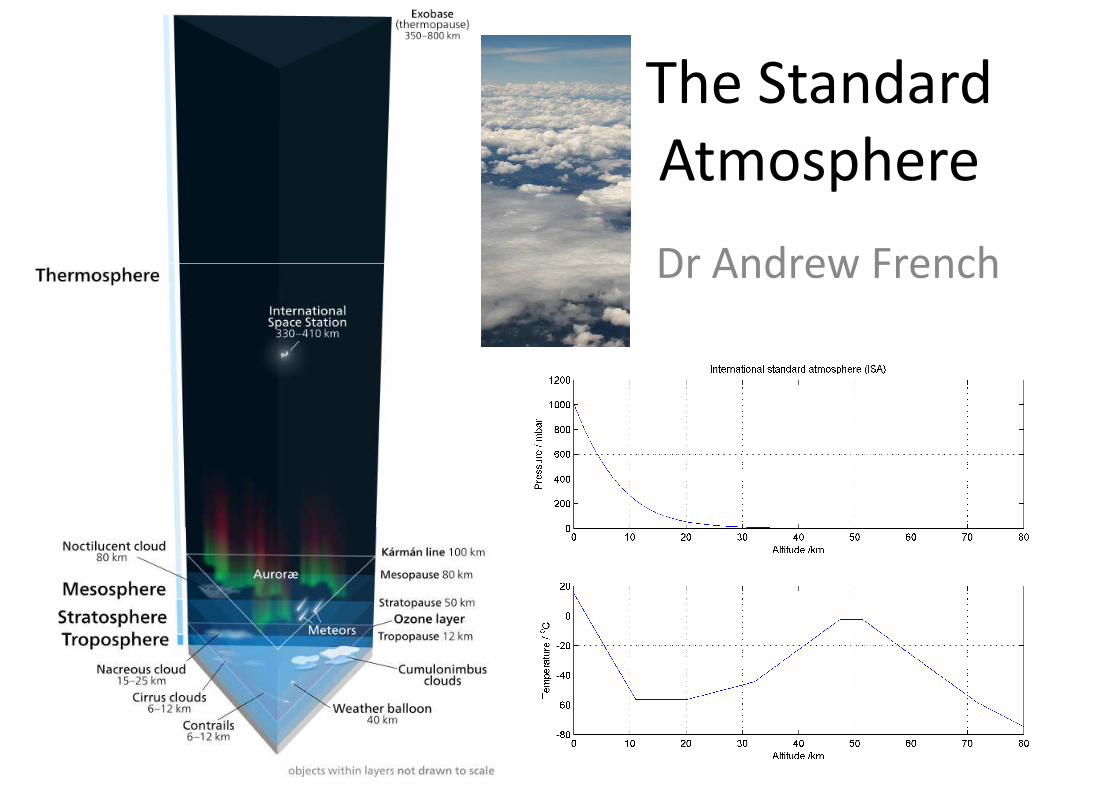
The Standard
Atmosphere
Dr Andrew FrenchDr Andrew French
1
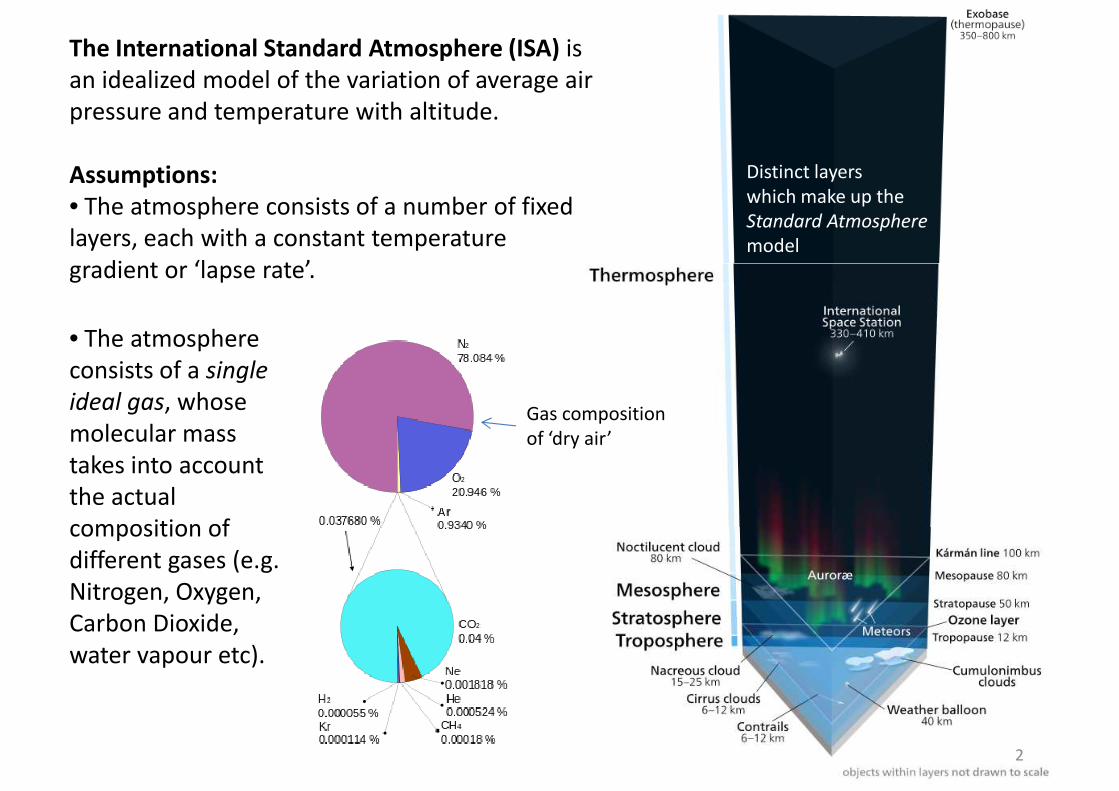
The International Standard Atmosphere (ISA) is
an idealized model of the variation of average air
pressure and temperature with altitude.
Assumptions:
• The atmosphere consists of a number of fixed
layers, each with a constant temperature
gradient or ‘lapse rate’.
Distinct layers
which make up the
Standard Atmosphere
model
• The atmosphere
consists of a single
ideal gas, whose
molecular mass
takes into account
the actual
composition of
gradient or ‘lapse rate’.
Gas composition
of ‘dry air’
2
composition of
different gases (e.g.
Nitrogen, Oxygen,
Carbon Dioxide,
water vapour etc).
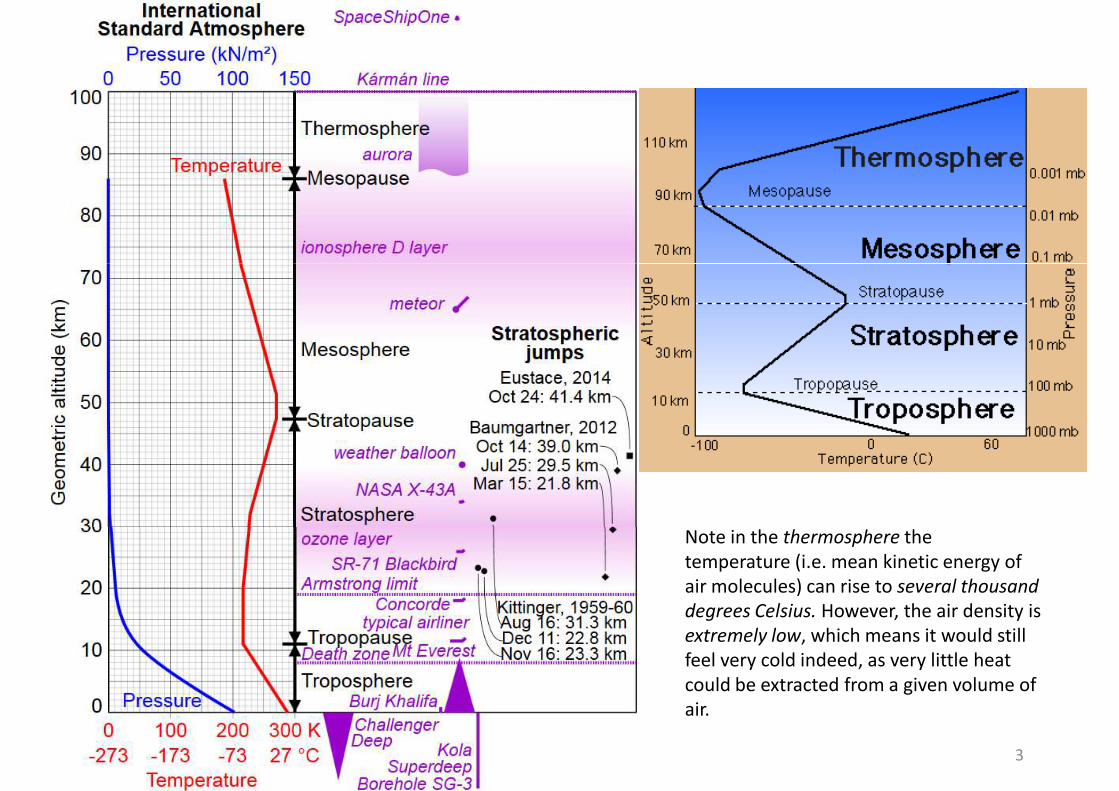
Note in the thermosphere the
3
Note in the thermosphere the
temperature (i.e. mean kinetic energy of
air molecules) can rise to several thousand
degrees Celsius. However, the air density is
extremely low, which means it would still
feel very cold indeed, as very little heat
could be extracted from a given volume of
air.
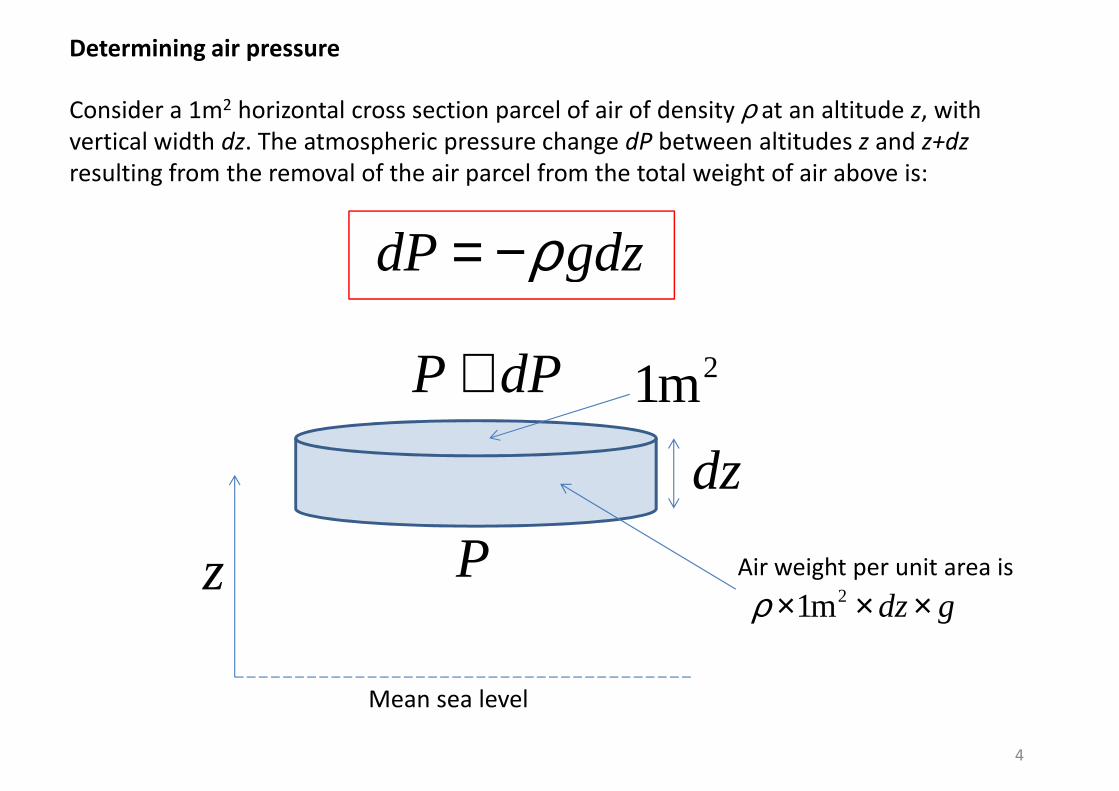
Determining air pressure
Consider a 1m2 horizontal cross section parcel of air of density ρ at an altitude z, with
vertical width dz. The atmospheric pressure change dP between altitudes z and z+dz
resulting from the removal of the air parcel from the total weight of air above is:
dP gdzρ= −dP gdzρ= −
P dP+
dz
21m
4
Pz
Mean sea level
21m dz gρ × × ×Air weight per unit area is
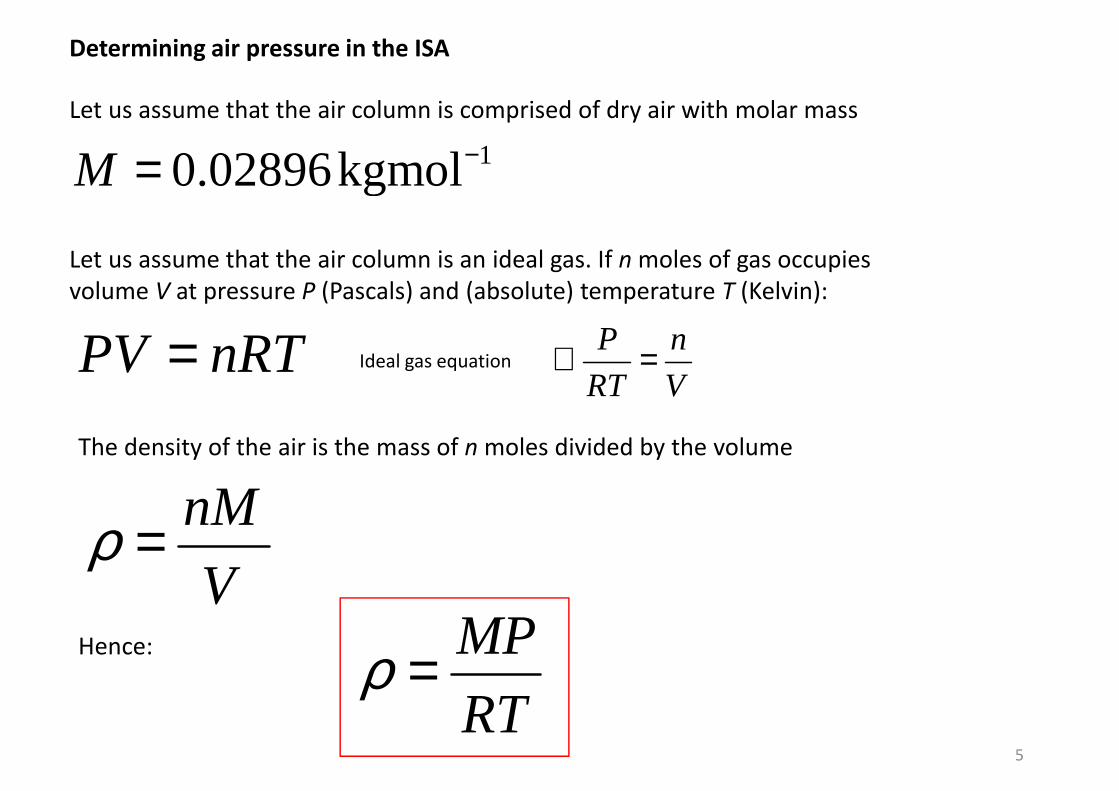
Determining air pressure in the ISA
Let us assume that the air column is comprised of dry air with molar mass
10.02896kgmolM −=
Let us assume that the air column is an ideal gas. If n moles of gas occupiesLet us assume that the air column is an ideal gas. If n moles of gas occupies
volume V at pressure P (Pascals) and (absolute) temperature T (Kelvin):
PV nRT=The density of the air is the mass of n moles divided by the volume
nMρ =
Ideal gas equationP n
RT V∴ =
5
nM
Vρ =
Hence: MP
RTρ =
MP
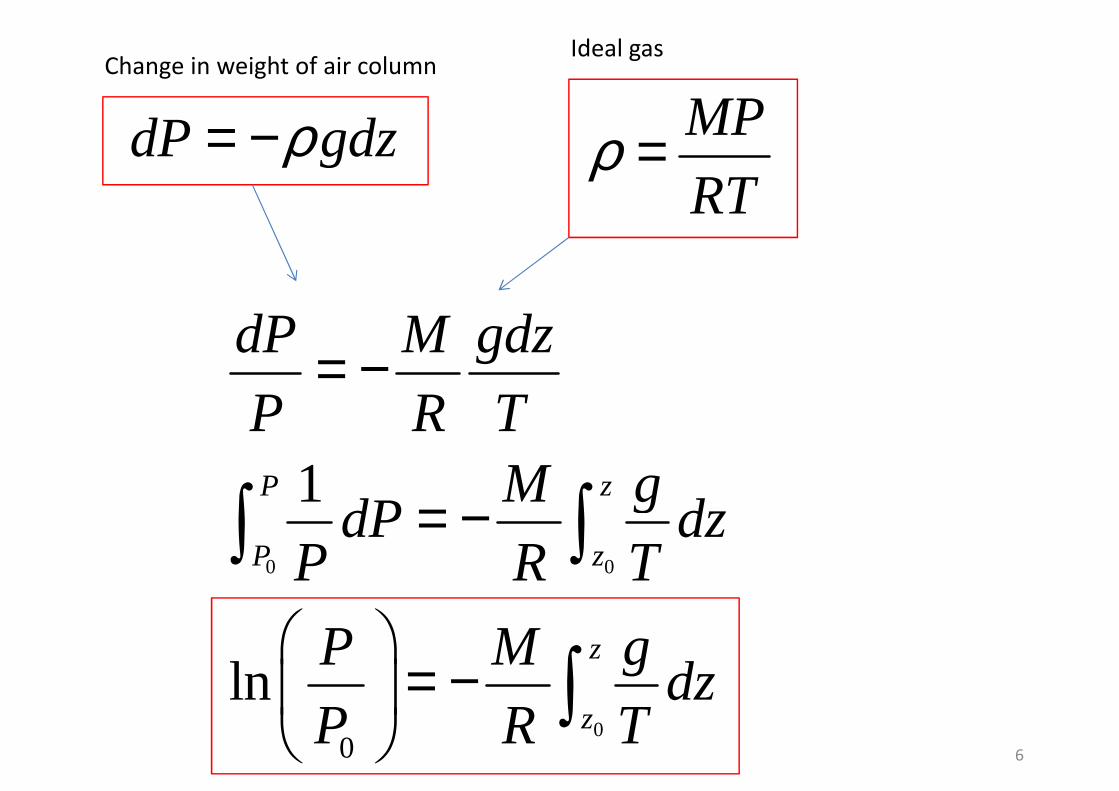
RTρ =dP gdzρ= −
Ideal gasChange in weight of air column
1P z
dP M gdz
P R TM g
dP dz
= −
= −∫ ∫
6
0 0
00
ln
P z
z
z
dP dzP R T
P M gdz
P R T
= −
= −
∫ ∫
∫
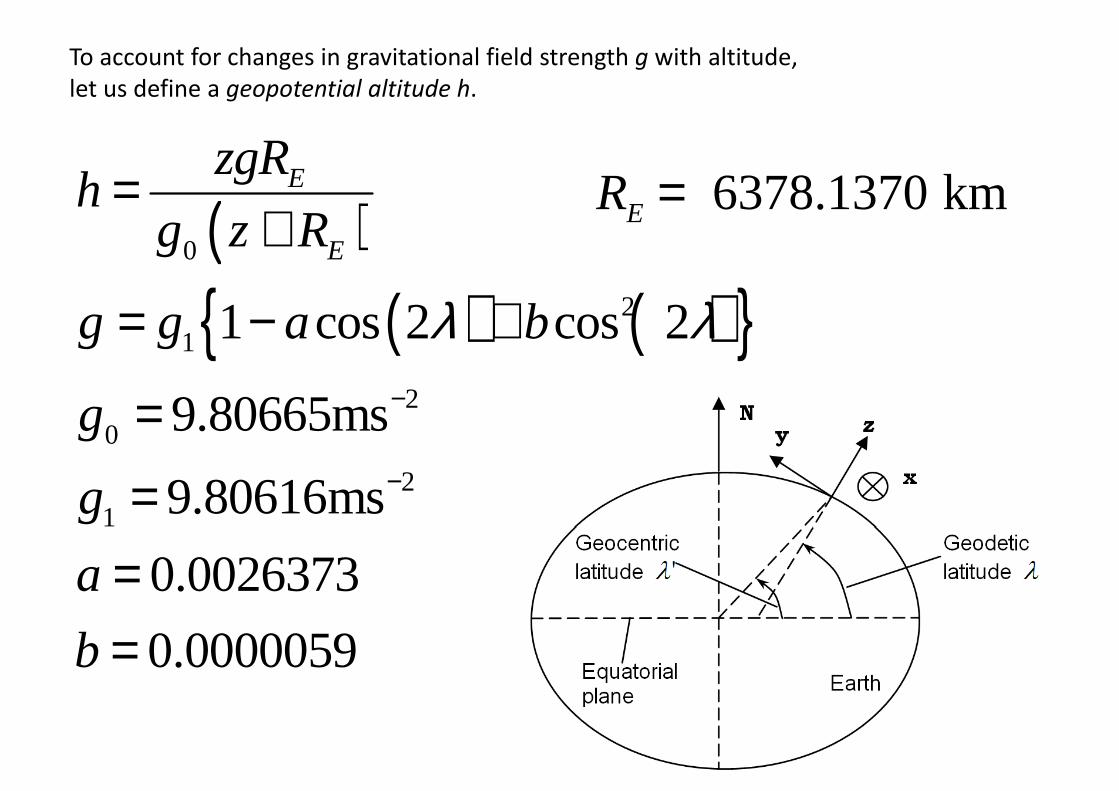
To account for changes in gravitational field strength g with altitude,
let us define a geopotential altitude h.
( )0
E
E
zgRh
g z R=
+ 6378.1370 kmER =( )
( ) ( ){ }0
21
20
21
1 cos 2 cos 2
9.80665ms
9.80616ms
E
g g a b
g
g
λ λ−
−
= − +
=
=
7
1
0.0026373
0.0000059
a
b
==
0
1ln
h
h
P Mgdh
P R T
= −
∫
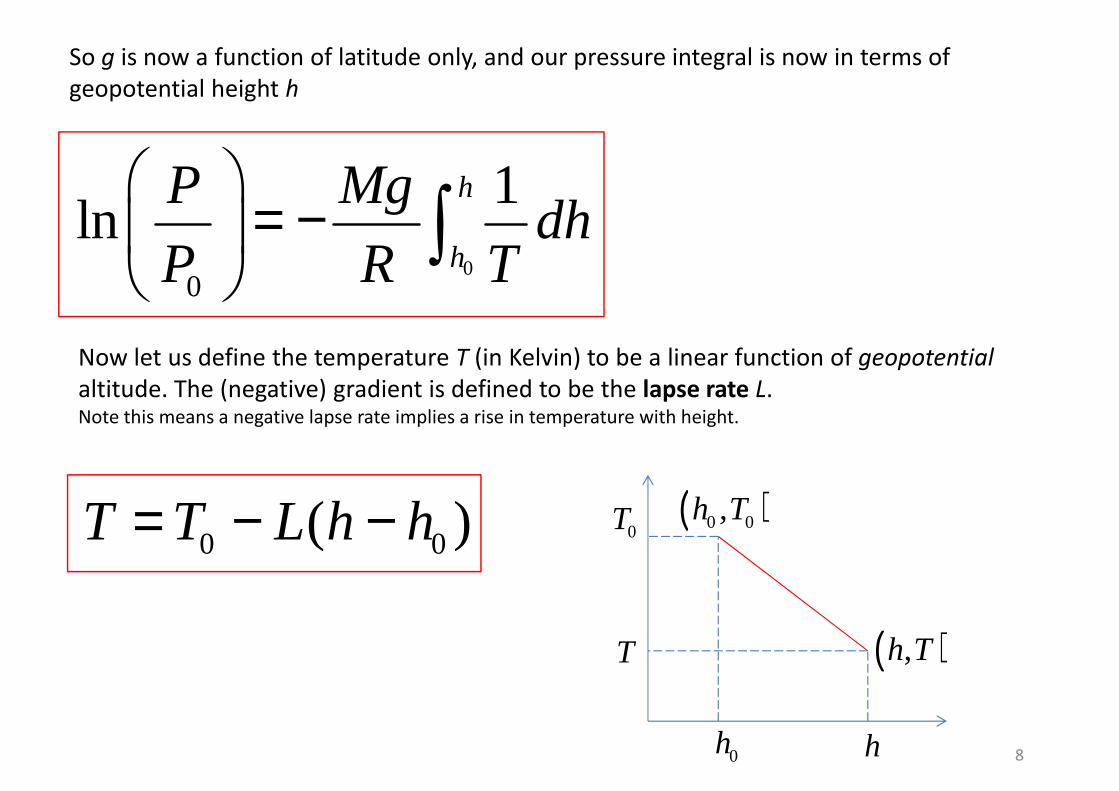
So g is now a function of latitude only, and our pressure integral is now in terms of
geopotential height h
00
hP R T ∫
Now let us define the temperature T (in Kelvin) to be a linear function of geopotential
altitude. The (negative) gradient is defined to be the lapse rate L. Note this means a negative lapse rate implies a rise in temperature with height.
0 0( )T T L h h= − − ( )0 0,h T0T
8
0 0( )T T L h h= − − ( )0 0
( ),h T
0h h
0T
T
0
ln -h
T T
P Mgdh
=
= ∫
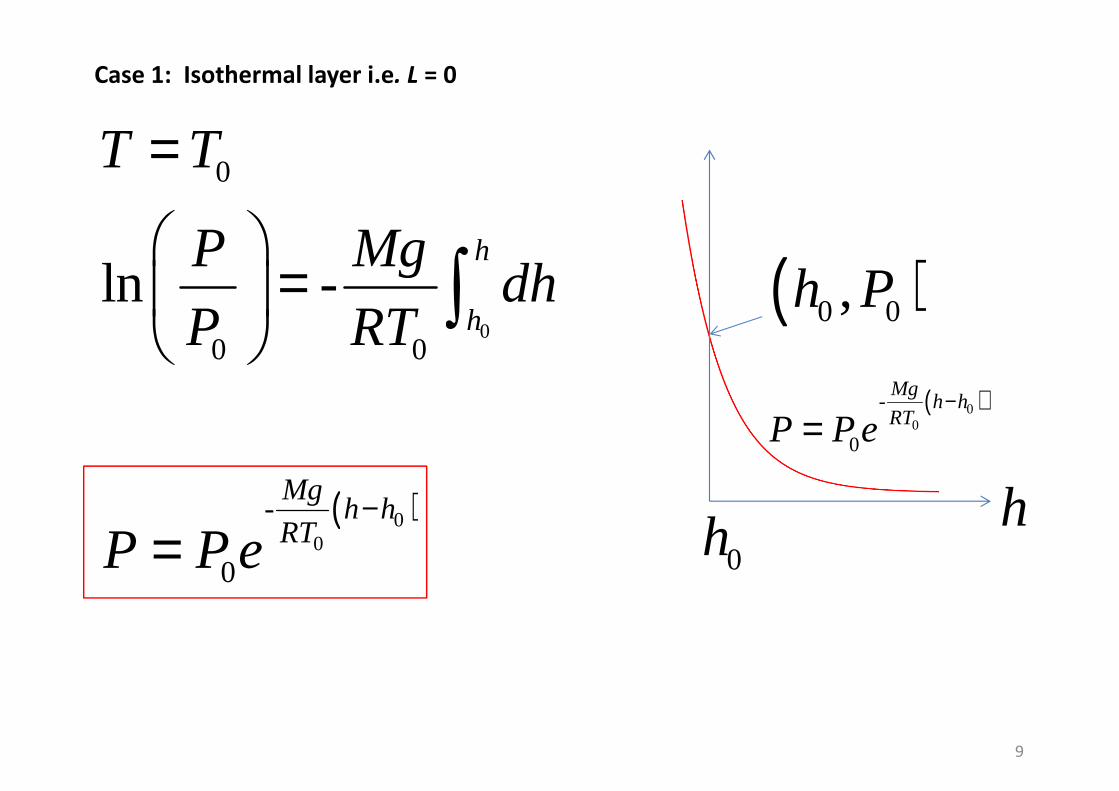
Case 1: Isothermal layer i.e. L = 0
( ),h P
( )
0
0
0 0
-
ln -h
h
Mgh h
RT
P Mgdh
P RT
P P e−
=
=
∫( )0
0
-
0
Mgh h
RTP P e−
=
hh
( )0 0,h P
9
( )00
0RTP P e=
h0h
0
0 0
0 0 0
( )
1ln -
( )
h
h
h
T T L h h
P Mgdh
P R T L h h
P Mg L
= − −
= − −
−=
∫
∫
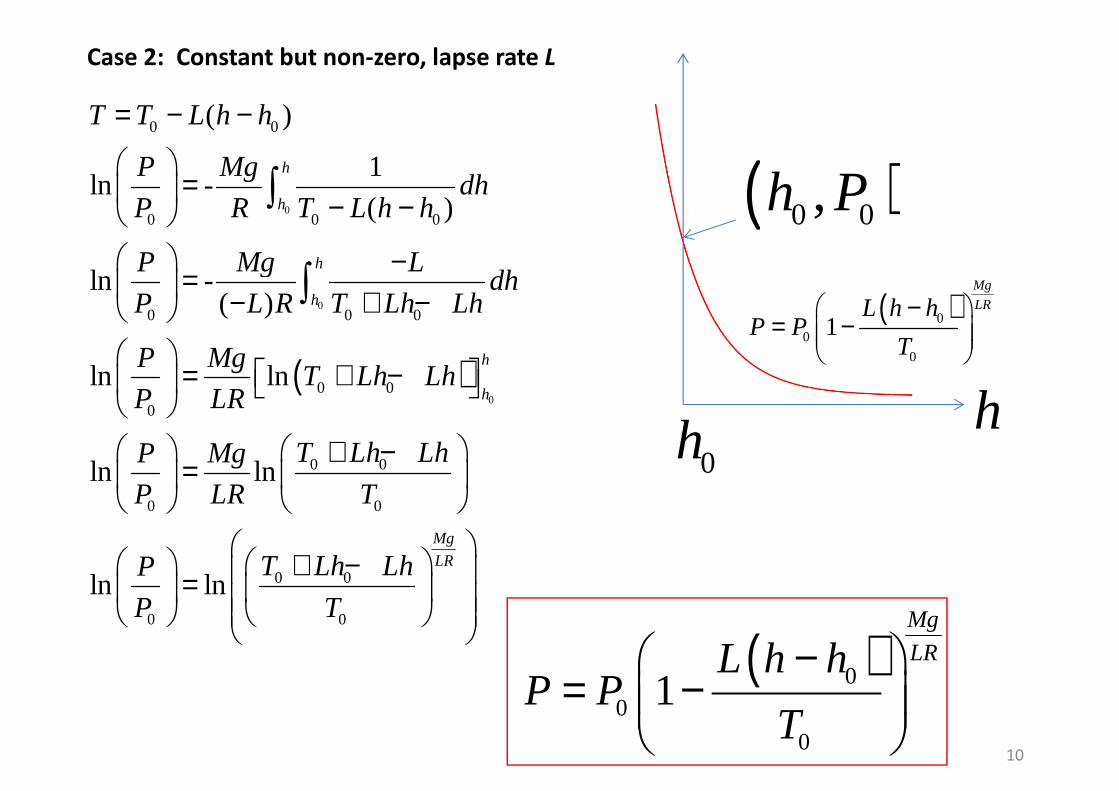
Case 2: Constant but non-zero, lapse rate L
( )0 0,h P
( )
0
0
0 0 0
0 0
0
0 0
0 0
ln -( )
ln ln
ln ln
h
h
h
h
P Mg Ldh
P L R T Lh Lh
P MgT Lh Lh
P LR
T Lh LhP Mg
P LR T
−= − + −
= + −
+ −=
∫
h0h
( )00
0
1
Mg
LRL h hP P
T
−= −
10
0 0
0 0
ln ln
Mg
LRT Lh LhP
P T
+ − =
( )0
0
0
1
Mg
LRL h hP P
T
−= −
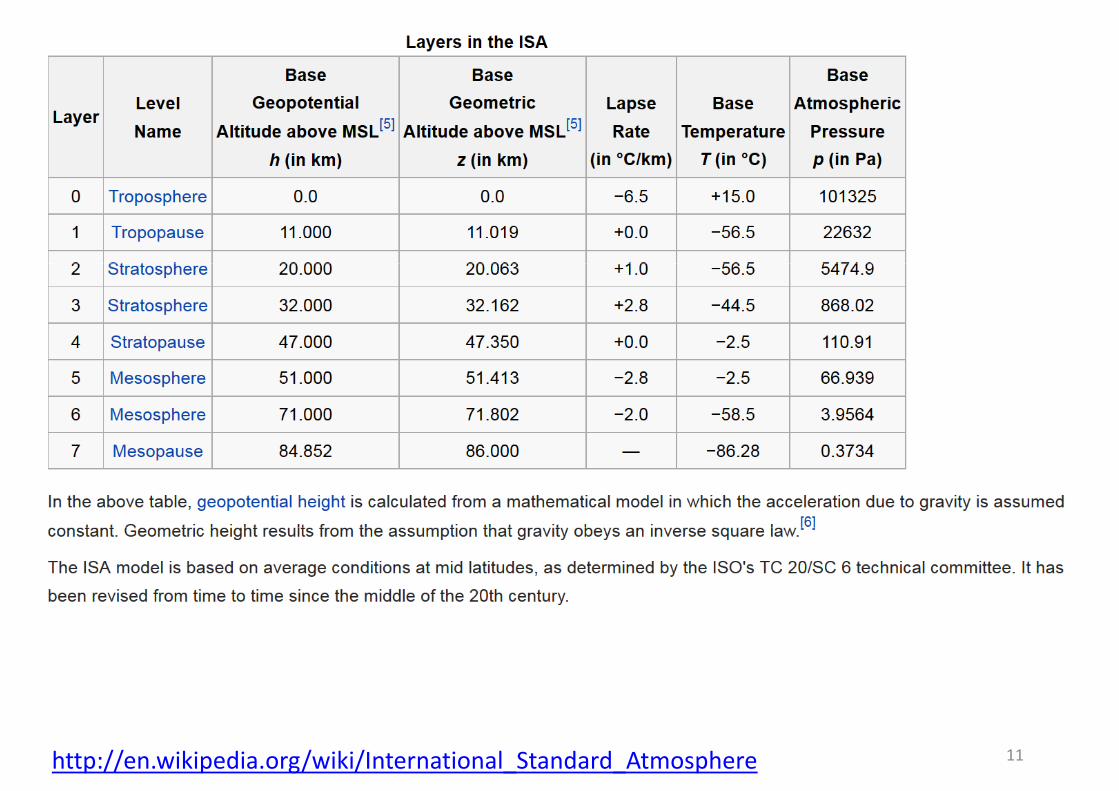
11http://en.wikipedia.org/wiki/International_Standard_Atmosphere
12
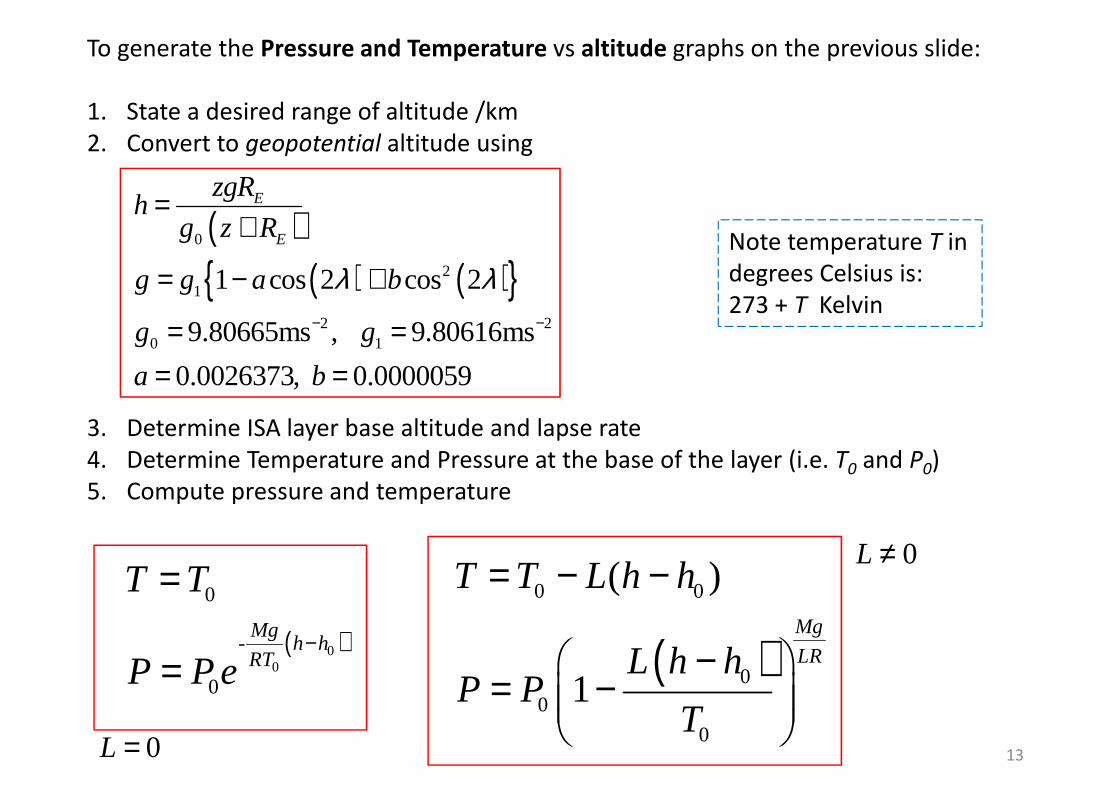
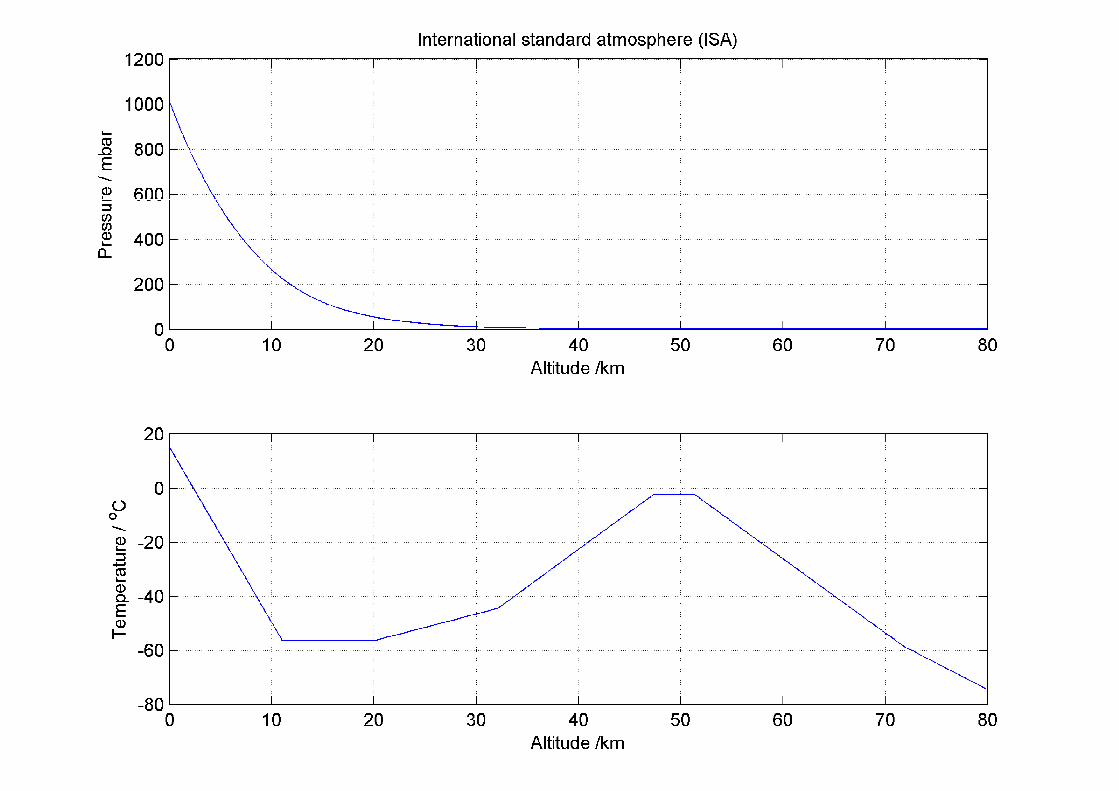
To generate the Pressure and Temperature vs altitude graphs on the previous slide:
1. State a desired range of altitude /km
2. Convert to geopotential altitude using
( )( ) ( ){ }
0
21 cos 2 cos 2
E
E
zgRh
g z R
g g a bλ λ
=+
= − +Note temperature T in
degrees Celsius is:
3. Determine ISA layer base altitude and lapse rate
4. Determine Temperature and Pressure at the base of the layer (i.e. T0 and P0)
5. Compute pressure and temperature
( ) ( ){ }21
2 20 1
1 cos 2 cos 2
9.80665ms , 9.80616ms
0.0026373, 0.0000059
g g a b
g g
a b
λ λ− −
= − +
= == =
degrees Celsius is:
273 + T Kelvin
13
( )0 0
00
0
( )
1
Mg
LR
T T L h h
L h hP P
T
= − −
−= −
( )00
0
-
0
Mgh h
RT
T T
P P e−
=
=
0L =
0L ≠
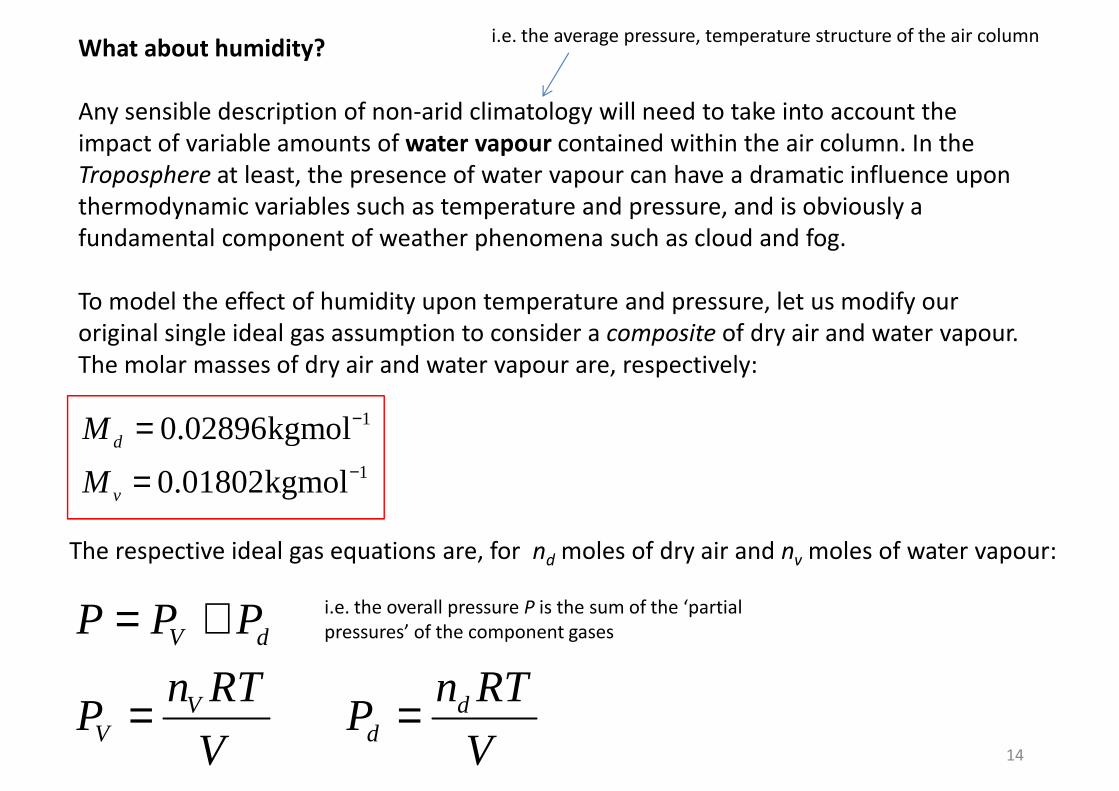
What about humidity?
Any sensible description of non-arid climatology will need to take into account the
impact of variable amounts of water vapour contained within the air column. In the
Troposphere at least, the presence of water vapour can have a dramatic influence upon
thermodynamic variables such as temperature and pressure, and is obviously a
fundamental component of weather phenomena such as cloud and fog.
i.e. the average pressure, temperature structure of the air column
To model the effect of humidity upon temperature and pressure, let us modify our
original single ideal gas assumption to consider a composite of dry air and water vapour.
The molar masses of dry air and water vapour are, respectively:
1
1
0.02896kgmol
0.01802kgmold
v
M
M
−
−
=
=
14
The respective ideal gas equations are, for nd moles of dry air and nv moles of water vapour:
V d
V dV d
P P P
n RT n RTP P
V V
= +
= =
i.e. the overall pressure P is the sum of the ‘partial
pressures’ of the component gases
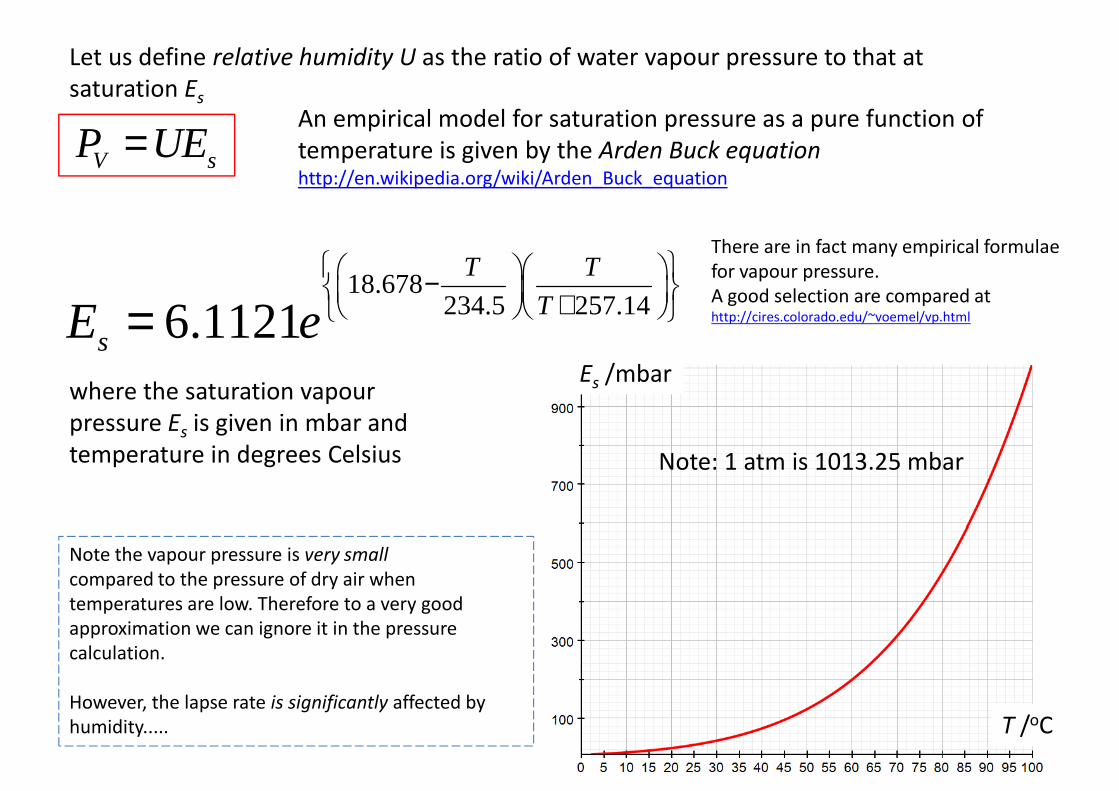
Let us define relative humidity U as the ratio of water vapour pressure to that at
saturation Es
V sP UE=An empirical model for saturation pressure as a pure function of
temperature is given by the Arden Buck equation http://en.wikipedia.org/wiki/Arden_Buck_equation
T T There are in fact many empirical formulae
for vapour pressure.
where the saturation vapour
pressure Es is given in mbar and
temperature in degrees Celsius
18.678234.5 257.146.1121
T T
TsE e
− + =for vapour pressure.
A good selection are compared at http://cires.colorado.edu/~voemel/vp.html
Es /mbar
Note: 1 atm is 1013.25 mbar
T /oC
Note the vapour pressure is very small
compared to the pressure of dry air when
temperatures are low. Therefore to a very good
approximation we can ignore it in the pressure
calculation.
However, the lapse rate is significantly affected by
humidity.....
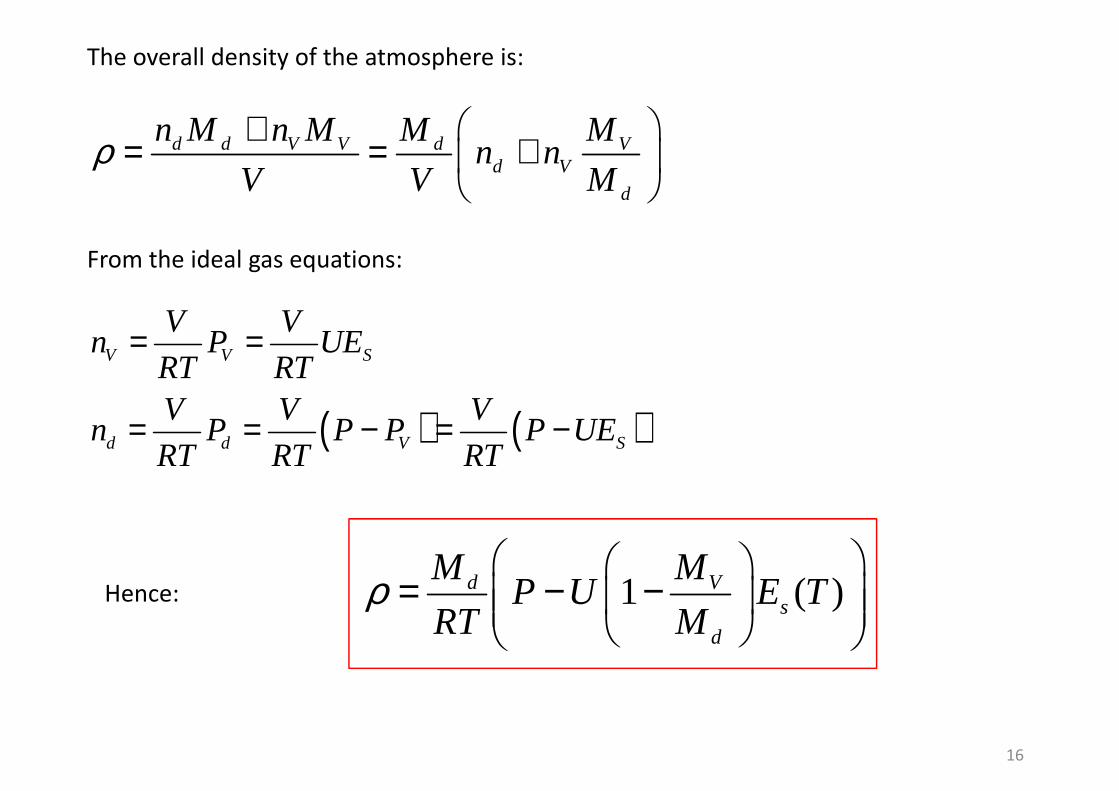
The overall density of the atmosphere is:
d d V V d Vd V
d
n M n M M Mn n
V V Mρ
+= = +
From the ideal gas equations:
( ) ( )
V V S
d d V S
V Vn P UE
RT RTV V V
n P P P P UERT RT RT
= =
= = − = −
From the ideal gas equations:
16
1 ( )d Vs
d
M MP U E T
RT Mρ
= − −
Hence:
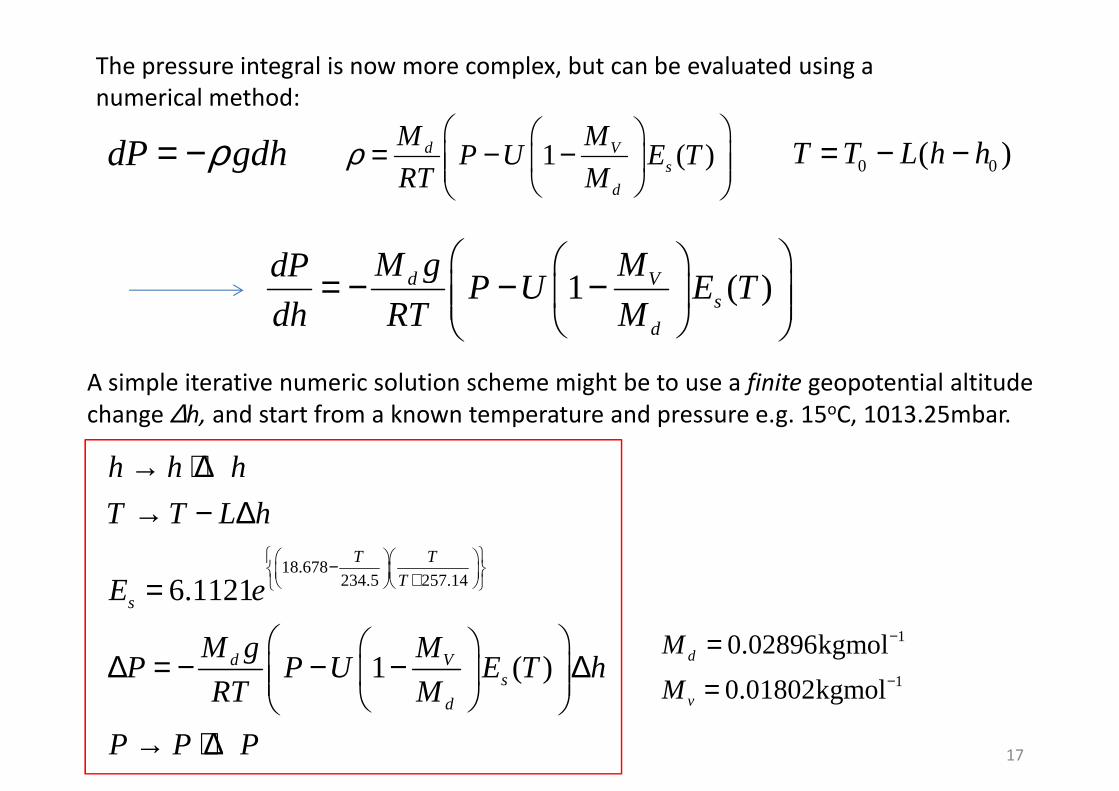
The pressure integral is now more complex, but can be evaluated using a
numerical method:
M g MdP = − − −
0 0( )T T L h h= − −dP gdhρ= − 1 ( )d Vs
d
M MP U E T
RT Mρ
= − −
1 ( )d Vs
d
M g MdPP U E T
dh RT M
= − − −
A simple iterative numeric solution scheme might be to use a finite geopotential altitude
change ∆h, and start from a known temperature and pressure e.g. 15oC, 1013.25mbar.
h h h
T T L h
→ + ∆→ − ∆
17
18.678234.5 257.146.1121
1 ( )
T T
Ts
d Vs
d
T T L h
E e
M g MP P U E T h
RT M
P P P
− +
→ − ∆
=
∆ = − − − ∆
→ + ∆
1
1
0.02896kgmol
0.01802kgmold
v
M
M
−
−
==
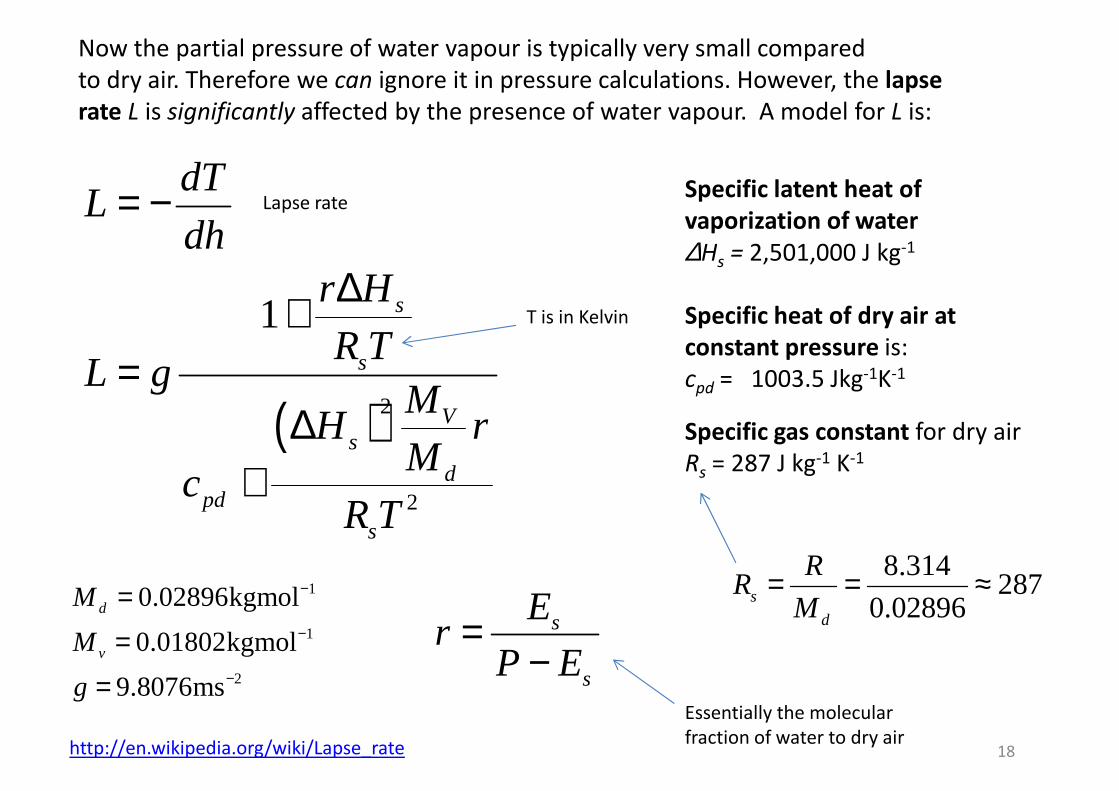
Now the partial pressure of water vapour is typically very small compared
to dry air. Therefore we can ignore it in pressure calculations. However, the lapse
rate L is significantly affected by the presence of water vapour. A model for L is:
dTL
dh= −
∆
Specific latent heat of
vaporization of water
∆Hs = 2,501,000 J kg-1
Lapse rate
( )2
2
1 s
s
Vs
dpd
s
r H
R TL g
MH r
Mc
R T
∆+=
∆+
∆Hs = 2,501,000 J kg
Specific heat of dry air at
constant pressure is:
cpd = 1003.5 Jkg-1K-1
Specific gas constant for dry air
Rs = 287 J kg-1 K-1
T is in Kelvin
18http://en.wikipedia.org/wiki/Lapse_rate
sR T
1
1
2
0.02896kgmol
0.01802kgmol
9.8076ms
d
v
M
M
g
−
−
−
=
==
8.314287
0.02896s
d
RR
M= = ≈
s
s
Er
P E=
−Essentially the molecular
fraction of water to dry air
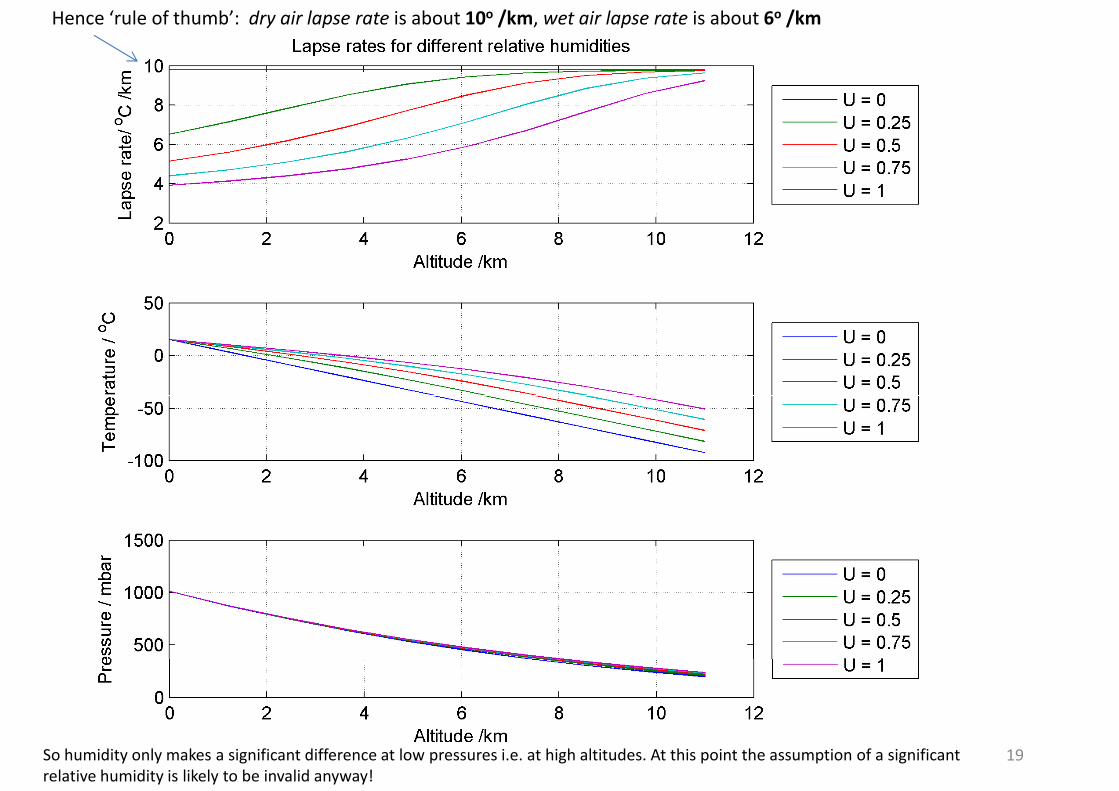
Hence ‘rule of thumb’: dry air lapse rate is about 10o /km, wet air lapse rate is about 6o /km
19So humidity only makes a significant difference at low pressures i.e. at high altitudes. At this point the assumption of a significant
relative humidity is likely to be invalid anyway!
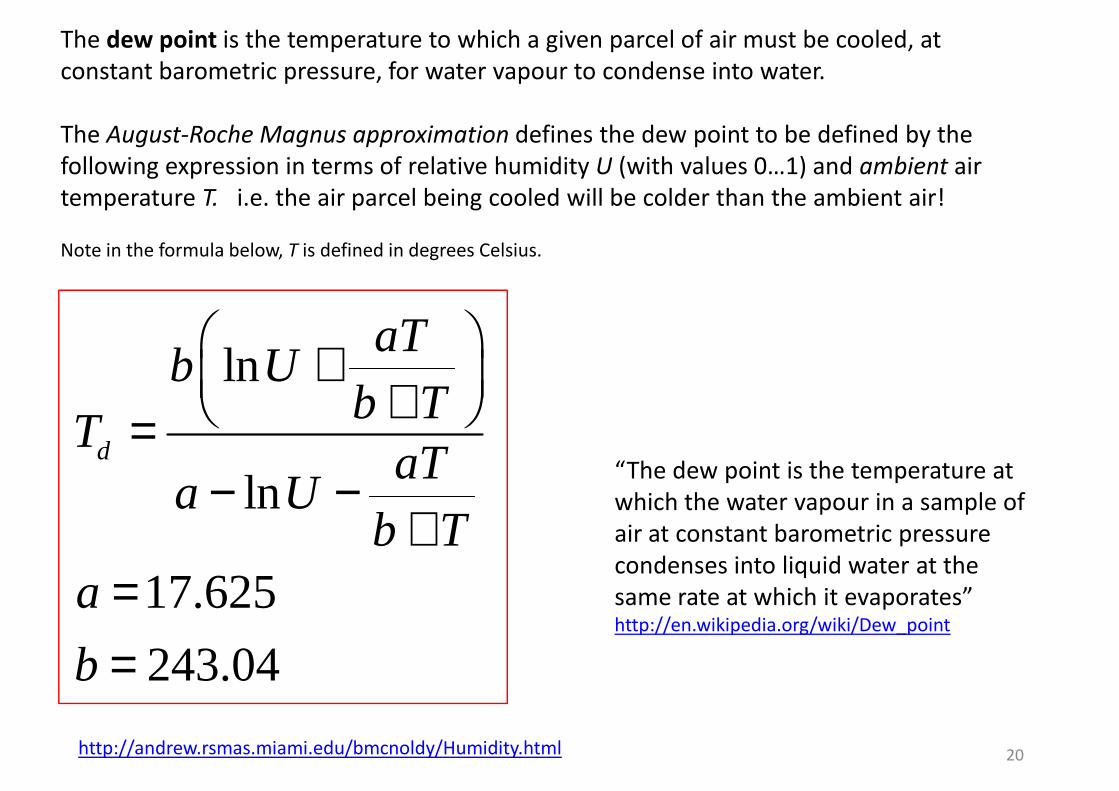
The dew point is the temperature to which a given parcel of air must be cooled, at
constant barometric pressure, for water vapour to condense into water.
The August-Roche Magnus approximation defines the dew point to be defined by the
following expression in terms of relative humidity U (with values 0…1) and ambient air
temperature T. i.e. the air parcel being cooled will be colder than the ambient air!
Note in the formula below, T is defined in degrees Celsius.
ln
lnd
aTb U
b TT
aTa U
b T
+ + =− −
+“The dew point is the temperature at
which the water vapour in a sample of
air at constant barometric pressure
20
17.625
243.04
b Ta
b
+==
http://andrew.rsmas.miami.edu/bmcnoldy/Humidity.html
air at constant barometric pressure
condenses into liquid water at the
same rate at which it evaporates”http://en.wikipedia.org/wiki/Dew_point
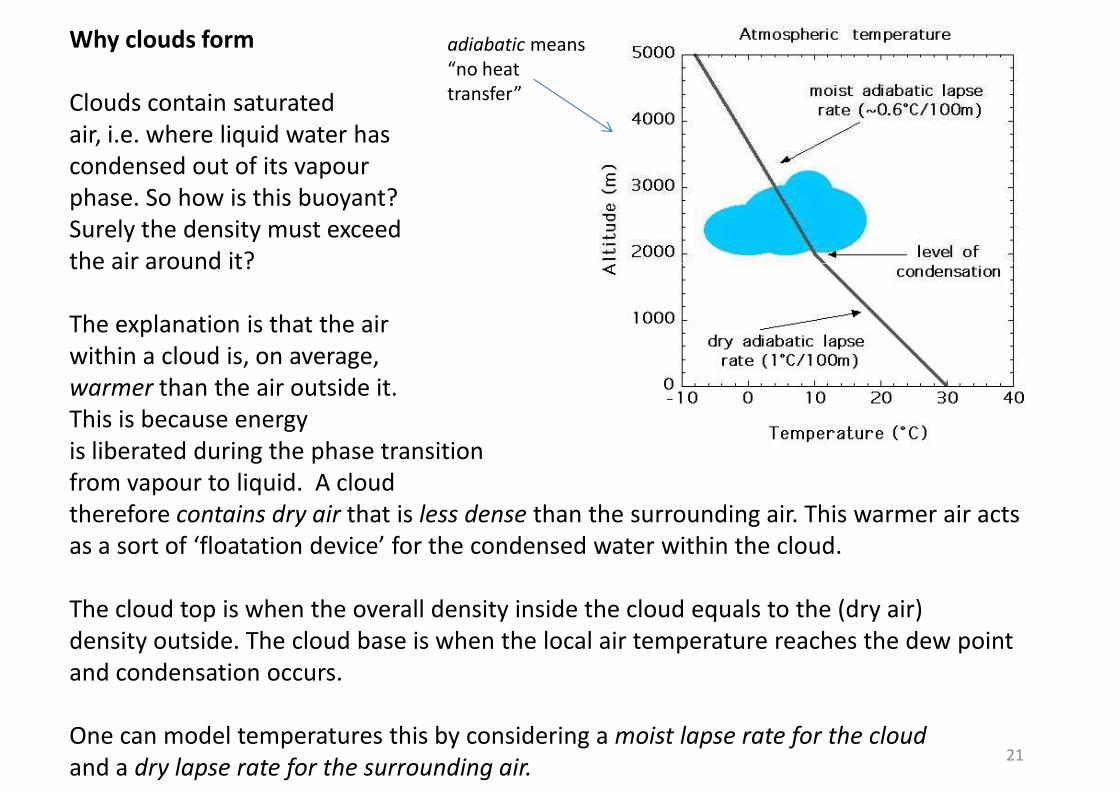
Why clouds form
Clouds contain saturated
air, i.e. where liquid water has
condensed out of its vapour
phase. So how is this buoyant?
Surely the density must exceed
the air around it?
adiabatic means
“no heat
transfer”
the air around it?
The explanation is that the air
within a cloud is, on average,
warmer than the air outside it.
This is because energy
is liberated during the phase transition
from vapour to liquid. A cloud
therefore contains dry air that is less dense than the surrounding air. This warmer air actstherefore contains dry air that is less dense than the surrounding air. This warmer air acts
as a sort of ‘floatation device’ for the condensed water within the cloud.
The cloud top is when the overall density inside the cloud equals to the (dry air)
density outside. The cloud base is when the local air temperature reaches the dew point
and condensation occurs.
One can model temperatures this by considering a moist lapse rate for the cloud
and a dry lapse rate for the surrounding air.21
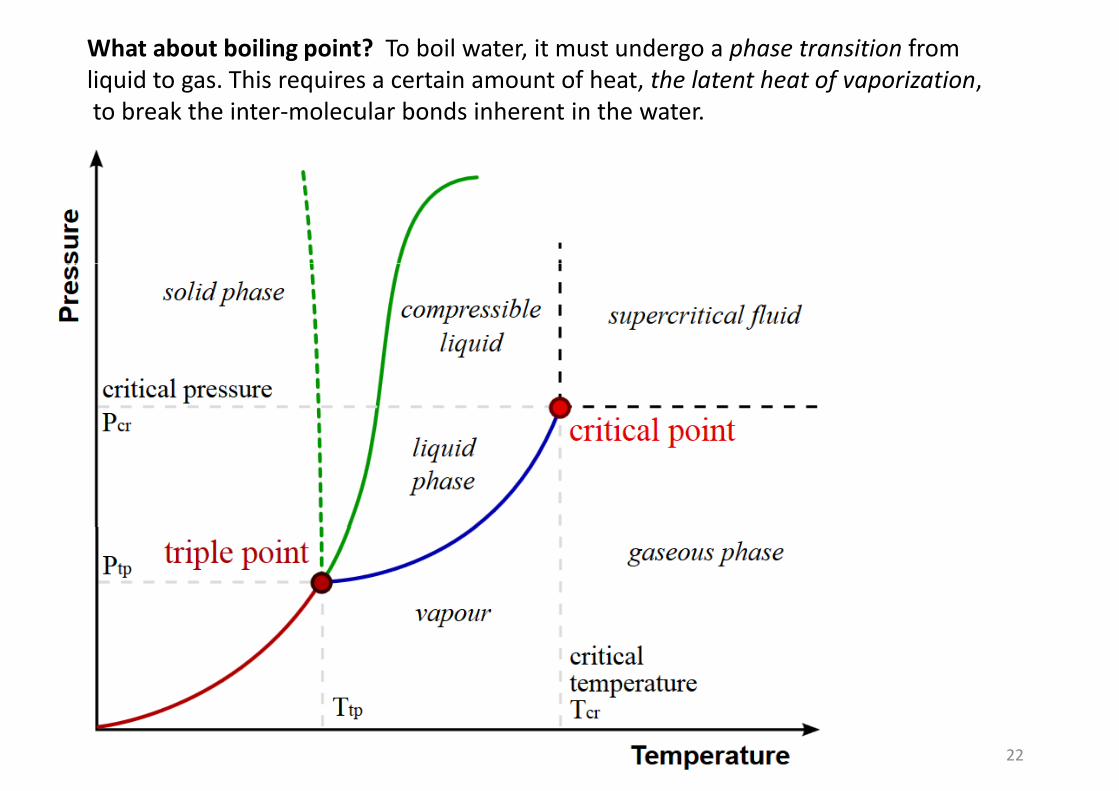
What about boiling point? To boil water, it must undergo a phase transition from
liquid to gas. This requires a certain amount of heat, the latent heat of vaporization,
to break the inter-molecular bonds inherent in the water.
22
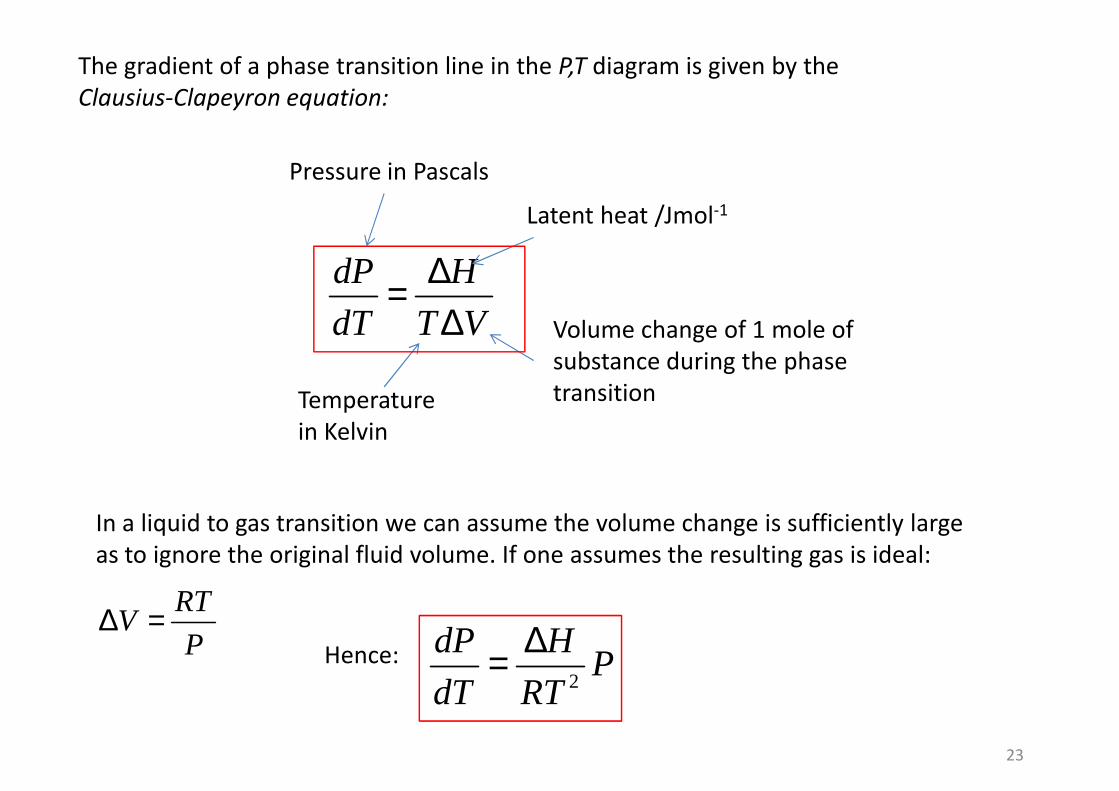
The gradient of a phase transition line in the P,T diagram is given by the
Clausius-Clapeyron equation:
dP H∆Latent heat /Jmol-1
Pressure in Pascals
dP H
dT T V
∆=∆ Volume change of 1 mole of
substance during the phase
transitionTemperature
in Kelvin
In a liquid to gas transition we can assume the volume change is sufficiently large
23
In a liquid to gas transition we can assume the volume change is sufficiently large
as to ignore the original fluid volume. If one assumes the resulting gas is ideal:
RTV
P∆ =
2
dP HP
dT RT
∆=Hence:
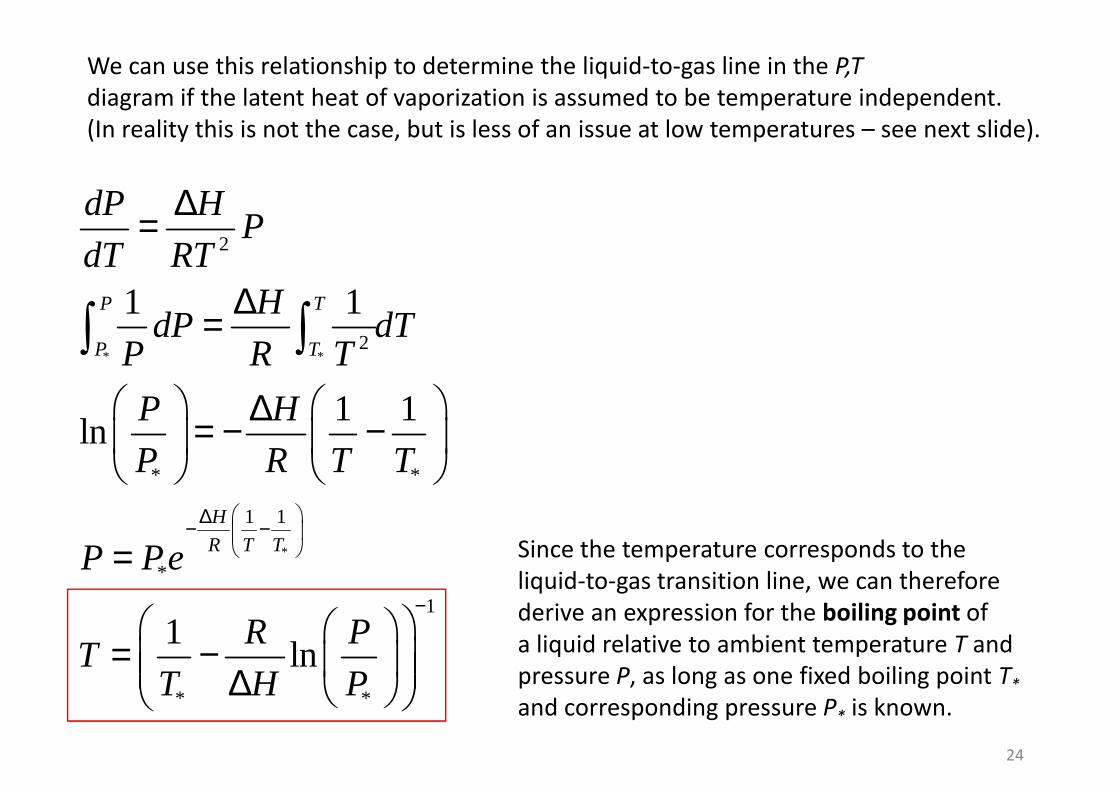
We can use this relationship to determine the liquid-to-gas line in the P,T
diagram if the latent heat of vaporization is assumed to be temperature independent.
(In reality this is not the case, but is less of an issue at low temperatures – see next slide).
2
dP HP
dT RT
∆=
* *2
* *
1 1
1 1
1 1ln
P T
P T
H
dT RTH
dP dTP R T
P H
P R T T ∆− −
∆=
∆= − −
∫ ∫
24
*
1 1
*
1
* *
1ln
H
R T TP Pe
R PT
T H P
− −
−
=
= − ∆
Since the temperature corresponds to the
liquid-to-gas transition line, we can therefore
derive an expression for the boiling point of
a liquid relative to ambient temperature T and
pressure P, as long as one fixed boiling point T*
and corresponding pressure P* is known.
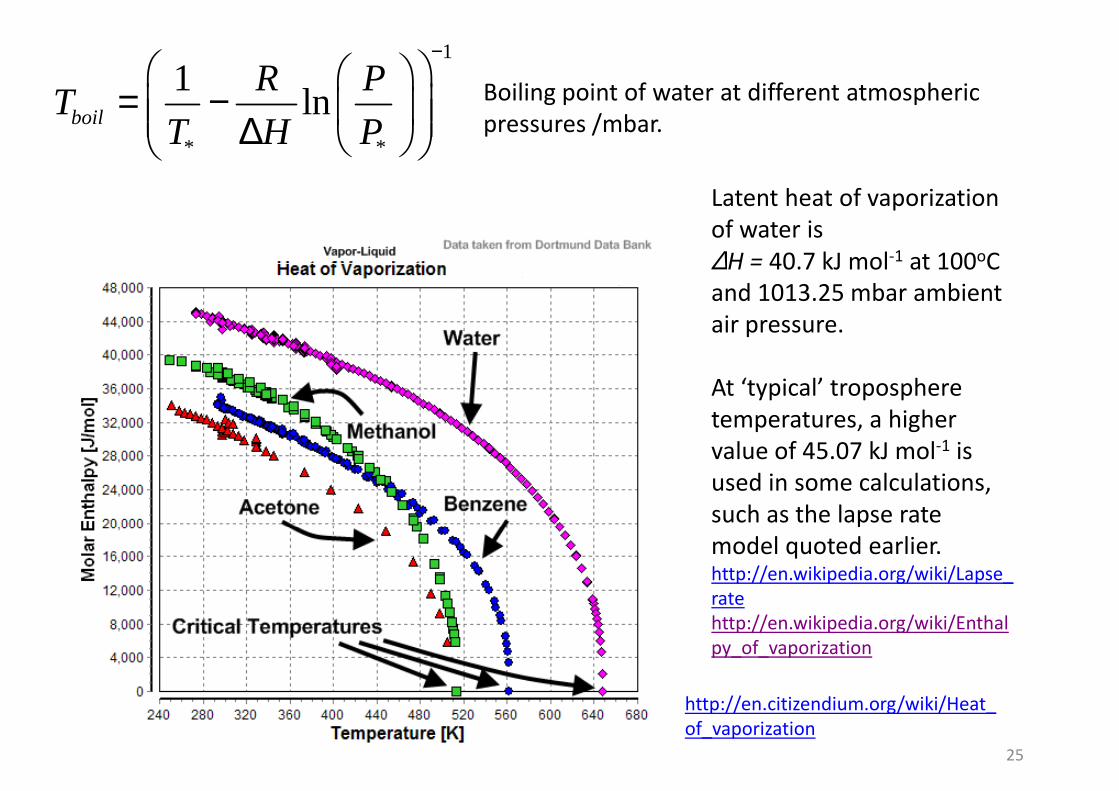
1
* *
1lnboil
R PT
T H P
−
= − ∆
Boiling point of water at different atmospheric
pressures /mbar.
Latent heat of vaporization
of water is
∆H = 40.7 kJ mol-1 at 100oC∆H = 40.7 kJ mol-1 at 100oC
and 1013.25 mbar ambient
air pressure.
At ‘typical’ troposphere
temperatures, a higher
value of 45.07 kJ mol-1 is
used in some calculations,
such as the lapse rate
25
such as the lapse rate
model quoted earlier.http://en.wikipedia.org/wiki/Lapse_
rate
http://en.wikipedia.org/wiki/Enthal
py_of_vaporization
http://en.citizendium.org/wiki/Heat_
of_vaporization
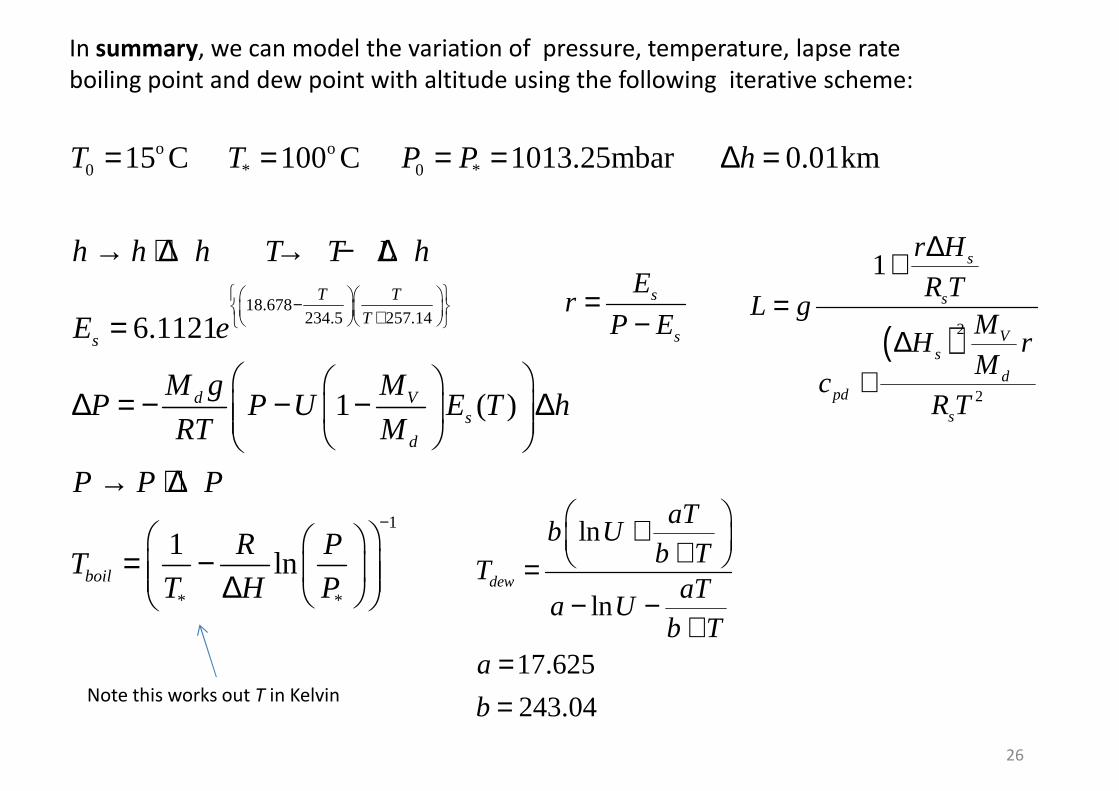
In summary, we can model the variation of pressure, temperature, lapse rate
boiling point and dew point with altitude using the following iterative scheme:
o o0 * 0 *15 C 100 C 1013.25mbar 0.01kmT T P P h
h h h T T L h
= = = = ∆ =
→ + ∆ → − ∆ 1 sr H∆+18.678
234.5 257.14
1
6.1121
1 ( )
1
T T
Ts
d Vs
d
h h h T T L h
E e
M g MP P U E T h
RT M
P P P
R P
− +
−
→ + ∆ → − ∆
=
∆ = − − − ∆
→ + ∆
( )2
2
1 s
s
Vs
dpd
s
R TL g
MH r
Mc
R T
+=
∆+
s
s
Er
P E=
−
lnaT
b U +
26
1
* *
1lnboil
R PT
T H P
−
= − ∆
ln
ln
17.625
243.04
dew
aTb U
b TT
aTa U
b Ta
b
+ + =− −
+==Note this works out T in Kelvin
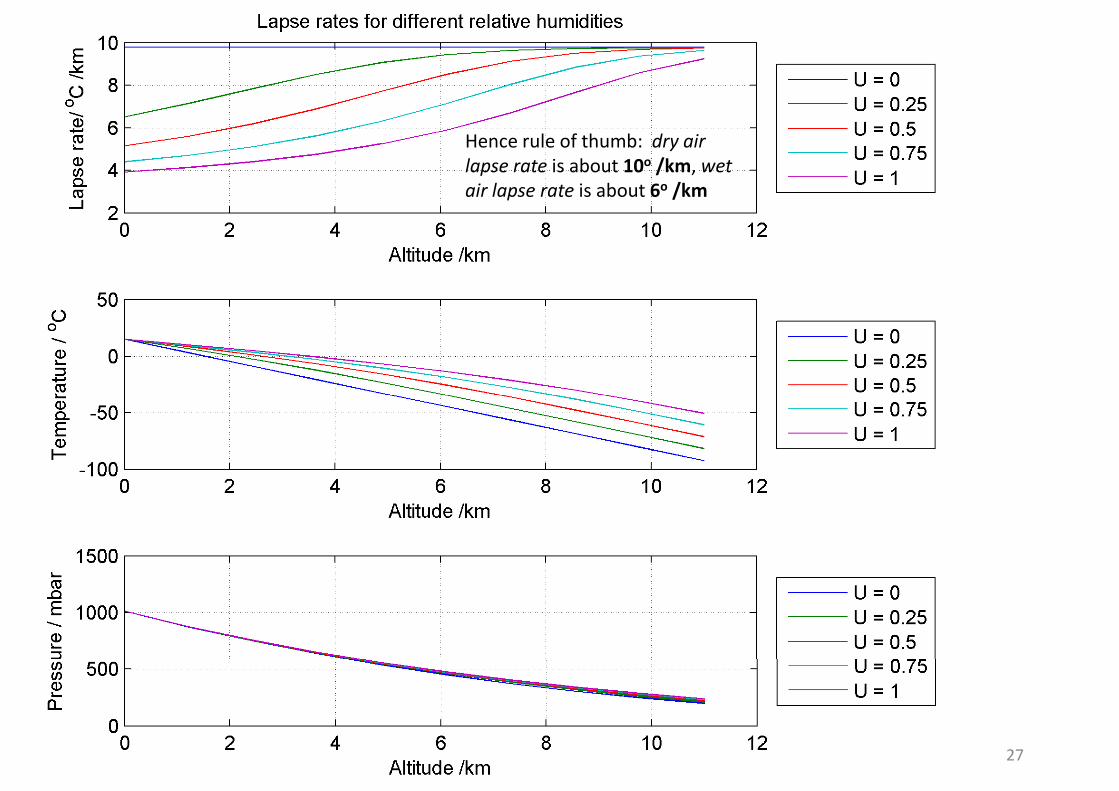
Hence rule of thumb: dry air
lapse rate is about 10o /km, wet
air lapse rate is about 6o /km
27
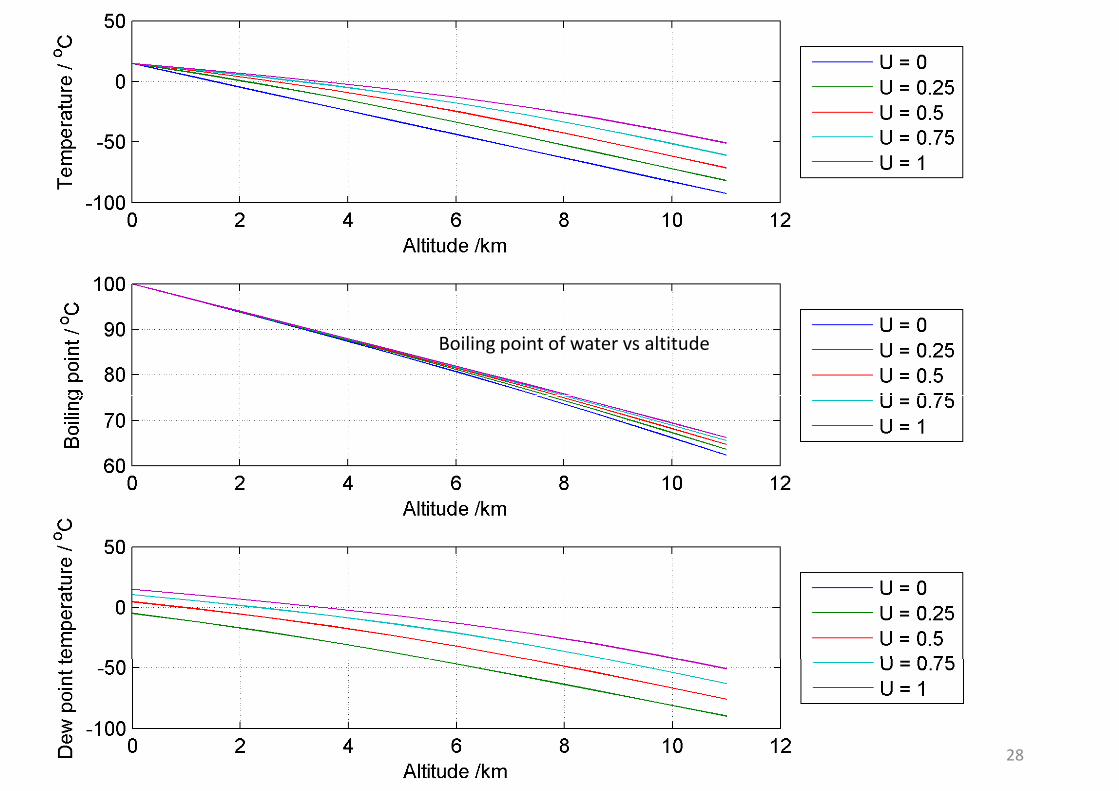
Boiling point of water vs altitude
28


