The spelling of phonemes
An Error Analysis of Norwegian pupils’ L2 English spelling
with emphasis on phoneme–grapheme correspondences
Haakon Valen Hume Simpson
Master’s Thesis in English Linguistics
Department of Foreign Languages
University of Bergen
May 2019


iii
Summary in Norwegian
Denne masteroppgaven i engelsk lingvistikk undersøker hvordan fonemene (lydene) bak
ulike grafemer (sammensetninger av bokstaver) påvirker elevers evne til å stave
grafemene. Forholdet mellom fonemer og grafemer i engelsk er komplekst. En norsk elev
som tilegner seg andrespråklig engelsk bruker ofte fonologiske strategier når ukjente ord
skal staves, som eksempelvis å bruke andre engelske grafemer for det samme fonemet, et
lignende engelsk grafem for et annet fonem, eller norske grafemer. Denne oppgaven tar
for seg åtte ulike fonemer i engelsk og undersøker om de kan utløse forskjellige typer
skrivefeil, om noen av dem er tydelig vanskeligere å stave enn andre, og om det er noen
synlige mønstre i hva som eventuelt gjør noen vanskeligere å stave enn andre.
Data fra CORYL (en samling av nasjonale prøver gjennomført av 12/13-åringer
og 15/16-åringer) og en diktatprøve gjennomført i en 10. klasse danner grunnlaget for
analysen. Funnene i oppgaven viser at det er stor forskjell i hvor ofte elever feilstaver
ulike fonemer. Den tydeligste forklaringen for ulikheten mellom fonemer funnet her var
korrelasjonen mellom hvor mange grafem et fonem kan bli stavet med, at jo færre og mer
regulere grafemer som utgjør et fonem, dess sjeldnere blir fonemet feilstavet. I tillegg
peker noen av funnene mot at det kan være av betydning om fonemet finnes i både
førstespråket og andrespråket, eller om det kun finnes i andrespråket. Det kan også hende
at elevers feilstavelser som oftest tar formen av et annet grafem som kan tilsvare det
tilsiktede fonemet, men disse to indikasjonene trenger et bredere datagrunnlag enn det
som foreligger her før konklusjoner kan trekkes.

iv
Acknowledgements
I am grateful for all the people who have inspired, assisted, or diverted me from the project
when needed. First of all, I want to thank the student I tutored, whose eagerness to learn
from sound-based spelling instruction inspired me to take on this topic for the present
thesis.
I would like to extend my sincere thanks to Greg Brooks for helpful conversations
and insightful comments, and for taking the time to meet and discuss the project in its
infancy.
I am also grateful for the level of interest that Angela Hasselgreen and Kari Telstad
Sundet gave the project and for the helpful instructions in maneuvering CORYL.
Thanks to the principal and the teachers of the lower and upper secondary schools
who allowed me to borrow their time and to the pupils who participated in the study.
I very much appreciate the helpful feedback given to me by the members of faculty
along the way, and especially Bente Hannisdal for help with assessing the validity of my
RP accent and transcription thereof.
Special thanks go to my supervisor Dagmar Haumann, who trusted in the potential
of the project and whose sharp eye I admire and who told me exactly what I needed to
hear during the course of writing.
The cooperative spirit of my fellow writing group members is unrivaled, and I am
indebted to all the great feedback you have given me and the hours you spent giving them.
I cannot begin to express my thanks to my parents and siblings, who have given
me so much this past year, I would never have come this far without you.
I extend my deepest gratitude to my dear Lise, without whom this project would
not have been possible, and to our John Edvard, without whom it would have been written
much quicker!

v
Table of contents
SUMMARY IN NORWEGIAN ..................................................................................... III
ACKNOWLEDGEMENTS ........................................................................................... IV
ABBREVIATIONS AND CONVENTIONS ............................................................... VIII
1 INTRODUCTION .................................................................................................... 1
2 THEORETICAL BACKGROUND AND PREVIOUS STUDIES .......................... 3
2.1 THE ENGLISH SPELLING SYSTEM ......................................................................... 3
2.2 SPELLING IN ERROR ANALYSIS ............................................................................ 8
2.3 ACQUISITION OF LITERACY ............................................................................... 10
2.4 ACQUISITION OF SPELLING ................................................................................ 13
2.5 ERROR CATEGORIES .......................................................................................... 18
2.6 L2 ENGLISH SPELLING ...................................................................................... 20
2.7 PRONUNCIATION ............................................................................................... 26
2.8 SUMMARY ......................................................................................................... 27
3 METHODOLOGY ................................................................................................. 29
3.1 CORYL ............................................................................................................ 29
3.2 PHONEMES & GRAPHEMES ............................................................................... 31
3.3 DEFINING ERRORS ............................................................................................. 33
3.4 CORPUS DATA ................................................................................................... 38
3.5 FIELD WORK ...................................................................................................... 41
3.6 SIGNIFICANCE TESTING ..................................................................................... 46
3.7 SUMMARY ......................................................................................................... 46
4 RESULTS & DISCUSSION .................................................................................. 47
4.1 CORPUS DATA RESULTS .................................................................................... 47
4.2 FIELD WORK RESULTS ....................................................................................... 56
4.3 HYPOTHESES ..................................................................................................... 60
4.4 SUMMARY ......................................................................................................... 75
5 CONCLUSION ...................................................................................................... 77
APPENDICES ................................................................................................................ 79
REFERENCE LIST ........................................................................................................ 82

vi
List of tables
Table 2.1: Graphemes of /v/ and /ʃ/ ................................................................................. 5
Table 3.1: Graphemes of the phoneme selection ........................................................... 33
Table 3.2: Unanalysable words by category and phoneme ........................................... 37
Table 3.3: Frequency of correct spellings of /eə/ by grapheme ..................................... 40
Table 3.4: Phonemes and graphemes present in the field work tests ............................ 42
Table 4.1: Errors and total use of the phonemes in CORYL, sorted by total use .......... 48
Table 4.2: Number of CEFR rated texts per age group ................................................. 53
Table 4.3: Number of errors per phoneme according to CEFR level ............................ 54
Table 4.4: Spelling errors by phoneme and error category ............................................ 55
Table 4.5: Erroneously pronounced target phonemes.................................................... 59
Table 4.6: Errors of the same phoneme in spelling and pronunciation by the same pupil
........................................................................................................................................ 61
Table 4.7: Error rates of L1 phonemes and L2 phonemes ............................................. 62
Table 4.8: Error rates of the graphemes of /ʃ/ ................................................................ 65
Table 4.9: Error rates of the graphemes of /ʧ/ ............................................................... 66
Table 4.10: Error rates of the graphemes of /v/ ............................................................. 66
Table 4.11: Error rates of the graphemes of /w/ ............................................................ 67
Table 4.12: Error rates of the graphemes of /e/ ............................................................. 67
Table 4.13: Error rates of the graphemes of /eə/ ............................................................ 68
Table 4.14: Error rates of the graphemes of /ɪə/ ............................................................ 69
Table 4.15: Rate of phonetically accurate spellings per phoneme................................. 72
Table 4.16: Rate of phonetically accurate spellings per phoneme, excluding irregular
graphemes and /æ/, and including homophone errors .................................................... 73
Table 4.17: Graphemes used in the spelling of nonwords ............................................. 74
vii
List of figures
Figure 2.1: Graphemes as they correspond to the phonemes of ‘pine’ ........................... 7
Figure 3.1: Systemisation of corpus data ....................................................................... 39
Figure 4.1: Relative number of errors from CORYL, by phoneme, from high to low.. 47
Figure 4.2: Distribution of errors per phoneme according to age group ....................... 49
Figure 4.3: The difference in error rates depending on exclusion of unanalysable items
........................................................................................................................................ 50
Figure 4.4: Distribution of errors per phoneme according to gender ............................ 52
Figure 4.5: The relative numbers of errors per phoneme by field work respondents
compared to CORYL ...................................................................................................... 58
Figure 4.6: The error rate of individual graphemes compared to text frequency .......... 70

viii
Abbreviations and conventions
CEFR Common European Framework of Reference for Languages
CORYL Corpus of Young Learner Language
CPH Critical Period Hypothesis
EN Eastern Norwegian
ESL English as a Second Language
GA General American (accent/pronunciation)
L1 First language
L2 Second language
PGC Phoneme–grapheme correspondence
RP Received Pronunciation
SLA Second Language Acquisition
UDIR The Norwegian Directorate for Education and Training
(Utdanningsdirektoratet)
UiB University of Bergen
VG1 First year of upper secondary school
A spelling error is always written in bold lowercase letters, and its target word is written
in small caps, e.g. theef for THIEF.
Phonemes are indicated by surrounding slashes, graphemes (and letter sequences) by
angular brackets, e.g.: <eer> cannot spell any other phoneme than /ɪə/.
Unless otherwise mentioned, everything related to the English spelling system concerns
British English spelling, and RP is used for all English phonology in this thesis.

1
1 Introduction
The aim of the present thesis is to investigate the relation of spelling and sound in the
second language English of young Norwegian learners. English orthography is
particularly inconsistent in how writing corresponds to sound. The 26 letters of the
alphabet cannot realise all 44 Received pronunciation (RP) phonemes in a transparent
one-to-one fashion, and second language learners are faced with an abundance of
inconsistencies in the correspondences between phonemes and graphemes (letters and
letter combinations). The acquisition and teaching of spelling in English is difficult not
only in the ESL classroom, but also for native speakers. Scholars have found that many
English teachers lack the necessary education and knowledge about phonemic awareness
and phoneme–grapheme correspondences required for giving satisfactory instructions,
especially regarding pupils with special needs in reading and writing (see e.g. Fresch,
2008; Sayeski, Earle, Eslinger, & Whitenton, 2017).
Different skills are required to master the encoding (speech to writing) and the
decoding (writing to speech) of language, and learners of first language (L1) and second
language (L2) English often use phonetic strategies in their attempt to spell unfamiliar
words. The difficulty of English spelling can cause problems for L2 learners, sometimes
even to the point where incorrect spelling can overshadow correct use of other language
features. One example from the Corpus of Young Learner Language (CORYL) is the
following sentence, written by a Norwegian pupil in 7th grade (Per is a male first name):
Per jump on the snak and the sneak dayd bikos Per had it sov many pizzas and had ben
sov fet. ‘Per jumped on the snake and the snake died because Per had eaten so many Pizzas
and had become so fat’
Besides corrections on spelling, the sentence in brackets only corrected the word form of
three verbs, and the example shows how a learners’ sentence can contain almost
exclusively spelling errors. From personal experience, teachers of L2 English can
sometimes focus too much on spelling errors and overlook correct features, potentially
giving the pupil worse markings than they deserved. For a short period, I was a substitute

2
English teacher for a pupil with great comprehension and oral skills but poor reading and
writing skills, who relied heavily on phonetic strategies in spelling. As it seemed to me a
common situation, I was surprised to find very little information on which parts of the
orthography or phonology to focus on or if there were any especially problematic patterns.
I therefore decided to find out if there is anything to gain from researching the relationship
between phonology and spelling in Norwegian learners’ L2 English.
A preliminary study was conducted as part of a subject at University of Bergen
(UiB) during the spring of 2018, in which I tested the feasibility of addressing the topic
using corpus data. The spelling errors of /ʃ/ and /ʧ/ were collected and analysed, but the
data is collected anew for the present thesis, in order to adhere to stricter definitions.
The research questions and hypotheses in this thesis are based on theory of literacy
acquisition and English orthography as well as first-hand experience with L2 learners.
The research questions (Q) and hypotheses (H) are as follows:
Q1. Is there a pattern in the phonetics behind learners’ spelling errors?
Q2. Are there phonemes that are more difficult to spell than others?
Q3. Do learners struggle with the same phonemes in pronunciation and spelling?
H1. Learners are more likely to misspell phonemes they pronounce erroneously.
H2. Learners are more likely to misspell phonemes that are not in their L1.
H3. Learners are more likely to misspell phonemes with less iconic graphemes.
H4. L2 spelling errors are phonetically accurate.
The present thesis consists of five chapters including this introduction. Chapter 2 provides
an overview of the relevant theoretical background of the topics involved, summaries of
previous studies on spelling acquisition and spelling errors, and outlines what results we
can expect to find. Chapter 3 presents the methodology, how data was obtained and
treated, while chapter 4 combines the results of the present study with discussions that
draw on the theory presented in chapter 2. Chapter 5 concludes the thesis.

3
2 Theoretical background and previous studies
This chapter provides the theoretical framework necessary for understanding and
conducting an error analysis that focuses on spelling in conjunction with phonology.
What makes up the English orthography, and what makes it difficult to acquire? The first
section explains how writing and sound corresponds in the English spelling system, and
the main focus of the chapter is how learners acquire spelling, and what they do when
they spell, which is primarily dealt with in sections 2.3 and 2.4. Sections 2.5-2.7 outline
the methodology and the results of previous studies on L1 spelling, L2 spelling, and
Norwegian pupils’ challenges in English pronunciation. The field of literacy acquisition
is large, and the chapter can by no means cover every process or issue that the topic
entails, however, the chapter sets the present thesis in the academic context and presents
issues that are particularly important for the discussions in the later chapters.
2.1 The English spelling system
Writing and spelling are essentially the encoding of spoken language, and similarly,
reading is the decoding of written language. The conventions of a written language are
called orthography, in which the building blocks are called graphemes, which are letters
or combinations of letters. In alphabetic orthographies, graphemes are more or less
analogous to phonemes. A spelling system refers to the way orthography meets different
aspects of language. The ‘rules’ or the ‘main system’ of spelling in English relates mostly
to phonology, how phonemes are represented by graphemes. A native speaker would most
likely draw on phoneme–grapheme correspondences when encountering new words or
nonwords. Spelling systems can differ greatly between languages, but most would agree
that the English spelling system is at the more complex end of the spectrum, and Goswami
(2005: 281) even claims that English is “the most inconsistent language in the world in
terms of the consistency of letter–sound correspondences”. An exhaustive and systematic
manner of studying the way phonemes and graphemes meet was first done by Hanna,
Hanna, Hogdes, and Rudorf (1966). The results of this study indicated among other things
that nearly three quarters of phonemes would be spelt correctly if spelt by their respective

4
most regular graphemes and that there are more graphemes in total for vowel phonemes
than for consonant phonemes (Treiman, Berch, & Weatherston, 1993: 466-467; Spencer,
2007: 306). Later, Venezky (1970) (and the partial revisit Venezky (1999)) investigates
the “patterns” in the correspondences from writing to sound and presents some general
principles of English orthography, such as “regularity is based on more than phonology”
and “visual identity of meaningful word parts takes precedence over letter–sound
simplicity” (Cook, 2014: 62). Brooks (2015) also sought to describe the relationship
between the orthography and the phonology of English. The dictionary builds upon some
of the earlier works, Carney (1994) in particular, and provides a very detailed account of
the British English spelling system. It is used throughout this thesis as a reference work
for the phoneme–grapheme correspondences, the grapheme–phoneme correspondences,
and any special processes that occur.
The 44 phonemes of RP can be realised by 284 different graphemes, amounting
to a total of 543 correspondences (Brooks, 2015: 262). A single phoneme can be realised
by as many as 46 different graphemes (/ə/) or as few as 2 different graphemes (/ð/). One
can also look at the correspondences from the other perspective, from grapheme to
phoneme. Not counting 2-phoneme graphemes (to be explained below), in the main
system, only 24 graphemes are exclusive to a single phoneme, or only 11 if doubled
spellings (<gg>, <dd>, etc.) are excluded.
For the purposes of this thesis, graphemes are a single letter or a combination of
letters that represent phonemes: one grapheme (usually) represents one phoneme, and
vice versa. The most economic correspondence between graphemes and phonemes would
have a separate grapheme for each phoneme, where each grapheme consists of one letter.
This is almost the case for vowels /e/ and /æ/ and some of the consonants in English, like
/b/, /g/, /m/, /p/, /r/, /l/, and /h/. These consonants are mostly spelled with a single letter
or the doubled spelling, though a few rare words do have other spellings. For the other 35
phonemes, however, correspondences are not as economic. Learners must eventually face
the fact that some graphemes are pronounced very differently in different environments.
An infamous example is the grapheme <ough>. It can realise /ɔː/ as in thought, /uː/ as in
through, /əʊ/ as in dough, /aʊ/ as in plough, /ə/ as in thorough, and /iː/ (but only in one of
the pronunciations of the name Colclough). Additionally, the same four letters, though as
two separate graphemes <ou> and <gh>, can also represent two phonemes: /ʌf/ as in

5
tough, /ɒf/ as in cough, /ɒk/ as in hough, and /əx/ in the name McCullough. According to
Brooks (2015: 417-418), there are 12 separate ways to pronounce <ough> in the 33 words
this letter sequence occurs in (as one or two graphemes).
The total numbers of graphemes and phoneme-grapheme correspondences above
are somewhat misleading. Part of the reason for the high numbers is the fact that many
graphemes and correspondences occur rarely, often in only one word. For example, <te>
can realise /ʧ/, but only in righteous. Brooks (2015) has devised a system where he sorts
graphemes by frequency and regularity into two groups: the main system, covering 89
graphemes, and the rest, covering the other 195 graphemes. Additionally, he defines a
basic grapheme for each phoneme. For example, the voiced labiodental fricative /v/ can
be realised by 6 graphemes, as shown in Table 2.1 below. Correspondences for /ʃ/ are
added for comparison (excluding 2-phoneme graphemes). The table is adapted from
Brooks (2015: 255 ff.).
Table 2.1: Graphemes of /v/ and /ʃ/
The main system The rest
Phoneme Basic
Grapheme
Other
frequent
graphemes
Rare
graphemes
Doubled
spelling
Oddities, by number of
letters
1 2 3 4
/v/ v f - ve - bv ph
vv
- -
/ʃ/ sh ci si ssi ti ce - c
s t
ch sc
se sj ss
che
chs
sch sci
-
The basic grapheme of /v/ is <v>, and <f> and <ve> make out the rest of the main system,
while <bv>, <ph>, and <vv> are oddities placed in ‘the rest’. Of these, only <v> and <ve>
are regular spellings: <v> occur in word-initial and -medial positions, and <ve> in word-
final positions, with a few exceptions. The other graphemes are rare: <f> only occurs in
roofs when pronounced /ruːvz/ and of, <bv> only in obvious when pronounced /ɒviːəs/,
<ph> only in nephew when pronounced /nevjuː/ and Stephen, and <vv> only word-
medially in colloquial words like lavvy (‘lavatory’) or navvy (‘navigator’). Of these, then,
only <v>, <f>, and <ve> are in the main system of /v/. The graphemes are also described
as being more or less iconic in the present thesis, which mainly refers to the distinction
between main system graphemes and the rest. However, the term also aims to describe a

6
cline of iconicity, taking frequencies into account. For example, if a basic grapheme
covers 99% of the usage of a phoneme, it is more iconic than a basic grapheme that only
covers 25% of the usage of its phoneme. Graphemes are also more iconic the fewer
phonemes they can realise. For example, <ch> can either spell /k/, /ʧ/, or /ʃ/, but <tch>
can only spell /ʧ/.
There are two ways to measure the frequencies of graphemes in each of their
correspondences. One way is to count the number of different words the correspondences
occur in, as in types. This is lexical frequency. The other way is to count the number of
times each correspondence occurs in written language, as in tokens, which is text
frequency. Continuing with the example of /v/, the text frequencies for this phoneme are
98% for <v> and 2% for <ve>, rounded up. The remaining < 1% are the other four
graphemes. With text frequency, function words and inflections (like past tense -ed) are
excluded from the count (Brooks, 2015: 22-23). The reason why the grapheme <f> is part
of this phoneme’s main system is because of the function word of, which has high text
frequency. In the remainder of this thesis, frequency alone will refer to text frequency,
and lexical frequency will be used whenever relevant, however, there are also mentions
of words’, phonemes’ or graphemes’ frequency in the corpus, but context makes this
clear.
The complexity of the English spelling system does not only stem from its high
number of graphemes and correspondences. There are other aspects of English spelling
that make a coherent and simple phoneme-to-grapheme analysis difficult. If the goal is to
link each grapheme to one phoneme, how should the final <e> in pine or cone be
analysed? Should it simply attach to the nearest phoneme, in this case /n/? Some may call
this final <e> a ‘silent letter’, but that may not be a good idea pedagogically. What is the
difference between pin and pine if the <e> is silent? There is a phonetic difference in the
vowel (/pɪn/ and /paɪn/), but if the <e> had no function, nothing in spelling would indicate
this difference. In their respective works Albrow (1972), Carney (1994), and Brooks
(2015) sought to adhere to a principle of exhaustiveness which states that “as far as
possible every letter in a word’s spelling should be allocated to one of the phonemes in
its spoken form.” (Brooks, 2015: 460-461). The <e> in pine belongs therefore to a split
digraph, represented as <i.e>. The dot indicates that the spelling of the next phoneme(s)

7
comes between these letters. The ordering of the graphemes of pine would therefore
correspond nicely to the order of its phonemes, as illustrated in Figure 2.1:
Figure 2.1: Graphemes as they correspond to the phonemes of ‘pine’
This system makes it clear that the two letters of the split digraph <i.e> work together to
refer to a single phoneme. The vowel-changing word-final <e> is also called the ‘magic
<e>’ by English and American kindergarten- and primary school teachers. According to
the ‘magic <e>’ rule, the preceding vowel letter changes in pronunciation to its letter
sound, that is, /aɪ/ for <i>, /əʊ/ for <o>, and so on, though there are of course many
exceptions. There are six split graphemes in English: <a.e> as in make, <e.e> as in scene,
<i.e> as in bike, <o.e> as in bone, <u.e> as in cute, and <y.e> as in rhyme (Brooks, 2015:
6-7, 452-454).
While the <e> of the split digraphs should not be called silent, there are other
candidates for which the label silent might fit. Learners of written English are likely to be
taught that the <k> in knife or the <g> in gnome are silent letters, but it is more helpful to
say that /n/ can be realised by /kn/ and /gn/ as separate graphemes (Brooks, 2015: 460-
461). Letter vowels in spelling can also be problematic as they sometimes have no
counterpart in pronunciation. Examples include business /bɪznɪs/, where no phoneme
corresponds to <i>, and different /dɪfrənt/, where no phoneme corresponds to the first
<e>. The graphemes <si> and <ffe> and 15 other cases of vowel elision are included in
Brooks’ inventory, but there are many more that are not. Brooks (2015: 244) leaves out
32 cases of vowel elision from the graphemic inventory. He proposes instead that it is
sufficient to recognize vowel elision as a special process that occurs in English spelling.
Some would possibly prefer instead that the exhaustiveness principle be followed to the
letter and raise the total number of graphemes to 316.

8
One grapheme consisting of several letters can often correspond to only one
phoneme. The opposite is also true in English: one letter, or grapheme, can represent
several phonemes. These are called 2- or 3-phoneme graphemes. A good example is <x>,
which most often refers to /ks/ as in box /bɒks/, and sometimes also including /e/ as in x-
ray /eksreɪ/.
Another process that contributes to the complexity of English spelling is dual
functioning, which Brooks (2015: 245) argues to occur with four phonemes: /e/, /r/, /w/,
and /y/. In cases of dual functioning, one grapheme, or part of a grapheme, has two
different functions in a specific word. In other words, two different phonemes dictate that
this grapheme be present. Dual-functioning /e/ occurs when it is both part of a split
digraph and of a word-final digraph. In save /seɪv/, two separate rules place the letter <e>
in word-final position: word-final /v/ is always represented by <ve>, and the diphthong
/eɪ/ is represented by <e.e> due to the ‘magic <e>’ rule.
2.2 Spelling in error analysis
Analysing errors involves studying interlanguage. This is a term coined by Selinker
(1972) which refers to the learner’s version of the target language. In error analysis, the
learner’s language is measured against the target language. Error analysis thus concerns
comparison between interlanguage and target language, and it is “a methodology for
dealing with data, rather than a theory of acquisition” (Cook, 1993: 22, in James, 1998:
7). It has been established that phonology plays a key role in spelling, both in beginner
and skilled spellers (Bosman & Van Orden, 1997: 175). Lexical, morphological,
syntactic, and phonological shortcomings can each cause the speller to produce an error.
Spelling errors are common in both learners’ and native speakers’ output. Lay
people are quick to spot this type of error and point it out, as spelling is “the most easily
assessed aspect of writing” (Brooks, Gorman, & Kendall, 1993: 1). Having correct
spelling is associated with being educated, though it is not the only factor in this
association (Cook, 1997: 474). When writing in online forums, for instance, the writer is
probably more likely to receive comments on their spelling rather than their syntax, word
choice, etc. According to Lightbown & Spada (2013: 39), only errors that tamper with
meaning are likely to be corrected in second language learning situations outside the
classroom, as it is regarded as impolite by most to interrupt someone trying to converse

9
in a second language. Online written discourse seldom involves a sense of direct
conversation between interlocutors. The sense of interrupting is then greatly diminished,
which lowers the bar for metalinguistic commentary.
In language, error exists as a spectrum of deviance, which is realised in the terms
slip, mistake, and error. Distinguishing between these requires information on the writer’s
intentions and ability to identify and correct their own writing, and the trichotomy has
been studied since the start of the 20th century. For example, in his Study of Misspellings
and Related Mistakes, Le Marchant Douse presented five types of orthographic mistakes
that he believed should be exempt from “bad marks” in the examinations of young people
(Le Marchant Douse, 1900: 93). It is for instance described how even skilled spellers
“may be for a moment perturbed by the sight or expectation of the coming P or A” and
write letters in the wrong sequence, or that the speller after writing one of the two letters
in a doubled spelling “may imagine that he has filled both and pass on” (Le Marchant
Douse, 1900: 86).
James (1998: 83-84) proposes to define slip, mistake, and error in concordance
with a degree of self-corrigibility. Firstly, if the unaided writer can quickly spot the
deviance and correct it, the deviance is a slip. Slips are typically typographic errors, i.e.
errors of execution rather than competence, through typos on the keyboard or lapses of
the pen. Secondly, if the writer is unable to spot the deviance but able to correct it when
it is drawn attention to, it is a mistake. Finally, if the writer is unable to correct the
deviance, it is an error, and further teaching is necessary before self-correction is possible.
Therefore, error is the type of language deviance that is most relevant to this thesis.
James (1998) also presents a list of types of errors that seem to be spelling errors,
but do not define them as such. Among these types are punctuation errors and typographic
errors, which are irrelevant to the spelling system. Another error type is confusibles,
which is the result of confusing similar words or homophones/-graphs with each other.
One type of error in the list is called dyslexic errors. This category contains misordering
of letters, like tow for TWO, and errors he deems pathological, using the example sat for
ASKED. He also includes “misselection from two letters that can represent the same sound”
(James, 1998: 130). There is no justification in his argument that these misselections
should be treated differently in cases of dyslexia. Reflections on these (and other) types
of error in relation to this thesis is covered in Chapter 3.3.

10
Sometimes, it may seem that an error is caused by interference from the L1. Such
cases are evidence of language transfer, which is when “linguistic features of one
language influence those of another language.” (R. Ellis, 2015: 118). Transfer is observed
in every aspect of language, though it is most obvious in pronunciation. Errors caused by
transfer in pronunciation can also have a direct effect on performance in spelling. When
learners of English attempt to spell, they have four strategies, or routes, at their disposal,
whether they are conscious of them or not. These routes are via L1 or L2 phonology, or
via L1 or L2 graphology (James, 1998: 134). One of these routes could also be called a
mispronunciation error. Using L1 phonology means that the learner accesses graphemes
for a phoneme that does not represent the target sound. James (1998: 137-138) separates
the other routes into two categories, namely interlingual misencodings and intralingual
misencodings. The first category involves language transfer, such as using L1 graphemes
that exist in the L2 for other phonemes. In the second category are misspellings that occur
without interference from the L1. Examples are overgeneralization of productive L2
spelling patterns, and choosing the wrong grapheme, but one that would be correct in the
same environment in a different word, like theef for THIEF.
Evidence for transfer in the domain of spelling can be found in e.g. Wang and
Geva (2003), who analyse the spelling errors of non-Cantonese phonemes /ʃ/ and /θ/ by
young native English speakers and Chinese learners of L2 English. They found that the
Chinese children largely produced spellings of these two phonemes with graphemes
representing close Cantonese counterparts, such as <s> for /ʃ/ and <s> and <z> for /θ/
(Wang & Geva, 2003: 342-343).
2.3 Acquisition of literacy
Literacy is the ability to read and write, which means that literacy skill is the combination
of reading and spelling skills. Reading and spelling seem at first glance to be two related,
but separate actions or abilities. Ehri (1997) points out that spelling can also refer to the
way a word is spelt as a sequence of letters and that recognising the spelling of words
while reading lies somewhere in between the act of spelling and the act of reading. She
also notes that when we write, we often read our own written products to assess the
correctness of the spelling, which means reading is often a part of the production of a
spelling. Many children perform adequately according to age in reading, but not in
11
spelling, and the opposite scenario is uncommon, which indicates that acquiring spelling
is more difficult than reading (Bosman & Van Orden, 1997: 174).
Children’s acquisition of L1 literacy depends on the orthographic depth of the
language. Spencer (2007: 307) presents evidence from several studies comparing
languages with different orthographies and claims that literacy acquisition is acquired
through different means in shallow and deep orthographies. A shallow orthography is an
orthography where there is close to one-to-one correspondence from graphemes to
phonemes, from phonemes to graphemes, or both. Deeper orthographies contain more
multi-letter graphemes, higher numbers of correspondences in both directions, and
inconsistencies. English orthography is deep, and is not transparent in any direction.
Spencer (2007) supports the hypothesis that acquiring literacy in a language with a
shallow orthography should only require a phonological process, but that acquiring
deeper orthographies requires more visual processes. Goswami (2005) refers to studies
on reading development across different languages and concludes that acquiring L1
English reading seems to be more difficult than in other languages, mostly because of the
orthographic inconsistencies of English (Goswami, 2005: 275, 280-281).
Spencer (2007) also notes that even within a language with a deep orthography,
words vary in relative orthographic depth; some words are wholly transparent in their
phoneme–grapheme correspondences, while other words contain more opaque
correspondences. This variation has an effect on both reading and spelling, but more
importantly, the language’s variation in phoneme–grapheme and grapheme–phoneme
correspondences correlates with the early acquisition of reading in a language (Spencer,
2007: 305-307). Spencer (2007) also conducted a study that found that the complexity
(which he defines as the number of letters compared to the number of phonemes in a
word) is more important than the frequency of words in predicting reading difficulties
(Spencer, 2007: 328). In other words, the more digraphs and trigraphs a word has, the
more difficult it is for young learners to read and/or spell.
Several factors have been shown to be essential in literacy acquisition or to be
predictors of better skills in reading or spelling. Ball and Blachman (1988: 217)
investigated the acquisition of L1 reading and found that explicit instruction in phonemic
awareness for pre-school children was effective and would facilitate reading acquisition.
However, Perin (1983) indicates that phonemic awareness is more closely related to
12
spelling than to reading skill, and argues that in early acquisition, reading is done using a
visual route while spelling is done using a phonological route. This is backed up by later
theory of spelling acquisition which states that the learner relies purely on phonology in
the initial stages, and only eventually draws on positional constraints and morphology in
the encoding of words (Treiman & Cassar, 1997: 77-78). Moving beyond phonemic
awareness, Chen and Schwartz (2018) stress the importance of morphological awareness
in the acquisition of literacy. This is important regardless of the type of morphology, but
is more central in languages with morphosyllabic writing systems, i.e. orthographies with
no representation of phonology in the characters, as in e.g. Chinese (Chen & Schwartz,
2018: 1685). The awareness of morphology is multi-faceted in that it requires
phonological, syntactic, and semantic skills, and this combination is part of the
contribution to successful literacy acquisition (Chen & Schwartz, 2018: 1692).
Treiman and Kessler (2006: 642-643) suggest that spellers, in their lexicon, store
not only the most basic phoneme–grapheme correspondences, but also information on
how particular contexts decide which correspondence is correct. But this is only half of
what speakers do when they read and write. The theory of a dual-route model states that
speakers have two ways to access the pronunciation or spelling of perceived words. The
framework of spelling suggesting that speakers draw on phoneme–grapheme
correspondences and contextual constraints makes up the phonological route of this
model. The other route is the visual route, when entire words are stored in the lexicon and
accessed without the use of phonology (Cook, 1997: 474-475). English uses a mix of both
routes, where regularities in spelling and pronunciation enables use of the phonological
route whereas irregularities requires use of the visual route. Pronouncing a nonword like
whimastity can easily be attempted by native speakers of English because they
(consciously or not) recognize morphological patterns and use phoneme–grapheme
correspondence rules. In contrast, spelling or pronouncing the word hiccough cannot be
correctly guessed by using previously attained rules. Words like hiccough require the
visual route and are called meaning-based words. Chinese is an example of a language
where the orthography is mainly meaning-based, where each symbol carries meaning. A
Chinese learner of English is therefore exptected to be less likely to use the phonological
route when attempting to spell or pronounce unknown words. (Cook, 1997: 475-476).
Section 2.6 summarises a study with examples of this (viz. Joshi, Høien, Feng,

13
Chengappa, & Boulware-Gooden, 2013). The dual-route model can help to explain how
speakers with different L1s use different strategies in spelling unknown L2 words.
2.3.1 L2 Literacy
Many of the studies on the acquisition of literacy are focused on whether, and to what
degree, L1 skills are transferable to L2 acquisition. Koda (2005: 328) summarises the
literature on the subject by stating that metalinguistic awareness in the L1 can make
“critical contributions, in multiple ways, to second-language literacy acquisition”. A
study by Sun-Alperin and Wang (2011) on Spanish learners of L2 English found evidence
of transfer from processing skills in phonology and orthography, and Kahn-Horwitz,
Sparks, and Goldstein (2012) found that the linguistic skills of primary school Hebrew
L1 speakers predicted spelling in L2 English longitudinally. Some studies have
investigated the transfer of linguistic skills across orthographies. In a study of young
Chinese learners of L2 English, Shum, Ho, Siegel, and Au (2016) found evidence that
poor L1 literacy skills have effects on L2 phonology in particular, and Farukh and
Vulchanova (2015), investigating the L2 English literacy skills among L1 Urdu speakers,
conclude that being familiar with a deep orthography is enough to gain an advantage in
acquiring reading and spelling in L2 English.
A study by Holm and Dodd (1996) also provides evidence of transfer of L1
literacy skills, and found that the spelling of known words and the spelling of nonwords
are processed differently; it is possible to spell known words without a phonological
route, but not nonwords (Holm & Dodd, 1996: 139). However, Gombert, Bryant, and
Warrick (1997: 232) stress that sometimes, speakers use analogies based on orthographic
similarities when trying to read or spell unknown words, and that skilled readers/spellers
are better at employing this strategy.
2.4 Acquisition of spelling
Traditionally, written language has not been considered as important as spoken language
in linguistic research and theory. Saussure (1972 in Jaffré (1997: 3)) said that “the spoken
form alone constitutes the [linguistic] object”, while some went as far as saying that
“writing is not language, but merely a way of recording language by means of visible
marks” (Bloomfield 1970, in Jaffré (1997: 3)). Spelling errors have been the object of

14
study since early 20th century (see e.g. Le Marchant Douse, 1900; Foster, 1911; Gill,
1912), but have largely been absent from linguistic theory. Perfetti (1997: 21) points out
that the field of psycholinguistics, which he considers “the natural home for the study of
spelling”, neglected spelling, and he found little on the topic in psycholinguistic literature.
He proposes that the reason is that spelling has not been deemed a scientific problem,
only a convention of literacy or a school subject. A large part of studies on spelling in
psychology and psycholinguistics merely use spelling tests and theory to gain knowledge
about language acquisition as a bigger picture, without focusing as much on the domain
of spelling itself. Contrastive to the negative outlook given in Perfetti (1997), academic
work over the past decades involving spelling has resulted in a range of theories on the
acquisition of spelling in first and second languages, comparisons between learners’ L2
spelling by different L1s, and more.
Spelling, like all other aspects of language, is acquired through both implicit and
explicit learning. Acquisition of a language requires exposure and practice. Since most
learners of an L2 will have already acquired some level of literacy in their L1, they will
begin acquiring literacy in the onset of learning that L2. The acquisition of spelling
therefore happens later in the learning process for L1 learners than for L2 learners,
assuming that most L2 learners have already learned to read and write in their L1 when
they start learning their L2. The notion that the acquisition of different aspects of language
occurs sequentially is well established in SLA. Learners, regardless of L1, have a
tendency to acquire features of the target language in the same order. For instance,
learners of English tend to acquire irregular past forms of verbs before the regular -ed
inflection (Lightbown & Spada, 2013: 45). While spelling is rarely mentioned in literature
on SLA, we can assume that the same should apply to the acquisition of spelling. The
order of sequences in language acquisition is not determined by frequency. Frequent
items, like English articles a/the, are not necessarily acquired first (Lightbown & Spada,
2013: 45). We can also assume that the same applies to graphemes and grapheme-
phoneme correspondences.
SLA theory also suggest that acquisition of certain language aspects depends on
the age of the learner, and this hypothesis is The Critical Period Hypothesis (CPH). It
states that humans acquire language more easily in a certain age span, after which learners
have more difficulty acquiring language and are not likely to achieve native levels of

15
competence (R. Ellis, 2015: 26). The CPH faces relatively little opposition, but scholars
do not agree on the age span that involves the onset and end of CPH. The period may end
long before or even after adolescence, and some have argued that the period varies
between language aspects. For example, Granena and Long (2012, in R. Ellis, 2015: 27)
provide evidence that the period ends much earlier for phonology than for lexis or
grammar. It is uncertain where spelling lies in this spectrum, but we can assume that the
CPH does apply to spelling.
What we do know about the initial, logographic stage in the acquisition of spelling
is that children tend to focus on a single aspect of a word, like a letter. When the child
understands that letters correspond to sound, the phonetic stage begins. This stage lasts
until the child can draw upon visual spelling patterns and morphological knowledge,
which is the morphemic/orthographic stage. Examples from the three stages include rudf
for ARE YOU DEAF, sigrit for CIGARETTE, and younited for UNITED (van Berkel, 2004:
239-241)1.
2.4.1 Phonological influence on spelling
It has been established since at least the 1970s that phonology plays a big part in the
acquisition of spelling (Read, 1970, in Read & Treiman, 2013: 196). Evidence of the
importance of phonology in the acquisition of L1 spelling has been found in multiple
studies. For instance, Anderson (1985) found that young learners primarily use a
phonological route which gradually develops into a more integrated view, while unskilled
adults appear to keep relying on the phonological strategy. Further evidence for the
phonological route is found by e.g. Bruck and Treiman (1990), Caravolas, Hulme, and
Snowling (2001), van Berkel (2005), and Fresch (2008). An example of the phonological
route in the early stages of L1 spelling acquisition is given by Read and Treiman (2013),
where a child has written wrx for WORKS. Since the graphemes used do not represent the
morphology (the base and inflection), the spelling is closer to a phonological
representation (Read & Treiman, 2013: 195-196).
Since spelling can be seen as the symbolic representation of sound, the acquisition
of L2 phonology may be helpful in explaining some types of spelling errors. Contrastive
analysis can be used to determine how the phonemic inventories of two languages differ.
1 The examples are gathered by van Berkel (2004) from several sources.

16
Phonemes not present in the L1 are likely to be a frequent source of error for the L2
learner. For example, dental fricatives /θ/ and /ð/ are present in few other languages, and
learners of English will often substitute these with other, closely related sounds like /d/,
/t/, /s/, etc. Learners are also likely to overgeneralize and use sounds they know are
difficult in place of those related sounds, e.g. pronouncing words like tin as /θɪn/
(Lightbown & Spada, 2013: 68-69). Swan and Smith (2001: 26) argue similarly, and use
the distinction between /v/ and /w/ to illustrate: “[Learners whose L1 does not contain
/w/] tend to replace v by w (*werry, *wolley ball), probably because this spelling is
assumed to be more ‘English’.” Essentially, learners are likely to replace both the familiar
and the unfamiliar phoneme with each other, where the overuse of an unfamiliar phoneme
could be explained by the learner’s hunch that the phoneme should be more present than
what the learner is used to. It is possible that the same errors could be manifest in spelling,
that a pupil pronouncing tin as /θɪn/ would also spell it as thin. This is investigated in the
present thesis through H1.
There is an opposing view of the importance of intralingual phonological
influence on spelling, specifically when it comes to L2 spelling, in other words, English
phonology may not be as important in L2 English spelling as some claim, since for ESL
learners, the phonological base is as lacking as the orthographic. Therefore, van Berkel
(2004) suggests that the visual route must be more important for L2 learners than L1
learners in the acquisition of spelling.
It is clear that skills in phonology are important in acquiring English spelling, but
not as important as in shallower orthographies, as the inconsistencies of English
orthography demand use of the phonological and the visual route. However, the context
of phonemes and graphemes within each word can greatly reduce these inconsistencies.
Treiman et al. (1993) found evidence that the context of a phoneme influences an L1
learner’s ability to spell it, and that there were more errors in middle syllables and in
unstressed syllables, and Treiman (1985) found that children struggle with initial
consonant clusters. The latter study also suggests that it could be more feasible to analyse
English spelling in the context of syllabic structures like onset and rime2, largely because
children omitted syllable-final single consonants more often than syllable-initial single
2 The onset is an optional consonant or consonant cluster, and the obligatory rime consists of a nucleus and
a coda, the latter of which may contain a consonant or a consonant cluster.

17
consonants (Treiman, 1985: 6, 14). The reasoning would be that if we process rimes over
individual phonemes or graphemes, omitting a letter that is part of a larger unit is more
acceptable than if omitting the letter omits the entire unit.
Context in spelling concerns more than just syllabic units, and the context of
neighbouring phonemes or graphemes may be critical in the act of spelling. The majority
of phoneme–grapheme correspondences for phonemes are predictable when contextual
rules are applied (van Berkel, 2005: 107-108). A more recent study by Treiman and
Kessler (2016) found that word-final spellings are determined by graphic rules more often
than by phonological rules. Using nonwords, they found that the word-final consonant
spellings produced by university students with English L1 are influenced by the phoneme
they select for the preceding vowel. This is also evidence for the use of a visual route,
that analogy from existing words dictates whether neighbouring graphemes appear
correct or not. For example, spellers tended to avoid “graphotactically odd” spellings such
as <aick> or <uk> (Treiman & Kessler, 2016: 1157).
The examples of contextually influenced spellings already assume that the
graphemes used are part of the correspondences of the phoneme. In the spelling of real
words, this phenomenon is called phonetic accuracy. Bosman and Van Orden (1997) treat
phonetically accurate misspellings as words that can be pronounced identically to the
target word, and, in an overview of more than twenty studies since 1980s involving
phonetic accuracy in spelling error analysis, found that the “vast majority” of spelling
errors were “phonetically acceptable” in every study (Bosman & Van Orden, 1997: 175-
176). Studies have also found that in the spelling of nonwords, L1 speakers tend to use
the most common correspondences for phonemes (e.g. Barry & Seymour, 1988).
Based on what the literature says about the roles of phonetic accuracy and context
in spelling, we can assume that (at least L1) spellers are more likely to produce spellings
that are both phonetically and contextually accurate. For example, while <tch> is part of
the correspondences of /ʧ/, it does not occur in all positions. It is common word-finally,
but never occurs initially in English. Therefore, if someone were to spell a word like CHAT
as tchat, it would be phonetically accurate, but contextually inaccurate. The literature on
phonetically accurate spellings concerns spelling in L1 English, and it is unclear whether
the same phenomenon occurs as often in L2 English. The issue is therefore investigated
in the present thesis through H4.

18
2.5 Error categories
There are other ways to categorise spelling errors than in relation to phonology or context.
Spache (1940) provides an overview of the different ways scholars categorised spelling
errors prior to 1940. There has been a range of different approaches, and several studies
included categories such as “mispronunciation” and “non-phonetic substitution”, and the
overview is concluded with a suggestion of categories to be used, containing 13 different
categories concerning slips, mistakes, and errors (Spache, 1940). Livingston (1946) used
seven categories plus an “unclassified” category and found that young L1 spellers mostly
produced errors in the “confusions” and the “omissions” categories. Since then, several
studies on L1 English spelling have adapted the categories into the following system in
classifying errors: insertion (innto for INTO), omission (scard for SCARED), substitution
(naw for NOW), and transposition (agian for AGAIN), and some include other categories
for problematic cases. All these categories concern letters, not graphemes. The system is
adapted for data analysis in this thesis and is explained in Chapter 3.3.
Brooks et al. (1993) studied spelling among native English learners, investigating
whether there was any difference in spelling ability related to age (11- and 15-year-olds),
gender, writing task, general writing ability, or year. The first 10 lines of 1492 different
pupil texts were analysed. This study also made use of the letter-based error categories as
described above. The authors also defined the grapheme substitution category, to be used
when the other four categories failed to analyse the error to satisfaction: “when (…) the
error seems very clearly to consist in the representation of a single phoneme by a possible,
but in context incorrect, grapheme.” (Brooks et al., 1993: 10). The study also allowed
multiple errors per word. The results show that, on the whole, these pupils had few
spelling errors at a mean 2.2 errors per 10 lines. An interesting find is that this number is
affected by a less skilled minority. The category of texts containing six or more errors
was proportionally large. In fact, 16% of 11-year-olds and 6% of 15-year-olds made more
than one error per two lines. By comparison, these texts were more numerous than the
texts with four errors and the texts with five errors combined, for both age groups (Brooks
et al., 1993: 14-15). The study found that the most common error category, by a wide
margin, was omission. It also found that there was no difference between age groups or
spelling skill in types of error produced. It would be difficult to compare the errors-per-

19
line numbers with the results of this thesis, but it is possible to compare the findings on
errors per category and differences between age groups.
Cook (1997) combined the analysis of corpus data and previous studies to
investigate the differences in error among L1 and L2 users of English, in order to find out
whether learners of English with different L1s experience the same problems. By
comparing the misspellings of L1 children and L2 adults, the study found that these two
groups produce similar amounts of each error type as well as errors on the whole. In a
more detailed analysis, results show that the most common error across groups was
omission. There were some differences, particularly in a grapheme substitution category,
which was based on phonology rather than letters in order to account for more complex
errors, but on the whole, Cook found no “distinctive spelling characteristics” between L2
users and L1 children and adults (Cook, 1997: 480). There was no type of error that was
‘unique’ to one group, and L2 adults performed almost identically to L1 children in terms
of error category and frequency.
The study also contained a more detailed analysis of the letter-based error
categories in an attempt to “provide a more detailed description of typical L1 and L2
errors and to lead towards questions concerning the involvement of the two routes and
their relationship to the user’s L1” (Cook, 1997: 480). Three vowel letters were present
in most vowel substitution errors, namely <a>, <e>, and <i>. These all substituted and
were substituted by each other. As mentioned in section 2.1, the unstressed middle vowel
/ə/, schwa, can be realised by a range of graphemes, including <a> (35%), <e> (13%),
and <i>; note that Brooks (2015) gives no frequency for <i> alone, but <i> is part of 30
phonemes that together constitute 12% of the spellings of /ə/. Results from Cook (1997)
show that of the <a>, <e>, and <i> vowel substitutions, 41.2% of L2 errors and 66.2% L1
errors could be pronounced /ə/. However, the only conclusion to be drawn from this result
is that /ə/ clearly could not be the whole reason for vowel substitution errors. There is no
discussion on the cause of the other vowel substitution errors. Consonant substitutions
were also analysed, and grouped by letters representing sibilants (<s>, <c>, <z>, and <t>),
and a couple of substitutions specific to certain L1 groups (e.g. <l> and <r> for Japanese
speakers and <b>, <d>, and <p> for Greek speakers). The only observation of these errors
on the phoneme level is that the majority all concerned sibilants, but it is noted that many
of the errors seem to occur because of morphological boundaries (Cook, 1997: 481-482).

20
Other findings of the study include that ‘many’ omissions occur with letters that do
represent sound, unlike ‘silent’ letters, which may have been expected to be a larger part
of this category; that digraphs with the letter <h> were commonly subjected to
transpositions by L2 speakers; and that a part of insertion errors stood out as ‘sound-
based’, namely using <ie> over <i> for /aɪ/ as in priemary for PRIMARY (Cook, 1997:
483-485).
It is stressed in the study that the analysis of spelling errors using learners’ own
texts may be misleading, as the data cannot show what the learner does not know (Cook,
1997: 486). It is very likely that learners avoid using words they know they cannot spell,
especially in a test situation. Therefore, the full image of how much spelling learners have
acquired is almost impossible to obtain. Cook (1997) concludes that the majority of L1
and L2 users’ spelling errors can be credited to phoneme-grapheme correspondences. To
see the effects of the L1 on the L2 spellings, he argues, the spellings of one L1 group
must be viewed in the light of the phonology of that L1. He also adds, however, that due
to the similarities in the spread of error category by the different L1 and L2 users,
language transfer may not be as important as previously thought. Finally, the study calls
for “far more research” on spelling of young learners of English (Cook, 1997: 485-487).
2.6 L2 English spelling
A number of studies have found evidence that the L1 directly influences spelling in L2
English, see e.g. L1 Arabic in Allaith and Joshi (2011), L1 Spanish in Bebout (1985), and
L1 Danish, Russian and Italian in Dich and Pedersen (2013). Additionally, Figueredo
(2006) compared the results of 27 studies that investigates the influence of a first language
on spelling in L2 English, and found “strong evidence for a relation between the ESL
learner’s first language and English spelling skill development” (Figueredo, 2006:
874+899).
Other studies explicitly attribute the source of influence upon spelling in L2
English to the phonology of the L1, see for instance L1 Chinese in Wang and Geva (2003)
and Yeong and Liow (2010), L1 Korean in Park (2011), and L1 Kikuyu3 in Macharia
(2013). One study of particular interest was conducted by Theresa Sonderman for her
master’s thesis (Sonderman, 2004). This thesis investigated whether errors in
3 Mainly spoken in central Kenya.

21
pronunciation would be reflected in the spelling of English words produced by young
learners (2nd and 4th graders) whose L1 was Spanish, which is similar to H1 in the present
thesis, which assumes that learners are more likely to misspell phonemes they pronounce
erroneously. A population of fourteen speakers performed a pronunciation test and a
spelling test, the latter consisting of 22 words. Some of these words were included as they
contained phonemes that were expected to be difficult to spell for Spanish speakers. The
population misspelt on average 64% of words, and in total, subjects produced an error in
both pronunciation and spelling in the same word ten times. Nine of these ten were errors
involving phonemes that do not occur in Spanish phonology, and Sonderman concludes
that the number of errors confirming the hypothesis is small, but still noteworthy
(Sonderman, 2004: 33-34, 44). However, the definition of these errors is unclear. It could
be that Sonderman only looked for errors in pronunciation and spelling that were
phonetically accurate, i.e., if SHELVES was spelt as shelfs and pronounced as /ʃelfs/, the
errors ‘match’. If the spelling error was shelfs but the pronunciation errors was instead
/ʃelbz/, there would be an error for the same target phoneme (/v/) in spelling and
pronunciation, however they would not be compatible in terms of phoneme–grapheme
correspondences. Based on the examples she provides, it seems that only phonetically
accurate error pairs were included.
Additionally, it is pointed out that across both the pronunciation test and the
spelling test, there was a high frequency of errors among fricatives and affricates, which,
apart from /s/, are rare in Spanish (Sonderman, 2004: 46). There was also a tendency of
errors based on differences in phonology with /b/ and /v/, which are separate phonemes
in English, but allophones of one phoneme in Spanish. The errors relating to this
difference are claimed to be cases of negative transfer from L1 Spanish (Sonderman,
2004: 47). The last findings of this study that are of interest here is that there is a
correlation between the number of times a word was misspelt and the frequency of that
word in third- and fourth grade English, and there is a correlation between error rate for
a word and whether or not there is a Spanish cognate of that word. The less frequent
words were misspelt more often, and words that had a Spanish cognate were pronounced
correctly but spelt incorrectly by most of the population (Sonderman, 2004: 48-49).
Joshi et al. (2013), in two separate studies, investigated the role of different
orthographies by comparing pupils from different primary school grades from four

22
different countries: USA, China, India, and Norway. The most striking result was in the
difference in answers among L2 children, specifically the Chinese in contrast with the
Norwegian and Indian children. The selection of these L1s was on the grounds of different
orthographies; Norwegian is alphabetic, Indian (specifically Kannada) is alphabetic-
syllabic and Chinese is mostly morphemic (Joshi et al., 2013: 570-571). The study
consisted of 50 words given by means of dictation. Even though the amount of errors was
similar across L1 groups, the way errors manifested themselves were clearly different
between the learners with alphabetic L1s and Chinese. It is clear from the results that the
former used the phonological route and the latter used the visual route in attempting to
spell less frequent words. For the target word WORLD, the Norwegian pupils produced
errors like word, wold, vold, and Indian pupils produced vorld, and word, volte, wold,
and owed, whereas the Chinese pupils produced work, worker, wall, and what (Joshi et
al., 2013: 573). They conclude that the acquisition of spelling is facilitated by the
knowledge that words can be separated into phonetic elements (Joshi et al., 2013: 573).
The relationship between the processing of an L1 and an L2 has also been studied
in terms of brain activity, and a study found that L1 and L2 abilities are closely related in
the way they are processed in the brain (Weber, Kozel, Purgstaller, Kargl, Schwab, &
Fink, 2013). L2 morphological tasks were more complex than phonological tasks for
young learners, and the results support the theory of sequential acquisition of spelling.
2.6.1 Norwegian learners’ spelling of L2 English
Before I discuss studies on Norwegian learners, I present some context about how much
is expected from pupils at various ages. Norwegian pupils start learning English in 1st
grade, usually the year they turn six years old. The Norwegian Directorate for Education
and Training (‘Utdanningsdirektoratet’, or UDIR), responsible for the education in
kindergarten and primary and secondary schools in Norway, have defined some
competence aims in each grade’s English curriculum. These aims are sorted under four
themes: language learning, oral communication, written communication, and culture,
society, and literature. Only one or two aims per grade mention spelling ability. When
spelling is mentioned, definitions are vague, and no examples are given to enlighten the
reader. For example, it is expected that pupils at the end of 2nd grade can “recognise the
relation between some English phonemes and spelling patterns”. After 4th grade, the
23
production of spelling is expected: pupils should “understand the relation between
English phonemes and letters and put sounds together to form words” and “use some
common short words and simple spelling and sentence patterns”, but it is unclear what
‘simple spelling patterns’ cover. However, pupils are by now also expected to “be able to
repeat the English alphabet and spell names and their home town”, which implies that at
least up until 4th grade, letter naming seems to be sufficient. After 7th grade, the end of
primary school, pupils are expected to “use basic patterns for orthography (…) to produce
texts”. After 10th grade, this is changed to “central patterns”. The adjective is omitted in
the aims for VG1 (first year of upper secondary): “use patterns for orthography (…)”. In
short, it is expected that Norwegian pupils acquire an awareness of the relationship
between orthography and phonology, and that from 2nd to 10th grade progress through
‘simple’, ‘basic’, and ‘central’ spelling patterns (Utdanningsdirektoratet, 2013).
These competence aims were defined in 2013 and are currently in effect for
Norwegian schools. Respondents in the studies described below were exposed to earlier
versions of competence aims. The same is true for the present thesis, as the corpus used
collected pupils’ tests in 2004. The competence aims used that year were defined in 1997
and aims involving spelling were even more vague than the current version.
The first aim relevant to orthography and spelling was for 3rd grade: “gradually
get to know the English sound system, e.g. practicing the alphabet”, which leads to
“experimenting with the language, (…) read, write, create own texts” in 4th grade.
Spelling is first mentioned in 6th grade: “get to know the structures of the language (…)
spelling patterns, phonics” and finally “recognise the most common inflections and work
with vocabulary, spelling”.4 The grades from 7th to 10th did not include any explicit aims
related to spelling (my translation from Norwegian, Veiteberg, 1996).
It is difficult to compare the two sets of competence aims, as the latest has more
content but is still relatively vague in definitions and scope. There may be a stronger
emphasis on teaching linguistic knowledge in the current curriculum. It is nevertheless
the case that Norwegian pupils in 2004 and in 2019 were/are expected to be able to write
4 My translation from the following: “sette seg gradvis inn i det engelske lydsystemet, f eks øve seg på
alfabetet”, “eksperimentere med språket, (…) lese, skrive, lage egne tekster”, “sette seg inn i språkets
strukturer (…) stavemåter, lydskrift”, “kjenne de vanligste bøyningsformene og arbeide med ordforråd,
rettskrivning”.

24
their own English texts by the end of primary school. Pupils should also have a fairly low
rate of spelling errors after seven years of learning English at school.
There has been little research on Norwegians’ spelling of L2 English, but some
have included spelling in more over-arching studies. In an error analysis dividing errors
into orthography, morphology, syntax, and lexis, Olsen (1999) observed that among 39
Norwegian pupils in lower secondary school, there was a tendency to write “typical
English” clusters, to overuse <c>, to overuse double consonants in short syllables, and
that most of the errors made were orthographic in type. Most errors (across all domains,
not only spelling) were attributed to influence from the L1 (Olsen, 1999: 201).
In her Master’s thesis, Nygaard (2010) investigated the written English
competence in 95 Norwegian pupils attending different programs at upper secondary
vocational schools, investigating several aspects: concord, verb tense, omitted words,
word choice, word order, punctuation, capitalisation, wrong word form, and spelling
(Nygaard, 2010: 50-51). Nygaard included wrongly used homophones (like see for SEA)
as spelling errors. Of all error categories, spelling was the most frequent one across
groups, despite the fact that the data were extracted from test answers written on
computers that had spell check enabled. Most of her analysis of spelling errors regarded
how many of the misspellings that the built-in spell check identified, i.e. of how much
help the spell check was to the pupils. When properties of the errors themselves were
analysed, only two are mentioned: “generalisation of spelling rules” (giving the example
wather for WATER) and the “extremely common” tendency “to put [the letter <h>] in the
wrong place” (giving the example whit for WITH) (Nygaard, 2010: 59, 67-68). However,
for the remainder of her thesis, the focus was not on analysing but rather counting errors
in relation to the total number of words and to the number of errors identified by the spell
check. Nygaard’s study investigated many topics but unfortunately did not present any
insight into how Norwegian pupils spell erroneously.
Raaen and Guldal (2012) conducted a longitudinal study on Norwegian pupils,
collecting data when the pupils attended 7th and 10th grade. The main focus of the study
was on the development of formal aspects of written English, and preliminary results
were published in among others Raaen (2009) and Raaen (2010). The study tested
orthography and sentence structure. In her analysis of their spelling errors, Raaen focused
on a selection of frequent function words: two, three, his, her, who and with, in addition

25
to because and genitive ‘s (Raaen & Guldal, 2012: 106). They found a high level of
spelling errors in all categories (from 26% of numerals to 58% of the genitive s) but made
some perhaps misguided decisions on identifying and classifying errors. For instance,
errors like runned for RAN and thinked for THOUGHT were included as spelling errors,
when clearly, these are the result of errors in irregular past tense inflection (Raaen, 2009:
311-312). Errors like these are not counted in the present thesis, which will be explained
in the methodology chapter. In her analysis of the spelling errors, Raaen focuses mainly
on the pupils’ level of vocabulary and the way this was taught to the pupils. The
comparison between performance in 7th and 10th grade shows that the pupils had halved
the error rates for some of the words. Altogether, the error rates for 10th grade pupils had
been reduced to 6.8%. It is stressed that this error rate is partly caused by “a clear minority
that struggles with spelling”, which mirrors the analysis in Brooks et al. (1993) (Raaen &
Guldal, 2012: 113).
Among other language aspects, Helland & Kaasa (2005) investigated the spelling
of dyslexic 12-year-old Norwegian learners (6th and 7th graders) from a more clinical
viewpoint. The authors used a definition of dyslexia as “a linguistic impairment related
to phoneme awareness, short term and working memory, or perception of short or rapid
varying sounds.” and added “vision or scanning eye movement” as problems associated
with dyslexia (Helland & Kaasa, 2005: 42). The spelling test given to the subjects
consisted of 22 common words, chosen to match their expected vocabulary levels and to
contain both familiar and unfamiliar phoneme-grapheme correspondences with emphasis
on the contrast between the orthographies of the L1 and the L2. These words were
analysed in two ways: first, one point was given for correct spelling and no points for
incorrect spelling; second, each word was analysed by the number of correct graphemes.
It is unclear how each word was split into graphemes, although they claimed that “a
grapheme was defined by its phoneme” (Helland & Kaasa, 2005: 54). For example, the
word beautiful, containing eight phonemes, was used, but their system divides the word
into these eight items: [b] [j] [eau] [t] [i] [f] [u] [l]. Each bracket spelled correctly would
yield one point, but it is unclear what the second and third item are supposed to be. A
consistent use of graphemes would not include [j], as this grapheme is not present in the
spelling of beautiful. The example questions how reliable the analysis in the study is.
Method aside, the authors of this study expected to find the highest number of errors in

26
spelling, as that is the area of highest contrast between English and Norwegian that is
typically difficult in the L1 for dyslexics. The results confirmed this expectation. The
dyslexic group was measured against an equivalent non-dyslexic control group, and the
dyslexic group itself was also divided into two: the top and bottom halves according to
L2 comprehension skill. Even though these subgroups show significant difference in most
aspects, and the top-subgroup was sometimes even comparable to the non-dyslexic
control group, both subgroups did equally poor on the spelling test (Helland & Kaasa,
2005: 55).
2.7 Pronunciation
Because of the relationship between phonology and orthography, it is important to
consider Norwegians pupils’ pronunciation of English. This topic has been researched by
several authors (e.g. Nilsen, 1989; Rugesæter, 2012, 2014). These studies present similar
findings. Rugesæter (2012, 2014) investigated among other things Norwegian learners’
ability to distinguish between vowel pairs. Rugesæter (2014: 9) found that only a small
minority of Norwegian learners are able to distinguish between /ɪə/ and /eə/. In contrast,
/e/ and /æ/ was unproblematic for most, except for speakers from Bergen. Nilsen (1989)
and Rugesæter (2012) present the distinction between /v/ and /w/ as particularly
problematic. In addition, they argue that Norwegian learners are likely to mix these
phonemes and replace them with each other. Many Norwegian learners also have
problems pronouncing /ɜ:/ and /ʌ/ in the correct places (Nilsen, 1989).
The ideal study on spelling errors in L2 English would investigate every phoneme
and every phoneme-grapheme correspondence of both the L2 and the L1. This would be
an enormous undertaking, and a selection must be made for this thesis. The selection is
based on the findings of Nilsen (1989) and Rugesæter (2012, 2014) in combination with
a preliminary analysis of data from CORYL made in preparation for this thesis. The
phonemes to be studied are narrowed down to four pairs, two consonant and two vowel
pairs: /ʃ/ – /ʧ/, /v/ – /w/, /e/ – /æ/, and /ɪə/ – /eə/. Chapter 3.2 contains an elaboration on
the selection.
A part of the present thesis deals with differences in Norwegian and English
phonology. Norwegian phonology is complex to write about as there is no standard
spoken variety, and even thorough accounts of Norwegian phonology limit themselves to

27
Eastern Norwegian (Kristoffersen, 2000). The scope of the present thesis thus requires
some simplifications.
Nilsen (2002) presents a contrastive analysis of the phonemic inventories of
Norwegian (mainly focusing on Eastern Norwegian (EN)) and RP. The difference in
phonology between Norwegian dialects is substantial, but this thesis does not seek to find
differences between speakers of different dialects. It is sufficient to include a few remarks
where dialectal difference is relevant. Nilsen (2002) presents four main points that are
relevant to the phoneme selection. Firstly, both EN and RP have /e/ and /æ/, but the
distribution varies across Norwegian dialects, particularly between Bergen, where /e/ is
rarely used, and the rest. Secondly, the two central diphthongs in the selection, namely
/ɪə/ and /eə/, are present in RP but not in Norwegian. Thirdly, while RP has bilabial /w/
and labio-dental fricative /v/, EN has the labio-dental approximant /ʋ/. Based on these
contrasts, Nilsen (2002) expects Norwegian learners to produce two errors in particular:
using /ʋ/ instead of /w/, and use long vowels plus /r/ for the centric diphthongs (e.g. /iːr/
for /ɪə/ and /eːr/ for /eə/). Finally, Nilsen (2002) claims that /ʃ/ and /ʧ/ are present in both
RP and Norwegian, but that /ʧ/ is only part of some of the Norwegian dialects. However,
according to Skjekkeland (1997: 96-101), these dialects contain not the voiceless
postalveolar affricate /ʧ/, but the voiceless palatal affricate [c͡ç] (following Skjekkeland’s
transcription). I also add the expectation that Norwegian speakers are likely to replace /ʧ/
with /ʃ/ based on the phonological differences and personal experience with learners.
The differences in phonology and the typical pronunciation challenges that
Norwegian learners have could be potential causes of spelling errors among Norwegian
pupils, and cross-checking pronunciation and spelling can perhaps tell if an error in one
of these domains coincide with a corresponding error in the other, i.e. a pupil that often
pronounces /w/ wrong will also equally often spell /w/ wrong.
2.8 Summary
This chapter presented a brief overview of the complex system that is the English
orthography and what error analysis investigates. We have seen what predicts the
successful acquisition of L2 literacy and spelling, and that it is clear that phonology is
central in the acquisition of spelling and in the act of spelling for L1 and L2 learners alike.
Although the case of Norwegian phonology is complex, there are certain errors we expect

28
Norwegian learners of L2 English to produce in pronunciation based on the differences
in phonologies, however there is still little knowledge of the types of spelling errors that
Norwegian pupils produce in L2 English. The following chapter gives an overview of the
methodology employed in this thesis.
29
3 Methodology
The study of learners’ spelling errors naturally requires real output from real learners, and
this study investigates errors in several ways. Most of the data is retrieved from a learner
corpus, and the data is compared to field work carried out for this thesis. These two sets
of data are comparable on some levels, but not all. Two factors enable comparison: firstly,
the age groups selected during field work were set to match the age groups represented
in the corpus. Secondly, the words used in the field work were checked against the corpus
to determine how familiar they would be to young learners. Another factor that makes the
data sets less comparable was the conscious decision to keep the test content used in the
field work different to that of the corpus. Cook (1997) emphasized the difficulty of
analysing spelling errors as learners can avoid the production of words and spelling
patterns they do not know. In free writing, learners can, consciously or not, refrain from
using language features that they do not yet master. To elicit these potential problem
areas, the respondents in the field work took a dictation test so that they only reacted to
spoken words and were thus forced to produce certain spellings. I have taken measures
to increase the validity of the data, but there are still issues that need to be addressed. The
data sets and how they were collected are presented in sections 3.4 and 3.5, but first I
present the corpus used, the phoneme collection and the phoneme–grapheme
correspondences involved, and the definition of error used along with the impact it has in
this thesis.
3.1 CORYL
In 2004 and 2005, national tests in English were administered in 7th and 10th grade
classrooms (12/13- and 15/16-year-olds) where the aim was to assess pupils’ writing
skills. CORYL is the result of a random selection of these tests, compiled and tagged by
researchers at UiB. The purpose of the corpus is to enable research on young Norwegian
learners’ interlanguage. The tags in the corpus include metadata about the text and author,
such as question type, age, and gender. Additionally, nearly one third of texts have been

30
rated according to CEFR5 levels, of which there are six: A1, A2, B1, B2, C1, and C2,
where A1 is the lowest on a scale of proficiency. Some of the texts in CORYL are
assigned half-levels of this scale, like A1/A2, which is a borderline case between the two
levels. The highest graded text in the corpus is B2, and some texts are graded <A1 (under
A1). There are also tags for each type of error, like capitalisation, wrong preposition,
concord, or indeed, spelling. The corpus compilers also sought to supply every spelling
error with the correct form, or what I refer to as the target word. These, too, are tagged. I
relied mostly on the combination of the spelling error tag and the correction tag to retrieve
spelling errors, and the process is described in section 3.4. Hasselgreen and Sundet (2017)
present the issue of the definition of an error, as it is ultimately a subjective decision made
by the raters, but refer to R. Ellis and Barkhuizen (2005) who recommend including
absolute errors but not dispreferred forms in the definition of error. These terms mostly
concern constructions in syntax, such as using different verb phrases depending on
context. If several could be acceptable in a given context, but most native speakers would
only use one, it is a case of a dispreferred form. This distinction is therefore not of
importance in the assessment of spelling errors. They are either compliant with standard
British or American spelling, or they are not.
Unfortunately, there is no information available on the first language of the
learners in CORYL. Hasselgreen and Sundet (2017: 199) only assume that “most pupils
have Norwegian as an L1 or an L2”. However, we can consider some data from SSB6.
The most relevant metric I could find was the number of children in kindergarten between
2000 and 2016 whose L1 was not Norwegian (hereafter minority speakers), although
pupils in 7th and 10th grade in 2004 would have attended last year of kindergarten in
1997 or 1994, a few years before the start of the SSB statistic. There has been a steady
increase of minority speakers in kindergarten from 5% in 2000 to 16% in 2016 (Statistics
Norway 2017). The number of minority speakers attending kindergarten, primary school,
and secondary school was undoubtedly varied, but we can assume that the number was
below 10% for pupils attending 7th and 10th grade in 2004. Since the texts in CORYL
were selected at random, the real number of minority speakers could be lower or higher
5 The Common European Framework of Reference for Languages. 6 Statistisk Sentralbyrå (Statistics Norway).

31
than this assumed percentage. Either way, we simply need to take into account that the
corpus data may include spellings produced by speakers with a different L1.
Some of the words in the corpus, like picture and fish, have an unusually high
frequency due to the subject matter of certain tasks, like ‘Describe what you see in the
picture’. This has little impact on the analysis in this thesis, as I am using the total number
of phonemes or graphemes in the analyses. It is not crucial to be aware of which words
they were used with in most cases.
3.2 Phonemes & Graphemes
As mentioned in section 2.7, the number of phonemes in focus has been narrowed down
to eight, which is just below one fifth of all RP phonemes: /ʃ/, /ʧ/, /v/, /w/, /e/, /æ/, /ɪə/ and
/eə/. These four vowels and four consonants are grouped into four pairs, each of which
contain some degree of similarity: two sibilants, two monophthongs, two diphthongs, and
/v/ plus /w/. The selection enables investigations of e.g. contrasts in the rate of spelling
errors between vowels or consonants, monophthongs and diphthongs, phonemes that are
present in only one of the languages and phonemes present in both languages.
R2 asks whether there are phonemes that are more difficult to spell than others,
and H2 assumes that learners are more likely to misspell phonemes that are not in their
L1. A difference in population between the two data sets is relevant for the discussion.
Monophthongs /e/ and /æ/ are present in both languages, but /e/ is only rarely used by
speakers from Bergen. Nearly every respondent in the field work was from Bergen, so it
is important to address this. To give an example, where other Norwegian dialects
pronounce the definite suffix -en with /e/, Bergen speakers use /æ/, as in the word hagen
‘the garden’: EN /hɑːgen/ and Bergen /hɑːgæn/. There is no information available on the
dialects of the pupils in the corpus, and despite the low usage of /e/ in the Bergen dialect,
it is regarded as an L1 phoneme for the field work population. As the diphthongs /ɪə/ and
/eə/ are not present in Norwegian, we can assume that they have higher rates of spelling
errors. Comparing just the vowels would yield an ambiguous result, as the difference
might as well be between monophthongs and diphthongs as L1 phonemes and L2
phonemes. Instead, the vowels and consonants are combined in the analysis of H2, so that
the error rates for all the phonemes not present in Norwegian are compared with all the
phonemes that are.

32
I mentioned in the introduction that a preliminary study was conducted as part of
a subject on linguistic methodology at UiB in the spring of 2018. I used the same methods
as described below to extract data from CORYL and analysed the spelling errors of the
main graphemes of /ʃ/ and /ʧ/. The results of that study were that the main graphemes of
/ʃ/ were misspelt 4.7% of the time it was used while the number for the main graphemes
of /ʧ/ was more than double, at 10.3%. I include the same phonemes in this thesis but
collected the data separately for this thesis to adhere to the error definitions described in
the following section.
The last pair of phonemes is /v/ and /w/, as personal experience with young
learners has led me to suspect that these two phonemes will have high error rates
compared to the other six phonemes. I am also under the impression that learners struggle
the distinction between the graphemes <v> and <w> regardless of phoneme. For example,
one of the errors in CORYL was shov for SHOW, where the w is part of grapheme <ow>
for /əʊ/, which could be an indication that the issue of v versus w is beyond just /v/ and
/w/, but it is beyond the scope of this thesis to investigate every potentially relevant case.
To conclude the way H2 will be tested, the L2 phonemes /ʧ/, /v/, /w/, /ɪə/, and /eə/
are compared with the L1 phonemes /ʃ/, /e/, and /æ/.
The graphemes of the phoneme selection are presented in Table 3.1:

33
Table 3.1: Graphemes of the phoneme selection
The main system The rest Phoneme Basic
Grapheme
Other
frequent
graphemes
Oddities, by number of letters 2- & 3-phoneme
graphemes
1 2 3 4 Phoneme
sequence
Graphemes
Co
nso
na
nts
/ʃ/ sh ci si ssi ti c s t ce ch sc se sj
ss
che chs
sch sci
- /kʃ/ x xi
/ʧ/ ch t tch c cc ci cz te th ti che tsch - -
/v/ v f ve - bv ph vv - - - -
/w/ w u wh - hu ou ww - - /wʌ/ o
/wɑː/ oi oir
oire ois
/waɪ/ oy
/waɪə/ oir
/eks/ x
Vo
wel
s
/e/ e - a u ae ai ay ea ei
eo ie
- - - -
/æ/ a - i ae ai al ei - - - -
/ɪə/ ear eer er ere - ir eir eyr
e’re ier
- - -
/eə/ are air ar ear ao er aer
eah
e’er eir
ere
aire
ayer
ayor
erre
ey’re
heir
Table 3.1 is based on those in Brooks (2015), with minor changes.7 The graphemes in
dark blue are attested with errors in CORYL, while graphemes in light blue are not. Some
graphemes are present in CORYL but never misspelt, such as <ce> in ocean and <oir> in
choir. The total of phoneme–grapheme correspondences to include in the analysis is 37,
18 for the consonants and 19 for the vowels. Every main grapheme is included apart from
<si> for /ʃ/ (as in version). The graphemes included in the field work are presented in
section 3.4.
3.3 Defining errors
Incorrectly spelled words are easy to spot, but errors are difficult to categorise. This thesis
focuses on phonology and will therefore categorise spelling errors according to each
phoneme of the erroneous word. Each phoneme can contain maximum one error, meaning
7 The ‘rare grapheme’ <ce> for /ʃ/ is part of Brooks’ main system as it is regular in the spelling of medial
/eɪʃəs/ spelt <-aceous>. These words, like herbaceous, are mostly used in botany. The only word with <ce>
for /ʃ/ that young L2 learners are likely to know is ocean. For the purposes of this thesis, therefore, <ce> is
put in ‘oddities’.
Additionally, <tch> and <ve> are moved from a ‘doubled spellings’ column to ‘other frequent graphemes’.
34
a word consisting of three phonemes will never have more than three errors. Sometimes,
more than one of the phonemes in the selection are erroneously spelt in a single word.
One pupil wrote evrywer for EVERYWHERE, which contains three errors, one each for /v/,
/w/, and /eə/. This is an example of the importance in separating the number of spelling
errors and the number of misspelt words. I also assign the type of spelling error to each
phoneme, either insertion, omission, substitution, transposition, or graphemic
substitution, as illustrated in the following examples. The spelling hause for HOUSE
contains one error, where the grapheme for /aʊ/ has a change from <ou> to <au>. One
letter is substituted for another, i.e. a substitution error. The same target word was also
spelled as haus, which contains two errors. In addition to the same substitution error, it
also has an omission error, since <e> is dropped from the spelling of /z/. Insertions are
the addition of extra letters, as in the insertion of <i> for /æ/ in begain for BEGAN.
Graphemic substitutions are similar to ‘normal’ substitutions, except they involve the
change of at least two letters. Two examples are the spellings sead for SAID, where <i> is
omitted and <e> inserted (i.e. <ai> substituted with <ea>), and mutsh for MUCH, where
one letter, <c>, is substituted with two letters, <ts>. Graphemic substitutions also include
cases where the ‘new’ grapheme is not a part of the English inventory, like <tsh> in the
last example. Additionally, cases where more than one letter is inserted or omitted are
also graphemic substitutions, like pitcher for PICTURE (<t> substituted with <tch>) and
cicen for KITCHEN (<tch> substituted with <c>).
Most view transposition errors as cases where two adjacent letters swap places,
like wihte or hwite for WHITE (cf. section 2.5). I have widened the definition of
transposition errors. Another spelling of WHITE, withe, is problematic as there are two
ways to analyse this spelling. It could either be two errors as one omission and one
insertion, or it could be a single error of transposition. There is a number of items in the
corpus data where this occurs, with examples like khitcen for KITCHEN, chrased for
CRASHED, fhis for FISH, and wath for WHAT. I therefore view each of these as containing
one error. It seems more likely that the learner has figured that the letter <h> belongs
‘somewhere’ in the word rather than there being two separate errors in this type of
spelling. Transposition errors always contain the correct letters, but in the wrong order.
As described in section 2.6.1, Nygaard (2010) also pointed out that Norwegian learners
have a tendency ‘to put <h> in the wrong place’. There is also one occurrence of fhic for
35
FISH. This seems to mirror the other transposition error, but it is accompanied by a
substitution of <s> to <c>. This type of error has been categorised as ‘complex’ in order
to be consistent with one error per phoneme. Another error that seemed to be a case of
transposition is when the <h> is moved to be following <w>, as in whit for WITH. While
they appear to be errors of /w/, my definition of transposition places the error at the
phoneme where the letter has moved from. Therefore, this example is an error for /ð/, not
/w/.
Not every spelling error collected is included in the final data set. There are some
types of errors that seem to be caused by other factors than phonology or orthography and
are subsequently omitted in order to increase the validity of the data. The following
paragraphs will explain and exemplify the types of errors that I deem unanalysable for
the purposes of this thesis. One of those error types are misspellings caused by
shortcomings in accessing morphology, mainly inflections. For example, there were six
occurrences of verbs in the -ing-form (all with word final <ve> for /v/ in the base form)
where <e> was not omitted, as in driveing for DRIVING. It is more likely that this type of
error is the result of the non-acquisition of an inflectional rule than of phoneme–grapheme
correspondences. These words are therefore not included in the error inventory of /v/.
Fricative voicing in nouns and reflexive pronouns are not included for the same reason.
These are all instances of words where word final <f> in the singular should have become
<ve> in the plural as in shelfs for SHELVES and -selfs for -SELVES.
Three different types of spelling errors were excluded because they spell other
words. The first type creates entirely different words, such as round for RAN, meat for
MET, and send for SAD. These are excluded as we cannot assume that the learner used the
phonological route rather than the visual route, and the latter is more likely even though
these spellings may resemble other words purely by coincidence. In a few cases, a spelling
error that spells a different word is deemed to be too advanced for the learner’s
vocabulary, e.g. vent for WENT. Errors of this type are not excluded.
The second type of excluded errors is a group of six words where the learners
have, deliberately or not, used the Norwegian translation for that word: akvarium for
AQUARIUM, sjokk for SHOCK, vei for WAY, vi for WE, hvite for WHITE, and her for HERE.
The latter is the only one with a frequency above three, with 57 occurrences. There are

36
also parallel errors in ther for there (61 occurrences8) and wher for where (14
occurrences9), which implies that the Norwegian cognate her is not the sole reason for
that error. Nevertheless, the spelling her for HERE is excluded in order to be consistent.
The decision is also backed up by a more qualitative peek at the involved texts, which
revealed that the vast majority were written by 12/13-year-olds with low competence,
often including several Norwegian words. Compared to the parallel errors ther and wher,
her for HERE was not produced as much by older and more skilled spellers.
The third type of similar words is homophones, where nine different spellings are
omitted: here for HEAR (and vice versa), won for ONE, pear for PAIR, read for RED, shore
for SURE, there for THEIR (and vice versa), and witch for WHICH.
Good spellers can be poor writers, in terms of manual execution. This thesis
concerns errors, not slips and mistakes, but unfortunately, it is impossible to make
assumptions on every pupil’s intentions or level of self-corrigibility. Therefore, some
slips and mistakes are bound to be included in the data. I have only excluded one item on
suspicion of a handwriting slip, namely piclure for PICTURE. This error is put in the final
category: ‘complex/other’. The other 11 erroneous words in this category are simply too
complex to fit into the phonological system. Examples include picnet for PICTURE, om
for OF, and wats for WATCHED. It is also entirely possible that the items in this category
are typos or the result of being wrongly transcribed into the corpus, perhaps caused by
unintelligible handwriting, which would also make them unfit for analysis. I have
summarised the number of all unanalysable items and sorted by category in Table 3.2:
8 This number includes thers and ther’s for THERE’S. 9 This number includes several different misspellings of WHERE and EVERYWHERE where the final grapheme
is the same error (<er> instead of <ere>).
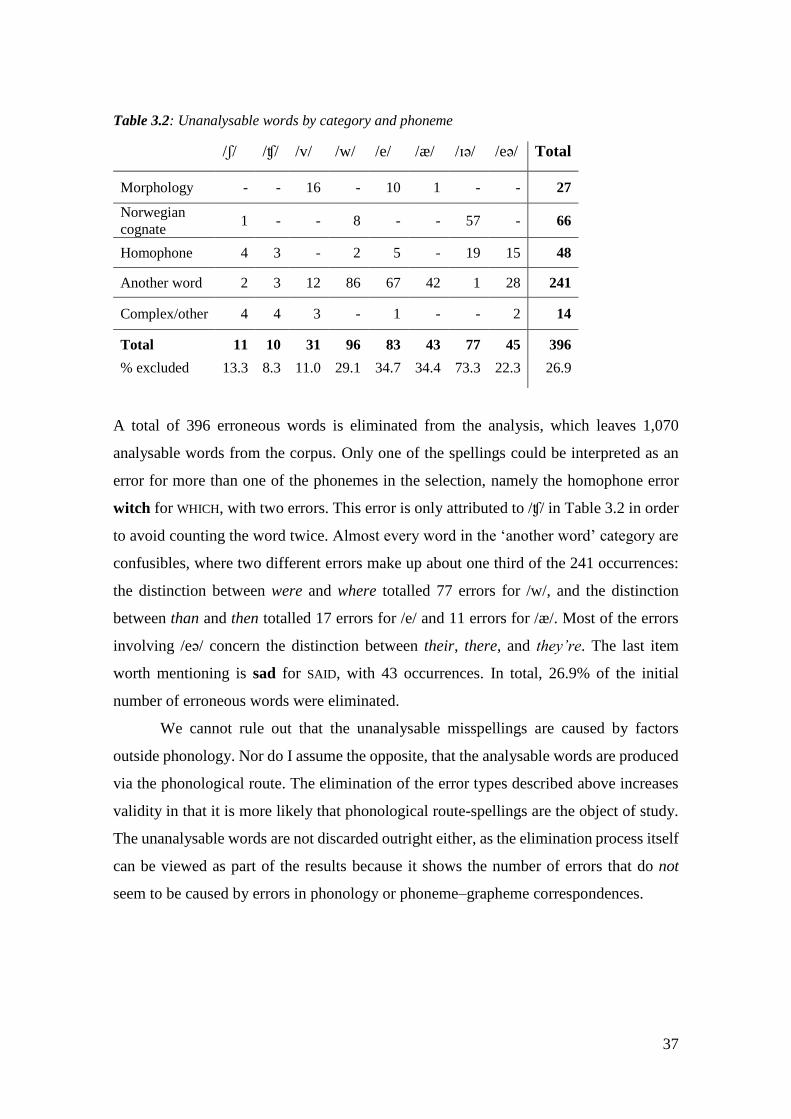
37
Table 3.2: Unanalysable words by category and phoneme
/ʃ/ /ʧ/ /v/ /w/ /e/ /æ/ /ɪə/ /eə/ Total
Morphology - - 16 - 10 1 - - 27
Norwegian
cognate 1 - - 8 - - 57 - 66
Homophone 4 3 - 2 5 - 19 15 48
Another word 2 3 12 86 67 42 1 28 241
Complex/other 4 4 3 - 1 - - 2 14
Total 11 10 31 96 83 43 77 45 396
% excluded 13.3 8.3 11.0 29.1 34.7 34.4 73.3 22.3 26.9
A total of 396 erroneous words is eliminated from the analysis, which leaves 1,070
analysable words from the corpus. Only one of the spellings could be interpreted as an
error for more than one of the phonemes in the selection, namely the homophone error
witch for WHICH, with two errors. This error is only attributed to /ʧ/ in Table 3.2 in order
to avoid counting the word twice. Almost every word in the ‘another word’ category are
confusibles, where two different errors make up about one third of the 241 occurrences:
the distinction between were and where totalled 77 errors for /w/, and the distinction
between than and then totalled 17 errors for /e/ and 11 errors for /æ/. Most of the errors
involving /eə/ concern the distinction between their, there, and they’re. The last item
worth mentioning is sad for SAID, with 43 occurrences. In total, 26.9% of the initial
number of erroneous words were eliminated.
We cannot rule out that the unanalysable misspellings are caused by factors
outside phonology. Nor do I assume the opposite, that the analysable words are produced
via the phonological route. The elimination of the error types described above increases
validity in that it is more likely that phonological route-spellings are the object of study.
The unanalysable words are not discarded outright either, as the elimination process itself
can be viewed as part of the results because it shows the number of errors that do not
seem to be caused by errors in phonology or phoneme–grapheme correspondences.

38
3.4 Corpus data
The corpus contains a total of 129,421 words across 272 texts (Hasselgreen & Sundet,
2017: 199). The relatively small size of the corpus means that specific enquiries often
yield few results, but this is not a problem for the methodology used here. As the goal is
to investigate the part that phonology plays in spelling using eight specific phonemes, the
initial data collection consisted of every occurrence of those phonemes in the corpus. The
process was the same for all phonemes, but some require greater manual effort than the
others. /æ/, for instance, is mostly spelled by <a>, which as a letter occurs in a high
number of words with few ways to narrow search results. Since the corpus is not tagged
for each phoneme, identifying words that contain a specific phoneme required searches
for every grapheme instead. I used the phoneme–grapheme correspondence tables from
Brooks (2015) as shown in Table 3.1 above to search for each grapheme separately. The
search string in [1] was used to find every error of <sh> for /ʃ/.
[1] [type="SP" & corr=".*sh.*" %c &!<>]
The first command (type=”SP”) retrieves all words tagged with the spelling error tag,
while the second command (corr=”.*sh.*”) narrows the results down to any target word
where the letter <s> is followed by the letter <h>, regardless of what comes before or
after those letters. “%c” ignores capitalisation, and the four final symbols in the string
leave out structural tags from the results to avoid clutter. This particular enquiry yielded
163 results, giving the impression that words containing <sh> were misspelt 163 times,
though misspellings that are also separation errors, like gold fich for GOLDFISH, are listed
as two results. Every word where the grapheme in question was misspelt was added to a
Microsoft Excel sheet, and some metadata were included. An example of the data
systemisation in Excel is given as a screenshot in Figure 3.1. Not shown in Figure 3.1 is
information on the category, which phoneme is involved, which grapheme is replaced,
and the grapheme that was used instead, which were also embedded to each spelling.

39
Figure 3.1: Systemisation of corpus data
Every target word was phonologically transcribed, and its graphemes separated according
to the phonemes they spell. The Longman Pronunciation Dictionary (Wells, 2008) was
consulted in the face of uncertainty. Then, the misspelt words were analysed into
graphemes in the same way as the target word, in order to systematically and clearly
indicate what type of error each word contained. The frequency of each item is given in
the rightmost column, and information on age group, gender and CEFR grade are all
added manually into their respective columns. Note that the sum of the ‘gender’ columns
and the ‘age’ columns differ within each item, this is because every text in the corpus
includes information on age, but not always on gender.
Most texts are also tagged with a unique pupil identification number, but since not
every text was, I did not collect this information. Besides, while analysis on what types
of error each individual pupil made would have been interesting, it is not what this study
investigates. This lack of identification also means that I will not combine pupil metadata
in the analysis, i.e. ‘how many 12/13-year-old boys produced this error’ and similar.
The 1,070 analysable items represent attempts at spelling 238 unique word forms.
These word forms are given in Appendix 1. While the number of errors collected may be
interesting on its own, it may also be very misleading. As with typical corpus research,
using only raw numbers may be misleading. In this study, the relative frequency is found
by comparing the number of errors for a phoneme to the total number of correct uses for
that phoneme. Every correct use was collected using two strategies. The first was identical
to the one exemplified with [1] above, except this time every erroneous word where the
grapheme in question was not the erroneous part was collected. The second strategy was
to search for each of the 37 phoneme–grapheme correspondences separately and

40
excluding words tagged as spelling errors. The strategies were combined in the same
enquiry, as in [2]:
[2] (".+are" %c | [corr = ".+are" %c &!<>])
The results of this enquiry include every word spelt with word-final <are> and any
erroneous word that would have been correctly spelt with word-final <are>. CORYL
initially gave 273 hits for [2], which was reduced to 262 after eliminating the words that
were not correct instances of <are> for /eə/. The process could be sped up for certain
graphemes, like <ere> for /eə/ which only includes words with there and where, and a
handful of French loans, none of which are present in CORYL. The enquiry for this
grapheme is given in [3]:
[3] (".*[tw]here.*" %c | [corr = ".*[tw]here.*" %c &!<>])
This gave 728 results after eliminating 165 instances of spelling errors or other words,
such as gathered. The final distribution of correct usage for each of the graphemes of /eə/
is given as an example in Table 3.3:
Table 3.3: Frequency of correct spellings of /eə/ by grapheme
Grapheme n
Main
system
<are> 262
<air> 147
<ear> 42
<ar> 7
The
rest
<ere> 728
<eir> 66
<ey’re> 16
<eah> 12
<aer> 1
<aire> 1
Total 1,282
The most important thing to note here is that the graphemes that are mainly realised in
function words (mainly <eir> and <ere>) make up a considerable portion of the total
number, and this will be discussed in the following chapters. The same procedure behind
Table 3.3 was used for every phoneme–grapheme correspondence of the phoneme
selection, instead of only the 37 that were misspelt.

41
3.5 Field work
Hasselgreen & Sundet (2017: 199) stress the importance of combining research using
CORYL with experimental research. Therefore, the corpus data is compared to original
field work, which was carried out in one 7th grade class (12/13-year-olds) and one 10th
grade class (15/16-year-olds). The field work methodology was structured with emphasis
on the phonological aspect of the research questions. Instead of analysing pupils’ free
writing as in CORYL, the field work was designed to elicit pupils’ spelling of spoken
words. They were therefore asked to take a dictation test. Additionally, a random selection
of the pupils who undertook the dictation were asked to read out loud the same sentences
as in the dictation. This combination of testing spelling and pronunciation enables cross
referencing in line with H1, investigating whether learners are more likely to misspell
phonemes they also pronounce erroneously. The following subsections present the
methodology behind the dictation and the pronunciation test and discusses the issues
involved.
Every pupil received written information about the project. In addition to gender,
age, and L1, pupils were also asked if they had been diagnosed with dyslexia. This meant
that spellings made by any dyslexics could either be excluded from the analysis or paid
extra attention to. Unfortunately, despite the hours of planning and execution involved,
only a few respondents remain available for analysis, due to lack of parental consent for
most of the pupils. Norwegian law requires research projects to gain explicit consent from
subjects. In this case, the pupils’ parents were the ones giving consent, because of the
pupils’ low age and the collection of sensitive data (dyslexia). The class teachers and I
agreed, knowing that pupils are often late in returning these kinds of documents, that the
teachers would collect consent over the following week. In the wake of the data collection
in November 2018, the teachers each provided me with a list of names where consent had
been given, either orally or in writing. In March 2019, after a week of discussing the case,
the NSD10 concluded that consent documented by a third party this way is not sufficient.
At this point it was too late to test new subjects. In the end, I personally have access to
the written consent of only seven 10th grade pupils. Although this is not enough data to
address the hypotheses with certainty, they are still analysed and used. The usefulness
10 Norsk Senter for Forskningsdata (Data Protection Services).

42
and reliability of the field work data in light of the low number of respondents is discussed
in chapter 4.
3.5.1 Dictation
In order to obtain as much data as possible, 22 sentences were constructed. These were
designed to contain the maximum number of relevant phonemes while keeping the
sentences short. Additionally, the vocabulary had to be familiar to the age groups,
multiple occurrences of the same phoneme in close proximity had to be avoided, all while
keeping sentences sounding natural in terms of content. Reaching a high number of
phonemes and graphemes took priority over the other restrictions. Two example
sentences are The heavy bear was very sad once and The volunteer asked a question. The
full list of sentences and their transcriptions are given in Appendix 2. The test ultimately
consisted of 89 words with a total of 124 occurrences of /ʃ/, /ʧ/, /v/, /w/, /e/, /æ/, /ɪə/, and
/eə/. The distributions are given in Table 3.4:
Table 3.4: Phonemes and graphemes present in the field work tests
/ʃ/ /ʧ/ /v/ /w/ /e/ /æ/ /ɪə/ /eə/
sh 7 ch 6 v 9 w 15 e 9 a 14 er 4 ar 4
ti 4 t 3 ve 5 wh 3 ea 2 al 1 ear 3 ear 2
ssi 2 tch 2 f 3 u 3 a 1 eer 2 ere 2
ce 1 ti 1 o 1 ai 1 ei 1 aer 1
ch 1 ay 1 e’re 1 air 1
ci 1 ie 1 ir 1 are 1
s 1 eir 1
si 1 ey’re 1
Total 18 12 17 22 15 15 12 13 124
Another goal was to include at least ten occurrences of each phoneme, which was met.
More importantly, I sought to include as many of the phoneme–grapheme
correspondences as possible. In addition to the graphemes of the main system, I included
common words from ‘the rest’, e.g. once and friend. With the 41 phoneme–grapheme
correspondences listed in Table 3.4, only seven are missing: <sci> for /ʃ/, <cc> for /ʧ/,
<oir> for /w/, <ier> for /ɪə/, and <aer>, <eah>, and <aire> for /eə/. In summary, nearly all
of the correspondences were present at least once in the test, but graphemes in the main
system were prioritised.

43
In addition to the 22 sentences, nine nonwords were used in the dictation. The
results of this part of the test are relevant for H4, that pupils’ spelling errors are
phonetically accurate. These nonwords were designed to include all eight phonemes in
different environments, and to be possible words in English. Each phoneme occurs at
least twice, apart from /æ/ which occurs once, and /w/, which was admittedly overlooked.
The nonwords are given as phonetic transcriptions, as they were only read out and I have
not created suggestions for ways to spell them.
[4] /kənˈvuːtʃ/
[5] /ˈtæʃɪti/
[6] /eməˈkeɪʃən/
[7] /ˈtʃʌv/
[8] /ˈpɒlikeə/
[9] /daɪˈkeəriən/
[10] /ˈbəʊtɪə/
[11] /ˈʃemɪŋ/
[12] /ˈvɪəriəl/
While the nonwords do not cover all possible environments for the phoneme selection,
such as word-final /ʃ/, the test had to be kept short. The idea behind using nonwords was
to force pupils to react to sound only, limiting the use of the visual route. However, in
order to have the nonwords ‘sound’ English, two of the endings with a relevant phoneme
are identical to known affixes: -ation in [6] and -arian in [9]. This is taken into account
in the analysis.
It has since come to my attention that some of the nonwords have existing
counterparts. For example, Shemming is an English surname and several businesses and
products are called Polycare. I am under the impression that the pupils were not familiar
with any of the nonwords judging by their reaction to them.
As is common with dictation, every item, i.e. all sentences and nonwords, were
repeated multiple times to ensure that all pupils heard every word. In order to keep the
input consistent, I recorded myself saying every item in an RP accent. The phonetic
transcriptions of the nonwords above and of the sentences in Appendix 2 are
transcriptions of those recordings, rather than transcriptions of the ‘ideal’ text book
scenario when it comes to aspects like reduction. Although it can be problematic that a
44
non-native speaker recorded the sentences, I ultimately take responsibility for the
accuracy of transcriptions given in Appendix 2 in that they reflect the recordings.
The pupils were informed that each sentence would be played three times with
small pauses in between and that they were to ‘spell what they heard’ in case words were
unfamiliar. Afterwards, the pupils were allowed to request the repetition of a few
sentences in case they had not fully completed every item. The pupils were also informed
that the final nine words were made up, and that they should pretend they were English
words. They were instructed to spell them how they thought the nonwords would have
been spelt. As they were short and unfamiliar, each nonword was repeated approximately
five times.
Each pupil was given access to their own copy of a Microsoft Word document
which I had formatted so that the built-in spell check was disabled and so that it was not
possible for pupils to do anything but fill in answers. Due to technical issues for some
pupils, they had to create new documents without the pre-made formatting. They were
instructed to turn spell check off. This issue affected two of the seven pupils in the field
work population, though their files had spell check turned off as they were turned in.
Additionally, some of the errors they made are usually automatically corrected in Word,
indicating that they did have spell check turned off for the entire test.
There were other issues that also need mentioning. Issues with both the classroom
speaker and an external speaker that I brought meant that my computer’s built-in speakers
were used. This led to a slight decrease in audio quality, which may have led some pupils’
mishearing phonemes for others, though volume was sufficient for everyone to hear.
During the test, there were occasional whispers, and it is possible that pupils helped each
other on the test. Their computer screens were not continually monitored, which means
that outright cheating using written communication, another document or other software
could theoretically have occurred. However, as the pupils were informed that they would
not be graded or even receive feedback, it is my impression that they were not inclined to
cheat.
There may be variables included in the data that I did not intend to include. An
example of such an extraneous variable is listening skill. Even a pupil with complete
mastery of all English phoneme–grapheme correspondences may still produce
phonological spelling errors if they think they hear a different phoneme than what was

45
actually played by the recording. There is some evidence of this in the spellings they
produced. For instance, the /v/ in the nonword /tʃʌv/ was sometimes written as <b>. While
they may be slips as the two keys are keyboard neighbours, /v/ and /b/ are also quite
similar sounds, and may be confused, especially in settings where the listener cannot see
the speaker’s mouth. One pupil also argued after the test was finished that the vowel in
the recording of /tʃʌv/ was /ø/.
3.5.2 Pronunciation test
H1 states that pupils misspell words they also pronounce erroneously. A pronunciation
test was therefore used in an attempt to elicit relevant data. Some of the pupils that
participated in the dictation were also asked to read the 22 sentences out loud in a
recording which I then analysed. This meant that if they did this and saw the sentences
before the dictation, they would have been recently exposed to the correct spelling, which
would affect the data in the dictation. Conversely, if they recorded the sentences after the
dictation, they would have been recently exposed to a correct way of pronouncing them.
As either way would affect the dictation results in some way, an equal number of pupils
was tested in pronunciation before and after the dictation, but an unequal number remains
eligible for analysis. Six of the seven pupils in the field work population took part in the
pronunciation test. Four of them prior to the dictation, meaning they saw the correct
spelling before the dictation, and two of them after, meaning they heard the correct
pronunciation before the pronunciation test. This is taken into account in the analysis.
Each of those six pupils were given instructions in Norwegian as to not influence
their pronunciation in any way. They were told to take their time and speak as they
normally spoke English, and that they were allowed to correct themselves. When they
did, only the self-corrected pronunciation is collected, regardless of whether that
pronunciation was objectively correct or not. Sentences were shown one at a time in the
same order for all pupils.
One of the six pupils had a mostly non-rhotic accent, while the other students’
accents were mostly rhotic. This has implications for the treatment of /ɪə/ and /eə/. All but
one of the pupils pronounced words like here (RP /hɪə/) as /hɪr/, thus using General
American (GA) English pronunciation and entirely different phonemes. These
46
pronunciations will be treated as correct, but if a pupil replaces /ɪr/ with e.g. /eːr/, it is
counted as an error.
3.6 Significance testing
Several tables and figures in Chapter 4 are tested for significance by use of the software
RStudio. Most of the time, the log-likelihood ratio test is used, as unlike e.g. the Chi-
square test, it does not assume that the data is normally distributed, and it can be used
when there are cells with values lower than five, which occurs frequently in the present
results. When the means of two populations are compared, a Welch Two Sample t-test is
used. The thesis adheres to an alpha of .01, and p-values higher than this cut-off point are
given in the running text. Otherwise, p-values are given below tables.
3.7 Summary
This chapter presented the methodology of the thesis. Pupil texts written by 12/13- and
15/16-year-olds from the learner corpus CORYL provide the data for the error analysis.
Correct and incorrect spellings for eight phonemes, namely /ʃ/, /ʧ/, /v/, /w/, /e/, /æ/, /eə/,
and /ɪə/, are collected. Simultaneously, a dictation test taken by 15/16-year-olds in
concordance with the present thesis provides a ground for comparing results between two
populations. Unforeseen circumstances unfortunately hinder the planned parallel
analyses, but field work data is still used in some of the analyses in the following chapter.
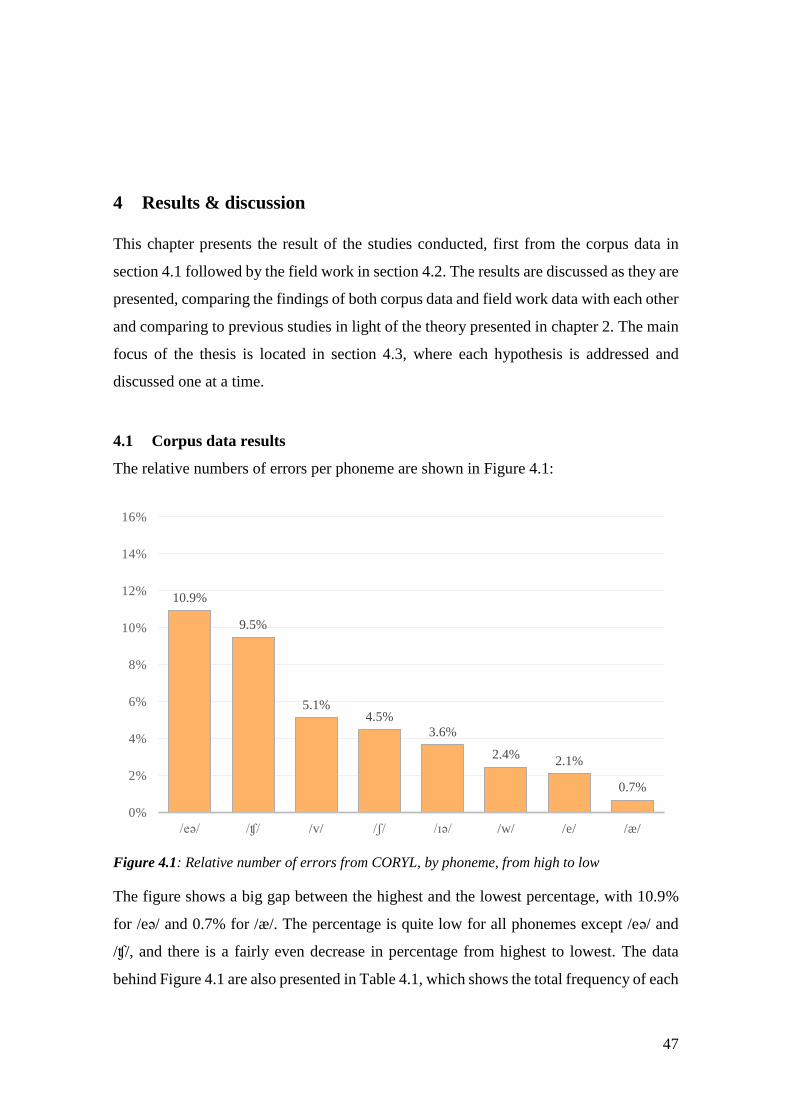
47
4 Results & discussion
This chapter presents the result of the studies conducted, first from the corpus data in
section 4.1 followed by the field work in section 4.2. The results are discussed as they are
presented, comparing the findings of both corpus data and field work data with each other
and comparing to previous studies in light of the theory presented in chapter 2. The main
focus of the thesis is located in section 4.3, where each hypothesis is addressed and
discussed one at a time.
4.1 Corpus data results
The relative numbers of errors per phoneme are shown in Figure 4.1:
Figure 4.1: Relative number of errors from CORYL, by phoneme, from high to low
The figure shows a big gap between the highest and the lowest percentage, with 10.9%
for /eə/ and 0.7% for /æ/. The percentage is quite low for all phonemes except /eə/ and
/ʧ/, and there is a fairly even decrease in percentage from highest to lowest. The data
behind Figure 4.1 are also presented in Table 4.1, which shows the total frequency of each
10.9%
9.5%
5.1%4.5%
3.6%
2.4%2.1%
0.7%
0%
2%
4%
6%
8%
10%
12%
14%
16%
/eə/ /ʧ/ /v/ /ʃ/ /ɪə/ /w/ /e/ /æ/

48
phoneme (i.e. the sum of correct and incorrect spellings) in addition to the number of
times they were misspelt:
Table 4.1: Errors and total use of the phonemes in CORYL, sorted by total use
/æ/ /w/ /e/ /v/ /ʃ/ /eə/ /ʧ/ /ɪə/ Total
Errors 78 233 160 250 72 157 111 28 1,089
Total use 11,789 9,566 7,683 4,892 1,609 1,439 1,174 768 38,920
% 0.7 2.6 2.1 5.1 4.5 10.9 9.5 3.6 2.8
Log-likelihood ratio test: p < .01
In total, the eight phonemes are used almost 39,000 times in the corpus, where they are
misspelt only 1,089 times, giving an error rate of 2.8%. The total percentage may be
misleading since more frequent phonemes are given more weight. In contrast, the mean
of all eight error rates is 4.8%. Two of the phonemes make out more than half of the total
usage, /æ/ with 11,789 uses and /w/ with 9,566, which is over 21,000 put together. This
is mostly caused by the high number of common function words that contain these
phonemes. The numbers for /æ/ include e.g. and, that, and have, and their various forms
(such as that’ve, having etc.). Just seven different content word lexemes make out 8,414
of the correct uses of /æ/. The phoneme can often be reduced to /ə/ in speech, and if these
seven lexemes were instead categorised under uses of /ə/, the errors for /æ/ would make
out 2.4% of the total usage, and /æ/ would have the second lowest error rate of the
phoneme selection. The total number of errors would also increase, from 2.8% to 3.6%.
Removing these content words on the basis of reduction in speech would perhaps be
misguided and removing function words because of their high frequency could reduce the
validity of the data. Highly frequent function words are also words that must be acquired
by learners. The experiment does illustrate the miniscule error rate of /æ/, when it remains
among the lowest error rates if 71% of the correct usage is removed, but not the related
errors.
4.1.1 Age
Each phoneme was misspelt an unequal number of times by the two age groups, but the
number of texts in each age group is also unequal: there are 150 texts by 12/13-year-olds
and 122 texts by 15/16-year-olds, however, as the older pupils average a higher number
of words per text, the number of words written by each group is very close. In total, 12/13-

49
year-olds produced 888 errors, while 15/16-year-olds produced 201 errors, which gives
an average of 5.9 errors per text for 12/13-year-olds and 1.6 errors per text for 15/16-
year-olds. If we suppose that the mean error rate for the present phoneme selection is
representable for all 44 RP phonemes, the hypothetical total number of spelling errors per
text is 32.5 for 12/13-year-olds and 8.8 for 15/16-year-olds. This shows how much
improvement there is over three years, especially considering that the older group writes
longer texts on average.
Figure 4.2 visualises the distribution by age group:
Figure 4.2: Distribution of errors per phoneme according to age group
The most notable features of this figure are that the majority of every phoneme’s errors
are produced by the younger group and that /ɪə/ seems to be more difficult to spell for the
older age group relative to the other phonemes. Of the 28 errors included for /ɪə/, 16 errors
were produced by 12/13-year-olds and 12 errors by 15/16-year-olds. The individual
phonemes cannot be tested for significance as correct usage was not collected with
information on age, but a log-likelihood ratio test of all errors, by age and phoneme,
showed significance at p < 0.01. The statistical significance here is moot, however, as we
already know that the older learners are, on average, better spellers than the younger
learners. This is evident from the number of texts that received low and high ratings in
each age group, which is discussed in section 4.1.3.
73.6% 74.8%
83.6% 82.4%
88.6% 87.4%
80.3%
57.1%
26.4% 25.2% 16.4% 17.6% 11.4% 12.6% 19.7% 42.9%
0%
10%
20%
30%
40%
50%
60%
70%
80%
90%
100%
/ʃ/ /ʧ/ /v/ /w/ /æ/ /e/ /eə/ /ɪə/
12/13-year-olds 15/16-year-olds

50
Keeping in mind that /ɪə/ saw more than 70% of errors excluded from the data set
because they were potential homophones or cognates, it is interesting that of the excluded
items, 15/16-year-olds produced seven errors while 12/13-year-olds produced ten times
as many, 70 errors. The majority of these 70 errors are constituted by her for HERE, the
error which could either be the use of the Norwegian cognate or simply the omission of
the final <e> (cf. section 3.3). Since the subjective treatment of data had such a large
impact on this particular phoneme, Figure 4.3 below compares the error rates of the
phonemes as presented in Figure 4.1 (in orange) to the error rates of analysable items and
unanalysable items combined (in grey), with the increase in percentage points added:
Figure 4.3: The difference in error rates depending on exclusion of unanalysable items
While most phonemes would see a very similar increase in percentage points if no items
were excluded, only having an increase between 0.4 and 1.0 percentage points (and 2.7
for /eə/), the error rate for /ɪə/ would be more than tripled. The diphthong would have the
second highest error rate, nearly matching the error rate of /eə/. This raises the question
why only /ɪə/ has so many unanalysable items compared to analysable items. Considering
both the analysable and the unanalysable items, the pupils produced errors for ten
different lexemes: career, clear, dear, disappear, hear, here, mystery, near, weird, and
year. By comparison, the number of lexemes for /eə/ is 15, which has twice as many
correct uses in the corpus. The two diphthongs are quite similar in their distribution across
/ɪə/, 3.6%
/ɪə/, 12.4%
2.7%
0.8%
0.6%0.6%
8.8%
1.0%1.0%
0.3%
0%
2%
4%
6%
8%
10%
12%
14%
16%
/eə/ /ʧ/ /v/ /ʃ/ /ɪə/ /w/ /e/ /æ/
If excluded If included Increase

51
words: they each occur in a series of function words, and for a young L2 learner, the
content words are less common than other phonemes. There are a few different instances
in the unanalysable items of a very frequent word being misspelt the same way
approximately 50 times, were for WHERE, sad for SAID, and her for HERE.
While there are many instances of spellings that are made by several 12/13-year-
olds but few 15/16-year-olds, there are no cases of individual spellings (ignoring hapaxes)
that are mostly produced by 15/16-year-olds. However, among the unanalysable items,
two spellings have this distribution: THAN was spelt then 11 times, only by 15/16-year-
olds, and THEIR was spelt there 13 times, of which 11 were produced by 15/16-year-olds.
These two spellings seem to have been produced using the visual route, where pupils
draw words from the lexicon. As van Berkel (2004) argued, use of the visual route
increases with age, and may be especially important for L2 learners (cf. section 2.4).
Many examples can be found of typical phonological route errors, and these are often
only made by 12/13-year-olds. For the graphemes <u> and <o> for /w/, which mainly
occur in the sequences /kw/ spelt <qu> and various forms of the lexeme one respectively,
the younger group produced errors like kwick for QUICK and some whan for SOMEONE.
However, it appears that the distribution of both types of errors might be by chance or the
presence of writing difficulties, i.e. that some older pupils still rely mainly on the
phonological route. For nearly all other errors where use of the visual route is likely, as
in the wrong word errors, the distribution of errors between age groups is either even or
heavily skewed towards the younger group. It should also be noted that, when looking at
spellings with few occurrences, such as than for THEN (eight occurrences by 12/13-year-
olds and nine occurrences by 15/16-year-olds), there is a possibility that a single pupil
produced most, or even all of the errors. With the current dataset, it is therefore better to
analyse the overarching tendencies and totals.
4.1.2 Gender
Errors were spread quite evenly according to gender. Not all texts in CORYL contain
information on the author’s gender, but the texts that do contain a total of 910 errors,
where females produced 484 errors and males 426. It is cumbersome to count the exact
number of texts by each gender, but it seems that the distribution is close. The number of
errors per phoneme according to gender is illustrated in Figure 4.4:

52
Figure 4.4: Distribution of errors per phoneme according to gender
Despite not every text containing data on gender, the errors for each phoneme are quite
evenly distributed between genders, as no phoneme has a more uneven distribution than
60/40. This outer point is, again, /ɪə/, where 12 errors were produced by females and eight
errors were produced by males. Very close to /ɪə/ in distribution is /v/ with 127 errors by
females and 87 errors by males. As with age, the distribution of errors according to gender
cannot be tested for significance for each phoneme since this information was not
collected with correct usage. However, a log-likelihood ratio test of all errors, by gender
and phoneme, showed no significance at p = 0.286, which implies that gender is not a
deciding factor in spelling skill. This contradicts the findings of L1 spelling by Brooks et
al. (1993), who found that females were better spellers in both age groups.
4.1.3 CEFR level
Few of the texts in CORYL were rated on the CEFR scale, to the point where 298 of the
1,089 errors, a little lower than one third, come from rated texts. Since the rated texts also
make out a little less than one third of all CORYL texts, we can assume that the errors in
rated texts are fairly representable. There are more texts by 12/13-year-olds than by
15/16-year-olds, 150 and 122 respectively, but the number of rated texts per age group is
heavily skewed towards the younger group. There are 71 rated texts by 12/13-year-olds
47.5% 46.0%
59.3%
48.9% 50.0%54.0%
56.6%60.0%
52.5% 54.0%
40.7%
51.1% 50.0%46.0%
43.4%40.0%
0%
10%
20%
30%
40%
50%
60%
70%
80%
90%
100%
/ʃ/ /ʧ/ /v/ /w/ /æ/ /e/ /eə/ /ɪə/
f m

53
and only 14 rated texts by 15/16-year-olds. Their distribution in CEFR grade are shown
in Table 4.2:
Table 4.2: Number of CEFR rated texts per age group
Age
CEFR level
<A1 A1 A1/A2 A2 A2/B1 B1 B1/B2 B2 Total
12/13 3 12 11 20 14 8 3 - 71
15/16 - 1 - 1 4 3 3 2 14
Log-likelihood ratio test: p < .01
Although there are few numbers for 15/16-year-olds, there is a visible tendency. The
majority of 12/13-year-olds are found in the lower half of the scale, while the majority of
15/16-year-olds are found in the middle half (the upper levels, C1 and C2, were not given
to any text in CORYL). This is consistent with the expectation that the average learner
becomes more adept at spelling over time.
The errors from rated texts are henceforth referred to as rated errors. In order to
analyse the rated errors relative to the total use of phonemes, the data must be normalised.
If we assume that the spread of CEFR levels is representable for the entire corpus, we can
reduce the total usage of all texts by the same factor as the number of rated errors are to
the total number of errors. This factor is 0.274, which gives a hypothetical total number
of 10,627 rated phonemes. The result of this process is shown in Table 4.3, which contains
the number of errors for each phoneme by CEFR level:
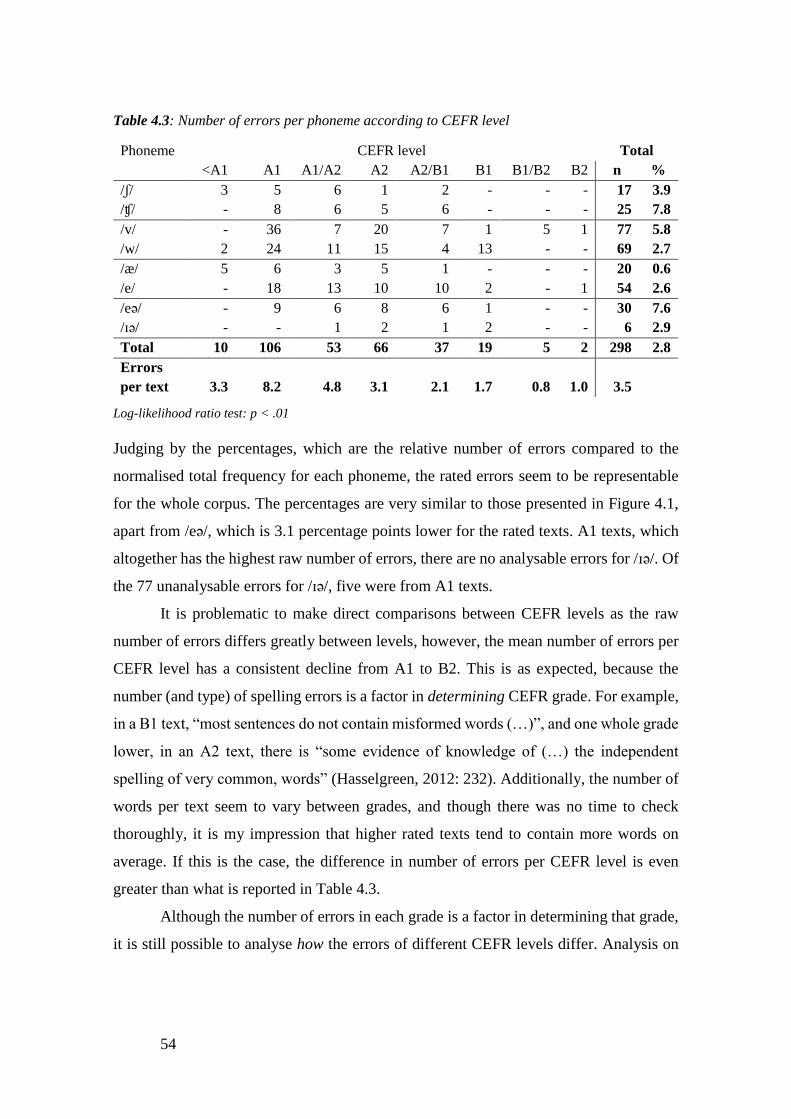
54
Table 4.3: Number of errors per phoneme according to CEFR level
Phoneme CEFR level Total
<A1 A1 A1/A2 A2 A2/B1 B1 B1/B2 B2 n %
/ʃ/ 3 5 6 1 2 - - - 17 3.9
/ʧ/ - 8 6 5 6 - - - 25 7.8
/v/ - 36 7 20 7 1 5 1 77 5.8
/w/ 2 24 11 15 4 13 - - 69 2.7
/æ/ 5 6 3 5 1 - - - 20 0.6
/e/ - 18 13 10 10 2 - 1 54 2.6
/eə/ - 9 6 8 6 1 - - 30 7.6
/ɪə/ - - 1 2 1 2 - - 6 2.9
Total 10 106 53 66 37 19 5 2 298 2.8
Errors
per text 3.3 8.2 4.8 3.1 2.1 1.7 0.8 1.0 3.5
Log-likelihood ratio test: p < .01
Judging by the percentages, which are the relative number of errors compared to the
normalised total frequency for each phoneme, the rated errors seem to be representable
for the whole corpus. The percentages are very similar to those presented in Figure 4.1,
apart from /eə/, which is 3.1 percentage points lower for the rated texts. A1 texts, which
altogether has the highest raw number of errors, there are no analysable errors for /ɪə/. Of
the 77 unanalysable errors for /ɪə/, five were from A1 texts.
It is problematic to make direct comparisons between CEFR levels as the raw
number of errors differs greatly between levels, however, the mean number of errors per
CEFR level has a consistent decline from A1 to B2. This is as expected, because the
number (and type) of spelling errors is a factor in determining CEFR grade. For example,
in a B1 text, “most sentences do not contain misformed words (…)”, and one whole grade
lower, in an A2 text, there is “some evidence of knowledge of (…) the independent
spelling of very common, words” (Hasselgreen, 2012: 232). Additionally, the number of
words per text seem to vary between grades, and though there was no time to check
thoroughly, it is my impression that higher rated texts tend to contain more words on
average. If this is the case, the difference in number of errors per CEFR level is even
greater than what is reported in Table 4.3.
Although the number of errors in each grade is a factor in determining that grade,
it is still possible to analyse how the errors of different CEFR levels differ. Analysis on

55
CEFR level thus requires either a greater (and even) number of rated texts or a more
qualitative approach.
4.1.4 Error category
This section contains the results of errors according to error categories as presented in
sections 2.5 and 3.3: insertion, omission, transposition, substitution, graphemic
substitution, and complex errors. The total number of errors in each error category is
presented in Table 4.4:
Table 4.4: Spelling errors by phoneme and error category
/ʃ/ /ʧ/ /v/ /w/ /e/ /æ/ /eə/ /ɪə/ Total %
Substitution 25 17 154 67 52 66 15 4 400 36.7
Omission 21 31 81 73 44 2 88 13 353 32.4
Graphemic sub. 3 25 15 15 47 1 28 5 139 12.8
Insertion 12 34 - 54 10 9 6 4 129 11.8
Transposition 8 3 - 20 7 - 20 2 60 5.5
Complex 3 1 - 4 - - - - 8 0.7
Total 72 111 250 233 160 78 157 28 1089 100
Log-likelihood ratio test: p < .01
Substitution is the most frequent type of error overall at 36.7%, closely followed by
omission at 32.4%. These make out just above two thirds of the errors and the remaining
four categories total a little less than one third put together. Graphemic substitution and
insertion contain a similar percentage of errors at 12.8 and 11.8% respectively.
Transposition, even in the widened definition used here (cf. section 3.3), only covers 5.5%
of errors. Eight errors, 0.7%, are categorised as complex.
The phonemes have unequal distributions of errors according to the categories.
Most of the phonemes have an even spread of errors across categories, but /v/ and /æ/ see
a majority of errors in the substitution category, and most of the errors of /eə/ and /ɪə/ are
omission errors. These tendencies can be explained on the basis of the phonemes’ most
frequent phoneme–grapheme correspondences. Since /v/ is spelt as either <v> or <ve>
apart from a few exceptions, the potential changes that can occur are more limited than
for e.g. the diphthongs. In all but a few cases, <v> for /v/ is substituted with <w> (or <ve>
with <we>), while <e> is omitted from <ve>. This is in contrast with /eə/, which has been
56
spelt with 17 different graphemes. Several of the graphemes of the diphthongs consist of
three letters, and the more letters there are, the higher the possibility that one is omitted.
Since the numbers in each category vary greatly between phonemes, the totals
may be different if all phonemes are included. After all, Livingston (1946), Brooks et al.
(1993), and Cook (1997) all found that the largest error category was omission, though
only the latter involved L2 spellers (cf. section 2.5).
4.2 Field work results
The initial plan for the analysis was to compare directly the field work data with the
corpus data, and thus address each hypothesis with data from both data sets. However,
due to the unforeseen circumstances reported in section 3.5, only a few respondents
remain eligible for analysis. The consequence of this is that apart from H1, field work
data do not have an impact on the conclusion of the hypotheses. The following sections
present the results from the dictation and the pronunciation tests.
4.2.1 Dictation results
The dictation consisted of 124 occurrences of the eight phonemes across 22 sentences (cf.
section 3.5.1). Since the data was produced by seven pupils, the phonemes were spelt a
total of 868 times. The pupils produced 86 erroneous words, 33 of which contained an
error for a relevant phoneme. One spelling had two relevant errors, which is a total
number of errors of 34 and total error rate of 3.8%. This is one percentage point higher
than CORYL’s total error rate of 2.8%, which is close. One the one hand, one would
expect the error rates of a population of a higher average age to perform better, but on the
other hand, the dictation test is also designed to elicit more errors. There is also the factor
of the circumstance of pupils’ spelling, which I discuss below. The results of corpus data
were supplied with a mean error rate so that each phoneme weighed equally, and the same
is done with the dictation results. The mean error rate here is 4.3%, close to the total error
rate, which is expected due to the even distribution of phonemes in the test.
As only spellings by 15/16-year-olds are included in these results, they are not
directly comparable to the results from CORYL. Information on age was not included in
the collection of correct usage in CORYL, as there was no time do to so. Since 15/16-
year-olds produced a small fraction of errors compared to 12/13-year olds in CORYL

57
(approx. 1/5 and 4/5 respectively), comparing the corpus data with the field work data
would be misleading since most of the errors in CORYL were written by less skilled
pupils on average. It is possible to assume that each age group wrote an equal number of
words for each phoneme, but the resulting percentages would create an equally unfaithful
picture. However, it is also difficult to assess the differences between results if the data
sets are not compared. The error rates per phoneme for both data sets are compared in
Figure 4.5 below, but I stress how different the bases for each are. Besides the difference
in age groups, the percentages for CORYL pupils are based on nearly 39,000 total uses
of the eight phonemes while field work is based on less than 1,000, and more importantly,
1,089 errors against 34.11 The low number of errors in the dictation means that a
difference of only a single error would have the potential to change the order of the most
misspelt phonemes. For example, /æ/ is shown below to have an error rate of 1%, but this
is based on a single error out of 105 total uses.
Furthermore, there is the format of the texts and the circumstance of the data
production to consider. The pupils of CORYL wrote texts as answers to a test in an
assumedly familiar school setting and were completely free in what words to write. The
pupils who participated in the dictation, by design, were not able to choose words freely,
and only reacted to the words they were presented with. As mentioned in 3.5.1, this is
deliberate with the aim to elicit errors that pupils may avoid in free writing. To sum up,
the comparison in the figure below must be viewed with a critical eye due to the
differences in the type and size of the populations, as well as the setting in which the
spellings were produced. The differences in the data sets also mean that significance
testing is redundant.
11 Another way to view this is in fractions: the field work ‘corpus’ is 1/44th of the size of CORYL, and
contains 1/32nd of the errors.

58
Figure 4.5: The relative numbers of errors per phoneme by field work respondents compared to
CORYL
There are some similarities and some stark differences between the two data sets. The
overall tendencies are similar in that outside of one or two outliers, there is an even
spacing between phonemes, ranging from about 5% to 1%. The outliers are the two
diphthongs, but with opposite error rates: /ɪə/ is the most difficult phoneme for the field
work population and /eə/ is the most difficult phoneme for the pupils of CORYL, and the
error rate is around 4% the other way around. There are three phonemes that have
approximately the same error rate in both populations: /w/, /e/, and /æ/, which make out
the three lowest error rates. The other three phonemes vary in error rate according to
population. The sibilants, like the diphthongs, are reversed: /ʃ/ is more difficult than /ʧ/
for the field work pupils while /ʧ/ is more difficult than /ʃ/ for the pupils of CORYL.
Arguably, the phoneme with the biggest difference between populations is /v/, which saw
no errors among the seven field work pupils while having the third highest error rate in
CORYL.
A very important factor of spelling skill is any pathological difficulty with reading
or writing such as dyslexia. Two of the seven pupils that participated in the dictation had
known writing difficulties, one of them diagnosed with dyslexia. Together, these pupils
10.9%
9.5%
5.1%4.5%
3.6%
2.4%2.1%
0.7%
4.4%3.6%
0.0%
5.6%
15.5%
2.6%1.9%
1.0%
0.0%
2.0%
4.0%
6.0%
8.0%
10.0%
12.0%
14.0%
16.0%
/eə/ /ʧ/ /v/ /ʃ/ /ɪə/ /w/ /e/ /æ/
CORYL Field work

59
produced 23 of the 34 errors. This reflects the findings of Brooks et al. (1993) and Raaen
and Guldal (2012), who noted that in their respective studies, there were small minorities
who produced a large portion of errors. This is likely also the case in CORYL, as is partly
evident from the findings presented in section 4.1.3 on CEFR level.
It is somewhat problematic to infer spelling patterns and deduce potential problem
areas from skewed data where most of the errors are produced by spellers with entirely
different outsets. After all, it is not discussed in this thesis whether poor and good spellers
produce the same kinds of errors. For the sake of quality of teaching, it could be beneficial
to investigate the spelling errors of phonemes separately for pupils with and pupils
without reading or writing difficulties.
4.2.2 Pronunciation test results
As described in section 3.5, six out of the seven eligible respondents undertook the
pronunciation test. The six pupils produced a total of 70 pronunciation errors across 623
words. The distribution of errors according to target phoneme is shown in Table 4.5:
Table 4.5: Erroneously pronounced target phonemes
Pronunciation
errors /ɪə/ /ʧ/ /v/ /eə/ /æ/ /e/ /w/ /ʃ/ Total
n 29 18 9 7 6 1 - - 70
% 40.3 25.0 8.8 9.0 6.7 1.1 - - 9.4
Since the six respondents only produced a few errors each, the errors are only presented
in total. The pronunciation errors were much more evenly distributed between pupils than
spelling errors, except one pupil who produced no pronunciation errors. The percentages
in Table 4.5 indicate the how often each phoneme was misspelt. For example, the pupils
pronounced /ʧ/ erroneously 25% of the time.
Section 2.7 presented the relevant pronunciation errors that we can expect
Norwegian speakers to produce, /ʋ/ instead of /w/ and long vowels plus /r/ for the centric
diphthongs. Additionally, most Norwegian speakers are unable to distinguish between
those dipththongs. These expectiations were partially met in the findings. There were no
errors for /w/, but two pupils pronounced target /v/ as /ʋ/, one time by one pupil and eight
times by the other. The diphthongs were erroneously pronounced more often, /eə/ seven
times and /ɪə/ 29 times. The former was pronounced /æ/ four times by four different

60
pupils, each time for parents. The target word area was pronounced once with /ɪə/ and
twice with /er/. A little under half of all pronunciation errors were attempts at pronouncing
/ɪə/. Out the 29 errors, 24 reflect the expectations presented by Nilsen (2002). Four errors
were uses of /iːr/, ten were uses of /eːr/, three were uses of /er/, and eight were uses of
/eər/. Interestingly, although there were not expected many errors of /ʧ/, it has the second
highest error rate. All but one error is the use of /ʃ/, occurring word-initially or -medially.
4.3 Hypotheses
Sections 4.1 and 4.2 presented the central results, which will be addressed in accordance
with each hypothesis in the following subsections. The four hypotheses are addressed one
at a time using relevant results, and they correspond to the following research questions:
Q1. Is there a pattern in the phonetics behind learners’ spelling errors?
Q2. Are there phonemes that are more difficult to spell than others?
Q3. Do learners struggle with the same phonemes in pronunciation and spelling?
Q2 corresponds directly with H1 whereas Q1 and Q2 are jointly addressed by H2-4.
4.3.1 H1: Errors in both spelling and pronunciation
The first hypothesis assumes that learners are more likely to misspell phonemes they
pronounce erroneously. This was initially planned to be tested by comparing the results
that each individual respondent had on the pronunciation test and the dictation. Because
there were few eligible participants, this hypothesis will ultimately not be satisfactorily
answered, but the results are presented regardless. Ultimately, the six respondents
produced 70 pronunciation errors and 33 spelling errors for the relevant phonemes, where
only four where of the same phoneme in the same student. This is shown in Table 4.6:

61
Table 4.6: Errors of the same phoneme in spelling and pronunciation by the same pupil
Pupil
ID
Target
word
Produced
spelling
Produced
pronunciation
Target grapheme/
phoneme
uf-3 ERA eeria /iːrə/ <er> for /ɪə/
uf-4 SOUVENIRS souverniers /sʊʋəneːrs/ <ir> for /ɪə/
VOLUNTEER voulentair /ʋɒlənteːr/ <eer> for /ɪə/
um-1 WEIRD wierd /weːrd/ <ei> for /ɪə/
Three pupils made four such double errors between them, all for the same phoneme,
namely /ɪə/, or more accurately the GA sequence /ɪr/, considering that all three pupils
were rhotic.
If the hypothesis is addressed outside individual words, i.e. errors of the same
phoneme regardless of word or grapheme, the numbers are different. If a pupil had two
spelling errors and six pronunciation errors for the same phoneme, they made errors
across both domains for the same phoneme twice. Each of the six pupils did this at least
once, and it occurred 16 times in total. The majority, 11, are for /ɪə/, and it occurred three
times for /ʧ/ and twice for /eə/.
Since the pupils produced few errors in total, it is not feasible to analyse this data
quantitatively. Approaching the results qualitatively leaves three aspects of interest. First,
two of the six pupils had writing or reading disabilities, which is reflected in the results;
they have more spelling and pronunciation errors than the other four pupils. There is no
indication that they have more difficulties with certain phonemes than the other pupils,
as their errors are distributed across phonemes similarly to the others. Second, every pupil
seemed to struggle with /ɪə/ in pronunciation, often realising it as /er/ or /eə/. The
diphthong had the highest number of pronunciation errors and spelling errors among the
field work respondents, by a large margin in both dimensions. It is therefore only logical
that there should be some overlap, if only by chance. In fact, a log-likelihood ratio test of
the total number of errors against the number of overlapping errors showed no
significance at p = 0.256. Third, besides the number of times pupils had errors in both
dimensions for a phoneme, there were also several cases of a pupil producing several
errors for a phoneme in only one of the dimensions and none in the other, contradicting
the hypothesis. For example, one student had eight pronunciation errors but no spelling
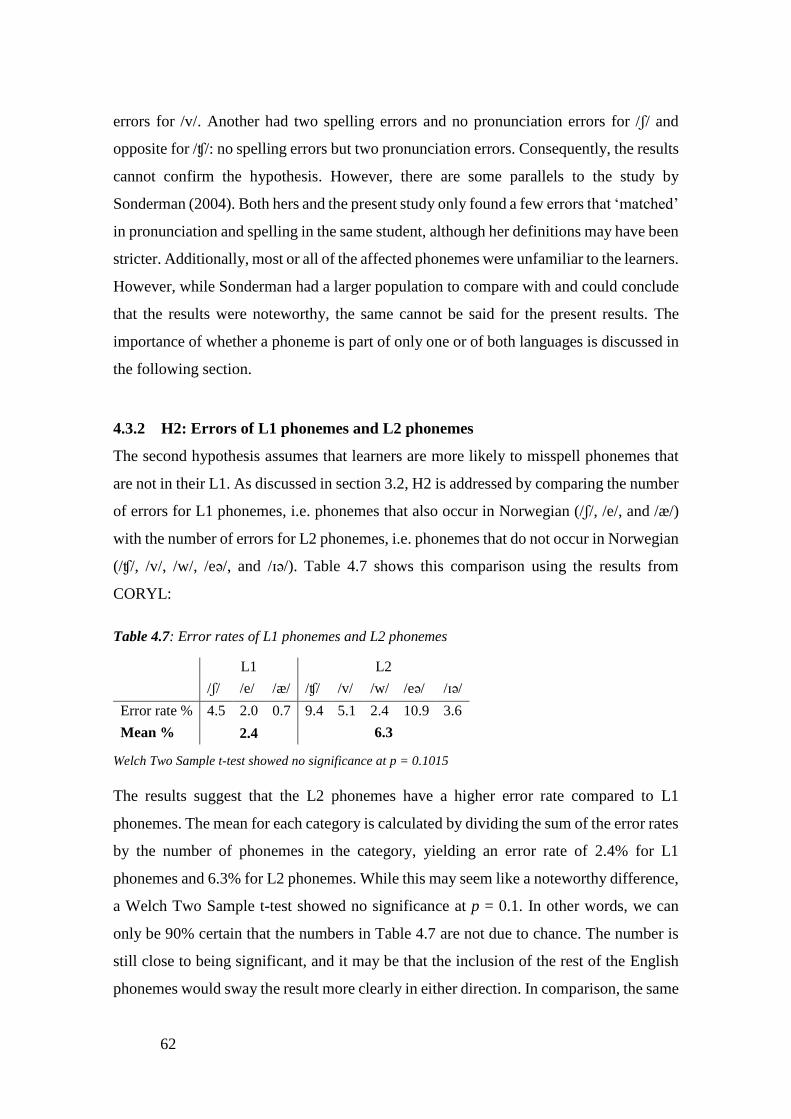
62
errors for /v/. Another had two spelling errors and no pronunciation errors for /ʃ/ and
opposite for /ʧ/: no spelling errors but two pronunciation errors. Consequently, the results
cannot confirm the hypothesis. However, there are some parallels to the study by
Sonderman (2004). Both hers and the present study only found a few errors that ‘matched’
in pronunciation and spelling in the same student, although her definitions may have been
stricter. Additionally, most or all of the affected phonemes were unfamiliar to the learners.
However, while Sonderman had a larger population to compare with and could conclude
that the results were noteworthy, the same cannot be said for the present results. The
importance of whether a phoneme is part of only one or of both languages is discussed in
the following section.
4.3.2 H2: Errors of L1 phonemes and L2 phonemes
The second hypothesis assumes that learners are more likely to misspell phonemes that
are not in their L1. As discussed in section 3.2, H2 is addressed by comparing the number
of errors for L1 phonemes, i.e. phonemes that also occur in Norwegian (/ʃ/, /e/, and /æ/)
with the number of errors for L2 phonemes, i.e. phonemes that do not occur in Norwegian
(/ʧ/, /v/, /w/, /eə/, and /ɪə/). Table 4.7 shows this comparison using the results from
CORYL:
Table 4.7: Error rates of L1 phonemes and L2 phonemes
L1 L2
/ʃ/ /e/ /æ/ /ʧ/ /v/ /w/ /eə/ /ɪə/
Error rate % 4.5 2.0 0.7 9.4 5.1 2.4 10.9 3.6
Mean % 2.4 6.3
Welch Two Sample t-test showed no significance at p = 0.1015
The results suggest that the L2 phonemes have a higher error rate compared to L1
phonemes. The mean for each category is calculated by dividing the sum of the error rates
by the number of phonemes in the category, yielding an error rate of 2.4% for L1
phonemes and 6.3% for L2 phonemes. While this may seem like a noteworthy difference,
a Welch Two Sample t-test showed no significance at p = 0.1. In other words, we can
only be 90% certain that the numbers in Table 4.7 are not due to chance. The number is
still close to being significant, and it may be that the inclusion of the rest of the English
phonemes would sway the result more clearly in either direction. In comparison, the same

63
procedure applied to the field work data yielded an error rate of 2.8% for L1 phonemes
and 5.2% for L2 phonemes, which is very similar to the error rates for CORYL, but also
more likely to have occurred by chance as the population is smaller.
Despite the matter of significance and the difference between the mean error rates,
the numbers vary hugely within both groups. There are L1 phonemes with low and high
error rates, and there are L2 phonemes with low and high error rates. The results indicate
that other factors than familiarity are more important in why some phonemes are more
frequently misspelt than others, and a more qualitative analysis of the hypothesis may be
more fruitful. For instance, the differences in phoneme–grapheme correspondences could
be more important. It is possible, compared to an entirely new phoneme, that it is more
difficult to learn the spelling patterns of a shared phoneme the more different the
phoneme–grapheme correspondences are between the L1 and the L2. There are spellings
in CORYL where known phonemes are spelt with L1 graphemes, such as fisj for FISH,
and some spellings where known phonemes are spelt with graphemes that are more
common for a similar L2 phoneme, such as fich for FISH. In the spelling error fisj, the
Norwegian grapheme <sj> is used for /ʃ/, which in Norwegian normally corresponds to
/ʃ/, as in e.g. sjø ‘sea’. In the spelling error fich, <ch> is used for the familiar phoneme /ʃ/
although the grapheme is much more often associated with the foreign phoneme /ʧ/,
especially in the word-final position. There are several of both of these types of errors,
and this will be further discussed in the analysis of phonetically accurate errors in section
4.3.4.
In summary, the combined evaluation by means of objective statistics and
subjective analysis cannot confirm H2: the findings in this thesis do not indicate that
learners are more likely to misspell phonemes that are not in their L1.
4.3.3 H3: Errors of frequent and infrequent graphemes
The third hypothesis assumes that learners are more likely to misspell phonemes with less
iconic graphemes. To thoroughly assess the ‘iconicity’ would have required an account
of the typical vocabulary of pupils, as well as an account of the most frequent graphemes
and the context in which they typically appear, which is beyond the scope of the present
thesis. It is however possible to measure the error rates of individual graphemes. There
are 51 correspondences included, and excluding those with an error rate of 0% or 100%

64
yields a mean error rate of 9.7% when all correspondences are weighted equally, and a
median of 7.1%. The concept of iconicity is closely related to regularity, which is the
basis of the distinction between graphemes in ‘the main system’ and ‘the rest’ as
presented by Brooks (2015) (cf. sections 2.1 and 3.2). I remind the reader of the
distinction between ‘graphemes in the main system’ and ‘a phoneme’s basic grapheme’,
which are both referenced in this section. The following reports the grapheme’s error rates
for one phoneme at a time along with a few comments and the results of all phonemes are
subsequently compared.
The ideas behind H3 are that the more graphemes that can spell a phoneme, or the
more the phoneme’s usage is spread across its graphemes, the higher the phoneme’s error
rate will be. If only the basic grapheme is considered, then /æ/ is expected to have the
lowest error rate since the basic grapheme <a> makes out 99% of its occurrences, while
/eə/ is expected to have the highest error rate, as the basic grapheme <are> makes out
only 24% of occurrences (coupled with <ar>). In broad terms, cases that support the
hypothesis are graphemes with low frequency and high error rates, or graphemes with
high frequency and low error rates. A more detailed analysis must take into account the
regularity of correspondences, which is an important factor of whether a grapheme
belongs in ‘the main system’ or ‘the rest’ (cf. section 2.1). The frequencies given are
calculated by Carney (1994), here gathered from Brooks (2015). Sometimes, several
graphemes are together attributed one frequency value, as with <ti>, <si>, <ssi>, and <ci>
in Table 4.8. In these cases, I supply the numbers of correct use and the number of errors
for each grapheme, but calculate one error rate to correspond to the frequency value for
the purposes of comparison. Most rare graphemes are not attributed individual frequency
values, and are therefore given a frequency of <1%, i.e. less than one percent. Graphemes
with correct usage but no errors are excluded from tables.
Table 4.8 shows the number of times each of the graphemes of /ʃ/ were misspelt:

65
Table 4.8: Error rates of the graphemes of /ʃ/
/ʃ/ PGC
freq. Grapheme
Correct
use Errors %
Main
system
37% <sh> 1308 55 4.0
55%
<ti> 133 5
4.8 <si> 2 0
<ssi> 8 3
<ci> 34 1
Rest
< 1% <ch> 11 1 8.3
< 1% <s> 26 6 18.8
< 1% <sci> 0 1 100.0
Total > 92% 1537 72 4.5
There are five graphemes for /ʃ/ with zero errors each, namely: <si>, <ce>, <ss>, <x>,
and <xi>, with 17 uses between them. Table 4.8 shows that the majority of errors for /ʃ/
are attempts at spelling <sh>, however, this grapheme also has the lowest error rate. The
bottom three graphemes are part of the 19 correspondences belonging to ‘the rest’ of /ʃ/,
for which Brooks (2015) only gives a combined frequency of 8%. They are therefore
given a symbolic frequency of < 1%. The combined frequency of the other graphemes in
the main system of /ʃ/, namely <ci>, <si>, <ssi>, and <ti>, is 55%. Therefore, the
graphemes that are misspelt in CORYL represent 92% of the frequency of spellings of
/ʃ/. However, it is clear that the frequency of pupils do not match the frequencies supplied.
Here, <sh> is used 85% of the time rather than 37%. For the vocabulary of the pupils of
CORYL, <sh> thus has the highest frequency and the lowest error rate of the graphemes
of /ʃ/, which is in line with the assumption of H3. Furthermore, the error rates of
graphemes in the main system of /ʃ/ are lower than the error rates of the irregular and less
frequent graphemes, however some graphemes are used so rarely that their numbers must
be viewed with a critical eye, see for instance <sci> with only a single use. More accurate
numbers for infrequent graphemes could have been found were the database larger.
The errors for the graphemes of /ʧ/ are shown in Table 4.9:

66
Table 4.9: Error rates of the graphemes of /ʧ/
/ʧ/ PGC
freq. Grapheme
Correct
use Errors %
Main
system
65% <ch> 567 59 9.4
25% <t> 284 17 5.6
10% <tch> 204 33 13.9
Rest < 1% <cc> 0 2 100.0
Total > 99% 1063 111 9.5
One rare grapheme of /ʧ/ was used eight times but never misspelt, namely <ti>, mostly
used in question. The three most frequent graphemes of /ʧ/ make out all but a select
number of odd spellings (percentages are rounded up). The basic grapheme <ch> is the
most frequent grapheme for /ʧ/, and like <sh> for /ʃ/, it is the target of the most of the
errors of /ʧ/. However, it has more than double the error rate. The rest of the
correspondences follow the same pattern as shown for /ʃ/, that lower frequency equals
higher error rate.
Table 4.10 shows the distribution of errors for /v/:
Table 4.10: Error rates of the graphemes of /v/
/v/ PGC
freq. Grapheme
Correct
use Errors %
Main
system
98% <v> 1797 138 7.1
2% <ve> 1869 110 5.6
- <f> 976 2 0.2
Total > 99% 4642 250 5.1
The graphemes presented here make out nearly all of the correspondences of /v/, and <f>
only occurs in the preposition of. There is no frequency given for this grapheme, but as
of is a highly common function word, the frequency is quite high, as shown by the number
of correct uses in the corpus. In fact, partly because the supplied frequencies do not count
function words, the frequencies supplied and the frequencies in CORYL could not be
more different, as the number of correct uses show an even split between <v> and <ve>,
and about one fifth of occurrences is attributed to <f>. Besides, <ve> is regular in word-
final positions, which means that it is more iconic than the frequency of 2% suggests, and
adds to the reasons for the similar error rates of <v> and <ve>. If the graphemes’
frequencies were based on the usage in the corpus, they would be 39.5% for <v>, 40.5%
for <ve>, and 20% for <f>. The grapheme <f> for /v/ is not regular, and although it is

67
easy to learn which word it occurs in, it is not commonly associated with /v/. Note that
errors where target OF was spelled off were deemed unanalysable and are not included
here.
The same pattern as with <v> and <ve> seems to occur for /w/, which is shown in
Table 4.11:
Table 4.11: Error rates of the graphemes of /w/
/w/ PGC
freq. Grapheme
Correct
use Errors %
Main
system
64% <w> 7387 117 1.6
5% <wh> 1289 98 7.1
31% <u> 87 3 3.3
Rest - <o> 569 15 2.6
Total > 99% 9333 233 2.4
As with /v/, the frequencies are misleading. The frequency given for <wh> does not
contain function words (e.g. what, when), and 76 out of the 98 errors for target <wh>
were indeed function words. It is clear that, again, the most frequent grapheme has the
lowest error rate, followed by <o> and <u>, though <wh> does not fit into the pattern.
Most of the occurrences of <u> concern the sequence /kw/ spelt <qu> as in quick, and the
occurrences of <o> appear for /wʌ/ in once and words with the morpheme one. There is
one grapheme for /w/ with zero errors, namely <oir> as in choir, attested once.
Overall, the four consonants have more or less similar patterns, but the vowels
show more differences between them. Table 4.12 shows the distribution of errors for /e/:
Table 4.12: Error rates of the graphemes of /e/
/e/ PGC
freq. Grapheme
Correct
use Errors %
Main
system 84% <e> 6018 20 0.3
Rest
6% <ea> 473 65 3.5
< 10%
<ie> 338 36
9.7 <a> 378 20
<ai> 473 65
<ay> 17 8
Total > 90% 7527 160 2.1
The errors of this phoneme seem to fit the assumption in H3. The most frequent grapheme,
<e>, has a low error rate compared with the previously discussed phonemes, and the other

68
graphemes combined represent less than 16% of the use of /e/, but have higher error rates.
Some of the more frequent of the irregular graphemes of /e/ occur in only a single or a
handful of words. For example, <ay> only occurs in says and <ie> only in friend. Of the
44 total errors for these two graphemes, 42 were produced by 12/13-year-olds. This is not
surprising considering that younger spellers rely mostly on the phonological strategy (cf.
section 2.3).
The usage of /æ/ does not warrant a detailed presentation, as all collected errors
for this phoneme have the same target grapheme, namely <a>. There are only 14 words
with graphemes other than <a> that can potentially realise /æ/, and the only one of these
present in CORYL is salmon, with <al> for /æ/. As salmon was only used once, spelt
correctly, the error rate for <a> is 0.7% (78 errors out of 11,788 total uses).
Table 4.13 presents the distribution of errors for /eə/:
Table 4.13: Error rates of the graphemes of /eə/
/eə/ PGC
freq. Grapheme
Correct
use Errors %
Main
system
24% <are> 262 46
15.4 <ar> 7 3
12% <air> 147 19 11.4
4% <ear> 42 1 2.3
37% <ere> 728 78 9.7
Rest 22% <eir> 66 7 9.6
- <ey’re> 16 3 15.8
Total ~ 90% 1282 157 10.9
This phoneme has zero errors in the 14 total occurrences of three graphemes, namely
<eah>, <aer>, and <aire>. As with /e/, some of the graphemes of /eə/ only occur in a few
words, and more than half of the occurences of /eə/ consists of function words, either
<eir> as in their or <ere> as in where and there. For this reason, the frequencies supplied
in Table 4.13 include function words. Most of the graphemes of /eə/ have higher error
rates than in the previous tables, and it does not seem like there is any correlation between
the frequency and error rates of graphemes. The most frequent grapheme, <ere>, has a
high error rate compared to the graphemes of other phonemes, but compared to the other
graphemes of /eə/, it is the third lowest. The frequency for <are>, the basic grapheme for
/eə/, is given together with its shortened sibling <ar>, as <ar> mostly occurs in inflections

69
of words with <are> in the base, such as care – caring. These together received one of
the highest error rates thus far.
Although the two centric diphthongs have a similar spread and type of
correspondences, the error rates of graphemes differ somewhat. Table 4.14 shows the
distribution of errors for /ɪə/:
Table 4.14: Error rates of the graphemes of /ɪə/
/ɪə/ PGC
freq. Grapheme
Correct
use Errors %
Main
system
56% <ear> 383 21 5.2
8% <eer> 8 1 11.1
24% <er> 31 1
0.6 <ere> 298 1
Rest - <eir> 6 4 40.0
Total > 80% 740 28 3.6
The most frequent grapheme, <ear>, is the target of the highest number of errors for /ɪə/,
at least considering the analysable items. The grapheme <ere> is here attributed one error,
but most of the misspellings of this grapheme were deemed unanalysable (cf. section 3.3).
There are also 14 total occurrences of graphemes with zero errors, namely <e’re>, <ier>,
<ir>.
Overall, there appears to be a tendency for frequent graphemes to contain low
error rates. Since it is difficult to mentally compare the findings of each phoneme as they
have been presented, the combined results for all phonemes are compared in Figure 4.6.
Only graphemes with supplied frequencies and graphemes where we can assume
frequencies below 1% are included in the figure. Graphemes that lack text frequency and
graphemes with an error rate of 0% or 100% are omitted. As discussed above, the supplied
frequencies for /v/ differed greatly from the data in CORYL, which is why Figure 4.6
shows the graphemes for /v/ with the frequencies of CORYL:

70
Figure 4.6: The error rate of individual graphemes compared to text frequency
For clarity, consonants are presented as hollow, blue symbols, and vowels are presented
as filled, orange symbols. Basic graphemes are written in boldface. Each data point (one
or more graphemes) in Figure 4.6 contains information on two things: the error rate is
given on the y-axis, and the text frequency if given on the x-axis, which means that the
graphemes with high error rates are located higher in figure, and the most frequent
graphemes are located towards the right side of the figure. For example, <e> is used more
than 80 % of the time for /e/ but only has an error rate of 0.3%. This grapheme is therefore
located in the lower right corner, as is <a> for /æ/, which has the highest frequency of any
correspondence and a very low error rate of 0.7%.
It is difficult to draw any conclusions based on the error rates of the
correspondences of any one phoneme in isolation, but the presentation in Figure 4.6
shows that there is a tendency for higher error rates the lower the frequency of the
grapheme. However, there are also correspondences that are low in both domains, such
as <ear> for /eə/, with 4% of the occurrences of /eə/ and an error rate of 2.3%. It should
<sh> <ti>+<ssi>+<si>
<s>
<ch> <ch>
<t>
<tch>
<v><ve>
<f> <w>
<wh>
<u><o> <e>
<ea>
<ai>+<ie>+<a>+<ay>
<a>
<are>+<ar>
<air>
<ear>
<ere>
<eir><ear>
<eer>
<er>+<ere>
<eir>
0%
10%
20%
30%
40%
50%
0% 10% 20% 30% 40% 50% 60% 70% 80% 90% 100%
Err
or
rate
of
corr
esp
ond
ence
Text frequency of correspondence
/ʃ/
/ʧ/
/v/
/w/
/e/
/æ/
/eə/
/ɪə/
71
be kept in mind that the numbers for some of the graphemes on the left side of the figure
are based on small numbers, such as <eer> for /ɪə/ which is based on only nine
occurrences. There are no instances of graphemes that are high in both domains, i.e. high
frequency and high error rate, with a minor exception in <ch>.
In summary, the overall tendencies indicate that infrequent graphemes are more
likely to be misspelt. H3 did not solely concern the error rates of graphemes, but whether
these tendencies correlate to the overall error rate of each phoneme. I mentioned that if
only the text frequencies of the basic graphemes are considered, /æ/ is expected to have
the lowest error rate, and /eə/ is expected to have the highest error rate. These expectations
are met. On the one hand, the grapheme <a> for /æ/ is unquestionably the most frequent
and least erroneous, and so is the phoneme /æ/ by extension. On the other hand, the
graphemes <are> + <ar> for /eə/ has one of the highest error rates of all graphemes, and
although they only account for a fifth of the occurrences of /eə/, the phoneme also has the
highest error rate at 10.9%. The other six basic graphemes are scattered between these
two outer points, where most have a high frequency coupled with a low error rate. To
conclude, the results confirm the assumption of H3 that learners are more likely to
misspell phonemes with less iconic graphemes.
4.3.4 H4: Phonetically accurate errors
The fourth hypothesis assumes that L2 spelling errors are phonetically accurate. The
hypothesis is addressed using data from CORYL before a discussion of the field work
pupils’ spelling of nonwords. The analysis of these data compares the errors for a
phoneme with the phoneme–grapheme correspondences of that phoneme. For example,
/eə/ has been spelt with 17 different graphemes in CORYL, but only seven of these are
part of the phoneme–grapheme correspondences for /eə/. Every erroneous grapheme has
been categorised as belonging to the main system, to the rest, or outside of the phoneme–
grapheme correspondences of their respective phonemes. For example, in the error mutch
for MUCH, /ʧ/ is misspelt using <tch> instead of <ch>. Since the produced grapheme is a
possible spelling of the same phoneme, it is phonetically accurate; the pronunciation of a
phonetically accurate misspelling can be identical to the target word. In other words,
following the most regular grapheme–phoneme correspondences, the pronunciation of
mutch would be the same as much, namely /mʌʧ/. These types of spellings are also what

72
van Berkel (2004) identified in the morphemic/orthographic stage of spelling, using the
phonetically accurate example of younite for UNITE (cf. section 2.4). The results of the
categorisation are shown in Table 4.15:
Table 4.15: Rate of phonetically accurate spellings per phoneme
/ʃ/ /ʧ/ /v/ /w/ /e/ /æ/ /eə/ /ɪə/ Total
Main system 37 40 84 138 75 - 40 18 432
Rest 27 21 - - 59 4 104 1 216
Not a PGC 8 50 166 96 26 74 13 9 442
Phonetically
accurate
graphemes
n 64 61 84 138 134 4 144 19 648
% 88.9 55.0 33.6 59.0 83.8 5.1 91.7 67.9 59.4
Log-likelihood ratio test showed significance at p < .01
Overall, pupils use phonetically accurate phonemes in more than half of all cases, at
59.4%. Behind the total, however, there is huge variance in phonetic accuracy across
phonemes. The most phonetically accurate phoneme, /eə/, was misspelt with phonetically
accurate graphemes 91.7% of the time, though most of these were rare graphemes, like
<er>. This grapheme only realises /eə/ in a handful of loanwords, e.g. sombrero. It is
arguably not ideal to include rare graphemes, as they would most likely not be
phonetically accurate in the eyes of the learner. Additionally, <er> is far more likely to
represent /ɜː/ or /ə/, which together make out 89% of the occurrences of <er> (Brooks,
2015: 384). At the other end of the scale, /æ/ is only phonetically correct 5.1% of the time,
which is 3 occurrences of <ai> and one occurrence of <i>, which both also only occur in
a handful of words, e.g. plaid and meringue. As mentioned, the few graphemes beside
<a> that can realise /æ/ only occur in about 14 different lexemes. Based on the nature of
the correspondences of /æ/ therefore, the phoneme should not be considered possible to
misspell in a phonetically accurate way, and it should therefore be exluded from the
analysis of phonetically accurate misspellings.
Considering the vocabulary of young L2 learners, it may be more valid to only
consider graphemes in the main system, i.e. graphemes that are part of a larger regularity,
compared to graphemes that are not part of the correspondences of their target phonemes.
Furthermore, for the purposes of the analysis of H4, the 51 hitherto unanalysable
homophone spellings should be included, since they are phonetically accurate by
definition. The resulting changes are visualised in Table 4.16:

73
Table 4.16: Rate of phonetically accurate spellings per phoneme, excluding irregular graphemes
and /æ/, and including homophone errors
/ʃ/ /ʧ/ /v/ /w/ /e/ /eə/ /ɪə/ Total
Main system 41 43 84 143 80 55 37 483
Not a PGC 8 50 166 96 26 13 9 368
% 83.7 46.2 33.6 59.8 75.5 80.9 80.4 56.8
Log-likelihood ratio test showed significance at p < .01
The result of limiting the comparison to the most frequent and regular graphemes with
graphemes outside the correspondences is that, of these seven phonemes, spelling errors
are phonetically accurate in 56.8% of cases, which is very close to the initial result
presented in Table 4.15. However, the rate of phonetically accurate spellings still vary
greatly between phonemes, the lowest is /v/ at 33.6% and the highest is /ʃ/ at 83.7%. One
could argue that the irregular correspondences should be defined as phonetically
inaccurate, especially as there are graphemes that are rare for one phoneme but regular
for another, as e.g. <a>. This grapheme can spell /e/ as in any, but if it occurred in an
unknown word, it is more likely that the corresponding sound is one of six phonemes,
namely /æ/, /ə/, /ɑː/, /eɪ/, /ɒ/, and /ɔː/ (Brooks, 2015: 347). In the scenario where irregular
graphemes are deemed phonetically inaccurate, the rate of phonetically accurate spellings
is 45.3%. Regardless of which definition of ‘phonetically accurate’ to use, some
phonemes do seem to obtain predominantly phonetically accurate misspellings, namely
/ʃ/, /e/, /eə/, and /ɪə/, as their percentages are consistently high.
Before any conclusion can be drawn from these results, there is another issue to
consider. In addition to whether or not a produced grapheme can correspond to the
intended phoneme, it ought to be contextually accurate. This is what Treiman and Kessler
(2016) referred to in their discussion of how learners tend to avoid graphotactically odd
spellings (cf, section 2.4.1). A point made by spelling reformers over a century ago makes
a good example, as they used irregular phoneme–grapheme correspondences to illustrate
and justify their agenda. A well known example is ghoti, which is a proposed parallel
spelling to fish, sinche /f/ can be <gh> as in enough, /ɪ/ can be <o> as in women, and /ʃ/
can be <ti> as in nation. In 1845, spelling reformer Alexander Ellis wrote A plea for
phonotypy and phonography, in which he argued that the number of ways that different
sounds could be spelled meant that even short words could have millions of possible
spellings. He also added some “amusingly extravagant” examples, such as

74
eolotthowghrhoighuay for orthography12 (A. J. Ellis, 1845: 16). What these examples fail
to take into account is the regularity and the context of the graphemes, whether it be word-
relative position or neighboring sounds.13 Following the most regular grapeme–phoneme
correspondences, native speakers should always pronounce ghoti as /ɡəʊti/.
An overview of the phonetically inaccurate errors that pupils produced has not
been given, but if the spelling errors were analysed according to contextual accuracy, the
result would most likely have been different. Unfortunately, such an analysis was outside
the scope of the present thesis. However, it is logical to assume that some of the
phonetically accurate errors, as defined above, are contextually inaccurate, which would
yield a lower rate of wholly phonetically accurate errors.
The dictation used in the field work contained nine nonwords in addition to the
longer sentences. The nonwords are given in section 3.5.1 and in Appendix 1, and I
remind the reader that /w/ was unfortunately overlooked in the creation of nonwords. The
results of the dictation are not suited for direct comparison with the results of Table 4.16,
as the nonword test is not concerned with errors. The test is instead designed to elicit the
graphemes that learners prefer when they can only draw on phonology, and if there are
any regularities. The produced spellings are given in Table 4.17:
Table 4.17: Graphemes used in the spelling of nonwords
/ʃ/ /ʧ/ /v/ /e/ /æ/ /eə/ /ɪə/ Total
Main
system
<sh> 7 <ch> 5 <v> 7 <e> 11 <a> 7 <ar> 6 <er> 4
72 <ti> 7 <tch> 3 <ve> 3 <are> 6 <ear> 1 <t> 2 <f> 1 <ear> 2
Sum 14 10 11 11 7 14 5
Rest <ch> 6 <che> 1 <a> 3 <ir> 2
16 <sch> 1 <t> 1 <eir> 1 <ier> 1
Sum 7 2 - 3 - - 4
Non-
PGC
<sh> 1 <b> 2 <are> 2
10 <tche> 1 <w> 1 <io> 2 <iur> 1
Sum - 2 3 - - - 5
Total 21 14 14 14 7 14 14 98
Phonetically
accurate 100% 83.3% 78.6% 100% 100% 100% 50% 87.8%
As discussed above, the graphemes that are part of irregular correspondences are excluded
from the calculations of the rate of phonetically accurate spellings. The overall result is
12 Based on the correspondences in the following words: George, colonel, Matthew, knowledge, ghost,
rheumatic, Beauvoir, laugh, and quay (A. J. Ellis, 1845: 16). 13 Which A. J. Ellis (1845) does point out.

75
that phonemes were spelt with phonetically accurate graphemes in 87.8% of cases. This
number is much higher than the rate of phonetically accurate errors in CORYL, and there
could be a number of reasons for this. First is the matter of age, that the nonword spellers
were all 15/16-year-olds and are thus expected to perform better than the average of the
12/13-year-olds and the 15/16-year-olds of CORYL. Secondly, some nonwords contained
potentially familiar affixes (cf. section 3.5.1), such as -arian in /daɪˈkeəriən/, and every
pupil did use <ar> in the spelling of this nonword. Finally, the very concept of the test
was to force pupils to rely on the phonological strategy and avoid the use of analogy via
the orthographic strategy (cf. section 2.3). Four phonemes were spelt with phonetically
accurate graphemes in every instance, and two phonemes in the majority of instances.
Only /ɪə/ was spelt accurately as often as inaccurately, which is yet another case
illustrating the difficulties learners have with the spelling of this particular phoneme. If
the graphemes were analysed according to context, the numbers would likely be different.
One of the occurrences of <tch>, for instance, was used word-initially in tchove for
/ˈtʃʌv/, but the grapheme never occurs word-initially in English.
The nature of phoneme–grapheme correspondences makes it difficult to draw a
clear conclusion of H4. Some phonemes have a larger pool of graphemes than others, and
while it is highly arguable which type of phoneme–grapheme correspondences to deem
phonetically accurate, some phonemes have received a high rate of phonetically accurate
errors regardless of the definitions used. When pupils are presented with nonwords, they
are much more likely to use accurate graphemes. It has been shown that some phonemes,
namely /ʃ/, /e/, /eə/, and to a lesser extent /ɪə/, are spelt with phonetically accurate
phonemes in most cases, and despite the assumption that taking the immediate context
into consideration would yield lower numbers, H4 is partly confirmed.
4.4 Summary
This chapter presented the results from CORYL and showed that there was no difference
in errors between genders, that there was an expected difference in spelling ability
between age groups and CEFR levels, and that the spelling of different phonemes yield
different types of spelling errors. The main result is that there is a clear difference in the
rate of spelling errors between phonemes. Overall, the English spelling by Norwegian
pupils have error rates of phonemes ranging from above 10% in /eə/ to below 1% in /æ/.

76
The results of field work conducted for the present thesis was also presented, and although
respondents were few, the results were very similar to those of CORYL. Additionally, it
was indicated that poor spelling skills does not always follow poor pronunciation skill
and vice versa, as most of the spelling errors were produced by a few pupils, while
pronunciation errors were on the whole evenly distributed across pupils.
H1 assumed that learners are more likely to misspell phonemes they pronounce
erroneously. Of the six eligible respondents, four double errors, i.e. an error in spelling
and pronunciation of the same phoneme in the same word, were produced. However, the
sample size was too small for any noteworthy conclusions, and the results cannot confirm
the hypothesis.
H2 assumed that learners are more likely to misspell phonemes that are not in their
L1, and like H1, results could not be considered significant. Although the mean error rate
for L2 phonemes was higher than for L1 phonemes, there is a 10% chance that the results
do not correlate with the categorisation, and the inclusion of all 44 phonemes may yield
clearer results, though the qualitative analysis indicates that other factors are more
important in the difficulty of spelling different phonemes.
H3 assumed that learners are more likely to misspell phonemes with less iconic
graphemes. There was a clear correlation between the distribution of frequency across
graphemes and error rate: phonemes with a few, frequent graphemes had lower error rates
than phonemes with many graphemes of even frequency. The same was true for the
graphemes themselves, and the results can confirm the hypothesis.
H4 assumed that L2 spelling errors are phonetically accurate. This happened in
about 50% of cases, but there was a difference between phonemes. At least three
phonemes, /ʃ/, /e/, and /eə/, were spelt with phonetically accurate graphemes in almost
every instance, and pupils used predominantly regular graphemes in the spelling of
nonwords. The results could therefore partly confirm the hypothesis, in that L2 spelling
errors of certain phonemes tend to be phonetically accurate, but for the hypothesis to be
concluded in full requires the consideration of the immediate context of the spelling, be
it word- or syllable-relative position or surrounding phonemes or graphemes.

77
5 Conclusion
The present thesis has found that there are visible patterns in the phonology behind
learners’ spelling errors, and there are indications of several other patterns. There are
phonemes that are misspelt more than ten times as often as other phonemes, but the
reasons are likely many and complex. The clearest correlation discovered is between the
iconicity or regularity of graphemes and the error rate of the corresponding phoneme.
When a phoneme mainly corresponds to a few, regular spellings, it has a low rate of
spelling errors. The clearest example is /æ/, which is spelt by <a> in 99% of occurrences,
and has a miniscule error rate of 0.7%. On the other side of the scale are phonemes where
there are a number of graphemes, neither of them particularly iconic, like /eə/, which has
the highest error rate at 10.9%. This correlation was found in the confirmation of H3.
Of the other three hypotheses in this thesis, two could not be confirmed. The
analysis of H1 needed a larger population and consequently sample size to make any
confident conclusions, and the analysis of H2 seemed to indicate that phonemes only
present in the L2 are more frequently misspelt than phonemes that also exist in the L1,
but the results were not significant, and including more phonemes could yield clearer
results. The results could only partially confirm the fourth and final hypothesis, as only a
few phonemes (/ʃ/, /e/, and /ɪə/) were consistently spelt with phonetically accurate
graphemes.
The present thesis is, to my knowledge, the first study to conduct an error analysis
on the spelling of individual phonemes in L2 English. Naturally, there are some
limitations. The study was always intended to be a microcosm, as retrieving results for
individual phonemes from a corpus not tagged for phonemes is a time consuming
undertaking. As the present thesis only analysed the spelling of eight of the 44 phonemes
of RP, every result shows merely one fifth of the full picture. The scope of the thesis also
meant that the use of Norwegian phonology and orthography was severly limited, and
any future research should make more comparisons to the L1 language system. A detailed
comparison of the phoneme–grapheme correspondences of the L1 and the L2 could
provide the context needed to find correlations that the present thesis could not.

78
The presence of certain topics unfortunately involves the absence of others, and
there were times where I would love to include more data and subsequent analysis, but
time would not allow it. For instance, an incorporation of the theory of spelling formation
at the hierarchical level as in e.g. Ryan (2018) would have been interesting, as several of
the issues in the present thesis refer to the context of spellings. And not least, the issue of
young learners’ L2 spelling errors should be tackled with the intent to help those few who
have difficulties acquiring L2 spelling, and I believe a phonological approach to teaching
has great potential.

79
Appendices
A1: The 238 word forms of the corpus data target words
ACCEPTED DEAR HEAR QUICKLY THAT WAVED
AGAIN DEPRESSION HEARING RECOMMEND THAT'S WE
AGAINST DESERVE HELP RED THE END WEARING
ALL OVER DETENTION HERE'S REMEMBER THEIR WEATHER
ALWAYS DISAPPEAR IMPROVEMENT REMEMBERED THEMSELVES WEEKS
AND DISAPPEARED I'VE REST THERE WEIRD
ANY DISCUSSIONS KITCHEN SAID THEREFORE WELL
ANYBODY DOWNSTAIRS LANDING SAT THERE'S WENT
ANYMORE DRENCHED LEATHER SAVE THEY'RE WERE
ANYONE DRIVE LIFE VEST SAYS THIEVES WEST
ANYTHING DRIVING LIVE SCARE TOUCH WHAT
ANYWHERE DROVE LIVED SCARED TRADITION WHAT'S
AWAY EACH OTHER LIVES SCARY TRASH WHEN
BACK END LIVING SEGREGATION TRAVELLED WHERE
BAG ESPECIALLY LOVE SERVICE TREASURE WHICH
BARELY EVENING LOVELY SEVERAL TV WHILE
BEACH EVERY LOVES SHADOW TWELVE WHISPERING
BEGAN EVERYBODY MACHINES SHALL UNFORTUNATELY WHISTLING
BELIEVE EVERYONE MAN SHE UPSTAIRS WHITE
BETWEEN EVERYTHING MANY SHINING VACATION WHY
BLACK EVERYWHERE MATCH SHOE VERGE WIDE
BOOKSHELF FAT MUCH SHOES VERY WIFE
CAMPING FELT MYSTERIOUSLY SHOOTING VISIT WINDOW
CAN FINISH NEAR SHOP VISITED WINDOWS
CAPPUCCINO FINISHED NEARBY SHOPPED VISITING WINNING
CARAVAN FISH NEARLY SHOPPING VOICE WINS
CARE FISHING NEVER SHOT VOICES WISHES
CAREER FIVE NO ONE SHOULD WAIT WITH
CATCH FRIEND OF SHOUTING WAITING WITHOUT
CATCH FRIENDS ONE SITUATION WAKE WOMAN
CHAIR GENERATION OVEN SLEPT WALL WOULD
CHAIRS GOLDFISH OVER SOMEONE WALLS YEARS
CHANGED HAIR OVERSLEPT STAIRS WANT YELLED
CHECK HAIR PAIR STARING WARM
CHINATOWN HAND PARROT SURE WAS
CLEARLY HANG PERMISSION SURVIVE WASHINGTON
CONSCIENCE HANGED PICTURE SWEATER WASN'T
COUCH HANGING PLAN SWIMMING WATCH
CRASHED HAPPENING PREPARED SWITCH WATCHING
DAD HAVE QUICK TEACHER WATER
DADDY HAVING QUICKEST TELEVISION WAVE

80
A2: Sentences and nonwords used in field work, transcribed as they were recorded
1. She says my pictures are weird.
/ʃi sez maɪ pɪktʃəz ə wɪəd/
2. The heavy bear was very sad once.
/ðə hevi beə wəz veri sæd wʌns/
3. The volunteer asked a question.
/ðə vɒləntɪə aːskt ə kwestʃən/
4. They will crash zero times with their aeroplane. /ðeɪ wɪl kræʃ zɪərəʊ taɪmz wɪð ðeə eərəpleɪn/
5. There are souvenirs everywhere.
/ðeə aː suːvənɪəz evriweə/
6. My generation clearly values tradition. /maɪ dʒenəreɪʃən klɪəli væljuːz trədɪʃən/
7. The scary witch never had any education. /ðə skeəri wɪtʃ nevə hæd eni edjukeɪʃən/
8. We’re having a discussion of language. /wɪə hævɪŋ eɪ dɪskʌʃən əv læŋgwɪdʒ/
9. We travel on the ocean waves. /wiː trævəl ɒn ði əʊʃən weɪvz/
10. I’m sure that action heroes eat salmon. /aɪm ʃɔː ðət ækʃən hɪərəʊz iːt sæmən/
11. Wealthy people actually give rewards. /welθi piːpəl æktʃəli gɪv riwɔːdz/
12. Which tie should my friend wear? /wɪtʃ taɪ ʃʊd maɪ frend weə/
13. They said that this area was too chilly. /ðeɪ sed ðət ðɪs eəriə wəz tuː tʃɪli/
14. They’re checking out my version of the air guitar. /ðeə tʃekɪŋ aʊt maɪ vɜːʃən əv ði eə gɪtaː/

81
15. I hear that your beard is special. /aɪ hɪə ðət jɔː bɪəd ɪz speʃəl/
16. He was much quicker than his own shadow. /hiː wəz mʌtʃ kwɪkə ðən hɪz əʊn ʃædəʊ/
17. When can we finish the chat about my career? /wen kən wi fɪnɪʃ ðə tʃæt əbaʊt maɪ kərɪə/
18. My parents gave me permission to have cereal. /maɪ peərənts geɪv mi pəmɪʃən tə hæv sɪəriəl/
19. The teacher can stare at his machine for hours. /ðə tiːtʃə kən steə ət ɪz məʃiːn fə aʊəz/
20. I don’t care if I catch the ship or not. /aɪ dəʊnt keə ɪf aɪ kætʃ ðə ʃɪp ɔː nɒt/
21. This is the era of the atom. /ðɪs ɪz ði ɪərə əv ði ætəm/
22. They are by nature wishful people /ðeɪ aː baɪ neɪtʃə wɪʃfəl piːpəl/
a. /kənˈvuːtʃ/
b. /ˈtæʃɪti/
c. /eməˈkeɪʃən/
d. /ˈtʃʌv/
e. /ˈpɒlikeə/
f. /daɪˈkeəriən/
g. /ˈbəʊtɪə/
h. /ˈʃemɪŋ/
i. /ˈvɪəriəl/

82
Reference list
Albrow, K. H. (1972). The English writing system: Notes towards a description.
London: Longman.
Allaith, Z. A., & Joshi, R. M. (2011). Spelling performance of English consonants
among students whose first language is Arabic. Reading and Writing, 24(9),
1089-1110. doi:http://dx.doi.org/10.1007/s11145-010-9294-3
Anderson, K. F. (1985). The Development of Spelling Ability and Linguistic Strategies.
The Reading Teacher, 39(2), 140-147.
Ball, E. W., & Blachman, B. A. (1988). Phoneme segmentation training: Effect on
reading readiness. Annals of Dyslexia, 38(1), 208-225.
Barry, C., & Seymour, P. H. K. (1988). Lexical Priming and Sound-to-Spelling
Contingency Effects in Nonword Spelling. The Quarterly Journal of
Experimental Psychology, 40(1), 5-40. doi:10.1080/14640748808402280
Bebout, L. (1985). An error analysis of misspellings made by learners of English as a
first and as a second language. Journal of psycholinguistic research, 14(6), 569-
593.
Bosman, A. M. T., & Van Orden, G. C. (1997). Why Spelling is More Difficult Than
Reading. In C. A. Perfetti, L. Rieben, & M. Fayol (Eds.), Learning to spell:
Research, theory, practice across languages (pp. 173-194). New Jersey:
Lawrence Erlbaum Associates.
Brooks, G. (2015). Dictionary of the British English spelling system. Cambridge, UK:
Open Book Publishers.
Brooks, G., Gorman, T., & Kendall, L. (1993). Spelling it out: the spelling abilities of
11-and 15-year-olds. Slough: National Foundation for Educational Research.
Bruck, M., & Treiman, R. (1990). Phonological awareness and spelling in normal
children and dyslexics: The case of initial consonant clusters. Journal of
Experimental Child Psychology, 50(1), 156-178.
doi:https://doi.org/10.1016/0022-0965(90)90037-9
Caravolas, M., Hulme, C., & Snowling, M. J. (2001). The Foundations of Spelling
Ability: Evidence from a 3-Year Longitudinal Study. Journal of Memory and
Language, 45(4), 751-774. doi:10.1006/jmla.2000.2785
Carney, E. (1994). A Survey of English Spelling. London: Routledge.
Chen, X., & Schwartz, M. (2018). Morphological awareness and literacy in second
language learners: a cross-language perspective. Reading and Writing, 31(8),
1685-1694. doi:10.1007/s11145-018-9866-1
Cook, V. J. (1997). L2 Users and English Spelling. Journal of Multilingual and
Multicultural Development, 18(6), 474-488. doi:10.1080/01434639708666335
Cook, V. J. (2014). The English writing system. London: Routledge.
Corpus of Young Learner Language. Available at
http://clarino.uib.no/korpuskel/landing-page?identifier=coryl&view=short
83
Dich, N., & Pedersen, B. (2013). Native Language Effects on Spelling in English as a
Foreign Language: A Time-Course Analysis. Canadian Journal of Applied
Linguistics, 16(1), 51-68.
Ehri, L. C. (1997). Learning to Read and Learning to Spell Are One and the Same,
Almost. In C. A. Perfetti, L. Rieben, & M. Fayol (Eds.), Learning to spell:
Research, theory, practice across languages (pp. 237-270). New Jersey:
Lawrence Erlbaum Associates.
Ellis, A. J. (1845). A plea for phonotypy and phonography or, Speech-printing and
speech-writing. Bath: Isaac Pitman.
Ellis, R. (2015). Understanding second language acquisition (2nd ed. ed.). Oxford:
Oxford University Press.
Ellis, R., & Barkhuizen, G. (2005). Analysing learner language. Oxford: Oxford
University Press.
Farukh, A., & Vulchanova, M. (2015). L1, quantity of exposure to L2, and reading
disability as factors in L2 literacy skills. In T. Cardierno & S. Eskildsen (Eds.),
Usage-Based Perspectives on Second Language Learning (30 ed., pp. 329-350).
Berlin: De Gruyter Mouton.
Figueredo, L. (2006). Using the known to chart the unknown: A review of first-
language influence on the development of English-as-a-second-language
spelling skill. Reading and Writing, 19(8), 873-905.
Foster, W. T. (1911). The spelling of college students. Journal of Educational
Psychology, 2(4), 211.
Fresch, M. J. (2008). An Exploration of University Students' Spelling Abilities. Reading
Horizons, 49(1), 53-70.
Gill, E. J. (1912). The teaching of spelling. Journal of experimental pedagogy, 1, 310-
334.
Gombert, J. E., Bryant, P., & Warrick, N. (1997). Childern's Use of Analogy in
Learning to Read and to Spell. In C. A. Perfetti, L. Rieben, & M. Fayol (Eds.),
Learning to spell: Research, theory, practice across languages (pp. 221-235).
New Jersey: Lawrence Erlbaum Associates.
Goswami, U. (2005). Synthetic Phonics and Learning to Read: A Cross‐language
Perspective. Educational Psychology in Practice, 21(4), 273-282.
doi:10.1080/02667360500344823
Hanna, P. R., Hanna, J. S., Hogdes, R. E., & Rudorf, E. H. (1966). Phoneme-grapheme
correspondences as cues to spelling improvement. Washington, D.C.: U.S.
Department of Health, Education, and Welfare, Office of Education, 1966.
Hasselgreen, A. (2012). Developing a framework for assessing writing in primary
school. In A. Hasselgreen, I. Drew, & B. Sørheim (Eds.), The Young Language
Learner. Research-based insights into Teaching and Learning (pp. 221-232).
Bergen: Fagbokforlaget.
84
Hasselgreen, A., & Sundet, K. T. (2017). Introducing the CORYL Corpus: What it Is
and How We Can Use it to Shed Light on Learner Language. Bergen Language
and Linguistics Studies, 7, 19.
Helland, T., & Kaasa, R. (2005). Dyslexia in English as a second language. Dyslexia,
11(1), 41-60. doi:10.1002/dys.286
Holm, A., & Dodd, B. (1996). The effect of first written language on the acquisition of
English literacy. Cognition, 59(2), 119-147. doi:10.1016/0010-0277(95)00691-5
Jaffré, J.-P. (1997). From Writing to Orthography: The Functions and Limits of the
Notion of System. In C. A. Perfetti, L. Rieben, & M. Fayol (Eds.), Learning to
spell: Research, theory, practice across languages (pp. 3-20). New Jersey:
Lawrence Erlbaum Associates.
James, C. (1998). Errors in language learning and use : exploring error analysis.
London: Longman.
Joshi, R. M., Høien, T., Feng, X., Chengappa, R., & Boulware-Gooden, R. (2013).
Learning to spell by ear and by eye: A cross-linguistic comparison. In R. M.
Joshi & P. G. Aaron (Eds.), Handbook of orthography and literacy (pp. 583-
592). New Jersey: Routledge.
Kahn-Horwitz, J., Sparks, R. L., & Goldstein, Z. (2012). English as a foreign language
spelling development: A longitudinal study. Applied Psycholinguistics, 33(2),
343-363. doi:10.1017/S0142716411000397
Koda, K. (2005). Learning to read across writing systems: Transfer, metalinguistic
awareness, and second language reading development. In V. Cook & B. Bassetti
(Eds.), Second Language Writing Systems (Vol. 11, pp. 311-334). Clevedon:
Multilingual Matters.
Kristoffersen, G. (2000). The phonology of Norwegian. Oxford: Oxford University
Press.
Le Marchant Douse, T. (1900). On Some Minor Psychological Inferences: A Study of
Misspellings and Related Mistakes. Mind, IX(36), 85-93.
doi:10.1093/mind/IX.36.85
Lightbown, P. M., & Spada, N. (2013). How Languages are Learned (4th ed.). Oxford:
Oxford University Press.
Livingston, A. A. (1946). A Study of Spelling Errors. British Journal of Educational
Psychology, 16(1), 46-46.
Macharia, M. (2013). The phonological basis of misspellings in the written English of
Kikuyu speakers. Journal of Language, Technology & Entrepreneurship in
Africa, 4(2), 1-16.
Nilsen, T. S. (1989). Do You øndəʃtænd? An Error Analysis of Norwegian Students'
Pronunciation of English. In.
Nilsen, T. S. (2002). British and American English Pronunciation (2nd ed.). Oslo:
Universitetsforlaget.

85
Nygaard, A.-M. (2010). An investigation of accuracy in the written English of upper
secondary vocational school students. (MA), University of Stavanger,
Stavanger.
Olsen, S. (1999). Errors and compensatory strategies: a study of grammar and
vocabulary in texts written by Norwegian learners of English. System, 27(2),
191-205. doi:https://doi.org/10.1016/S0346-251X(99)00016-0
Park, C. (2011). Influence of L1 phonological and orthographic system in L2 spelling: A
comparison of korean learners of english and native speaking children. (Doctor
of Philosophy), Ball State University, Muncie, Indiana. Retrieved from
https://search.proquest.com/docview/885864262?accountid=8579
Perfetti, C. A. (1997). The Psycholinguistics of Spelling and Reading. In C. A. Perfetti,
L. Rieben, & M. Fayol (Eds.), Learning to spell: Research, theory, practice
across languages (pp. 21-38). New Jersey: Lawrence Erlbaum Associates.
Perin, D. (1983). Phonemic segmentation and spelling. British Journal of Psychology,
74(1), 129-144. doi:10.1111/j.2044-8295.1983.tb01849.x
Raaen, G. F. (2009). Fluency is for everybody, accuracy for the few, and absolute
accuracy for the very, very few. In B. Groven, T. M. Guldal, O. F. Lillemyr, N.
Naastad, & F. Rønning (Eds.), FoU i Praksis 2008. Rapport fra konferanse om
praksisrettet FoU i lærerutdanning (pp. 307-315). Trondheim: Tapir Akademisk
Forlag.
Raaen, G. F. (2010). A comparison of basic English skills in 7th and 10th grade. In T.
M. Guldal, C. F. Dons, S. Sagberg, T. Solhaug, & R. Tromsdal (Eds.), FoU I
Praksis 2009. Rapport fra konferanse om praksisrettet FoU i lærerutdanning
(pp. 205-213). Trondheim: Tapir Akademisk Forlag.
Raaen, G. F., & Guldal, T. M. (2012). Basic skills: orthography and sentence
complexity in written English from grades 7 to 10. In A. Hasselgreen, I. Drew,
& B. Sørheim (Eds.), The Young Language Learner. Research-based insights
into Teaching and Learning (pp. 101-117). Bergen: Fagbokforlaget.
Read, C., & Treiman, R. (2013). Children's Invented Spelling: What We Have Learned
in Forty Years*. In M. Piattelli-Palmarini & R. C. Berwick (Eds.), Rich
languages from poor inputs (pp. 197-211). Oxford: Oxford University Press.
Rugesæter, K. P. N. (2012). Phonological competence in English among Norwegian
pupils and implications for the teaching of pronunciation in the English
classroom. In A. Hasselgreen, I. Drew, & B. Sørheim (Eds.), The Young
Language Learner. Research-based Insights into Teaching and Learning. (pp.
119-130). Bergen: Fagbokforlaget.
Rugesæter, K. P. N. (2014). Difficult contrasts: an analysis of phonemic distinctions in
the English of young Norwegian learners seen against the backdrop of incidental
foreign language learning. Acta Didactica Norge-tidsskrift for fagdidaktisk
forsknings-og utviklingsarbeid i Norge.
Ryan, D. (2018). Principles of English spelling formation. (PhD), Trinity College,
Dublin.

86
Sayeski, K. L., Earle, G. A., Eslinger, R. P., & Whitenton, J. N. (2017). Teacher
candidates’ mastery of phoneme-grapheme correspondence: massed versus
distributed practice in teacher education. Annals of Dyslexia, 67(1), 26-41.
Selinker, L. (1972). Interlanguage. In IRAL - International Review of Applied
Linguistics in Language Teaching (Vol. 10, pp. 209).
Shum, K. K.-m., Ho, C. S.-H., Siegel, L. S., & Au, T. K.-f. (2016). First-Language
Longitudinal Predictors of Second-Language Literacy in Young L2 Learners.
Reading Research Quarterly, 51(3), 323-344. doi:10.1002/rrq.139
Skjekkeland, M. (1997). Dei Norske Dialektane. Kristiansand: Høyskoleforlaget.
Sonderman, T. (2004). The influence of first language phonology on second language
spelling. (Master of Arts), Truman State University, Kirksville, Missouri.
Spache, G. (1940). A critical analysis of various methods of classifying spelling errors.
I. Journal of Educational Psychology, 31(2), 111.
Spencer, K. (2007). Predicting children's word-spelling difficulty for common English
words from measures of orthographic transparency, phonemic and graphemic
length and word frequency. British Journal of Psychology, 98(2), 305-338.
doi:10.1348/000712606x123002
Statistics Norway. (26/6/2017). Retrieved from https://www.ssb.no/utdanning/artikler-
og-publikasjoner/hvordan-gar-det-med-innvandrere-og-deres-barn-i-skolen.
Retrieved 10/3 2019
Sun-Alperin, M. K., & Wang, M. (2011). Cross-language transfer of phonological and
orthographic processing skills from Spanish L1 to English L2. Reading and
Writing, 24(5), 591-614. doi:10.1007/s11145-009-9221-7
Swan, M., & Smith, B. (2001). Learner English: A teacher's guide to interference and
other problems (2nd ed.). Cambridge: Cambridge University Press.
Treiman, R. (1985). Phonemic analysis, spelling, and reading. The Development of
Reading Skills, 1985(27), 5-18. doi:10.1002/cd.23219852703
Treiman, R., Berch, D., & Weatherston, S. (1993). Children's use of phoneme-grapheme
correspondences in spelling: Roles of position and stress. Journal of Educational
Psychology, 85(3), 466.
Treiman, R., & Cassar, M. (1997). Spelling Acquisition in English. In C. A. Perfetti, L.
Rieben, & M. Fayol (Eds.), Learning to spell: Research, theory, practice across
languages (pp. 61-80). New Jersey: Lawrence Erlbaum Associates.
Treiman, R., & Kessler, B. (2006). Spelling as statistical learning: Using consonantal
context to spell vowels. Journal of Educational Psychology, 98(3), 642-652.
doi:10.1037/0022-0663.98.3.642
Treiman, R., & Kessler, B. (2016). Choosing between alternative spellings of sounds:
The role of context. Journal of Experimental Psychology: Learning, Memory,
and Cognition, 42(7), 1154-1159. doi:10.1037/xlm0000225
Utdanningsdirektoratet. (2013). English subject curriculum (ENG1-03). Retrieved from
https://www.udir.no/kl06/ENG1-

87
03/Hele/Komplett_visning?lplang=http://data.udir.no/kl06/eng?depth=0.
Retrieved 30/11 2018
van Berkel, A. (2004). Learning to Spell in English as a Second Language.
International Review of Applied Linguistics in Language Teaching (IRAL),
42(3), 239-257. doi:10.1515/iral.2004.012
van Berkel, A. (2005). The role of the phonological strategy in learning to spell in
English as a second language. In V. Cook & B. Bassetti (Eds.), Second
Language Writing Systems (pp. 97-121). Clevedon: Multilingual Matters.
Veiteberg, J. (1996). Læreplanverket for den 10-årige grunnskolen. Oslo: Nasjonalt
læremiddelsenter.
Venezky, R. L. (1970). The Structure of English Orthography. Berlin: De Gruyter.
Venezky, R. L. (1999). The American way of spelling: The structure and origins of
American English orthography. New York: Guilford Press.
Wang, M., & Geva, E. (2003). Spelling acquisition of novel English phonemes in
Chinese children. Reading and Writing, 16(4), 325-348.
doi:10.1023/a:1023661927929
Weber, P., Kozel, N., Purgstaller, C., Kargl, R., Schwab, D., & Fink, A. (2013). First
and second language in the brain: Neuronal correlates of language processing
and spelling strategies. Brain and Language, 124(1), 22-33.
doi:https://doi.org/10.1016/j.bandl.2012.11.010
Wells, J. C. (Ed.) (2008) Longman Pronunciation Dictionary (3rd ed.). Harlow:
Pearson Education.
Yeong, S. H. M., & Liow, S. J. R. (2010). Phonemic Representation and Early Spelling
Errors in Bilingual Children. Scientific Studies of Reading, 14(5), 387-406.
doi:10.1080/10888431003623538


