
The seasonal sensitivity of Cyanobacteria and otherphytoplankton to changes in flushing rate andwater temperature
J . A L E X E L L I O T T
Centre for Ecology and Hydrology Lancaster, Algal Modelling Unit, Lake Ecosystem Group, Library Avenue, Bailrigg,
Lancashire LA1 4AP, UK
Abstract
The phytoplankton lake community model PROTECH (Phytoplankton RespOnses To
Environmental CHange) was applied to the eutrophic lake, Esthwaite Water (United
Kingdom). It was validated against monitoring data from 2003 and simulated well the
seasonal pattern of total chlorophyll, diatom chlorophyll and Cyanobacteria chlorophyll
with respective R2-values calculated between observed and simulated of 0.68, 0.72 and
0.77 (all Po0.01). This simulation was then rerun through various combinations of
factorized changes covering a range of half to double the flushing rate and from �1 to
1 4 1C changes in water temperature. Their effect on the phytoplankton was measured as
annual, spring, summer and autumn means of the total and species chlorophyll
concentrations. In addition, Cyanobacteria mean percentage abundance (%Cb) and
maximum percentage abundance (Max %Cb) was recorded, as were the number of days
that Cyanobacteria chlorophyll concentration exceed two World Health Organization
(WHO) derived risk thresholds (10 and 50 mg m�3). The phytoplankton community was
dominated in the year by three of the eight phytoplankton simulated. The vernal bloom
of the diatom Asterionella showed little annual or seasonal response to the changing
drivers but this was not the case for the two Cyanobacteria that also dominated,
Anabaena and Aphanizomenon. These Cyanobacteria showed enhanced abundance,
community dominance and increased duration above the highest WHO risk threshold
with increasing water temperature and decreasing flushing rate: this effect was greatest
in the summer period. However, the response was ultimately controlled by the avail-
ability of nutrients, particularly phosphorus and nitrogen, with occasional declines in
the latter’s concentration helping the dominance of these nitrogen-fixing phytoplankton.
Keywords: blue–green algae, climate change, eutrophication, phytoplankton, PROTECH, retention
time
Received 11 February 2009; revised version received 7 May 2009 and accepted 27 May 2009
Introduction
In assessing the impact of climate change on organisms,
there has been much focus on the threats to species (e.g.
Visser, 2008), but the reverse is also true in that some
species will inevitably be more successful under
such conditions (e.g. Cumming & Van Vuuren, 2006).
Cyanobacteria (also referred to as blue–green algae) are
a phytoplankton phylum that can deteriorate water
quality through the production of toxins that are harm-
ful to birds and mammals, including humans (Chorus
& Bartram, 1999). In recent years, there has been in-
creasing interest in how climate change could poten-
tially affect the proliferation of harmful Cyanobacteria
blooms in water bodies (e.g. Paerl & Huisman, 2008).
This has mainly focused on the direct effects of
increased water temperature, but some studies have
also highlighted the importance of changes in stratifi-
cation strength and duration (e.g. Jones & Elliott,
2007; Johnk et al., 2008). However, there is also a close
relationship between the hydraulic retention time of the
lake (flushing rate) and Cyanobacteria bloom formation
(Paerl & Huisman, 2008). Significantly, there appears toCorrespondence: J. Alex Elliott, tel. 1 0 152 459 5800, fax 1 01524
61536, e-mail: [email protected]
Global Change Biology (2010) 16, 864–876, doi: 10.1111/j.1365-2486.2009.01998.x
864 r 2009 Blackwell Publishing Ltd
DWR-708
have been no study that has attempted to evaluate the
relative importance of temperature and flushing rate
when applied simultaneously. Therefore, this work
aims to address precisely this question.
The projected changes for air temperature and river
flow across the United Kingdom in general are for an
overall increase in temperature (2–3.5 1C by the 2080s) and
winter flow, with increased likelihood of lower summer
flow (Hulme et al., 2002). However, many UK catchment
level studies using Regional Climate Models (RCMs) have
shown that predicting impacts at such a detailed scale is
particularly challenging given the levels of uncertainty in
the modelled climate drivers (e.g. rainfall) and the heavy
influence catchment topography (e.g. Reynard et al., 2005;
Kay et al., 2006). Therefore, this study uses a method that
tests the sensitivity of a lake’s phytoplankton community
to such climatic changes by perturbing observed weather
data over a range of values. Thus, the sensitivity of the
lake to a wide range of different climatic conditions can be
observed, rather than for just one modelled outcome, with
all its associated uncertainties (i.e. the ‘cascade of uncer-
tainty’; Henderson-Sellers, 1993).
Therefore, the aim of this article is to identify, through
simulation using a phytoplankton lake community
computer model, the sensitivity of the Cyanobacteria
and other phytoplankton to changing flushing rate and
water temperature. This sensitivity is measured at the
annual and seasonal level (spring, summer and au-
tumn) and of particular interest is the response of the
Cyanobacteria, both in terms of the seasonal means but
also their maximum abundance (i.e. the worst day in
terms of related water quality) and World Health Orga-
nization (WHO) abundance thresholds.
It is predicted, in accordance with the perceived view
on factors favourable to Cyanobacteria (Reynolds, 2006;
Paerl & Huisman, 2008) that
(i) higher water temperatures and/or
(ii) lower flushing rates will promote Cyanobacteria
dominance, particularly in the summer/autumn.
Methods
Site description
Esthwaite Water is a small (surface area 1.0 km2, mean
depth 6.4 m, maximum depth 15.5 m (Ramsbottom, 1976)),
eutrophic lake [mean annual phytoplankton chloro-
phyll concentration 13.5 mg m�3 (Maberly et al., 2006)]
situated in northwest England [541210N, 3100W (Reynolds,
1984)] and classed as a Site of Special Scientific Interest
(SSSI) (Talling, 1999). The lake has undergone persistent
eutrophication since the late 1960s (Bennion et al., 2000)
and regularly produces Cyanobacteria blooms in the
summer to early autumn consisting mainly of Anabaena
and Aphanizomenon (Heaney et al., 1992).
The historic source of much of the nutrient enrichment
has been point derived, with 460% of the total phos-
phorus load originating from the local sewage works
before stripping was added in 1986 (Talling & Heaney,
1988). However, recovery has been complicated by the
addition of a fish farm and internal phosphorus fluxes
(Heaney et al., 1992). The estimated annual mean hydrau-
lic retention time is ca.90 days (Talling & Heaney, 1988).
Data
The driving and validation data for the simulations
were all taken from 2003 as this year provided a good
set of data for both driving and validating the model, as
well as shown the typical patterns of thermal structure
and phytoplankton development for this lake. Daily
measurements of the outflow (Cunsey Beck) and the
main inflow (Black Beck) discharges were available
(annual retention time for 2003 of 104 days) and, for
Black Beck, fortnightly soluble reactive phosphorus
(SRP), nitrate-nitrogen and silica concentrations were
available. Fortnightly in-lake water temperature, SRP,
nitrate-nitrogen, silica and chlorophyll a concentrations
(integrated over the top 5 m), including phytoplankton
species counts, were also available for the same period.
The latter count data were converted to chlorophyll a
estimates using cell volume to chlorophyll a relation-
ships given by Reynolds (1984). This method, while
being potentially a considerable source of error, was
necessary for comparison with the model output and
the data should be regarded as a rough, semiquantita-
tive estimate of the relative importance of certain taxa
during the year.
Daily meteorological data were drawn from two
sources: wind speed and air temperature were mea-
sured on site at a shore meteorological station, while
cloud cover (oktas) estimates were from a meteorologi-
cal station situated 7 km away.
PROTECH model description
The phytoplankton community model used is called
Phytoplankton RespOnses To Environmental CHange
(PROTECH); (Reynolds et al., 2001). It is a process-based
model that simulates the daily growth of multiple phy-
toplankton types throughout the water column. The
model has been developed and tested on a wide range
of lakes and reservoirs around the world over the last two
decades (e.g. Elliott et al., 2000, 2005, 2007; Lewis et al.,
2002; Elliott & Thackeray, 2004; Bernhardt et al., 2008).
The biological component of PROTECH (see Rey-
nolds et al., 2001 for a full description) has at its heart
A L G A L S E N S I T I V I T Y T O F L U S H I N G A N D T E M P E R A T U R E 865
r 2009 Blackwell Publishing Ltd, Global Change Biology, 16, 864–876
DWR-708

a simple equation that determines the daily change in
the chlorophyll a concentration (DX/Dt, mg m�3 day�1)
of each phytoplankton:
DX=Dt ¼ ðr0 � S� G�DÞX; ð1Þ
where r0 is the growth rate defined as a proportional
increase over 24 h, S is the loss due to settling out of the
water column, G is the loss due to Daphnia grazing
(phytoplankton 450mm are not grazed) and D is the
loss due to dilution. The growth rate (r0, day�1) is
further defined by
r0 ¼ minfr0ðy;IÞ; r0P; r0N; r0Sig; ð2Þ
where r0(y, I) is the growth rate due to temperature and
daily photoperiod and r0P, r0N, r0Si are the growth rates
determined by phosphorus, nitrogen and silicon if their
concentrations are o3.0, 80.0 and 500.0 mg m�3, respec-
tively (Reynolds, 1984). The r0 values are phytoplankton
dependent (e.g. nondiatoms are not limited by silica
concentrations below 500 mg m�3), relating to the mor-
phology of the alga (for r0(y, I)) and, because of the effects
of temperature and light, vary with each time-step
throughout the simulated water-column. Thus, no one
specific summary r0 value exists for a given phytoplank-
ton. Therefore, for each alga within the model, the initial
starting value of X mg chlorophyll a m�3 day�1 [Eqn (1)]
is modified on a daily time-step to predict change in the
chlorophyll a concentration for each phytoplanker in
each layer in the water column (see Reynolds et al., 2001,
for details). Nutrient concentrations in the water col-
umn are modified to reflect uptake due to growth and
daily supply and loss via inflow/outflow exchange. For
all the phytoplankton simulated, it is assumed that
these nutrients are consumed from the water column
in the following stoichiometric ratio of 82 g SiO2 (only if
diatom) : 8.3 g nitrogen : 1.2 g phosphorus : 1 g chloro-
phyll (Stumm & Morgan, 1981).
There is also a phytoplankton-specific movement func-
tion that calculates the position of each alga in the
column, accounting for the movement of the water and
Stoke’s Law (movement down the water column), as well
as the motile/buoyancy properties of some phytoplank-
ton (positive movement up the water column, dependent
upon light intensity for motile phytoplankton).
An initial profile for the water column (containing
temperature, nutrient concentrations and inoculum
sizes for the selected phytoplankton) is defined for
day 1 (equivalent to 1 January in the simulations pre-
sented in this investigation). The daily inoculum was
defined so that the total chlorophyll a for the eight
phytoplankton equalled the nearest observed value to
the start of the year i.e. 0.225 mg m�3 chl a for each
phytoplankton to make a total chlorophyll a of
1.8 mg m�3 chl a. Daily wind speed, cloud cover, river
inflow (including nutrient concentrations) and outflow
data are input to the model and daily insolation is
adjusted depending upon the time of the year latitude
and cloud cover. For each 24 h time-step, the physical
structure of the water column is defined over vertical,
morphologically dependent 0.1 m slices. The extent of
mixing within the water column is calculated by follow-
ing the Monin–Obukhov length calculation (Imberger,
1985), which gives an instantaneous prediction of the
depth at which the buoyancy forces (due to the heat
flux) and the opposing dissipative forces (due to wind
stress) are equal in magnitude. This point corresponds
to the extent of the mixed layer, assuming initial uni-
formity. To test the resistance to mixing of an existing
density structure, it is also necessary to apply a Wed-
derburn test, which incorporates a term for the accu-
mulated density difference between the water at the
surface and at any nominated depth. At each iteration,
the model works down the water column, incorporating
each slice until the accumulated density difference
resists the incorporation: this slice then corresponds to
the depth of the thermocline.
Phytoplankton simulations
Examination of the phytoplankton count data revealed
the numerically abundant phytoplankton types de-
tected in the lake during 2003. This information was
used to select the following PROTECH phytoplankton
for the simulations: Anabaena, Aphanizomenon, Apha-
nothece, Asterionella, Cryptomonas, Plagioselmis, Peridi-
nium and Ceratium (Tables 1 and 2). For initial
calibration, PROTECH output summarized as total,
diatom and Cyanobacteria chlorophyll concentration
in the upper 5 m of water were compared with the
observed data available. This process, in conjunction
with additional examination of in-lake water column
nutrient profiles, indicated a lack of phosphorus in the
simulated lake during the middle of year. PROTECH
does not include equations to simulate the release of
SRP from sediment which is known to be important in
this lake (Drake & Heaney, 1987; Miller et al., 2005),
therefore extra SRP was added to the water column
from 1 June to 31 August. This amounted to an extra
0.44 mg m�3 per 0.1 m layer per day [over a total of 155
layers, i.e. 15.5 m deep lake; roughly equating to
2.8 mg m�2 day�1 and falling within the commonly ob-
served range of 0.5–5 mg m�2 day�1 (Drake & Heaney,
1987)] to produce hypolimnion concentrations similar
to those observed and was the only calibration required
to the initial generic model set-up.
For validation of the simulation, visual comparison
and regression analysis were used to compare total
chlorophyll, as well as the diatom and Cyanobacteria
866 J . A . E L L I O T T
r 2009 Blackwell Publishing Ltd, Global Change Biology, 16, 864–876
DWR-708
biomass simulated. For the latter two variables, it was
necessary to convert the fortnightly observed species
count data from cells per mL to mg chlorophyll a
per m�3. These values were calculated using the cell
volume to chlorophyll a relationships given in Reynolds
(1984) and summed for the dominant taxa in the lake,
i.e. diatoms and Cyanobacteria.
Taking this baseline simulation, the combined effect of
changing retention time and water temperature was
tested by the incremental alteration of these two factors.
This was done by forcing the water temperature through-
out the water column to be between 1 1C cooler to 4 1C
warmer, in 1 1C increments; this provided a realistic range
of past to possible future water temperature in northwest
England (e.g. Elliott et al., 2005; Fowler & Kilsby, 2007). It
should be stressed that this change in temperature did
not alter the original 2003 pattern of stratification, which
was fixed so as to isolate only the direct effect of changing
temperature on the phytoplankton populations. In addi-
tion, the temperature of the inflow discharge was not
allowed to change the lake water temperature. In combi-
nation with these temperature changes, the retention time
of the lake was changed by altering the observed in-
flow and outflow discharge by the following factors: 0.5,
1.0, 1.5 and 2.0, thus creating drier and wetter years;
inflow nutrient concentration was not changed, mimick-
ing the response of a more diffuse nutrient source. For
each permutation, the annual, spring (March–May), sum-
mer (June–August) and autumn (September–November)
mean chlorophyll was calculated for each species and the
total biomass. In addition, the mean and maximum
percentage dominance by Cyanobacteria was also mea-
sured for both the year and the seasons defined above.
Finally, the WHO guidelines for Cyanobacteria
blooms (Chorus & Bartram, 1999) were used to calcu-
late the number of days when key threshold levels
were passed. Thus, two levels were set with the first
representing number of days with 410 mg m�3 Cyano-
bacteria chlorophyll a (low risk) and the second
for moderate risk when Cyanobacteria chlorophyll a
exceeded 50 mg m�3.
Results
Comparison with observed data
The simulated total chlorophyll a matched well to the
measured data (Fig. 1a), showing a tendency to repro-
duce the many bloom peaks; this was reflected in a high
R2 of 0.68 (Po0.01). This level of good fit was also
replicated at the taxonomic level, producing excellent
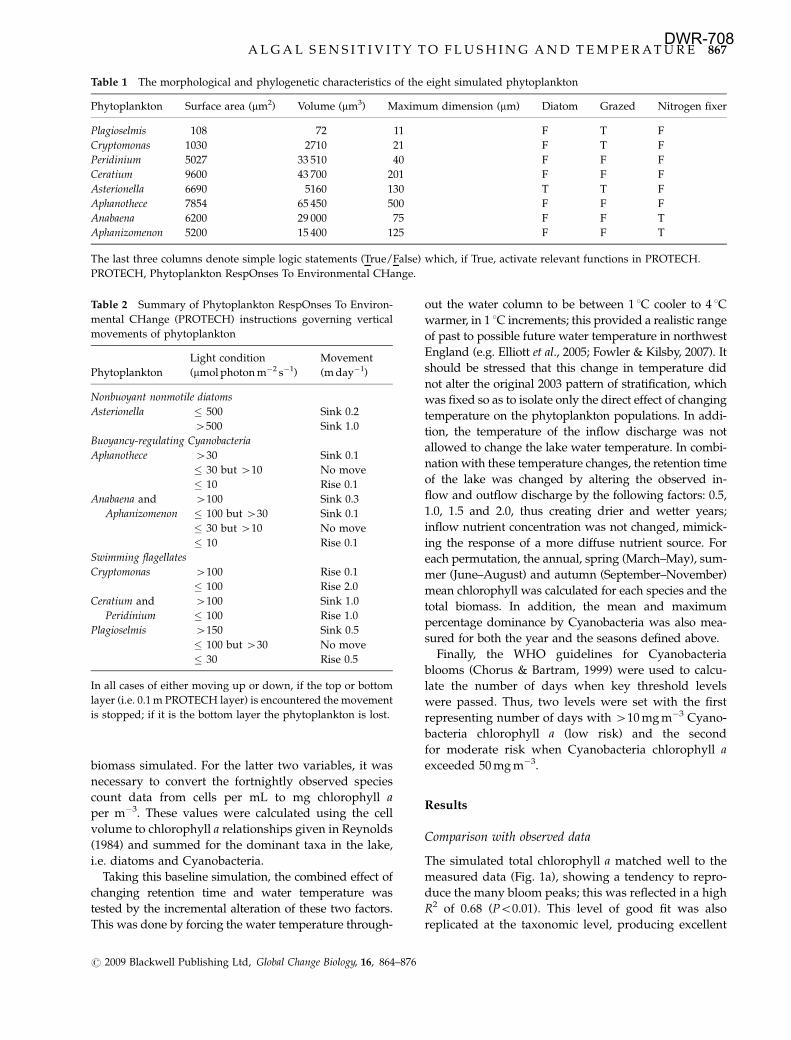
Table 1 The morphological and phylogenetic characteristics of the eight simulated phytoplankton
Phytoplankton Surface area (mm2) Volume (mm3) Maximum dimension (mm) Diatom Grazed Nitrogen fixer
Plagioselmis 108 72 11 F T F
Cryptomonas 1030 2710 21 F T F
Peridinium 5027 33 510 40 F F F
Ceratium 9600 43 700 201 F F F
Asterionella 6690 5160 130 T T F
Aphanothece 7854 65 450 500 F F F
Anabaena 6200 29 000 75 F F T
Aphanizomenon 5200 15 400 125 F F T
The last three columns denote simple logic statements (True/False) which, if True, activate relevant functions in PROTECH.
PROTECH, Phytoplankton RespOnses To Environmental CHange.
Table 2 Summary of Phytoplankton RespOnses To Environ-
mental CHange (PROTECH) instructions governing vertical
movements of phytoplankton
Phytoplankton
Light condition
(mmol photon m�2 s�1)
Movement
(m day�1)
Nonbuoyant nonmotile diatoms
Asterionella � 500 Sink 0.2
4500 Sink 1.0
Buoyancy-regulating Cyanobacteria
Aphanothece 430 Sink 0.1
� 30 but 410 No move
� 10 Rise 0.1
Anabaena and
Aphanizomenon
4100 Sink 0.3
� 100 but 430 Sink 0.1
� 30 but 410 No move
� 10 Rise 0.1
Swimming flagellates
Cryptomonas 4100 Rise 0.1
� 100 Rise 2.0
Ceratium and
Peridinium
4100 Sink 1.0
� 100 Rise 1.0
Plagioselmis 4150 Sink 0.5
� 100 but 430 No move
� 30 Rise 0.5
In all cases of either moving up or down, if the top or bottom
layer (i.e. 0.1 m PROTECH layer) is encountered the movement
is stopped; if it is the bottom layer the phytoplankton is lost.
A L G A L S E N S I T I V I T Y T O F L U S H I N G A N D T E M P E R A T U R E 867
r 2009 Blackwell Publishing Ltd, Global Change Biology, 16, 864–876
DWR-708
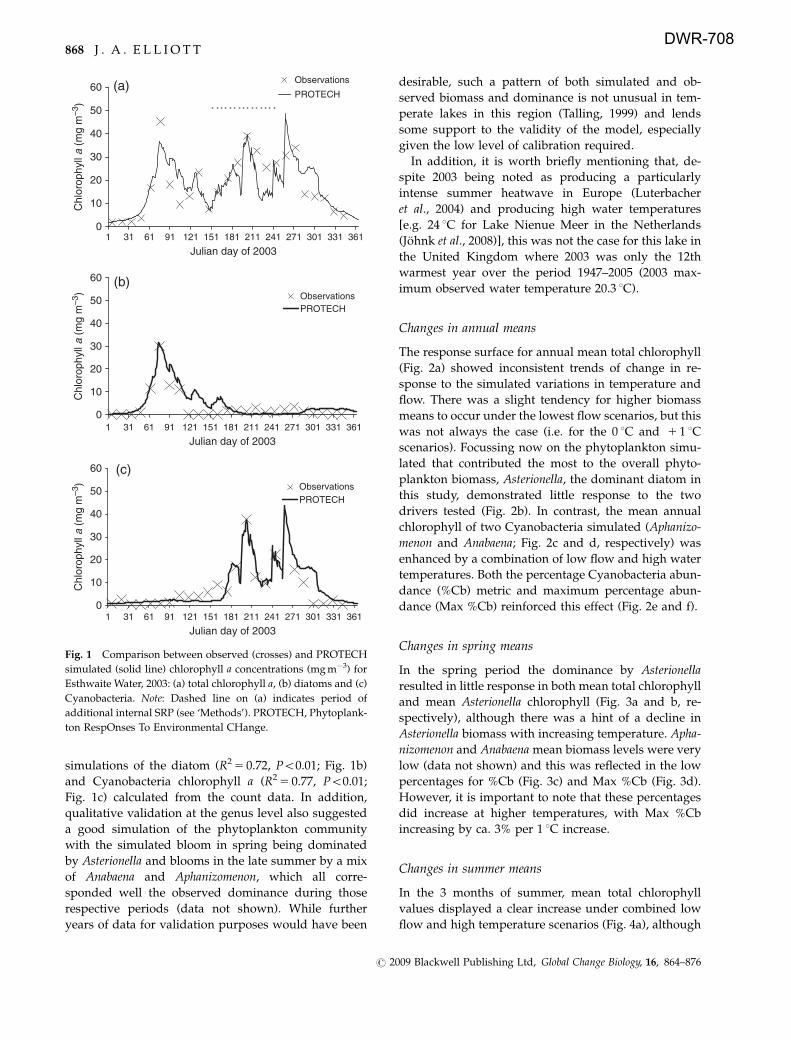
simulations of the diatom (R2 5 0.72, Po0.01; Fig. 1b)
and Cyanobacteria chlorophyll a (R2 5 0.77, Po0.01;
Fig. 1c) calculated from the count data. In addition,
qualitative validation at the genus level also suggested
a good simulation of the phytoplankton community
with the simulated bloom in spring being dominated
by Asterionella and blooms in the late summer by a mix
of Anabaena and Aphanizomenon, which all corre-
sponded well the observed dominance during those
respective periods (data not shown). While further
years of data for validation purposes would have been
desirable, such a pattern of both simulated and ob-
served biomass and dominance is not unusual in tem-
perate lakes in this region (Talling, 1999) and lends
some support to the validity of the model, especially
given the low level of calibration required.
In addition, it is worth briefly mentioning that, de-
spite 2003 being noted as producing a particularly
intense summer heatwave in Europe (Luterbacher
et al., 2004) and producing high water temperatures
[e.g. 24 1C for Lake Nienue Meer in the Netherlands
(Johnk et al., 2008)], this was not the case for this lake in
the United Kingdom where 2003 was only the 12th
warmest year over the period 1947–2005 (2003 max-
imum observed water temperature 20.3 1C).
Changes in annual means
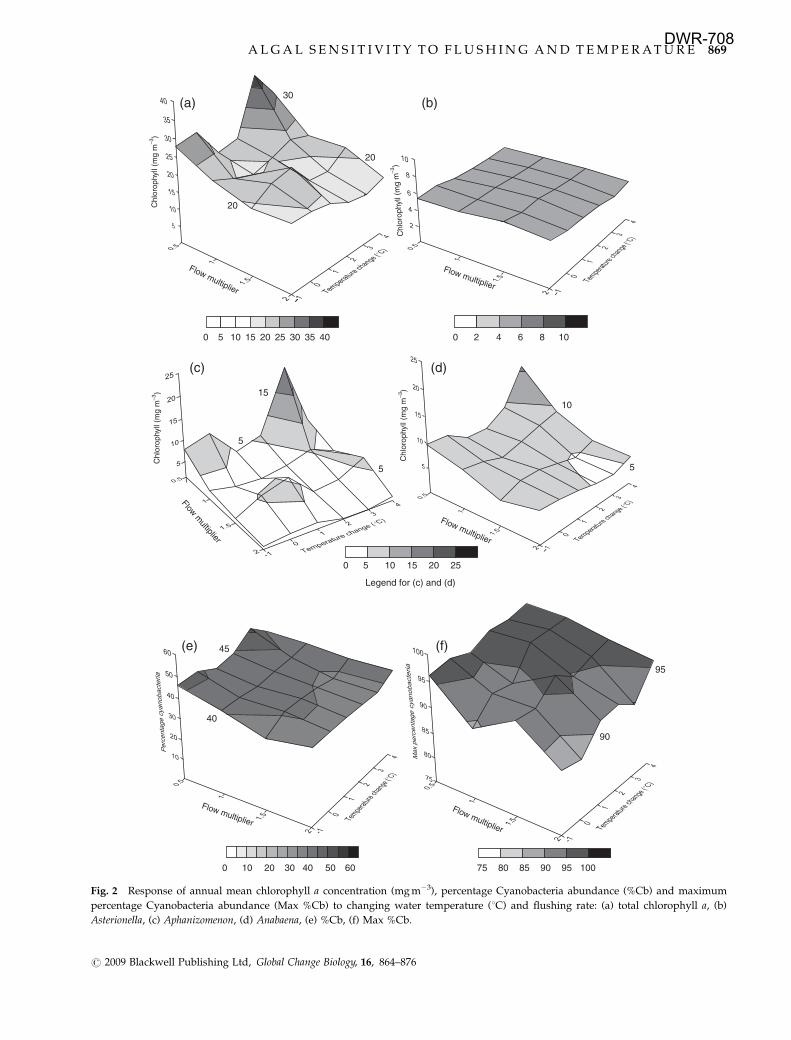
The response surface for annual mean total chlorophyll
(Fig. 2a) showed inconsistent trends of change in re-
sponse to the simulated variations in temperature and
flow. There was a slight tendency for higher biomass
means to occur under the lowest flow scenarios, but this
was not always the case (i.e. for the 0 1C and 1 1 1C
scenarios). Focussing now on the phytoplankton simu-
lated that contributed the most to the overall phyto-
plankton biomass, Asterionella, the dominant diatom in
this study, demonstrated little response to the two
drivers tested (Fig. 2b). In contrast, the mean annual
chlorophyll of two Cyanobacteria simulated (Aphanizo-
menon and Anabaena; Fig. 2c and d, respectively) was
enhanced by a combination of low flow and high water
temperatures. Both the percentage Cyanobacteria abun-
dance (%Cb) metric and maximum percentage abun-
dance (Max %Cb) reinforced this effect (Fig. 2e and f).
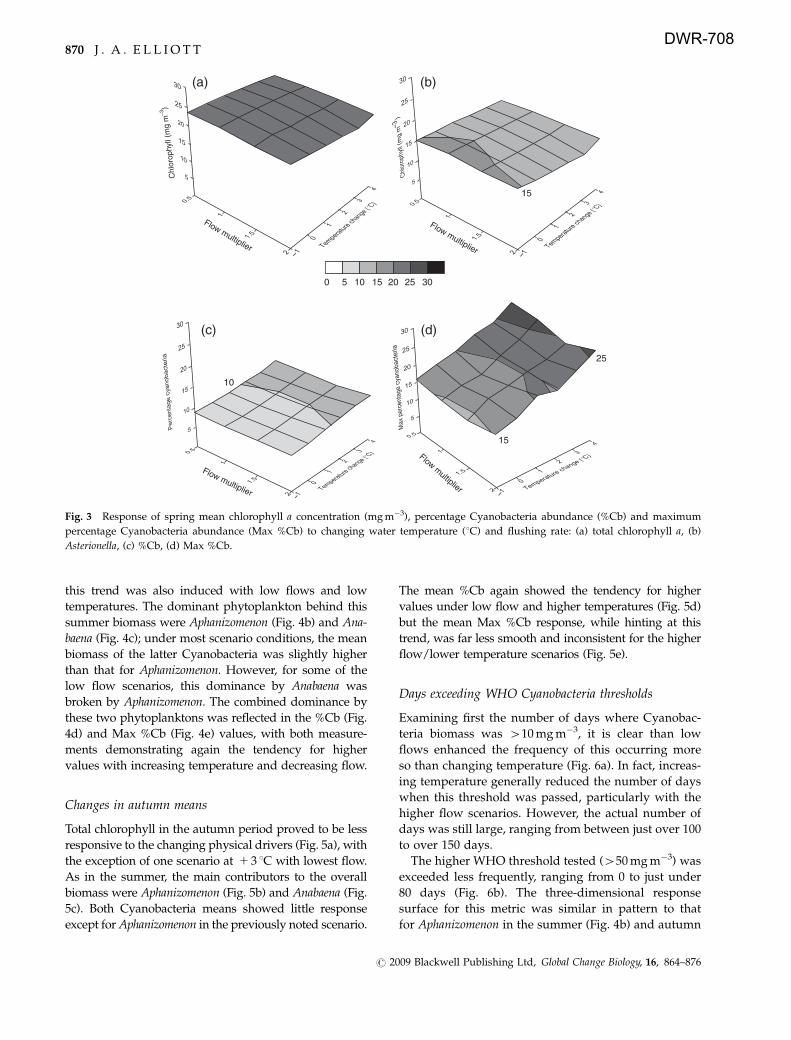
Changes in spring means
In the spring period the dominance by Asterionella
resulted in little response in both mean total chlorophyll
and mean Asterionella chlorophyll (Fig. 3a and b, re-
spectively), although there was a hint of a decline in
Asterionella biomass with increasing temperature. Apha-
nizomenon and Anabaena mean biomass levels were very
low (data not shown) and this was reflected in the low
percentages for %Cb (Fig. 3c) and Max %Cb (Fig. 3d).
However, it is important to note that these percentages
did increase at higher temperatures, with Max %Cb
increasing by ca. 3% per 1 1C increase.
Changes in summer means
In the 3 months of summer, mean total chlorophyll
values displayed a clear increase under combined low
flow and high temperature scenarios (Fig. 4a), although
0
10
20
30
40
50
60
Julian day of 2003
0
10
20
30
40
50
60
1 31 61 91 121 151 181 211 241 271 301 331 361
Julian day of 2003
Chl
orop
hyll a
(mg
m–3
)C
hlor
ophy
ll a
(mg
m–3
)C
hlor
ophy
ll a
(mg
m–3
)Observations
PROTECH(a)
1 31 61 91 121 151 181 211 241 271 301 331 3610
10
20
30
40
50
60
Julian day of 2003
ObservationsPROTECH
(c)
ObservationsPROTECH
1 31 61 91 121 151 181 211 241 271 301 331 361
(b)
Fig. 1 Comparison between observed (crosses) and PROTECH
simulated (solid line) chlorophyll a concentrations (mg m�3) for
Esthwaite Water, 2003: (a) total chlorophyll a, (b) diatoms and (c)
Cyanobacteria. Note: Dashed line on (a) indicates period of
additional internal SRP (see ‘Methods’). PROTECH, Phytoplank-
ton RespOnses To Environmental CHange.
868 J . A . E L L I O T T
r 2009 Blackwell Publishing Ltd, Global Change Biology, 16, 864–876
DWR-708
0 5 10 15 20 25
0 5 10 15 20 25
30 35 40 0 2 4 6 8 10
Legend for (c) and (d)
0 10 40 50 6020 30 75 80 95 10085 90
(a) (b)
(c) (d)
(e) (f)
30
20
20
5
5
15 10
95
90
40
45
5
Fig. 2 Response of annual mean chlorophyll a concentration (mg m�3), percentage Cyanobacteria abundance (%Cb) and maximum
percentage Cyanobacteria abundance (Max %Cb) to changing water temperature (1C) and flushing rate: (a) total chlorophyll a, (b)
Asterionella, (c) Aphanizomenon, (d) Anabaena, (e) %Cb, (f) Max %Cb.
A L G A L S E N S I T I V I T Y T O F L U S H I N G A N D T E M P E R A T U R E 869
r 2009 Blackwell Publishing Ltd, Global Change Biology, 16, 864–876
DWR-708
this trend was also induced with low flows and low
temperatures. The dominant phytoplankton behind this
summer biomass were Aphanizomenon (Fig. 4b) and Ana-
baena (Fig. 4c); under most scenario conditions, the mean
biomass of the latter Cyanobacteria was slightly higher
than that for Aphanizomenon. However, for some of the
low flow scenarios, this dominance by Anabaena was
broken by Aphanizomenon. The combined dominance by
these two phytoplanktons was reflected in the %Cb (Fig.
4d) and Max %Cb (Fig. 4e) values, with both measure-
ments demonstrating again the tendency for higher
values with increasing temperature and decreasing flow.
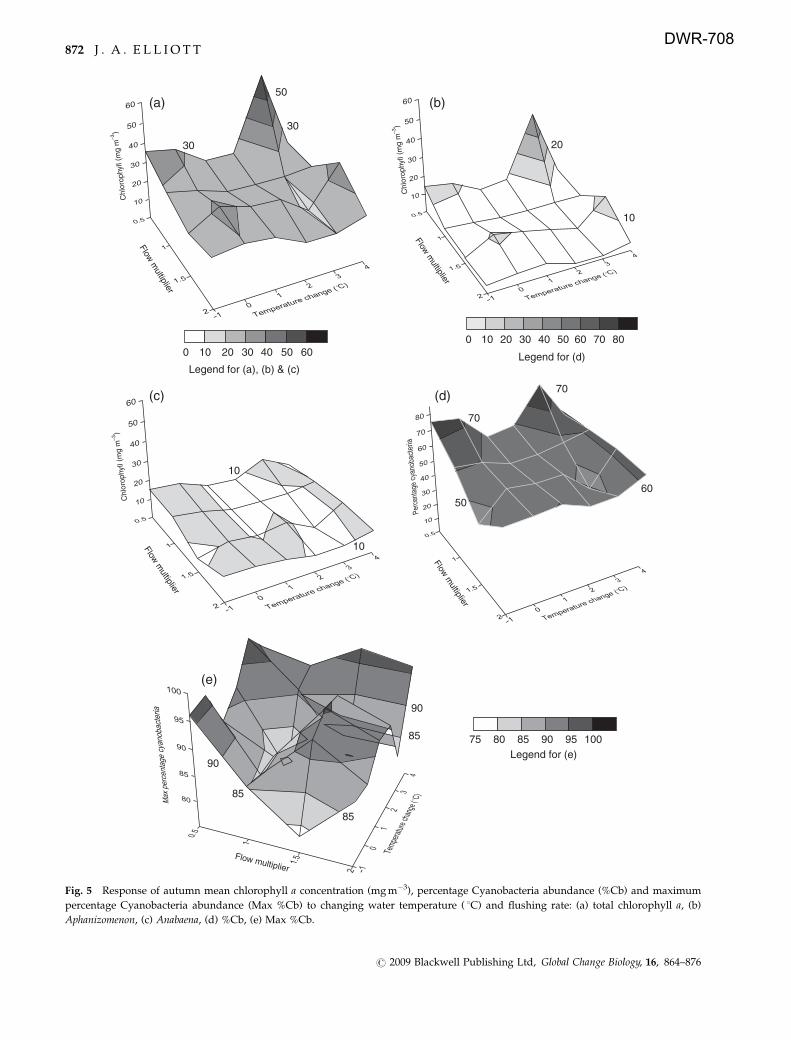
Changes in autumn means
Total chlorophyll in the autumn period proved to be less
responsive to the changing physical drivers (Fig. 5a), with
the exception of one scenario at 1 3 1C with lowest flow.
As in the summer, the main contributors to the overall
biomass were Aphanizomenon (Fig. 5b) and Anabaena (Fig.
5c). Both Cyanobacteria means showed little response
except for Aphanizomenon in the previously noted scenario.
The mean %Cb again showed the tendency for higher
values under low flow and higher temperatures (Fig. 5d)
but the mean Max %Cb response, while hinting at this
trend, was far less smooth and inconsistent for the higher
flow/lower temperature scenarios (Fig. 5e).
Days exceeding WHO Cyanobacteria thresholds
Examining first the number of days where Cyanobac-
teria biomass was 410 mg m�3, it is clear than low
flows enhanced the frequency of this occurring more
so than changing temperature (Fig. 6a). In fact, increas-
ing temperature generally reduced the number of days
when this threshold was passed, particularly with the
higher flow scenarios. However, the actual number of
days was still large, ranging from between just over 100
to over 150 days.
The higher WHO threshold tested (450 mg m�3) was
exceeded less frequently, ranging from 0 to just under
80 days (Fig. 6b). The three-dimensional response
surface for this metric was similar in pattern to that
for Aphanizomenon in the summer (Fig. 4b) and autumn
(a) (b)
(c) (d)
2520151050 30
15
10
25
15
Fig. 3 Response of spring mean chlorophyll a concentration (mg m�3), percentage Cyanobacteria abundance (%Cb) and maximum
percentage Cyanobacteria abundance (Max %Cb) to changing water temperature (1C) and flushing rate: (a) total chlorophyll a, (b)
Asterionella, (c) %Cb, (d) Max %Cb.
870 J . A . E L L I O T T
r 2009 Blackwell Publishing Ltd, Global Change Biology, 16, 864–876
DWR-708

0 302010 40 50 60 70 80Legend for (a), (b), (c)and (d)
100 9590858075
Legend for (e)
(a)
(c)
(e)
60
20
40
(b)
20
20
40
(d)
80
70
60
95
85
Fig. 4 Response of summer mean chlorophyll a concentration (mg m�3), percentage Cyanobacteria abundance (%Cb) and maximum
percentage Cyanobacteria abundance (Max %Cb) to changing water temperature ( 1C) and flushing rate: (a) total chlorophyll a, (b)
Aphanizomenon, (c) Anabaena, (d) %Cb, (e) Max %Cb.
A L G A L S E N S I T I V I T Y T O F L U S H I N G A N D T E M P E R A T U R E 871
r 2009 Blackwell Publishing Ltd, Global Change Biology, 16, 864–876
DWR-708
100 60 504020 30100 60 504020 30
Legend for (a), (b) & (c)
100 9590858075Legend for (e)
(a) (b)
(c) (d)
(e)
50
30
30 20
10
90
90
85
85
85
80
Legend for (d)
10
10
70
50
70
70
60
Fig. 5 Response of autumn mean chlorophyll a concentration (mg m�3), percentage Cyanobacteria abundance (%Cb) and maximum
percentage Cyanobacteria abundance (Max %Cb) to changing water temperature ( 1C) and flushing rate: (a) total chlorophyll a, (b)
Aphanizomenon, (c) Anabaena, (d) %Cb, (e) Max %Cb.
872 J . A . E L L I O T T
r 2009 Blackwell Publishing Ltd, Global Change Biology, 16, 864–876
DWR-708
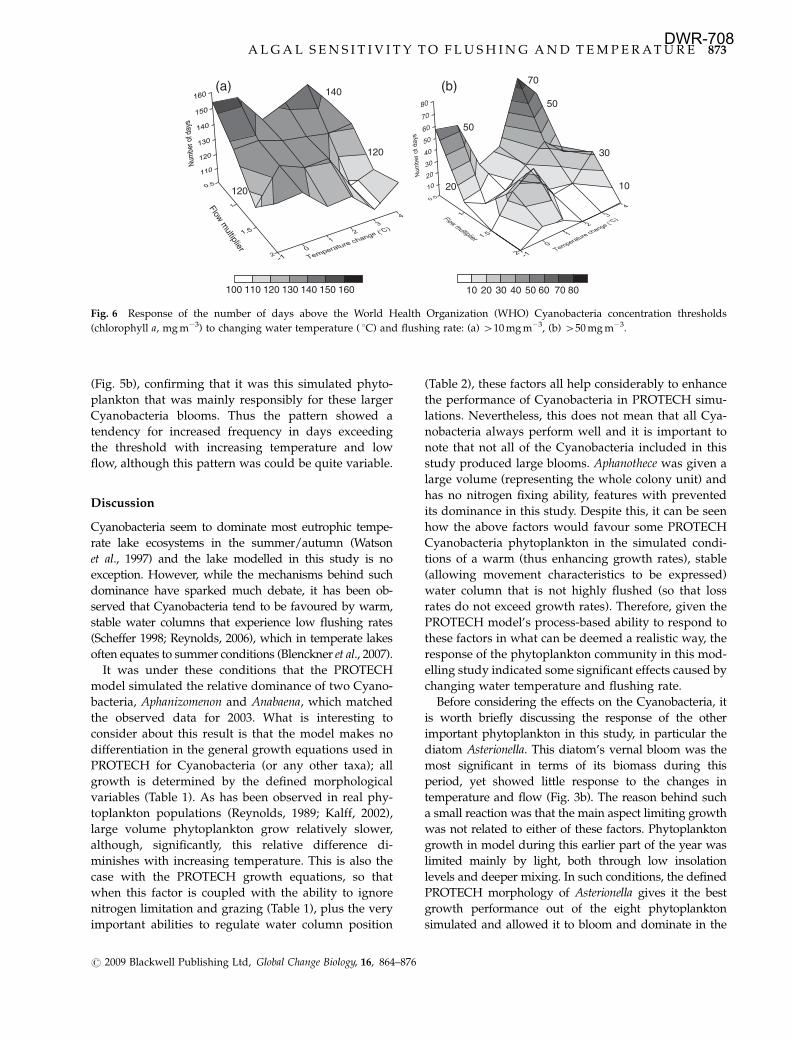
(Fig. 5b), confirming that it was this simulated phyto-
plankton that was mainly responsibly for these larger
Cyanobacteria blooms. Thus the pattern showed a
tendency for increased frequency in days exceeding
the threshold with increasing temperature and low
flow, although this pattern was could be quite variable.
Discussion
Cyanobacteria seem to dominate most eutrophic tempe-
rate lake ecosystems in the summer/autumn (Watson
et al., 1997) and the lake modelled in this study is no
exception. However, while the mechanisms behind such
dominance have sparked much debate, it has been ob-
served that Cyanobacteria tend to be favoured by warm,
stable water columns that experience low flushing rates
(Scheffer 1998; Reynolds, 2006), which in temperate lakes
often equates to summer conditions (Blenckner et al., 2007).
It was under these conditions that the PROTECH
model simulated the relative dominance of two Cyano-
bacteria, Aphanizomenon and Anabaena, which matched
the observed data for 2003. What is interesting to
consider about this result is that the model makes no
differentiation in the general growth equations used in
PROTECH for Cyanobacteria (or any other taxa); all
growth is determined by the defined morphological
variables (Table 1). As has been observed in real phy-
toplankton populations (Reynolds, 1989; Kalff, 2002),
large volume phytoplankton grow relatively slower,
although, significantly, this relative difference di-
minishes with increasing temperature. This is also the
case with the PROTECH growth equations, so that
when this factor is coupled with the ability to ignore
nitrogen limitation and grazing (Table 1), plus the very
important abilities to regulate water column position
(Table 2), these factors all help considerably to enhance
the performance of Cyanobacteria in PROTECH simu-
lations. Nevertheless, this does not mean that all Cya-
nobacteria always perform well and it is important to
note that not all of the Cyanobacteria included in this
study produced large blooms. Aphanothece was given a
large volume (representing the whole colony unit) and
has no nitrogen fixing ability, features with prevented
its dominance in this study. Despite this, it can be seen
how the above factors would favour some PROTECH
Cyanobacteria phytoplankton in the simulated condi-
tions of a warm (thus enhancing growth rates), stable
(allowing movement characteristics to be expressed)
water column that is not highly flushed (so that loss
rates do not exceed growth rates). Therefore, given the
PROTECH model’s process-based ability to respond to
these factors in what can be deemed a realistic way, the
response of the phytoplankton community in this mod-
elling study indicated some significant effects caused by
changing water temperature and flushing rate.
Before considering the effects on the Cyanobacteria, it
is worth briefly discussing the response of the other
important phytoplankton in this study, in particular the
diatom Asterionella. This diatom’s vernal bloom was the
most significant in terms of its biomass during this
period, yet showed little response to the changes in
temperature and flow (Fig. 3b). The reason behind such
a small reaction was that the main aspect limiting growth
was not related to either of these factors. Phytoplankton
growth in model during this earlier part of the year was
limited mainly by light, both through low insolation
levels and deeper mixing. In such conditions, the defined
PROTECH morphology of Asterionella gives it the best
growth performance out of the eight phytoplankton
simulated and allowed it to bloom and dominate in the
130120110100 140 150 160 10 20 30 40 50 60 70 80
(b)
10
30
50
70
20
50
(a) 140
120
120
Fig. 6 Response of the number of days above the World Health Organization (WHO) Cyanobacteria concentration thresholds
(chlorophyll a, mg m�3) to changing water temperature ( 1C) and flushing rate: (a) 410 mg m�3, (b) 450 mg m�3.
A L G A L S E N S I T I V I T Y T O F L U S H I N G A N D T E M P E R A T U R E 873
r 2009 Blackwell Publishing Ltd, Global Change Biology, 16, 864–876
DWR-708
spring. Thus, a change in water temperature or flow
could do little to increase the predominantly light-limited
biomass produced, nor select for a different phytoplank-
ton to dominate. However, as the year progressed, in-
solation levels increased and, coupled with the onset of
stratification, this situation changed markedly to the
increasing advantage of two Cyanobacteria.
On the whole, the annual, summer and autumn results
showed the general trend of increasing Cyanobacteria
abundance and proportional dominance of the phyto-
plankton community with increasing temperature and
decreasing flow. These predictions are in keeping with
the perceived view on factors favourable to Cyanobacter-
ia (Reynolds, 2006; Paerl & Huisman, 2008). Interestingly,
in two relevant previous studies predicting temperature
effects on Cyanobacteria abundance, the PROTECH mod-
el produced contrasting responses. In the Bassenthwaite
Lake study (Elliott et al., 2006), a marked increase in
Cyanobacteria occurred with an increase in temperature,
in concurrence with the findings presented here. How-
ever, in a study on Loch Leven (Elliott & May, 2008),
increasing temperature had little effect on Cyanobacteria
composition relative to that caused by changing the
phosphorous and nitrogen nutrient supply. These latter
aspects exerted the greater control on the lake phyto-
plankton populations in that study.
While the overall Cyanobacteria pattern appeared uni-
form in response, there was a great deal of variation from
the Cyanobacteria that contributed to it. Aphanizomenon
and Anabaena sometimes codominated and other times
one prevailed over the other. While replicating the over-
all Cyanobacteria trends, their individual mean chloro-
phyll response surfaces created by the varying scenarios
did produce occasional spikes in response to certain
combinations. The driver behind such spikes was nutri-
ent supply, which was why they occurred more
frequently with the low flow scenarios. Under such
conditions in the summer, nutrient recharge of phos-
phorus and nitrogen from the inflow was very low,
considering the growth potential of the system at such
a time of year, thus internal phosphorus supply became a
more important source. Furthermore, while this internal
release went some way towards supplying the phyto-
plankton’s phosphorus demands, nitrogen levels were
not as easily replenished, affirming the adaptive advan-
tage of the nitrogen-fixing phytoplankton (i.e. Aphanizo-
menon and Anabaena). This factor, in addition to them
both having identical movement characteristics in PRO-
TECH, left the two phytoplankton in close competition in
the simulations. Thus, the dominance of one over the
other to form a large bloom was left to other interactive
factors such as light limitation through self-shading, a
factor that proven to be important, if difficult to predict,
in previous PROTECH studies (Elliott et al., 2001).
Finally, the WHO guideline thresholds provided a
measure of the total number of days where water
quality could be threatened by Cyanobacteria growth.
For the lower threshold, an increase in number of days
occurred with low flows, aping the patterns seen in the
%Cb and Max %Cb, however, this was not the case with
increasing temperature and higher flows (Fig. 6a). This
meant that, despite %Cb and Max %Cb generally
increasing with temperature regardless of flow (e.g.
Fig. 2), the number of days above this threshold de-
clined, indicating a fall in overall biomass production
under these conditions. This occurred because the
blooms were less prolonged and collapsed due to
nutrient limitation caused by the general increase in
community growth rate due to increased temperature
and the increased pressure from flushing losses. Despite
this, the Cyanobacteria blooms were still dominant, if of
reduced duration, under these conditions. This was
clear from the higher threshold data, which showed
an increased number of days above this threshold with
higher temperatures.
In summary, the study has clearly shown that low
flows and high temperatures favour the dominance and
bloom formation of Cyanobacteria. Across the range of
factors tested, both stressors seem to equally promote
Cyanobacteria dominance. Furthermore, given that the
summer and autumn period proved to be the most
sensitive to these factors, the results also demonstrate
that droughts in these seasons will be more important in
the future than in the winter and spring. This is im-
portant result because current predictions for the north-
west England are for decreasing river flow in the
summer (Fowler & Kilsby, 2007) and, in addition, by
using statistical trend analysis of the past climate it was
predicted specifically for Esthwaite Water that summer
surface temperatures could increase by over 2 1C by the
2050s (George et al., 2007). However, it should be noted
that internal release of phosphorus in this eutrophic
lake was an important influence by providing nutrients
for the growth demand that could not have been met
under the low flow conditions, e.g. with half flow rate in
the summer, retention time increased to nearly 2 years
greatly slowing down the recharge of in-lake nutrients
via catchment input. Combined with the importance of
nitrogen in triggering dominance by the nitrogen fixing
phytoplankton in this study, it can be seen the nutrients
are still very important in shaping the carrying capacity
of the phytoplankton and their responses, within this
envelope, to these climate related drivers. Thus, it is
possible that making general predictions about Cyano-
bacteria populations in lakes and reservoirs over a wide
area (e.g. a country, region or continent) will remain
challenging given the large influence nonclimatic local
factors can have upon these important phytoplankton.
874 J . A . E L L I O T T
r 2009 Blackwell Publishing Ltd, Global Change Biology, 16, 864–876
DWR-708

However, further studies utilizing data from other lakes
and years are warranted to test this view.
Acknowledgements
Thanks are extended to the British Atmospheric Data Centre andMr B. C. Tebay for providing the meteorological data, the Envir-onmental Agency for providing the flow data. Special thanks aregiven to my colleagues in CEH for collecting the other data used,in particular Stephen Maberly for assembling the nutrient data andStephen Thackeray for his useful comments. In this study, A. E.was funded by NERC Research Grant NE/E009328/1.
References
Bennion H, Monteith D, Appleby P (2000) Temporal and geo-
graphical variation in lake trophic status in the English Lake
District: evidence from (sub)fossil diatoms and aquatic macro-
phytes. Freshwater Biology, 45, 394–412.
Bernhardt J, Elliott JA, Jones ID (2008) Modelling the effects on
phytoplankton communities of changing mixed depth and
background extinction coefficient on three contrasting lakes
in the English Lake District. Freshwater Biology, 53, 2573–2586.
Blenckner T, Adrian R, Livingstone DM et al. (2007) Large-scale
climatic signatures in lakes across Europe: a meta-analysis.
Global Change Biology, 13, 1314–1326.
Chorus I, Bartram J (eds) (1999) Toxic Cyanobacteria In Water: A
Guide To Their Public Health Consequences, Monitoring And
Management, WHO Report. E&FN Spon, London.
Cumming GS, Van Vuuren DP (2006) Will climate change affect
ectoparasite species ranges? Global Ecology and Biogeography,
15, 486–497.
Drake JC, Heaney SI (1987) Occurrence of phosphorus and its
potential remobilization in the littoral sediments of a produc-
tive lake. Freshwater Biology, 17, 513–523.
Elliott JA, Irish AE, Reynolds CS (2001) The effects of vertical
mixing on a phytoplankton community: a modelling approach
to the Intermediate Disturbance Hypothesis. Freshwater Biol-
ogy, 46, 1291–1297.
Elliott JA, Irish AE, Reynolds CS, Tett P (2000) Modelling fresh-
water phytoplankton communities; an exercise in validation.
Ecological Modelling, 128, 19–26.
Elliott JA, Jones ID, Thackeray SJ (2006) Testing the sensitivity of
phytoplankton communities to changes in water temperature and
nutrient load, in a temperate lake. Hydrobiologia, 559, 401–411.
Elliott JA, May L (2008) The sensitivity of phytoplankton in Loch
Leven (UK) to changes in nutrient load and water tempera-
ture. Freshwater Biology, 53, 32–41.
Elliott JA, Persson I, Thackeray SJ, Blenckner T (2007) Phytoplank-
ton modelling of Lake Erken, Sweden by linking the models
PROBE and PROTECH. Ecological Modelling, 202, 421–426.
Elliott JA, Thackeray SJ (2004) The simulation of phytoplankton
in shallow and deep lakes using PROTECH. Ecological Model-
ling, 178, 357–369.
Elliott JA, Thackeray SJ, Huntingford C, Jones RG (2005) Com-
bining a Regional Climate Model with a phytoplankton com-
munity model to predict future changes in phytoplankton in
lakes. Freshwater Biology, 50, 1404–1411.
Fowler HJ, Kilsby CG (2007) Using regional climate model data
to simulate historical and future river flows in northwest
England. Climatic Change, 80, 337–367.
George G, Hurley M, Hewitt D (2007) The impact of climate
change on the physical characteristics of the larger lakes in the
English Lake District. Freshwater Biology, 52, 1647–1666.
Heaney SI, Corry JE, Lishman JP (1992) Changes of water quality
and sediment phosphorus of a small productive lake following
decreased phosphorus loading. In: Eutrophication: Research and
Application to Water Supply (eds Sutcliffe DW, Jones JG),
pp. 119–131. Freshwater Biological Association, Ambleside.
Henderson-Sellers A (1993) An antipodean climate of uncer-
tainty?. Climatic Change, 25, 203–224.
Hulme M, Jenkins GJ, Lu X et al. (2002) Climate Change Scenarios
for the United Kingdom: The UKCIP02 Scientific Report. Tyndall
Centre for Climate Change Research, School of Environmental
Sciences, University of East Anglia, Norwich, UK.
Imberger J (1985) The diurnal mixed layer. Limnology and Ocea-
nography, 30, 737–770.
Johnk K, Huisman J, Sharples J, Sommeijer B, Visser PM, Stroom
JM (2008) Summer heatwaves promote blooms of harmful
cyanobacteria. Global Change Biology, 14, 495–512.
Jones ID, Elliott JA (2007) Modelling the effects of changing
retention time on abundance and composition of phyto-
plankton species in a small lake. Freshwater Biology, 52,
988–997.
Kalff J (2002) Limnology. Prentice Hall, New Jersey, USA.
Kay AL, Jones RG, Reynard NS (2006) RCM rainfall for UK flood
frequency estimation. II. Climate change results. Journal of
Hydrology, 318, 163–172.
Lewis DM, Elliott JA, Lambert MF, Reynolds CS (2002) The simula-
tion of an Australian reservoir using a phytoplankton community
model (PROTECH). Ecological Modelling, 150, 107–116.
Luterbacher J, Dietrich D, Xoplaki E, Grosjean M, Wanner H
(2004) European seasonal and annual temperature variability,
trends, and extremes since 1500. Science, 303, 1499–1503.
Maberly SC, De Ville MM, Thackeray SJ et al. (2006) A survey of
the Lakes of the English Lake District: The Lakes Tour 2005. NERC/
Centre for Ecology and Hydrology, Lancaster, UK.
Miller H, Jones I, Folkard A, Maberly S (2005) The vertical
distribution of soluble reactive phosphorus in the water column
of Esthwaite Water and the effect of physical variables. In: 9th
Workshop on Physical Processes in Natural Waters (ed. Folkard A,
Jones I), pp. 183–190. Lancaster University, Lancaster.
Paerl HW, Huisman J (2008) Blooms like it hot. Science, 320, 57–58.
Ramsbottom AE (1976) Depth Charts of the Cumbrian Lakes. Fresh-
water Biological Association, Kendal, UK.
Reynard NS, Crooks SM, Kay AL (2005) Impact of Climate Change
on Flood Flows in River Catchments – Final Report. Environment
Agency, Bristol.
Reynolds CS (1984) The Ecology of Freshwater Phytoplankton. Cam-
bridge University Press, Cambridge, UK.
Reynolds CS (1989) Physical determinants of phytoplankton
succession. In: Plankton Ecology (ed. Sommer U), pp. 9–55.
Brock-Springer, New York.
Reynolds CS (2006) The Ecology of Phytoplankton: Ecology, Biodi-
versity and Conservation. Cambridge University Press, Cam-
bridge, UK.
A L G A L S E N S I T I V I T Y T O F L U S H I N G A N D T E M P E R A T U R E 875
r 2009 Blackwell Publishing Ltd, Global Change Biology, 16, 864–876
DWR-708

Reynolds CS, Irish AE, Elliott JA (2001) The ecological basis for
simulating phytoplankton responses to environmental change
(PROTECH). Ecological Modelling, 140, 271–291.
Scheffer M (1998) Ecology of Shallow Lakes. Chapman and Hall,
London.
Stumm W, Morgan JJ (1981) Aquatic Chemistry, 2nd edn. Wiley,
New York.
Talling JF (1999) Some English Lakes as Diverse and Active Ecosys-
tems: A Factual Summary and Source Book. Freshwater Biological
Association, Kendal.
Talling JF, Heaney SI (1988) Long-term changes in some English
(Cumbrian) lakes subjected to increased nutrient inputs. In:
Algae and the Aquatic Environment (ed. Round FE), pp. 1–29.
Biopress Ltd, Bristol.
Visser ME (2008) Keeping up with a warming world; assessing
the rate of adaptation to climate change. Proceedings of the Royal
Society B – Biological Sciences, 275, 649–659.
Watson S, McCauley E, Downing JA (1997) Patterns in phytoplank-
ton taxonomic composition across temperate lakes of differing
nutrient status. Limnology and Oceanography, 42, 487–495.
876 J . A . E L L I O T T
r 2009 Blackwell Publishing Ltd, Global Change Biology, 16, 864–876
DWR-708

This document is a scanned copy of a printed document. No warranty is given about the accuracy of the copy.
Users should refer to the original published version of the material.
DWR-708


