
Biol. Rev. (2013), 88, pp. 745–766. 745doi: 10.1111/brv.12028
The role of fecundity and reproductive effortin defining life-history strategies of NorthAmerican freshwater mussels
Wendell R. Haag∗
US Forest Service, Center for Bottomland Hardwoods Research, Forest Hydrology Laboratory, Oxford, Mississippi, 38655, U.S.A.
ABSTRACT
Selection is expected to optimize reproductive investment resulting in characteristic trade-offs among traits such asbrood size, offspring size, somatic maintenance, and lifespan; relative patterns of energy allocation to these functionsare important in defining life-history strategies. Freshwater mussels are a diverse and imperiled component of aquaticecosystems, but little is known about their life-history strategies, particularly patterns of fecundity and reproductiveeffort. Because mussels have an unusual life cycle in which larvae (glochidia) are obligate parasites on fishes, differencesin host relationships are expected to influence patterns of reproductive output among species. I investigated fecundityand reproductive effort (RE) and their relationships to other life-history traits for a taxonomically broad cross sectionof North American mussel diversity. Annual fecundity of North American mussel species spans nearly four ordersof magnitude, ranging from < 2000 to 10 million, but most species have considerably lower fecundity than previousgeneralizations, which portrayed the group as having uniformly high fecundity (e.g. > 200000). Estimates of RE alsowere highly variable, ranging among species from 0.06 to 25.4%. Median fecundity and RE differed among phylogeneticgroups, but patterns for these two traits differed in several ways. For example, the tribe Anodontini had relatively lowmedian fecundity but had the highest RE of any group. Within and among species, body size was a strong predictor offecundity and explained a high percentage of variation in fecundity among species. Fecundity showed little relationshipto other life-history traits including glochidial size, lifespan, brooding strategies, or host strategies. The only apparenttrade-off evident among these traits was the extraordinarily high fecundity of Leptodea, Margaritifera, and Truncilla, whichmay come at a cost of greatly reduced glochidial size; there was no relationship between fecundity and glochidial sizefor the remaining 61 species in the dataset. In contrast to fecundity, RE showed evidence of a strong trade-off withlifespan, which was negatively related to RE. The raw number of glochidia produced may be determined primarily byphysical and energetic constraints rather than selection for optimal output based on differences in host strategies or othertraits. By integrating traits such as body size, glochidial size, and fecundity, RE appears more useful in defining mussellife-history strategies. Combined with trade-offs between other traits such as growth, lifespan, and age at maturity,differences in RE among species depict a broad continuum of divergent strategies ranging from strongly r-selectedspecies (e.g. tribe Anodontini and some Lampsilini) to K -selected species (e.g. tribes Pleurobemini and Quadrulini;family Margaritiferidae). Future studies of reproductive effort in an environmental and life-history context will be usefulfor understanding the explosive radiation of this group of animals in North America and will aid in the development ofeffective conservation strategies.
Key words: life history, trade-off, fecundity, reproduction, glochidia, unionidae, margaritiferidae, unionoida.
CONTENTS
I. Introduction . . . . . . . . . . . . . . . . . . . . . . . . . . . . . . . . . . . . . . . . . . . . . . . . . . . . . . . . . . . . . . . . . . . . . . . . . . . . . . . . . . . . . . . . . . . . . . . . 746II. Methods . . . . . . . . . . . . . . . . . . . . . . . . . . . . . . . . . . . . . . . . . . . . . . . . . . . . . . . . . . . . . . . . . . . . . . . . . . . . . . . . . . . . . . . . . . . . . . . . . . . . 747
(1) The data set . . . . . . . . . . . . . . . . . . . . . . . . . . . . . . . . . . . . . . . . . . . . . . . . . . . . . . . . . . . . . . . . . . . . . . . . . . . . . . . . . . . . . . . . . . . . 747(2) Life-history variables . . . . . . . . . . . . . . . . . . . . . . . . . . . . . . . . . . . . . . . . . . . . . . . . . . . . . . . . . . . . . . . . . . . . . . . . . . . . . . . . . . . 753(3) Data analysis . . . . . . . . . . . . . . . . . . . . . . . . . . . . . . . . . . . . . . . . . . . . . . . . . . . . . . . . . . . . . . . . . . . . . . . . . . . . . . . . . . . . . . . . . . . 753
* Author for correspondence (Tel: 662-234-2744; E-mail: [email protected]).
Biological Reviews 88 (2013) 745–766 Published 2013. This article is a U.S. Government work and is in the public domain in the USA.

746 Wendell R. Haag
III. Results . . . . . . . . . . . . . . . . . . . . . . . . . . . . . . . . . . . . . . . . . . . . . . . . . . . . . . . . . . . . . . . . . . . . . . . . . . . . . . . . . . . . . . . . . . . . . . . . . . . . . . 754(1) Overall patterns of fecundity . . . . . . . . . . . . . . . . . . . . . . . . . . . . . . . . . . . . . . . . . . . . . . . . . . . . . . . . . . . . . . . . . . . . . . . . . . . 754(2) Overall patterns of reproductive effort . . . . . . . . . . . . . . . . . . . . . . . . . . . . . . . . . . . . . . . . . . . . . . . . . . . . . . . . . . . . . . . . . 755(3) Relationships of fecundity and life-history variables . . . . . . . . . . . . . . . . . . . . . . . . . . . . . . . . . . . . . . . . . . . . . . . . . . . . 755(4) Relationships of reproductive effort and life-history variables . . . . . . . . . . . . . . . . . . . . . . . . . . . . . . . . . . . . . . . . . . 759(5) Models with multiple life-history variables . . . . . . . . . . . . . . . . . . . . . . . . . . . . . . . . . . . . . . . . . . . . . . . . . . . . . . . . . . . . . 759
IV. Discussion . . . . . . . . . . . . . . . . . . . . . . . . . . . . . . . . . . . . . . . . . . . . . . . . . . . . . . . . . . . . . . . . . . . . . . . . . . . . . . . . . . . . . . . . . . . . . . . . . . 760V. Conclusions . . . . . . . . . . . . . . . . . . . . . . . . . . . . . . . . . . . . . . . . . . . . . . . . . . . . . . . . . . . . . . . . . . . . . . . . . . . . . . . . . . . . . . . . . . . . . . . . 763
VI. Acknowledgements . . . . . . . . . . . . . . . . . . . . . . . . . . . . . . . . . . . . . . . . . . . . . . . . . . . . . . . . . . . . . . . . . . . . . . . . . . . . . . . . . . . . . . . . . 764VII. References . . . . . . . . . . . . . . . . . . . . . . . . . . . . . . . . . . . . . . . . . . . . . . . . . . . . . . . . . . . . . . . . . . . . . . . . . . . . . . . . . . . . . . . . . . . . . . . . . . 764
I. INTRODUCTION
Fecundity is an important life-history trait and is considereda measure of an organism’s fitness (Charlesworth, 1994).When resources are limiting, selection is expected to optimizereproductive investment resulting in characteristic trade-offsamong brood size, offspring size, and reproductive lifespan.For example, high fecundity is possible often because ofreduced parental care or production of smaller offspringrequiring lower energetic investment (e.g. Winemiller &Rose, 1992). High investment in reproduction may comeat a cost to somatic maintenance, resulting in decreasedlifespan for highly fecund organisms. However, lifetimereproductive effort is predicted to be invariant of lifespanbecause of the longer reproductive life of species that investless in reproduction per unit time (White & Seymour, 2004;Charnov, Warne & Moses, 2007).
Freshwater mussels (order Unionoida) are a diverseand ecologically important group (Vaughn & Hakenkamp,2001; Gutierrez et al., 2003; Vaughn, Nichols & Spooner,2008). Mussels have an unusual life history in whichlarvae (glochidia) of most species are obligate parasiteson fishes. After hatching, glochidia are brooded by thefemale mussel, but brooding time varies among speciesgenerally corresponding to either a short-term or long-termbrooding strategy. Short-term brooders brood glochidia forapproximately 2–6 weeks before release usually in springor summer. Long-term brooders brood glochidia for up toeight months, usually from late summer or autumn, untilrelease the following spring or summer (e.g. Weaver, Pardue& Neves, 1991; Bruenderman & Neves, 1993; Garner,Haggerty & Modlin, 1999). The portion of the gills usedfor brooding also varies among species ranging from the useof all four gills to only a portion of the outer gills. Afterrelease from the female, glochidia must encounter a suitablehost species within a few days. Host use varies among speciesfrom generalists that are able to parasitize nearly any fishspecies, to specialists that can use as hosts only one or a fewclosely related fishes (Haag, 2012). Host use of specialistsencompasses a taxonomically and ecologically wide range offishes from drift-feeding minnows to large top predators, andone species is a specialist on an aquatic salamander (Necturusmaculosus). Accordingly, a wide array of strategies to transmitglochidia to hosts has evolved ranging from broadcast offree glochidia to complex strategies that target specific host
species (Barnhart, Haag & Roston, 2008; Haag, 2012). Inpart because of this complex life cycle, mussels are now oneof the most imperiled groups of organisms on Earth (Regnier,Fontaine & Bouchet, 2009).
As a group, freshwater mussels have been portrayedtraditionally as having uniformly high annual fecundity(> 200 000) to compensate for the low chances of glochidiaencountering hosts (McMahon & Bogan, 2001). However,fecundity is known for few species and relationships offecundity to other life-history traits have received littleattention. Recent studies show a much wider range infecundity including species that produce < 10000 glochidiaannually (Haag & Staton, 2003; Pilarczyk et al., 2005; Joneset al., 2010), and energetic investment in glochidia is lowin some species (Bauer, 1998). Bauer (1994) showed aninverse relationship between glochidial size and fecundityas predicted by life-history theory, but his analysis includedonly seven species. In addition to predictions of generallife-history theory, life-history traits specific to mussels alsomay be expected to influence fecundity. For example, if hostinfection strategies such as broadcasting are less efficient thanother, more specialized, strategies, fecundity of broadcastersshould be higher. Brooding glochidia may incur a cost tofemales because the presence of glochidia in the gills canreduce feeding and respiratory efficiency (Richard, Dietz &Silverman, 1991; Tankersley & Dimock 1993; Tankersley,1996), and the duration of the brooding period and portionof the gill used for brooding are therefore expected to beinversely related to fecundity. The wide range of variationamong species in fecundity, host strategies, and other traitssuch as growth and lifespan (Haag & Rypel, 2011) coupledwith the great taxonomic diversity of this group suggests thatmussels use a broad array of life-history strategies. Becauseof the central role of fecundity and reproductive effort in lifehistory, patterns of variation in these traits among species andtheir relationships to other life-history traits are importantfor understanding mussel ecology and developing effectiveconservation strategies for these imperiled animals.
I examined fecundity and reproductive effort in NorthAmerican freshwater mussels using original data and litera-ture reports. First, I examined patterns of variation at severallevels including within populations, among species, andamong phylogenetic groups. Second, I report relationships offecundity and reproductive effort with other life-history vari-ables including body size, glochidial size, lifespan, brooding
Biological Reviews 88 (2013) 745–766 Published 2013. This article is a U.S. Government work and is in the public domain in the USA.

Fecundity and reproductive effort in mussels 747
traits, host use, and host-infection strategy. I then used mul-tiple regression to evaluate the relative importance of thesetraits in explaining variation in fecundity among species andto show patterns of covariation among traits. Finally, I dis-cuss the significance of fecundity and reproductive effort inlife-history evolution of freshwater mussels.
II. METHODS
(1) The data set
I compiled fecundity data for 72 mussel taxa (71 speciesplus 1 subspecies) from the literature, from original datagenerated by this study, and from unpublished data providedby colleagues (Table 1). These species represent a broadcross section of North American mussel diversity, containingmultiple representatives of all major phylogenetic lineages(sensu Graf, 2002; Campbell et al., 2005), all recognizedhost-attraction strategies (Barnhart et al., 2008), and an arrayof life-history strategies (see Haag, 2012). Several species arerepresented by estimates from more than one population,but for most, sample sizes were too small to examinestatistically differences in fecundity among populations, andno species are represented by estimates from across theirgeographic range.
I generated original fecundity estimates from preservedgravid female mussels following the methods of Haag &Staton (2003). I made estimates only from females whosegill marsupia appeared fully charged, in order to maximizethe likelihood that estimates represented the full reproductivecomplement of the individual and were not biased by femaleshaving previously released a portion of their brood. For eachspecimen, I measured total shell length (nearest 0.1 mm)with dial calipers. For 33 species, I also measured shellvolume (nearest 1.0 ml) to provide a surrogate measure ofbody mass. I measured shell volume by filling each shellvalve with water and recording the volume of water usinga graduated cylinder. I estimated fecundity by dissectinggravid gills, suspending glochidia in a known volume ofwater, and extrapolating total fecundity from the meannumber of glochidia in three replicate aliquots. I countedonly the number of developing eggs or glochidia in a sampleso that fecundity estimates reflected the number of viableoffspring in a brood and were not inflated by the presenceof structural or other non-developing eggs (see Barnhartet al., 2008). Most mussel species appear to produce onlya single brood per year, but multiple clutches have beenreported for a few species, primarily short-term brooders.However, most of these reports are from subtropical regionssouth of about 31◦N latitude, and the evidence for multiplebrood production is equivocal in most cases (Haag, 2012).Because all of the populations sampled in this study arefrom temperate latitudes, I considered estimates to representannual fecundity for an individual.
In addition to fecundity, I estimated reproductiveeffort (RE) for nine species (Table 2). Reproductiveeffort is a measure of the relative amount of energy
allocated to offspring production and can be calculatedas: RE = (offspring mass)/(offspring mass + adult bodymass + mass of organic component of the shell) (Bauer, 1998;Gosling, 2003). This estimate assumes one brood per yearand that the energetic cost of producing a mass of adult tissueis equivalent to the energetic cost of producing the same massof offspring tissue (Charnov et al., 2007). All individuals in thisanalysis were brooding fully mature glochidia, and I flushedglochidia from gravid gills into pre-weighed pans. Glochidia,soft tissues (including flushed gills), and shells were then driedat 60◦C for 48 h and weighed separately. I did not estimatedirectly the mass of the organic component of the shell. Shellsof adult mussels typically contain about 2.3–3.8% organicmatter (Cameron, Cameron & Paterson, 1979), and I usedthe midpoint of this range (3.1%) to estimate organic shellmass for all species. I also compiled other reported values ofRE from the literature. One disadvantage of this method isthat inorganic shell mass is included in estimates of glochidialmass but not in estimates of adult tissue mass, and resultantestimates of RE are likely inflated. Therefore, I also ashedadult soft tissue and glochidia at 500◦C in a muffle furnace,and then subtracted ash mass from dry mass to obtain ash-free dry mass, an estimate of the organic fraction of samples.I then calculated RE using estimates of organic mass.
Measurements of tissue and shell mass necessary forcalculating RE were unavailable for other species in thedataset. I used length versus body mass and length versus shellmass relationships to estimate mass (dry mass only) for anadditional 10 species (13 populations) with fecundity data(Table 2). In all cases, length-mass relationships explaineda high percentage of variation in body and shell mass(r2 = 0.85–0.98; see also Benke et al., 1999) and werederived from the same population as fecundity estimates.I estimated total glochidial volume for these species as(glochidia size)3 × fecundity (see Charnov et al., 2007),and converted these values to mass according to therelationship between volume and mass derived from thenine species with direct measurements of glochidial mass(log glochidial mass = 0.985(log glochidial volume) − 4.067;r2 = 0.817, P < 0.0001). Adult length and fecundity usedto predict mass were mean values for each population (seeTable 1), and glochidial size was determined from sourceslisted subsequently. In Fusconaia cerina and Pleurobema decisum,approximately 50% of eggs typically are unfertilized andprovide structure to the conglutinate (Haag & Staton, 2003;Barnhart et al., 2008; see Section II.2). These unfertilizedeggs were not included in fecundity estimates, but becausethey represent an energetic cost, I multiplied estimates ofglochidial mass by two for these species. I then used theseestimates of adult body mass, shell mass, and glochidial massto calculate RE for these 13 populations. I tested the accuracyof this method by estimating RE for eight of the species withdirect mass measurements. For all species except Leptodea
fragilis, direct and estimated values of RE were very similarand were strongly correlated (r = 0.941 without L. fragilis,r = 0.712 with L. fragilis; P < 0.0001 for both correlations;see Table 2).
Biological Reviews 88 (2013) 745–766 Published 2013. This article is a U.S. Government work and is in the public domain in the USA.

748 Wendell R. HaagT
able
1.Fe
cund
ityda
tafo
rN
orth
Am
eric
anfr
eshw
ater
mus
sels
Spec
ies
Mea
nle
ngth
(mm
)M
ean
fecu
ndity
Fecu
ndity
rang
eN
Len
gth-
fecu
ndity
rela
tions
hip
Site
Sour
ce
Fam
ily
Mar
gari
tife
rid
aeC
umbe
rlan
dia
mon
odon
ta15
1.2
4967
500
1930
000
–95
7000
08
—G
asco
nade
and
Mer
amec
Riv
ers,
MO
Bai
rd(2
000)
Mar
gari
tife
ram
arga
ritife
ra77
.944
2168
810
3060
0–
1685
1000
8—
Riv
erD
ee,U
KY
oung
&W
illia
ms
(198
4)F
amil
yU
nio
nid
aeT
ribe
Am
blem
ini
Am
blem
apl
icat
a78
.532
5709
7605
0–
6813
0013
y=
0.60
0x3.
0275
,r2
=0.
879*
**L
ittle
Tal
laha
tchi
eR
iver
,M
SH
aag
&St
aton
(200
3)
Am
blem
apl
icat
a86
.922
9738
4050
0–
4653
0012
y=
0.00
9x3.
825 ,
r2=
0.83
9***
Sips
eyR
iver
,AL
Haa
g&
Stat
on(2
003)
Tri
beA
nodo
ntin
iA
lasm
idon
tahe
tero
don
29.0
2661
2067
–29
973
——
R.M
air
(unp
ublis
hed
data
)A
lasm
idon
tam
argi
nata
55.0
4729
842
559
–54
391
3—
—R
.Mai
r(u
npub
lishe
dda
ta)
Ala
smid
onta
viri
dis
35.6
6914
4432
–84
763
——
R.M
air
(unp
ublis
hed
data
)A
rcid
ens
conf
rago
sus
144.
010
5075
0—
1—
St.F
ranc
isR
iver
,AR
Thi
sst
udy
Las
mig
ona
com
plan
ata
158.
514
4950
010
4800
0–
1930
000
4—
St.F
ranc
isR
iver
,AR
Thi
sst
udy
Las
mig
ona
hols
toni
a38
.628
83—
5—
—R
.Mai
r(u
npub
lishe
dda
ta)
Peg
ias
fabu
la1
25.0
1950
1500
–24
00—
——
J.L
ayze
r(u
npub
lishe
dda
ta)
Pyg
anod
onca
tara
cta2
54.3
†53
811
——
y=
912.
011x
2.41
0 ,r2
=0.
397*
*L
ayto
n’s
Lak
e,N
SPa
ters
on&
Cam
eron
(198
5)
Pyg
anod
onca
tara
cta2
60.7
†17
482
——
y=
1.47
9x5.
200 ,
r2=
0.46
2**
Mor
ice
Lak
e,N
BPa
ters
on&
Cam
eron
(198
5)
Pyg
anod
ongr
andi
s10
7.6
4123
0069
300
–72
4050
9y=
0.00
2x4.
092
r2=
0.86
32**
*Fa
rmpo
nd,M
ST
his
stud
y
Pyg
anod
ongr
andi
s12
7.4
4896
0017
4000
–88
8000
10y=
0.22
0x2.
990
r2=
0.42
3**
Farm
pond
,MS
Thi
sst
udy
Pyg
anod
ongr
andi
s73
.558
453
2000
0–
2150
00†
63y=
0.00
006x
4.84
2 ††,
r2=
0.88
0**
Lon
gan
dN
arro
wL
akes
,A
BH
anso
n,M
acka
y&
Prep
as(1
989)
Sim
pson
aias
ambi
gua
42.3
5225
0—
1—
Wis
cons
inR
iver
,WI
Thi
sst
udy
Str
ophi
tus
subv
exus
55.6
2321
420
500
–25
927
2—
Bru
shy
Cre
ek,A
LT
his
stud
yU
tter
back
iaim
beci
llis
65.7
5026
513
500
–85
500
10y=
0.87
6x2.
600 ,
r2=
0.85
7***
Farm
pond
,MS
Thi
sst
udy
Utter
back
iaim
beci
llis
79.5
7779
725
500
–14
6500
8y=
1.42
9x2.
460 ,
r2=
0.27
1**
Pusk
usL
ake,
MS
Thi
sst
udy
Tri
beL
amps
ilini
Act
inon
aias
liga
men
tina
3—
—80
616
–15
6122
464
—G
reen
Riv
er,K
YM
oles
&L
ayze
r(2
008)
Act
inon
aias
liga
men
tina
128.
2†65
2843
4586
91–
8149
0417
y=
1.08
0x2.
743 ††
,r2
=0.
580*
**G
reen
Riv
er,K
YM
oles
&L
ayze
r(2
008)
Act
inon
aias
liga
men
tina
118.
9†81
6063
3109
48—
1170
959
22y=
4.44
0x2.
537 ††
,r2
=0.
640*
**G
reen
Riv
er,K
YM
oles
&L
ayze
r(2
008)
Cyp
roge
nia
aber
ti53
.013
2363
—7
—V
erdi
gris
Riv
er,K
SE
cker
t(20
03)
Cyp
roge
nia
aber
ti58
.063
182
—4
—St
.Fra
ncis
Riv
er,M
OE
cker
t(20
03)
Biological Reviews 88 (2013) 745–766 Published 2013. This article is a U.S. Government work and is in the public domain in the USA.

Fecundity and reproductive effort in mussels 749
Tab
le1.
(Con
t.)
Spec
ies
Mea
nle
ngth
(mm
)M
ean
fecu
ndity
Fecu
ndity
rang
eN
Len
gth-
fecu
ndity
rela
tions
hip
Site
Sour
ce
Cyp
roge
nia
aber
ti44
.069
634
—7
—O
uach
itaR
iver
,AR
Eck
ert(
2003
)C
ypro
geni
ast
egar
ia41
.943
487
2239
3–
6354
44
—C
linch
Riv
er,T
NJo
nes
&N
eves
(200
2)D
rom
usdr
omas
57.4
1083
81.6
4826
7–
2530
507
nsC
linch
Riv
er,T
NJo
nes
etal
.(20
04)
Ellip
sari
aline
olat
a56
.097
833
1400
0–
1635
0018
y=
0.07
1x3.
482,
r2=
0.81
0***
Ten
ness
eeR
iver
,AL
Thi
sst
udy
Epi
obla
sma
ahls
tedt
i45
.716
843
7066
–31
946
4—
Duc
kR
iver
,TN
J.W
.Jon
es(u
npub
lishe
dda
ta)
Epi
obla
sma
caps
aefo
rmis
441
.413
589
1049
4–
1687
69
y=
16.7
2x1.
798,
r2=
0.61
5*C
linch
Riv
er,T
NJ.
W.J
ones
(unp
ublis
hed
data
)
Epi
obla
sma
triq
uetr
a35
.315
511
1344
0–
2100
04
—B
ourb
euse
Riv
er,M
OB
arnh
art(
2002
)E
piob
lasm
aflo
rent
ina
aure
ola
29.6
8068
5818
–12
558
7ns
Clin
chR
iver
,VA
J.W
.Jon
es(u
npub
lishe
dda
ta)
Epi
obla
sma
flore
ntin
aw
alke
ri42
.05
7213
1828
–12
822
4—
Big
Sout
hFo
rkC
umbe
rlan
dR
iver
,KY
J.W
.Jon
es(u
npub
lishe
dda
ta)
Gle
bula
rotu
ndat
a510
6.4
5310
00—
5—
Bay
ouPe
yron
net,
LA
Park
er,H
ackn
ey&
Vid
rine
(198
4)H
amio
taau
stra
lis6
62.0
9180
0—
1—
Nat
ural
Bri
dge
Cre
ek,A
LB
lalo
ck-H
erod
,Her
od&
Will
iam
s(2
002)
Lam
psilis
orna
ta74
.228
1776
4862
5–
7396
0029
y=
0.83
7x2.
955
r2=
0.62
0***
Sips
eyR
iver
,AL
Haa
g&
Stat
on(2
003)
Lam
psilis
ovat
a13
6.3
7172
50—
1—
Ten
ness
eeR
iver
,AL
Thi
sst
udy
Lam
psilis
rafin
esqu
eana
113.
012
7400
011
7300
0–
1466
000
4—
Spri
ngR
iver
,KS
Bar
nhar
t(20
03)
Lam
psilis
siliqu
oide
a510
4.8
5330
00—
9—
Eas
tFor
kL
ittle
Mia
miR
iver
,O
HPe
rles
,Chr
istia
n&
Ber
g(2
003)
Lam
psilis
siliqu
oide
a68
.392
667
7400
0–
1250
003
——
Cok
eret
al.(
1921
)L
amps
ilis
stra
min
ea7
66.8
2684
6417
8000
–37
0000
7y=
1.03
4x2.
973,
r2=
0.81
2**
Sips
eyR
iver
,AL
Thi
sst
udy
Lam
psilis
tere
s96
.779
4667
6050
00–
9990
003
—L
ittle
Tal
laha
tchi
eR
iver
,MS
Thi
sst
udy
Lam
psilis
tere
s12
9.0
4631
633
1434
000
–84
3450
06
—St
.Fra
ncis
Riv
er,A
RT
his
stud
yL
amps
ilis
tere
s84
.438
6250
2940
00–
4785
002
—Si
psey
Riv
er,A
LT
his
stud
yA
llL
amps
ilis
tere
s11
2.1
2813
300
—10
y=
0.00
0010
x5.49
6
r2=
0.88
8***
—T
his
stud
y
Lem
iox
rim
osus
36.6
5306
4132
–64
792
—C
linch
Riv
er,T
NJo
nes
etal
.(20
10)
Lem
iox
rim
osus
36.6
2036
070
66–
5870
06
—D
uck
Riv
er,T
NJo
nes
etal
.(20
10)
Lep
tode
afr
agilis
79.9
9586
987
1571
250
–23
4015
0015
y=
5.86
4x3.
217,
r2=
0.77
0***
St.F
ranc
isR
iver
,AR
Thi
sst
udy
Lep
tode
afr
agilis
99.7
1073
5000
1070
7500
–10
7625
002
—L
ittle
Tal
laha
tchi
eR
iver
,MS
Thi
sst
udy
Lep
tode
afr
agilis
43.7
6882
50—
1—
Sips
eyR
iver
,AL
Thi
sst
udy
Lep
tode
afr
agilis
66.5
9080
00—
1—
Tow
nC
reek
,MS
Thi
sst
udy
Lep
tode
afr
agilis
74.0
2225
000
—1
—C
oker
etal
.(19
21)
Lep
tode
ale
ptod
on52
.210
7766
741
9000
–20
0000
03
—G
asco
nade
and
Mer
amec
Riv
ers,
MO
Bar
nhar
t(20
01,2
002,
2003
)
Lig
umia
rect
a15
1.6
1076
833
8955
00–
1226
500
3—
Ten
ness
eeR
iver
,AL
Thi
sst
udy
Biological Reviews 88 (2013) 745–766 Published 2013. This article is a U.S. Government work and is in the public domain in the USA.

750 Wendell R. HaagT
able
1.(C
ont.)
Spec
ies
Mea
nle
ngth
(mm
)M
ean
fecu
ndity
Fecu
ndity
rang
eN
Len
gth-
fecu
ndity
rela
tions
hip
Site
Sour
ce
Lig
umia
rect
a11
9.6
6042
6928
3500
–10
9696
49
y=
0.00
6x3.
833 ,
r2=
0.72
7**
St.C
roix
Riv
er,M
NT
his
stud
y
Lig
umia
subr
ostr
ata
60.0
7482
135
500
–13
7500
7y=
11.3
77x2.
133
r2=
0.84
4**
Farm
pond
,MS
Thi
sst
udy
Med
ioni
dus
acut
issi
mus
21.7
1625
814
50–
3537
515
y=
0.00
3x4.
937
r2=
0.90
0***
Sips
eyR
iver
,AL
Thi
sst
udy
Med
ioni
dus
conr
adic
us8
33.2
1640
011
400
–21
400
7y=
6.91
9x2.
215 ,
r2=
0.77
9**
Clin
chR
iver
,TN
Thi
sst
udy
Obl
iqua
ria
refle
xa48
.840
975
447
–13
5750
21sq
rt(y
)=5.
238x
−53
.191
,r2
=0.
679*
**L
ittle
Tal
laha
tchi
eR
iver
,MS
Haa
g&
Stat
on(2
003)
Obl
iqua
ria
refle
xa40
.825
767
3250
–82
500
12sq
rt(y
)=5.
238x
−53
.191
,r2
=0.
679*
**Si
psey
Riv
er,A
LH
aag
&St
aton
(200
3)
Obo
vari
aun
icol
or9
32.5
5639
024
200
–10
5925
31y=
572.
160x
1.31
0
r2=
0.40
8***
Sips
eyR
iver
,AL
Thi
sst
udy
Pot
amilus
ohie
nsis
68.7
1062
768
—1
—St
.Fra
ncis
Riv
er,A
RT
his
stud
yP
otam
ilus
purp
urat
us10
4.5
4174
0775
000
–68
8750
10y=
0.00
2x4.
134
r2=
0.89
1***
St.F
ranc
isR
iver
,AR
Thi
sst
udy
Pot
amilus
purp
urat
us11
3.3
4255
0027
1000
–58
0000
2—
Litt
leT
alla
hatc
hie
Riv
er,M
ST
his
stud
yP
tych
obra
nchu
ssu
bten
tum
576
.124
7000
4330
0–
5020
0029
—C
linch
Riv
er,T
NV
.Men
gel&
J.L
ayze
r(u
npub
lishe
dda
ta)
Tox
olas
ma
texa
sens
is27
.620
089
8214
–31
964
2—
Qua
rter
liah
Cre
ek,M
ST
his
stud
yT
oxol
asm
ate
xase
nsis
35.4
3350
018
250
–48
750
2—
St.F
ranc
isR
iver
,AR
Thi
sst
udy
Tru
ncilla
dona
cifo
rmis
20.8
3519
00—
1—
St.F
ranc
isR
iver
,AR
Thi
sst
udy
Tru
ncilla
trun
cata
45.3
8838
8928
6000
–18
5100
05
—St
.Cro
ixR
iver
,MN
Thi
sst
udy
Ven
usta
conc
hael
lips
ifor
mis
62.4
1387
0012
3500
−161
500
5—
Pom
me
deT
erre
Riv
er,M
OT
his
stud
yV
enus
taco
ncha
plea
sii
37.3
4694
7—
1—
Jam
esR
iver
,MO
Bar
nhar
t(20
01)
Villo
sair
is41
.757
667
4850
0–
6775
03
—L
ittle
Riv
er,T
NT
his
stud
yV
illo
salien
osa
63.5
5255
00—
1—
Cat
alpa
Cre
ek,M
ST
his
stud
yV
illo
salien
osa
43.5
7302
532
600
–10
7100
4—
Sips
eyR
iver
,AL
Thi
sst
udy
Villo
sane
bulo
sa46
.514
0000
3975
0–
2402
502
—H
olly
Cre
ek,G
AT
his
stud
yV
illo
sava
nuxe
men
sis
42.7
5866
745
400
–68
000
3—
Hol
lyC
reek
,GA
Thi
sst
udy
Villo
sava
nuxe
men
sis
39.2
2627
517
875
–33
750
3—
Spri
ngC
reek
,TN
Thi
sst
udy
allV
illo
sa—
——
—y=
0.01
0x4.
169
r2=
0.79
4***
—T
his
stud
y
Tri
bePl
euro
bem
ini
Ellip
tio
arca
69.9
1362
2719
300
–20
6875
35y=
−100
.930
x2+
1709
3x–
5654
29,
r2=
0.64
5***
Sips
eyR
iver
,AL
Haa
g&
Stat
on(2
003)
Ellip
tio
com
plan
ata2
58.0
†16
668
1878
–68
655
23y=
12.6
18x4.
088 ††
,r2
=0.
563*
**M
oric
eL
ake,
NB
Pate
rson
(198
5)
Ellip
tio
cras
side
ns11
4.7
6512
50—
1—
Sips
eyR
iver
,AL
Thi
sst
udy
Ellip
tio
dila
tata
84.1
8108
948
393
–11
2589
5—
St.C
roix
Riv
er,M
NT
his
stud
y
Biological Reviews 88 (2013) 745–766 Published 2013. This article is a U.S. Government work and is in the public domain in the USA.

Fecundity and reproductive effort in mussels 751
Tab
le1.
(Con
t.)
Spec
ies
Mea
nle
ngth
(mm
)M
ean
fecu
ndity
Fecu
ndity
rang
eN
Len
gth-
fecu
ndity
rela
tions
hip
Site
Sour
ce
Fus
cona
iabu
rkei
44.1
6058
3880
–10
395
4—
Eig
htm
ileC
reek
,FL
Pila
rczy
ket
al.(
2005
)F
usco
naia
ceri
na46
.023
890
8750
–55
422
36y=
3.97
3x2.
273
r2=
0.47
6*Si
psey
Riv
er,A
LH
aag
&St
aton
(200
3)
Fus
cona
iacu
neol
us5
63.0
1130
00—
1—
Clin
chR
iver
,VA
Bru
ende
rman
&N
eves
(199
3)F
usco
naia
ozar
kens
is68
.915
840
8582
–29
470
8ns
Spri
ngR
iver
,MO
M.C
.Bar
nhar
t(un
publ
ishe
dda
ta)
Ple
urob
ema
deci
sum
46.7
2943
367
21–
7358
116
y=
0.65
3x2.
788,
r2=
0.76
54**
*Si
psey
Riv
er,A
LH
aag
&St
aton
(200
3)
Ple
urob
ema
deci
sum
47.9
4088
727
860
–69
553
10y=
30.3
13x1.
863,
r2=
0.42
9*Si
psey
Riv
er,A
LH
aag
&St
aton
(200
3)
Ple
urob
ema
collin
a49
.912
423
—8
—Jo
hns
and
Dic
ksC
reek
s,V
AH
ove
&N
eves
(199
4)P
leur
obem
ast
rode
anum
1043
.118
413
1032
0–
3973
39
nsE
ight
mile
Cre
ek,F
LPi
larc
zyk
etal
.(20
05)
Tri
beQ
uadr
ulin
iM
egal
onai
asne
rvos
a11
7.1
6074
5536
1000
–81
5250
11y=
156.
170x
1.73
2
r2=
0.79
9**
*T
enne
ssee
Riv
er,A
LT
his
stud
y
Qua
drul
aas
pera
ta40
.496
4725
0–
2825
074
sqrt
(y)=
3.79
6x−
55.0
40,
r2=
0.64
6***
Sips
eyR
iver
,AL
Haa
g&
Stat
on(2
003)
Qua
drul
acy
lind
rica
91.5
1150
00—
5—
Clin
chR
iver
,VA
Yea
ger
&N
eves
(198
6)Q
uadr
ula
pust
ulos
a53
.028
369
49–
5062
530
sqrt
(y)=
−0.0
99x2
+13
.758
x−
281.
810
r2=
0.64
6***
Litt
leT
alla
hatc
hie
Riv
er,M
SH
aag
&St
aton
(200
3)
Qua
drul
apu
stul
osa
59.9
3687
5—
1—
St.C
roix
Riv
er,M
NT
his
stud
yQ
uadr
ula
rum
phia
na11
50.7
3075
025
00–
6825
010
y=
(8×
10−1
6 )x11
.371
,r2
=0.
857*
*Si
psey
Riv
er,A
LT
his
stud
y
Uni
omer
uste
tral
asm
us55
.586
0654
20–
1072
54
—T
hom
pson
Cre
ek,M
ST
his
stud
yU
nion
idae
,inc
erta
ese
dis
Ple
ctom
erus
dom
beya
nus
100.
455
3500
1635
00–
9435
002
—L
eafR
iver
,MS
Thi
sst
udy
Fecu
ndity
refe
rshe
reto
asi
ngle
clut
chan
din
clud
esfe
rtile
eggs
only
;fo
rso
me
spec
ies,
repo
rted
estim
ates
have
been
adju
sted
toac
coun
tfo
rth
ech
arac
teri
stic
pres
ence
ofa
larg
enu
mbe
rof
unfe
rtili
zed
eggs
(e.g
.Fus
cona
iasp
p.,P
leur
obem
asp
p.;s
eeH
aag
&St
aton
,200
3).M
ultip
leva
lues
for
asp
ecie
sre
pres
entd
iffer
entp
opul
atio
ns.F
orle
ngth
(x)v
ersu
sfe
cund
ity(y
)re
latio
nshi
ps,l
engt
his
inm
mun
less
note
dot
herw
ise.
—=
notr
epor
ted
orno
tava
ilabl
e.*P
<0.
05;*
*P<
0.01
;***
P<
0.00
1;ns
=no
tsig
nific
ant.
†Val
ues
estim
ated
from
grap
hica
lpr
esen
tatio
nof
data
.††E
quat
ion
give
nor
igin
ally
inlin
ear
form
usin
glo
g-tr
ansf
orm
edda
ta.
1 Len
gth
not
avai
labl
e;st
ated
leng
this
aty
pica
lval
uefo
rth
esp
ecie
s;2 le
ngth
-fec
undi
tyre
latio
nshi
pba
sed
onle
ngth
ince
ntim
eter
s;3 ra
nge
acro
ssth
ree
popu
latio
ns;
4 excl
udes
one
outli
er:7
780
(42.
0m
m);
5 mea
nle
ngth
not
give
n,va
lue
ism
idpo
int
ofre
port
edle
ngth
rang
e;6 fe
cund
ityre
port
edas
anes
timat
edra
nge
(612
00–
1224
00),
valu
eis
mid
poin
tof
rang
e;7 ex
clud
eson
eou
tlier
:203
000
(73.
3m
m);
8 estim
ates
excl
ude
one
outli
er:6
200
(34.
6m
m);
9 estim
ates
excl
ude
two
outli
ers:
1970
00(3
9.9
mm
leng
th)a
nd17
5000
(32.
3m
m);
10ex
clud
estw
oou
tlier
s:86
0(4
1.1
mm
leng
th)a
nd33
0(4
6.2
mm
);11
excl
udes
two
outli
ers:
6000
(53.
2m
m)a
nd10
750
(60.
0m
m).
Biological Reviews 88 (2013) 745–766 Published 2013. This article is a U.S. Government work and is in the public domain in the USA.

752 Wendell R. Haag
Tab
le2.
Rep
rodu
ctiv
eef
fort
(RE
)in
fres
hwat
erm
usse
ls
Spec
ies
Site
N
Obs
erve
dR
E(%
)dr
ym
ass
Est
imat
edR
E(%
)dr
ym
ass
Obs
erve
dR
E(%
)as
h-fr
ee
Ash
(%)
adul
t(w
/osh
ell)
Ash
(%)
gloc
hidi
a(w
/she
ll)
Fam
ilyM
arga
ritif
erid
aeM
arga
ritife
ram
arga
ritife
ra1
Cen
tral
Eur
ope
—0.
8–
5.3
——
——
Fam
ilyU
nion
idae
Tri
beA
mbl
emin
iA
mbl
ema
plic
ata
Litt
leT
alla
hatc
hie
Riv
er,M
S—
—3.
8—
——
Am
blem
apl
icat
aSi
psey
Riv
er,A
L—
—1.
6—
——
Tri
beA
nodo
ntin
iA
nodo
nta
anat
ina2
Swed
en—
15–
45—
——
—P
ygan
odon
cata
ract
a3M
oric
eL
ake,
NB
——
10.8
——
—P
ygan
odon
cata
ract
a3L
ayto
n’s
Lak
e,N
B—
—19
.9—
——
Pyg
anod
ongr
andi
sH
atch
ery
pond
,AL
3525
.4(1
.8)
——
——
Utter
back
iaim
beci
llis
Pusk
usL
ake,
MS
814
.3(1
.6)
12.0
——
—
Tri
beL
amps
ilini
Lam
psilis
orna
taSi
psey
Riv
er,A
L4
7.3
(1.0
)6.
4—
——
Lam
psilis
stra
min
eaSi
psey
Riv
er,A
L6
8.5
(0.5
)8.
23.
4(0
.6)
20.0
(1.2
)66
.5(6
.4)
Lam
psilis
tere
sSi
psey
Riv
er,A
L2
8.9
(0.7
)8.
75.
1(0
.6)
17.5
(1.3
)53
.1(1
.7)
Lep
tode
afr
agilis
Sips
eyR
iver
,AL
225
.4(8
.7)
8.5
——
—M
edio
nidu
sac
utis
sim
usSi
psey
Riv
er,A
L7
15.6
(0.9
)17
.68.
0(0
.6)
18.4
(1.4
)58
.9(4
.1)
Obl
iqua
ria
refle
xaL
ittle
Tal
laha
tchi
eR
iver
,MS
——
1.7
——
—O
bliq
uari
are
flexa
Sips
eyR
iver
,AL
——
1.8
——
—O
bova
ria
unic
olor
Sips
eyR
iver
,AL
245.
5(0
.3)
5.0
2.0
(0.2
)22
.7(1
.0)
67.7
(3.2
)T
runc
illa
dona
cifo
rmis
Litt
leT
alla
hatc
hie
Riv
er,M
S—
—7.
5—
——
Villo
salien
osa
Sips
eyR
iver
,AL
49.
3(0
.3)
10.8
3.8
(1.0
)32
.7(1
4.8)
63.2
(9.1
)
Tri
bePl
euro
bem
ini
Ellip
tio
arca
Sips
eyR
iver
,AL
——
6.2
——
—F
usco
naia
ceri
naSi
psey
Riv
er,A
L—
—0.
9—
——
Ple
urob
ema
deci
sum
Sips
eyR
iver
,AL
——
3.4
——
—
Tri
beQ
uadr
ulin
iQ
uadr
ula
aspe
rata
Sips
eyR
iver
,AL
——
1.0
——
—Q
uadr
ula
pust
ulos
aL
ittle
Tal
laha
tchi
eR
iver
,MS
——
1.1
——
—Q
uadr
ula
rum
phia
naSi
psey
Riv
er,A
L—
—0.
1—
——
Obs
erve
dva
lues
ofR
Ear
efr
omth
isst
udy
exce
ptw
here
othe
rwis
eno
ted.
Sam
ple
size
sin
this
anal
ysis
diffe
rfr
omth
ose
inT
able
1be
caus
em
ass
was
notd
eter
min
edfo
ral
lind
ivid
uals
with
fecu
ndity
estim
ates
.Est
imat
edR
Ew
asba
sed
onle
ngth
vers
usdr
ym
ass
rela
tions
hips
(W.R
.Haa
g,un
publ
ishe
dda
ta,e
xcep
twhe
reot
herw
ise
note
d)us
ing
estim
ates
ofm
ean
adul
tle
ngth
and
fecu
ndity
for
each
popu
latio
n(T
able
1;se
ete
xt).
Val
uesi
npa
rent
hese
sare
stan
dard
erro
rs.—
deno
test
hatv
alue
seith
erw
ere
notd
eter
min
ed,n
otre
port
edin
the
sour
ce,o
rar
eno
tapp
licab
lebe
caus
ees
timat
edR
Eis
base
don
mea
nva
lues
ofm
ass
and
fecu
ndity
for
the
popu
latio
n.O
ther
sour
ces:
1 Bau
er(1
998)
;2 Hau
kioj
a&
Hak
ala
(197
8),c
ited
inB
auer
(199
8);3 C
amer
onet
al.(
1979
;len
gth
–dr
ym
ass
rela
tions
hips
).
Biological Reviews 88 (2013) 745–766 Published 2013. This article is a U.S. Government work and is in the public domain in the USA.

Fecundity and reproductive effort in mussels 753
(2) Life-history variables
I examined variation in fecundity among mussel species withregard to seven life-history variables: body size, offspring(glochidia) size, lifespan, brooding period, area of the gillused for brooding, host-infection strategy, and host use.When possible, I used estimates of these variables specific tothe same population from which fecundity estimates weremade, but estimates from other populations were used insome cases. Sources and methods for determining life-historyvariables are described below.
Body size: determined as the mean shell length (mm) ofindividuals from which fecundity estimates were made asreported in Table 1. I also used shell volume when availableas a surrogate measure of body mass.
Glochidia size: defined as the mean of glochidial shell lengthand height (mm) following Barnhart et al. (2008). Data onglochidia size were obtained from Hoggarth (1999), Kennedy& Haag (2005), and Barnhart et al. (2008), and were availablefor 67 species in the dataset.
Lifespan: determined as the maximum age (years) reportedfor a species. Information was obtained primarily from Haag& Rypel (2011), but also van der Schalie & van der Schalie(1963), Harmon & Joy (1990), Barnhart (2001), Rogers,Watson & Neves (2001), Fobian (2007), Jones et al. (2010)and Jones & Neves (2011). If estimates of lifespan wereavailable for more than one population of a species, I usedthe maximum reported value. Estimates of lifespan wereavailable for 51 species in the dataset.
Brooding period: classified as short-term or long-termbrooders according to information summarized in Williams,Bogan & Garner (2008). Brooding period was available forall species.
Gill brooding area: determined as the proportion of the gillsused for brooding glochidia. For example, species that broodglochidia throughout the length of all four gills were assigneda value of 1.00, and species that brood only in the posteriorhalf of the outer gills were assigned a value of 0.25. Cyprogeniaspp. and Obliquaria reflexa brood only in a few water tubes inthe outer gills and were assigned a value of 0.17. Broodingarea was determined mostly from information summarizedin Williams et al. (2008) and was available for all species.Because gill area had only four values (0.17, 0.25, 0.50, and1.00), I treated this as a nominal variable in data analysis.
Host infection strategy: determined as one of five strategiesused by mussels to transmit glochidia to hosts, includingbroadcasting, mucus webs, mantle lures, conglutinates, andmantle magazines (see Barnhart et al., 2008). Broadcastingincludes species that release free glochidia, which encounterhosts apparently by chance. Release of glochidia in mucuswebs is similar to broadcasting, but glochidia are bound ina mucus matrix that entangles potential host fishes. Mantlelures are modified portions of the female mantle that attractpotential fish hosts to the mussel by mimicking prey items offishes; glochidia are released when attacking fishes rupturethe gravid gill which is also displayed as part of the lure.Conglutinates are discrete packets of glochidia that mimicprey items of fishes; after release from the female mussel,
conglutinates are ingested by fishes facilitating transmittalof glochidia. The mantle magazine strategy involves short-term storage of glochidia within a chamber associated withthe excurrent aperture; glochidia are discharged rapidlyfrom the chamber apparently upon tactile, photosensory,or chemosensory stimulation by a host fish. Host infectionstrategies were determined for 58 species based on Barnhartet al. (2008). Host infection strategies are well-described formost species in the data set except for a few species classifiedas broadcasters by default because of the apparent absenceof other adaptations for host infection (e.g. Leptodea, Potamilus,Truncilla; see Section IV).
Host use: determined as the primary hosts for a musselspecies (see Haag & Warren, 1997; O’Brien & Williams,2002). To facilitate broad comparisons in host use, I catego-rized host use into guilds according to the highest taxonomiclevel that encompassed the range of fishes or amphibians usedby a particular mussel species. Host guilds included fresh-water drum (Aplodinotus grunniens), black basses (Micropterusspp.), sunfishes (Lepomis spp.), darters (Percidae), sculpins(Cottus spp.), catfishes (Ictaluridae), minnows (Cyprinidae),salmonids (Salmonidae), gar (Lepisosteidae), skipjack herring(Alosa chrysochloris), mudpuppy (Necturus maculosus), sauger andwalleye (Sander spp.), and generalists that do not specializeon a particular host group. I obtained host information froma large number of studies summarized in the Mussel/hostdatabase, The Ohio State University Museum of BiologicalDiversity, Division of Mollusks, http://www.biosci.ohio-state.edu/˜molluscs/OSUM2/index.htm.
(3) Data analysis
For original data and datasets provided by colleagues, Itested for length-fecundity relationships for populations withsample sizes exceeding seven individuals. When samplesizes were sufficient, I generated separate length-fecundityrelationships for species represented in the dataset by morethan one population. Because mussel fecundity typically isrelated to length by a power function (e.g. Paterson, 1985;Haag & Staton 2003; Moles & Layzer, 2008), I fitted powerfunctions for all species, but also evaluated alternative modelsby examining residuals and coefficients of determination. Iomitted a small number of outlier observations for somespecies if these values deviated widely from length–fecundityrelationships. In most cases, outliers were exceptionally smallnumbers suggesting that these females had already released aportion of their brood; all omitted outliers are reported in thefootnotes to Table 1. For species with shell volume data andsufficient sample sizes, I also tested for relationships betweenfecundity and volume. Although the dataset included two ormore populations for some species, small sample sizes did notallow me to test for differences in length-specific fecundityamong any populations.
I examined bivariate relationships between fecundity andlife-history variables using linear regression and analysis ofvariance with all continuous variables log10-transformed.For these analyses, I used mean fecundity, shell length, andshell volume for species represented in the dataset by more
Biological Reviews 88 (2013) 745–766 Published 2013. This article is a U.S. Government work and is in the public domain in the USA.

754 Wendell R. Haag
than one estimate. Because shell length was strongly relatedto fecundity, I accounted for the influence of length onrelationships with other life-history variables either by usinglength-standardized fecundity (obtained as the residuals offecundity regressed on length) or with analysis of covariance.I also examined relationships between reproductive effort(RE) and life-history variables (shell length, glochidial size,lifespan, brooding period, and fecundity). For these analyses,life-history variables were specific to the population forwhich RE was estimated except for M. margaritifera; forthis species, I used data from other central Europeanpopulations (see Table 2). I did not examine relationshipsbetween RE and host strategies because of the smallernumber of species with estimates of RE. In addition toestimates of annual fecundity presented in Table 1, I wasinterested in how lifetime fecundity was related to life-history variables, especially lifespan. In organisms withindeterminate growth, lifetime fecundity can be calculatedby summing mean fecundity of each age class. However,because age-fecundity relationships were available for fewspecies in the dataset, I estimated lifetime fecundity asthe product of mean fecundity and lifespan, assuming onebrood per year. I evaluated the accuracy of this approachin three species for which complete age-specific fecundityinformation was available (Haag & Staton, 2003). Estimateswere similar for both methods for all three species (Elliptio arca:summed age-specific fecundity = 4077374, mean fecundityx lifespan = 4086810; Lampsilis ornata: 6220106, 5071968;Quadrula pustulosa: 1433387, 1361712).
I examined the relationship between annual fecundityand suites of life-history variables simultaneously usingmultiple regression. I used this approach to provide asimple comparison of the relative amount of variation infecundity explained by various factors and not to develop apredictive model for estimating fecundity. Further, to avoidproblems with stepwise procedures, I analyzed only the fullmodels including all effects (e.g. Whittingham et al., 2006).In this analysis, I used as independent variables shell length,glochidial size, lifespan, brooding period, and host-infectionstrategy. I did not include host use in this analysis because it ishighly associated with host-infection strategy; host-attractionstrategies typically target specific fish feeding or behaviouralguilds (Barnhart et al., 2008; Haag, 2012). The categoricalvariables brooding period and host-infection strategy alsocovary to a considerable extent. For example, all specieswith mantle lures are long-term brooders, but long-termbrooders are also present among other infection strategies.In addition, brooding was weakly correlated with glochidialsize (r = 0.306, P < 0.0121; on average, larger glochidiain long-term brooders) and lifespan (r = 0.654, P < 0.0001;on average, shorter lifespan in long-term brooders), butnot with shell length; despite these correlations, glochidialsize and lifespan overlapped widely among broodingperiods. There was a weak relationship between shelllength and lifespan (r = 0.281, P < 0.0464), but the othercontinuous independent variables were not correlated witheach other.
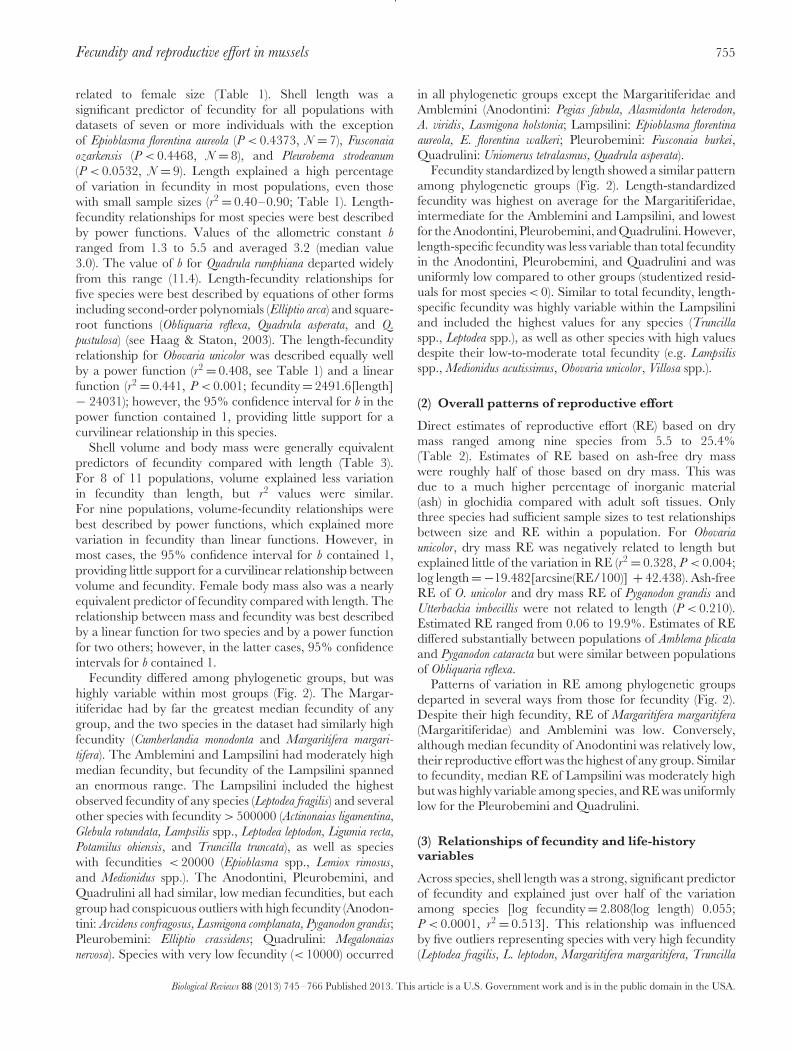
0.00
0.05
0.10
0.15
0.20
0.25
0.30
2500
075
000
1250
0017
5000
2250
0027
5000
3250
0037
5000
4250
004 7
5000
5250
0057
5000
6250
0067
5000
7250
0077
5000
8250
008 7
5000
9250
009 7
5000
>100
0000
Pro
port
ion
of s
peci
es
Fecundity (bin size = 25,000)
Fig. 1. Distribution of average fecundity values for NorthAmerican freshwater mussel species (N = 71 species plus onesubspecies).
III. RESULTS
(1) Overall patterns of fecundity
Fecundity varied widely among mussel species and spannednearly 4 orders of magnitude (Table 1). Mean population-level species fecundities ranged from 1950 (Pegias fabula) to10735000 (Leptodea fragilis). Fecundity was even more variableamong individuals and ranged from 49 for a small specimenof Quadrula pustulosa to 23401500 for a large adult Leptodeafragilis. Fecundity values showed an apparently multimodaldistribution (Fig. 1). Species with relatively low fecundity(< 25000) composed the largest percentage (30%), and 65%of species had fecundity < 150000; 14% of species had veryhigh fecundity (> 1000000), and about 20% had fecunditybetween 250000–950000.
Among populations of a species, mean fecundity was gen-erally similar and well within the same order of magnitude.In many cases where populations appeared to vary morewidely, these differences were due to samples containingindividuals that differed widely in length (e.g. Lampsilis teres,Ligumia recta, Leptodea fragilis). For example, mean fecundity ofPyganodon grandis from two Mississippi populations was morethan seven times higher than a population from Alberta,but mean length of these populations also differed widely,and the predicted fecundity of a 90 mm individual wassimilar in all three populations (Mississippi, 198514, 153323;Alberta, 174018; see Hanson et al., 1989). However, somepopulations did appear to show substantial differences inlength-specific fecundity. Predicted fecundity of a 55 mmPyganodon cataracta from Layton’s Lake, Nova Scotia (55498),was more than five times higher than a similarly sizedindividual from nearby Morice Lake, New Brunswick(10468), and the slopes of these relationships also differedwidely (Table 1; see Paterson & Cameron, 1985). Slopesof length-fecundity relationships were similar between twopopulations of Actinonaias ligamentina in the Green River,Kentucky, but length-specific fecundity was over 1.5 timeshigher in one population (see Moles & Layzer, 2008).
Within a population, fecundity varied among individualsby 0–2 orders of magnitude and this variation was strongly
Biological Reviews 88 (2013) 745–766 Published 2013. This article is a U.S. Government work and is in the public domain in the USA.
Fecundity and reproductive effort in mussels 755
related to female size (Table 1). Shell length was asignificant predictor of fecundity for all populations withdatasets of seven or more individuals with the exceptionof Epioblasma florentina aureola (P < 0.4373, N = 7), Fusconaia
ozarkensis (P < 0.4468, N = 8), and Pleurobema strodeanum
(P < 0.0532, N = 9). Length explained a high percentageof variation in fecundity in most populations, even thosewith small sample sizes (r2 = 0.40–0.90; Table 1). Length-fecundity relationships for most species were best describedby power functions. Values of the allometric constant b
ranged from 1.3 to 5.5 and averaged 3.2 (median value3.0). The value of b for Quadrula rumphiana departed widelyfrom this range (11.4). Length-fecundity relationships forfive species were best described by equations of other formsincluding second-order polynomials (Elliptio arca) and square-root functions (Obliquaria reflexa, Quadrula asperata, and Q.
pustulosa) (see Haag & Staton, 2003). The length-fecundityrelationship for Obovaria unicolor was described equally wellby a power function (r2 = 0.408, see Table 1) and a linearfunction (r2 = 0.441, P < 0.001; fecundity = 2491.6[length]− 24031); however, the 95% confidence interval for b in thepower function contained 1, providing little support for acurvilinear relationship in this species.
Shell volume and body mass were generally equivalentpredictors of fecundity compared with length (Table 3).For 8 of 11 populations, volume explained less variationin fecundity than length, but r2 values were similar.For nine populations, volume-fecundity relationships werebest described by power functions, which explained morevariation in fecundity than linear functions. However, inmost cases, the 95% confidence interval for b contained 1,providing little support for a curvilinear relationship betweenvolume and fecundity. Female body mass also was a nearlyequivalent predictor of fecundity compared with length. Therelationship between mass and fecundity was best describedby a linear function for two species and by a power functionfor two others; however, in the latter cases, 95% confidenceintervals for b contained 1.
Fecundity differed among phylogenetic groups, but washighly variable within most groups (Fig. 2). The Margar-itiferidae had by far the greatest median fecundity of anygroup, and the two species in the dataset had similarly highfecundity (Cumberlandia monodonta and Margaritifera margari-
tifera). The Amblemini and Lampsilini had moderately highmedian fecundity, but fecundity of the Lampsilini spannedan enormous range. The Lampsilini included the highestobserved fecundity of any species (Leptodea fragilis) and severalother species with fecundity > 500000 (Actinonaias ligamentina,
Glebula rotundata, Lampsilis spp., Leptodea leptodon, Ligumia recta,
Potamilus ohiensis, and Truncilla truncata), as well as specieswith fecundities < 20000 (Epioblasma spp., Lemiox rimosus,and Medionidus spp.). The Anodontini, Pleurobemini, andQuadrulini all had similar, low median fecundities, but eachgroup had conspicuous outliers with high fecundity (Anodon-tini: Arcidens confragosus, Lasmigona complanata, Pyganodon grandis;Pleurobemini: Elliptio crassidens; Quadrulini: Megalonaias
nervosa). Species with very low fecundity (< 10000) occurred
in all phylogenetic groups except the Margaritiferidae andAmblemini (Anodontini: Pegias fabula, Alasmidonta heterodon,A. viridis, Lasmigona holstonia; Lampsilini: Epioblasma florentinaaureola, E. florentina walkeri; Pleurobemini: Fusconaia burkei,Quadrulini: Uniomerus tetralasmus, Quadrula asperata).
Fecundity standardized by length showed a similar patternamong phylogenetic groups (Fig. 2). Length-standardizedfecundity was highest on average for the Margaritiferidae,intermediate for the Amblemini and Lampsilini, and lowestfor the Anodontini, Pleurobemini, and Quadrulini. However,length-specific fecundity was less variable than total fecundityin the Anodontini, Pleurobemini, and Quadrulini and wasuniformly low compared to other groups (studentized resid-uals for most species < 0). Similar to total fecundity, length-specific fecundity was highly variable within the Lampsiliniand included the highest values for any species (Truncillaspp., Leptodea spp.), as well as other species with high valuesdespite their low-to-moderate total fecundity (e.g. Lampsilisspp., Medionidus acutissimus, Obovaria unicolor, Villosa spp.).
(2) Overall patterns of reproductive effort
Direct estimates of reproductive effort (RE) based on drymass ranged among nine species from 5.5 to 25.4%(Table 2). Estimates of RE based on ash-free dry masswere roughly half of those based on dry mass. This wasdue to a much higher percentage of inorganic material(ash) in glochidia compared with adult soft tissues. Onlythree species had sufficient sample sizes to test relationshipsbetween size and RE within a population. For Obovariaunicolor, dry mass RE was negatively related to length butexplained little of the variation in RE (r2 = 0.328, P < 0.004;log length = −19.482[arcsine(RE/100)] + 42.438). Ash-freeRE of O. unicolor and dry mass RE of Pyganodon grandis andUtterbackia imbecillis were not related to length (P < 0.210).Estimated RE ranged from 0.06 to 19.9%. Estimates of REdiffered substantially between populations of Amblema plicataand Pyganodon cataracta but were similar between populationsof Obliquaria reflexa.
Patterns of variation in RE among phylogenetic groupsdeparted in several ways from those for fecundity (Fig. 2).Despite their high fecundity, RE of Margaritifera margaritifera(Margaritiferidae) and Amblemini was low. Conversely,although median fecundity of Anodontini was relatively low,their reproductive effort was the highest of any group. Similarto fecundity, median RE of Lampsilini was moderately highbut was highly variable among species, and RE was uniformlylow for the Pleurobemini and Quadrulini.
(3) Relationships of fecundity and life-historyvariables
Across species, shell length was a strong, significant predictorof fecundity and explained just over half of the variationamong species [log fecundity = 2.808(log length) 0.055;P < 0.0001, r2 = 0.513]. This relationship was influencedby five outliers representing species with very high fecundity(Leptodea fragilis, L. leptodon, Margaritifera margaritifera, Truncilla
Biological Reviews 88 (2013) 745–766 Published 2013. This article is a U.S. Government work and is in the public domain in the USA.

756 Wendell R. Haag
Tab
le3.
Com
pari
son
ofsh
elll
engt
h,vo
lum
e,an
dbo
dym
ass
for
expl
aini
ngva
riat
ion
infe
cund
ityam
ong
indi
vidu
als
infr
eshw
ater
mus
selp
opul
atio
ns
Spec
ies
Popu
latio
nV
aria
ble
r2a
bN
Am
blem
apl
icat
aL
ittle
Tal
laha
tchi
eR
iver
,MS
Len
gth
0.82
80.
006
3.92
110
Vol
ume
0.80
517
701.
246†
10A
.pl
icat
aSi
psey
Riv
er,A
LL
engt
h0.
879
0.60
03.
027
13V
olum
e0.
669
9323
0.92
1†13
Ellip
sari
aline
olat
aT
enne
ssee
Riv
er,A
LL
engt
h0.
810
0.07
13.
482
18V
olum
e0.
762
3385
1.17
0†18
Lam
psilis
stra
min
eaSi
psey
Riv
er,A
LL
engt
h0.
825
0.26
83.
300
6V
olum
e*0.
701
8780
261
326
Mas
s*0.
752
4961
472
0841
6L
epto
dea
frag
ilis
St.F
ranc
esR
iver
,AR
Len
gth
0.77
05.
864
3.21
715
Vol
ume
0.69
821
2253
0.98
4†15
Med
ioni
dus
acut
issi
mus
Sips
eyR
iver
,AL
Len
gth
0.93
90.
037
4.09
58
Vol
ume
0.86
619
201
0.89
2†8
Mas
s0.
947
4732
651.
125†
8M
egal
onai
asne
rvos
aT
enne
ssee
Riv
er,A
LL
engt
h0.
799
156.
170
1.73
211
Vol
ume
0.73
191
810.
888†
11O
bova
ria
unic
olor
Sips
eyR
iver
,AL
Len
gth
0.40
857
2.16
01.
310†
24V
olum
e*0.
469
2840
963
2624
Mas
s*0.
3873
2847
073
026
24P
ygan
odon
gran
dis
Farm
pond
,MS
Len
gth
0.42
30.
220
2.99
010
Vol
ume
0.43
331
090.
952†
10P
otam
ilus
purp
urat
usSt
.Fra
ncis
Riv
er,A
RL
engt
h0.
891
0.00
24.
134
10V
olum
e0.
874
441
1.46
010
Utter
back
iaim
beci
llis
Pusk
usL
ake,
MS
Len
gth
0.27
11.
429
2.46
08
Vol
ume
0.38
241
900.
824†
7M
ass
0.24
769
744
0.94
4†8
aan
db
are
fitte
dco
nsta
ntso
fthe
allo
met
ric
equa
tion:
fecu
ndity
=a(
leng
th,v
olum
e,or
mas
s)b,e
xcep
tfor
rela
tions
hips
deno
ted
by*,
whi
char
elin
ear:
(fecu
ndity
=a+
b(le
ngth
,vol
ume,
orm
ass).
All
rela
tions
hips
are
sign
ifica
ntat
P<
0.00
1ex
cept
for
P.
gran
dis,
volu
me
(P<
0.03
).In
som
eca
ses,
cons
tant
sfo
rle
ngth
rela
tions
hips
diffe
rfr
omth
ose
pres
ente
din
Tab
le1
beca
use
mas
san
dsh
ellv
olum
ew
asno
tdet
erm
ined
for
alli
ndiv
idua
lsw
ithfe
cund
ityes
timat
es.†
deno
tes
the
95%
confi
denc
ein
terv
alfo
rth
eco
nsta
ntco
ntai
ns1.
Biological Reviews 88 (2013) 745–766 Published 2013. This article is a U.S. Government work and is in the public domain in the USA.

Fecundity and reproductive effort in mussels 757
35647
108382
277742
23890 31686
0
100000
200000
300000
400000
4694594
500000
2500000
4500000
6500000
8500000 (A)T
otal
fecu
ndity
-2
-1
0
1
2
3
4
Leng
th-s
tand
ardi
zed
fecu
ndity
0.0
5.0
10.0
15.0
20.0
25.0
30.0
35.0
Rep
rodu
ctiv
e ef
fort
(%
)
Margaritiferidae
Amblemini
Lampsilini
Anodontini
Pleurobemini
Quadrulini
(B)
(C)
Fig. 2. Phylogenetic patterns of fecundity and reproductiveeffort for North American freshwater mussel species. (A) Totalannual fecundity (N = 70 species plus 1 subspecies, excludingPlectomerus dombeyanus, which is of uncertain phylogenetic affinity,see Campbell et al., 2005). Numbers and horizontal barsare median fecundity for each group; note change in scalebetween 400000 and 500000. (B) Length-standardized fecundityobtained as the residuals of fecundity regressed on length (bothvariables log-transformed). Horizontal bars are median residualsfor each group. (C) Reproductive effort for 20 species. Horizontalbars are median values.
donaciformis, and T. truncata; studentized residuals ≥ 2.0). Afteromitting these species from the analysis, the proportionof variation in fecundity explained by length increaseddramatically (Fig. 3). Other species with high length-specificfecundities but not identified as significant outliers wereCumberlandia monodonta, Lampsilis teres, Medionidus acutissimus,Obovaria unicolor, Potamilus ohiensis, and Villosa nebulosa. Shellvolume was nearly equivalent to length for predictingfecundity. For 33 species with volume data (excluding
3.0
3.5
4.0
4.5
5.0
5.5
6.0
6.5
7.0
1.2 1.4 1.6 1.8 2.0 2.2
Log
fecu
ndity
Log shell length (mm)
Fig. 3. Relationship between fecundity and shell length forNorth American freshwater mussels (N = 71 species plus onesubspecies). Open circles were identified as significant outliersbased on very high length-specific fecundity (see text). Theplotted regression line is for the dataset excluding theseoutliers [log fecundity = 3.146(log length) − 0.672; P < 0.0001,r2 = 0.751].
the outliers L. fragilis and Truncilla spp.), length explained69.8% of the variation in fecundity [log fecundity = 2.739(logshell volume) + 0.109; P < 0.0001], and volume explained68.1% [log fecundity = 0.958(log shell volume) + 3.766;P < 0.0001]. Among species, shell volume was closely relatedto length [log shell volume = 2.716(log shell length) − 3.551;r2 = 0.940, P < 0.0001].
Glochidial size was significantly and negatively relatedto fecundity, but glochidial size explained little of thevariation in fecundity among species [Fig. 4; log fecun-dity = −1.6984(log glochidial size) + 8.9575; P < 0.0008,r2 = 0.163, N = 67]. This relationship was driven by a groupof six species with small glochidia and very high fecundity;this group included the five high-fecundity species identifiedpreviously as outliers and also Cumberlandia monodonta.Another species with small glochidia, Quadrula rumphiana, hadlow fecundity. There was a significant interaction between
3.0
4.0
5.0
6.0
7.0
8.0
1.7 1.9 2.1 2.3 2.5 2.7
Log
fecu
ndity
Log glochidial size (µm)
Cumberlandia monodonta,Margaritifera margaritifera, Leptodea spp., Truncilla spp.
Quadrularumphiana
Fig. 4. Relationship between offspring (glochidia) size andfecundity in North American freshwater mussels. Points withinthe ellipse are six species with small glochidia and high fecundity(see text).
Biological Reviews 88 (2013) 745–766 Published 2013. This article is a U.S. Government work and is in the public domain in the USA.
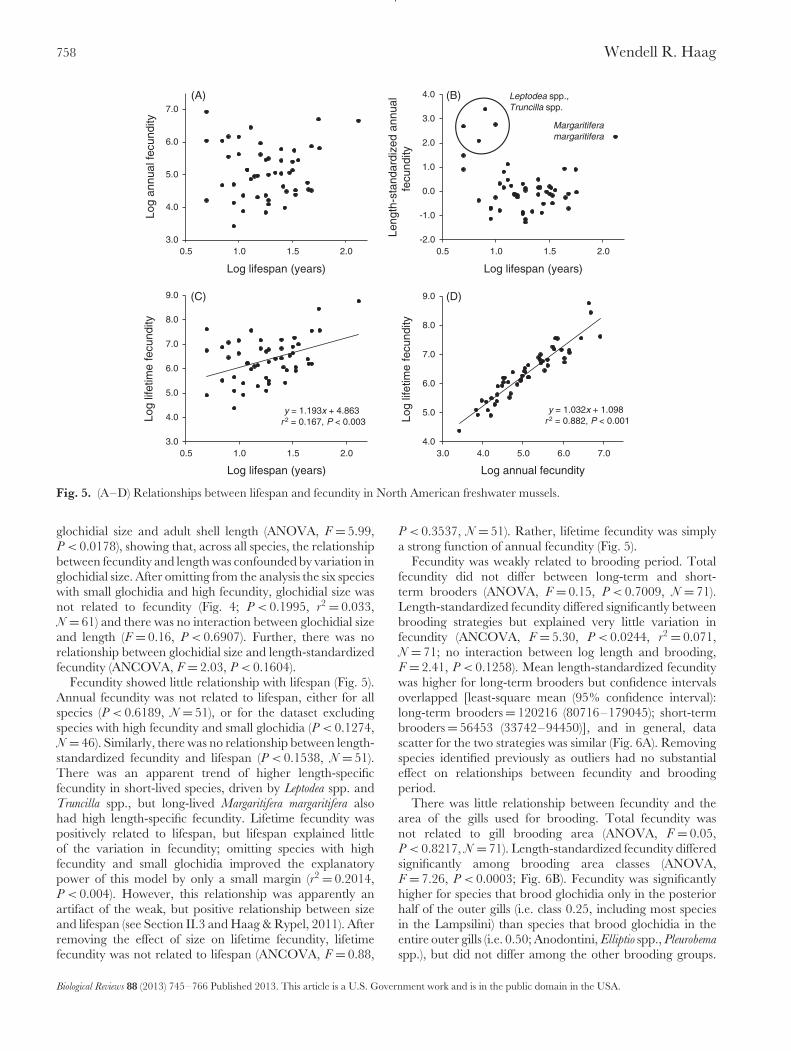
758 Wendell R. Haag
3.0
4.0
5.0
6.0
7.0
0.5 1.0 1.5 2.0
Log
annu
al fe
cund
ity
Log lifespan (years)
y = 1.193x + 4.863r 2 = 0.167, P < 0.003
3.0
4.0
5.0
6.0
7.0
8.0
9.0
0.5 1.0 1.5 2.0
Log
lifet
ime
fecu
ndity
Log lifespan (years)
y = 1.032x + 1.098r 2 = 0.882, P < 0.001
4.0
5.0
6.0
7.0
8.0
9.0
3.0 4.0 5.0 6.0 7.0
Log
lifet
ime
fecu
ndity
Log annual fecundity
-2.0
-1.0
0.0
1.0
2.0
3.0
4.0
0.5 1.0 1.5 2.0
Leng
th-s
tand
ardi
zed
annu
alfe
cund
ity
Log lifespan (years)
Leptodea spp., Truncilla spp.
Margaritiferamargaritifera
(A) (B)
(C) (D)
Fig. 5. (A–D) Relationships between lifespan and fecundity in North American freshwater mussels.
glochidial size and adult shell length (ANOVA, F = 5.99,P < 0.0178), showing that, across all species, the relationshipbetween fecundity and length was confounded by variation inglochidial size. After omitting from the analysis the six specieswith small glochidia and high fecundity, glochidial size wasnot related to fecundity (Fig. 4; P < 0.1995, r2 = 0.033,N = 61) and there was no interaction between glochidial sizeand length (F = 0.16, P < 0.6907). Further, there was norelationship between glochidial size and length-standardizedfecundity (ANCOVA, F = 2.03, P < 0.1604).
Fecundity showed little relationship with lifespan (Fig. 5).Annual fecundity was not related to lifespan, either for allspecies (P < 0.6189, N = 51), or for the dataset excludingspecies with high fecundity and small glochidia (P < 0.1274,N = 46). Similarly, there was no relationship between length-standardized fecundity and lifespan (P < 0.1538, N = 51).There was an apparent trend of higher length-specificfecundity in short-lived species, driven by Leptodea spp. andTruncilla spp., but long-lived Margaritifera margaritifera alsohad high length-specific fecundity. Lifetime fecundity waspositively related to lifespan, but lifespan explained littleof the variation in fecundity; omitting species with highfecundity and small glochidia improved the explanatorypower of this model by only a small margin (r2 = 0.2014,P < 0.004). However, this relationship was apparently anartifact of the weak, but positive relationship between sizeand lifespan (see Section II.3 and Haag & Rypel, 2011). Afterremoving the effect of size on lifetime fecundity, lifetimefecundity was not related to lifespan (ANCOVA, F = 0.88,
P < 0.3537, N = 51). Rather, lifetime fecundity was simplya strong function of annual fecundity (Fig. 5).
Fecundity was weakly related to brooding period. Totalfecundity did not differ between long-term and short-term brooders (ANOVA, F = 0.15, P < 0.7009, N = 71).Length-standardized fecundity differed significantly betweenbrooding strategies but explained very little variation infecundity (ANCOVA, F = 5.30, P < 0.0244, r2 = 0.071,N = 71; no interaction between log length and brooding,F = 2.41, P < 0.1258). Mean length-standardized fecunditywas higher for long-term brooders but confidence intervalsoverlapped [least-square mean (95% confidence interval):long-term brooders = 120216 (80716–179045); short-termbrooders = 56453 (33742–94450)], and in general, datascatter for the two strategies was similar (Fig. 6A). Removingspecies identified previously as outliers had no substantialeffect on relationships between fecundity and broodingperiod.
There was little relationship between fecundity and thearea of the gills used for brooding. Total fecundity wasnot related to gill brooding area (ANOVA, F = 0.05,P < 0.8217, N = 71). Length-standardized fecundity differedsignificantly among brooding area classes (ANOVA,F = 7.26, P < 0.0003; Fig. 6B). Fecundity was significantlyhigher for species that brood glochidia only in the posteriorhalf of the outer gills (i.e. class 0.25, including most speciesin the Lampsilini) than species that brood glochidia in theentire outer gills (i.e. 0.50; Anodontini, Elliptio spp., Pleurobemaspp.), but did not differ among the other brooding groups.
Biological Reviews 88 (2013) 745–766 Published 2013. This article is a U.S. Government work and is in the public domain in the USA.

Fecundity and reproductive effort in mussels 759
3.0
4.0
5.0
6.0
7.0
1.2 1.4 1.6 1.8 2.0 2.2
Log
fecu
ndity
Log length (mm)
Long-term broodersShort-term brooders
-2.0
-1.0
0.0
1.0
2.0
3.0
4.0
0.00 0.25 0.50 0.75 1.00
Leng
th-s
tand
ardi
zed
fecu
ndity
Proportion of gills used for brooding
1,21
21,2
(A) (B)
Fig. 6. (A,B) Relationship between brooding traits and fecundity in North American freshwater mussels. In (B), horizontal barsare mean length-standardized fecundity for each brooding area class; classes with the same number are not significantly different(P > 0.05).
Despite these significant differences, total and length-specificfecundity overlapped greatly among brooding classes (Fig. 6).
Length-standardized fecundity (residuals of log fecundityregressed on log length) was significantly different amonghost-infection strategies (ANOVA, F = 23.86, P < 0.0001,N = 58). Length-standardized fecundity was higher forbroadcasters than for all other infection strategies, but didnot differ significantly among any other strategies (Fig. 7).Among putative broadcasters, only Potamilus purpuratus hadlength-standardized fecundity that was similar to species withother infection strategies. Even though length-standardizedfecundity did not differ among the remaining strategies,residuals were centered nearly on zero only for species thatdisplayed mantle lures. For conglutinates, mucus webs, andmantle magazines, most residuals were < 0, indicating a weaktrend for lower length-specific fecundity in these strategies.Within the mantle lure strategy, length-standardizedfecundities were lowest in Epioblasma, which uses a host-trapping infection strategy in conjunction with lure display(see Section IV). Overall, the lowest observed values of length-standardized fecundity were for three species that produceconglutinates (Fusconaia burkei, F. ozarkensis, and Pleurobemacollina), and two species that apparently release glochidia inmucus webs (Alasmidonta heterodon, Elliptio complanata).
Patterns of length-standardized fecundity and hostuse were similar to those for infection strategy anddiffered significantly among groups (ANOVA, F = 10.10,P < 0.0001, N = 59). Length-standardized fecundity wassignificantly higher for species that use freshwater drumthan for all other host groups; among other groups fecunditydiffered only between species that use bass and those thatuse minnows (Fig. 7). In addition, length-specific fecunditywas high for each of the single species in the dataset that usegar (Lampsilis teres) and salmonids (Margaritifera margaritifera).Residuals were centered nearly on 0 for bass, sunfish,darter, sculpin, skipjack herring, mudpuppy, and sauger,suggesting that mussels using these hosts have similar length-specific fecundities. Most residuals for minnows, catfishes,and generalists were < 0, suggesting a weak trend of lower
length-specific fecundity for mussel species using these hostgroups. Despite these patterns, fecundity overlapped greatlyfor all host strategies.
(4) Relationships of reproductive effort andlife-history variables
Reproductive effort was not related to length, fecundity, orglochidial size, either for the combined dataset of observedand estimated values (P < 0.138–0.891, r2 = 0.001–0.107),or for observed values only (P < 0.850–0.960,r2 = 0.001–0.005). For observed and estimated REcombined, RE was strongly negatively related to lifespan(Fig. 8). For observed values only, lifespan explained aneven higher percentage of the variation in RE (P < 0.0001,r2 = 0.861). Reproductive effort also differed significantlyamong brooding strategies and was higher in long-termbrooders (ANOVA: F = 40.84, 1 d.f., P < 0.0001; Fig. 8).
(5) Models with multiple life-history variables
The multiple regression model including length, glochidialsize, lifespan, brooding period, and host infection strategysupported results of bivariate relationships and the primaryimportance of size in predicting fecundity. For the full dataset,size was clearly the most important variable determiningfecundity, and this model explained a large percentage of thevariation in fecundity (Table 4). However, glochidial size andhost-infection strategy were also significant factors althoughtheir sums of squares were much smaller than for length.Lifespan and brooding period were not significant factors. Inthe dataset excluding the five species identified as significantoutliers (Leptodea spp., Margaritifera margaritifera, and Truncillaspp.; see Section III.3), length was the only significant factorbut infection strategy was marginally significant; this modelexplained a similar proportion of the variation in fecundityas the full dataset (Table 4). For the 40 species in this dataset,length alone explained 73% of the variation in fecundity.This suggests that knowledge of infection strategy could
Biological Reviews 88 (2013) 745–766 Published 2013. This article is a U.S. Government work and is in the public domain in the USA.

760 Wendell R. Haag
-2
-1
0
1
2
3
4
Broadcaster1
Mantle lure2Conglutinate2
Mucus web2Mantle magazine2
-2
-1
0
1
2
3
4
drum
1
saug
er
catfi
sh2,
3
gene
ralis
t2,3
dart
er2,
3
sunf
ish2,
3
bass
2
gar
salm
onid
scul
pin2,
3
min
now
3
mud
pupp
y
skip
jack
her
ring
Leng
th-s
tand
ardi
zed
fecu
ndity
(A)
(B)
Fig. 7. Patterns of fecundity among host strategies of NorthAmerican freshwater mussels. (A) Shows variation in fecundityamong host-infection strategies and (B) shows variation amonghost-use strategies. For both (A) and (B), length-standardizedfecundity was obtained as the residuals of fecundity regressedon length (both log-transformed). Horizontal bars are meanresiduals for each group; groups with the same number are notsignificantly different (P > 0.05); on the (B), host groups withoutnumbers were not included in the analysis.
provide at best only a small improvement in prediction offecundity compared to length alone.
IV. DISCUSSION
Like many organisms, fecundity of mussels is stronglyrelated to body size, both within and among species. Withina population, a high proportion of variation in fecundityamong individuals is accounted for by shell length. Becausefecundity increases as a power function of length in mostspecies, large individuals are expected to contribute adisproportionately high fraction of reproductive output ina population. Age is typically a poorer predictor of musselfecundity (Haag & Staton, 2003), suggesting that fecundityis determined primarily by energetic constraints related tobody size. Although shell volume and mass were roughlyequivalent to length as predictors of fecundity, femalebody mass or condition may explain some of the variationin fecundity unaccounted for by length. In Margaritiferamargaritifera, heavier females produced more glochidia per
unit length, and there was an apparent body mass thresholdbelow which other females did not reproduce (Bauer, 1998).
The extent to which fecundity varies among populationsand the significance of this variation remains poorly known.In Elliptio arca, Fusconaia cerina, and Quadrula asperata, meanfecundity and length-specific fecundity did not differ amongpopulations in a river or among nearby rivers (see Haag &Staton, 2003). In other cases, mean fecundity differed widelybetween populations, but length-fecundity relationships weresimilar, and differences in fecundity were simply a result ofpopulation differences in adult size (e.g. Obliquaria reflexa,Pyganodon grandis). Growth rate and body size can beinfluenced to a large extent by environmental factors (seeHaag & Rypel, 2011), and concomitant differences infecundity are an expected consequence of this plasticity.More interesting are cases in which length-specific fecunditydiffers among populations, indicating different levels ofenergetic allocation to reproduction. Such differences havebeen documented among populations in different waterbodies (Amblema plicata, Pyganodon cataracta), and even amongpopulations in a river (Actinonaias ligamentina, Pleurobema
decisum; see Paterson & Cameron, 1985; Haag & Staton,2003; Moles & Layzer, 2008). The potential adaptivesignificance of these differences is unknown, but somealso may be simple responses to variation in body size.For example, even though length-specific fecundity differedwidely among populations of P. cataracta, these populationsalso differed in length-specific body mass, and fecundity didnot differ when expressed as a function of mass (Paterson& Cameron, 1985). Despite these examples, no studies haveexamined patterns of fecundity and reproductive allocationat large scales, such as across the geographic range of aspecies or across broad environmental gradients.
The great variation in fecundity among mussel speciessuggests that this may be an important trait for describingdivergent life-history strategies within the group. However,similar to within- and among-population variation, variationin fecundity among species was explained primarily by bodysize and there was little evidence of trade-offs betweenfecundity and other life-history traits. For most species,there was no evidence of a trade-off between fecundity andoffspring size, and little evidence of a trade-off betweenfecundity and lifespan. The degree of parental care investedin offspring was opposite to that predicted by life-historytheory: species that brood glochidia for extended periods(long-term brooders) had on average significantly higherfecundity than short-term brooders.
The strongest evidence for a fecundity trade-off are thediminutive glochidia of Margaritifera margaritifera, Leptodea spp.,and Truncilla spp., which are less than one third the size ofmost other species. Even though they have extraordinarilyhigh fecundity, RE of these species is lower than, or compa-rable to, many other species. This suggests that reduced ener-getic investment in individual glochidia allows maximizationof total glochidial output as predicted by life-history the-ory. A cost of small glochidia may be the requirement for anextended period of glochidial development on hosts (Howard
Biological Reviews 88 (2013) 745–766 Published 2013. This article is a U.S. Government work and is in the public domain in the USA.

Fecundity and reproductive effort in mussels 761
0
5
10
15
20
25
30
0 10 20 30 40 50 60 70 80
Re
prod
uctiv
e e
ffort
(%)
Lifespan (years)
observed RE
predicted RE
1.9
13.8
0
5
10
15
20
25
30(A) (B)
short-termbrooders
long-termbrooders
Fig. 8. Relationship between reproductive effort (RE), lifespan, and brooding period. (A) Regression equation is arcsinRE =−16.564(log lifespan) + 35.254; P < 0.0001, r2 = 0.632 (observed and predicted RE combined), but data are plotteduntransformed. (B) Horizontal bars indicate mean values back-transformed from arcsin-transformed data.
Table 4. Results of multiple regression models for predicting fecundity of freshwater mussels based on life-history variables
Variable d.f. Partial sums of squares F P < r2
Full dataset (N = 46) 8 24.470 30.29 0.0001 0.871Length 1 11.010 109.04 0.0001 —Glochidial size 1 1.575 15.60 0.0003 —Lifespan 1 0.003 0.03 0.8646 —Host-infection strategy 4 1.101 2.73 0.0444 —Brooding period 1 0.081 0.80 0.3766 —
Dataset without outliers (N = 40) 8 15.697 21.98 0.0001 0.850Length 1 9.731 109.00 0.0001 —Glochidial size 1 0.213 2.39 0.1326 —Lifespan 1 0.010 0.12 0.7355 —Host-infection strategy 4 0.884 2.47 0.0648 —Brooding period 1 0.001 0.01 0.9096 —
& Anson, 1922; Young & Williams, 1984; Steingraeber et al.,2007; Barnhart et al., 2008), during which the chances ofglochidial or host death are increased. Despite the costs ofsmall glochidia, the host-infection strategy of these speciesmay place them under strong selective pressure to maximizefecundity. Margaritifera margaritifera broadcasts free glochidiainto the water column where host infection apparently islargely a matter of chance and may be strongly dependenton high glochidial abundance in the drift (Murphy, 1942). InM. margaritifera, small glochidia are further thought to allowhigh fecundity despite the low productivity of streams inwhich it typically occurs (Bauer, 1998). Host-infection strate-gies of Leptodea spp. and Truncilla spp. are unknown, and theforces that may have selected for small glochidia and highfecundity in these species are unclear. Gravid female Trun-cilla spp. show subtle mantle movements that are absent inmales (B. Sietman, personal communication), but otherwise,both genera lack conspicuous mantle lures, conglutinates,or other obvious host attraction adaptations, suggesting thatthey also may broadcast free glochidia. Alternatively, itis proposed that their host, the molluscivorous freshwaterdrum, becomes infected with glochidia by feeding on gravidfemale mussels (Coker et al., 1921; Howard & Anson, 1922;Barnhart et al., 2008). This host-infection mode has not beendocumented directly, but small glochidia may make possible
the unusually high glochidial infestations typically seen ondrum (e.g. Surber, 1915; Coker et al., 1921; Weiss & Layzer,1995) therefore maximizing the benefits of female sacrifice.Regardless, the occurrence of this trait in two disparate mus-sel lineages (Margaritiferidae and Lampsilini) suggests that itis an adaptive trade-off rather than a phylogenetic artifact.
Diminutive glochidia also occur in the Quadrula quadrulagroup (including Q. rumphiana) and in Quadrula verrucosa(Barnhart et al., 2008). These species attract and infect hostswith mantle magazines, but this trait is shared with othermembers of the Quadrulini that do not have diminutiveglochidia (Cyclonaias tuberculata, Quadrula metanevra group, Q.pustulosa group; Barnhart et al., 2008; Sietman, Davis &Hove, 2012). Unlike other species with diminutive glochidia,fecundity is low in Q. rumphiana and is comparable to Q.asperata and Q. pustulosa, and much lower than Q. cylindrica, allof which have glochidia that are nearly three times larger thanQ. rumphiana. Consequently, the presence of small glochidia inthe Quadrulini clearly does not represent a trade-off allowinghigher fecundity, and the potential adaptive significance ofthis trait is unexplained.
There were no strong differences in fecundity amongother host-infection strategies suggesting that differencesin efficiency among these strategies have not been largeenough to exert substantial selective pressure on fecundity.
Biological Reviews 88 (2013) 745–766 Published 2013. This article is a U.S. Government work and is in the public domain in the USA.

762 Wendell R. Haag
Nevertheless, differences among or within some strategiescould reflect the relative efficiency of host infection. Forexample, the lower length-specific fecundity of Epioblasma
spp. compared to other species with mantle lures may bedue to the unusual host trapping behaviour exhibited bythese species. Females trap hosts (darters) between their shellvalves and pump glochidia over the fish’s gills (Barnhart et al.,2008); this behaviour may be highly efficient in transferringglochidia to hosts thus relaxing selection for high fecundity.For mantle-lure strategies that do not include host trapping,it is more difficult to propose that their generally highlength-specific fecundity reflects lower infection efficiencycompared with conglutinate, mucus web, and mantlemagazine strategies that are typically associated with lowlength-standardized fecundity. First, pelagic conglutinatesare composed of a large number of unfertilized eggs thatprovide structure to these conglutinates (Barnhart et al.,2008). These structural eggs represent an energetic cost tofemales and necessarily lower fecundity dramatically in thesespecies. Second, most species that produce mucus webs arehost generalists. Rather than reflecting the efficiency of theweb strategy itself in infecting fishes, lower fecundity maybe possible in these species because of a greater chance ofinfecting hosts brought about by a broadening of the hostresource. Finally, there is likely a phylogenetic componentto some of these patterns. For example, all species that usemantle magazines to infect hosts are in the Quadrulini, andlower fecundity for this strategy may be simply a shared,inherited trait within this lineage.
Other shared traits within lineages may be responsible fordifferences in fecundity among species or tribes. Broodingperiod and the area of the gill used for brooding have a strongphylogenetic component and may not be easily modified byselection. Brooding glochidia in the gills likely decreasesfeeding and respiratory efficiency. In the Anodontini andLampsilini, glochidia are brooded for an extended period,and gravid gills are greatly distended to several timestheir normal thickness leaving little or no space for watercirculation. This problem is dealt with in the Anodontiniby the development of accessory gill water tubes in gravidfemales (Richard et al., 1991; Tankersley & Dimock, 1993;Tankersley, 1996) and in the Lampsilini by using only asmall portion of the total gill area. In species that use theentire length of the gill for brooding and lack accessory watertubes (Margaritiferidae, Pleurobemini, Quadrulini), gills areusually incompletely filled with glochidia and are not greatlydistended. This condition has been interpreted as a result ofpoor fertilization success or female energetic status (Haggertyet al., 1995; Bauer, 1998). However, incompletely chargedgills seems to be a characteristic of these species (Coker et al.,1921; Haag & Staton, 2003) and, along with a short broodingperiod, may be necessary to maintain filtering and respiratoryefficiency. Such constraints could partially explain the lowfecundity of most Pleurobemini and Quadrulini.
In contrast to fecundity, patterns of variation in repro-ductive effort among species showed evidence of a strongtrade-off with lifespan as predicted by life-history theory. A
central tenet of life-history evolution is that, when resourcesare limiting, organisms with longer life spans shoulddevote less energy to reproduction per unit time comparedwith short-lived organisms (Williams, 1966; Stearns,1992; Charlesworth, 1994). High and early investment inreproduction can decrease lifespan because of diversion ofresources from somatic maintenance, and also because ofadult mortality associated with reproductive behaviours.In addition to differences among species, this trade-off alsoappears to be manifested among populations of a species.Reproductive effort of Amblema plicata from a long-livedpopulation in the Sipsey River (54 years) was about half thatof a short-lived population in the Little Tallahatchie River(18 years; see Haag & Rypel, 2011). Among 13 Finnish pop-ulations of Anodonta piscinalis, there was a negative correlationbetween RE and lifespan in one year when food resourcesappeared to be limiting, but this trade-off was not apparentwhen resources were more abundant (Haukioja & Hakala,1978). One unusual feature of RE in mussels is the higherreproductive effort of long-term brooders, which presumablyinvest more energy in parental care than short-term broodersand would be expected accordingly to devote less energy tooffspring production. Factoring in potential costs of broodingmay further widen differences in RE among species.
Trade-offs among life-history traits are depicted by theconcepts of the fast-slow continuum and r- and K - selection(Pianka, 1970; Promislow & Harvey, 1990; Bielby et al.,2007). In a fast life history (generally corresponding tor-selected species), high or variable extrinsic mortality isthought to favour fast growth and early and high investmentin reproduction, which results in decreased lifespan. Lowor constant mortality and increased competition selects forthe opposite suite of traits represented by a slow life history(K -selected species) (Arendt, 1997; Cichon, 1997).
In addition to the apparent trade-off between reproductiveeffort and lifespan, relationships among other mussel life-history traits are emerging that suggest a broad range oflife-history strategies in the group. Lifespan varies widelyamong mussel species, ranging from < 5 to > 100 years, andis strongly negatively related to growth rate such that speciesthat invest heavily in growth have predictably short lives(Haag & Rypel, 2011). Similarly, age at maturity rangesfrom < 1 to 20 years and also is negatively related togrowth rate but positively related to lifespan (Haag, 2012).Together, these relationships depict a continuum of life-history diversity with at least two endpoints corresponding tor-selected species with fast growth, short lifespan, high annualreproductive investment, and early maturity, and K -selectedspecies with the opposite suite of traits. Among species inthe present study, r-strategists include the lampsiline Leptodea
fragilis, and the anodontines Anodonta anatina, Pyganodon spp.,and Utterbackia imbecillis. Species at the K -selected end ofthe continuum include the Pleurobemini (Fusconaia spp.,Pleurobema spp.), Quadrulini, slow-growing populations ofAmblema plicata, and potentially lampsilines such as Obliquaria
reflexa and Obovaria unicolor. Despite its high fecundity,Margaritifera margaritifera has low reproductive effort, late age
Biological Reviews 88 (2013) 745–766 Published 2013. This article is a U.S. Government work and is in the public domain in the USA.

Fecundity and reproductive effort in mussels 763
at maturity, and a long lifespan concordant with a K -selected life-history strategy (Bauer, 1998). Other species inthis study fall at intermediate positions along the continuum,and for some, such as Amblema plicata, life-history traitsmay be plastic resulting in variable expression of life-historystrategy among populations in different environments (Haag,2012). Particularly interesting is the very low reproductiveeffort of Quadrula rumphiana, which was at least an order ofmagnitude lower than all other species. This species has onlya moderate life span (∼28 years), but its low reproductiveeffort and diminutive glochidia suggest that it represents aunique life-history strategy.
V. CONCLUSIONS
(1) Fecundity of North American mussel species spansnearly four orders of magnitude, but most species haveconsiderably lower fecundity than previous characterizationsfor the group (e.g. > 200000; McMahon & Bogan, 2001).Nevertheless, the primary role of body size in predictingfecundity suggests that glochidial production is mainlydetermined by physical and energetic constraints ratherthan trade-offs among life-history traits. For species thatbroadcast free glochidia, extraordinarily high fecundity atthe cost of reduced glochidial size may be selected for tomaximize chances of host infection in the drift. However,for most other species with more elaborate host-infectionstrategies, differences in fecundity among species may havelittle adaptive significance. The high fecundity seen in somemussel species has been explained as an adaptation associatedwith their parasitic life cycle (McMahon & Bogan, 2001).Parasites were long considered to have higher fecundity thanfree-living organisms to compensate for the high mortalitythat typically occurs during transmission to hosts (Poulin,1995; Whittington, 1997). However, recent studies haveshown that, similar to mussels, fecundity of many parasitesis primarily a function of body size, and length-specificfecundity of parasitic organisms is not different from free-living relatives (e.g. Trouve & Morand, 1998). Glochidiaexperience extremely high mortality (� 99%) betweenrelease from the female and recruitment to the benthicjuvenile stage, and recruitment can be highly variable amongyears probably according to environmental factors (Jansen,Bauer & Zahner-Meike, 2001; Haag, 2012). Accordingly,variation in fecundity has little influence on populationgrowth compared to adult survival (Haag, 2012). Despitethe traditional focus on fecundity as a measure of fitness,changes in adult survivorship are increasingly viewed ashaving a much greater effect on population growth in awide range of organisms (Crone, 2001). For mussels, as inother organisms, differences among habitats in the relativeimportance of environmental stochasticity and its effects onadult survivorship may be primary drivers of diversificationin life-history strategies, which in turn, influence speciesresponses to human impacts (Haag, 2012).
(2) Unlike fecundity, the relative allocation of energy toreproduction, as measured by reproductive effort, appearsto be an important variable for understanding mussel life-history evolution. The negative relationship between REand lifespan, as well as apparent trade-offs among otherlife-history traits, indicates a range of divergent life-historystrategies with endpoints similar to those described for manyother organisms (Haag, 2012; see also Winemiller & Rose,1992; Grime, 2001).
(3) Despite its strong relationship to other life-historyvariables, RE of freshwater mussels is generally low(mean = 7.2% in this study for dry-mass estimates) comparedwith marine bivalves, in which RE commonly exceeds40% (Dame, 1996). Further, estimates of RE that do notinclude the inorganic fraction of glochidial mass are abouthalf of estimates based on total dry mass, indicating evenlower investment in reproduction. This could suggest thatproduction of glochidia incurs comparatively little cost tofemale mussels, and consequently, patterns of reproductiveallocation may have had little role in shaping life histories (seeTuomi, Hakala & Haukioja, 1983). This idea is supportedby the observation that transplanting freshwater musselsamong sites with apparently varying productivity resultedin large changes in growth but only slight or no changesin reproductive output (Jokela & Mutikainen, 1995). Analternative explanation for this result is that allocationto reproduction is a high-priority heritable trait that isinfluenced by environmental variation to a lesser extentthan phenotypically plastic traits such as growth (Glazier,2002). Additional studies of RE in mussels, particularlythose addressing the influence of environmental and bioticfactors and accordant variation in RE among populations,will be valuable in elucidating mechanisms of life-historydiversification.
(4) Measures of RE based on biomass can be a usefulindex of relative differences among species or populations,but this method has several shortcomings (Roff, 1992). First,it does not account for potential differences in caloric contentof reproductive versus somatic tissues. Second, it is not basedon actual production and cannot account for differences inreproductive allocation over the life of an individual. In mostbivalves, allocation of production to gonads increases withage and often approaches 100% in older individuals withslow growth (Thompson, 1984; Nakaoka, 1994; Gosling,2003). In addition, differences in age at maturity amongspecies will influence schedules of reproductive allocationand their demographic consequences.
(5) Several issues specific to mussels also complicateaccurate estimation of RE. First, in the method used by Bauer(1998), measurements of adult female body mass includedthe mass of the soft tissue and the organic fraction of the shellonly, but glochidial mass included these components as wellas the inorganic fraction of glochidial shells. In my dataset,the mean inorganic fraction of glochidial mass across specieswas 62% – nearly three times higher than for adult tissuemass (mean = 22%) – resulting in estimates of RE based onash-free dry mass that were about half of those based on total
Biological Reviews 88 (2013) 745–766 Published 2013. This article is a U.S. Government work and is in the public domain in the USA.
764 Wendell R. Haag
dry mass. However, the inorganic fraction of glochidia maynot be completely cost-free for female mussels. For example,maternal carbon and calcium is transferred to developingglochidia (Wood, 1974; Silverman, Kays & Dietz, 1987), butthe magnitude of these and other contributions is unknown.Second, other aspects of reproduction likely incur as yetunspecified costs. Unfertilized structural eggs, membranesand pigments associated with complex conglutinates suchas those in Ptychobranchus spp., copious mucus produced inassociation with glochidia in many species, and reductionsin filtering efficiency associated with brooding all have anenergetic cost that must be accounted for. Production anddisplay of complex mantle lures in the Lampsilini doubtlessrequires considerable energy, and display of these lures mayexpose females to higher predation risk (Jones & Neves,2011). Third, reproductive periodicity is poorly known formany species and it is possible that some, particularly short-term brooders, produce multiple broods in a year (e.g. Price& Eads, 2011; see Haag, 2012). Frequent multiple-broodproduction would substantially alter the low annual fecundityand RE apparent for the Pleurobemini and Quadruliniunder the assumption of single broods. Finally, populationdynamics of most mussel species, particularly short-livedspecies, are poorly known. Short-lived species are expectedto have higher rates of instantaneous mortality, which isexpected to influence reproductive allocation (Haukioja &Hakala, 1978; Heino & Kaitala, 1997, 1999; Haag, 2012).
(6) The apparent breadth of mussel life histories contrastswith traditional depictions of the group as uniformlylong lived and with typically high fecundity. Effectiveconservation efforts will need to consider fundamentalecological differences among species because strategiesdesigned for long-lived, slow-growing species at the K -selected end of the life-history continuum may be ineffectivefor species with r-selected traits. For example, efforts toreestablish extirpated populations of short-lived species withhigh RE may require very large initial introductions tooffset the high natural mortality typically associated with thislife history. Short-lived species with high growth rates andhigh RE also may be dependent on high food availabilitymaking them more susceptible to food competition in densemussel assemblages. Understanding the evolution of mussellife histories and the factors that shape mussel assemblages isultimately dependent on specifying the selective forces thatregulate populations, particularly the roles of mortality anddensity dependence.
VI. ACKNOWLEDGEMENTS
I thank the following people for their various contributions tothis study. Steve Ahlstedt, Chris Barnhart, Ryan Evans, SteveFraley, Jeff Garner, Mark Hove, John Harris, Paul Johnson,Larry Shaffer, Jim Stoeckel, and Tom Watters providedor helped collect specimens. Chris Barnhart, Al Christian,Rachel Mair, Michael Stewart, Jess Jones, and Jim Layzerkindly provided unpublished data on fecundity of several
species. Leann Staton, Mickey Bland, Amy Commens-Carson, Angela Greer, Karen Higgins, Liz McQuire, andAnthony Rietl helped in the field and conducted much of thelaboratory work. This study was supported by the NationalFish and Wildlife Foundation, Weyerhaeuser Company, andthe Southern Research Station, US Forest Service.
VII. REFERENCES
Arendt, J. D. (1997). Adaptive intrinsic growth rates: an integration across taxa.Quaterly Review of Biology 72, 149–177.
Baird, M. S. (2000). Life history of the spectaclecase, Cumberlandia monodonta Say,
1829 (Bivalvia, Unionoidea, Margaritiferidae). M.S. Thesis: Southwest Missouri StateUniversity, Springfield.
Barnhart, M. C. (2001). Fish hosts and culture of mussel species of specialconcern. Unpublished report. Report to US Fish and Wildlife Service andMissouri Department of Conservation, Columbia. Available at http://biology.missouristate.edu/faculty_pages/Barnhart%20pubs/barnhart_pubs.htm.
Barnhart, M. C. (2002). Propagation and culture of mussel species of specialconcern. Unpublished report. Report to US Fish and Wildlife Service andMissouri Department of Conservation, Columbia. Available at http://biology.missouristate.edu/faculty_pages/Barnhart%20pubs/barnhart_pubs.htm.
Barnhart, M. C. (2003). Culture and restoration of mussel species ofconcern. Unpublished report. Report to US Fish and Wildlife Service andMissouri Department of Conservation, Columbia. Available at http://biology.missouristate.edu/faculty_pages/Barnhart%20pubs/barnhart_pubs.htm.
Barnhart, M. C., Haag, W. R. & Roston, W. N. (2008). Adaptations to hostinfection and larval parasitism in Unionoida. Journal of the North American Benthological
Society 27, 370–394.Bauer, G. (1994). The adaptive value of offspring size among freshwater mussels
(Bivalvia; Unionoidea). Journal of Animal Ecology 63, 933–944.Bauer, G. (1998). Allocation policy of female freshwater pearl mussels. Oecologia (Berlin)
117, 90–94.Benke, A. C., Huryn, A. D., Smock, L. A. & Wallace, J. B. (1999). Length-mass
relationships for freshwater macroinvertebrates in North America with particularreference to the southeastern United States. Journal of the North American Benthological
Society 18, 308–343.Bielby, J., Mace, G. M., Bininda-Emonds, O. R., Cardillo, M., Gittleman, J.
L., Jones, K. E., Orme, C. D. & Purvis, A. (2007). The fast-slow continuum inmammalian life history: an emperical reevaluation. American Naturalist 169, 748–757.
Blalock-Herod, H. N., Herod, J. & Williams, J. D. (2002). Evaluation ofconservation status, distribution, and reproductive characteristics of an endemicGulf Coast freshwater mussel, Lampsilis australis (Bivalvia: Unionidae). Biodiversity and
Conservation 11, 1877–1887.Bruenderman, S. A. & Neves, R. J. (1993). Life history of the endangered fine-rayed
pigtoe, Fusconaia cuneolus (Bivalvia: Unionidae) in the Clinch River, Virginia. American
Malacological Bulletin 10, 83–91.Cameron, C. J., Cameron, I. F. & Paterson, G. C. (1979). Contribution of organic
matter to biomass estimates of unionid bivalves. Canadian Journal of Zoology 57,1666–1669.
Campbell, D. C., Serb, J. M., Buhay, J. E., Roe, K. J., Minton, R. L.& Lydeard, C. (2005). Phylogeny of North American amblemines (Bivalvia,Unionoida): prodigious polyphyly proves pervasive across genera. Invertebrate Biology
124, 131–164.Charlesworth, B. (1994). Evolution in Age-Structured Populations. Cambridge University
Press, Cambridge.Charnov, E. L., Warne, R. & Moses, M. (2007). Lifetime reproductive effort.
American Naturalist 170, E129–E142.Cichon, M. (1997). Evolution of longevity through optimal resource allocation.
Philosophical Transactions of the Royal Society of London B 264, 1383–1388.Coker, R. E., Shira, A. F., Clark, H. W. & Howard, A. D. (1921). Natural history
and propagation of fresh-water mussels. Bulletin of the Bureau of Fisheries 37, 79–181.Crone, E. E. (2001). Is survivorship a better fitness surrogate than fecundity? Evolution
55, 2611–2614.Dame, R. F. (1996). Ecology of Marine Bivalves: An Ecosystem Approach. CRC Press, Boca
Raton.Eckert, N. L. (2003). Reproductive biology and host requirement differences among isolated
populations of Cyprogenia aberti (Conrad, 1850). MS Thesis: Missouri State University,Springfield.
Fobian, T. (2007). Reproductive biology of the rabbitsfoot mussel ( Quadrula cylindrica)
(Say, 1817) in the upper Arkansas River system. MS Thesis: Missouri State University,Springfield.
Biological Reviews 88 (2013) 745–766 Published 2013. This article is a U.S. Government work and is in the public domain in the USA.

Fecundity and reproductive effort in mussels 765
Garner, J. T., Haggerty, T. M. & Modlin, R. F. (1999). Reproductive cycleof Quadrula metanevra (Bivalvia: Unionidae) in the Pickwick Dam tailwater of theTennessee River. American Midland Naturalist 141, 277–283.
Glazier, D. S. (2002). Resource-allocation rules and the heritability of traits. Evolution
56, 1696–1700.Gosling, E. (2003). Bivalve Mollusks: Biology, Ecology, and Culture. Blackwell, Oxford.Graf, D. L. (2002). Molecular phylogenetic analysis of two problematic freshwater
mussel genera (Unio and Gonidea) and a re-evaluation of the classification of NearcticUnionidae (Bivalvia: Palaeoheterodonta: Unionoida). Journal of Molluscan Studies 68,65–71.
Grime, J. P. (2001). Plant Strategies, Vegetation Processes, and Ecosystem Properties. John Wiley& Sons, Chichester.
Gutierrez, J. L., Jones, C. G., Strayer, D. L. & Iribarne, O. O. (2003). Mollusksas ecosystem engineers: the role of shell production in aquatic habitats. Oikos 101,79–90.
Haag, W. R. (2012). North American Freshwater Mussels: Natural History, Ecology, and
Conservation. Cambridge University Press, Cambridge.Haag, W. R. & Rypel, A. L. (2011). Growth and longevity in freshwater mussels:
evolutionary and conservation implications. Biological Reviews 86, 225–247.Haag, W. R. & Staton, J. L. (2003). Variation in fecundity and other reproductive
traits in freshwater mussels. Freshwater Biology 48, 2118–2130.Haag, W. R. & Warren, M. L. (1997). Host fishes and reproductive biology of 6
freshwater mussel species from the Mobile Basin, USA. Journal of the North American
Benthological Society 16, 576–585.Haggerty, T. M., Garner, J. T., Patterson, G. H. & Jones, L. C. (1995). A
quantitative assesment of the reproductive biology of Cyclonaias tuberculata (Bivalvia:Unionidae). Canadian Journal of Zoology 73, 83–88.
Hanson, J. M., MacKay, W. C. & Prepas, E. E. (1989). Effect of size-selectivepredation by muskrats (Ondatra zibethicus) on a population of unionid clams (Anodontagrandis simpsoniana). Journal of Animal Ecology 58, 15–28.
Harmon, J. L. & Joy, J. E. (1990). Growth rates of the freshwater mussel, Anodonta
imbecillis Say 1829, in five West Virginia Wildlife Station ponds. American Midland
Naturalist 124, 372–378.Haukioja, E. & Hakala, T. (1978). Measuring growth from shell rings in populations
of Anodonta piscinalis (Pelecypoda, Unionidae). Annales Zoologici Fennici 15, 60–65.Heino, M. & Kaitala, V. (1997). Should ecological factors affect the evolution of age
at maturity in freshwater clams? Evolutionary Ecology 11, 67–81.Heino, M. & Kaitala, V. (1999). Evolution of resource allocation between growth
and reproduction in animals with indeterminate growth. Journal of Evolutionary Biology
12, 423–429.Hoggarth, M. A. (1999). Descriptions of some of the glochidia of the Unionidae
(Mollusca: Bivalvia). Malacologia 41, 1–118.Hove, M. C. & Neves, R. J. (1994). Life history of the endangered James spinymussel
Pleurobema collina (Conrad, 1837) (Mollusca:Unionidae). American Malacological Bulletin
11, 29–40.Howard, A. D. & Anson, B. J. (1922). Phases in the parasitism of the Unionidae.
Journal of Parasitology 9, 68–82.Jansen, W., Bauer, G. & Zahner-Meike, E. (2001). Glochidial mortality in
freshwater Mussels. In Ecology and Evolution of the Freshwater Mussels Unionoida,Ecological Studies (Volume 145, eds G. Bauer and K. Wachtler), pp. 185–211.Springer-Verlag, Berlin.
Jokela, J. & Mutikainen, P. (1995). Phenotypic plasticity and priority rules forenergy allocation in a freshwater clam: a field experiment. Oecologia 104, 122–132.
Jones, J. W. & Neves, R. J. (2002). Life history and propagation of the endangeredfanshell pearly mussel, Cyprogenia stegaria Rafinesque (Bivalvia: Unionidae). Journal of
the North American Benthological Society 21, 76–88.Jones, J. W. & Neves, R. J. (2011). Influence of life-history variation on demographic
responses of three freshwater mussel species (Bivalvia: Unionidae) in the ClinchRiver, USA. Aquatic Conservation: Marine and Freshwater Ecosystems 21, 57–73.
Jones, J. W., Neves, R. J., Ahlstedt, S. A., Hubbs, D., Johnson, M., Dan, H. &Ostby, B. J. K. (2010). Life history and demographics of the endangered birdwingpearlymussel (Lemiox rimosus) (Bivalvia:Unionidae). American Midland Naturalist 163,335–350.
Jones, J. W., Neves, R. J., Ahlstedt, S. A. & Mair, R. A. (2004). Life history andpropagation of the endangered dromedary pearlymussel (Dromus dromas) (Bivalvia:Unionidae). Journal of the North American Benthological Society 23, 515–525.
Kennedy, T. B. & Haag, W. R. (2005). Using morphometrics to identify glochidiafrom a diverse freshwater mussel community. Journal of the North American Benthological
Society 24, 880–889.McMahon, R. F. & Bogan, A. E. (2001). Mollusca: Bivalvia. In Ecology and
Classification of North American Freshwater Invertebrates (eds J. H. Thorp andA. P. Covich), pp. 321–429. Academic Press, San Diego.
Moles, K. R. & Layzer, J. B. (2008). Reproductive ecology of Actinonaias ligamentina
(Bivalvia: Unionidae) in a regulated river. Journal of the North American Benthological
Society 27, 212–222.Murphy, G. (1942). Relationship of the fresh-water mussel to trout in the Truckee
River. California Fish and Game 28, 89–102.
Nakaoka, M. (1994). Size-dependent reproductive traits of Yoldia notabilis (Bivalvia:Protobranchia). Marine Ecology Progress Series 114, 129–137.
O’Brien, C. A. & Williams, J. D. (2002). Reproductive biology of four freshwatermussels (Bivalvia: Unionidae) endemic to eastern Gulf Coastal Plain drainages ofAlabama, Florida, and Georgia. American Malacological Bulletin 17, 147–158.
Parker, R. S., Hackney, C. T. & Vidrine, M. F. (1984). Ecology and reproductivestrategy of a South Louisiana freshwater mussel, Glebula rotundata (Lamarck)(Unionidae:Lampsilini). Freshwater Invertebrate Biology 3, 53–58.
Paterson, C. G. (1985). Biomass and production of the unionid, Elliptio complanata
(Lightfoot) in an old reservoir in New Brunswick, Canada. Freshwater Invertebrate
Biology 4, 201–207.Paterson, C. G. & Cameron, I. F. (1985). Comparative energetics of two populations
of the unionid, Anodonta cataracta (Say). Freshwater Invertebrate Biology 4, 79–90.Perles, S. J., Christian, A. D. & Berg, D. J. (2003). Vertical migration, orientation,
aggregation, and fecundity of the freshwater mussel Lampsilis siliquoidea. Ohio Journal
of Science 103, 73–78.Pianka, E. R. (1970). On r- and K - selection. American Naturalist 104, 592–597.Pilarczyk, M. M., Stewart, P. M., Shelton, D. N., Heath, W. H. & Miller,
J. M. (2005). Contemporary survey and historical freshwater mussel assemblages insoutheast Alabama and northwest Florida and life history and host fish identificationof two candidate unionids (Quincuncina burkei and Pleurobema strodeanum). Unpublishedreport to US Fish and Wildlife Service, Panama City.
Poulin, R. (1995). Evolution of parasite life history traits: myths and reality. Parasitology
Today 11, 342–345.Price, J. E. & Eads, C. B. (2011). Brooding patterns in three freshwater mussels of
the genus Elliptio in the Broad River in South Carolina. American Malacological Bulletin
29, 121–126.Promislow, D. E. L. & Harvey, P. H. (1990). Living fast and dying young: a
comparative analysis of life-history variation among mammals. Journal of Zoology
(London) 220, 417–437.Regnier, C., Fontaine, B. & Bouchet, P. (2009). Not knowing, not recording, not
listing: numerous unnoticed mollusk extinctions. Conservation Biology 23, 1214–1221.Richard, P. E., Dietz, T. H. & Silverman, H. (1991). Structure of the gill during
reproduction in the unionids Anodonta grandis, Ligumia subrostrata, and Carunculina parva
texasensis. Canadian Journal of Zoology 69, 1744–1754.Roff, D. A. (1992). The Evolution of Life Histories: Theory and Analysis. Chapman
& Hall, New York.Rogers, S. O., Watson, B. T. & Neves, R. J. (2001). Life history and population
biology of the endangered tan riffleshell (Epioblasma florentina walkeri) (Bivalvia:Unionidae). Journal of the North American Benthological Society 20, 582–594.
van der Schalie, H. & van der Schalie, A. (1963). The distribution, ecology,and life history of the mussel, Actinonaias ellipsiformis (Conrad), in Michigan. Occasional
Papers of the Museum of Zoology, University of Michigan 633, 1–17.Sietman, B. E., Davis, J. M. & Hove, M. C. (2012). Mantle display and glochidia
release behaviors of five quadruline freshwater mussel species (Bivalvia: Unionidae).American Malacological Bulletin 30, 39–46.
Silverman, H., Kays, W. T. & Dietz, T. H. (1987). Maternal calcium contributionto glochidial shells in freshwater mussels (Eulamellibranchia:Unionidae). The Journal
of Experimental Zoology 242, 137–146.Stearns, S. C. (1992). The Evolution of Life Histories. Oxford University Press,
Oxford.Steingraeber, M. T., Bartch, M. R., Kalas, J. E. & Newton, T. J. (2007).
Thermal criteria for early life stage development of the winged mapleleaf mussel(Quadrula fragosa). American Midland Naturalist 157, 297–311.
Surber, T. (1915). Identification of the glochidia of fresh-water mussels. Report ofthe US Commissioner of Fisheries for 1914, Appendix 5 (Issued separately as USBureau of Fisheries Document 813), pp. 1–9.
Tankersley, R. A. (1996). Multipurpose gills: effect of larval brooding on the feedingphysiology of freshwater unionid mussels. Invertebrate Biology 115, 243–255.
Tankersley, R. A. & Dimock, R. V. (1993). The effect of larval brooding onthe filtration rate and particle-retention efficiency of Pyganodon cataracta (Bivalvia:Unionidae). Canadian Journal of Zoology 71, 1934–1944.
Thompson, R. J. (1984). Production, reproductive effort, reproductive value andreproductive cost in a population of the blue mussel Mytilus edulis from a subarcticenvironment. Marine Ecology Progress Series 16, 249–257.
Trouve, S. & Morand, S. (1998). Evolution of parasites’ fecundity. International Journal
of Parasitology 17, 1817–1819.Tuomi, J., Hakala, T. & Haukioja, E. (1983). Alternative concepts of reproductive
effort, costs of reproduction, and selection in life history evolution. American Zoologist
23, 25–34.Vaughn, C. C. & Hakenkamp, C. C. (2001). The functional role of burrowing
bivalves in freshwater ecosystems. Freshwater Biology 46, 1431–1446.Vaughn, C. C., Nichols, S. J. & Spooner, D. E. (2008). Community foodweb
ecology of freshwater mussels. Journal of the North American Benthological Society 27,409–423.
Weaver, L. R., Pardue, G. B. & Neves, R. J. (1991). Reproductive biology and fishhosts of the Tennessee clubshell Pleurobema oviforme (Mollusca:Unionidae) in Virginia.American Midland Naturalist 126, 82–89.
Biological Reviews 88 (2013) 745–766 Published 2013. This article is a U.S. Government work and is in the public domain in the USA.
766 Wendell R. Haag
Weiss, J. L. & Layzer, J. B. (1995). Infestations of glochidia on fishes in the BarrenRiver, Kentucky. American Malacological Bulletin 11, 153–159.
White, C. R. & Seymour, R. S. (2004). Does basal metabolic rate contain auseful signal? Mammalian BMR allometry and correlations with a selection ofphysiological, ecological, and life-history variables. Physiological and Biochemical Zoology
77, 929–941.Whittingham, M. J., Stephens, P. A., Bradbury, R. B. & Freckleton, R. P.
(2006). Why do we still use stepwise modelling in ecology and behaviour? Journal of
Animal Ecology 75, 1182–1189.Whittington, I. D. (1997). Reproduction and host location among the parasitic
platyhelminthes. International Journal of Parasitology 27, 705–714.Williams, G. C. (1966). Natural selection, the cost of reproduction and a refinement
of Lack’s principle. American Naturalist 100, 687–690.Williams, J. D., Bogan, A. E. & Garner, J. T. (2008). Freshwater Mussels of
Alabama and the Mobile Basin in Georgia, Mississippi and Tennessee. Universityof Alabama Press, Tuscaloosa.
Winemiller, K. O. & Rose, K. A. (1992). Patterns of life-history diversification inNorth American fishes: implications for population and regulation. Canadian Journal
of Fisheries and Aquatic Science 49, 2196–2218.Wood, E. M. (1974). Development and morphology of the glochidium larvae of
Anodonta cygnea (Mollusca: Bivalvia). Journal of Zoology (London) 173, 1–13.Yeager, B. L. & Neves, R. J. (1986). Reproductive cycle and fish hosts of the
rabbit’s foot mussel, Quadrula cylindrica strigillata (Mollusca:Unionidae) in the UpperTennessee River drainage. American Midland Naturalist 116, 329–340.
Young, M. & Williams, J. (1984). The reproductive biology of the freshwater pearlmussel Margaritifera margaritifera in Scotland. I. Field Studies. Archiv fur Hydrobiologie
99, 405–422.
(Received 31 January 2012; revised 22 January 2013; accepted 25 January 2013; published online 28 February 2013)
Biological Reviews 88 (2013) 745–766 Published 2013. This article is a U.S. Government work and is in the public domain in the USA.


