
The views expressed in this presentation are those of the author and do not represent the views or policies of the U.S. Environmental Protection Agency
The Production of Renewable Chemicals based on Sustainable Life Cycle Inventories
Gerardo J. Ruiz-Mercado, PhDU.S. Environmental Protection Agency
Office of Research & DevelopmentCincinnati, OH USA
III REUNIÓN NACIONAL DE LA RED TEMÁTICA EN BIOENERGÍAXII REUNIÓN NACIONAL DE LA RED MEXICANA DE BIOENERGÍA
October 19-21, 2016, Morelia, Mexico

• Office of Research and Development, ORD
• National Risk Management Research Laboratory, NRMRL
• Sustainable Technology Division, STD
Some research areas:Life Cycle Assessment, Impact Assessment, and Sustainable Chemistry
http://www.rwdconsultingllc.com/wp-content/uploads/2014/01/EPA_ohio1.jpghttp://savecincinnati.com/images/cincinnati%20skyline.jpg
U.S. EPAhttps://www3.epa.gov/
https://epa.maps.arcgis.com/apps/OnePane/basicviewer/index.html?appid=ef56449ae4f94eb1981a2df781704b70
Cincinnati, OH, USA
2

• Sustainability and Chemical Processes
• Sustainability Indicators
• GREENSCOPE Evaluation Tool
• GREENSCOPE Tool Demonstration and Case Study
• Sustainable Supply Chains and Life Cycles
• Challenges, Needs, and Opportunities to Advance Sustainability
• Student Opportunities at the EPA
3
Agenda

http://biconsortium.eu/sites/biconsortium.eu/files/pictures/Bio_Based_Basic_model.jpg
Sustainability and Chemical Processes
4

Sustainable Development
• This concept was placed in 1987
• “Our common future” report from the World Commission on Environment and Development (WCED):
“Development that meets the needs of the present without compromising the ability of future generations to meet their own needs.“
• This is the most widely accepted definition of sustainable development across the world
5

6
Sustainability for Chemical Processes
• Guidelines to achieve quality of life improvements
– without affecting the availability of ecological goods & services
• Assess and address and environmental, social, and economic aspects affected by industry
– identify which system components are affected
– localize process and product aspects which generate them
– redesign relevant processes and products & demonstrate system improvements
• Minimize or eliminate the environmental impacts and maximize the social/economic benefits

Sustainability for Chemical/Energy Synthesis
• Support decision-makers to determine whether a system is becoming more or less sustainable– Are we doing relatively good / bad?
• What benchmarks to use?• How close are we to achieve absolute targets? 7
Nonrenewable Resources
Env. & Ecological Processes
Dissipation & Impact Absorption
Renewable Resources Products
Releases
Chemical Process and Product Development

Sustainability and Process Design
Changes to improve sustainability at early design stageswill have greater influence on the sustainability of theprocess during operation
8

Sustainability Assessment
Economy
Society Environment
Sustainable
development
Eco-efficiency Socio- economic
Socio-ecology
Rele
ases
E
col. g
oods &
serv
ices
Revenues
Econ.
goods &
serv
ices
Releases
Ecol. goods & services
9
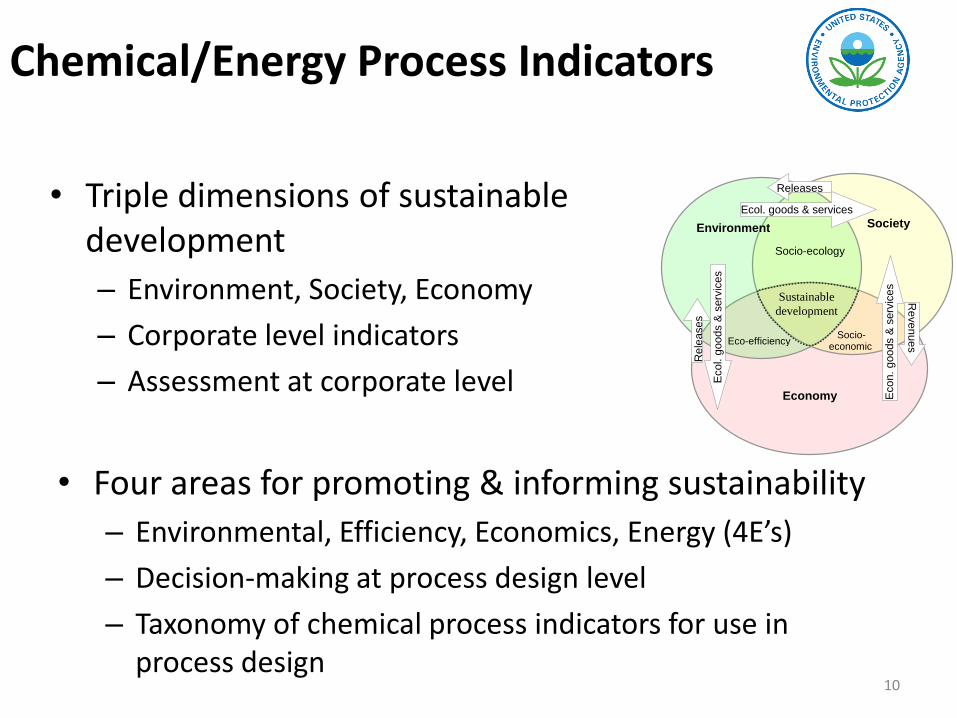
• Four areas for promoting & informing sustainability
– Environmental, Efficiency, Economics, Energy (4E’s)
– Decision-making at process design level
– Taxonomy of chemical process indicators for use in process design
10
Chemical/Energy Process Indicators
Economy
Society Environment
Sustainable
development
Eco-efficiency Socio- economic
Socio-ecology
Rele
ases
E
col. g
oods &
serv
ices
Revenues
Econ.
goods &
serv
ices
Releases
Ecol. goods & services
• Triple dimensions of sustainable development
– Environment, Society, Economy
– Corporate level indicators
– Assessment at corporate level

The GREENSCOPE Tool and Indicators
• Clear, practical, and user-friendly approach
• Monitor & predict sustainability at any process design stage
• Capable of calculating 139+ different indicators
• User can choose which indicators to calculate
• User can redefine absolute limits to fit circumstances 11

GREENSCOPE Sustainability Framework
Actual-Worst
% Sustainabilty Score = 100%Best-Worst 12
• Identification and selection of two reference states for each sustainability indicator:
– Best target: 100% of sustainability
– Worst-case: 0% of sustainability
• Two scenarios for normalizing the indicators on a realistic measurement scale
• Dimensionless scale for evaluating a current process or tracking modifications/designs of a new (part of a) process

Environmental (66)
Specifications of
process input material
(e.g., hazardous)
Operating conditions
and process operation
failures (health and
safety hazards)
Impact of components
utilized in the system
Potential impact of
releases
100% sust., best target,
no pollutants release,
& no hazardous
material use or
generation
Efficiency (26)
Quantities of inputs
required/product or a
specific process task
(e.g., separation)
Mass transfer
operations, energy
demand, equipment
size, costs, raw
materials, releases
Connect input/output
with product,
intermediate or
operation unit
The reference states are
defined as mass
fractions 0 x 1
Economic (33)
A sustainable
economic outcome
must be achieved
Based on profitability
criteria for projects
(process, operating
unit), may or may not
account for the time
value of money
Some cost criteria
Indicators: capital &
manufacturing costs;
Input costs: raw
material cost; Output
costs: waste
treatment costs
Energy (14)
Different
thermodynamic
properties used to
obtain energetic
sustainability scores
Energy (caloric);
exergy (available);
emergy (embodied)
Zero energy
consumption per unit of
product trend can be
best target
Most of the worst cases
depend on the
particular process or
process equipment
GREENSCOPE Indicators
13
14
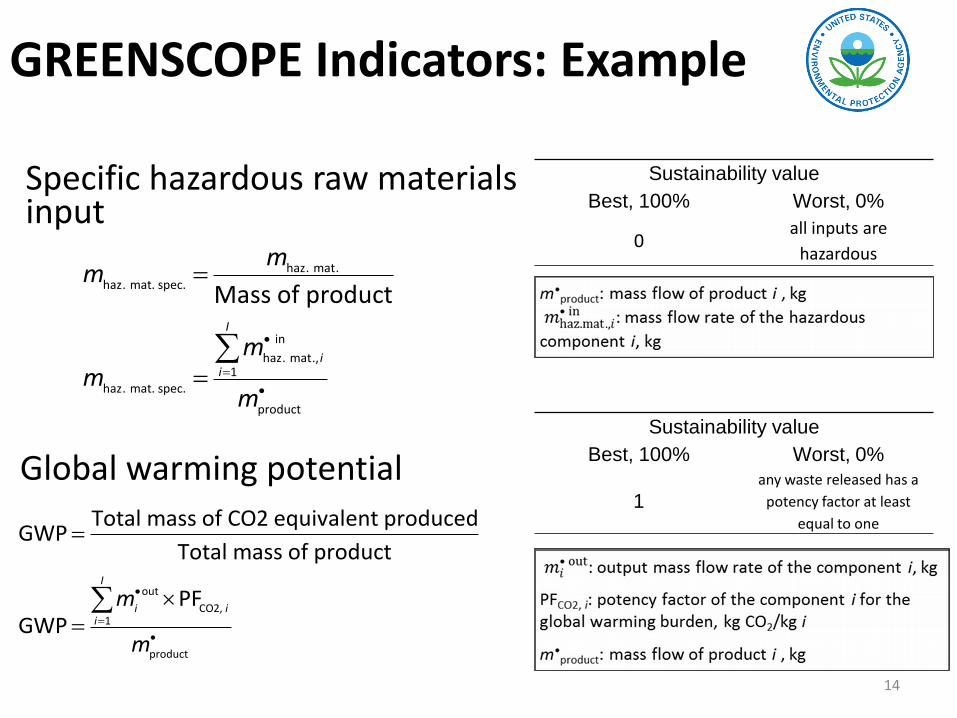
Specific hazardous raw materials input
Sustainability value
Best, 100% Worst, 0%
0all inputs are
hazardous
haz. mat.
haz. mat. spec.
in
haz. mat.,1
haz. mat. spec.
product
Mass of productI
ii
mm
mm
m
Global warming potential
out
CO2, 1
product
Total mass of CO2 equivalent producedGWP
Total mass of product
PFGWP
I
i ii
m
m
Sustainability value
Best, 100% Worst, 0%
1any waste released has a
potency factor at least
equal to one
GREENSCOPE Indicators: Example

GREENSCOPE
Design for Sustainability and GREENSCOPE Evaluation
15

Maleic Anhydride Production Process: Conventional Approach
• MA is produced at industrial scale for applications in coatings and polymers:
– Unsaturated polyester resin, production of fumaric and malic acid, lube oils as an additive, and maleic copolymers
• Currently, two main production routes:
– Benzene oxidation or other aromatic compounds
• Environmental concerns, increasing price of benzene
– Gas phase oxidation of n-butane
• Availability of n-butane as a feedstock
• Nonrenewable material 16

• Major components in the MA process
– Feedstock supply (benzene or n-butane), catalyst manufacture, air compression, reaction system, MA recovery/refining and off gas incineration
• Catalyst fixed bed reactor
– Vanadium-phosphorus-oxide (VPO) for n-butane
– V2O5-MoO3 for benzene
• Multiple parallel and in-series oxidization reactions not only to MA, but also to CO and CO2
• A large amount of water is produced
• Highly exothermic reactions17
Maleic Anhydride Production Process: Conventional Approach

• Feedstock: Bio-butanol (2G) with air
– Gas phase reaction, no solvent used
• Catalyst fixed bed reactor
– Catalyst: Vanadyl pyrophosphate
– Air in excess is compressed, heated and mixed with the feedstock before being fed to the reactor
– 3 s residence time
• T: 340 ºC; P: 1 bar
• Multiple oxidization reactions:
– MA, CO, CO2, H2O, phthalic anhydride, acetic acid, acrylic acid, and other “lights”, such as formaldehyde, butenes, lighter hydrocarbons 18
Maleic Anhydride Production Process: A Bio-based Approach

19
I
N
P
U
T
S
O
U
T
P
U
T
S
• Bio-butanol
• 98% butanol conversion
• Products: maleic anhydride,
acetic acid, acrylic acid,
phthalic anhydride, formalin
• Utilities: steam, electricity,
cooling water
• Liquid, & air releases
Maleic Anhydride from Bio-butanol CHEMCAD Process Simulation

Sustainability Assessment & Design: GREENSCOPE Tool
20
•Sustainability quantitative assessment•Individual or multiple process comparisons•Key factors, areas for improvements, optimal tradeoffs
Classification lists, energy conversion factors,
potency factors
Physicochemical, thermodynamic, and
toxicological properties
Equipment, raw material, utility, and product costs, annual salary, land cost
GREENSCOPE
Energy (e.g., steam) Products
ReleasesRaw material (e.g., oil)
CHEMCAD Simulation
Energy & massEquipment
Operating conditionsProduct & releases
Experimental dataPredicted dataProcess data
Literature dataAssumptions
Tools/Simulation
All indicator results Satisfied?
Potential sustainable
process
YES
NO
Process designDecision-making
Experimental work Process modeling & optimization
New process design specifications
GRNS.xls Template

Efficiency Indicator ResultsIndicator Description Sust. (%)
2. AEi Atom economy 5.8
7. MIv Value mass intensity 0
15. MRPMaterial recovery parameter
0
17. pROIM
Physical return on
investment99.4
23. Vwater, tot.
Total water
consumption100
21

Environmental Indicator Results
22
Indicator Description Sust. (%)
1. Nhaz. mat.
Number of hazardous
materials input75
6. HHirritation
Health hazard,
irritation factor68.5
10. SHreac/dec I
Safety hazard, reaction
/ decomposition I88.3
22. EHbioacc.
Environmental hazard,
bioaccumulation (the
food chain or in soil)
89.3
43. EPEutrophication
potential100
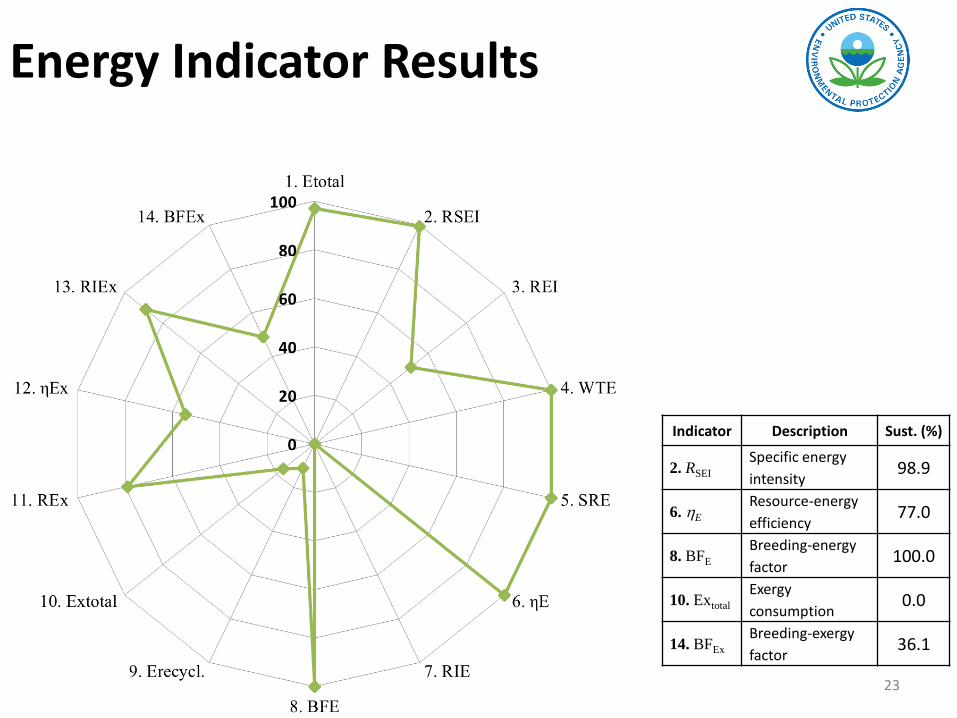
Energy Indicator Results
23
Indicator Description Sust. (%)
2. RSEI
Specific energy
intensity98.9
6. E
Resource-energy
efficiency77.0
8. BFE
Breeding-energy
factor100.0
10. Extotal
Exergy
consumption0.0
14. BFEx
Breeding-exergy
factor36.1

Economic Indicator Results
24
Indicator Description Sust. (%)
1. NPV Net present value 45.9
8. PBP Payback Period 92.0
19. COM Manufacturing cost 68.0
23. CE, spec. Specific energy costs 63.1
33. Cpur. air fract.
Fractional costs of
purifying air0.0

Life Cycle Inventory Results: GREENSCOPE Tool
25
Compound # Compound Name CAS Number
0: Waste; 1: Product; 2: Feedstock; 3: Catalyst; 4: Global reagent/Solvent; 5: Other (drying agent, additive, solvent, washing agent, etc.)
kg/hNet output waste, kg/h
Net product flow, kg/h
Input Output
1N-Butanol 71-36-3 2 7412.300 7.376 2.838 4.542Maleic Anhydride 108-31-6 1 0 890.546 0.000 890.553Water 7732-18-5 4 250.000 5488.405 1811.729 3676.684Carbon Monoxide 630-08-0 0 0 1017.527 1017.527 0.005Carbon Dioxide 124-38-9 0 0 1598.754 1598.754 0.006Phthalic Anhydride 85-44-9 1 0 1345.182 0.000 1345.187Acrylic Acid 79-10-7 1 0 2617.892 0.000 2617.898Acetic Acid 64-19-7 1 0 1088.059 249.033 839.039Nitrogen 7782-44-7 5 50425.200 50425.206 50425.206 0.00
10Oxygen 7727-37-9 2 14399.551 6407.793 6407.793 0.0011(E)-2-Butene 107-01-7 0 0 509.528 508.586 0.9412Formaldehyde 50-00-0 1 0 1090.707 146.153 944.55
Utility typeUtility flow rate needs, kg/h, m3/h, MJ/h, or kWh/h
Medium pressure steam @10 barg 184°C, 1/kg 9385.6599
Moderately low T Refrigerated water, Tin = 5 °C Tout = 15°C, 1/kg
2232940.6935
Electricity (kWh/h) 1980.1353

A Framework for More Sustainable Supply Chains & Life Cycles
26
http://epa.gov/climatechange/climate-change-waste/life-cycle-diagram.html#distribution

Global sustainability assessment
1. Raw material acquisition: removal of feedstocks and energy sources from the planet
2. Manufacturing: Valuable product production from the feedstocks and its delivery
3. Use: actual use, reuse, and maintenance of the product, energy requirements & releases
4. Recycling & disposal, energy requirements & releases, material management options 27
12
34

Global Sustainability: Implementing Improvements at Process Level
• Elimination of waste treatment units, decreasing capital and manufacturing costs
• No energy load for waste treatment units
• Reduce recycling
• Simplify separation / purification systems28
Natural Resources
FeedstockProduction
Product Distribution
Product Use
Ecological Goods & Services
Feedstock Logistics
UpstreamLife Cycle
DownstreamLife Cycle
Chemical production
Product
Atom economy Less or non toxic
solvents/reagents Minimum water use Minimum energy
needs Minimum or no
releases Sustainable design
Safe product Functional/effective Minimum or no
environmental risk Design for
degradation/ commercial afterlife
ProcessLevel
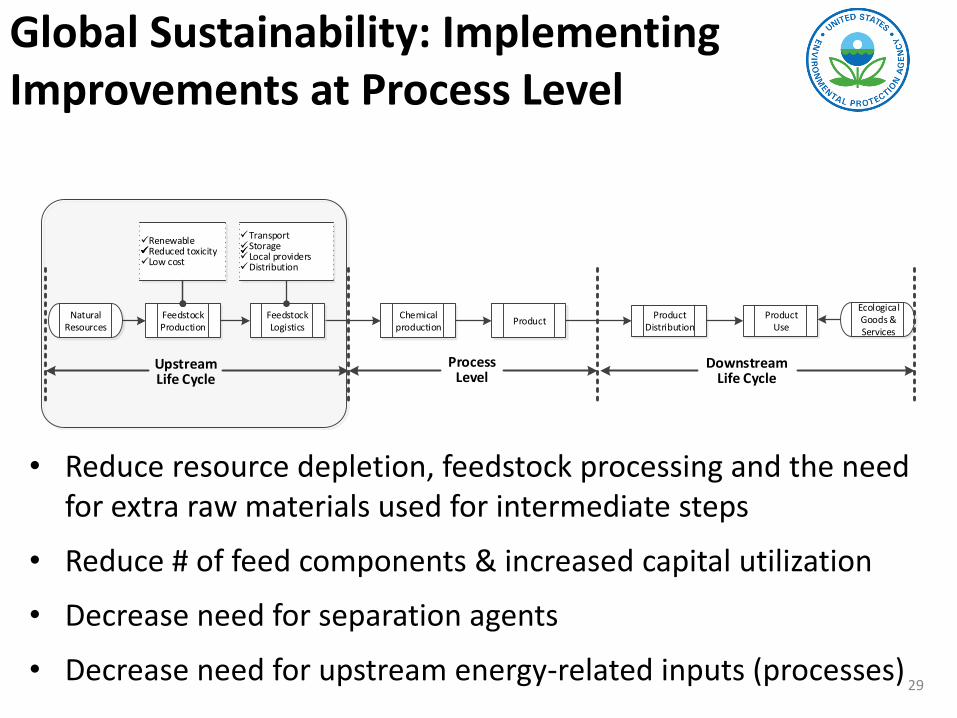
• Reduce resource depletion, feedstock processing and the need for extra raw materials used for intermediate steps
• Reduce # of feed components & increased capital utilization
• Decrease need for separation agents
• Decrease need for upstream energy-related inputs (processes)29
Chemical production
ProductProduct
DistributionProduct
Use
Ecological Goods & Services
ProcessLevel
DownstreamLife Cycle
Natural Resources
FeedstockProduction
Feedstock Logistics
Transport Storage Local providers Distribution
RenewableReduced toxicityLow cost
UpstreamLife Cycle
Global Sustainability: Implementing Improvements at Process Level
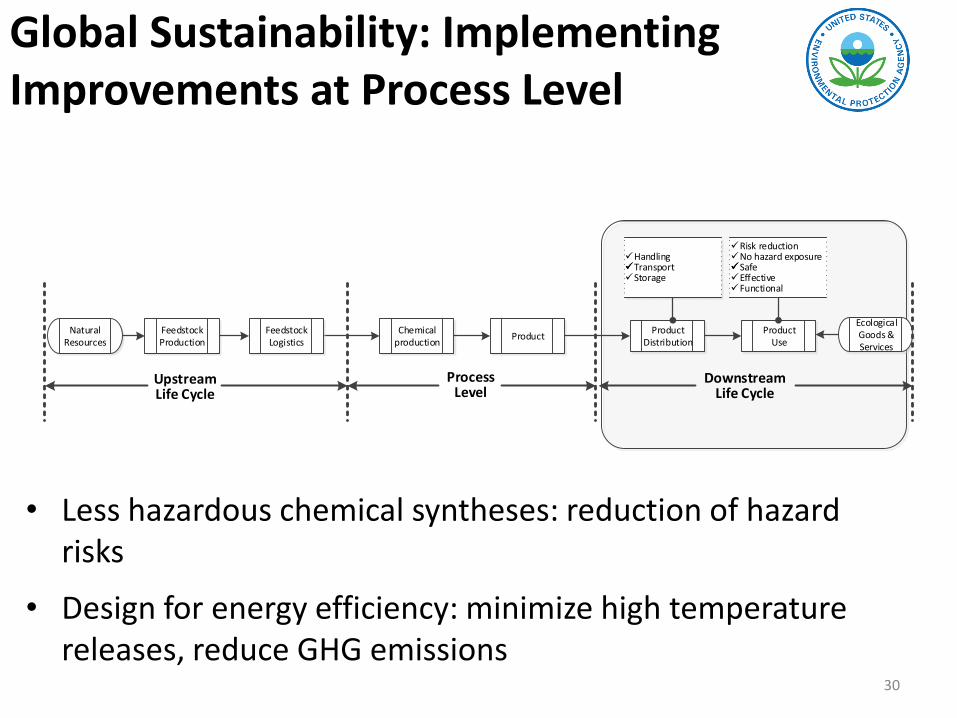
Global Sustainability: Implementing Improvements at Process Level
• Less hazardous chemical syntheses: reduction of hazard risks
• Design for energy efficiency: minimize high temperature releases, reduce GHG emissions
30
Natural Resources
FeedstockProduction
Chemical production
ProductFeedstock Logistics
UpstreamLife Cycle
ProcessLevel
Product Distribution
Product Use
Ecological Goods & Services
Handling Transport Storage
Risk reduction No hazard exposure Safe Effective Functional
DownstreamLife Cycle

Multi-Stakeholder Decision-Making and Conflict Resolution
• A decision-making framework to compute solutions by balancing
– Conflicting priorities
– Multiple stakeholders
– Multiple objectives
• To minimize stakeholder
dissatisfactions
• Effective for complex decision-making processes
31

Case Study: Sustainable Facility Location Selection
• To locate biowaste processing facilities in a geographical region in order to: – Minimize transportation – Maximize the distance between facilities and urban areas to
avoid safety and health concerns – Maximize the distance between facilities and watersheds to
avoid contamination– Minimize capital costs
• Other applications: wind farms, wastewater treatment facilities, landfills, etc.
• Multiple conflicting objectives and stakeholders• Location of facilities considering priorities of
communities, farmers, local/federal agencies, investors, etc.
32

Case Study: Sustainable Facility Location Selection
• Compromise solutions in terms of stakeholder dissatisfactions
• To provide a mechanism to explore and quantify the effect of opinions on final decisions
• Computing an entire Pareto set is not practical for problems with many competing objectives and stakeholder preferences
Minimize average dissatisfaction Minimize worst dissatisfactionA balance between the mean and the worst-case solutions 33

Integrated U.S. Biorefineries: The Needs For Local or Regional Values
• Energy crops: e.g., switchgrass, miscanthus, etc.
• Agricultural waste (cane bagasse), stover, waste bins, etc.
• Various combinations of raw material and conversion technologies

Remaining Challenges to Advance Sustainability
• Data availability for the calculation or prediction of sustainability using indicators
– Chemical process heterogeneity
– New chemical compounds
• Physicochemical properties
• Toxicity properties and classification lists
– Cost
• Technoeconomic assessment of unconventional equipment
• Time value variations
• Quantitative social indicators
• Multiproduct allocation for processes and facilities
– Mass, energy, value
• Legal foundations and the establishment of official methodologies and standards for the assessment of sustainability
SustainableSynthesis
Mass
Energy
Sustainable Manufacturing
35

Conclusions
36
SustainableSynthesis
Mass
Energy
Sustainable Manufacturing
• Sustainable development applied to chemical process
engineering
• Performance indicators for designing sustainable
processes at any scale or design phase
• GREENSCOPE quantifies results of sustainable
practices
– Modifications in the type and magnitude of goods and services
– Preventing and minimizing all types of releases
– Manufacturing the desired product & maximizing its economic
benefits
• More Sustainable Supply Chains
– Global sustainable processes and products (no burden shift)
– Connect the LCI with the decision-makers

Gerardo Ruiz-Mercado & Heriberto Cabezas
U.S. Environmental Protection Agency
Office of Research and Development
Sustainable Technology Division
Cincinnati, OH USA 45269
http://store.elsevier.comISBN 9780128020326

Acknowledgments
38
Drs. Michael A. Gonzalez & Raymond L. Smith, GREENSCOPE
Co-developers
Dr. Victor M. Zavala, U. Wisconsin-Madison, USA
Drs. José M. Ponce & Agustín J. Castro, Universidad
Michoacana de San Nicolás de Hidalgo
Comité Organizador del III RTB y XII REMBIO

Student Opportunities at the EPA
39
Fellowships and post-doctoral opportunities:
• American Association for the Advancement of Science (AAAS) Science and Technology Policy Fellowships
• Association of Schools and Programs of Public Health (ASPPH)/EPA Environmental Health Fellowship Program
• EPA Office of Research and Development Post-Doctoral Research Program
• Greater Research Opportunities (GRO) Undergraduate Fellowships
• National Academy of Sciences/National Research Council Resident Research Associateship Program
• Oak Ridge Institute for Science and Education (ORISE) Fellowships
• Presidential Management Fellows (PMF) Program
• Science to Achieve Results (STAR) Fellowships for Graduate Environmental Study

National Academy of Sciences/National Research Council Resident Research Associateship Program
40
• Post-doctoral, mid-career technical professionals, and Faculty at the assistant Professor level
• To work as visiting scientists at federal laboratories, including EPA, for periods of up to three years
• Opportunities for engineers, ecologists, mathematicians, statisticians, as well as other scientific backgrounds, for the future.
• The Program offers an attractive stipend, health insurance, and travel allowance
• Open to U.S. citizens, permanent residents and non-U.S. citizens
• https://www.epa.gov/careers/fellowships-scholarships-and-post-doctoral-opportunities#nas

Oak Ridge Institute for Science and Education (ORISE) Internships, Scholarships and Fellowships
41
• Internships and research project training opportunities funded by EPA and by other government and private sector organizations
• Opportunities are available year-round to science and engineering undergrads, grad students, recent grads, post-docs, faculty
• Open to U.S. citizens, permanent residents and non-U.S. citizens
• http://orise.orau.gov/epa/applicants/current-research-opportunities.aspx
• http://orise.orau.gov/science-education/internships-scholarships-fellowships/default.aspx

42
Thanks!
Questions?
Current Job Openings, Internships, Fellowships, Scholarships and Other Student Opportunities:https://www.epa.gov/careers• For Undergraduate, Post-BS/MSc/PhD Fellows


