©2014 Dairy Council of California and Society for Nutrition Education and Behavior
The Power of Protein: Separating Hype from Reality
May 6, 2014

©2014 Dairy Council of California and Society for Nutrition Education and Behavior
Objectives
1. Outline the multiple health benefits of protein, beyond
muscle building (e.g. satiety/weight mgmt., healthy
aging, blood sugar control, etc.)
2. Compare the IOM’s recommended range of protein
intake (10-35cal %) to the RDA minimum intake
(0.8g/kg/day) and identify specific demographic groups
that may benefit from the higher levels.
3. Design diets that include evenly-distributed protein
levels throughout the day from a variety of sources,
starting with breakfast.
4. Identify foods that are high-quality sources of protein.

©2014 Dairy Council of California and Society for Nutrition Education and Behavior
The Power of Protein: Separating Hype from Reality
Heather Leidy, PhD
Nutrition and Exercise Physiology
University of Missouri
Nancy R. Rodriguez, PhD, RD, FACSM
Kinesiology and Allied Health
University of Connecticut, Storrs

©2014 Dairy Council of California and Society for Nutrition Education and Behavior
Latest Research Exploring the Role of Protein Quantity & Timing of Consumption on Health
Outcomes
Heather Leidy, PhD
Nutrition and Exercise Physiology
University of Missouri
©2014 Dairy Council of California and Society for Nutrition Education and Behavior
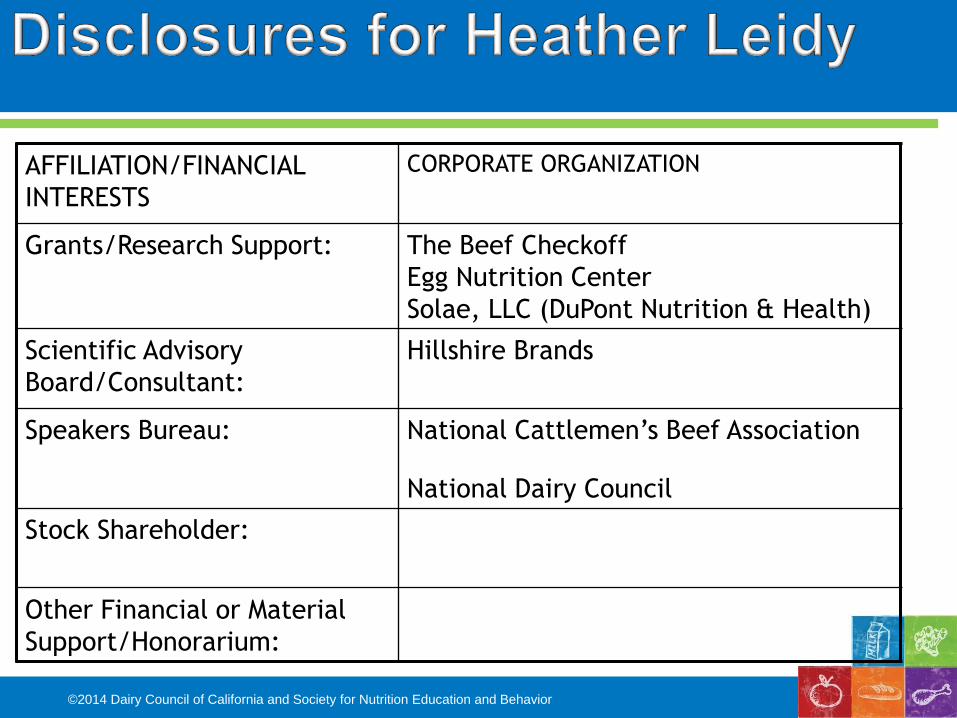
AFFILIATION/FINANCIAL
INTERESTS
CORPORATE ORGANIZATION
Grants/Research Support: The Beef Checkoff
Egg Nutrition Center
Solae, LLC (DuPont Nutrition & Health)
Scientific Advisory
Board/Consultant:
Hillshire Brands
Speakers Bureau: National Cattlemen’s Beef Association
National Dairy Council
Stock Shareholder:
Other Financial or Material
Support/Honorarium:

©2014 Dairy Council of California and Society for Nutrition Education and Behavior
Protein Benefits: Assembling the Pieces
Increased Dietary Protein
WeightLoss
Fat Loss
Lean Mass
Retention
Reduced Intake
Benefits
• Weight Management
• Healthy Living
• Sarcopenia
• Type 2 Diabetes
• Obesity
(across the lifespan)

©2014 Dairy Council of California and Society for Nutrition Education and Behavior
High Protein, Energy Restriction Diets
Wycherley TP, et al., 2012; AJCN; 96: 1281-98
Meta-analysis
• 24 trials in 1063 adults
• Duration of energy restriction:
12 ± 9 wk
• Intake: 1550 ± 270 kcal
Standard Protein Diet:
0.72 g·kg-1·d-1 (18 ± 2%)
High Protein Diet:
1.25 g·kg-1·d-1 (30 ± 2%)
Pre/Post Change
*
*
*

©2014 Dairy Council of California and Society for Nutrition Education and Behavior
High Protein following Weight Loss
Lejeune et al., 2005; Brit J Nutr; 93: 281-289
4 wk VLED followed by 6 month weight maintenance in 113 adults
NP: 15% Protein
HP: 18% Protein (additional 30 g protein/day)
Compared to NP, the HP Group:
• Lower % Weight Regain:
20 vs. 60%, p<0.05
****
*HP vs. NP p<0.05
Weight Loss/Re-gain

©2014 Dairy Council of California and Society for Nutrition Education and Behavior
VLED 3 months 6 months
*
*
HP vs. NP p<0.05
Fat Loss/Re-gain
Lejeune et al., 2005; Brit J Nutr; 93: 281-289
****
*HP vs. NP p<0.05
High Protein following Weight Loss
Weight Loss/Re-gain
4 wk VLED followed by 6 month weight maintenance in 113 adults
NP: 15% Protein
HP: 18% Protein (additional 30 g protein/day)

©2014 Dairy Council of California and Society for Nutrition Education and Behavior
High Protein & Energy Intake
Weigle et al. 2005 Am J Clin Nutr; 41-48
-441 ± 63 kcal/d
Body Weight
Daily Intake
NP HP HP-Ad Libitum
-4.9 ± 0.5 kg
5-month long-term ‘free-living’ study
2 weeks of normal protein & 2 weeks of high protein (30% of intake)
12 weeks of high protein (free-living)

©2014 Dairy Council of California and Society for Nutrition Education and Behavior
Increased Dietary Protein
WeightLoss
Fat Loss
‘Metabolism’RMRTEF
Lean Mass
Retention
Reduced Intake
*
Wycherley TP, et al., 2012; AJCN; 96: 1281-98; Lejeune et al., 2005; Brit J Nutr; 93: 281-289; Skov et al. 1999 Int J
Obesity; 5238-536; Leidy, 2010 Int J Obesity; 34(7): 1125-1133; Leidy, 2011 Obesity 19(10): 2019-2025
Protein Benefits: Assembling the Pieces

©2014 Dairy Council of California and Society for Nutrition Education and Behavior
Increased Dietary Protein
WeightLoss
Fat Loss
‘Metabolism’TEF
RMR
Lean Mass
Retention
ProteinSynthesis
Reduced Intake
*
Symons et al., 2007; AJCN 86: 451-456
Protein Benefits: Assembling the Pieces
Acute Protein-rich Meal Response
30 g protein was consumed
5h protein synthesis measured

©2014 Dairy Council of California and Society for Nutrition Education and Behavior
Increased Dietary Protein
WeightLoss
Fat Loss
‘Metabolism’TEF
RMR
Lean Mass
Retention
ProteinSynthesis
FoodReward/ Cravings
Satiety/Satiation
Reduced Intake
Why do we eat?
Why do we stop?
Protein Benefits: Assembling the Pieces

©2014 Dairy Council of California and Society for Nutrition Education and Behavior
Reward-driven
‘Hunger’
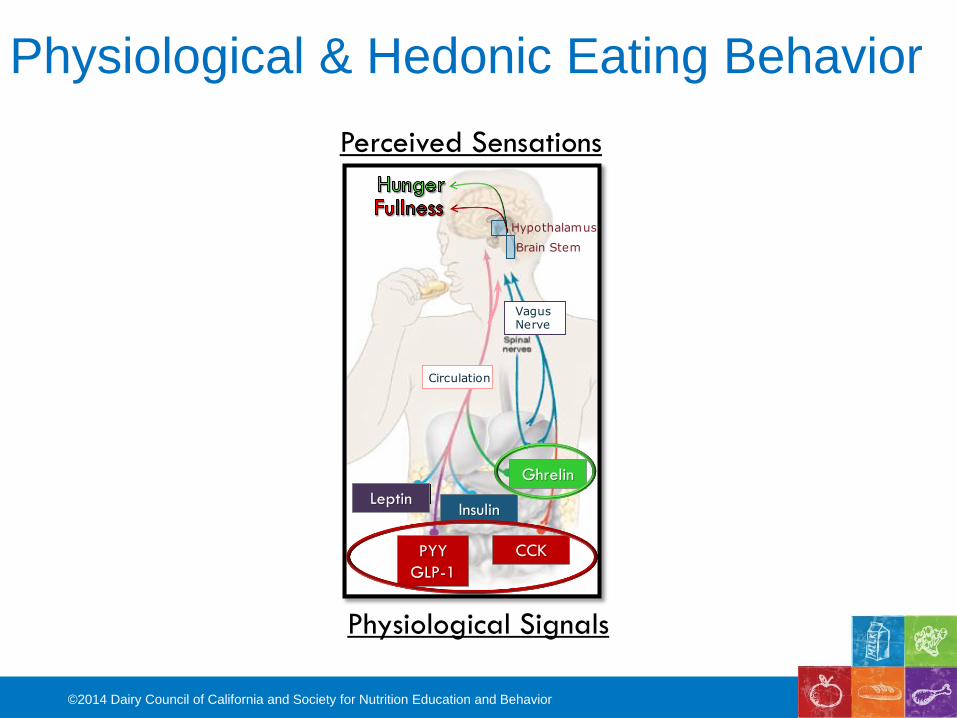
Physiological & Hedonic Eating Behavior
Physiological
Hunger
Reward-driven
SatisfactionPhysiological
Satiety
©2014 Dairy Council of California and Society for Nutrition Education and Behavior
Circulation
VagusNerve
Pancreas
Stomach
DuodenumIleum
Adipose
Hypothalamus
Brain Stem
Leptin
Ghrelin
Insulin
PYY
GLP-1
CCK
Perceived Sensations
Physiological Signals
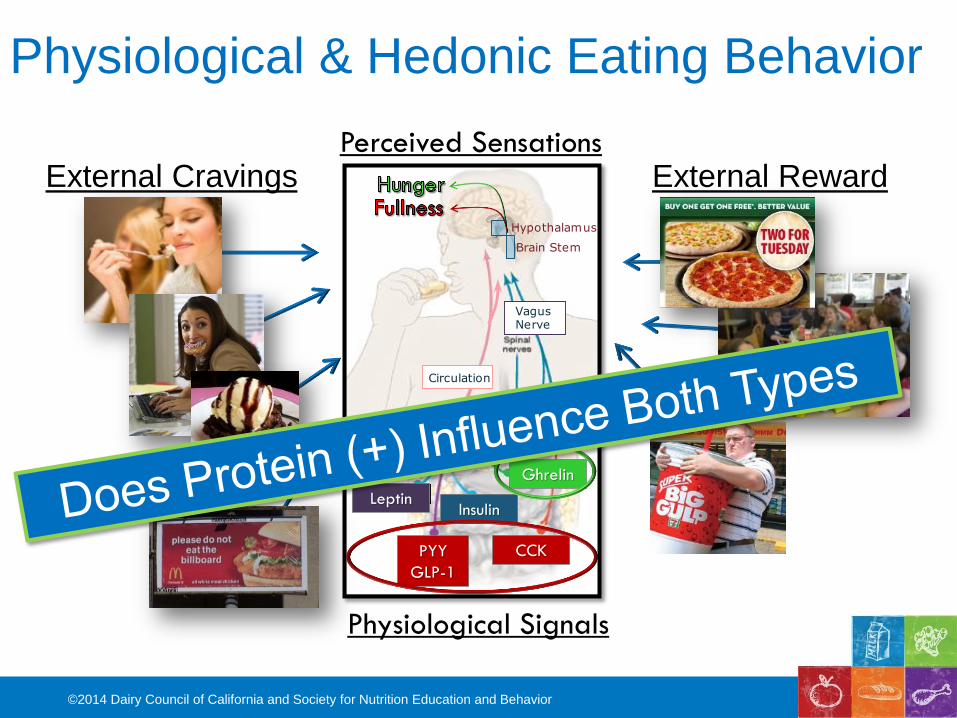
Physiological & Hedonic Eating Behavior
©2014 Dairy Council of California and Society for Nutrition Education and Behavior
Circulation
VagusNerve
Pancreas
Stomach
DuodenumIleum
Adipose
Hypothalamus
Brain Stem
Leptin
Ghrelin
Insulin
PYY
GLP-1
CCK
Perceived Sensations
Physiological Signals
Physiological & Hedonic Eating Behavior
External Cravings External Reward
©2014 Dairy Council of California and Society for Nutrition Education and Behavior
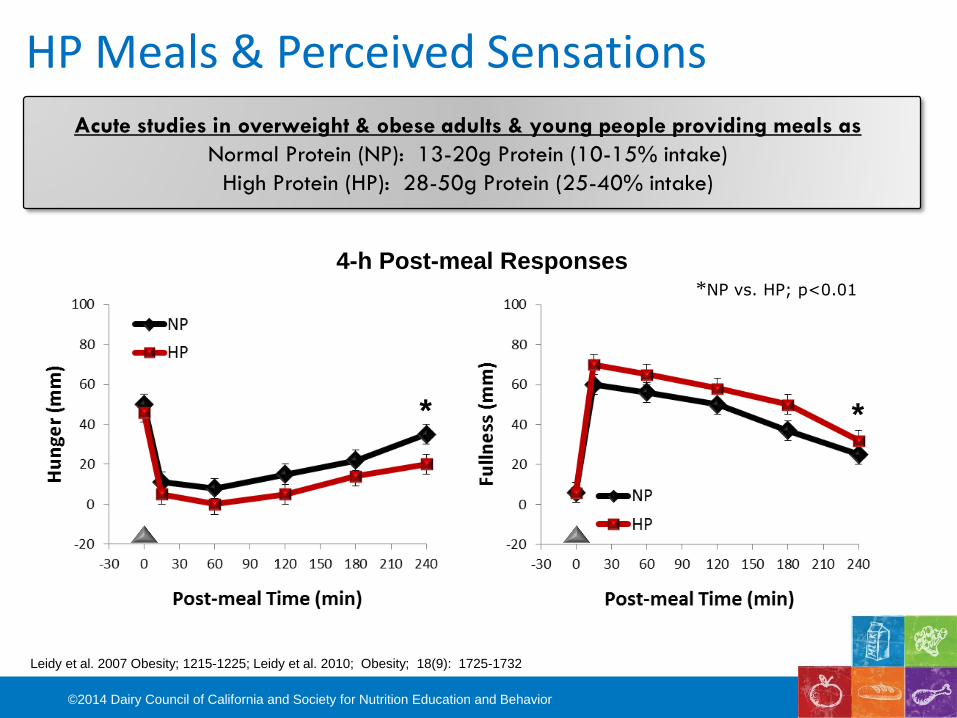
HP Meals & Perceived Sensations
* *
*NP vs. HP; p<0.01
Leidy et al. 2007 Obesity; 1215-1225; Leidy et al. 2010; Obesity; 18(9): 1725-1732
4-h Post-meal Responses
Acute studies in overweight & obese adults & young people providing meals as
Normal Protein (NP): 13-20g Protein (10-15% intake)
High Protein (HP): 28-50g Protein (25-40% intake)

©2014 Dairy Council of California and Society for Nutrition Education and Behavior
HP Meals & Hormonal Responses
Leidy et al. 2007 Obesity; 1215-1225; Leidy et al. 2010; Obesity; 18(9): 1725-1732
Acute studies in overweight & obese adults & young people providing meals as
Normal Protein (NP): 13-20g Protein (10-15% intake)
High Protein (HP): 28-50g Protein (25-40% intake)
*
*
4-h Post-meal Responses
*NP vs. HP; p<0.01

©2014 Dairy Council of California and Society for Nutrition Education and Behavior
Acute study in 15 adults; 160 kcal afternoon snacksNo Snack: 0 g Protein
Yogurts: 5 g, 14 g, or 24 g protein/serving
Douglas, Leidy et al. 2012; Appetite; 58(1): 117-122
c
b
b
a2h
2 ½ h
2 ½ h
3h
HP Meals & Eating Initiation

©2014 Dairy Council of California and Society for Nutrition Education and Behavior
HP Meals & Food Reward/Cravings
Leidy, 2011 Obesity 19(10): 2019-2025;
NP B
rea
kfa
stH
P B
rea
kfa
st
Insula
(food cravings)
Pre-frontal
(executive control)
Acute studies in overweight & obese teens providing meals as
Normal Protein (NP): 13-18g Protein (14-18% intake)
High Protein (HP): 35-50g Protein (40% intake)
Pre-Lunch Activation (NP > HP)Pre-lunch Food Stimuli

©2014 Dairy Council of California and Society for Nutrition Education and Behavior
Dietary Factors
• Quantity (How much?)
• Quality (What type?)
• Food Form (What form?)
• Timing of Consumption (When?)
Increased Dietary Protein
WeightLoss
Fat Loss
‘Metabolism’TEF
RMR
Lean Mass
Retention
ProteinSynthesis
FoodReward/ Cravings
Satiety/Satiation
Reduced Intake
Protein Benefits: Assembling the Pieces
©2014 Dairy Council of California and Society for Nutrition Education and Behavior
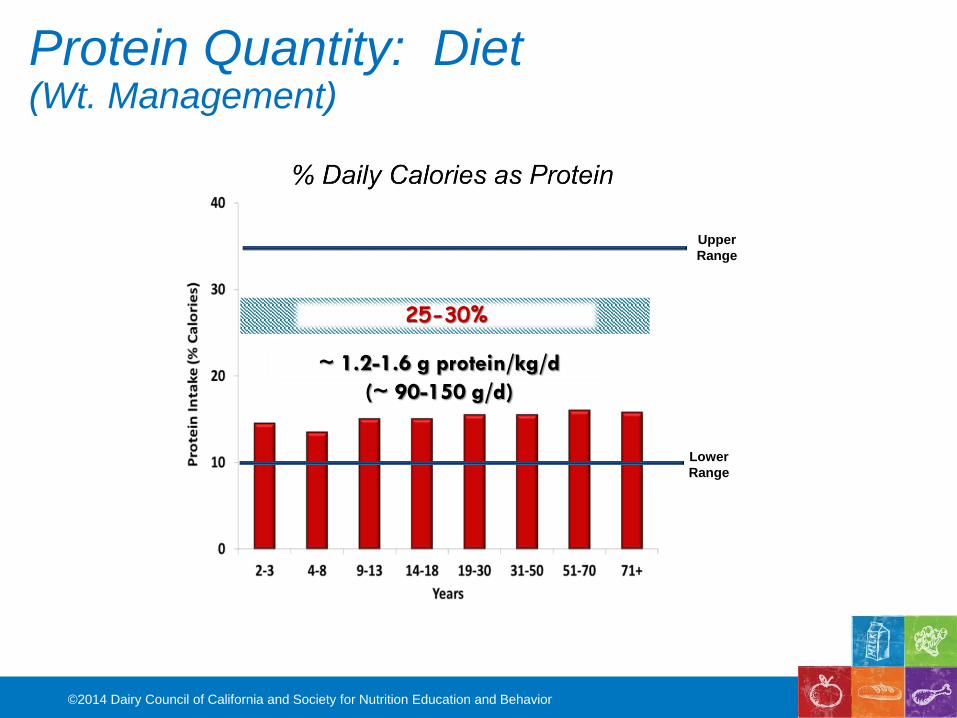
Lower
Range
Upper
Range
25-30%
~ 1.2-1.6 g protein/kg/d
(~ 90-150 g/d)
Protein Quantity: Diet(Wt. Management)

©2014 Dairy Council of California and Society for Nutrition Education and Behavior
Paddon-Jones & Leidy; Curr Opin Clin Nutr Metab Care; 2013 17: 5-11
*
Reference
Lower
Protein
(g)
Higher
Protein
(g)
Energy
(kcal)
Stubbs, 1999 66 207 1400
Stubbs, 1996 58 185 1400
Batterham, 2006 46 178 1100
Brennan, 2012 28 127 1130
Foster-Schubert, 2008 13 100 500
Belza, 2013 24 88 700
Barkeling, 1990 16 64 600
Van der Klaauw, 2013 20 60 400
Boelsma, 2010 17 59 675
Blom, 2006 19 57 400
El Khoury, 2010 14 55 550
Vozzo, 2003 25 51 700
Leidy, 2010 26 46 700
Leidy, 2010 26 46 500
Belza, 2013 24 44 700
Veldhorst, 2009 15 38 600
Veldhorst, 2009 15 38 600
Veldhorst, 2009 15 38 600
Al Awar, 2005 20 36 400
Smeets, 2008 14 35 350
Leidy, 2013 13 35 350
Leidy, 2007 17 28 400
Makris, 2011 12 24 350
Karhunen, 2010 3 20 300
Protein Quantity: Meal (?)R
ed: s
ig. satiety
diffe
rences
Acute Meal Responses
Consumption of 350 kcal meals containing
15-30 g protein/meal
©2014 Dairy Council of California and Society for Nutrition Education and Behavior
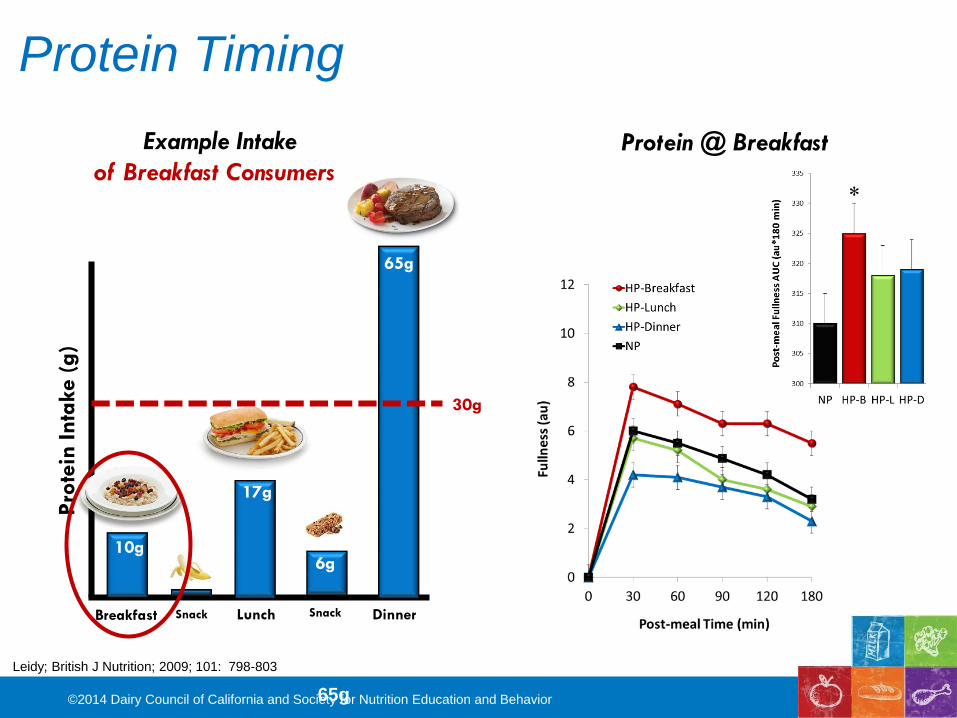
Breakfast Lunch DinnerSnack Snack
Pro
tein
Inta
ke (
g)
10g
17g
65g
65g
6g
30g
Example Intake
of Breakfast Consumers
Protein @ Breakfast
*
Leidy; British J Nutrition; 2009; 101: 798-803
Protein Timing

©2014 Dairy Council of California and Society for Nutrition Education and Behavior
Breakfast Lunch DinnerSnack Snack
Pro
tein
Inta
ke (
g)
10g
17g
65g
65g
6g
30g
Example Intake
of Breakfast Consumers
Leidy; British J Nutrition; 2009; 101: 798-803
Protein Timing
Breakfast Frequency
©2014 Dairy Council of California and Society for Nutrition Education and Behavior
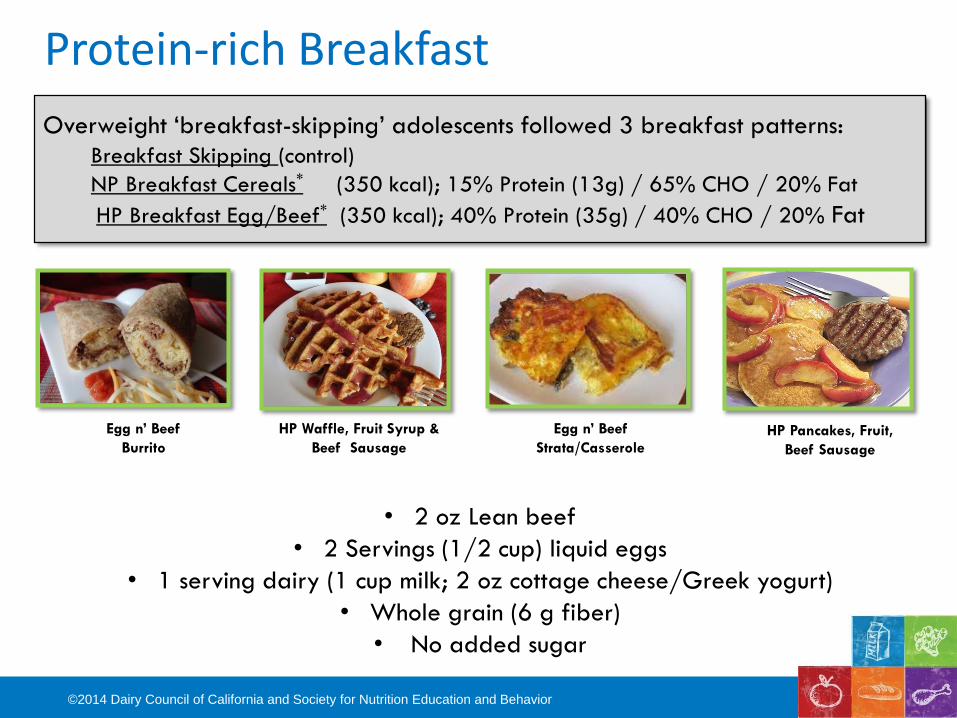
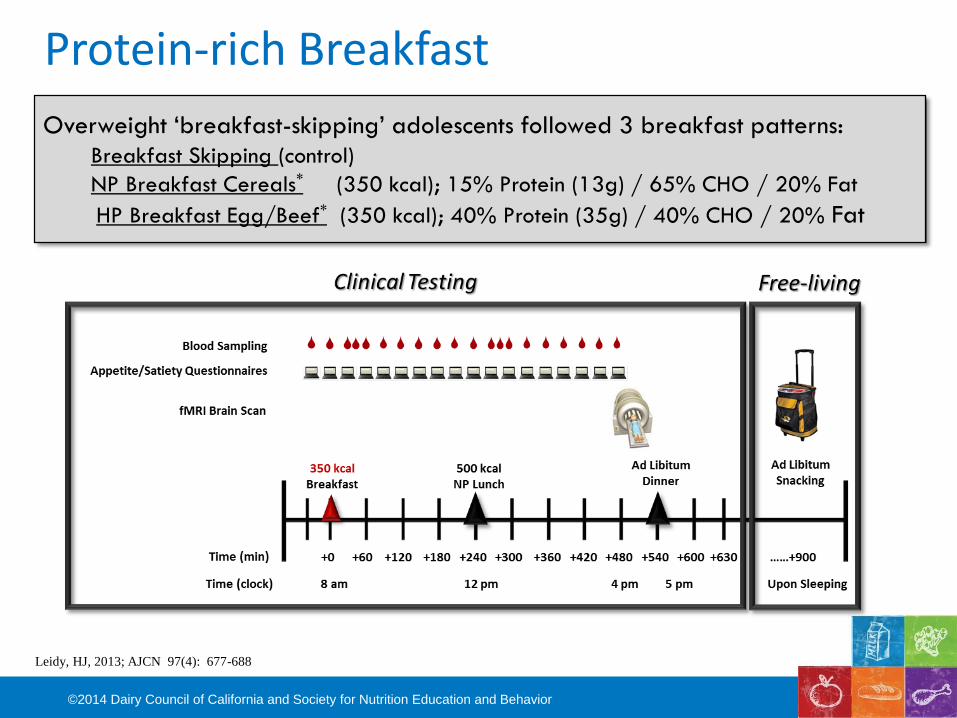
Protein-rich Breakfast
Overweight ‘breakfast-skipping’ adolescents followed 3 breakfast patterns:
Breakfast Skipping (control)
NP Breakfast Cereals* (350 kcal); 15% Protein (13g) / 65% CHO / 20% Fat
HP Breakfast Egg/Beef* (350 kcal); 40% Protein (35g) / 40% CHO / 20% Fat
Egg n’ Beef
Burrito
HP Waffle, Fruit Syrup &
Beef Sausage
Egg n’ Beef
Strata/Casserole
• 2 oz Lean beef
• 2 Servings (1/2 cup) liquid eggs
• 1 serving dairy (1 cup milk; 2 oz cottage cheese/Greek yogurt)
• Whole grain (6 g fiber)
• No added sugar
HP Pancakes, Fruit,
Beef Sausage
©2014 Dairy Council of California and Society for Nutrition Education and Behavior
Leidy, HJ, 2013; AJCN 97(4): 677-688
Protein-rich Breakfast
Overweight ‘breakfast-skipping’ adolescents followed 3 breakfast patterns:
Breakfast Skipping (control)
NP Breakfast Cereals* (350 kcal); 15% Protein (13g) / 65% CHO / 20% Fat
HP Breakfast Egg/Beef* (350 kcal); 40% Protein (35g) / 40% CHO / 20% Fat
©2014 Dairy Council of California and Society for Nutrition Education and Behavior
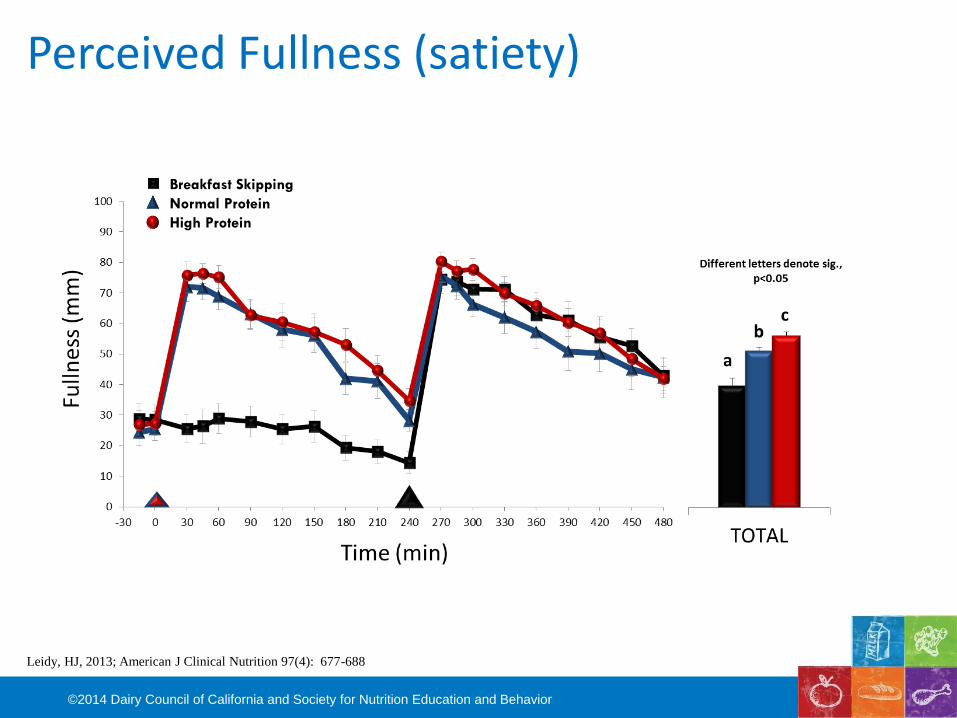
Perceived Fullness (satiety)
Leidy, HJ, 2013; American J Clinical Nutrition 97(4): 677-688
Breakfast Skipping
Normal Protein
High Protein
©2014 Dairy Council of California and Society for Nutrition Education and Behavior
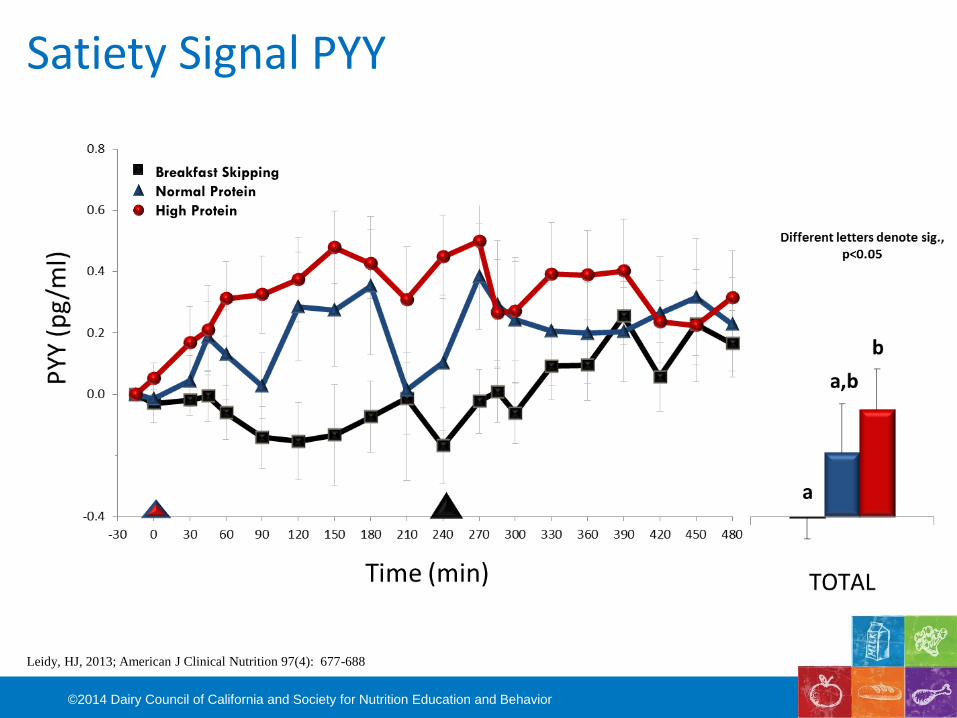
Satiety Signal PYY
Breakfast Skipping
Normal Protein
High Protein
Leidy, HJ, 2013; American J Clinical Nutrition 97(4): 677-688
©2014 Dairy Council of California and Society for Nutrition Education and Behavior
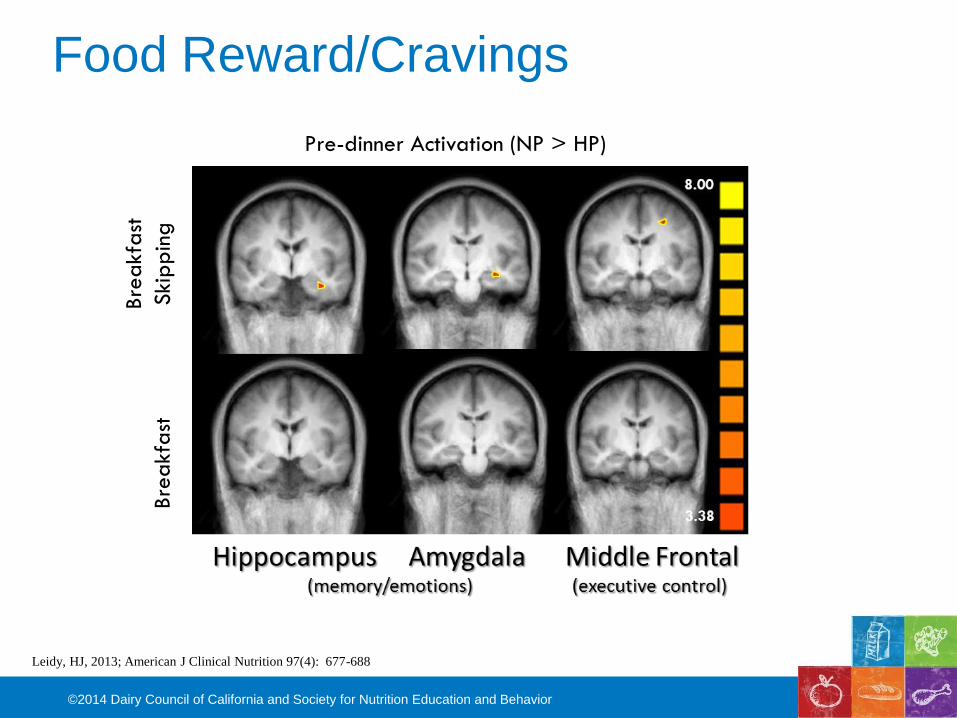
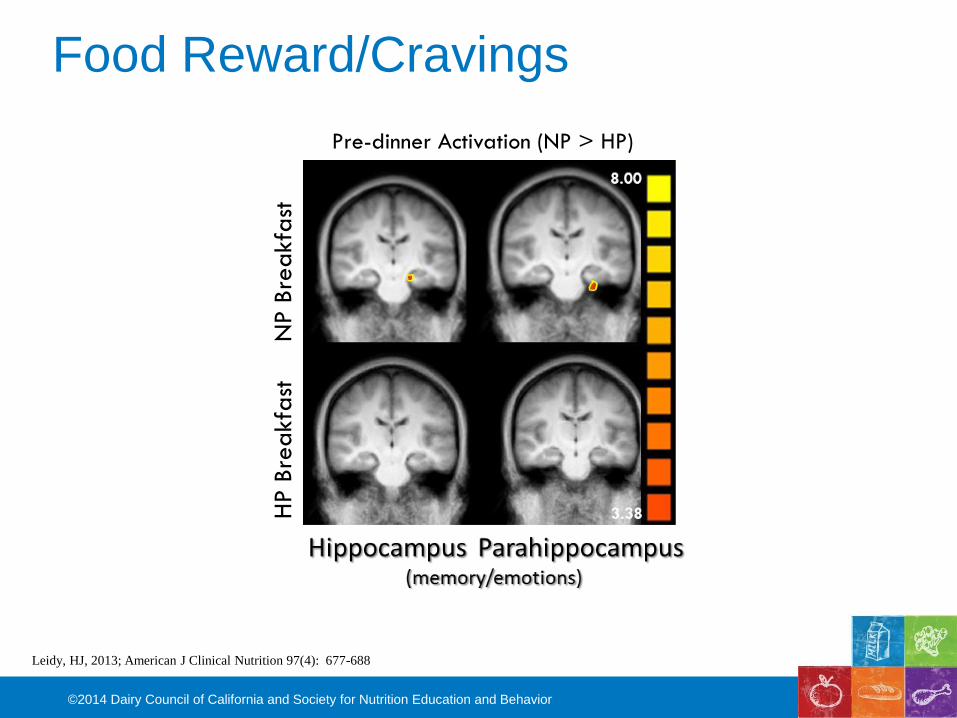
Leidy, HJ, 2013; American J Clinical Nutrition 97(4): 677-688
Bre
akfa
st
Ski
pp
ing
Bre
akfa
stPre-dinner Activation (NP > HP)
Food Reward/Cravings
©2014 Dairy Council of California and Society for Nutrition Education and Behavior
Leidy, HJ, 2013; American J Clinical Nutrition 97(4): 677-688
NP B
rea
kfa
stH
P B
rea
kfa
st
Pre-dinner Activation (NP > HP)
Food Reward/Cravings
©2014 Dairy Council of California and Society for Nutrition Education and Behavior
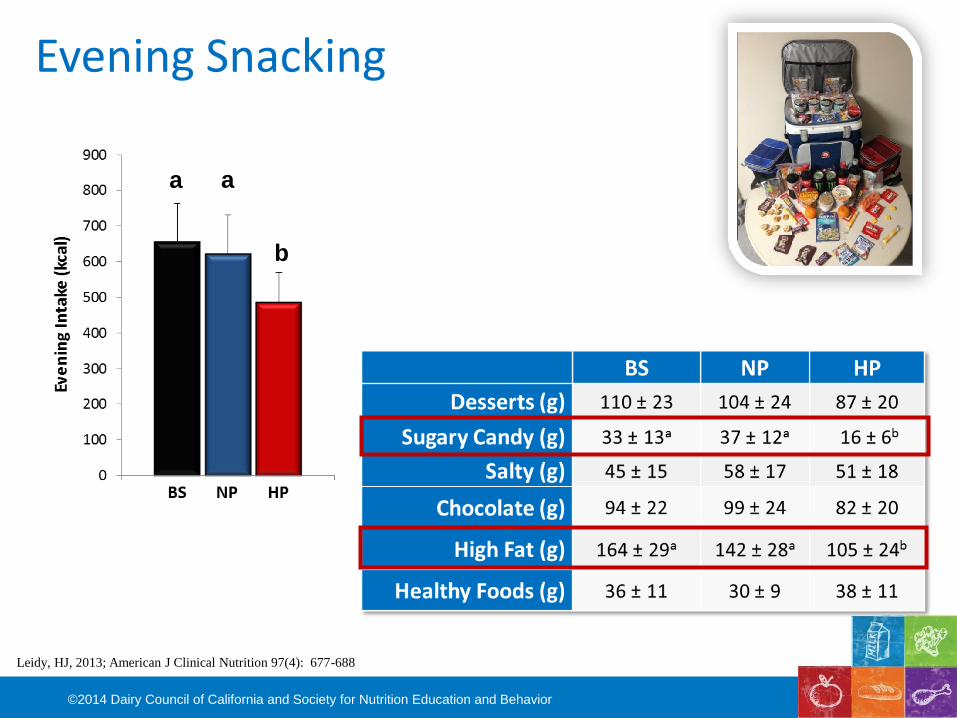
Evening Snacking
Leidy, HJ, 2013; American J Clinical Nutrition 97(4): 677-688
a a
b
©2014 Dairy Council of California and Society for Nutrition Education and Behavior
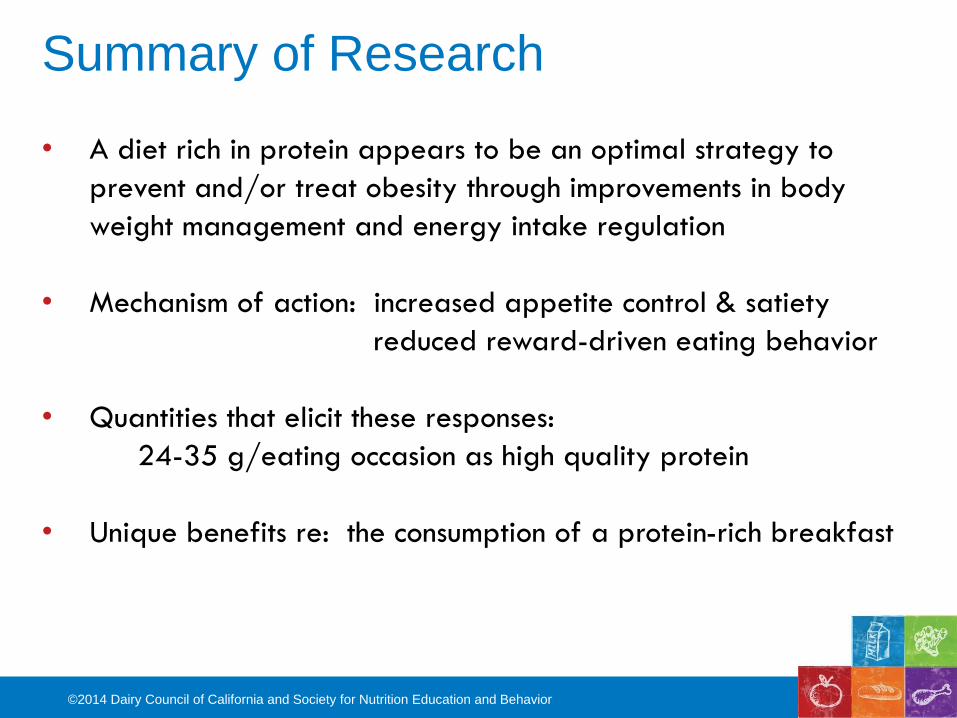
• A diet rich in protein appears to be an optimal strategy to
prevent and/or treat obesity through improvements in body
weight management and energy intake regulation
• Mechanism of action: increased appetite control & satiety
reduced reward-driven eating behavior
• Quantities that elicit these responses:
24-35 g/eating occasion as high quality protein
• Unique benefits re: the consumption of a protein-rich breakfast
Summary of Research

©2014 Dairy Council of California and Society for Nutrition Education and Behavior
The Power of Protein: Translating Research to Practice
Nancy R. Rodriguez, PhD, RD, FACSM
College of Agriculture and Natural Resources
Departments of Kinesiology and Allied Health
University of Connecticut, Storrs

©2014 Dairy Council of California and Society for Nutrition Education and Behavior
Disclosures
Nancy Rodriguez, PhD, RD, CSSD, FACSM
National Dairy Council’s Whey Protein Advisory Panel
Research Support
Beef Checkoff
Dairy Research Institute
American Egg Board
USDA, NIH, American Heart Association
Speaker’s Bureau
National Dairy Council
Beef Checkoff

©2014 Dairy Council of California and Society for Nutrition Education and Behavior
Protein’s role in health
Overview of protein turnover
Practical considerations for current evidence regarding
protein quantity, distribution, and quality
Extending current evidence to recommendations for
higher protein intake across the lifecycle
Children and Teens
Athletes and Active Individuals
Young and Middle-Aged Adults
Baby Boomers and Seniors
Translation to diet design
Presentation Overview
©2014 Dairy Council of California and Society for Nutrition Education and Behavior
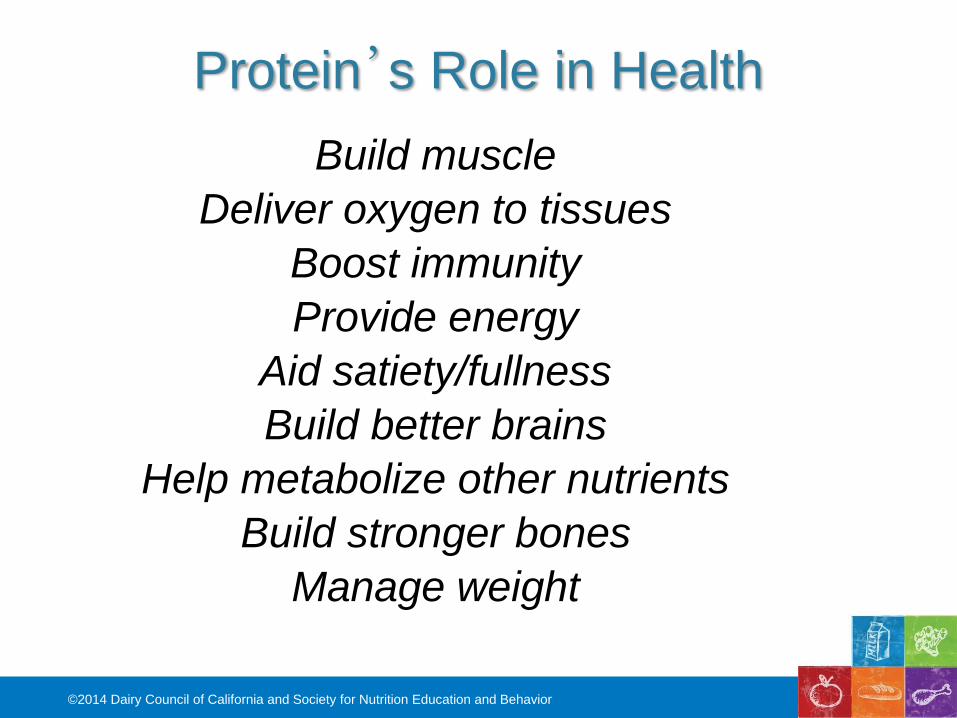
Protein’s Role in Health
Build muscle
Deliver oxygen to tissues
Boost immunity
Provide energy
Aid satiety/fullness
Build better brains
Help metabolize other nutrients
Build stronger bones
Manage weight

©2014 Dairy Council of California and Society for Nutrition Education and Behavior
Research Indicates…
Protein intake higher than
the RDA may help adults
prevent or manage
cardiovascular disease
and type 2 diabetes.
Protein and calcium intake
interact positively to affect
bone health, and intakes
of both must be adequate
to fully realize the benefit
of each nutrient on bone.
Elevated protein intake, in
combination with controlled
energy intake was found to
be an effective and practical
weight-loss strategy.
Animal protein had a
greater positive effect than
plant proteins.
Sarcopenia is the progressive
loss of muscle mass with age.
The most practical means of
increasing skeletal muscle
protein for the majority of older
adults is to include a moderate
serving of high-quality protein
with each meal.
American Journal of Clinical Nutrition, 87, (suppl), 2008.
©2014 Dairy Council of California and Society for Nutrition Education and Behavior
Protein is Fundamental to Life
Protein is made up of
building blocks and
provides structural parts for
a number of important body
parts that allows it to
function
©2014 Dairy Council of California and Society for Nutrition Education and Behavior
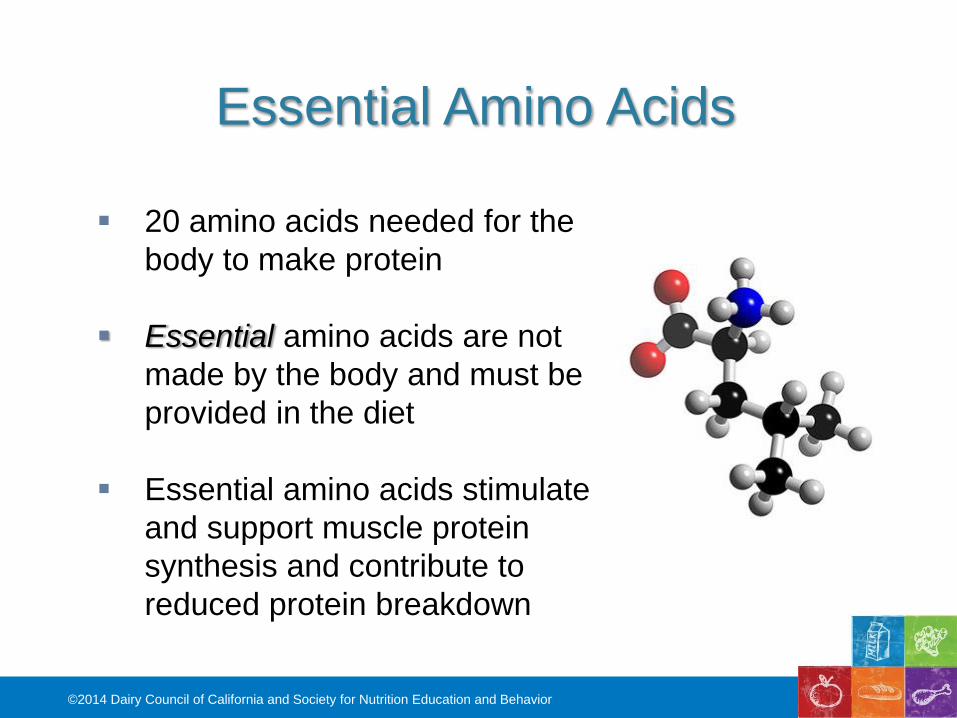
Essential Amino Acids
20 amino acids needed for the
body to make protein
Essential amino acids are not
made by the body and must be
provided in the diet
Essential amino acids stimulate
and support muscle protein
synthesis and contribute to
reduced protein breakdown
©2014 Dairy Council of California and Society for Nutrition Education and Behavior
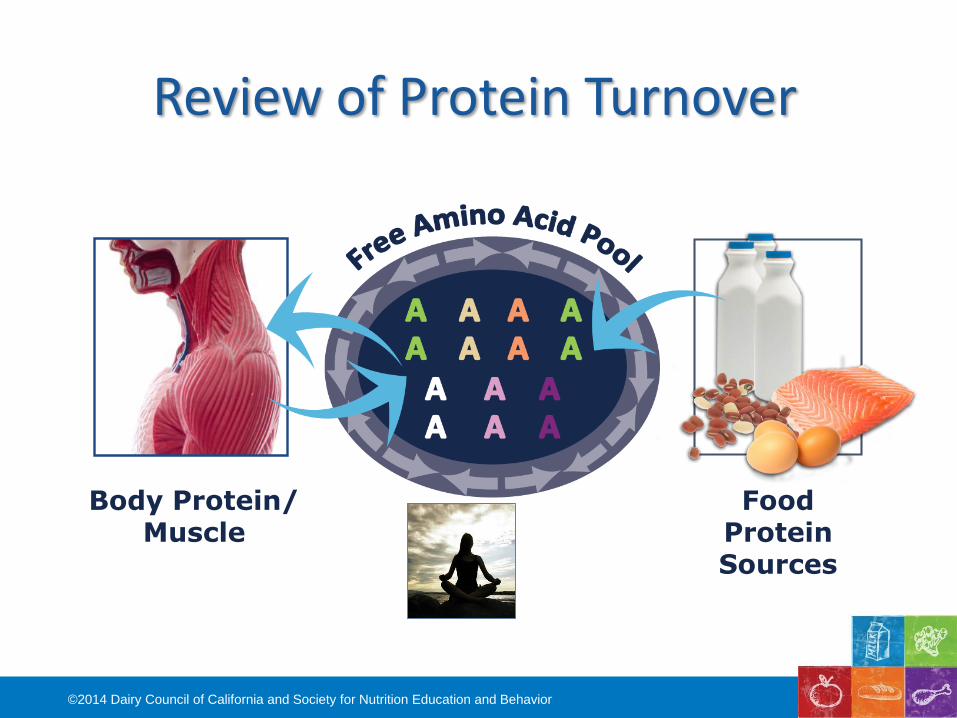
Review of Protein Turnover
AABody Protein/
MuscleFood
Protein Sources
©2014 Dairy Council of California and Society for Nutrition Education and Behavior
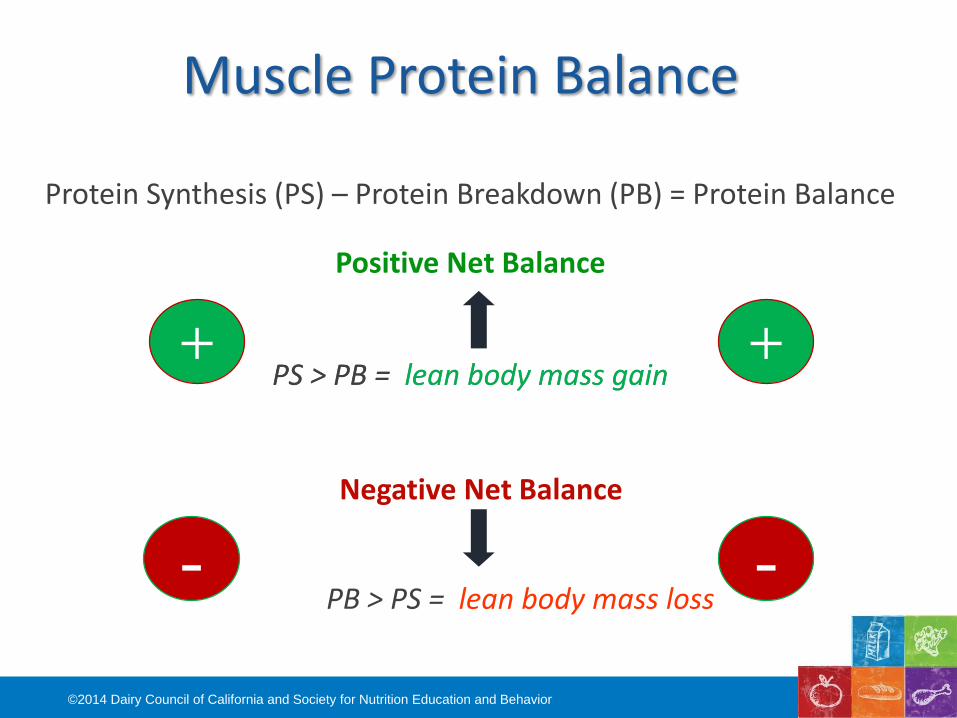
Muscle Protein Balance
Protein Synthesis (PS) – Protein Breakdown (PB) = Protein Balance
Positive Net Balance
PS > PB = lean body mass gain
Negative Net Balance
PB > PS = lean body mass loss-
+
-
+
©2014 Dairy Council of California and Society for Nutrition Education and Behavior
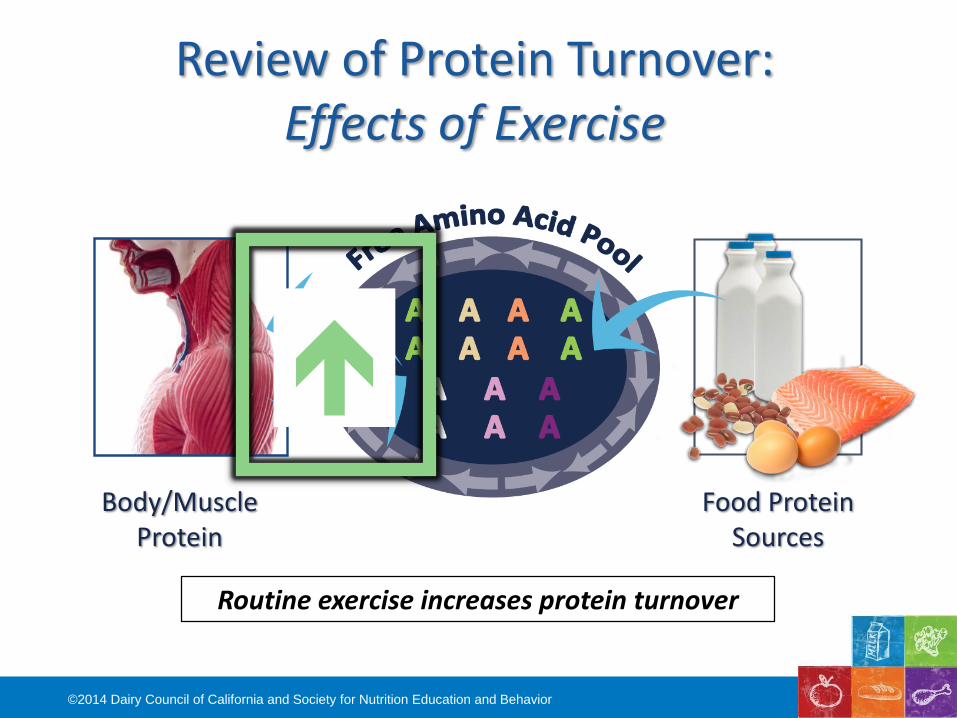
Review of Protein Turnover: Effects of Exercise
AABody/Muscle
ProteinFood Protein
Sources
Routine exercise increases protein turnover

©2014 Dairy Council of California and Society for Nutrition Education and Behavior
Review of Protein Turnover: Effects of Consuming High Quality Proteins
AABody/Muscle
ProteinFood Protein
Sources
Consuming protein reduces protein breakdown
©2014 Dairy Council of California and Society for Nutrition Education and Behavior
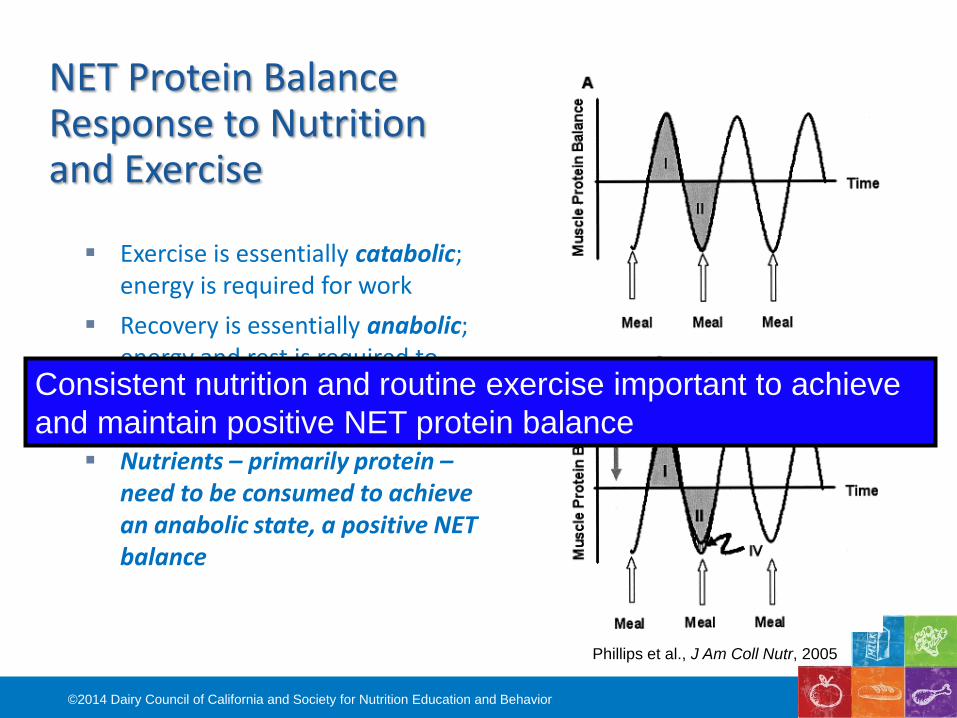
Phillips et al., J Am Coll Nutr, 2005
NET Protein Balance Response to Nutrition and Exercise
Exercise is essentially catabolic; energy is required for work
Recovery is essentially anabolic; energy and rest is required to rehydrate, refuel, repair, and rebuild
Nutrients – primarily protein –need to be consumed to achieve an anabolic state, a positive NET balance
Consistent nutrition and routine exercise important to achieve
and maintain positive NET protein balance
©2014 Dairy Council of California and Society for Nutrition Education and Behavior
Protein Quantity and Diet Rx:A New Way of Thinking

©2014 Dairy Council of California and Society for Nutrition Education and Behavior
Protein Recommendations
Recommended Dietary Allowance (RDA)Dietary protein recommendations based on preventing deficiency
Acceptable Macronutrient Distribution Range (AMDR)A range of intake for promoting optimal health

©2014 Dairy Council of California and Society for Nutrition Education and Behavior
AMDR for Protein10 - 35%

©2014 Dairy Council of California and Society for Nutrition Education and Behavior
Lower
Range
Upper
Range
25-30% of Daily Energy
~ 1.2-1.6 g protein/kg/d
(~ 90-150 g/d)

©2014 Dairy Council of California and Society for Nutrition Education and Behavior
Protein Diets: Defined - Relative
Lower Protein Diet
10-15% of calories from
protein
Moderate/Higher Protein Diet
20-35% of calories from
protein

©2014 Dairy Council of California and Society for Nutrition Education and Behavior
Lower Protein Diet
~1 g/kg body weight
(RDA - 0.8 g/kg)
Moderate/Higher Protein Diet
1.2 -1.5 g/kg
1.5 -1.8 g/kg
Protein Diets: Defined - Absolute

©2014 Dairy Council of California and Society for Nutrition Education and Behavior
Misconceptions About Animal Proteins and Health
Effects of dietary
protein intake on
indexes of hydration
W.F. Martin, L.H.
Cerundolo, M.A. Pikosky,
P.C. Gaine, C.M. Maresh,
L.E. Armstrong, D.R.
Bolster and N.R.
Rodriguez. J Am Diet
Assoc 106:587-589, 2006.
Habitual consumption of eggs
does not alter the beneficial
effects of endurance training on
plasma lipids and lipoprotein
metabolism in untrained
men and women
L.M. Vislocky, M.A. Pikosky, K.H. Rubin, S.
Vega-Lopez, P.C. Gaine, W.F. Martin, T.L.
Zern, I.E. Lofgren, M.L. Fernandez and N.R.
Rodriguez. J Nutr Biochem May 19 (Epub),
2008.
Dietary protein intake and renal function
W.F. Martin, L.E. Armstrong and N.R. Rodriguez. Nutr Metab(Lond) 20(2):25, 2005.

©2014 Dairy Council of California and Society for Nutrition Education and Behavior
Protein Timing Protein Distribution

©2014 Dairy Council of California and Society for Nutrition Education and Behavior
Maximum protein synthesis
Even Distribution of Protein Throughout the Day’s
Meals and Snacks can Maximize Anabolic
Response Specific to Protein Utilization by the Body
Paddon-Jones and Rasmussen, Curr Opin Clin Nutr Metab Care, 2009

©2014 Dairy Council of California and Society for Nutrition Education and Behavior
Protein Distribution
Protein-centric meals for optimal protein utilization: Can it be that simple?Rodriguez, NR. J Nutr 2014
Dietary protein distribution positively influences 24 h muscle protein synthesis in healthy adults Mamerow MM et al., J Nutr 2014
©2014 Dairy Council of California and Society for Nutrition Education and Behavior
Quality
©2014 Dairy Council of California and Society for Nutrition Education and Behavior
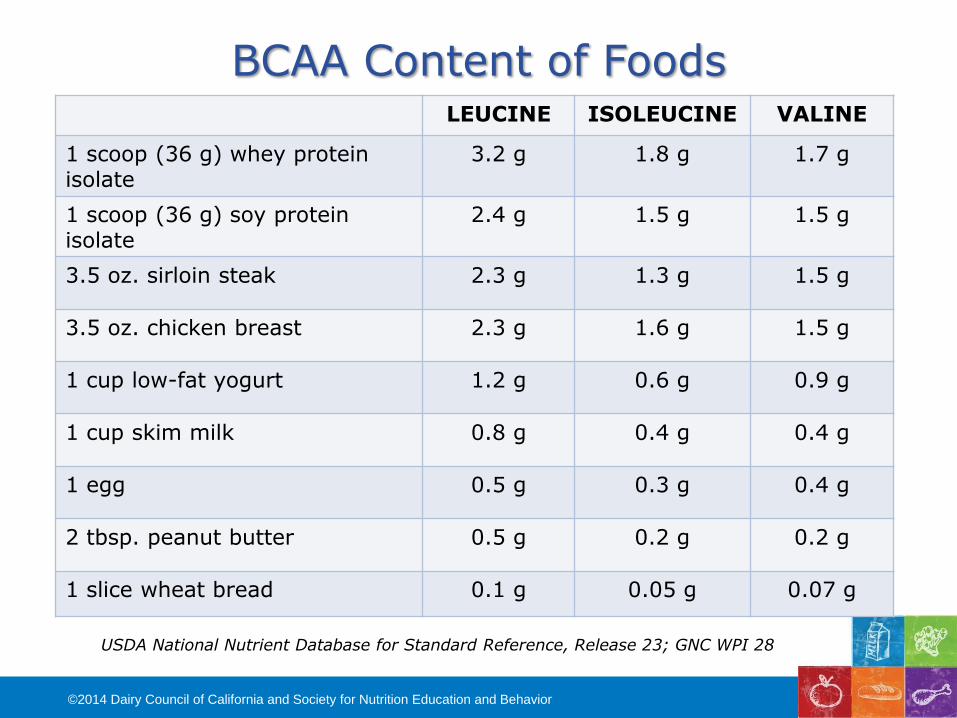
BCAA Content of FoodsLEUCINE ISOLEUCINE VALINE
1 scoop (36 g) whey protein isolate
3.2 g 1.8 g 1.7 g
1 scoop (36 g) soy protein isolate
2.4 g 1.5 g 1.5 g
3.5 oz. sirloin steak 2.3 g 1.3 g 1.5 g
3.5 oz. chicken breast 2.3 g 1.6 g 1.5 g
1 cup low-fat yogurt 1.2 g 0.6 g 0.9 g
1 cup skim milk 0.8 g 0.4 g 0.4 g
1 egg 0.5 g 0.3 g 0.4 g
2 tbsp. peanut butter 0.5 g 0.2 g 0.2 g
1 slice wheat bread 0.1 g 0.05 g 0.07 g
USDA National Nutrient Database for Standard Reference, Release 23; GNC WPI 28

©2014 Dairy Council of California and Society for Nutrition Education and Behavior
Animal Foods = High Quality Protein
©2014 Dairy Council of California and Society for Nutrition Education and Behavior
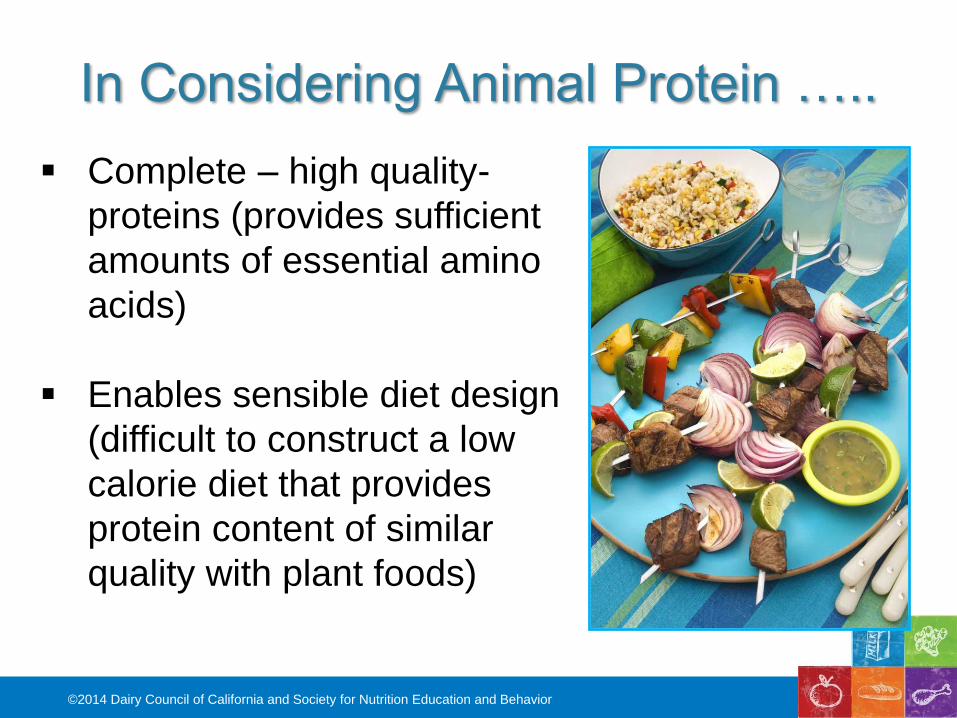
In Considering Animal Protein …..
Complete – high quality-
proteins (provides sufficient
amounts of essential amino
acids)
Enables sensible diet design
(difficult to construct a low
calorie diet that provides
protein content of similar
quality with plant foods)

©2014 Dairy Council of California and Society for Nutrition Education and Behavior
3 ounces
lean beef
180 calories
Three ½ cup
servings
black beans
374 calories
1 ¼ cups
raw tofu
236 calories
7 tablespoons
peanut butter
670 calories
The Caloric Cost of Plant Protein
Based on 25 grams protein

©2014 Dairy Council of California and Society for Nutrition Education and Behavior
Nutrition Basics for Growth, Development, and Optimal Protein Use
Importance of energy balance
Selected nutrient considerations for
respective stages of lifecycle
Energy Balance
Energy In = Energy Out (Maintenance)
Energy In > Energy Out (Weight Gain)
Energy In < Energy Out (Weight Loss)

©2014 Dairy Council of California and Society for Nutrition Education and Behavior
Nutrient-specific Considerations:Children and Teens
Protein
Calories
Iron
Calcium
Other essential micronutrients
Growth and Development
Nutrient Partitioning
Nutrient-Specific Considerations
©2014 Dairy Council of California and Society for Nutrition Education and Behavior
Nutrient-specific Considerations:Young and Middle-Aged Adults
Protein
Calories
Iron
Calcium
Other essential micronutrients
Maintenance of Bone and Muscle Mass:
Prevention
Osteoporosis
Sarcopenia
Nutrient-Specific Considerations

©2014 Dairy Council of California and Society for Nutrition Education and Behavior
Nutrient-specific Considerations:Baby Boomers
Protein
Calories
Iron
Calcium
Other essential micronutrients
Maintenance of Bone and Muscle Mass:
Reducing Progression
Osteoporosis
Sarcopenia
Nutrient-Specific Considerations

©2014 Dairy Council of California and Society for Nutrition Education and Behavior
The Reality of Protein Rich Meals for Contemporary Diet Design
6 g
10 g
5 g
8 g 6 g 24 g
Grand latte
(skim) 16 g
13 g
4 g
24 g
Breakfast Lunch Dinner

©2014 Dairy Council of California and Society for Nutrition Education and Behavior
Catab
olism
Ana
bolism
maximum rate of protein synthesis
~ 30 g ~ 30 g ~ 30 g
Total Protein
90 g
Repeated maximal stimulation of protein synthesis is important to maintain, repair, or increase muscle mass
Building Protein Rich Meals and Nutrition Care Plans:Relevance of Timing
©2014 Dairy Council of California and Society for Nutrition Education and Behavior
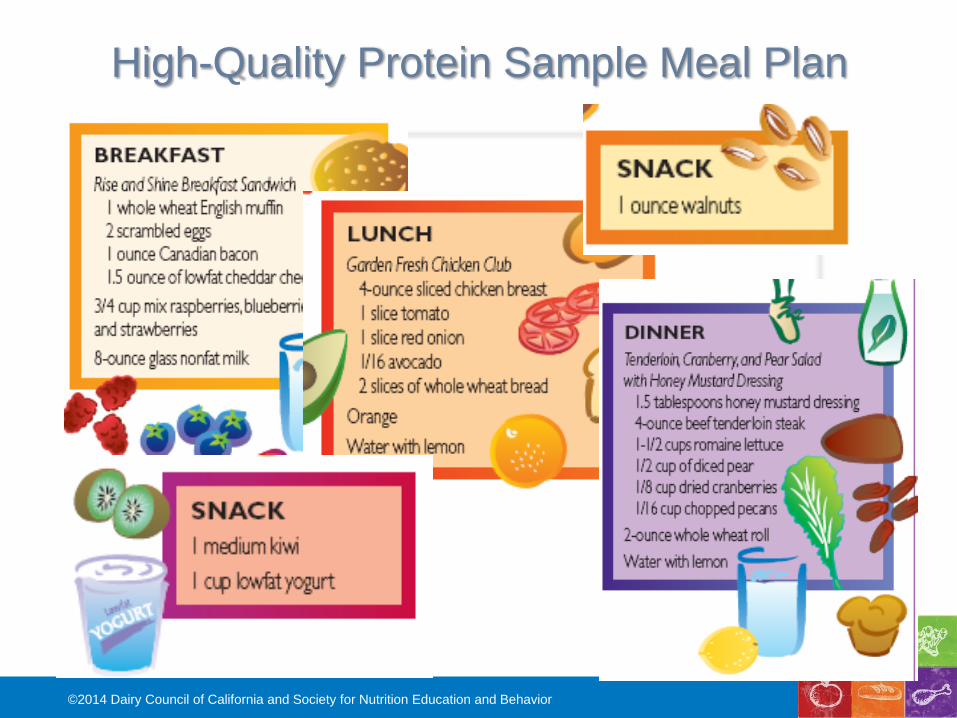
High-Quality Protein Sample Meal Plan

©2014 Dairy Council of California and Society for Nutrition Education and Behavior
Summary and Translation
Habitual consumption of protein in excess of the RDA but well within the AMDR, in combination with a physically active lifestyle will contribute to:
Optimizing protein utilization by the body throughout the lifecycle,
Improving various health outcomes, in particular, weight management and favorable changes in body composition
Nutrient needs reflected in Mother Nature’s plan
Milk – and other high quality proteins – are pivotal options in
healthy diet design from early to later life

©2014 Dairy Council of California and Society for Nutrition Education and Behavior
Thank You!!

©2014 Dairy Council of California and Society for Nutrition Education and Behavior
Q & A
Please type your questions in the dialog box on your screen.
All follow up information from the webinar will be housed on this
page:
www.HealthyEating.org/2014ProteinWebinar
Archived webinar
PDF of the slide deck
Summary of Q&A
©2014 Dairy Council of California and Society for Nutrition Education and Behavior
Become an SNEB member!
Benefits of membership
• Professional Member - $190 per year
• Associate Member - $95 per year
• Student Member - $60 per year
• Subscription to the Journal of Nutrition Education and Behavior
• Free access to live and recorded webinars
• Deepest discount to attend the SNEB Annual Conference
• Membership in an SNEB specialty division
• Connection to other professionals through SNEB listserv
• www.sneb.org/join


