
unuftp.is Final Project 2011
This paper should be cited as: Kpadeh, Z.A. 2012. The potential of aquaculture in Liberia . United Nations University Fisheries Training Programme, Iceland [final project]. http://www.unuftp.is/static/fellows/document/zizi11prf.pdf
THE POTENTIAL OF AQUACULTURE IN LIBERIA
Zizi Alpha Kpadeh
Bureau of National Fisheries, Ministry of Agriculture
P.O. Box 10-9010, 1000 Monrovia 10,Liberia
Supervisor:
Professor Helgi Thorarensen
Holar University College
ABSTRACT
Aquaculture was first introduced in Liberia in the 1950s. Although conditions for aquaculture
are good in Liberia, there has been no significant growth in the field since then. The study
developed methods for assessing the aquaculture potential in different parts of Liberia. Firstly,
criteria were developed for assessing different factors that are relevant for developing
aquaculture. The criteria developed were water, soil, topography, market and agricultural by-
products. Secondly, the criteria were used to assess the potential for aquaculture in different
counties. One limitation to a study such as this is the lack of information, both statistical and
factual, about factors relevant for aquaculture. Therefore, the criteria could only be tested on a
limited dataset. Some of the gaps were bridged by the author’s knowledge of the country. The
results from this study showed that there are potential for aquaculture based on the following:
water is in abundance and can be available year round; latosols, which make up 75% of the
soil has a compact texture with a water retentive capacity; population density in most of the
counties is favourable for the marketing of aquaculture products; the topography of the
country consists of flat land mainly and plateaus that are convenient for pond construction;
and the total of 2337 household livestock farmers indicates that livestock wastes are available
throughout the country for pond fertilization.
Keywords: Aquaculture potential, Liberia, Evapotranspiration, Biophysical factors, Socio-
economic factors

Kpadeh
UNU-Fisheries Training Programme 2
TABLE OF CONTENTS
LIST OF FIGURES............................................................................................................................... 3
LIST OF TABLES................................................................................................................................. 4
1 INTRODUCTION .......................................................................................................................... 6
1.1 STATE OF WORLD AQUACULTURE............................................................................................. 7
1.2 STATE OF AQUACULTURE IN AFRICA ........................................................................................ 7
1.3 RATIONALE ................................................................................................................................ 7
1.4 OBJECTIVES ................................................................................................................................ 8
1.5 RESEARCH QUESTION ................................................................................................................. 8
2 AQUACULTURE CONDITIONS IN LIBERIA ......................................................................... 9
2.1 LOCATION OF LIBERIA ............................................................................................................... 9
2.2 DEVELOPMENT OF AQUACULTURE IN LIBERIA .......................................................................... 9
2.3 PRACTICES AND SYSTEMS OF AQUACULTURE .......................................................................... 10
2.4 CULTURED SPECIES.................................................................................................................. 11
2.5 CONTRIBUTION TO THE ECONOMY ........................................................................................... 11
2.6 HUMAN RESOURCE .................................................................................................................. 11
2.7 INSTITUTIONAL AND LEGAL FRAMEWORK ............................................................................... 12
3 METHODOLOGY ....................................................................................................................... 12
4 ENVIRONMENTAL REQUIREMENTS OF TWO FISH SPECIES -NILE TILAPIA AND
AFRICAN CATFISH .......................................................................................................................... 13
4.1 NILE TILAPIA ............................................................................................................................ 13
4.2 AFRICAN CATFISH .................................................................................................................... 14
5 BIOPHYSICAL CRITERIA ....................................................................................................... 15
5.1 WATER REQUIREMENTS ........................................................................................................... 15
5.1.1 Water temperature ............................................................................................................ 16
5.1.2 Water temperature in Liberia ............................................................................................ 17
5.1.3 Salinity .............................................................................................................................. 17
5.1.4 Salinity in the inland waters of Liberia ............................................................................. 18
5.1.5 pH in aquaculture ponds .................................................................................................. 18
5.1.6 Water availability .............................................................................................................. 19
5.1.7 Water resources of Liberia ................................................................................................ 19
5.2 SOIL .......................................................................................................................................... 19
5.2.1 The soil of Liberia ............................................................................................................. 21
5.3 TOPOGRAPHY ........................................................................................................................... 23
5.3.1 Topography of Liberia ...................................................................................................... 23
6 SOCIO-ECONOMIC FACTORS ............................................................................................... 24
6.1 MARKET ................................................................................................................................... 24
6.2 AGRICULTURAL BY-PRODUCTS ................................................................................................ 24
6.3 EDUCATION .............................................................................................................................. 25
7 DISCUSSION ................................................................................................................................ 26
8 CONCLUSION AND RECOMMENDATIONS ........................................................................ 27
LIST OF REFERENCES ................................................................................................................... 28
ACKNOWLEDGEMENTS ................................................................................................................ 31
Kpadeh
UNU-Fisheries Training Programme 3
LIST OF FIGURES
Figure 1: Liberia and its neighbouring countries (CIA 2011) .................................................... 9
Figure 2: The graph points out the total aquaculture production in Liberia (FAO 2000) ........ 10
Figure 3: The graph shows the total production per species in Liberia (FAO 2009). .............. 11
Figure 4: Nile tilapia ................................................................................................................ 13
Figure 5: African catfish .......................................................................................................... 15

Kpadeh
UNU-Fisheries Training Programme 4
LIST OF TABLES
Table 1: Limit and optimal water quality requirements for Nile tilapia (Mjoun et al. 2010) .. 14
Table 2: Upper and lower critical ranges of temperature for Nile tilapia (Mjoun et al. 2010) 14
Table 3: Catfish ranges of environmental factors (Bruton 1988) ............................................. 14
Table 4: Water quality requirements for aquaculture hatcheries and production facilities
(Bruton 1988) ........................................................................................................................... 16
Table 5: Temperature requirement for Nile tilapia in pond aquaculture .................................. 17
Table 6: Temperature requirement for African catfish (Britz and Hecht 1987) ...................... 17
Table 7: pH requirements for Nile tilapia juvenile (El-Sherif and El-Feky 2008)................... 18
Table 8: Soil quality criteria for aquaculture ponds (Aruleba and Agbebi 2010) .................... 20
Table 9: Soil of Liberia (CAAS-Liberia, 2007) ....................................................................... 22
Table 10: Types of liming agents and recommended dosages (Russell et al. 2008) ............... 22
Table 11: Topography criteria (FAO 1995) ............................................................................. 23
Table 12: Population density of counties (LISGIS 2008) ........................................................ 24
Table 13: Household livestock and crop farmers (LISGIS 2008) ............................................ 25

Kpadeh
UNU-Fisheries Training Programme 5
ABBREVIATIONS
BCRADP Bong County Rural Agriculture Development Program
BNF Bureau of National Fisheries
CAAS Comprehensive Assessment of the Agriculture Sector
CIA Central Intelligence Agency
EU European Union
FAO Food and Agriculture Organization of the United Nations
INGO International Non-Governmental Organizations
LISGIS Liberia Institute of Statistics and GEO-Information Services
MLME Ministry of Lands, Mines and Energy
MOA Ministry of Agriculture
PRS Poverty Reduction Strategy

Kpadeh
UNU-Fisheries Training Programme 6
1 INTRODUCTION
The coastal waters of Liberia are richly endowed in biodiversity with abundance of various
finfish, molluscs and crustacean species. However, in recent years, the sector has witnessed
reduced landings. The marine artisanal fisheries account for 80% of the total marine fish
landed locally and operate without much official control measures (EAF-NANSEN 2010).
From 1980-2002 the per capita consumption of fish declined from 14 kg to 4.3 kg, which is
far less than the average global per consumption of 16 kg (FAO 2010a). Despite the decline in
the consumption of fish, the dependency of fish for the supply of animal protein is still high,
accounting for 65% of animal protein consumed. For many rural populations, fish is the best
alternative source of protein due to the fact that it is cheaper than chicken and meat (FAO
2010a). According to the Poverty Reduction Strategy (PRS), in 2006, 81% of the rural
population was either moderately vulnerable (41%) or highly vulnerable (40%) to having
access to food, while 11% of the rural population completely lacked access to food and only
9% had acceptable food. About 40% of children under age five suffered chronic malnutrition,
and even in farming communities’ access to food was insecure, and supply was not sufficient
to meet the demand of the people. Despite the food insecurity, the annual growth of the
Liberian population was 2.1% from 1984 to 2008, increasing the population from 2.1 million
people to almost 3.5 million in 2008 (LISGIS 2008). With the present growth rate the
population is expected to double every 33 years. This means that the economic activity needs
to double in order to maintain the current standard of living and services to the population.
Unemployment is on the increase and is currently around 85% (CIA 2011).
Options are limited for combating the nutritional and livelihood crises in Liberia. Prior to the
civil crisis, the economy of Liberia was driven by the agricultural sector and the extractive
industries such as production of diamond, gold and iron ore. As a consequence of the civil
crisis, regulations lacked, and these sectors were destroyed and overexploited (CIA 2011).
One possible approach in addressing issues such as food security and population growth for
the long-term benefit of the population is a shift from an economy driven by extractive
industry to one driven by renewable resources. Extractive resources are non-renewable and
will in the long term get depleted. According to the World Bank in 2008, extractive industry
revenues tend to be uncertain, volatile, and exhaustible - all characteristics that pose enormous
challenges to policy makers. Renewable resource is a natural resource with the ability of
being replaced through biological or other natural processes and replenished over the passage
of time. Aquatic resources are a perfect example of such renewable resource.
With the current condition of malnutrition, high unemployment, limited supply of fish and
increased population growth, aquaculture is a renewable resource sector that can bridge the
gap between fish supply and demand, and reduce unemployment and malnutrition. Indeed,
there is a global trend for the development of aquaculture, increasing its contribution to many
countries over the past decades (FAO 2009). However, despite the inception of aquaculture in
Liberia in the 1950s, it still remains underdeveloped. One major reason for this
underdevelopment is the non-determination of suitable areas for aquaculture development
(BNF 2008).
Kpadeh
UNU-Fisheries Training Programme 7
1.1 State of World Aquaculture
In almost all regions of the world, with the exception of Sub-Saharan Africa, aquaculture is
expanding and production is as well increasing to meet the ever-increasing demand of aquatic
food. Production from world capture fisheries has levelled off and most of the fishing areas
have reach their maximum potential yield (FAO 2010a).
It is estimated that in order to maintain the current level of per capital consumption, global
aquaculture production will need to reach 80 million tonnes by 2050. Aquaculture has the
potential to address the projection of fish demand, but will face enormous challenges to
achieve this goal (FAO 2010a).
1.2 State of Aquaculture in Africa
The production of aquaculture in Sub-Saharan Africa is limited despite its natural potential.
The aquaculture of tilapia, which is considered promising and native to the continent, has not
been developed in the area (FAO 2010a).
There is high possibility for the development of aquaculture in the continent, and can be done
through intensive use of the abundant inland water and coastal areas. In order to achieve this
milestone, the continent will need to address the following existing constraints, such as:
inadequate knowledge on aquaculture among farmers; prevalence of foreign aid programs
organized on top down basis with inconsistent, short term goals and excessive independence
on donor funded aquaculture development programs; low allocations for aquaculture
development in national budget; whole sale importation of traditional crops agriculture
practices into aquaculture, such as seed recycling; poor or slow growth of cultured species;
poor broodstock management; and poor species identification (FAO 2010a).
The region’s top producer is Nigeria with a total of 44,000 tonnes of freshwater fishes, mainly
catfish. Egypt, which is the world’s first and second producer of mullet and tilapia
respectively, is playing a dominant role in Northern Africa producing 92% of the region’s
total. There are other potential species such as the black tiger shrimps (Penaeus monodon) in
Madagascar, Eucheuma seaweed in The United Republic of Tanzania, and the niche species
such as abalone in South Africa that are thriving (FAO 2010b).
1.3 Rationale
The key players in the development of aquaculture in Liberia are International Non-
Governmental Organizations (NGO), Local non-Governmental Organizations and some
private individuals. Approximately 30 NGOs have operated in Liberia between 1995 and
2008 implementing over 35 aquaculture projects under the food security thematic
frameworks. A vast majority of these projects have failed because of the unavailability of
first-hand information on feasible regions for aquaculture development (BNF 2008). As a
consequence, number of organizations involved in aquaculture has dropped drastically over
the years and even those still engaged in aquaculture projects are sceptical about future
funding. In spite of this scenario, there is a considerable interest for the development of
aquaculture among various stakeholders, but the lack of a proper planning and management
scheme remains a major impediment to the development (BNF 2008).

Kpadeh
UNU-Fisheries Training Programme 8
For further development of aquaculture in Liberia it is important for government and
financing institutions to have reliable information on suitable regions such that they can
maximize the use of their scarce resources. Aguillar-Manjarrez and Nath (1998) and Pillay
and Pillay and Kutty (2005) claim that most developing and industrial countries have in recent
times deemed it necessary to develop national plans clearly defining objectives, policies and
strategies that are favourable for a selected goal. However, these plans can only be attained by
conducting detailed feasibility studies, including site surveys and studies on technical and
economic viability in the proposed area. Therefore, it is my hope that the results obtained
from this study will enhance the development of aquaculture through proper planning and
management and subsequently renew the interest of donors who are the drivers of the
development of aquaculture.
1.4 Objectives
The main objective of this study was to develop a tool to locate regions in Liberia that are
suitable for aquaculture of tilapia (Oreochromis niloticus) and African catfish (Clarias
gariepinus)
1.5 Research question
1. How can the suitability of different regions in Liberia for aquaculture be assessed?
2. What are the criteria needed to evaluate the potential of aquaculture?
Kpadeh
UNU-Fisheries Training Programme 9
2 AQUACULTURE CONDITIONS IN LIBERIA
2.1 Location of Liberia
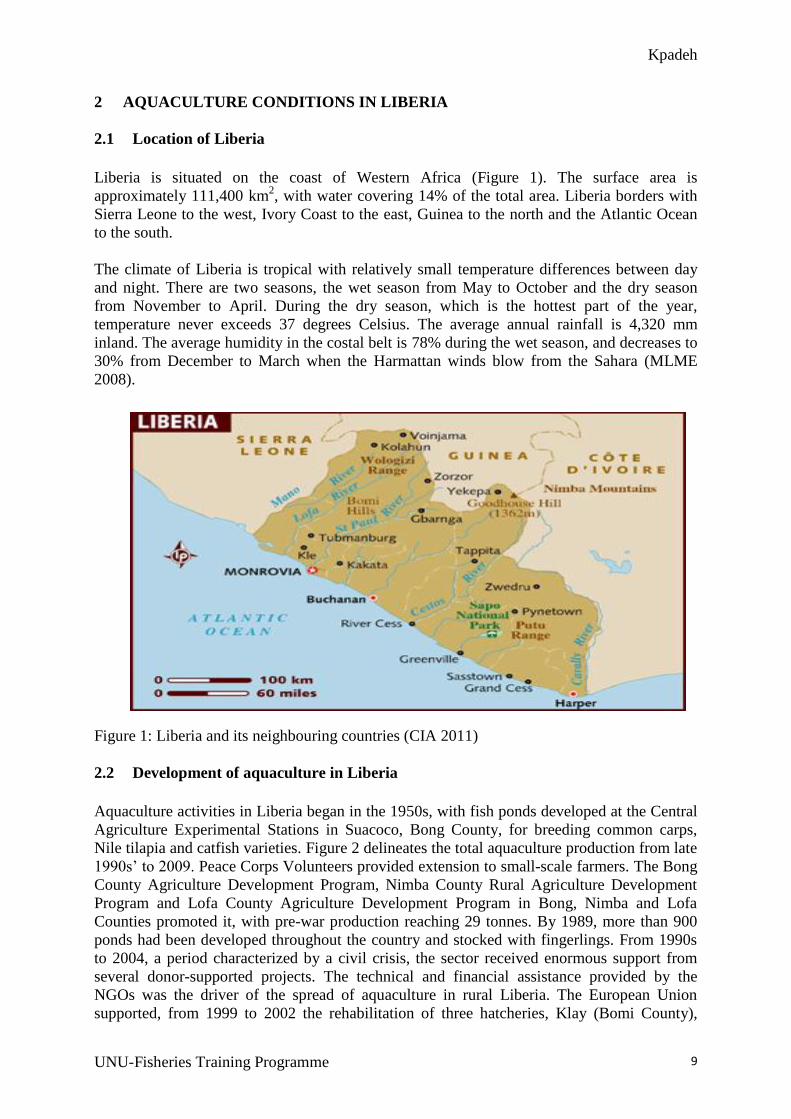
Liberia is situated on the coast of Western Africa (Figure 1). The surface area is
approximately 111,400 km2, with water covering 14% of the total area. Liberia borders with
Sierra Leone to the west, Ivory Coast to the east, Guinea to the north and the Atlantic Ocean
to the south.
The climate of Liberia is tropical with relatively small temperature differences between day
and night. There are two seasons, the wet season from May to October and the dry season
from November to April. During the dry season, which is the hottest part of the year,
temperature never exceeds 37 degrees Celsius. The average annual rainfall is 4,320 mm
inland. The average humidity in the costal belt is 78% during the wet season, and decreases to
30% from December to March when the Harmattan winds blow from the Sahara (MLME
2008).
Figure 1: Liberia and its neighbouring countries (CIA 2011)
2.2 Development of aquaculture in Liberia
Aquaculture activities in Liberia began in the 1950s, with fish ponds developed at the Central
Agriculture Experimental Stations in Suacoco, Bong County, for breeding common carps,
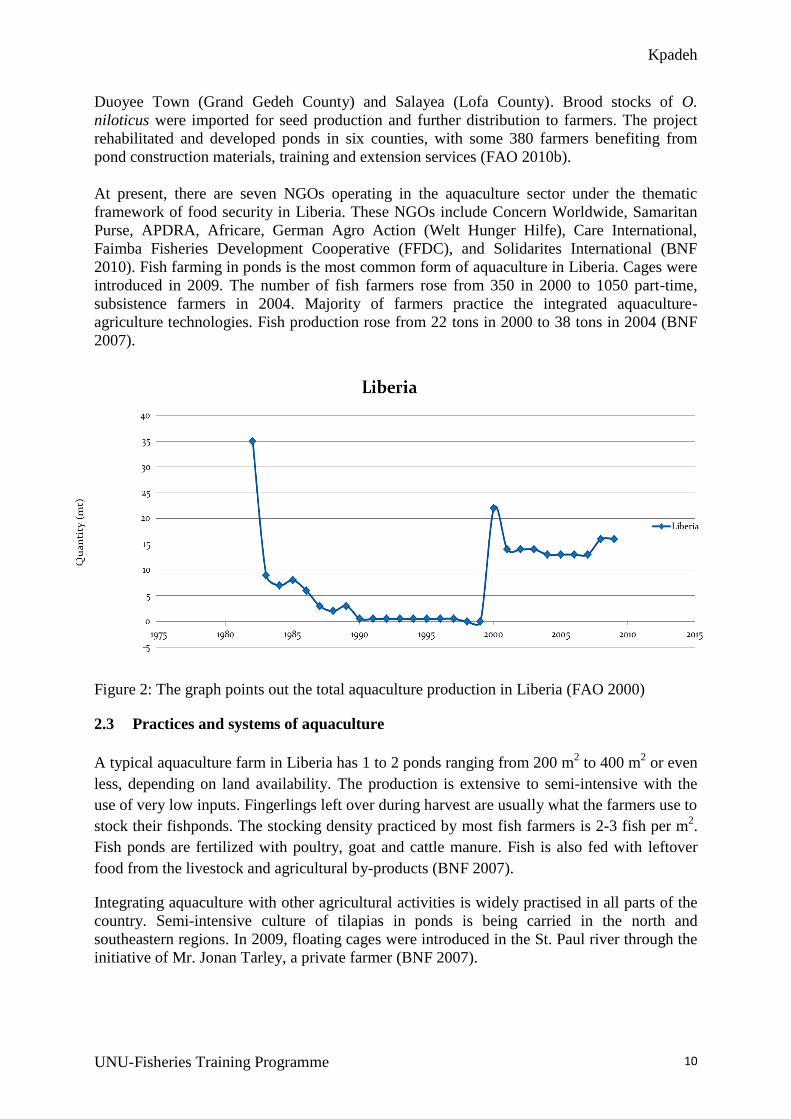
Nile tilapia and catfish varieties. Figure 2 delineates the total aquaculture production from late
1990s’ to 2009. Peace Corps Volunteers provided extension to small-scale farmers. The Bong
County Agriculture Development Program, Nimba County Rural Agriculture Development
Program and Lofa County Agriculture Development Program in Bong, Nimba and Lofa
Counties promoted it, with pre-war production reaching 29 tonnes. By 1989, more than 900
ponds had been developed throughout the country and stocked with fingerlings. From 1990s
to 2004, a period characterized by a civil crisis, the sector received enormous support from
several donor-supported projects. The technical and financial assistance provided by the
NGOs was the driver of the spread of aquaculture in rural Liberia. The European Union
supported, from 1999 to 2002 the rehabilitation of three hatcheries, Klay (Bomi County),
Kpadeh
UNU-Fisheries Training Programme 10
Duoyee Town (Grand Gedeh County) and Salayea (Lofa County). Brood stocks of O.
niloticus were imported for seed production and further distribution to farmers. The project
rehabilitated and developed ponds in six counties, with some 380 farmers benefiting from
pond construction materials, training and extension services (FAO 2010b).
At present, there are seven NGOs operating in the aquaculture sector under the thematic
framework of food security in Liberia. These NGOs include Concern Worldwide, Samaritan
Purse, APDRA, Africare, German Agro Action (Welt Hunger Hilfe), Care International,
Faimba Fisheries Development Cooperative (FFDC), and Solidarites International (BNF
2010). Fish farming in ponds is the most common form of aquaculture in Liberia. Cages were
introduced in 2009. The number of fish farmers rose from 350 in 2000 to 1050 part-time,
subsistence farmers in 2004. Majority of farmers practice the integrated aquaculture-
agriculture technologies. Fish production rose from 22 tons in 2000 to 38 tons in 2004 (BNF
2007).
Figure 2: The graph points out the total aquaculture production in Liberia (FAO 2000)
2.3 Practices and systems of aquaculture
A typical aquaculture farm in Liberia has 1 to 2 ponds ranging from 200 m2 to 400 m
2 or even
less, depending on land availability. The production is extensive to semi-intensive with the
use of very low inputs. Fingerlings left over during harvest are usually what the farmers use to
stock their fishponds. The stocking density practiced by most fish farmers is 2-3 fish per m2.
Fish ponds are fertilized with poultry, goat and cattle manure. Fish is also fed with leftover
food from the livestock and agricultural by-products (BNF 2007).
Integrating aquaculture with other agricultural activities is widely practised in all parts of the
country. Semi-intensive culture of tilapias in ponds is being carried in the north and
southeastern regions. In 2009, floating cages were introduced in the St. Paul river through the
initiative of Mr. Jonan Tarley, a private farmer (BNF 2007).

Kpadeh
UNU-Fisheries Training Programme 11
0
2
4
6
8
10
12
sampa
Mangotilapia
Niletilapia
red bellytilapia
Africancatfish
year
qu
anti
ty (
mt)
2.4 Cultured Species
Five main species are commonly cultured in Liberia: Nile tilapia, African catfish, Sampa,
Mango tilapia and Red belly tilapia. Nile tilapia, Tilapia zili and other tilapia varieties
accounts for 95% of production while African catfish and Heterobranchus spp. account for
the remaining 5% (Figure 3). The use of exotic species is restricted to some extends despite
the lack of formal law regarding its introduction into fish farming in Liberia. The Bureau of
National Fisheries executes the restriction of the importation of exotic species in order to
protect Liberia’s fish biodiversity. In 2009, the Bureau of National Fisheries put a halt to the
introduction of the African Bony tongue (Heterotis niloticus) by APDRA, a French NGO
implementing inland fish-farming project In Liberia. However, in 2010 the introduction of the
species was allowed in Liberia after thoroughly researching its biology and impacts in other
neighbouring countries where it is being cultured (BNF 2010).
Figure 3: The graph shows the total production per species in Liberia (FAO 2009).
2.5 Contribution to the economy
Aquaculture in Liberia is practiced with the objectives to contribute to food security in terms
of increased food production, improved household access to food and improved utilization of
farmland for food production. Fish farming is a convenient source of fish supply to the rural
part of Liberia, especially to the six non-coastal counties. Most often, frozen seafood sold in
rural areas is of poor quality due to bad handling. Fisheries in general contributed 12% to
agricultural GDP and 3.2% to national GDP in 2002. The contribution of aquaculture as an
independent sector is unknown or perhaps negligible (FAO 2010).
2.6 Human Resource
Fish farmers are the primary stakeholders of the aquaculture sector. There are about 1050
part-time, subsistence fish farmers. Approximately 2,500 people are involved in fish farming

Kpadeh
UNU-Fisheries Training Programme 12
activities including pond construction and management, extension services and fish
harvesting. There is no detailed information on the gender ratio and the level of education of
fish farmers; however, It can be assumed that 80% of fish farmers are illiterate (BNF 2007).
2.7 Institutional and legal framework
The Bureau of National Fisheries, in the Ministry of Agriculture founded in 1950, is
responsible for the management and development of aquaculture. The Bureau has four
functional sections comprising administration, research and statistics, marine and aquaculture
and inland fisheries.
Before the official declaration of the new ‘Draft Marine Fisheries Policies and Regulation’ in
2011, the only instrument for fisheries management was the revised fisheries ‘Rules and
Regulation’ of 1973 enshrined in the ‘Natural Resources Law’ of 1956. In the regulation, the
Ministry of Agriculture was authorized through the Bureau of National Fisheries to impose
fees and fines and take measures to enhance the sustainable management and utilization of the
fisheries resources of Liberia. In both of these policies and regulations, there is no specific
clause clearly explaining the management and planning of aquaculture (BNF 2007).
3 METHODOLOGY
The study was carried out at the Holar University College in Saudarkrokur, Iceland. The main
focus of the study was on assessing the potential for pond aquaculture in all of the 15 counties
in Liberia.
The study was a desk study involving both development of criteria to identify suitable
locations for aquaculture operations and evaluation of aquaculture potential in different
counties in Liberia. Existing data and information were collected from governmental
ministries and agencies where possible. Library, on-line articles, databases and the author’s
personal knowledge and experience on aquaculture activities in Liberia formed part of the
data sources.
The first task was to develop suitable criteria for assessing the potential of pond aquaculture
in different regions, and the second task was to use the criteria as a tool and using Liberia as
the test country. Aquaculture potential for pond culture was assessed on the basis of
biophysical factors (water, soil and topography) and socio-economic factors (market, link
with other activities such as farming of livestock and education). The environmental
requirements of two fish species, Nile tilapia and African catfish, were gathered to develop
the criteria for pond aquaculture of the species.
Kpadeh
UNU-Fisheries Training Programme 13
4 ENVIRONMENTAL REQUIREMENTS OF TWO FISH SPECIES -NILE
TILAPIA AND AFRICAN CATFISH
In selecting a species of fish suitable for farming, various biological and economic factors are
of particular relevance. These include market price, ability to feed, fast growth, efficient feed
conversion, temperature tolerance, hardiness and adaptability to heavy stocking density,
simple larval development, and the ability to reproduce in captivity. However, this section
will briefly deal with the environmental requirements for the above-mentioned species.
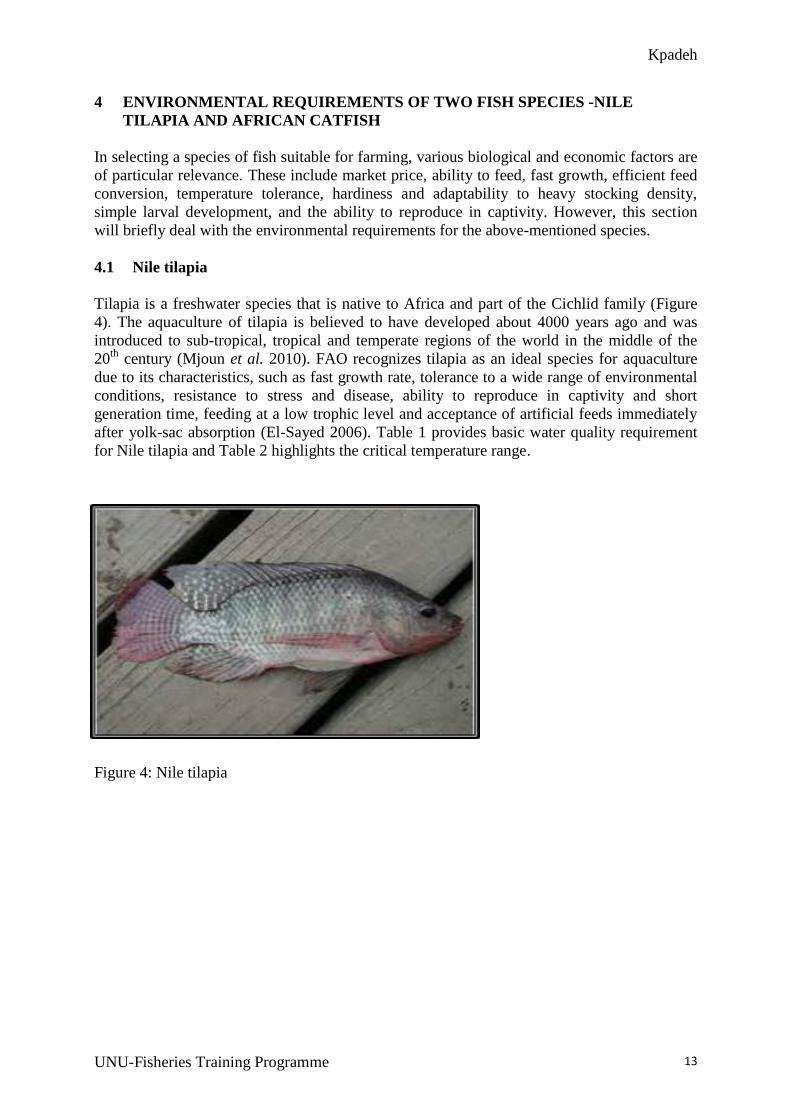
4.1 Nile tilapia
Tilapia is a freshwater species that is native to Africa and part of the Cichlid family (Figure
4). The aquaculture of tilapia is believed to have developed about 4000 years ago and was
introduced to sub-tropical, tropical and temperate regions of the world in the middle of the
20th
century (Mjoun et al. 2010). FAO recognizes tilapia as an ideal species for aquaculture
due to its characteristics, such as fast growth rate, tolerance to a wide range of environmental
conditions, resistance to stress and disease, ability to reproduce in captivity and short
generation time, feeding at a low trophic level and acceptance of artificial feeds immediately
after yolk-sac absorption (El-Sayed 2006). Table 1 provides basic water quality requirement
for Nile tilapia and Table 2 highlights the critical temperature range.
Figure 4: Nile tilapia

Kpadeh
UNU-Fisheries Training Programme 14
Table 1: Limit and optimal water quality requirements for Nile tilapia (Mjoun et al. 2010). Parameters Range Optimum for growth
Salinity ppm Up to 36 Up to 19
Dissolved oxygen (mg/l) Down to 0.001 >3
pH 3.7-11 7-9
Ammonia mg/L Up to 7.1 <0.05
Table 2: Upper and lower critical ranges of temperature for Nile tilapia (Mjoun et al. 2010). Lower critical range
(⁰C)
Optimum range
(⁰C)
Upper critical range
(⁰C)
11-12 31 - 36 42
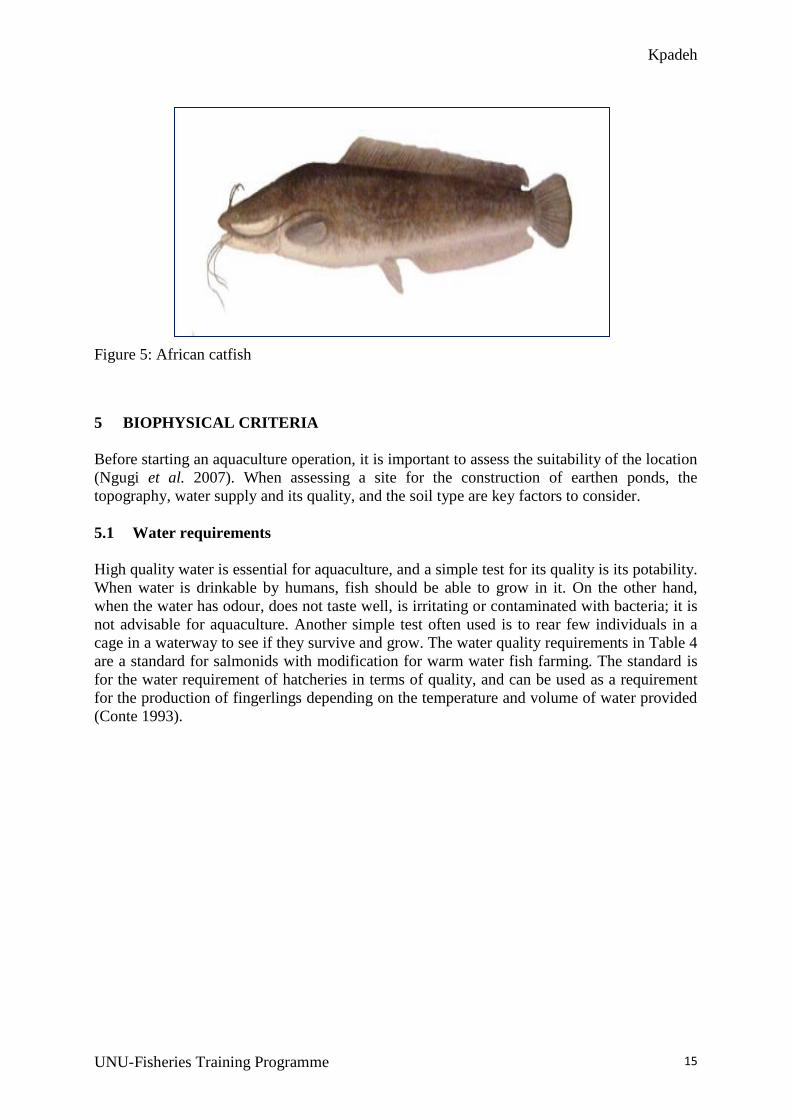
4.2 African catfish
The aquaculture of African catfish in Africa goes back 40 years although success have been
mixed. The total aquaculture production of this species in 1994 was 3,978 tonnes,
contributing 7.4% of total aquaculture production for the same year in Africa (Britz and Hecht
1987). The species is the most widely distributed freshwater species in the world and can
survive under varying climates (temperate to tropical). Its habitats include water bodies such
as shallow and deep lakes, rivers, swamps, flood plains, underground sinkholes, and
impoundments. African catfish (Figure 5) are efficient opportunists and survivors, equipped to
exploit whatever resources are available. The species can tolerate wide ranges of
environmental extremes (Table 3).
Table 3: Catfish ranges of environmental factors (Bruton 1988).
Factors Ranges of tolerance
Water temperature 8 to 35⁰ C, breeding >18⁰ C, and for egg hatching 17 to 32⁰ C
Oxygen 0 to 100% saturation
Salinity 0 to 12 ppt and 0 to 2.5 is optimal
Desiccation The species has the ability to live out of water for so many hours due to
the presence of an accessory breathing organ
pH The species can tolerate a wide range of pH
Density Wide tolerance
Kpadeh
UNU-Fisheries Training Programme 15
Figure 5: African catfish
5 BIOPHYSICAL CRITERIA
Before starting an aquaculture operation, it is important to assess the suitability of the location
(Ngugi et al. 2007). When assessing a site for the construction of earthen ponds, the
topography, water supply and its quality, and the soil type are key factors to consider.
5.1 Water requirements
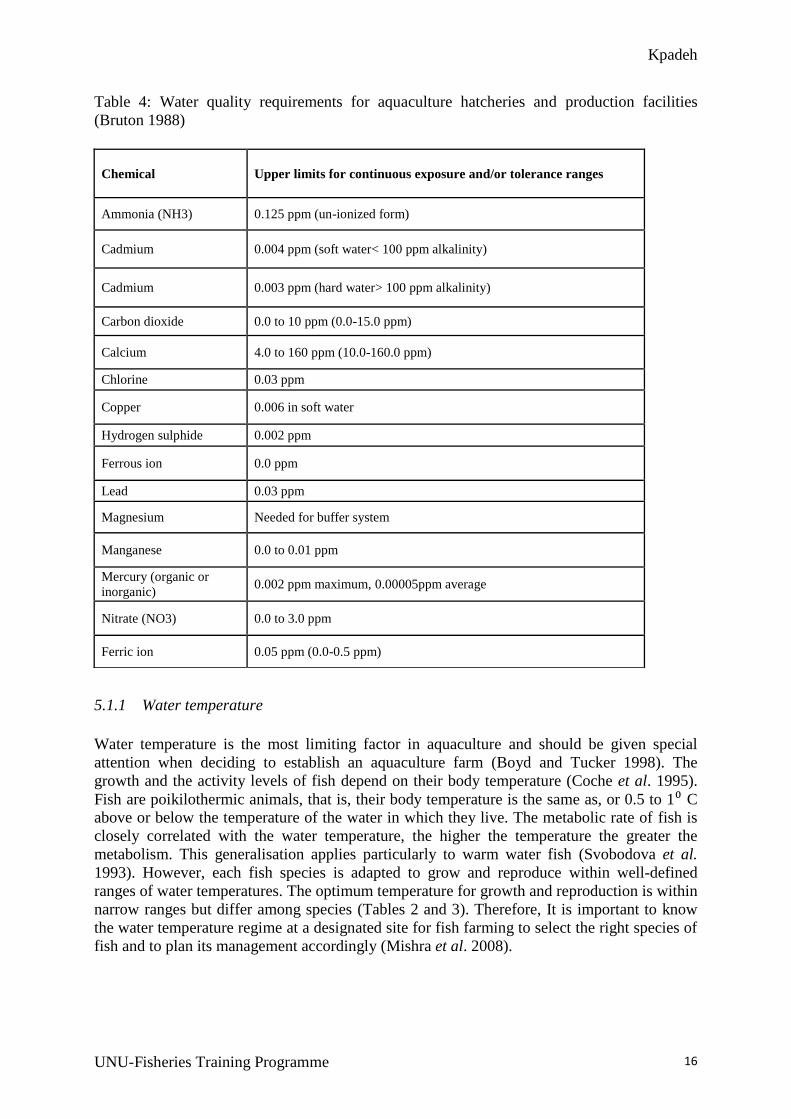
High quality water is essential for aquaculture, and a simple test for its quality is its potability.
When water is drinkable by humans, fish should be able to grow in it. On the other hand,
when the water has odour, does not taste well, is irritating or contaminated with bacteria; it is
not advisable for aquaculture. Another simple test often used is to rear few individuals in a
cage in a waterway to see if they survive and grow. The water quality requirements in Table 4
are a standard for salmonids with modification for warm water fish farming. The standard is
for the water requirement of hatcheries in terms of quality, and can be used as a requirement
for the production of fingerlings depending on the temperature and volume of water provided
(Conte 1993).
Kpadeh
UNU-Fisheries Training Programme 16
Table 4: Water quality requirements for aquaculture hatcheries and production facilities
(Bruton 1988)
5.1.1 Water temperature
Water temperature is the most limiting factor in aquaculture and should be given special
attention when deciding to establish an aquaculture farm (Boyd and Tucker 1998). The
growth and the activity levels of fish depend on their body temperature (Coche et al. 1995).
Fish are poikilothermic animals, that is, their body temperature is the same as, or 0.5 to 1⁰ C
above or below the temperature of the water in which they live. The metabolic rate of fish is
closely correlated with the water temperature, the higher the temperature the greater the
metabolism. This generalisation applies particularly to warm water fish (Svobodova et al.
1993). However, each fish species is adapted to grow and reproduce within well-defined
ranges of water temperatures. The optimum temperature for growth and reproduction is within
narrow ranges but differ among species (Tables 2 and 3). Therefore, It is important to know
the water temperature regime at a designated site for fish farming to select the right species of
fish and to plan its management accordingly (Mishra et al. 2008).
Chemical Upper limits for continuous exposure and/or tolerance ranges
Ammonia (NH3) 0.125 ppm (un-ionized form)
Cadmium 0.004 ppm (soft water< 100 ppm alkalinity)
Cadmium 0.003 ppm (hard water> 100 ppm alkalinity)
Carbon dioxide 0.0 to 10 ppm (0.0-15.0 ppm)
Calcium 4.0 to 160 ppm (10.0-160.0 ppm)
Chlorine 0.03 ppm
Copper 0.006 in soft water
Hydrogen sulphide 0.002 ppm
Ferrous ion 0.0 ppm
Lead 0.03 ppm
Magnesium Needed for buffer system
Manganese 0.0 to 0.01 ppm
Mercury (organic or
inorganic) 0.002 ppm maximum, 0.00005ppm average
Nitrate (NO3) 0.0 to 3.0 ppm
Ferric ion 0.05 ppm (0.0-0.5 ppm)
Kpadeh
UNU-Fisheries Training Programme 17
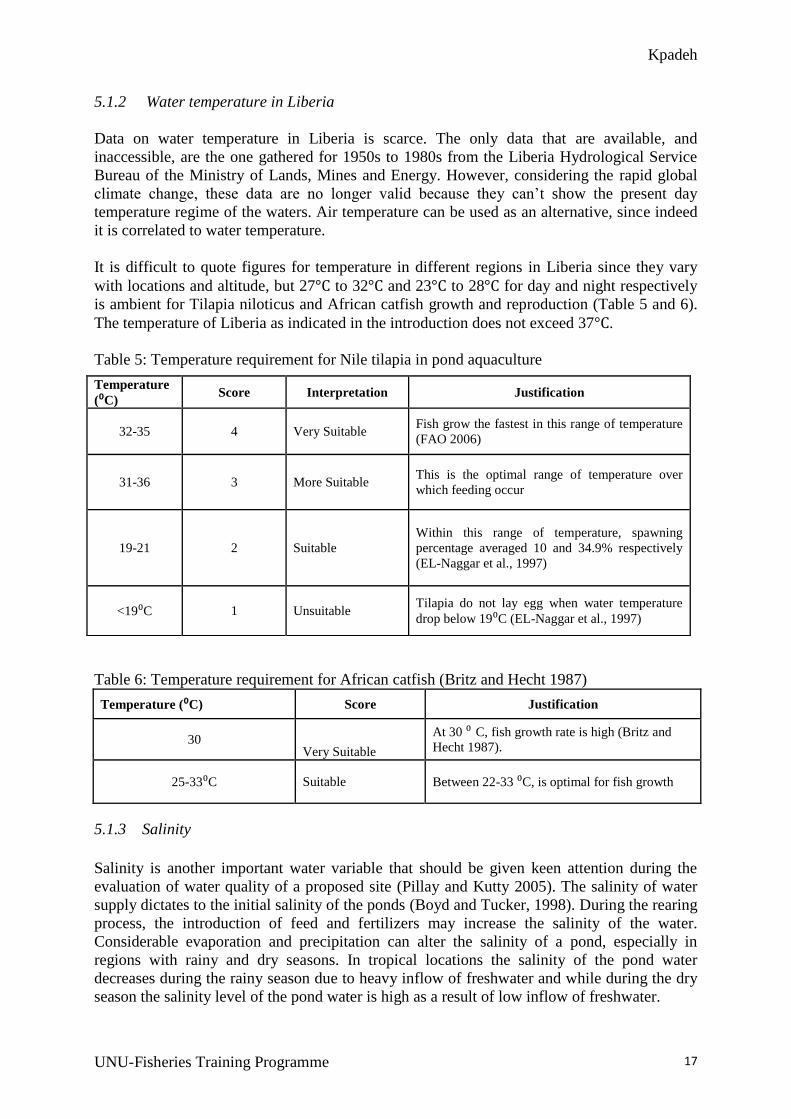
5.1.2 Water temperature in Liberia
Data on water temperature in Liberia is scarce. The only data that are available, and
inaccessible, are the one gathered for 1950s to 1980s from the Liberia Hydrological Service
Bureau of the Ministry of Lands, Mines and Energy. However, considering the rapid global
climate change, these data are no longer valid because they can’t show the present day
temperature regime of the waters. Air temperature can be used as an alternative, since indeed
it is correlated to water temperature.
It is difficult to quote figures for temperature in different regions in Liberia since they vary
with locations and altitude, but 27°C to 32°C and 23°C to 28°C for day and night respectively
is ambient for Tilapia niloticus and African catfish growth and reproduction (Table 5 and 6).
The temperature of Liberia as indicated in the introduction does not exceed 37°C.
Table 5: Temperature requirement for Nile tilapia in pond aquaculture
Table 6: Temperature requirement for African catfish (Britz and Hecht 1987)
Temperature (⁰C) Score Justification
30 Very Suitable
At 30 ⁰ C, fish growth rate is high (Britz and
Hecht 1987).
25-33⁰C Suitable Between 22-33 ⁰C, is optimal for fish growth
5.1.3 Salinity
Salinity is another important water variable that should be given keen attention during the
evaluation of water quality of a proposed site (Pillay and Kutty 2005). The salinity of water
supply dictates to the initial salinity of the ponds (Boyd and Tucker, 1998). During the rearing
process, the introduction of feed and fertilizers may increase the salinity of the water.
Considerable evaporation and precipitation can alter the salinity of a pond, especially in
regions with rainy and dry seasons. In tropical locations the salinity of the pond water
decreases during the rainy season due to heavy inflow of freshwater and while during the dry
season the salinity level of the pond water is high as a result of low inflow of freshwater.
Temperature
(⁰C) Score Interpretation Justification
32-35 4 Very Suitable Fish grow the fastest in this range of temperature
(FAO 2006)
31-36 3 More Suitable This is the optimal range of temperature over
which feeding occur
19-21 2 Suitable
Within this range of temperature, spawning
percentage averaged 10 and 34.9% respectively
(EL-Naggar et al., 1997)
<19⁰C 1 Unsuitable Tilapia do not lay egg when water temperature
drop below 19⁰C (EL-Naggar et al., 1997)
Kpadeh
UNU-Fisheries Training Programme 18
Salinity tolerance is species specific, and every species has its range of salinity that they can
tolerate with certain level being optimal. It is within this range that fish can efficiently
regulate their internal body fluid composition of ions and water. Species reared outside their
optimal salinity range may have to expend considerable energy on osmoregulation, leaving
less energy for other processes (Boyd and Tucker 1998).
5.1.4 Salinity in the inland waters of Liberia
I was unable to find any information on the salinity of inland water bodies in Liberia.
However, given the high annual precipitation the salinity of inland water bodies is likely to be
low and most likely does not affect the culture of Tilapia and African catfish.
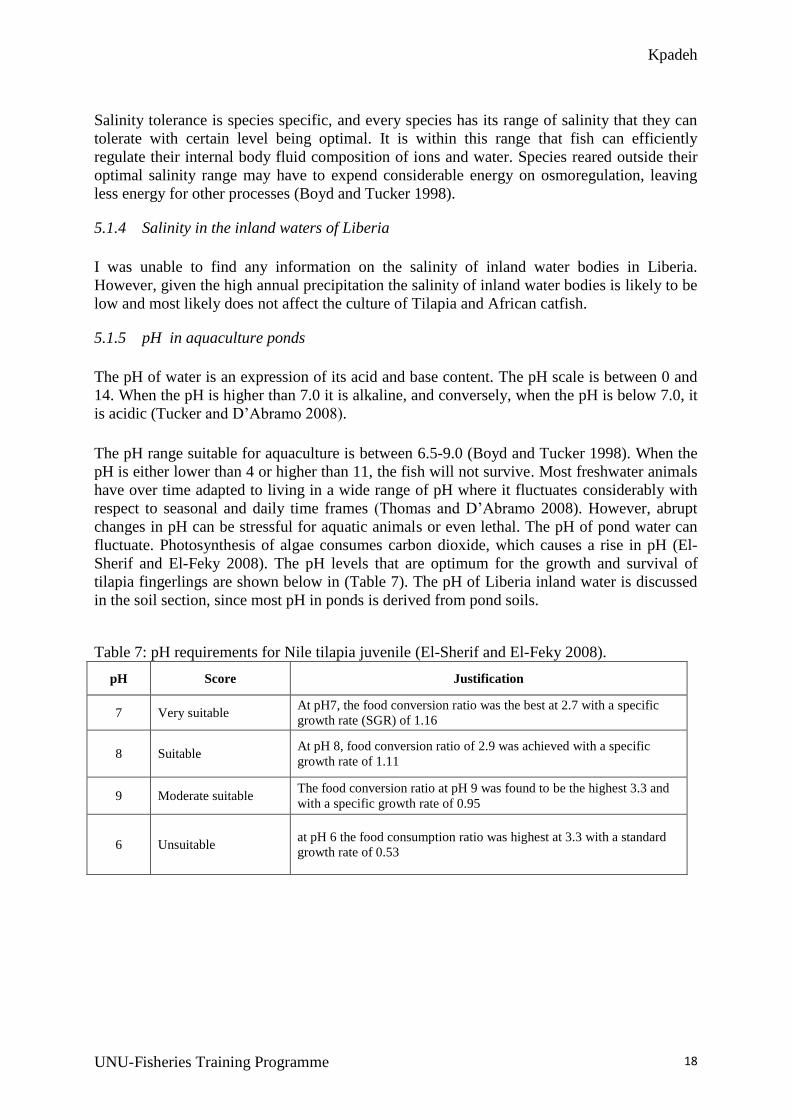
5.1.5 pH in aquaculture ponds
The pH of water is an expression of its acid and base content. The pH scale is between 0 and
14. When the pH is higher than 7.0 it is alkaline, and conversely, when the pH is below 7.0, it
is acidic (Tucker and D’Abramo 2008).
The pH range suitable for aquaculture is between 6.5-9.0 (Boyd and Tucker 1998). When the
pH is either lower than 4 or higher than 11, the fish will not survive. Most freshwater animals
have over time adapted to living in a wide range of pH where it fluctuates considerably with
respect to seasonal and daily time frames (Thomas and D’Abramo 2008). However, abrupt
changes in pH can be stressful for aquatic animals or even lethal. The pH of pond water can
fluctuate. Photosynthesis of algae consumes carbon dioxide, which causes a rise in pH (El-
Sherif and El-Feky 2008). The pH levels that are optimum for the growth and survival of
tilapia fingerlings are shown below in (Table 7). The pH of Liberia inland water is discussed
in the soil section, since most pH in ponds is derived from pond soils.
Table 7: pH requirements for Nile tilapia juvenile (El-Sherif and El-Feky 2008).
pH Score Justification
7 Very suitable At pH7, the food conversion ratio was the best at 2.7 with a specific
growth rate (SGR) of 1.16
8 Suitable At pH 8, food conversion ratio of 2.9 was achieved with a specific
growth rate of 1.11
9 Moderate suitable The food conversion ratio at pH 9 was found to be the highest 3.3 and
with a specific growth rate of 0.95
6 Unsuitable at pH 6 the food consumption ratio was highest at 3.3 with a standard
growth rate of 0.53
Kpadeh
UNU-Fisheries Training Programme 19
5.1.6 Water availability
A reliable water supply is an important factor to consider when selecting a site for
aquaculture. The quantity of water required depends among other factors on the type of
aquaculture system, evaporation rate, leaching from ponds, species cultured, management
practices, culture densities, and skills of the culturist (Lawson 1995). When calculating a
water budget, all factors that influence water use should be taken into consideration (Homziak
et al. 1993).
5.1.7 Water resources of Liberia
The climate and water resources of Liberia are very suitable for the aquaculture of African
catfish and Nile tilapia and other freshwater species with respect to their environmental
requirements. The climate of Liberia is almost the same everywhere with just minor variation
between areas during certain part of the year with slight rainfall and sunshine. The annual
rainfall varies from 1,700 mm in the north to 4500 mm in the south with a temperature
between 22-28 ⁰C. Relative humidity is from 65% to 85%. Approximately 75% to 85% of the
rainfall is experienced between June and October. It is also established that most part of
Liberia have excess water for up to 8 to 5 months with an estimated evapotranspiration rate
between 3.0 and 4.5 mm daily. There are nine major river system that are characteristic of
perennial that flow from the northeast to southwest and drain into the Atlantic Ocean. The
country stands as one of the top African countries with abundance renewable water resources
of about 232 km3/yr.
In most levee ponds with an average depth of 1.5-2.0 m the annual water requirement would
be approximately 250 mm/yr for wet climate and up to 900 mm/yr for very dry region (eg.
desert area). The quantity of water can further increase up to 3000 mm/yr when ponds are
drained annual for harvest and other losses, thus making aquaculture a water intensive sector
as compare to rice sector that will need just 1000 mm/yr for a staple crop (Yoo and Boyd
1994).
Considering the worst-case scenario of water requirement of 3000 mm/yr and assuming the
total aquaculture area of 20,000 hectares for sustainable aquaculture, the total water
requirement will be 6 billion mm3/yr or 6 km
3/yr. The amount is just 2.6% of the total
renewable water resource of 232 km3/yr of Liberia.
5.2 Soil
The four most important soil features for aquaculture production are texture, organic matter
content, pH, and presence or absence of particular soluble compounds that may be beneficial
or harmful to water quality. Much is known about the classification of soil for agricultural and
engineering work, but little is known about the desirable characteristics of soil for aquaculture
ponds (Boyd 1995).
Pond bottom soil plays a vital role in providing nutrients for phytoplankton, the primary food
organism in a pond. As a result, ponds bottom soil must be suitable to enhance productivity of
the ponds (Datta 2011). The pH of pond water is influence by the interaction between water
and pond bottom soil. Acidic soil reduces the concentration of bicarbonate, carbonate,
magnesium and calcium in water and such water does not support the process of
photosynthesis in the pond (Boyd et al. 2002). Soil is responsible for retaining water in ponds.

Kpadeh
UNU-Fisheries Training Programme 20
Water retentiveness in pond is greatly influenced by the characteristic of the soil. Soil can be
classified as gravel, clay, silt and sand based on the distribution of particle size. A good pond
bottom should have a soil composition of 30% clay with a mixture of different sizes of
particles (Boyd 1995).
Water and air exchange in the soil takes place in small and large openings called pores that
are interconnected, and can be characterized by the sizes of particles found within them. The
size of pores decreases when the particle size decreases. Coarse textured soil has many large
pores because of the loose arrangements of larger particles, unlike fine textured soils that have
smaller pores due to the tight arrangement of their particles (McCauley et al. 2005). The
ability of a soil to retain water is entirely dependent on the volume of pore space (Boyd 1995).
For proper planning and management, soil and its properties should be investigated (Pillay
and Kutty 2005). Soil criteria for aquaculture ponds (Table 8) were developed to assess the
soil suitability for aquaculture in Liberia.
Table 8: Soil quality criteria for aquaculture ponds (Aruleba and Agbebi 2010).
SCL=Sandy, clay, Loam, L=Loam, LS= Loamy Sand, S= Sandy, SL= Sandy Loam,
SCL=Sandy Clay Loam, CL= Clay Loam
Parameter Critical
level
Unsuitable(S4) Marginally
suitable
Moderate
suitable
Highly Suitable
(S1)
Organic carbon
(%)
1-2 <1 1-2 2-3 >3
Clay (%) 20 <5 10 11-19 >20
Permeability
(cm/hr)
10 <5
Bulk density
(g/cm3)
1.4 >1.2 1.25-1.4 1.4 >1.4
P (mg.kg-1) 8 <6 6-7 7-8 >8
Total N (%) 0.15 <0.08 0.08-1.0 0.1-0.13 >1.5
Soil texture SCL,L LS,S L SL, SCL CL
Depth (cm) 75 <50 50-75 75-100 >100
Kpadeh
UNU-Fisheries Training Programme 21
5.2.1 The soil of Liberia
According to the study conducted on the Comprehensive Assessment of the Agriculture
Sector (CAAS-Liberia, 1997) there are three categories of soil in Liberia (Table 9). Latosols
make up 75% of the soil in Liberia and suit the use for aquaculture with one minor limitation
that is the high level of acidity. The soil texture ranges from sandy loams to clay loam with an
organic matter content of 2 to 6% that is favourable for water retention in the ponds and the
enhancement of the production of phytoplankton. The accumulation of pH in water is
attributed to pond soil. The optimum range of pH for growth and reproduction is from 6.5-9.0
pH, although tilapia can tolerate as low levels as pH 5. Below pH 5 conditions are lethal for
the fish, wherein the fish becomes stressed and may eventually die (Boyd 1995). However the
condition of soil acidity does not preclude aquaculture from a certain area since the acidity
can be neutralized with proper measure. Liming can neutralize pond soil acidity and at the
same time enhance productivity. Table 10 shows the type of liming and their recommended
quantity of applications for ponds.

Kpadeh
UNU-Fisheries Training Programme 22
Table 9: Soil of Liberia (CAAS-Liberia, 2007).
Soil type Liberian
classification % Area Area (ha) Properties
Lateritic
soil or
Latosol
Kakata, Voinjama
and Suacoco series
75% 8,352,750
Reddish brown, leached top soil, 4-6%, OM,
acidic, well drained, agricultural soil
Regosols
or coastal
sandy soil
Clara town, sinkor
and Freeport series
20% 2,227,440
Well- drained, 60% coarse sand, very low
water holding capacity, little humus and few
mineral nutrients, not productive agriculture
soil
Alluvial
or swamp
soil
Gbelle, Ballam,
Grayzohn, and
cuttington series
5% 556,850
Waterlogged, grey hydromorphic soils,
poorly draining, thick dark layer of loamy-
peaty organic material, with relatively high
humus content
Table 10: Types of liming agents and recommended dosages (Russell et al. 2008). Crushed oyster shells CaCO At least two tons per acre Recommended
Pelletized lime CaCO, Mg
CO3 At least two tons per acre
Not recommended due to high cost and
the potential problem with binders
Fulid Lime
CaCO3,
Ca(OH) In
some
formulation
Depends on formulation Not recommended due to high cost and
the potential to raise pH to toxic level
Lime wastes CaCO3,
Ca(OH)
The smaller of either 200
lb per acre or the amount
required to deliver 50 lb
per acre of Ca(OH)
Not generally recommended and could
also raise pH to toxic levels
Quick lime, Brunt lime CaO Less than 50 lb per acre
Not recommended and could raise ph to
toxic leves with only short term
effectiveness
Shaked Lime, Hydrated
lime, Builders lime Ca(OH) Less than 50 lb per acre
Not recommended and could raise ph to
toxic leves with only short term
effectiveness
Kpadeh
UNU-Fisheries Training Programme 23
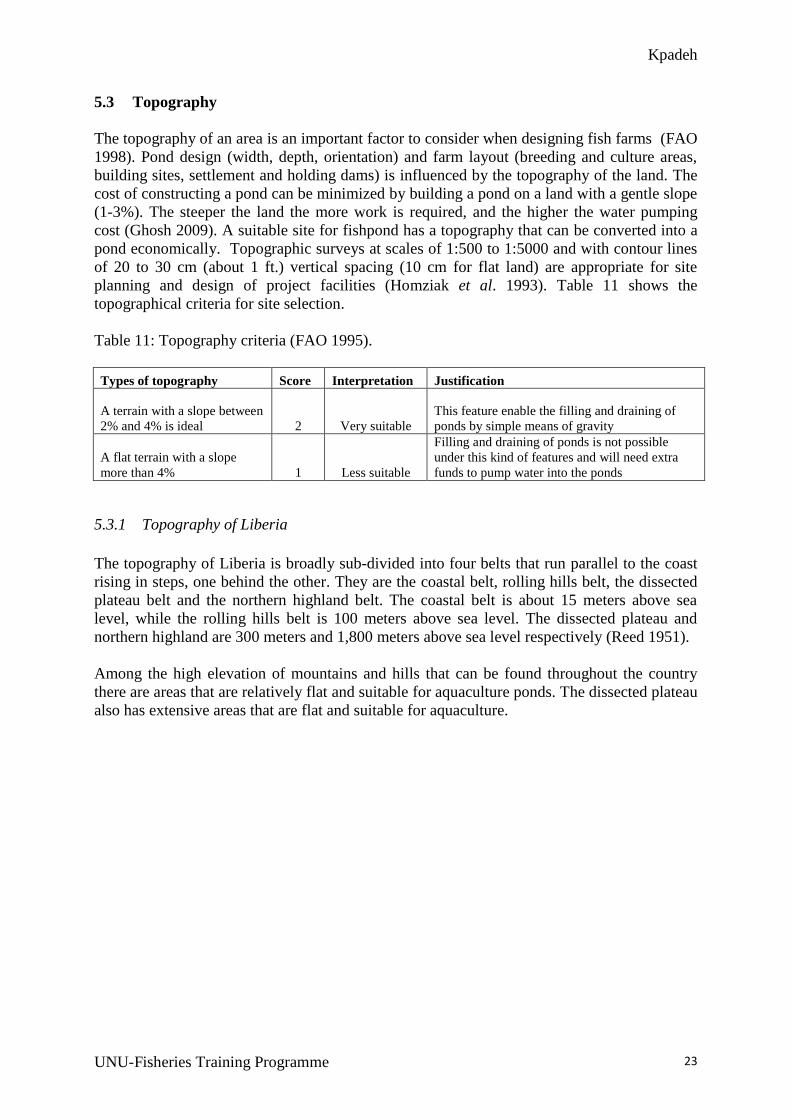
5.3 Topography
The topography of an area is an important factor to consider when designing fish farms (FAO
1998). Pond design (width, depth, orientation) and farm layout (breeding and culture areas,
building sites, settlement and holding dams) is influenced by the topography of the land. The
cost of constructing a pond can be minimized by building a pond on a land with a gentle slope
(1-3%). The steeper the land the more work is required, and the higher the water pumping
cost (Ghosh 2009). A suitable site for fishpond has a topography that can be converted into a
pond economically. Topographic surveys at scales of 1:500 to 1:5000 and with contour lines
of 20 to 30 cm (about 1 ft.) vertical spacing (10 cm for flat land) are appropriate for site
planning and design of project facilities (Homziak et al. 1993). Table 11 shows the
topographical criteria for site selection.
Table 11: Topography criteria (FAO 1995).
Types of topography Score Interpretation Justification
A terrain with a slope between
2% and 4% is ideal 2 Very suitable
This feature enable the filling and draining of
ponds by simple means of gravity
A flat terrain with a slope
more than 4% 1 Less suitable
Filling and draining of ponds is not possible
under this kind of features and will need extra
funds to pump water into the ponds
5.3.1 Topography of Liberia
The topography of Liberia is broadly sub-divided into four belts that run parallel to the coast
rising in steps, one behind the other. They are the coastal belt, rolling hills belt, the dissected
plateau belt and the northern highland belt. The coastal belt is about 15 meters above sea
level, while the rolling hills belt is 100 meters above sea level. The dissected plateau and
northern highland are 300 meters and 1,800 meters above sea level respectively (Reed 1951).
Among the high elevation of mountains and hills that can be found throughout the country
there are areas that are relatively flat and suitable for aquaculture ponds. The dissected plateau
also has extensive areas that are flat and suitable for aquaculture.

Kpadeh
UNU-Fisheries Training Programme 24
6 SOCIO-ECONOMIC FACTORS
6.1 Market
Marketing is as important as production, financing, cash flows and other profit determining
factors for an aquaculture enterprise, whether it be a commercial or small-scale. A good
survey of a market potential of a site or area that is intended for aquaculture is the key to the
overall success of the operation.
In Liberia, there is no complete data on fish consumption and marketing, and as an
alternative, on farm sale was used to evaluate market potential. Market potential as on farm
sale (Table 12) was inferred from the population density (individual/sq. mi or I/sq. mi). Many
small-scale fish farmers in the United States generate more income from selling their fish and
crustaceans on the farm (Dasgupta et al. 2009). The basis of the analysis is, the higher the
population density, the larger the market demand, and also the impact of population on land
tenure or ownership.
Table 12: Population density of counties (LISGIS 2008).
County [I/sq. mi]
Montserrado 1540
Margibi 202
Maryland 153
Bomi 113
Nimba 104
Bong 99
Lofa 75
Grand Bassa 73
Grand Cape Mount 69
Grand Kru 39
Rivercess 33
Grand Gedeh 30
Sinoe 27
River Gee 24
Gbarpolu 22
6.2 Agricultural by-products
Agriculture provides livelihood for a large proportion of the economically active population
in Liberia, who are engaged in smallholder agriculture, according to the poverty reduction
strategy 2008.
There is good potential for aquaculture in farming areas. The presence of agriculture indicates
that there is already basic infrastructure such as farm to market road and availability of labour
force. Secondly, agriculture and livestock farming produces agricultural by-products that can
be used both as sources of feed for fish and fertilizer for fish ponds (Kapetsky 1994). In

Kpadeh
UNU-Fisheries Training Programme 25
Liberia, 25% of the nutritional requirements of the aquaculture fish are met by feeding them
rice bran, kitchen leftover and other vegetable by-products. The remaining 75% of the food is
produced in the pond. The fertilization of ponds with livestock waste enhances the
productivity of the ponds.
Information regarding livestock and crop production for each of the counties is lacking, which
would have been the most preferable data to use in this study. As a proxy, the number of
household livestock and crop farmers were used for each of the counties and was inferred
from the 2008 National population and housing census (LISGIS 2008).
The results in Table 13 is in descending order, and the top five counties (Nimba, Bong, Lofa,
Montserrado and Grand Bassa) are considered to have the highest potential of livestock waste
availability, while (Gbarpolu, Rivercess, Grand Gedeh, Margibi, Grand Cape Mount) which
are intermediate on the table, are the ones with moderate potential for livestock wastes
availability, and the five counties at the bottom of the table (Grand Kru, Maryland, Sinoe,
River Gee, and Bomi) are considered to be the counties with the least potential for livestock
waste availability.
Table 13: Household livestock and crop farmers (LISGIS 2008).
County # of household farmers
Nimba 62917
Bong 49807
Lofa 40815
Grand Bassa 30558
Montserrado 24500
Margibi 17725
Grand Cape Mount 16017
Grand Gedeh 12640
Rivercess 11646
Gbarpolu 11400
Sinoe 10833
Maryland 10717
Bomi 10460
River Gee 8464
Grand Kru 7765
6.3 Education
Education plays a pivotal role in the development of aquaculture, enabling farmers to adopt
readily modern technology to enhance production. A survey conducted in Malawi on fish
farming households, shows that the most productive and higher income earning fish farmers
were people with higher education (Russell et al. 2008). The assessment further shows that
the success of these farmers was attributed to their ability to adopt different levels of
technology (Russell et al. 2008).
Kpadeh
UNU-Fisheries Training Programme 26
In Liberia, a detailed assessment has not yet been conducted to establish the educational levels
among fish farmers, but it can be assumed that approximately 80% of fish farmers are
illiterate. This has been a major barrier in the development of aquaculture in Liberia.
It is not feasible to develop a criterion for education due to the lack of information on the
educational levels in each of the counties. Based on what I perceived, education could be an
impediment to aquaculture development in Liberia.
7 DISCUSSION
The results from this study suggest that there is good potential for aquaculture in Liberia.
When conditions are evaluated based on biological and physical criteria (soil, water and
topography) they all suggest that most parts of the country are suitable for pond aquaculture.
Liberia has numerous water bodies, high level of precipitation and abundant resources that
could allow other forms of aquaculture such as cage culture. Latosols, which make up 75% of
the soil covered in Liberia is ideal for aquaculture due to its compact texture and
impermeability. Even though, hills and mountains characterize the topography, there are areas
of relatively flat lands, such as plateau, that are suitable for small-scale aquaculture. These
areas can be found at various locations in the country. There are some variations in population
density in among counties and as a result, the available market is variable in size. However,
there is, at present, a decrease in per capital fish consumption due to reduced landings of fish
by artisanal fishers, which suggests a good market potential for aquaculture products. The
strong tradition of fish consumption in Liberia will also keep demand high for aquaculture
fish. The total of 326,264 household livestock farmers in the country signify that livestock
wastes are accessible to fertilize aquaculture ponds. Due to the lack of information on
education, the author assumed that education is a threat to the development of aquaculture
based on his experiences. The study indicates that there are some differences between
counties in the number of students. Thus the availability of well-educated people may vary
accordingly.
The study could only address certain factors that affect aquaculture development. However,
other factors will also affect the future development of aquaculture. Some of these threats are:
Pollution: Pollution has been identified as a potential risk rather than a major source of losses
to aquaculture. Despite of the abundance of water supplies in Liberia, the valuable resource is
under increased pressure from population growth, uncontrolled disposal of waste, agricultural
activities, mining, logging, aquaculture and other activities. Pollution of streams with reduced
water quality is common in urbanized areas (MLME 2008). Furthermore, the entire sewerage
system that was destroyed during the civil crisis has resulted into domestic waste being
dumped into coastal lagoons, estuaries, deltas, mangroves that are rich resource of fish protein
(Brandolin and Tigani 2006).
Access to Loans: Most fish farmers or wanting to be fish farmers lack access to initial capital
to ignite an aquaculture farm. This is a major constraint that can hamper the development of
aquaculture in rural settings.
Other issues: There are issue that could directly or indirectly affects aquaculture by
introducing socio-economic conflicts with other users for the same water body, particularly
tourism and fishing. Usually, there should be a 1 km demarcation between aquaculture,
Kpadeh
UNU-Fisheries Training Programme 27
tourism and fishing grounds to avoid conflicts of rights. Aquaculture like any other farming
activities involved the use of land. Land cost and ownership can arise in populated area. The
population of Liberia is increasing by 2.1% per annum, meaning that in the next few years
increase in land cost is inevitable. This situation will be a constraint to the development of
aquaculture in Liberia, because the poor farmers who constitute about 75% of fish farmers in
Liberia will find difficulty in acquiring land.
8 CONCLUSION AND RECOMMENDATIONS
The results of this study suggest that there is a good potential for aquaculture in Liberia.
However, evaluation of aquaculture potential in different counties is required for further
studies to access the potential in different parts of the country. Some of this information is not
accessible but should be obtained. The study relied in part on surrogate indicators, e.g. on
market size and education level, and these must be confirmed in further studies.
Regarding the future prospects and development of aquaculture in Liberia, a more detailed
assessment taking into consideration all of the 15 counties should be conducted to map out
potential zones for aquaculture development. This will create an environment for proper
planning and management of the sector, that which has been lacking since the inception of
aquaculture in the 1950s. This present study shows how important this information is.
This study evaluated the potential for aquaculture in Liberia. The following recommendations
arise from the study, and are as follows:
It is recommended that the government of Liberia support the development of
aquaculture to help balance the shortfall in supplies that are resulting from; increased
population and reduced landings of catches by artisanal fisher folks
It is recommended that a strategy framework for aquaculture in Liberia is formulated
to enhance planning and management of the sub sector
The government of Liberia should recognized the need to undertake a strategic
assessment of the potential of aquaculture to contribute to share food security and
livelihood of rural inhabitants. Economic activities are scarce in rural communities
A holistic approach involving NGOs, government, fish farmers and other stakeholders
should be envisaged to enhance the development of aquaculture
A detail assessment on the potential of aquaculture in Liberia should take into
consideration all of the 15 counties so as to stimulate improved planning and
management of aquaculture.
Kpadeh
UNU-Fisheries Training Programme 28
LIST OF REFERENCES
Aguillar-Manjarrez, J and Nath, S.S. (1998). A strategic reassessment of fish farming
potential in Africa. CIFA Technical Paper No. 32, Rome: FAO. 170 pp.
Aruleba J.O. and Agbebi F.O. (2010). Assessment and management of South Western Nigeria
Ponds for sustainable aquacultural production. Faculty of Agricultural Sciences, University of Ado
Ekiti, Nigeria. ARPN Journal of Agricultural and Biological Science. Vol. 5, No. 1, January 2010.
Boyd, C.E. and Tucker, C.S. (1998). Pond Aquaculture Water Quality Management. Boston:
Kluwer Academic Publishers.
Boyd C.E., Wood, C.W. and Thunjai, T. (2002). Aquaculture pond bottom soil quality
management. Oregon: Pond Dynamics/Aquaculture Collaborative Research Support Program,
Oregon State University.
Boyd, C.E. (1995). Bottom soils, sediment, and pond aquaculture. New York: Chapman and
Hall
Britz P.J., and Hecht, T. (1987). Temperature preferences and optimum temperature for
growth of African sharp tooth catfish (Clarias gariepinus) larvae and post larvae. Aquaculture
63:201-214.
Brandolini, G. and Tigani, M. (2006). Liberia Environmental Profile. European Commission
and Agreco GEIE.
Bruton, M.N. (1988). “Systematics and biology of clariid catfish”. In Hecht, T. Uys W., and
Britz P. eds. The Culture of Sharptooth Cattish, Clarias gariepinus in Southern Africa.
Bureau of National Fisheries (BNF). (2007). Quarterly Report Research, Statistics and
Biology Division. Monrovia: Ministry of Agriculture.
Bureau of National Fisheries (BNF). (2008). Quarterly Report Research, Statistics and
Biology Division. Monrovia: Ministry of Agriculture.
Bureau of National Fisheries (BNF). (2010). Quarterly Report Research, Statistics and
Biology Division. Monrovia: Ministry of Agriculture.
Coche, A.G., Muir, J.F. and Laughlin, T. (1995). Simple methods for aquaculture pond
construction for fresh water fish culture. Training series 20/1. Rome: FAO.
Conte, F.S. (1993). Evaluation of a freshwater site for aquaculture potential. Western
Regional Aquaculture Centre Publication No. 92-101. University of Washington, School of
Fisheries.
Central Intelligence Agency (CIA) World Fact Book Liberia [January 15, 2009]
https://www.cia.gov/library/publications/the-world-factbook/print/li.html.
Dasgupta, S., Sarkar, S.K., Sarangi, N. and Bhattacharya, S. (2009). Variation in spawning
responses, egg and larvae productions from induced rohu (Labeo rohita) during pre-monsoon
Kpadeh
UNU-Fisheries Training Programme 29
and monsoon seasons: Relationship with hormonal changes and oocyte responsiveness during
final maturation. Aquaculture 209: 320-326.
Datta, S.N. (2011). Culture of Azolla and its efficacy in diet of Labeo rohita. Aquaculture
310:376-379.
EAF-NANSEN. (2010). Improving the artisanal fisheries management of Liberia and Sierra
Leone.
EL-Sayed, A.M. (2006). Tilapia culture in salt water: environmental requirements,
nutritional implications and economic potentials. Simposium Internacional de Nutricion
Acuicola. 15-17 November, Universidad Autonoma de Nuevo Leon, Monterrey, Nuevo Leon,
Mexico.
Food and Agricultural Organization of the United Nations FAO. (1999). Africa Regional
Integrated Irrigation and Aquaculture Workshop. FAO Aquaculture Newsletter-December
1999 No.23. Rome: FAO.
Food and Agricultural Organization of the United Nations FAO (2009). State of food security
in the world. FAO Report 2009. Rome: FAO.
Food and Agricultural Organization of the United Nations FAO (2010a). The State Of The
World Fisheries And Aquaculture. FAO Report 2010. Rome: FAO.
Food and Agricultural Organization of the United Nations FAO (2010b). Countries Fisheries
And Aquaculture Profile. FAO Report 2010. Rome: FAO.
Ghosh, A.K. (2009). Aquaculture technology and environment. PHI Learning Private Limited.
278 pp.
Homziak J., Veal, C.D. and Hayes, D. (1993). Design and construction of aquaculture
facilities in dredged material containment areas. Technical Report EL-93-11. Vicksburg:
U.S. Army Engineer Waterways Experiment Station.
Kapetsky, J.M. (1994). A Strategic assessment of warm water fish farming potential in Africa.
CIFA technical paper 27. Rome: FAO.
Lawson, T. (1995). Fundamentals of aquaculture engineering. Boston: Kluwer Academic
Publishers.
Liberia Institute for Geo Information and Statistics (LISGIS) 2008. National housing and
population census 2008.
McCauley, A., Jones, C. & Jacobsen, J. (2005). Soil and Water Management. Module 1:
Basic Soil Properties. Bozeman, MT: Montana State University Extension Service.
Ministry of Lands, Mines and Energy (MLME). (2008). National Integrated Water Resources
Management policy. Monrovia: Ministry of Lands, Mines and Energy.
Ministry of Planning and Economics Affairs (PEA). (2008). Government of Liberia Poverty
Reduction Strategy. Monrovia: Ministry of Planning and Economics Affairs.

Kpadeh
UNU-Fisheries Training Programme 30
Mishra, R.R., Rath, B. and Thatoi, H. (2008). Water quality assessment of aquaculture ponds
in Bhitarkanika mangrove ecosystem. Turkish Journal of Fisheries and Aquatic Science 8:71-
77.
El-Sherif, M.S. and El-Feky, A.M.I. (2008). Performance of Nile tilapia (Oreochromis
niloticus) fingerlings under different water temperatures. International Journal and
Agriculture and Biology 3:301-305.
Mjoun, K., Rosentrater, K.A. and Brown, M.L. (2010). Tilapia environmental biology and
nutritional requirements. South Dakota Cooperative Extension. FS 963-02.
Pillay, T.V.R. and Kutty, M.N. (2005). Aquaculture, Principles and practices. 2nd
Edition.
Oxford: Blackwell Publishing Ltd.
Reed, W.E. (1951). Reconnaissance soil survey of Liberia. US Department of Agriculture,
Office of Foreign Agricultural Relations and US Department of State, Technical Cooperation
Administration.
Russell, A.J.M., Grotz, P.A., Kriesemer, S.K. and Pemsel, D.E. (2008). A Case Study On The
Development and Status of Freshwater Aquaculture in Malawi. World Fish Center, Studies
and Reviews 11869.
Svobodova, Z. (1993). Water Quality and Fish Health. Rome: FAO.
Tucker, C.S. and D’Abramo, L.R. (2008). Managing high pH in freshwater ponds. Southern
Regional Aquaculture Center.
Ngugi, C.C., Bowman, J.R., and Omolo, B.O. (2007). A new guide to fish farming in Kenya.
Aquaculture Collaborative Research Support Program.
Yoo, K.H. and Boyd, C.E. (1994). Hydrology and water supply for pond aquaculture: New
York: Chapman Hall.
Kpadeh
UNU-Fisheries Training Programme 31
ACKNOWLEDGEMENTS
I would like to express my special thanks and gratitude to Professor Helgi Thorarensen who
encouraged me to undertake this project on the topic “The potential of aquaculture in
Liberia”, which also helped me doing a lot of research and came to know into detail about so
many new things. Secondly, I would also like to thank the management team of the UNU-
FTP, Tumi Tomasson, Director, Thor Asgeirsson, Deputy Director, and Sigridur
Ingvarsdottir, Administrative Attendance for according me all the necessary assistance that I
needed to make life convenient during my six months stay in Iceland. My sincere thanks and
appreciation to the Minister of Agriculture of Liberia, Dr. Florence Chenoweth for granting
me the permission to undertake this training course. Also to Mr. Yevewuo Z. Subah through
whose support and encouragement that I have a career in aquaculture. To all fellows who
were supportive as we struggled. I particularly wish to acknowledge Jose Companhia for
encouraging me to complete this project when I felt like giving up. Also to Antoine Dillet,
PhD student at Holar University College for reading through my work when I most needed
my work to be edited. Finally, and not the least, to my mother Mrs Susannah J. Beyan, family
members, friends and colleagues at the Bureau of National Fisheries for their patience during
the six months absence from Liberia.


