
The North Carolina Health Professions Data System
Katie Gaul, Erin Fraher,Thomas C. Ricketts, Jessica Carpenter
University of North Carolina at Chapel Hill

Overview of Today’s Presentation
The North Carolina Health Professions Data System
Mission Background Data Collection, Cleaning, Reporting Organizational Issues External Data Sources WHY? Examples and Value of Work Wrapping Up

Our Mission
To provide timely, useful data and analysis to support decision making for health professions policy in North Carolina and the United States To support research into health workforce
issues and problems To train others in how to develop and
maintain data systems in health workforce

HPDS: 3 Main Product Lines
Maintenance of Licensure Data Files for HPDS
This function is the backbone of our work. It takes substantial time and staff effort to collect, clean, edit, and disseminate licensure data. Sustaining & maintaining this infrastructure is challenging.
Special Projects:Service to the State and the
InstitutionThe HPDS often undertakes special research projects at the request of the NC AHEC, UNC Board of Governors (respond to legislation, make presentations), licensure boards etc. This service has increased the visibility of the Sheps Center to important local sponsors and policymakers.
Allied Health Workforce Studies
Funded by the Duke Endowment and the NC AHEC, research has focused on quantifying the supply of, and demand for, allied health workers. Findings highlighting the growth of allied health employment have gained the attention of policy makers. Staff in the Governor’s office, the legislature, and other state agencies are working to develop innovative ways to transition unemployed individuals into allied health jobs.

North Carolina HPDS
A collaboration between the Cecil G. Sheps Center for Health Services Research at UNC-CH and the health professions licensing boards.
Data are provided voluntarily by the boards—there is no legislation that requires this, there is no appropriation.
Core funding provided by: NC AHEC Program Office, data request
fees, project cross-subsidies, and the UNC-CH Office of the Provost.

The System is Unique in the U.S.
30 years of continuous, complete data
Comprehensive and voluntary collaboration with 12 licensing bodies in North Carolina
Data remain property of licensing board, permission sought for each “new” use
System is independent of government or health care professionals

Categories of Health Professionals in Data
System Certified Nurse Midwives
(1985) Chiropractors Dental Hygienists Dentists Licensed Practical Nurses Nurse Practitioners Occupational Therapists
(2006) Occupational Therapy
Assistants (2006) Optometrists
Pharmacists Physical Therapists Physical Therapist
Assistants Physician Assistants Physicians (MDs and
DOs) Podiatrists Psychological Associates Psychologists Registered Nurses Respiratory Therapists
(2004)

HPDS Data Collected from Boards
“Base” data from initial licensure/approval forms
Updated data from renewals of licensure and approvals to practice
Includes 100% of active professionals because licensure is required by law
We develop a ‘Snapshot’ of files as of October of each year (Orange Book)
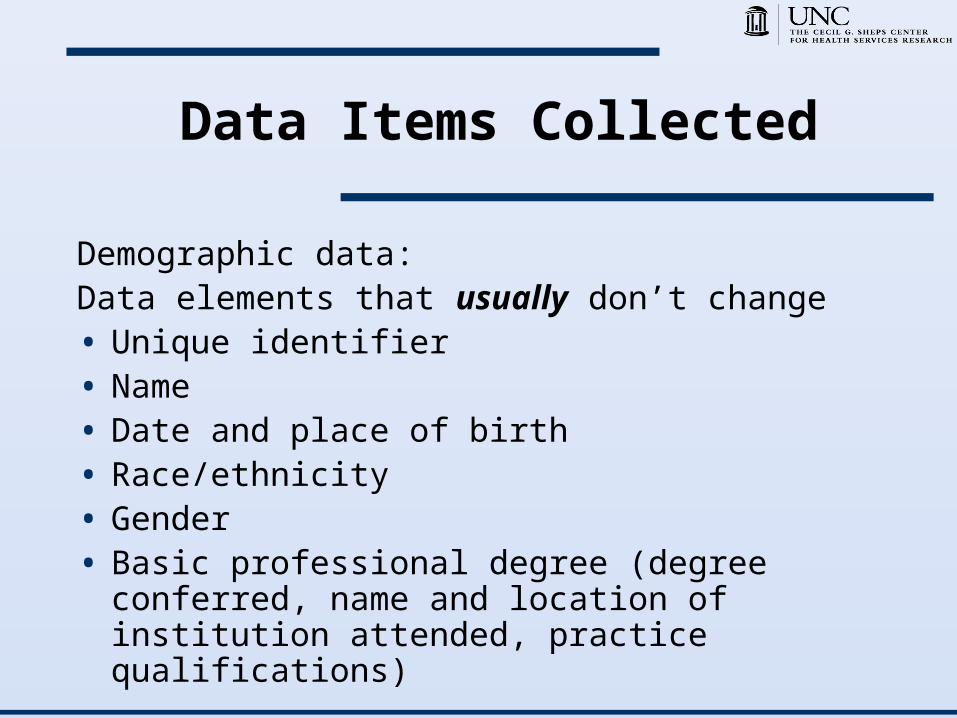
Data Items Collected
Demographic data: Data elements that usually don’t change• Unique identifier • Name• Date and place of birth• Race/ethnicity• Gender• Basic professional degree (degree conferred,
name and location of institution attended, practice qualifications)
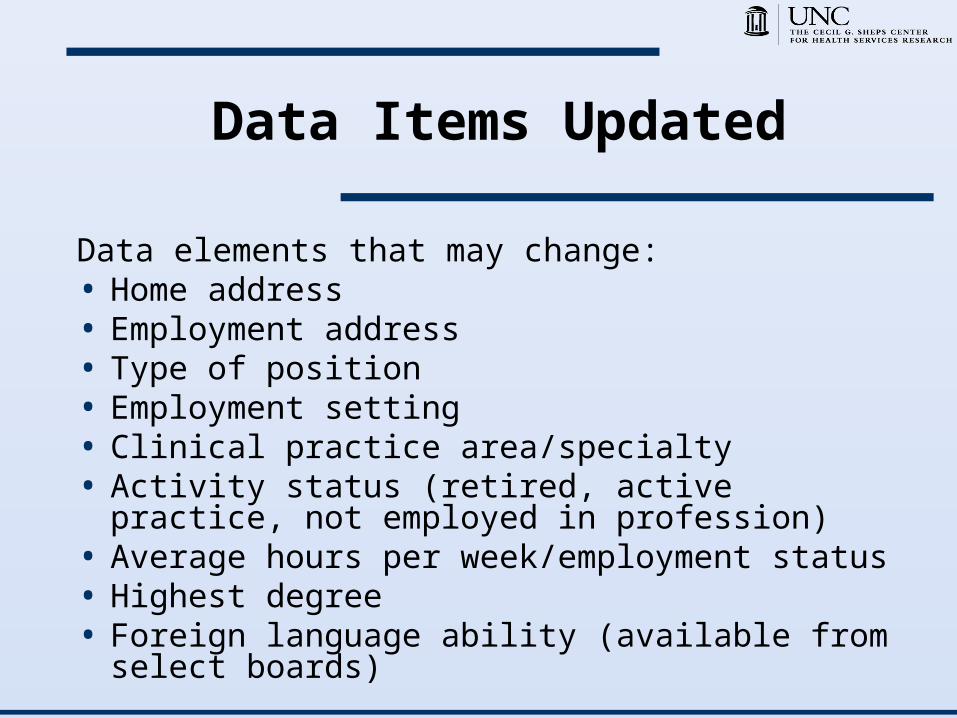
Data Items Updated
Data elements that may change: • Home address • Employment address• Type of position• Employment setting• Clinical practice area/specialty• Activity status (retired, active practice, not
employed in profession)• Average hours per week/employment status• Highest degree • Foreign language ability (available from select
boards)

Additional Data Items Collected
for Physicians and PAs Primary, Secondary and Other practice location
ZIP Code location Facility type Hours in clinical care (by location) Hours in primary care (by location)
Provide prenatal care? Deliver babies? Hospital Privileges (2007) Licenses ever held in other states/countries
(2007)
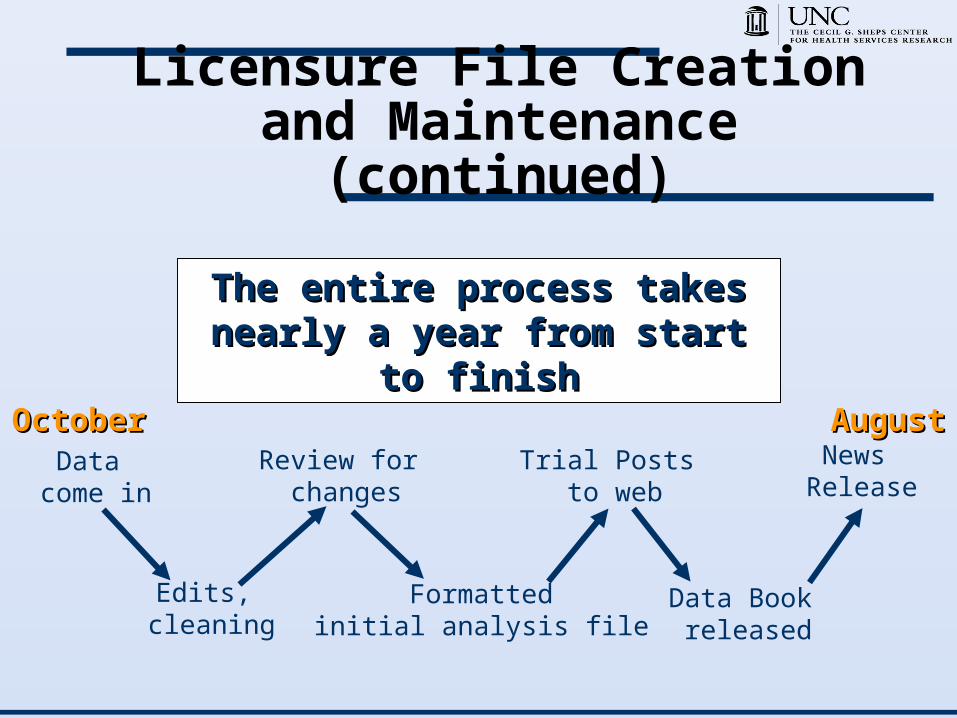
Licensure File Creation and Maintenance (continued)
Data come in
Edits, cleaning
Review for changes
Formattedinitial analysis file
Trial Posts to web
Data Book released
News Release
OctoberOctober AugustAugust
The entire process takes The entire process takes nearly a year from start to nearly a year from start to
finishfinish

North Carolina Health Professions Data Book
Annual Health Professions Data Book, produced since 1979, details state and county level health professions data; current issue: October 2007 data
Publications and research widely used by policymakers, educators, researchers, the media and health professionals as the official source of health professions statistics in NC
Supported by the North Carolina Area Health Education Centers Program and the University of North Carolina at Chapel Hill Office of the Provost

North Carolina Health Professions Data Book
Counts of active, licensed health professionals
Population by age group and race
Employment and income data Vital statistics (births, deaths,
pregnancies) Infant mortality rates Hospital and facility data
Aggregated by state, county and regions (AHEC, DHHS, Perinatal)

HPDS: Organizational Issues

Infrastructure: Hardware/Software
Hardware High end personal
computers which are regularly upgraded (every 2-3 years)
Connected to Sheps Center servers allowing file sharing, storage of large files, automatic back-up
Label writer for mailing data requests
Cleaning and processing of licensure files is done on local desktop computer using SAS®
Archive licensure files kept on UNC mainframe
Software Microsoft Access - track data requests, do file
audits, invoicing, data book pages Microsoft Excel/Powerpoint - graphically present
data Macromedia Dreamweaver® - web development Adobe Acrobat® - create PDF documents for
website Quark® or Adobe InDesign® - desktop
publishing Adobe Illustrator® - format maps and graphics MapInfo® or ArcGIS® - create maps and do
spatial analysis SAS® or Stata® - statistical analysis and
programming
Dissemination
State-Level (examples) State Legislators, Governor’s office, State Policy Makers Health Professions Schools All regional AHECs and their libraries North Carolina State Library North Carolina DHHS, Commerce North Carolina Hospital Association and other employers Professional Associations Duke Endowment and Kate B. Reynolds Charitable Trust North Carolina Institute of Medicine
National-Level AAMC, other workforce centers, AHECs, and researchers Federal Bureau of Health Professions, HRSA, NAO Library of Congress
Email listserv: 2,298 members, sign-up available on website

Basic Cost Estimates
StageFunding type
TasksEstimate
*This may vary*
Designthe System
One-Time
Explore available data, infrastructure, personnel, expectations; design database and data collection & analysis procedures
Wide range; depends on quality of data and current
database format;
personnel
Implementthe System
One-Time
Hire; purchase infrastructure; collect and audit data; populate database; identify and repair glitches; launch website
Operations Ongoing
Maintain files and collect new data; publish Data Book and aggregate stats; maintain website; respond to requests for data
$117,000 (North
Carolina)
Special Projects
Occasional
Undertake special projects at the request of General Assembly and others; tasks determined by nature of project
Depends on scope of work and budget

Cost Estimate for Producing the Annual Data Book:
Operating Costs
Personnel Time (salaries and benefits)excludes project cross-subsidies
~$113,300
Administrative (copying, postage, phone, supplies)
$600
Publications (printing, dissemination) $2,900
Total ~$116,849
Fiscal Year 2007-2008
This is a general estimate of the costs to produce the Data Book each year; This does not include funds
necessary for infrastructure or additional functions.
*These estimates cover the production of the annual HPDS Data Book and don’t take into account other projects that we design with the NC AHEC Program and others.
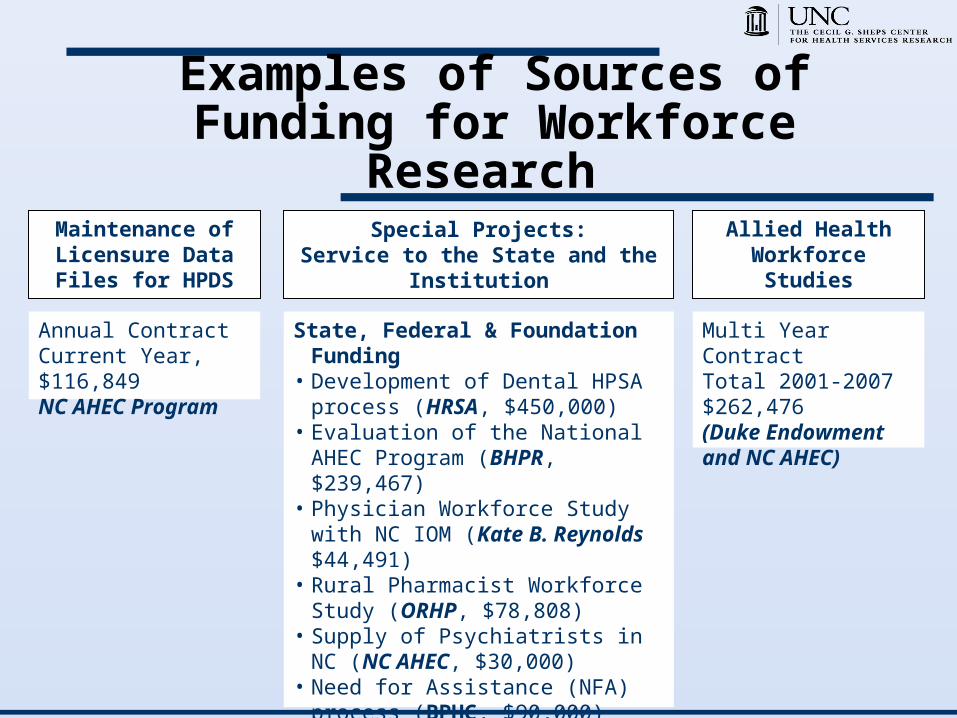
Examples of Sources of Funding for Workforce
Research Maintenance of Licensure Data Files for HPDS
Annual ContractCurrent Year, $116,849 NC AHEC Program
Special Projects:Service to the State and the
Institution
State, Federal & Foundation Funding
• Development of Dental HPSA process (HRSA, $450,000)
• Evaluation of the National AHEC Program (BHPR, $239,467)
• Physician Workforce Study with NC IOM (Kate B. Reynolds $44,491)
• Rural Pharmacist Workforce Study (ORHP, $78,808)
• Supply of Psychiatrists in NC (NC AHEC, $30,000)
• Need for Assistance (NFA) process (BPHC, $90,000)
• SE Regional Center for Health Workforce Studies (HRSA, $1,000,000)
Allied Health Workforce
Studies
Multi Year ContractTotal 2001-2007 $262,476 (Duke Endowment and NC AHEC)
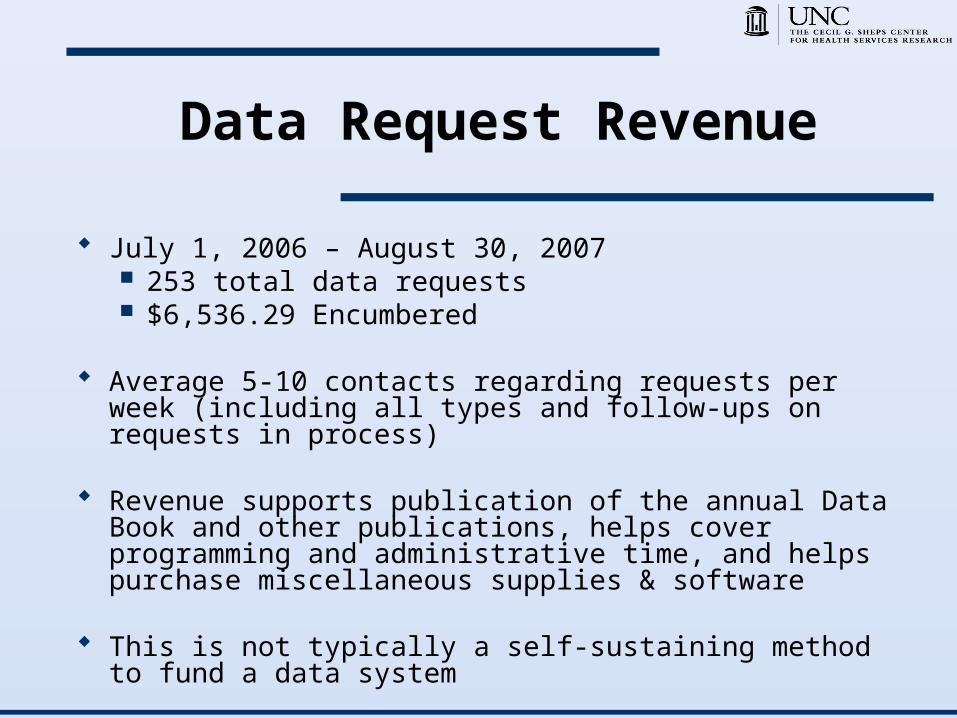
Data Request Revenue
July 1, 2006 – August 30, 2007 253 total data requests $6,536.29 Encumbered
Average 5-10 contacts regarding requests per week (including all types and follow-ups on requests in process)
Revenue supports publication of the annual Data Book and other publications, helps cover programming and administrative time, and helps purchase miscellaneous supplies & software
This is not typically a self-sustaining method to fund a data system

Data Sources
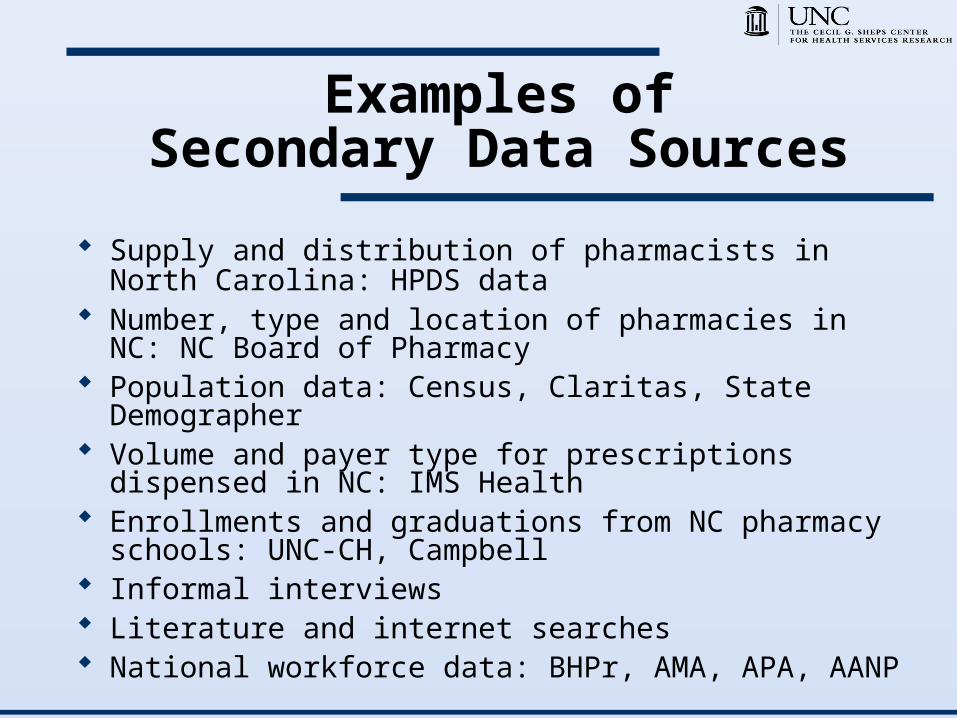
Examples ofSecondary Data Sources
Supply and distribution of pharmacists in North Carolina: HPDS data
Number, type and location of pharmacies in NC: NC Board of Pharmacy
Population data: Census, Claritas, State Demographer
Volume and payer type for prescriptions dispensed in NC: IMS Health
Enrollments and graduations from NC pharmacy schools: UNC-CH, Campbell
Informal interviews Literature and internet searches National workforce data: BHPr, AMA, APA, AANP
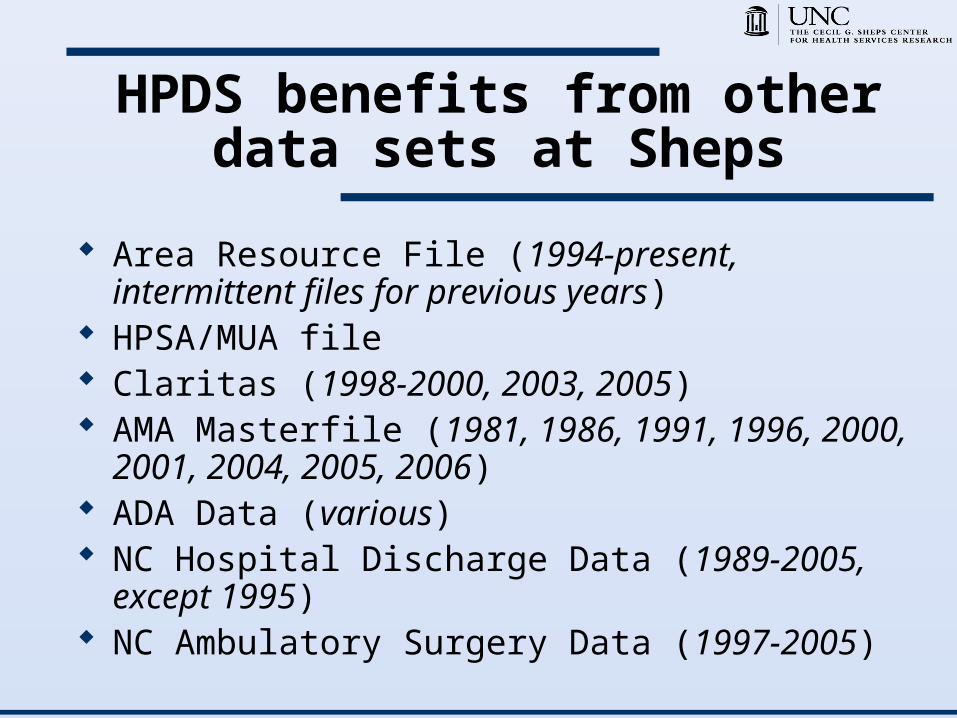
HPDS benefits from other data sets at Sheps
Area Resource File (1994-present, intermittent files for previous years)
HPSA/MUA file Claritas (1998-2000, 2003, 2005) AMA Masterfile (1981, 1986, 1991, 1996,
2000, 2001, 2004, 2005, 2006) ADA Data (various) NC Hospital Discharge Data (1989-2005,
except 1995) NC Ambulatory Surgery Data (1997-2005)

Why?Examples and Value of
Work

The Data System Can Help Answer Questions Like:
How many dentists are there in North Carolina? Where are they practicing?
Are there too few psychiatrists in the state?
Are we retaining health professionals trained in North Carolina?
Will NC’s supply of physicians keep pace with expected population growth?
Does the ethnic and racial distribution of health professionals match the population?
How well do the linguistic capabilities of practitioners match the language needs of North Carolina’s citizens?
BUT it can’t answer some types of questions for lack of
appropriate data:
When do physicians actually retire? Are fewer physicians delivering babies
because of malpractice issues? Are we facing a psychiatrist shortage
because reimbursement rates are too low? Where should we put the new (dentistry,
pharmacy, satellite medical) school?
Goal: to provide data-driven, timely and objective analyses to inform the policy debate.

The Basics: Describing the Workforce
For example… Supply of physicians is growing, but growth has
slowed Average age of physicians is increasing slightly Gender is converging slowly for new physicians Newly licensed physicians were more likely to be
female, be minority or be younger Of the physicians that left the file between 2002-
2003, 143 retired from practice and the average retirement age was 66
27% of active physicians in 2003 completed medical school in NC; 35% completed NC residencies
Makes analysis “simple”
Ongoing tracking stimulate attention and policy change Having the trend data readily available makes it
unnecessary to do complex studies The data speak for themselves, and allows the
stakeholders to feel some ownership in the data Stakeholders can “do their own analysis” by asking us
questions of the data which we can answer
Our data help people avoid doing large and complex (time-consuming) studies that cost a lot of money
In some cases, the Medical Board will include “survey” questions on their licensure and renewal forms, making it easier to collect data with broad interest
Informing Policy Makers
North Carolina General Assembly, 2003-2006 Planning for potential new schools of:
Dentistry Pharmacy Optometry
Plans for expansion of medical, dental schools
Effects of malpractice insurance rate increases
Effects of changes in license rules

Trends in the Supply of Dentists in North Carolina,
1996-2005Policy Issue : Dental access in rural NCKey Findings:NC lags behind national supplyBetween 1996-2005, 33% of counties experienced decline in dentists per 10K pop, 26 of 33 were rural countiesAging dental workforce, especially in rural counties87% of dentists are whitePolicy ResponseLegislature appropriated $89.6 million for new dental school at ECU and $96 million For expansion at UNC-CH
February 2007
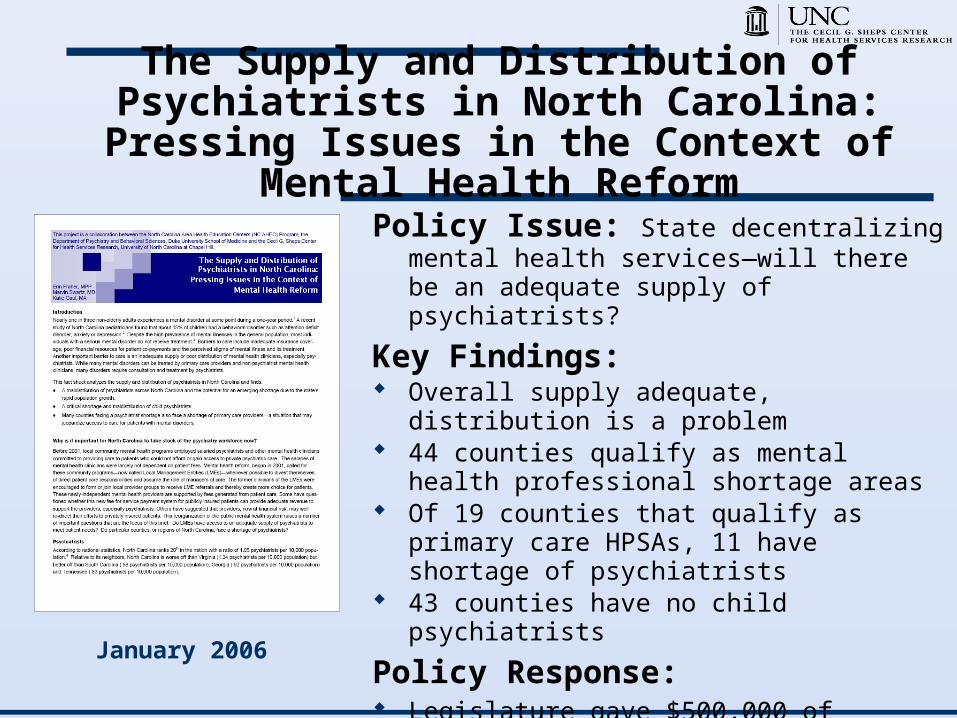
The Supply and Distribution of Psychiatrists in North Carolina:
Pressing Issues in the Context of Mental Health Reform
Policy Issue: State decentralizing mental health services—will there be an adequate supply of psychiatrists?
Key Findings: Overall supply adequate, distribution is a
problem 44 counties qualify as mental health
professional shortage areas Of 19 counties that qualify as primary
care HPSAs, 11 have shortage of psychiatrists
43 counties have no child psychiatrists
Policy Response: Legislature gave $500,000 of recurring
funding to AHEC to address maldistribution and supply. Pilot efforts focus on mid-levels, residents and tele-psychiatry, consultation models.
January 2006

Psychiatric Hospital (4)
Change in Psychiatrist FTEs per 10,000 Population(# of Counties)
50% or Greater Increase (9)1% to 49% Increase (22)1% to 49% Decrease (41)
50% to 99% Decrease (7)Lost all Psychiatrists (5)No Psychiatrists in 1999, At Least 1 in 2004 (4)No Psychiatrists in 1999 or 2004 (12)
Change in Psychiatrist Full-Time Equivalents per 10,000 PopulationNorth Carolina, 1999 to 2004
*Psychiatrists include active (or unknown activity status), instate, nonfederal, non-resident-in-training physicians who indicate a primary specialty of psychiatry,child psychiatry, psychoanalysis, psychosomatic med, addiction/chemical dependency,forensic psychiatry, or geriatric psychiatry, and secondary specialties in psychiatry, child psychiatry and forensic psychiatry.
Produced by: North Carolina Health Professions Data System and theSoutheast Regional Center for Health Workforce Studies, Cecil G. ShepsCenter for Health Services Research, University of North Carolina at Chapel Hill.
BroughtonHospital
John UmsteadHospital
CherryHospital
Dorothea DixHospital
Source: LINC, 2005; North Carolina Health Professions Data System, with data derived from the North Carolina Medical Board, 2004; NC DHHS, MHDDSAS, 2005.
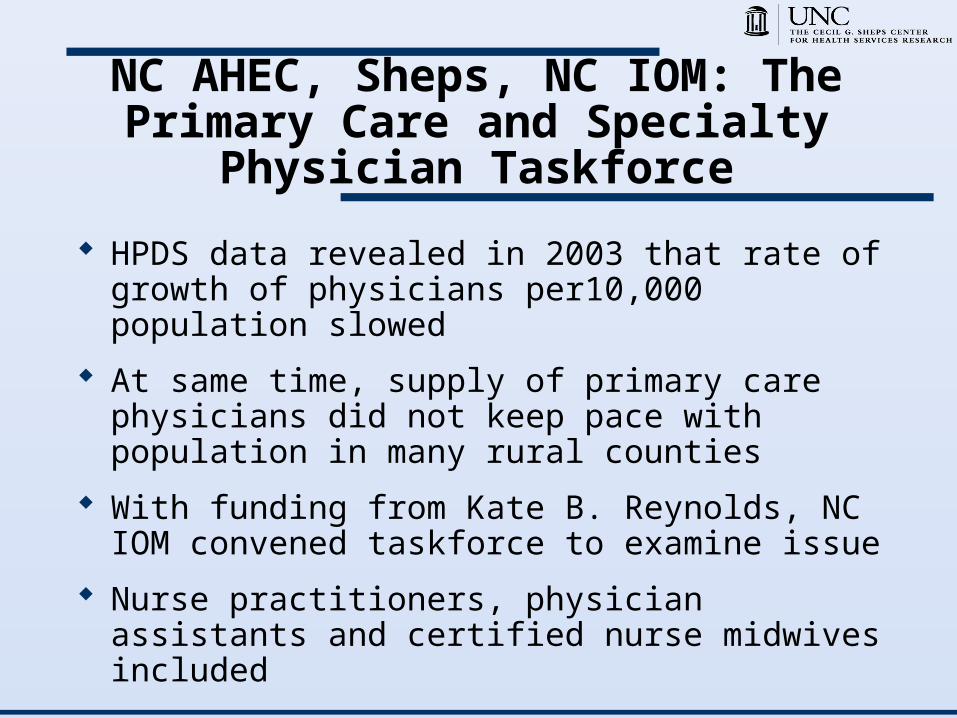
NC AHEC, Sheps, NC IOM: The Primary Care and Specialty
Physician Taskforce
HPDS data revealed in 2003 that rate of growth of physicians per10,000 population slowed
At same time, supply of primary care physicians did not keep pace with population in many rural counties
With funding from Kate B. Reynolds, NC IOM convened taskforce to examine issue
Nurse practitioners, physician assistants and certified nurse midwives included
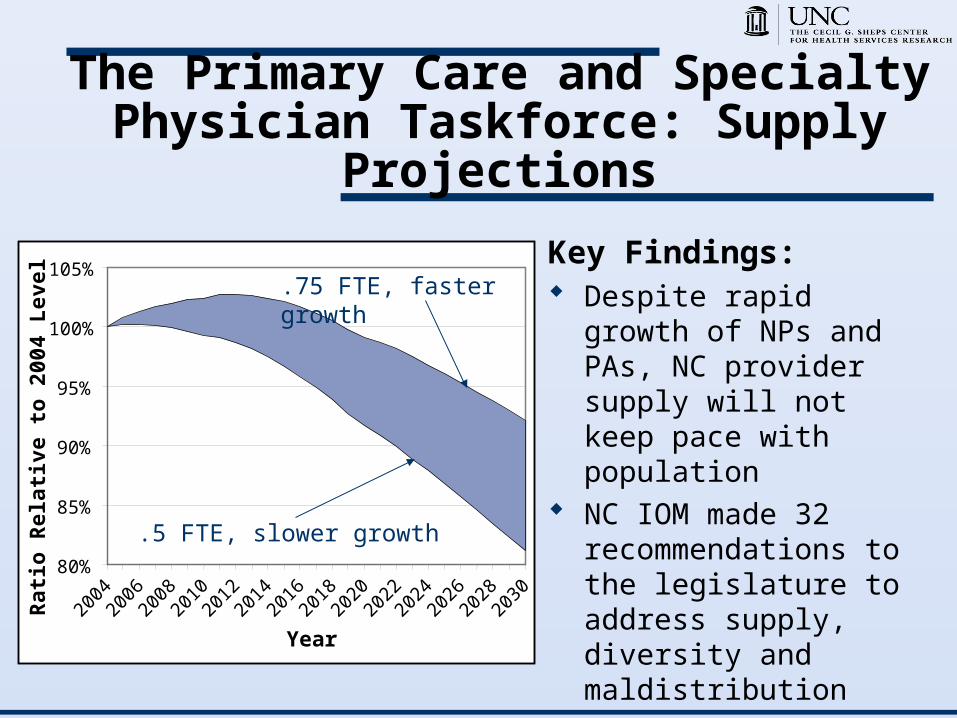
The Primary Care and Specialty Physician Taskforce: Supply
Projections
80%
85%
90%
95%
100%
105%
2004
2006
2008
2010
2012
2014
2016
2018
2020
2022
2024
2026
2028
2030
Year
Rat
io R
elat
ive
to 2
004
Lev
el
.5 FTE, slower growth
.75 FTE, faster growthKey Findings: Despite rapid growth of
NPs and PAs, NC provider supply will not keep pace with population
NC IOM made 32 recommendations to the legislature to address supply, diversity and maldistribution
Final report released June 2007; available at http://www.nciom.org


Wrapping Up
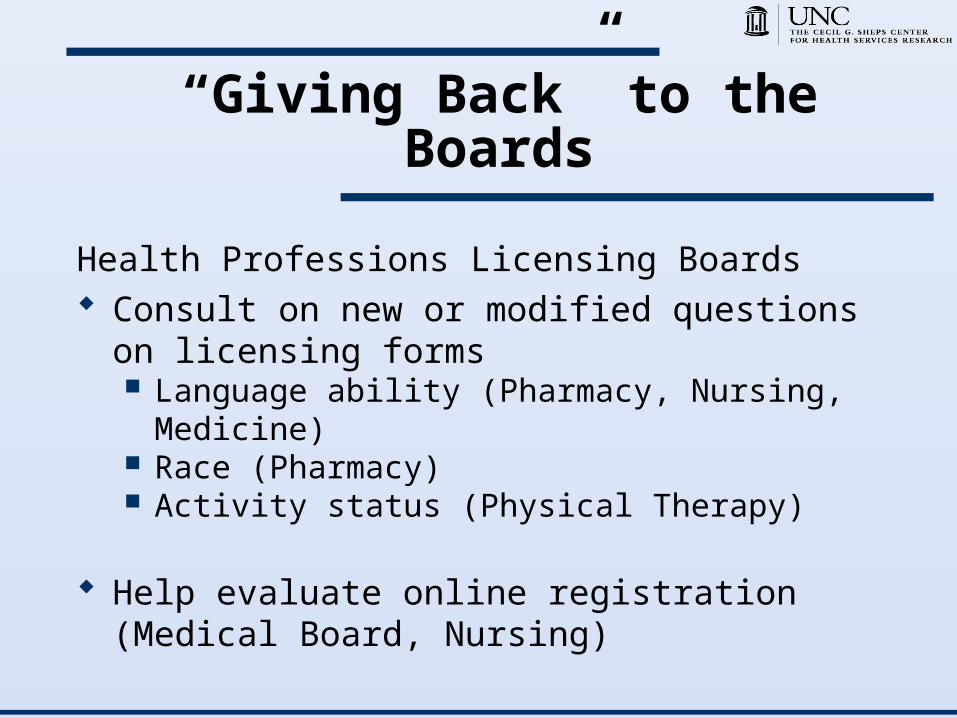
“Giving Back” to the Boards
Health Professions Licensing Boards Consult on new or modified questions on
licensing forms Language ability (Pharmacy, Nursing,
Medicine) Race (Pharmacy) Activity status (Physical Therapy)
Help evaluate online registration (Medical Board, Nursing)

Lessons Learned
Data driven workforce analyses necessary to: Monitor longitudinal trends in supply and
distribution—establish benchmarks. Are we worse or better off?
Identify emerging workforce issues Challenge anecdotal evidence Be perceived as objective in politically
charged policy debates Justify funding requests
Tackle discrete policy-relevant and manageable size projects
Disseminate results in short policy briefs with lots of pictures (maps are good…)

Health Workforce Planning: The Future
Workforce issues are not going away
Federal workforce research funds have been cut and there are limited national data
Responsibility falls on individuals states—most policy levers are at state-level

Moving Forward
We (HPDS) are starting to shift from “classic” workforce studies (assign physician to place, counts by county, look at distribution, etc.) to more in-depth analyses Involves merging administrative and other
databases onto our licensure files to capture more detailed information
Dr. John Doe is not just a surgeon at ABC Hospital; Dr. Doe does this many of these particular procedures on these types of patients per year, and has shifted from doing general surgery to more specialized surgical procedures
Recommendations
Start small and make a big impact
Expand later
Get a good team together - people with different skill sets who work well together and can learn from each other
What you’re looking to do will inform state policy = look for some state money to fund this (don’t depend solely on federal funding sources)
Stay objective and maintain credibility

Contact Us
Cecil G. Sheps Center for Health Services ResearchUniversity of North Carolina at Chapel Hill725 Martin Luther King Jr. Blvd, CB 7590
Chapel Hill, NC 27599HPDS Main Line: (919) 966-7112, [email protected]
(919) 966-5541
Erin Fraher, Director
[email protected](919) 966-5012
Katie [email protected](919) 966-6529
Jessica Carpenter
[email protected](919) 843-3402

HPDS Websitehttp://www.shepscenter.unc.edu/h
p County- and region-level data Historical health professions
trends (1979-2006) Practitioner per 10,000
population ratios and maps Data definitions HPDS publications, press
releases Powerpoint presentations Data request instructions General information about the
HPDS; frequently asked questions
Sign-up for HPDS listserv Links to NC licensing boards,
other national and state health workforce sites, other useful statistics sources

Extra Slides

Overview
The North Carolina Health Professions Data System
Background Organizational Issues Data Sources Special Reports and Projects Allied Health WHY? Examples and Value of Work Wrapping Up
Contact Information

The Cecil G. Sheps Centerfor Health Services
Research Founded in 1968; is one of the oldest and largest
health services research centers in the nation
Is an organizational unit of the University of North Carolina at Chapel Hill in the Health Affairs Division
$14 million annual budget (2006)
Employs or houses 170 staff including senior faculty, research fellows, analytic staff, fellows and graduate students
Over 130 research fellows based in other academic departments, state and federal government, private industry and other countries are affiliated with the Sheps Center

Data Request Process
Receive requests by Email Fax Phone
Informational Requests Non-Sheps Data – refer to appropriate source (if
possible) HPDS Data request procedures HPDS General Information
Requests tracked in contact database (MS Access) Requestor’s name & contact information Detailed description of request Output type Due date – date sent

Data Request Process
Two types of data requests:1. Off the shelf data and publications
Aggregate statistics found on HPDS website or Data Book (e.g. How many RNs are active in Durham County?)
Requests for Publications (Data Book, fact sheets)
2. Requests requiring data processing Aggregate statistics not found in HPDS publications (e.g.
How many family practice physicians in the state provide obstetric deliveries?)
Individual level data Mailing lists (e.g. Regional MS Society sending educational
fliers to local physicians; Companies advertising CE programs to psychologists)
Analysis files for research
Permission sought from board to release individual level data

Data Requests Requiring Processing
Requests tracked in contact database (MS Access) Requestor’s name & contact information Detailed description of request Output type Due date – date sent
Fees Health Professions Data Book
$20.00 per book, plus postage Mailing lists (name, address, county, specialty)
$4.50 per 100 names for electronic files $100 minimum, non-profit organizations; $200 minimum, for-profit organizations $600 maximum
Analysis files (including the above plus additional demographic and practice characteristics)
$7.00 per 100 names for electronic files $200 minimum, non-profit organizations; $300 minimum, for-profit organizations $700 maximum, non-profit organizations; $800 maximum, for-profit
organizations Requests requiring programming
$50.00 per hour for substantial requests (else free)Discounts given for AHECs, students, UNC System, North Carolina State Agencies, and at the Director’s discretion
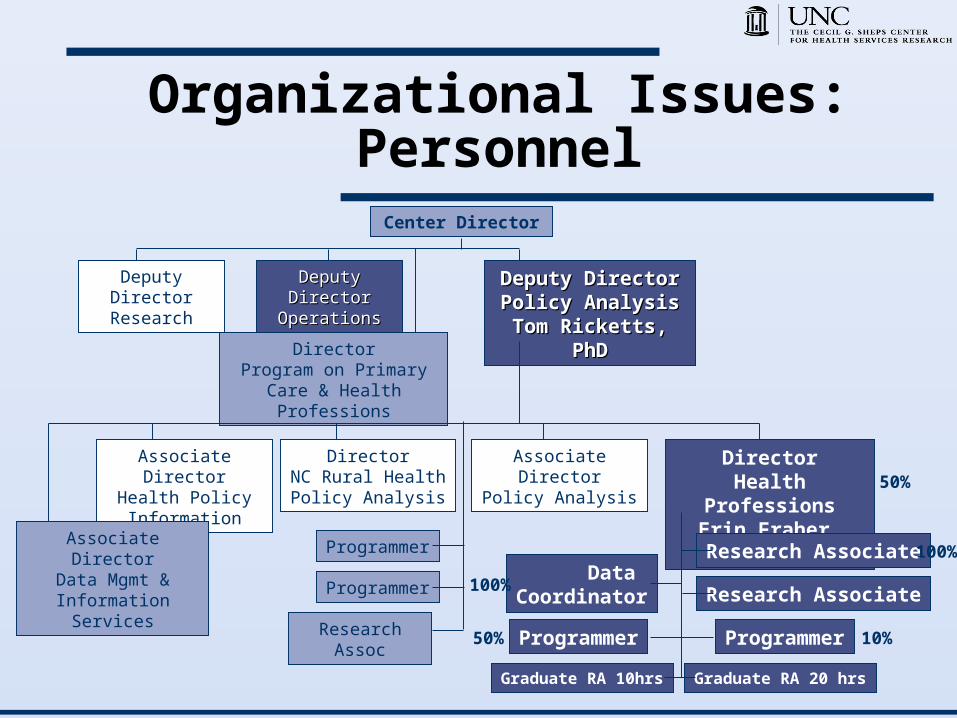
Organizational Issues: Personnel
Center Director
Deputy DirectorResearch
Deputy DirectorDeputy DirectorOperationsOperations
Deputy DirectorDeputy DirectorPolicy AnalysisPolicy AnalysisTom Ricketts, Tom Ricketts,
PhDPhDDirectorProgram on Primary Care &
Health Professions
Associate DirectorHealth Policy Information
DirectorNC Rural Health Policy Analysis
Associate DirectorPolicy Analysis
DirectorHealth
ProfessionsErin Fraher,
MPP
50%
Associate DirectorData Mgmt &
Information Services
Programmer
Programmer
Research Assoc
Research Associate100%Data
Coordinator100%
Programmer Programmer50% 10%
Graduate RA 10hrs Graduate RA 20 hrs
Research Associate

HPDS Benefits from Sheps Center Infrastructure
Administrative Support
Programming
Information and Library Services
Media and Communications
Business and Financial Support
Computer and Data
Management Support
Executive
Other Research
AreasHealth ProfessionsData System

Infrastructure: Cartography and Geographic Analysis
Capabilities Maps with HPDS data are prepared using cartographic
software that provides a Geographic Information System (GIS) interface such as ESRI’s Arc Suite (ArcView®, ArcInfo®, ArcGIS®, ArcIMS®), and MapInfo®
MapInfo / ArcView - Data System has benefited from availability of cartographic software and expertise through the NC Rural Health Policy Research and Analysis Program.
There are three licenses for MapInfo in the Center. The Center may shift over to ArcView because UNC has
an unlimited number of licenses. Rural program buys Claritas products for ZIP to county
coding and address matching. Other GIS products are used as needed
Infrastructure: Library Services
Sheps employs two full-time librarians who oversee the Center’s library holdings
Librarians conduct customized bibliographic research from electronic sources for researchers
Librarians manage a Rural Policy collection, which includes over 11,000 items related to rural health, primary care, health policy dated back to 1978
Rural policy collection regularly deposits and cross-references items from the Federal Office of Rural Health Policy (OFRHP), General Accounting Office (GAO), the Office of Management and Budget (OMB), the Congressional Budgeting Office (CBO), Medicare Advisory Payment Commission (MedPAC) and the Bureau of Health Professions (BHPr)
Infrastructure: Dissemination
Center normally employs two full-time Information and Communication Specialists, who assist in the development written and published material; these positions are currently vacant
Provide copy editing, prepare fact sheets, and respond to short term queries for information
Center employs two full-time web masters with distributed responsibilities
Press releases and Press events are managed in collaboration with the UNC Office of Public Affairs

Electronic Dissemination
Email listserv Updates to website New publications and news items Sent to key policy makers, educators,
researchers, employers, etc. Sign-up available on the HPDS website 2,298 people on the list
HPDS: 3 Main Product Lines
Maintenance of Licensure Data Files for HPDS
This function is the backbone of our work. It takes substantial time and staff effort to collect, clean, edit, and disseminate licensure data. Sustaining & maintaining this infrastructure is challenging.
Special Projects:Service to the State and the
InstitutionThe HPDS often undertakes special research projects at the request of the NC AHEC, UNC Board of Governors (respond to legislation, make presentations), licensure boards etc. This service has increased the visibility of the Sheps Center to important local sponsors and policymakers.
Allied Health Workforce Studies
Funded by the Duke Endowment and the NC AHEC, research has focused on quantifying the supply of, and demand for, allied health workers. Findings highlighting the growth of allied health employment have gained the attention of policy makers. Staff in the Governor’s office, the legislature, and other state agencies are working to develop innovative ways to transition unemployed individuals into allied health jobs.
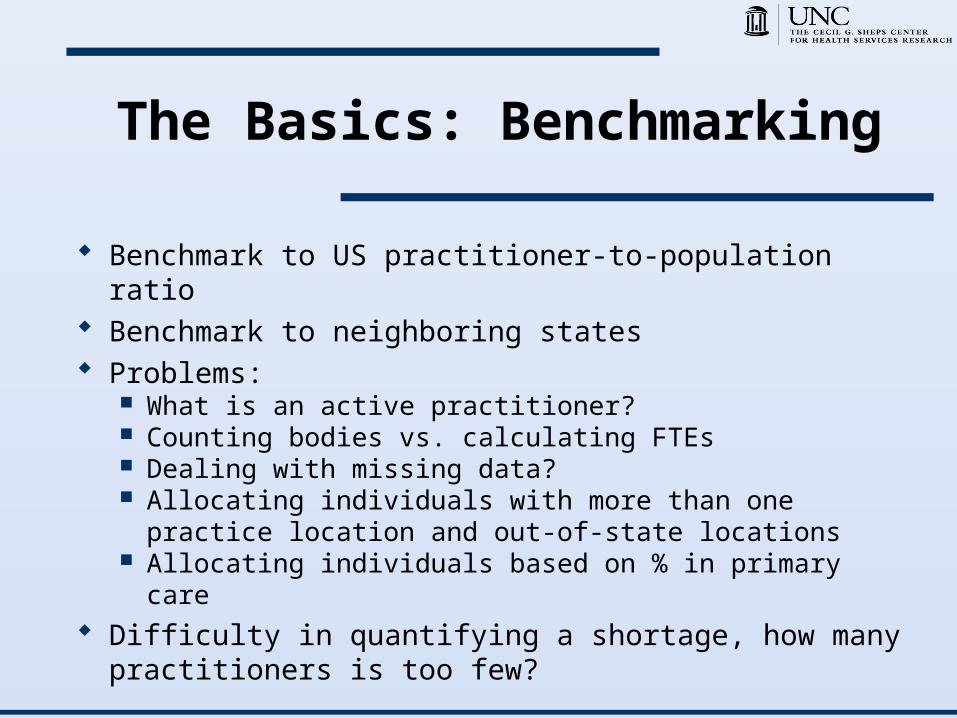
The Basics: Benchmarking
Benchmark to US practitioner-to-population ratio Benchmark to neighboring states Problems:
What is an active practitioner? Counting bodies vs. calculating FTEs Dealing with missing data? Allocating individuals with more than one practice
location and out-of-state locations Allocating individuals based on % in primary care
Difficulty in quantifying a shortage, how many practitioners is too few?
Health Professions Data System Recent Products
Special reports Trends in Licensed Health Professions in North Carolina,
1979-2005
Fact Sheets Physician Medical and Residency Training Fact Sheet,
2005, 2003, 2001,1999,1997,1995 Allied Health Job Vacancy Tracking Reports (Apr. 2007,
Aug. 2006, Apr. 2005) Trends in the Supply of Dentists in NC, 1996-2005 The Supply and Distribution of Psychiatrists in North
Carolina: Pressing Issues in the Context of Mental Health Reform
Trends in the Supply of NPs and PAs in NC, 1990-2001

Trends in Physicians Delivering Babies
2000 2001 2002 2003 2004
OB/GYNs 919 937 954 960 981
OB/GYNs Delivering
651 701 742 750 748
% OBs 70.8% 74.8% 77.8% 78.1% 76.2%
FPs 2,173 2,224 2,293 2,327 2,040
FPs Delivering 212 227 228 232 205
% FPs 9.8% 10.2% 9.9% 9.9% 10%
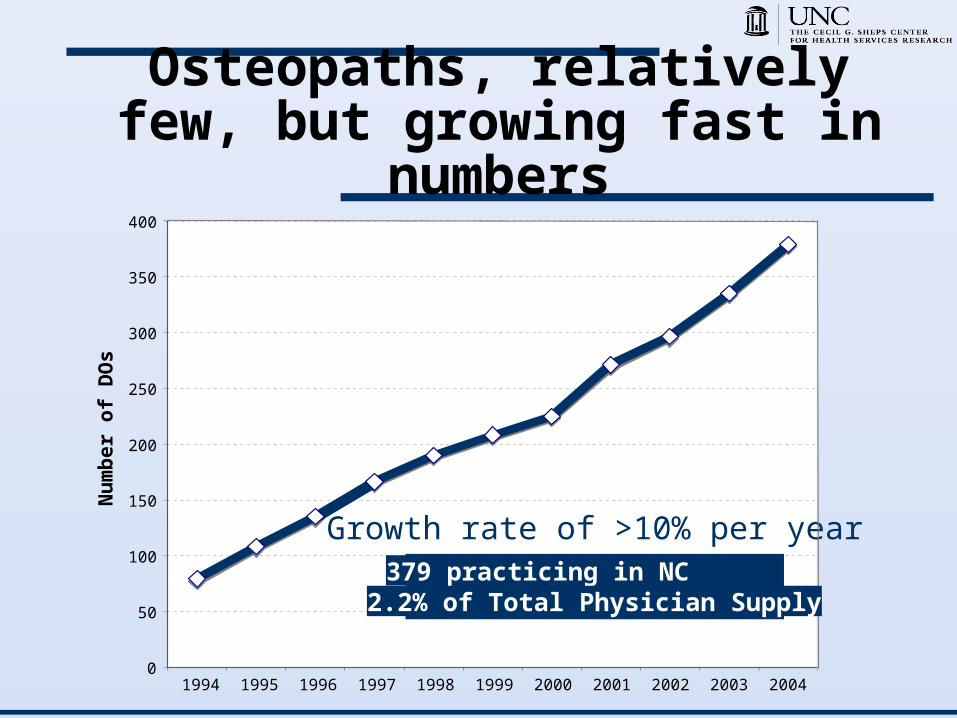
Osteopaths, relatively few, but growing fast in
numbers
Growth rate of >10% per year
0
50
100
150
200
250
300
350
400
1994 1995 1996 1997 1998 1999 2000 2001 2002 2003 2004
379 practicing in NC2.2% of Total Physician Supply
Nu
mb
er
of
DO
s

Evaluation
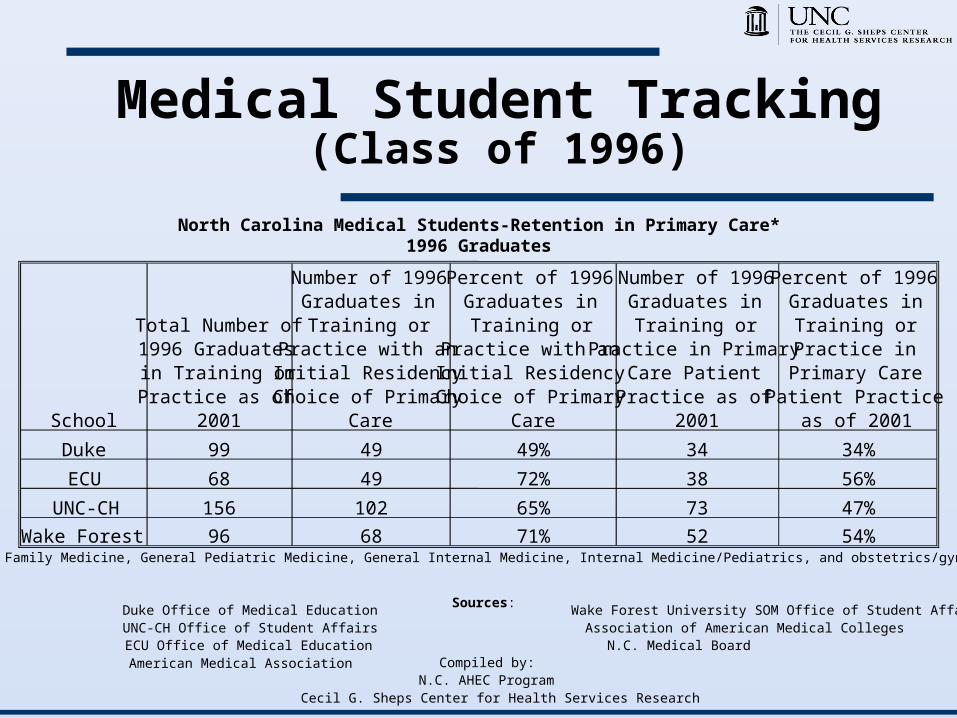
Medical Student Tracking(Class of 1996)
North Carolina Medical Students-Retention in Primary Care*1996 Graduates
*Primary Care = Family Medicine, General Pediatric Medicine, General Internal Medicine, Internal Medicine/Pediatrics, and obstetrics/gynecology.
Sources: Wake Forest University SOM Office of Student AffairsAssociation of American Medical Colleges
N.C. Medical Board
Duke Office of Medical EducationUNC-CH Office of Student AffairsECU Office of Medical EducationAmerican Medical Association Compiled by:
N.C. AHEC ProgramCecil G. Sheps Center for Health Services Research
School
Total Number of 1996 Graduates
in Training or Practice as of
2001
Number of 1996 Graduates in Training or
Practice with an Initial Residency
Choice of Primary Care
Percent of 1996 Graduates in Training or
Practice with an Initial Residency
Choice of Primary Care
Number of 1996 Graduates in Training or
Practice in Primary Care Patient
Practice as of 2001
Percent of 1996 Graduates in Training or Practice in
Primary Care Patient Practice
as of 2001
Duke 99 49 49% 34 34%
ECU 68 49 72% 38 56%
UNC-CH 156 102 65% 73 47%
Wake Forest 96 68 71% 52 54%

Medical Student Tracking(Class of 2002)
*Primary Care = Family Medicine, General Pediatric Medicine, General Internal Medicine, Internal Medicine/Pediatrics, and obstetrics/gynecology.
Sources: Wake Forest University SOM Office of Student AffairsAssociation of American Medical Colleges
N.C. Medical Board
Duke Office of Medical EducationUNC-CH Office of Student AffairsECU Office of Medical EducationAmerican Medical Association Compiled by:
N.C. AHEC ProgramCecil G. Sheps Center for Health Services Research
SchoolTotal Number of 2002 Graduates
Number of 2002 Graduates not
Entering Residency
Training
Number of 2002 Graduates Entering Residency Training
Number of 2002 Graduates Entering
Residency Training Who
Chose A Primary Care Residency
Percent of 2002 Graduates Entering
Residency Training Who
Chose A Primary Care Residency
Duke 88 0 88 40 45%
ECU 71 0 71 44 62%
UNC-CH 151 6 145 76 52%
Wake Forest 96 2 94 46 49%
North Carolina Medical Students-Initial Choice of Primary Care*2002 Graduates
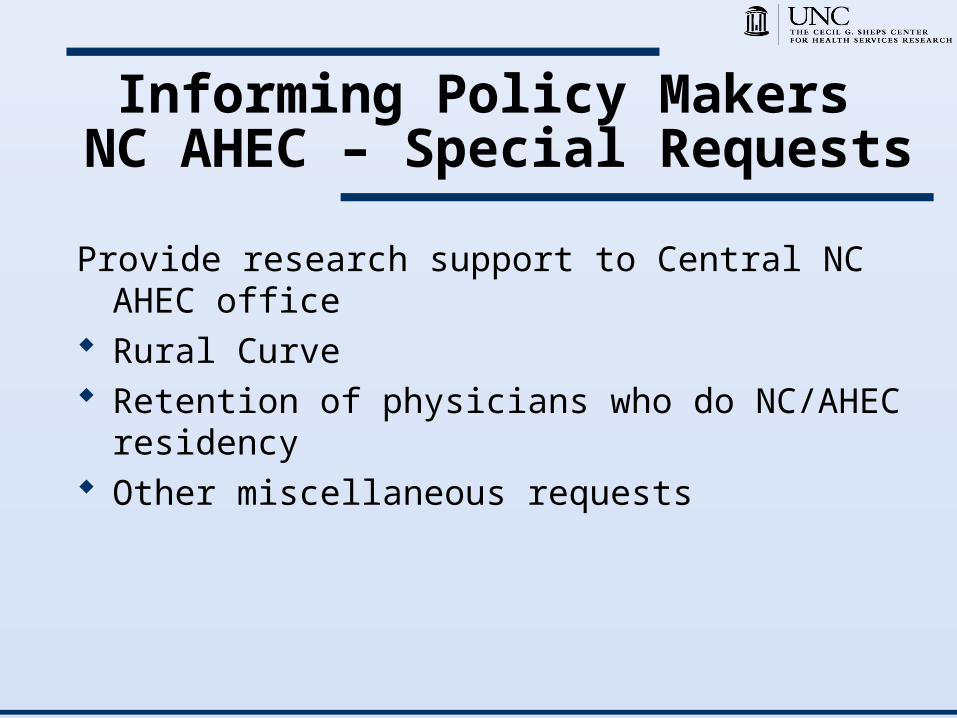
Informing Policy Makers NC AHEC – Special Requests
Provide research support to Central NC AHEC office
Rural Curve Retention of physicians who do NC/AHEC
residency Other miscellaneous requests

Allied Health Studies

HPDS: 3 Main Product Lines
Maintenance of Licensure Data Files for HPDS
This function is the backbone of our work. It takes substantial time and staff effort to collect, clean, edit, and disseminate licensure data. Sustaining & maintaining this infrastructure is challenging.
Special Projects:Service to the State and the
InstitutionThe HPDS often undertakes special research projects at the request of the NC AHEC, UNC Board of Governors (respond to legislation, make presentations), licensure boards etc. This service has increased the visibility of the Sheps Center to important local sponsors and policymakers.
Allied Health Workforce Studies
Funded by the Duke Endowment and the NC AHEC, research has focused on quantifying the supply of, and demand for, allied health workers. Findings highlighting the growth of allied health employment have gained the attention of policy makers. Staff in the Governor’s office, the legislature, and other state agencies are working to develop innovative ways to transition unemployed individuals into allied health jobs.
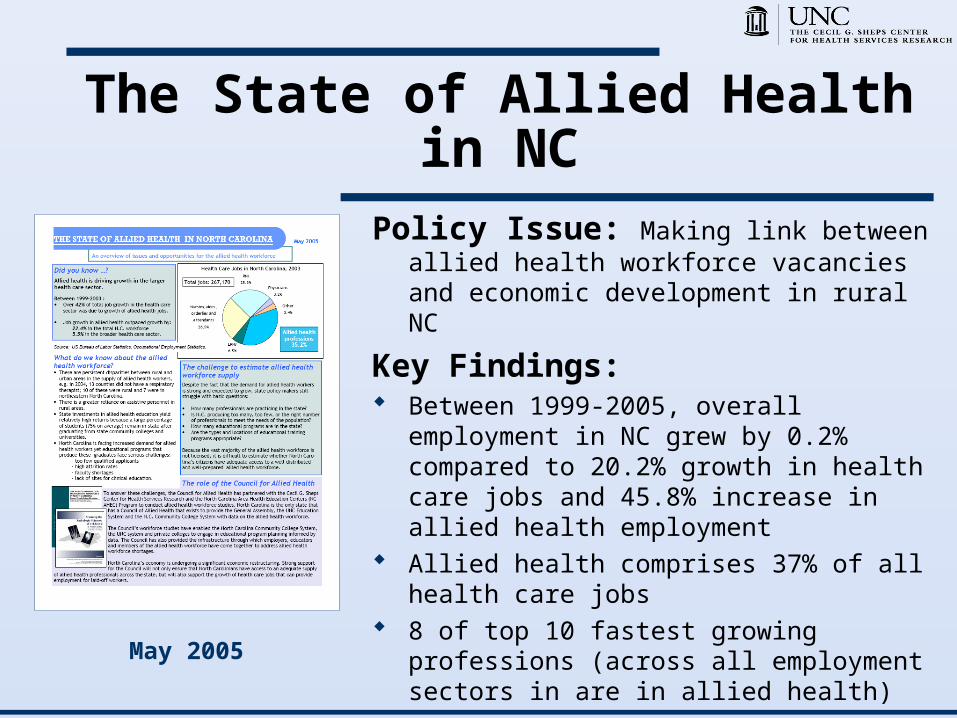
The State of Allied Health in NC
Policy Issue: Making link between allied health workforce vacancies and economic development in rural NC
Key Findings: Between 1999-2005, overall
employment in NC grew by 0.2% compared to 20.2% growth in health care jobs and 45.8% increase in allied health employment
Allied health comprises 37% of all health care jobs
8 of top 10 fastest growing professions (across all employment sectors in are in allied health)
Policy Response: PendingWe have requested funding for continued
monitoring of allied health workforce
May 2005

Manufacturing and Health Care & Social Assistance Employment,
NC, 1995-2005
0
100
200
300
400
500
600
700
800
900
Em
plo
ym
en
t (t
hou
san
ds)
568,835
822, 995
491,637
332,446
1995 1996 1997 1998 1999 2000 2001 2002 2003 2004 2005
Year
Manufacturing
Health Care & Social Assistance
Source: North Carolina Employment Security Commission, 2006.

Healthcare and Allied Health Jobs Grew,
Overall Employment Remained Stagnant
Source: Bureau of Labor Statistics. Occupational Employment Statistics. State Cross-Industry Estimates: 1999-2005. URL: http://www.bls.gov/oes/. Accessed 06/28/2006.
1999 2005% Growth
(1999-2005)
Total N.C. Employme
nt3,801,670 3,809,690 0.2%
Healthcare Jobs
251,550 302,270 20.2%
Allied Health Jobs
76,590 111,630 45.8%
Total State, Healthcare and Allied Health Employment, North Carolina, 1999-2005
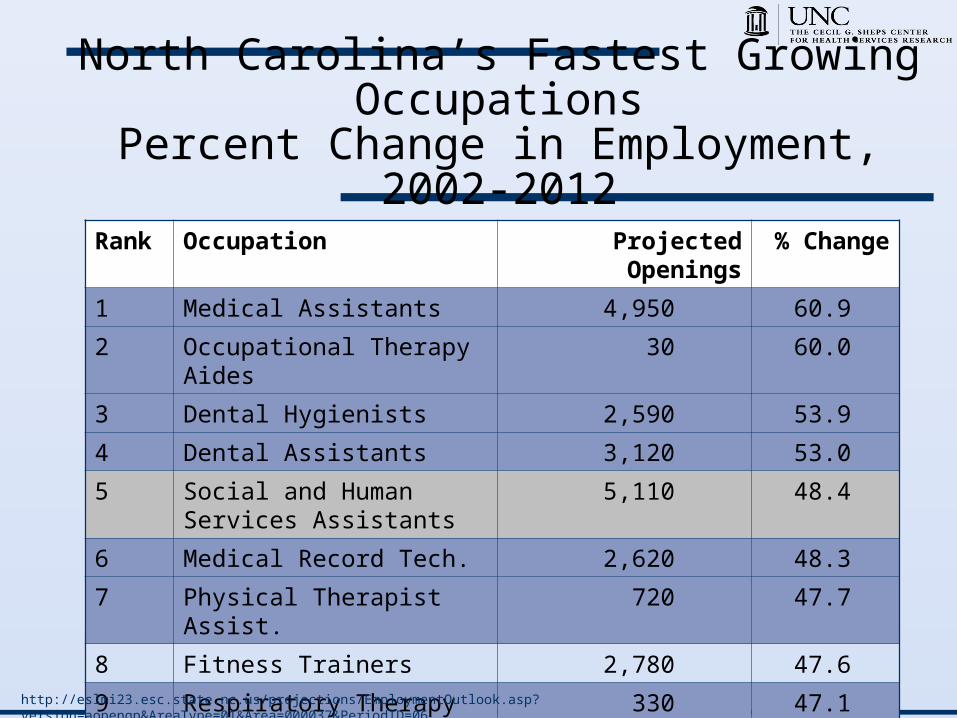
North Carolina’s Fastest Growing Occupations
Percent Change in Employment, 2002-2012
Rank Occupation Projected Openings
% Change
1 Medical Assistants 4,950 60.9
2 Occupational Therapy Aides
30 60.0
3 Dental Hygienists 2,590 53.9
4 Dental Assistants 3,120 53.0
5 Social and Human Services Assistants
5,110 48.4
6 Medical Record Tech. 2,620 48.3
7 Physical Therapist Assist. 720 47.7
8 Fitness Trainers 2,780 47.6
9 Respiratory Therapy Tech.
330 47.1
10 Respiratory Therapists 1,170 46.8
http://eslmi23.esc.state.nc.us/projections/EmploymentOutlook.asp?version=aopengp&AreaType=01&Area=000037&PeriodID=06

Health Care Jobs in North Carolina, 2005
Other, 3%Physicians, 5%
LPNs, 5%
RNs, 24%
Nurse aides, orderlies and attendants, 26%
Allied Health Professions,
37%
Note: "Other healthcare occupations" includes: chiropractors, dentists, optometrists, and pharmacists.Source: U.S. Bureau of Labor Statistics, Occupational Employment Statistics (2005). URL: http://www.bls.gov/oes/.
Total Health
Care Jobs =
302,270

Job Vacancy Tracking ReportsPurpose: Estimate workforce
demand for selected allied health professions
Method: Monitor weekly job listings in newspaper and online sources
Data: Latest data collected for twelve professions during 10 week period (September 24-November 26, 2006)
Results: Number of vacancies Distribution of vacancies by region
and profession Types of employers advertising
vacancies
April 2007August 2006
April 2005

Medical Assistants Employed in
North Carolina, 2002-2006
Source: North Carolina Health Professions Data System with data from the Employment Security Commission
6,6607,260
8,120
9,950
8,880
0
2,000
4,000
6,000
8,000
10,000
12,000
2002 2003 2004 2005 2006
Year
# o
f m
ed
ica
l as
sis
tan
ts
Medical assistants are growing at nearly double the projected growth rate

Licensure File Creation and Maintenance
Files are received annually from Boards, effective Oct. 31
Applications analyst programmers clean and edit files
Compare new files to previous year to look for changes in variables
Code individuals to counties based on ZIP code data
There are checks in place to flag inconsistencies which we then investigate, but otherwise we do not verify the accuracy of each record
Generate tables of summary statistics for review by Data Book Coordinator

Licensure File Creation and Maintenance (continued)
File audit Aggregated totals by variable are compared to
previous years by state and county Programmers scrutinize files where strange
patterns are detected Final review by HPDS staff and approval for
release Feedback to Boards
Tables of aggregate statistics by geographic region are returned to boards for their reference
HPDS sends feedback to boards on potential data collection issues, trends in the data

Licensure File Creationand Maintenance
Compare variablesreceived to previous
year’s variables
Generate tablesof summary stats
for review
Files receivedfrom Boards,
effective Oct. 31
Applications analystprogrammers
clean and edit files
Code individualsto county based
on ZIP code
File Audit:compare, investigate
Final review,approval for release
Feedback toBoards
Release Data Book,Post data to web The entire process The entire process
takes nearly a year takes nearly a year from start to finishfrom start to finish
OctoberOctober
AugustAugust


![01 asterix the gaul [1959]](https://cdn.vdocuments.us/doc/165x107/55643b47d8b42ad3308b50c7/01-asterix-the-gaul-1959.jpg)