
The New Margin Playbook Maximizing Operating Income in an Era of
Decelerating Reimbursement

©2015 The Advisory Board Company • advisory.com
2
Ongoing Expense Reduction Expected to Be Challenging
Source: Moody’s Investors Service, “Revenue Growth and Cash Flow
Margins Hit All-Time Lows in 2013 US Not-for-Profit Hospital Medians ,”
August 2014; Health Care Advisory Board interviews and analysis.
Revenue Growth Barely Exceeded Cost in 2014
6.5%
4.0%
5.4%
5.1%
3.9%
4.7%
5.7%
4.0% 5.0%
5.5%
4.3% 4.6%
2009 2010 2011 2012 2013 2014
Revenue Growth Expense Growth
Revenue and Expense Growth Rates for Non-Profit Hospitals
2009-2014 Medians, n=444

©2015 The Advisory Board Company • advisory.com
3
Prioritize Performance Improvement Opportunities
Use Customized Data to Develop a Margin Protection Plan
Executive Management
Workshop Our presentation of “The
New Margin Playbook”
Customized Data Diagnostic Review key margin performance
indicators to identify strengths
and diagnose areas for
improvement
Tailored Action Plan Access a full complement of
Advisory Board best practices
and resources
The Margin Improvement Intensive
Hospital Benchmark Generator A One-Stop Application For Hospital
Performance Benchmarking
Source: Health Care Advisory Board interviews and analysis.
Customized Access Portal Instant Access to Critical Organization-
Specific Analytics

©2015 The Advisory Board Company • advisory.com
4
Source: Health Care Advisory Board interviews and analysis.
The New Margin Playbook
Containing Labor and Benefit
Cost Growth
1. Instill Greater Employee
Accountability for Costs
2. Maximize Top-of-License Care
Curtailing Supply Expenses
3. Enable Greater Self-Contracting
4. Leverage Technology to Enable
Reverse Auctions
Minimizing Unnecessary and
Unreimbursed Utilization
5. Prioritize Sources of Clinical Care
Variation
6. Reinforce Patient Intake Protocols
7. Standardize Care Across Clinics
and Sites of Care
Leveraging Systemness to Excise
Structural Costs
8. Optimize Shared Administrative
Services
9. Rightsize Services and
Sites of Care
1 Containing Cost
Growth
Minimizing Denials and
Underpayments
10. Accelerate the Transition to
ICD-10
11. Implement Best-in-Class CDI
Programs
Elevating Performance on
Mandates and Value-Based
Reimbursement
12. Prioritize Risks from VBP and
Other Penalties
Minimizing Avoidable
Uncompensated Care
13. Elevate Point-of-Service
Collections
Increasing Returns from
Philanthropy
14. Develop a Major-Gifts
Philanthropy Program
15. Engage Physicians in Donor
Development
2 Maximizing Revenue
Capture
Becoming the Procedural
“DRG Factory”
16. Increase Transparency of
Referral Patterns
17. Engage Physicians to
Strengthen Referral Network
Growing through Acquisitions
and Partnerships
18. Embrace Partnerships that
Expand Competencies
Pursuing Risk-Based
Reimbursement
19. Build the Clinical Model for
Population Health
20. Choose the Right Business
Model for Risk
Winning Share in a Retail Market
for Health Care
21. Capture New Patients with
Convenient Offerings
22. Expand Share with Tailored
Service
3 Capturing New
Sources of Growth

©2015 The Advisory Board Company • advisory.com
5
2
3
1
Road Map
Containing Cost Growth
Maximizing Revenue Capture
Capturing New Sources of Growth

©2015 The Advisory Board Company • advisory.com
6
Source: Health Care Advisory Board interviews and analysis.
Instill Greater Employee Accountability for Costs
Case in Brief: Covenant Health
• Three-hospital health system based in
Lubbock, Texas
• Already at risk for own employees
• Using employees’ health plan benefit design
to encourage appropriate utilization of primary
care, generic prescriptions to reduce costs
Covenant Health’s
Benefit Pricing Strategy
ED visits
Urgent care visits
Primary care visits (free)
Generic prescriptions
Incre
asin
g
Decre
asin
g
Service Price
Containing Labor and Benefit Cost Growth
Change Price of Services, Products
Limit Access to Certain Services, Products
1
2
Remove certain brand-name
pharmaceuticals from formulary
Require prior authorizations for
imaging services
Raise emergency department copays
Tier pharmaceutical price structure
Differentiate network prices
Reduce price of preventive services
Strategies to Consider:
Strategies to Consider:
Benefit Design Levers
to Inflect Utilization Patterns

©2015 The Advisory Board Company • advisory.com
7
Using Team-Based Care, Technology to Extend Clinical Reach
Source: Health Care Advisory Board interviews and analysis
Maximize Top-of-License Care
Element 1:
Ensure Proper Task
Allocation
Three Elements to Enable Top-of-License Care Delivery
Element 2:
Broaden Range of
Clinical Decision-Makers
Element 3:
Leverage Technology
to Extend Care Team
Remote
monitoring
Robotics
Video
consults
Pharmacist RN New RN/LPN
Patients
Physician

©2015 The Advisory Board Company • advisory.com
8
Balancing GPO, Self-Contracting Advantages
Curtailing Supply Expenses
Source: Health Care Advisory Board interviews and analysis.
Enable Greater Self-Contracting
Commodity
Value
Directly sourced
today
Currently left
to GPO
GPO line
today
Available
value through
local sourcing
Available
value through
GPO
sourcing
PPI
Latent
value
Category Type Warrants direct
approach
Warrants aggregated
approach
Cross-over
point, direct no
longer makes
sense
Self-Contracting Opportunity Analysis

©2015 The Advisory Board Company • advisory.com
9
Normalizing Supplier Offers to Remove Price Bias
Source. Health Care Advisory Board interviews and analysis.
Leverage Technology to Enable Reverse Auctions
Supplier bids required
to offer specific service
terms for consideration
Physicians,
suppliers can
compare blinded
bids in real-time
Physicians compare
normalized offers
and determine final
purchase
• Incorporates specific physician
preferences
• Bids often bundle items together
for portfolio-based approach
• Engages physicians
throughout entire
bidding process
• Fosters competition
among suppliers
• Factors in changes to procedure
process/time, personnel requirements
• Accounts for variation in product quality,
supplemental supplies required
Final bids normalized around
physician-defined parameters
Supplier Bidding Process Physician-Led Contract Evaluation 17%
Reduction in
orthopedic supply
expenses
• Provides equal, non-biased
comparisons across products
• Enables decisions based on
total value of offer, not item-by-
item price
Enabling Physicians to Make Informed Decisions Around Total Value

©2015 The Advisory Board Company • advisory.com
10
Running Toward Zero-Defect
Minimizing Unnecessary and Unreimbursed Utilization
Source: Health Care Advisory Board interviews and analysis.
Prioritize Sources of Clinical Care Variation
• Create matrixed
accountability structure
• Embed change as part of
routine operations
• Foster transparency within
and across departments,
services, and sites
• Engage care teams in
structured workflow
redesign
• Foster front-line team
implementation
through competition
• Gain access to
comprehensive, real-
time performance data
• Identify key variation
opportunities with
multidisciplinary team
• Drive practice patterns
with peer-to-peer
clinician meetings
• Enable compliance with
advanced technology
• Promote adherence
through expert support
and surveillance
1 2 3 4
Advanced
Enterprise
Analytics
Reengineered
Workflow
Design
Evidence-Driven
Clinical
Compliance
Scalable
Standardization
Structure
Four Components of Reducing Clinical Variation

©2015 The Advisory Board Company • advisory.com
11
Early Sepsis Detection: Good for Patients, Good for Efficiency
Reinforce Patient Intake Protocols
1.08
0.8
July 2009 May 2011
25% reduction
in risk-adjusted
LOS for sepsis
35.7
119.4
July 2009 May 2011
Sepsis Diagnoses per 1,000 Admissions
Sepsis Mortality Rate
24%
10%
2007 2011
Source: Whippy A, Skeath M, “Kaiser Permanente’s Performance Improvement System, Part 3: Multisite Improvements in
Care for Patients with Sepsis,” The Joint Commission Journal on Quality and Patient Safety, 37, no. 11; Crawford et al.,
“Kaiser Permanente N. California Sepsis Mortality Reduction Initiative,” Crit. Care, 16, Supplement 3, (2012): 12; Physician
Executive Council, 10 Imperatives for Reducing Sepsis Mortality, Washington, DC; The Advisory Board Company, 2013.
Early Identification in ED
Better Outcomes Faster Discharge
Observed/Expected LOS
Kaiser’s ED Sepsis Screening Tool

©2015 The Advisory Board Company • advisory.com
12
Standardize Care Across Clinics and Sites of Care
Immediate Behavior Change from Few
• Reduce outlier cases by targeting smaller
number of physicians with practice
patterns that fall outside facility norm
• Provides faster impact, but diminishing
returns over time as outliers are eliminated
Outlier cases
Second Step: Shifting the Mean
Drives Long-Term Results
Gradual Behavior Change from Many
• Need the majority of providers to make
continuous, minor tweaks to their practice
that improve care and reduce costs
• Takes longer to do, but offers consistent
returns over time (constant evolution)
First Step: Outlier Reduction
Strategy Drives Early ROI
Two Ways of Looking at Variation ROI
Source: Crimson Continuum of Care data and analysis; Health Care Advisory Board interviews and analysis..

©2015 The Advisory Board Company • advisory.com
13
1. A Defined Vision of
Reliable Care
2. Physician Value-
Vision Alignment
Adopting Care Reliability as
the Central Clinical Strategy
3. Clinician Defined
System-wide Standards
of Care
4. Physician Support
Structure
Building a Clinician-
Centered Infrastructure
5. Cultural Fit
Assessment
6. Physician Leader
Pipeline Development
7. Accountability for
Clinical Standard
Adoption
Aligning Medical Staff
Management
Source: Banner Health, Phoenix, AZ; Health Care Advisory Board interviews and analysis..
A Comprehensive Approach to Transformation at Banner Health
“A System Approach to Transforming Clinical Culture: Case Study of Banner Health System”,
Advisory Board Company’s Physician Executive Council
• National Meeting Presentation (2014-2015), White Paper (2015), Webconference (2015)
Seven Elements of Clinical Standardization

©2015 The Advisory Board Company • advisory.com
14
Optimize Shared Administrative Services
Source: Health Care Advisory Board interviews and analysis.
Leveraging Systemness to Excise Structural Costs
1) Service level agreements.
2) Key performance indicators.
Evolution in the Benefits of Shared Services
Building a
User-Focused Model
Scope of Benefit
Capturing
Next-Generation Benefits
Centralizing
Disparate Functions
• Less duplication
of services across
system
• Savings from
reclaimed space,
headcount reduction
• Efficiency from
economies of scale
• Improved service quality,
efficiency
• Incorporated SLAs1/KPIs2
• Streamlined cash
management
• Facilitated enterprise growth
• Scale-enabled
specialization
• Enhanced business
intelligence capabilities
• Elevated competitive
advantage
Sca
le o
f B
en
efit
Service-Specific System-Wide

©2015 The Advisory Board Company • advisory.com
15
Evaluating Each Service Against Five Strategic Considerations
Source: Health Care Advisory Board interviews and analysis.
Rightsize Services and Sites of Care
Strategic Considerations for
Rationalization of Services
Rationalization Actions Based
on Strategic Considerations
Matching access and capacity
to historical volumes
Analyzed OR procedural volumes
to determine appropriate locations
Invested in services with high forecasted
demand to create care destinations
Opportunity for growth in new
and existing service lines
Regulatory issues with FTC,
State Attorney General, CMS
Required zero duplication of new
services or technologies at two sites
Culture of clinical and non-clinical
staff constituencies
Created single medical staff,
evaluated clinical need at sites
Religious directives for Hospital at
Saint Raphael (Catholic Church)
Respected Ethical and Religious
Directives for Catholic Health Care
at Hospital of Saint Raphael

©2015 The Advisory Board Company • advisory.com
16
2
3
1
Road Map
Containing Cost Growth
Maximizing Revenue Capture
Capturing New Sources of Growth

©2015 The Advisory Board Company • advisory.com
17 Minimize Denials and Underpayments
Source: Health Care Advisory Board interviews and analysis.
Accelerate the Transition to ICD-10
58% 28%
14%
MS-DRG Group Change
Med/Surg Change
CC/MCC Change
$5,174
Average
Change in
Payment
Per Claim
$9,978
Average
Change in
Payment
Per Claim
$3,822
Average
Change in
Payment
Per Claim
DRG Change for Positive Charts DRG Change for Negative Claims
60% 28%
12%
MS-DRG Group Change
CC/MCC Change
Med/Surg Change
-$3,511
Average
Change in
Payment
Per Claim
-$3,428
Average
Change in
Payment
Per Claim
-$8,470.40
Average
Change in
Payment
Per Claim

©2015 The Advisory Board Company • advisory.com
18
Source: Financial Leadership Council interviews and analysis.
Implement Best-in-Class CDI Programs
Clearly Defined Mission
• Reimbursement or quality focus?
• Reporting structure matches mission
Optimally Staffed Program
• Productivity standards used to
determine staffing
• Engaging with other departments
take time away from charts
Performance Accountability
• Expectations are explicit and
well-understood
• Program performance data shared
with relevant parties
Efficient Process Flow
• Well-integrated electronic queries
• Clear escalation policy in place for
unresponsive physicians
Established Intra-Department
Relationships
• Ongoing training and data sharing
• Physician champions used effectively
to gain buy-in
1
2
3
4
5

©2015 The Advisory Board Company • advisory.com
19
Prioritize Risks from VPB and Other Penalties
Reimbursement Increasingly Tied to Performance
Source: CMS, Bundled Payments for Care Improvement Initiative, 2012, available at: innovation.cms.gov; Source: The Advisory Board Company Daily Briefing, “Clement: What Medicare is doing to limit
observation status,” May 28,2013, Washington, DC; Jaffe S, “Medicare Seeks to Limit Number of Seniors Placed In Hospital Observation Care,” Kaiser Health News, May 3, 2013, available at:
www.kaiserhealthnews.org; Gengler A, “The Painful New Trend in Medicare,” CNN Money, August 7, 2012, available at: money.cnn.com; Health Care Advisory Board interviews and analysis.
Elevate Performance on Mandates and Value-Based Reimbursement
80% Percent of hospitals expected to
see reduced reimbursement in FY
2015 due to CMS P4P programs
Mandatory Medicare Pay-for-
Performance Programs
Maximum Payment Penalty
1%
2%-3%
1%-2% Hospital Value-Based
Purchasing Program
Hospital Readmissions
Reduction Program
Hospital-Acquired
Condition Penalty
$4,100
$1,800
$0
Inpatient Observation "Improperly"Admitted
Potential Chest Pain Treatment Paths
Medicare Payment Rates
RAC Reaction Spilling Over to Volume
1.6M Observation stays
nationwide, 2011
69% Increase in number of
Medicare beneficiaries
under observation,
2006-2011

©2015 The Advisory Board Company • advisory.com
20
Shifting Coverage Increases Uncompensated Care, Decreases Net Payment
Minimize Avoidable Uncompensated Care
Source: Financial Leadership Council interviews and analysis.
The Future of Uncompensated Care?
$11.9M $12.4M $12.6M $14.3M $16.2M
$9.3M $7.5M $8.7M $7.6M
$7.8M
2013 2014 Full ACAImplementation
2014 Opt-Outof Medicaid
2014 Full ACA,10% Shift toExchanges
2014 Full ACA,20% Shift toExchanges
Bad Debt Net Charity Discounts
Impact of Commercial Shifts on Bad Debt, Net Charity Discounts
2.0% 2.7% 2.2% 1.7% 0.6% Operating
Margin
Net
Payment $220M $222M $221M $219M $217M
Assumes 15% Discount Off Commercial Rates
Margins are
effectively
erased with a
20% shift to
exchanges

©2015 The Advisory Board Company • advisory.com
21
Typical Practice
Strong Practice
Considerable Delta Between Average and Strong Collections
Source: Health Care Advisory Board interviews and analysis.
Elevate Point-of-Service Collections
Total Annual Point of Service Collections
Medium-Sized Hospital (Net Patient Revenue: $450 M)
$1.8 M
$8.1 M $13.5 M
0.4% of
Net Patient Revenue
1.8%-3.0% of
Net Patient Revenue
$5.4 M
Range in
Value
Relative
Bottom Line Impact

©2015 The Advisory Board Company • advisory.com
22
Develop a Major-Gifts Philanthropy Program
Focus on Major Gifts to Maximize Return
Elevate Returns from Philanthropy
Source: Mayo Clinic, Rochester, MN. Mayo Clinic 2012 Annual Report, available at
http://www.mayoclinic.org/mcitems/mc0700-mc0799/mc0710-2012.pdf [June 21, 2013]. ; Health Care
Advisory Board interviews and analysis.
0.81
1.66 1.18
3.49
1.67
6.71
Special Events Major Gifts
25th Percentile 50th Percentile
75th Percentile
Philanthropy Return on Investment, by
Fundraising Strategy
N = 164
13%
Other
2% Philanthropy
85%
Patient
Revenue
14%
Other
21% Philanthropy
65%
Patient
Income
Revenue at Mayo Health System
Income at Mayo Health System

©2015 The Advisory Board Company • advisory.com
23
Engage Physicians in Donor Development
Physicians the Most Productive Source of Grateful Patient Donors
Source: Virginia Mason Medical Center, Seattle, WA; Health Care Advisory Board interviews and analysis.
$49K 4.2 months
Patient
prospects
$242K 6.9 months
Board
referrals
$455K 2.9 months
Physician
referrals
Time to Major Gift and Average Gift Size at Virginia Mason

©2015 The Advisory Board Company • advisory.com
24
2
3
1
Road Map
Containing Cost Growth
Maximizing Revenue Capture
Capturing New Sources of Growth

©2015 The Advisory Board Company • advisory.com
25
Homing In on Leakage Problems, Hardwiring Regular Referral Tracking
Becoming the Procedural “DRG Factory”
Increase Transparency of Referral Patterns
Case in Brief: Stralian Health1
• 500-physician multi-specialty group affiliated with large health system in the South
• Ties portion of physician compensation to use of EMR for referral data entry
Historic Current
76%
88%
12-percent
increase in
in-network
referrals
Stralian’s1 Referral-Monitoring Structure
EMR field outlines referral steps
Physicians required to fill field, highlight need
for patient follow-up
Service line leaders pull, evaluate data monthly
Intervene as necessary to improve efficiency,
decrease referral leaks
Percent of In-Network Referrals

©2015 The Advisory Board Company • advisory.com
26
Opening the Books and Teaching the Financial Impact of Referrals
Engage Physicians to Strengthen Referral Network
New Hire Orientation
Case in Brief: Hepworth Clinic1
• 600-physician multi-specialty clinic in the Southeast
• Physician leader discusses referral management during new-physician onboarding
• Organization reports an increase of in-network referrals by several percentage points in
recent years; leaders attribute growth to enhanced transparency around referral impact
• Physician leader presents profit margin
data on IP procedures
• Compares number of PCP patient
visits needed to generate same
margin; makes the case that PCP
referrals are integral to financial health
of the organization
• Demonstrates impact of referral
leakage on hospital margin to new
physician recruits

©2015 The Advisory Board Company • advisory.com
27
Addressing Individual Limits in Geographic Reach
Growing through Acquisitions and Partnerships
Source: Health Care Advisory Board interviews and analysis.
Embrace Partnerships that Expand Competencies
Case in Brief: Healthcare
Solutions Network Cincinnati-based
employers have
employees living on
both sides of river
• Joint venture collaboration
between Cincinnati, Ohio-
based TriHealth and
Edgewood, Kentucky-based
St. Elizabeth Healthcare
• Offers health insurers access
to a unified, high-quality,
low-cost network that covers
the entire Tristate region
• Both organizations offering the
network to their current
employees and dependents
Partnering to Expand Geographic Scope
St. Elizabeth
Healthcare
TriHealth
Neither Organization Able to Offer
Adequate Geographic Coverage Alone
Ohio
Kentucky

©2015 The Advisory Board Company • advisory.com
28 Pursuing Risk-Based Reimbursement
Build the Clinical Model for Population Health
• No single EMR
across sites
• No perfect
analytic system
• No need to own every
part of the continuum
• No need to make
significant bricks-and-
mortar investments
• No need to bring in
an entirely new
workforce or
leadership team
Leverage Analytics
to Drive Value
from Care
Management IT
Develop a
Preferred
Partner Network
Invest in Flexible
Care Management
Workforce
1 2 3
Information
Technology
Network
Development Workforce
Three Key Investment Decisions for Care Management Infrastructure
©2015 The Advisory Board Company • advisory.com
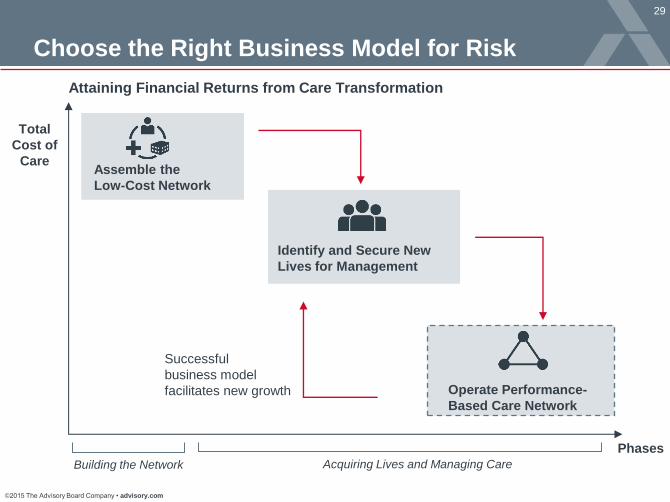
29
Choose the Right Business Model for Risk
Total
Cost of
Care
Identify and Secure New
Lives for Management
Successful
business model
facilitates new growth
Acquiring Lives and Managing Care Building the Network
Operate Performance-
Based Care Network
Assemble the
Low-Cost Network
Attaining Financial Returns from Care Transformation
Phases

©2015 The Advisory Board Company • advisory.com
30
New Dynamics Unfamiliar in Health Care, But Not in Broader Economy
Winning Share in a Retail Market for Health Care
Source: Health Care Advisory Board interviews and analysis.
All Signs Point to a Retail Market
Traditional Market Retail Market
Growing number of buyers
1
Proliferation of product options
2
Increased transparency
3
Reduced switching costs
4
Greater consumer cost exposure
5
Passive employer,
price-insulated employee
Activist employer,
price-sensitive individual
Broad, open networks Narrow, custom networks
No platform for apples-to-
apples plan comparison
Clear plan comparison
on exchange platforms
Disruptive for employers
to change benefit options
Easy for individuals to
switch plans annually
Constant employee
premium contribution,
low deductibles
Variable individual
premium contribution,
high deductibles
©2015 The Advisory Board Company • advisory.com
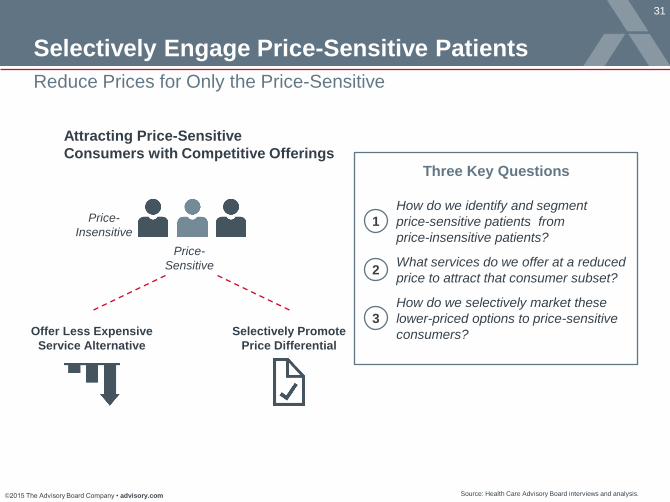
31
Selectively Engage Price-Sensitive Patients
Reduce Prices for Only the Price-Sensitive
Source: Health Care Advisory Board interviews and analysis.
How do we identify and segment
price-sensitive patients from
price-insensitive patients?
Three Key Questions
1
Attracting Price-Sensitive
Consumers with Competitive Offerings
2
3
Price-
Insensitive
Price-
Sensitive
Offer Less Expensive
Service Alternative
Selectively Promote
Price Differential
What services do we offer at a reduced
price to attract that consumer subset?
How do we selectively market these
lower-priced options to price-sensitive
consumers?

©2015 The Advisory Board Company • advisory.com
32
Capture New Patients with Convenient Offerings
Markets Responding to Unmet Needs
Source: Mehrota A et al, "Visits To Retail Clinics Grew Fourfold From 2007 To 2009,
Although Their Share Of Overall Outpatient Visits Remains Low," Health Affairs,
August 2012; Health Care Advisory Board interviews and analysis.
Traditional
Access
Points
Consumer-
Oriented
Access Points Retail
Clinic
Urgent Care
Center
Virtual
Visit
44% Retail visits occur
when physician office
is likely to be closed
Primary
Care Office
Low Acuity High Acuity Emergency
Department
Consumer-Oriented Service Delivery Sites Filling Traditional Gaps
Driving Provider Questions:
• Should we partner to establish retail clinics?
• Should we build or expand our urgent care footprint?
• Is virtual care something that we should provide?
• When should we enter into partnerships to meet patient demands?

©2015 The Advisory Board Company • advisory.com
33
Expand Share with Tailored Service
33
Referencing the Principles of Supply and Demand
Source: Health Care Advisory Board interviews and analysis.
Demand Outstripping Supply
For Primary Care Services
Price
Supply
Current Price
Market Price
Quantity
Demand
Current price below
what consumers are
willing to pay for
primary care services
Current supply not
meeting patient demand
for primary care services
Two Ways to Address
a Primary Care Shortage
Embracing Premium
Payment Models
Accommodating Excess
Primary Care Demand
1
2

©2015 The Advisory Board Company • advisory.com
34
Delivering Desirable Network Attributes at Low Cost
Source: Health Care Advisory Board interviews and analysis.
Redefining the Value Proposition
Competitive Unit
Prices
Strategic Imperatives:
• Avoid reactive
position vis-a-vis
price cuts,
transparency
• Radically restructure
cost structures to
sustain lower
unit prices
Total Cost Control
Strategic Imperatives:
• Develop population
health model to
control cost trend
• Clearly
communicate total
cost advantage to
potential purchasers
Geographic Reach
and Clinical Scope
Strategic Imperatives:
• Match service
portfolios, footprints
to target purchasers
• Explore partnership
strategies that
strengthen market
presence
Clinical and Service
Quality
Strategic Imperatives:
• Present
unimpeachable
clinical credentials to
wholesale buyers
• Emphasize access,
experience
advantages to
individual consumers
Low Cost Desirable Network Attributes
Four Imperatives for Health Systems


