1
The Level of Corporate Transparency
among the World’s Largest Multinational Companies
Barbara Kowalczyk-Hoyer
Freelancing Economist and Independent Consultant
DRAFT
ABSTRACT
In its recent study, Transparency International (TI) evaluated the level of public disclosure
among the 105 largest publicly listed multinational companies (MNCs).
Two out of three evaluated dimensions - organisational transparency and country-by-country
reporting - are important to trace how money is generated and how it flows within large
multinational corporate structures. Such information should be available to all stakeholders,
especially to the citizens of countries, in which such companies operate, bid for licences, sign
governmental contracts, generate revenues and pay or not pay taxes.
The study shows several interesting results. First, the average level of organisational
transparency is relatively high, but often limited to the disclosure of material fully-
consolidated holdings. Second, country-by-country reporting of financial data is still very rare
among MNCs. Third, there are already some “best practice examples” - companies, which
decided to voluntary introduce country-by-country reporting for all countries, in which they
operate. Fourth, the often quoted argument, that country-level reporting is not possible in
some “difficult environments” is not defendable, because one can find examples of good
disclosure in almost each such country.
KEYWORDS
Multinational companies (MNC), country-by-country reporting (CBCR), organisational
transparency (OT), corporate transparency, Transparency International Secretariat (TI), civil
society organisation (CSO)

2
INTRODUCTION
Transparency International (TI), the global coalition against corruption, has been addressing
the issue of corporate transparency for many years. At the beginning its efforts were focused
on companies’ anti-corruption programmes, but with time a much broader spectrum of issues
was taken into account.
TI’s engagement in the sector analysis of oil and gas companies and its cooperation with the
Extractive Industries Transparency Initiative (EITI) and with the Revenue Watch Institute,
resulted in the inclusion of new important transparency-related topics into the agenda:
organisational transparency (OT) understood as disclosure of subsidiaries and minority
holdings and country-by-country reporting (CBCR) of basic financial data. Both areas were
incorporated in the transparency evaluation tools used in TI’s private sector studies.
After successful launches of two reports on oil and gas sectors (2008, 2011), TI applied
similar criteria to the evaluation of a cross-industry sample of 105 largest publicly-listed
multinationals. This resulted in a publication of the report Transparency in Corporate
Reporting: Assessing the World’s Largest Companies, (TI, 2012). The report included
company rankings and some analysis of the results.
Data collected by TI for this report is a unique, valuable and publicly available source of
information on 105 MNCs. Even if the number of companies is not impressive, the meaning
and scope of the study is strengthened by the fact that these are the largest by market value,
multinational publicly-traded companies, plus data was collected on a group level and such
groups usually include hundreds of consolidated subsidiaries. TI estimates the joint market
value of evaluated companies to be more than US$11 trillion, and their presence to reach out
to almost all countries of the world (TI website). What is also important, a big part of data was
validated by evaluated companies, which confirmed its quality.
In this paper, this publicly available database is used to illustrate the current level of
transparency regarding MNCs’ organisational transparency and country-level operations.
These two complementary dimensions are the key to understand where money is generated
and how it flows within large multinational corporate structures.
3
TI MEASUREMENT OF CORPORATE TRANSPARENCY
“Transparency is a characteristic of governments, companies, organisations and individuals
of being open in the clear disclosure of information, rules, plans, processes and actions” (TI,
2009). This definition is very broad and not really helpful for practical applications. Therefore,
for the purpose of measurement it has to be translated into practice.
In case of corporate transparency, the first necessary step is the selection of required
information to be disclosed by companies. This is not an easy task, considering an immense
range of data collected by companies: financial, organisational, marketing, social, technical,
environmental, etc. Companies possess information, which could be of interest to diverse
parties, such as owners, lenders, society, governments, civil society organisations (CSOs) or
competitors. Some stakeholders can require disclosure of information, which they consider
relevant, using laws, regulations or even their authority or financial influence. Other
stakeholders are fully dependent on voluntary disclosure of information. In its studies on
corporate transparency, TI decided to focus on information, which it considered most
relevant for the prevention of corruption, and which is (or has been until recently) disclosed
on a voluntary basis. This resulted in the selection of three areas: anti-corruption
programmes, organisational transparency and country-by-country reporting.
Not only information disclosed by companies could be bottomless, but also the number of
potential sources, in which such information could be found. A company can provide
information through its corporate website, stock exchange reporting systems, industrial
associations, ministries, municipalities or even through internet pages, which do not seem
relevant for such reporting. Corporate information can be publicly available, protected by
password or only accessible for selected audience, free of charge or subject to fees, virtual
or printed on paper. The number of combinations is immense and makes comprehensive
research almost impossible. Without defining a very precise and limited set of sources,
practical data collection would not be possible. In its research, TI decided to follow two basic
rules. First, information must be publicly available without limitation by fees or passwords -
every member of the society should be able to access it. Second, a company’s website
should be the source of information, either directly or through attached or linked documents.
The third methodological element added by TI is company consultations on collected data.
This process should not affect equal treatment of companies, regardless of their engagement
in the process. It should only help identify mistakes and omissions of the researchers, and
increase companies’ understanding and acceptance of the transparency requirements. In

4
fact, the cooperating companies are more likely to follow TI’s recommendations and increase
the level of their public disclosure, than companies, which do not participate in the data
validation process.
The three-dimensional evaluation of corporate transparency has been already applied by TI
several times: in 2008 and in 2011 in the Promoting Revenue Transparency reports on oil
and gas companies (TI, 2011), in 2012 in the Transparency in Corporate Reporting:
Assessing the World’s Largest Companies report (TI, 2012), which is the major subject of
this paper, and currently in several running reports (with country, emerging markets and
global focus respectively). Each study brings some new experience resulting in modifications
of the methodology. The evaluation criteria become more precise and in some cases stricter.
ORGANISATIONAL TRANSPARENCY and COUNTRY-BY-COUNTRY REPORTING
For the purpose of this paper, two out of three corporate transparency dimensions evaluated
by TI have been analysed: organisational transparency (OT) and country-by-country
reporting (CBCR).
The requirement to publish such data has been first raised by Richard Murphy, whose
original idea was to introduce a new international accounting standard for all MNCs, which
would require disclosure of information on:
• all entities that form an MNC, their locations and operations,
• sales in each country of operations divided into external and intra-company sales,
• value added, profit and tax by each entity in each country of operations.
The major purpose for such disclosure was defined as follows: “(…) to provide information
that will assist those seeking to appraise the organisation with regard to: its corporate social
responsibility, investment risk, tax risk, its contribution by way of value added to the societies
in which it operates, its contribution to national well-being by way of tax payment within
those locations“(Murphy, 2003).
This last aspect - contribution to development through tax payments - is most frequently
stressed by organisations supporting international development. In its analysis of “ill-gotten
money” in Malawi and Namibia, the World Bank named tax evasion, next to corruption, “the
most critical criminal activity impacting development” (WB, 2011). The 2011 UN study

5
confirmed negative impact of illicit money flows on economic growth, moreover it estimated,
that commercial activities such as mispricing, transfer pricing or fake transactions, generate
cross-border “dirty money” flows, which are twice higher than those generated by criminal
activities (UNODC, 2011). In other words, UN estimates that MNCs conduct more illicit
international transactions than smugglers, drug, arms and human traffickers all together.
The idea of corporate transparency, especially through CBCR, has spread fast, leading to
the emergence of numerous international initiatives, such as Tax Justice Network, Publish
What You Pay or EITI. Recently it moved one step further and reached the legislators in the
USA (Dodd Frank Act) and in the EU (EU Directive 2013). Both civil society movements and
regulators stress the corporate social responsibility and developmental aspects and they
mostly focused on the extractive sectors.
Although the initial idea treated OT and CBCR as two complementary elements, which
should be required from MNCs, the second element has attracted much more attention from
both CSOs and the legislators. TI’s corporate transparency evaluations put both elements
back on the agenda.
HOW MUCH DO MNCs DISCLOSE
In the analysed 2012 TI study, the evaluation of MNCs’ organisational transparency was
based on a short questionnaire, which asked about the disclosure of companies’ material
entities, both majority and minority owned. For each such entity, a company was expected to
disclose: name, country of incorporation and percentage held by the mother company.
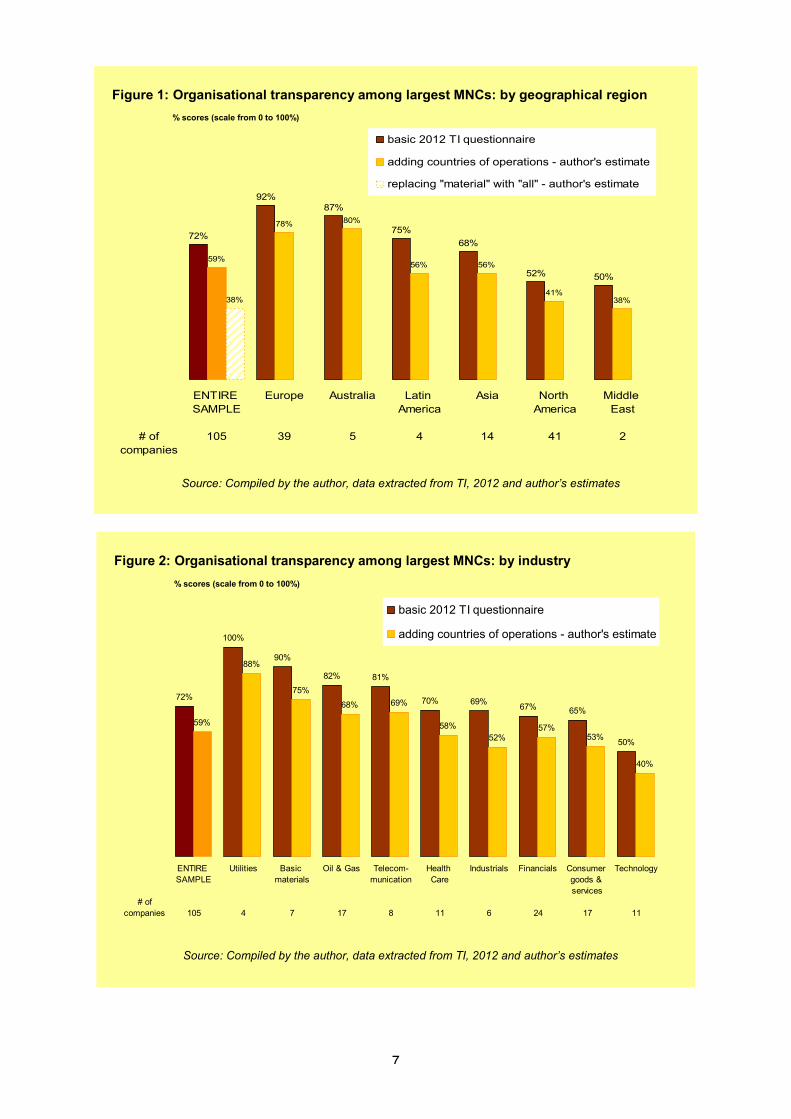
The average results were good, but differed strongly among regions and industries (Figures
1 and 2 – brown bars – “basic TI questionnaire”). The sample average was 72% (on a scale
from 0 to 100%, where 100% means the full disclosure).
Most regional representations were too small to draw any broader conclusions, but the
Northern American (mostly US) and the European subsamples were big enough to allow for
some comparison. The average score for Europe was 92%, while the average score for the
US was only 52%. Most US companies reported only on their fully consolidated holdings
(subsidiaries), as required by the SEC regulations. There was hardly any voluntary reporting
on minority holdings among the US MNCs. In Europe, on the contrary, reporting on minority
6
holdings was almost complete, just as reporting on fully-consolidated holdings.
Industry-wise, the sample was too diverse and the subsamples too small to allow for far
reaching conclusions. The only bigger subsamples were: oil & gas, financials and consumer
goods & services. Among these three, oil & gas achieved the highest scores, which could be
related to the longer history of transparency evaluation in this sector and to the existence of
industry-specific transparency initiatives.
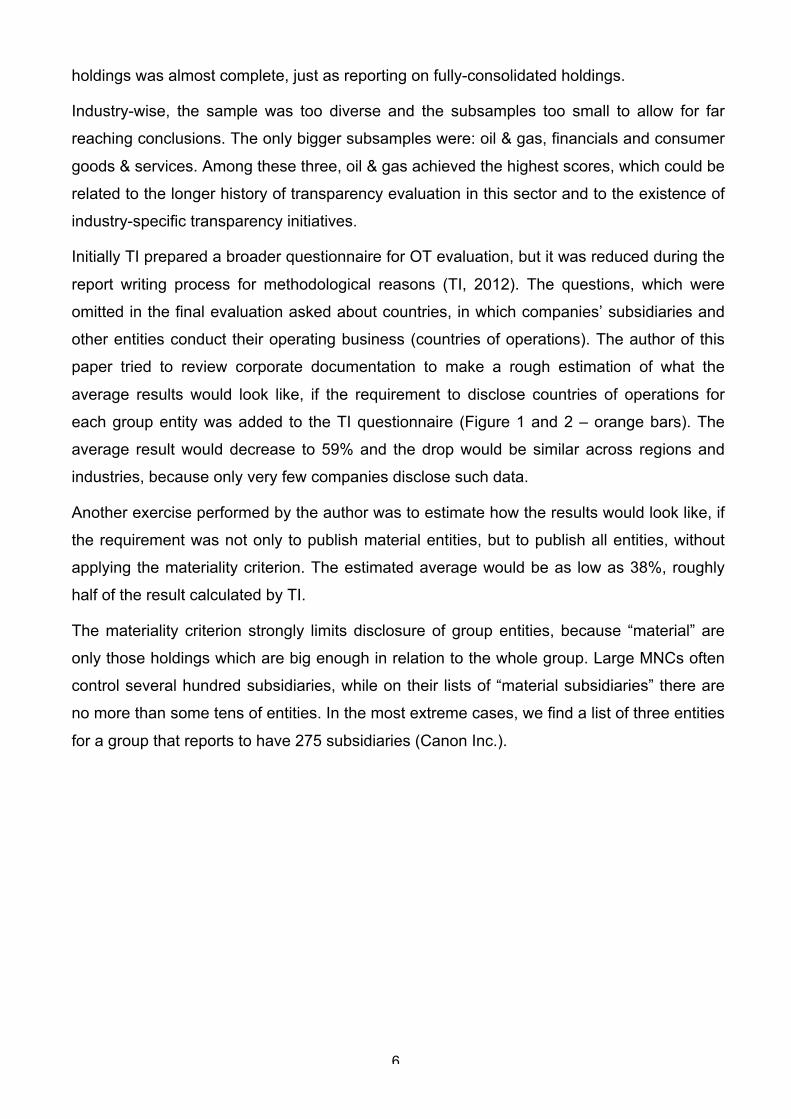
Initially TI prepared a broader questionnaire for OT evaluation, but it was reduced during the
report writing process for methodological reasons (TI, 2012). The questions, which were
omitted in the final evaluation asked about countries, in which companies’ subsidiaries and
other entities conduct their operating business (countries of operations). The author of this
paper tried to review corporate documentation to make a rough estimation of what the
average results would look like, if the requirement to disclose countries of operations for
each group entity was added to the TI questionnaire (Figure 1 and 2 – orange bars). The
average result would decrease to 59% and the drop would be similar across regions and
industries, because only very few companies disclose such data.
Another exercise performed by the author was to estimate how the results would look like, if
the requirement was not only to publish material entities, but to publish all entities, without
applying the materiality criterion. The estimated average would be as low as 38%, roughly
half of the result calculated by TI.
The materiality criterion strongly limits disclosure of group entities, because “material” are
only those holdings which are big enough in relation to the whole group. Large MNCs often
control several hundred subsidiaries, while on their lists of “material subsidiaries” there are
no more than some tens of entities. In the most extreme cases, we find a list of three entities
for a group that reports to have 275 subsidiaries (Canon Inc.).
7
Source: Compiled by the author, data extracted from TI, 2012 and author’s estimates
Figure 1: Organisational transparency among largest MNCs: by geographical region % scores (scale from 0 to 100%)
72%
92%87%
75%68%
52% 50%
59%
78% 80%
56% 56%
41%38%38%
# ofcompanies
ENTIRE SAMPLE
105
Europe
39
Australia
5
Latin America
4
Asia
14
North America
41
Middle East
2
basic 2012 TI questionnaire
adding countries of operations - author's estimate
replacing "material" with "all" - author's estimate
Source: Compiled by the author, data extracted from TI, 2012 and author’s estimates
Figure 2: Organisational transparency among largest MNCs: by industry % scores (scale from 0 to 100%)
72%
100%
90%
82% 81%
70% 69% 67% 65%
50%
59%
88%
75%
68% 69%
58%52%
57%53%
40%
# ofcompanies
ENTIRE SAMPLE
105
Utilities
4
Basic materials
7
Oil & Gas
17
Telecom-munication
8
Health Care
11
Industrials
6
Financials
24
Consumer goods & services
17
Technology
11
basic 2012 TI questionnaire
adding countries of operations - author's estimate

8
In its 2012 report, TI evaluated the level of CBCR was by checking country-level disclosure
of five elements: revenues, profit before taxation, income tax, capital expenditure and
community contributions. The first four elements should give orientation about company’s
scope of operations in a country, but also about the level of taxation in relation to revenues or
profits (an indication of potential tax exemptions or tax evasion). The last required element,
although financial, is more related to company’s anti-corruption programme, because
community or charitable contributions make companies vulnerable to corruption and can
serve as its substitute.
The evaluation followed the rule that information about each country in which a company
operates is equally important. If a company operates in 100 countries, disclosing data for one
of them will always contribute 1% to the overall score, no matter if this is the largest or the
smallest country. Additionally, not to allow for home-country bias, results were calculated for
foreign operations only. Otherwise, a rather common split of financial data between domestic
and international operations would favour countries operating in few countries against
countries operating globally.
The results showed a very poor level of CBCR among the largest MNCs. The average result
was 3,7% on a scale of 0-100%. In other words, the average CBCR is close to none (Figures
3 and 4).
The average result of the European companies (5,7%) was four times higher than that of the
Northern American ones (1,4%). Still, both results were very low.
A small subsample of Australian companies was the only regional group achieving a result
above 10% and this was primarily thanks to the two basic materials/ oil & gas companies,
which achieved high scores of 24%.
It is interesting to note that Statoil, a state controlled Norwegian oil & gas company, was an
unchallenged leader with the score of 50%. This confirmed the engagement of the
Norwegian government in many transparency initiatives, such as EITI or PWYP.
Another interesting observation on the geographical front is a very high score of the Indian
companies. In India, companies are required to attach simplified financial statements of all
their subsidiaries (not limited by the materiality criterion) to their annual reports. For publicly
listed companies, it means the disclosure of such data to the public. While there is still a
difference between subsidiary-by-subsidiary reporting and CBCR (bigger subsidiaries often
operate in more than one country), TI decided to consider such disclosure as a good proxy

9
for CBCR, and awarded positive but reduced scores for such reporting (TI, 2012). High
Indian scores are therefore a product of high reporting requirements in this country.
Figure 3: Country-by-country reporting among largest MNCs: by geographical region% scores (scale from 0 to 100%)
Source: Compiled by the author, data extracted from TI, 2012
3.7%
11.0%
5.7%
3.1%
1.4% 1.2%0.0%
# ofcompanies
ENTIRE SAMPLE
105
Australia
5
Europe
39
Asia
14
North America
41
Latin America
4
Middle East
2
Source: Compiled by the author, data extracted from TI, 2012
Figure 4: Country-by-country reporting among largest MNCs: by industry% scores (scale from 0 to 100%)
3.7%
10.8%
6.9%
5.9%
3.3%
2.3%1.7%
1.2% 1.0%0.3%
# ofcompanies
ENTIRE SAMPLE
105
Basic materials
7
Oil & Gas
17
Telecom-munication
8
Consumer goods & services
17
Financials
24
Technology
11
Utilities
4
Health Care
11
Industrials
6

10
Industry-wise, basic materials and oil & gas companies achieved the highest, above-average
scores (Figure 4). Most probably, this is a result of long-lasting promotion of the CBCR idea
among extractive companies. TI published two reports with such evaluation of oil & gas
sectors before applying it to a cross-industry sample (TI, 2011). EITI or PWYP both focus on
extractive industries. The recently adopted legislative changes also focus on extractives, and
they may have induced some changes in company reporting standards in advance.
WHY IS THE LEVEL OF COUNTRY-BY-COUNTRY REPORTING SO LOW?
What drives secrecy and what supports openness? Who would profit from better CBCR and
who would loose? Why does it have to be such a battle to make companies disclose country-
level information?
In his paper on political economy of CBCR, Dariusz Wójcik presents a very interesting
discussion of how different groups perceive the necessity of such reporting and why they
support it or not. He bases his analysis on the results of the EU consultation on CBCR.
Generally, groups which strongly oppose CBCR are: companies, accountants and auditors.
Groups which are in favour of CBCR are users of such information, mostly represented by
CSOs. Other potential users of such information – investors, were hardly engaged in the EU
consultation process. Governments neither strongly supported, nor opposed the CBCR
(Wójcik, 2012a).
This type of analysis is very valuable, because it helps identify potential supporters of CBCR,
as well as, identify arguments, which could convince the opponents. Below, the companies’,
investors’ and governments’ attitudes to CBCR are discussed in more detail.
COMPANIES
Most companies oppose CBCR, even in its limited version proposed by the EU. TI
experienced similar companies’ attitude while conducting its research. Their often repeated
arguments were: high costs of generating such information and the so called “difficult
environment” – one hard and one soft argument (TI, 2011, TI 2012).
The costs of generating country-level data must be estimated separately by each company

11
and only such estimation can be used as a valid argument. However, there are two facts,
which suggest that such costs cannot be as high, so they could harm companies’ competitive
position. First, there are companies which regularly publish country-level data and they can
bear the associated costs voluntarily, without being rewarded for it. Second, companies
report to the tax authorities in all countries, in which they have consolidated subsidiaries,
meaning that they have country-level financial data in their records, and it only needs to be
compiled and published.
In its impact assessment of different CBCR options in 2010, the EU ordered initial cost
estimation for different types of such reporting and on this basis it rejected the full-CBCR
option and accepted the option, which required companies to report on payments to
governments only (Wójcik, 2012b). However, considering the differences between the
accepted and the rejected standards, the biggest differing cost factor was the auditing
requirement and not the content of disclosed data. Additionally, as Wójcik noted in his paper,
the thresholds of acceptable costs set by the EU in this assessment were chosen arbitrary
(Wójcik, 2012b).
The so called “difficult environment” means that in some countries there is high level of
secrecy, hence strong opposition from their authorities against disclosure of any data, which
could reveal state licences, payments to governments or other elements of contracts
between MNCs and local authorities. Companies claim that they could loose contacts, tax
exemptions or other favourable treatment if they published data on their operations in certain
countries. In other words, they see openness as competitive disadvantage and as a potential
reason of lost business.
This particular argument was analysed by TI in its two reports (TI, 2011 and TI, 2012). Both
reports confirmed that in each country, no matter how opaque and difficult its political
situation is, one can find companies which do not fear openness and disclose country-level
data. In the 2011 report on oil and gas sectors, TI compared disclosure by different
transnational oil and gas producers in oil-rich African, Asian, Latin American and CIS
countries. Since the report was industry-specific, we can find evidence that direct competitors
chose different levels of openness in the same environment. For example in Equatorial
Guinea, three US oil and gas producers: Marathon, Hess and ExxonMobil disclosed 54%,
23% and 8% of required data respectively. Another example is Kazakhstan, where Italian Eni
disclosed 92% of required information, while BG, Chevron and BP only 8%, and ExxonMobil

12
and Shell disclosed no information at all. The situation repeats through all analysed regions
and countries (PRT, 2011, pp.37-39). The same exercise was repeated in the 2012 report
and showed similar results (Figure 5). In each country, there are at least several MNCs,
which disclose considerable financial data on their operations, while the majority of
companies choose to disclose no data at all.
Such results seem to support the thesis, that the “environment” itself is not the real reason
for limited disclosure and a company can always decide if to disclose country-level
information or not.
Figure 5: Disclosure of data by MNCs in chosen countries% scores (scale from 0 to 100%, where 100% means full disclosure)
50%
30%
30%
20%
20%
20%
10%
10%
10%
0%
Statoil
ONGC
Shell
Chevron
CNOOC Ltd
Total
BAT
GlaxoSK
SAP
24 other companies
NIGERIA50%
50%
40%
30%
20%
20%
20%
20%
20%
10%
10%
0%
Gazprom
Statoil
BP
ONGC
Allianz
Arcelor
Conoco
ENEL
Nestle
BAT
SAP
60 other companies
RUSSIA
40%
30%
20%
20%
20%
10%
0%
ENI
ONGC
Allianz
Arcelor
Chevron
SAP
30 other companies
KAZAKHSTAN
Source: TI, 2012, p.32
The most supportive of the CBCR idea are the extractive companies (Wójcik, 2012a), which
confirms the results of the 2012 TI study and supports the statement, that transparency
initiatives have the power to change companies’ attitude.
INVESTORS
Why don’t investors support CBCR? There is no evidence that they oppose it, however their
absence in the EU consultation process suggests little interest in the issue. More information
should be always in their interest, because it allows for better analysis of risk and for better

13
forecasting.
First, individual investors are not organised and therefore their opinion not heard.
Additionally, they rarely make investment decisions on the basis of their own analysis. They
rather buy recommendations, through the usage of investment advisors or they follow official
ratings or valuations by professional analysts.
Second, big and influential institutional investors such as investment funds or asset
management groups, who do require good information from companies, usually have better
sources of such information than publicly disclosed documents. They have direct access to
companies - they can ask company’s CFO or an investment banker working for a company
and making its due diligence for the emission prospectus. Moreover, institutional investors
would tend to prefer such exclusive information, because it gives them a competitive edge
against other investors.
Considering the above, there might be little use in convincing investors of the benefits of
public CBCR, unless the official rating agencies start using CBCR data for their evaluation. If
official ratings were affected by the very availability of such data (transparency risk) investors
would put pressure on companies to be more transparent.
Therefore, in the battle for CBCR, rating agencies could be a better ally then the investors.
GOVERNMENTS
There are only few governments, which show their commitment to the corporate
transparency idea. The Norwegian government supports CBCR through financing of
numerous transparency initiatives and it confirms its commitment through Statoil’s reporting.
Another supportive government is the Indian one. Indian companies are required to report
their financials by subsidiary, which is a proxy of CBCR. They also disclose information about
countries of incorporation and percentages held in all their subsidiaries, which leads to a high
level of OT among them.
Home countries of the largest MNCs are mostly highly developed economies - 80 out of 105
companies in the TI 2012 sample were domiciled in Western Europe, USA or Canada. In
many such countries, there is a conflict between MNCs’ lobby, which opposes CBCR and
CSOs, which support the initiative. The strong pressure from both sides on the governments
is most likely going to lead to the compromise solutions, such as the recent legislative
changes in the USA and in the EU, which only include chosen industries and limited data.

14
However, even such compromises are steps in the right direction.
In the host countries of MNCs, especially in the developing world, the support for CBCR will
be dependent on the quality of democratic institutions. On the one hand, more transparency
contributes to economic development and therefore it should be supported by the host
governments. But on the other hand, transparency can also disclose corruption or special tax
benefits awarded to MNCs without legal authorisation. The fact, that still only few developing
countries support good corporate reporting suggests that host country governments do not
see their interest in such transparency.
CONCLUSION
Public disclosure of MNCs’ global holdings (organisational transparency), and of their
country-level operations (country-by-country reporting) are two important elements of
corporate transparency. Such information would, among others, allow for companies to be
held accountable to the societies in which they operate with regard to taxation and social
responsibility issues.
In its private sector studies, Transparency International evaluated the levels of such
transparency among large global corporations. The results allow for drawing the following
major conclusions:
1. THE LEVEL OF CORPORATE TRANSPARENCY AMONG MNCs IS STILL LOW
The average results calculated in the TI 2012 report indicate a relatively high level of OT and
a very low level of CBCR. However, a closer analysis shows that both OT and CBCR require
major improvements.
Although the average level of OT among the largest publicly-listed MNCs is relatively high, it
differs strongly between the European and the Northern American companies. While Europe-
based companies disclose relatively complete information on both their majority and minority
holdings, American companies tend to disclose only majority-owned entities.
Moreover, most companies, regardless of the region, limit their OT disclosure by using the so
called “materiality criterion” and they leave out all entities, which are not large enough in
relation to the whole group. The disclosure of all entities as opposed to “material only” is

15
legally required in very few countries. This has lead to the general acceptance of such
limitation as an unofficial standard, which in practice often means, that companies do not
disclose their holdings registered in the offshore financial centres.
Country-by-country reporting among the largest MNCs is very low. In the TI report, even the
best performing industrial group, basic materials, scored on average only 10.8% from 100%
possible. The best performing company in the whole sample, Norwegian Statoil, disclosed
only 50% of information required by the TI’s methodology.
2. TRANSPARENCY INITIATIVES DO WORK
The results indicate that the support of home governments or legislators can drive CBCR and
OT. Such support can be expressed either through direct regulatory requirements (India –
both OT and CBCR), or through the support of global transparency initiatives (Norway -
CBCR).
Also the activity of international CSOs brings results (EITI, PWYP), which can be seen in
higher levels of transparency in the extractive sectors. CSOs can also succeed in their efforts
to change legislation (Dodd-Frank Act, recent EU Directive).
3. NONE OF THE OFFICIAL ARGUMENTS AGAINST CBCR HAS BEEN SERIOUSLY
PROVEN
There is little evidence that CBCR leads to competitive disadvantage for companies. The
arguments of too high costs of generating such data or host-country difficulties, which could
harm companies’ competitive position, have never been seriously proven by the
transparency opponents.
In 2009, the Norwegian TI Chapter conducted a survey among Norwegian companies about
corruption. The most interesting result was the answer to the last question of this study
“What are the most important causes of corruption in Norway?” The cause most often
chosen by companies was “greed”, while the one considered as least important was “it is
necessary for doing business” (TI Norway, 2009). It would be interesting to find out if the
question “What is the most important reason of low corporate transparency?” asked among
MNCs, would give similar results.

16
REFERENCES
EU, 2013, Official Journal of the European Union, Directive 2013/34/EU of the European
Parliament and of the Council
Global Financial Integrity, 2011, Illicit Financial Flows from Developing Countries: 2000-2009.
Update with a Focus on Asia
Global Financial Integrity, 2008, Illicit Financial Flows from Developing Countries: 2002-2006
Murphy R., 2010, Country-by-country Reporting: Shining Light onto Financial Statements
Murphy R., 2007, Tax Justice Network, Why is Country-by-Country financial reporting by
Multinational Companies so important?
Murphy R., 2003, Reporting Turnover and Tax by Location
Task Force for Financial Integrity and Economic Development, 2009, Country-by-country
Reporting: Holding multinational companies to account wherever they are
The World Bank, 2011, Ill-gotten Money and the Economy: Experiences from Malawi and
Namibia
Transparency International, 2012, Transparency in Corporate Reporting: Assessing the
World’s Largest Companies
Transparency International, 2011, Promoting Revenue Transparency: 2011 report on Oil and
Gas Companies
Transparency International, 2009, The Anti-Corruption Plain Language Guide
Transparency International Norway, 2009, Survey Among Norwegian Businesses about
Corruption
United Nations Office on Drugs and Crime, 2011, Estimating illicit financial flows resulting
from drug trafficking and other transnational organized crimes
Wójcik D., 2012a, Shining light on globalisation: the political economy of country-by-country
reporting, Draft Working Paper No. 12-07, Oxford University 2012
Wójcik D., 2012b, Accounting for globalization: evaluating the effectiveness of country-by-
country reporting, Draft Working Paper No. 12-08, Oxford University 2012


