©2011 Azul Systems, Inc.
The Java Evolution Mismatch
Why you need a better JVM
Gil Tene, CTO & co-Founder, Azul Systems

©2011 Azul Systems, Inc.
About Azul
We make scalable Virtual Machines
Have built “whatever it takes to get job done” since 2002
3 generations of custom SMP Multi-core HW (Vega)
Now Pure software for commodity x86 (Zing)
“Industry firsts” in Garbage collection, elastic memory, Java virtualization, memory scale
Vega
C4
©2011 Azul Systems, Inc.
Java Platform Evolution - early days
Initially focused on client-side applicationsbrowser, applet, etc.
Started off as a “toy”Cool, rich features that quickly evolved and expanded
Slow (interpreted)
Fat (needed more memory than many machines had)
~1995-~2000: Server side uses quickly evolvedPlatform performance evolved right along with functionality
JIT compilers, HotSpot, generational, parallel GC
Able to “fit better” and perform well in real machines
©2011 Azul Systems, Inc.
Java Platform Evolution:the past decade
Java became the dominant server application platform Java “won” the productivity and leverage game
Functionality evolved quickly and continuallyFocused on productivity, enterprise functionality
Huge, unrivaled ecosystem
Performance stayed around the same...Platform was built to fit in a few cores, a few GB circa 2001
Has not evolved since
But servers have changed...
©2011 Azul Systems, Inc.
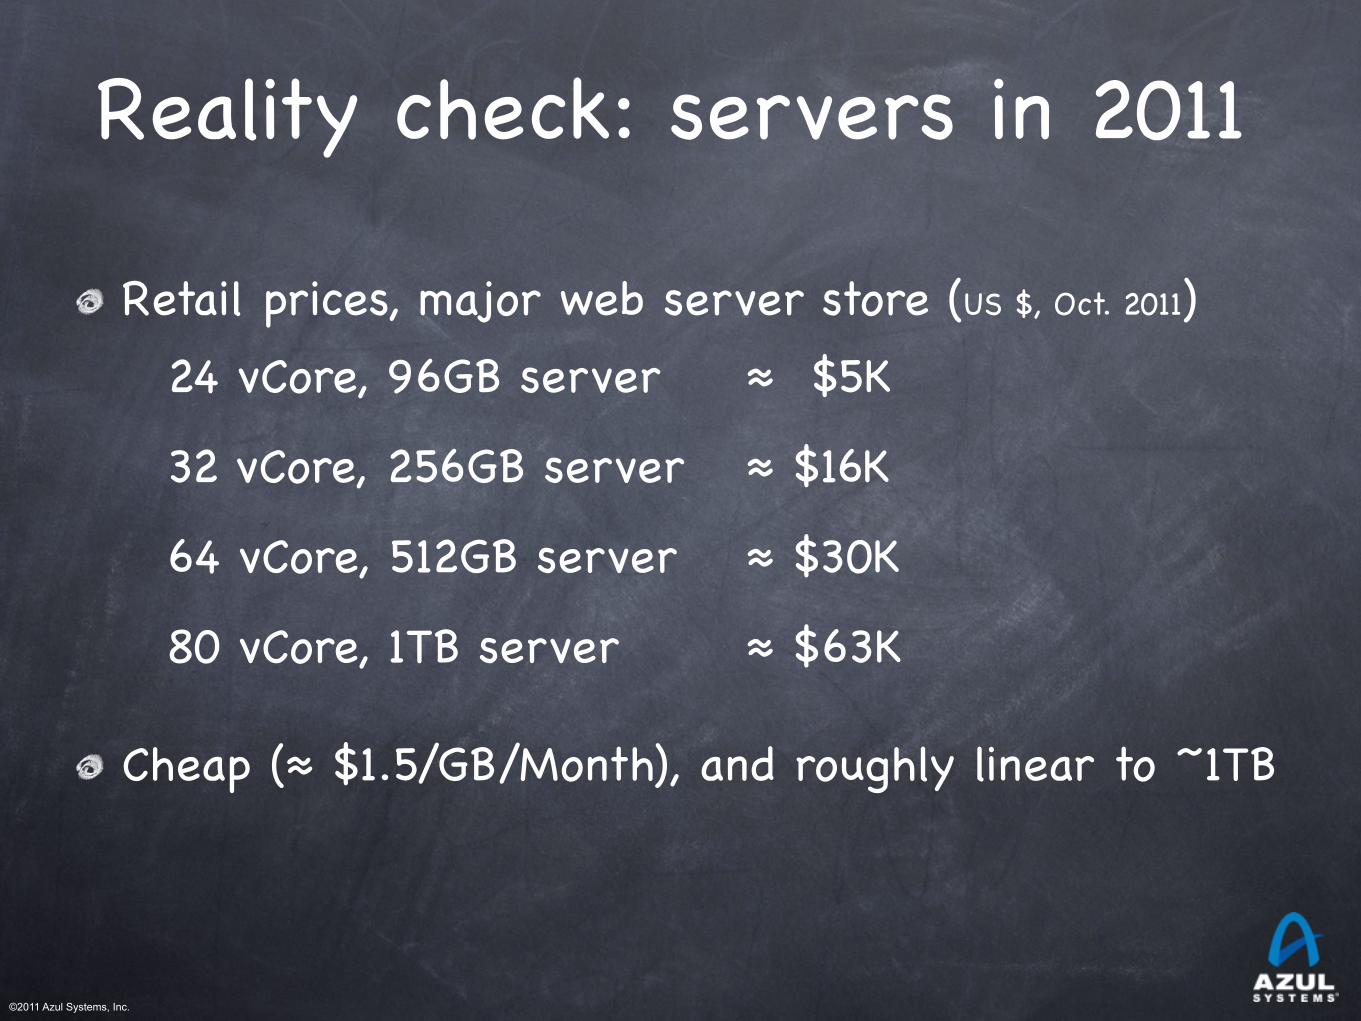
Reality check: servers in 2011
Retail prices, major web server store (US $, Oct. 2011)
Cheap (≈ $1.5/GB/Month), and roughly linear to ~1TB
24 vCore, 96GB server ≈ $5K
32 vCore, 256GB server ≈ $16K
64 vCore, 512GB server ≈ $30K
80 vCore, 1TB server ≈ $63K

©2011 Azul Systems, Inc.
“Tiny” application history
100KB apps on a ¼ to ½ MB Server
10MB apps on a 32 – 64 MB server
1GB apps on a 2 – 4 GB server
??? GB apps on 256 GBAssuming Moore’s Law means:
“transistor counts grow at ≈2x every ≈18 months”
It also means memory size grows ≈100x every 10 years
2010
2000
1990
1980
“Tiny”: would be “silly” to distribute
Application Memory Wall

©2011 Azul Systems, Inc.
The Java “problem”Then and Now
2000: Java platforms had a hard time fitting well in one computer
2012: Java platforms can’t make use of more than a tiny fraction of one computer

©2011 Azul Systems, Inc.
Current day Java Limitations
Responsiveness
Sensitivity to load, Fragility
Rigid, non-elastic, inefficient
Scale and Complexity
Common cause: platform misbehaves above a few cores and a few GB per instance

©2011 Azul Systems, Inc.
What is keeping Java platforms frommaking full use of current servers?
Garbage Collection is a clear and dominant cause
There seem to be practical heap size limits for applications with responsiveness requirements
[Virtually] All current commercial JVMs will exhibit a multi-second pause on a normally utilized 2-4GB heap.
It’s a question of “When” and “How often”, not “If”.
GC tuning only moves the “when” and the “how often” around
Root cause: The link between scale and responsiveness
©2011 Azul Systems, Inc.
Zing: A JVM for today’s servers
Eliminates the core problems that keep Java form making good/full/effective use of current servers
Able to put current servers to work
©2011 Azul Systems, Inc.
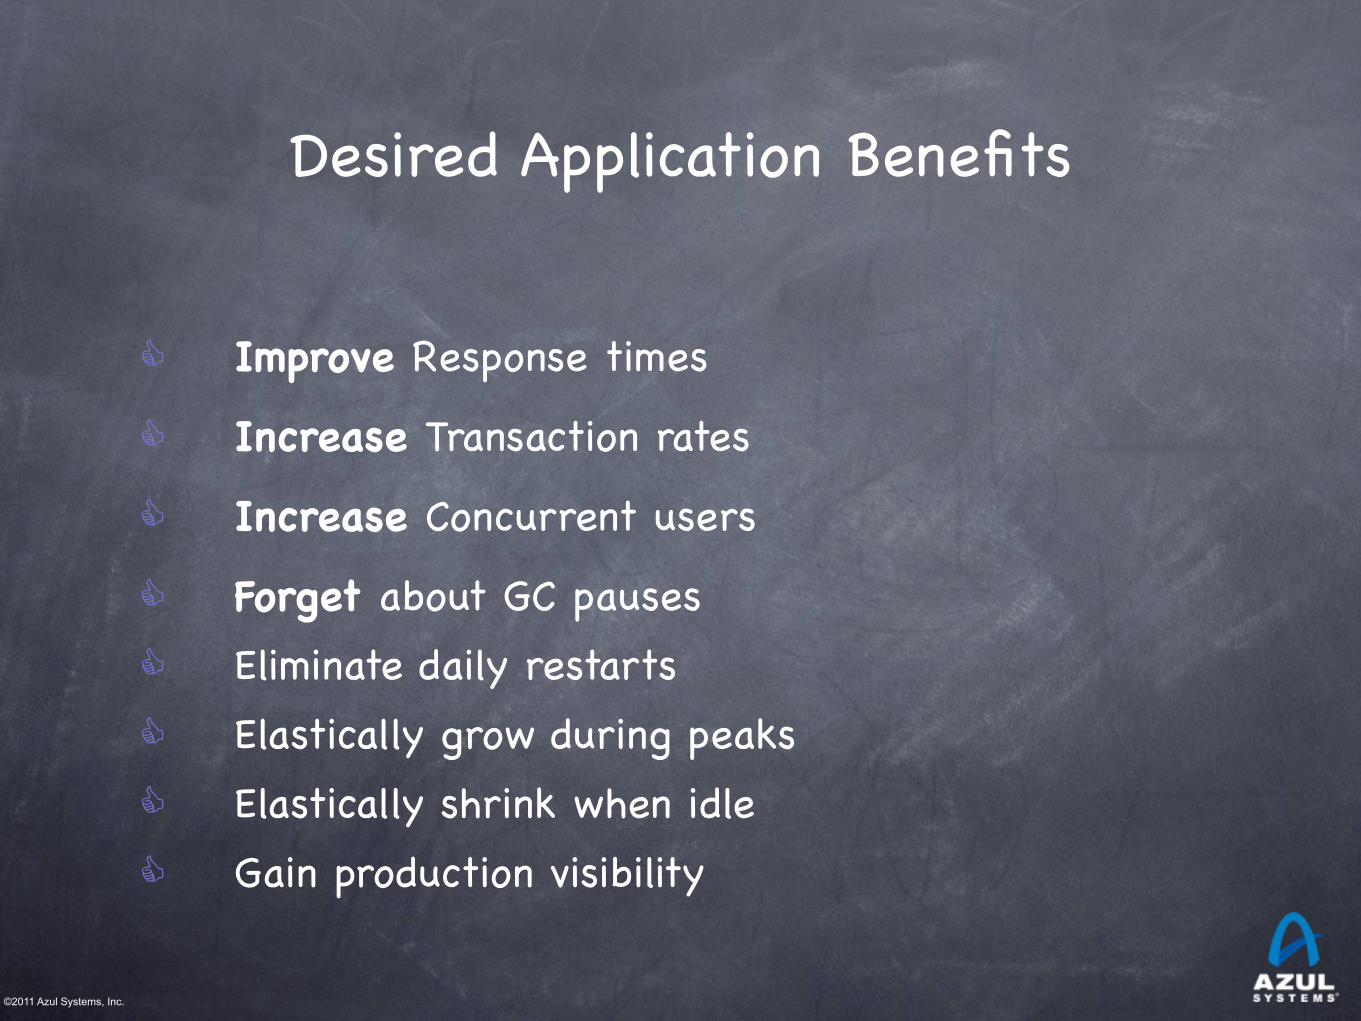
Desired Application Benefits
C Improve Response times
C Increase Transaction rates
C Increase Concurrent users
C Forget about GC pausesC Eliminate daily restarts C Elastically grow during peaksC Elastically shrink when idleC Gain production visibility

©2011 Azul Systems, Inc.
Modern Use Casesü Portal / eCommerce Apps
• High concurrent users with consistent response times
ü Low-latency / Trading Apps• Consistent response times with greater stability & availability
ü Big Data / Large Caching / In-memory Data Analytics• Fast, consistent in-memory data processing
ü SOA / ESB / Messaging Apps• Large data sizes and transactions rates
ü Mission-critical / High Throughput / SLA Apps• Guaranteed performance metrics (i.e. transactions rates)

©2011 Azul Systems, Inc.
Framing the discussion:Garbage Collection at modern server scales
Modern Servers have 10s, even 100s of GB of memory
Each modern x86 core (when actually used) produces garbage at a rate of ¼ - ½ GB/sec +
That’s many GB/sec of allocation in a server
Monolithic stop-the-world operations are the cause of the current Application Memory Wall
Even if they are done “only a few times a day”

©2011 Azul Systems, Inc.
We need to solve the right problems
Focus on the causes of the Application Memory WallScale is artificially limited by responsiveness
Responsiveness must be unlinked from scaleHeap size, Live Set size, Allocation rate, Mutation rate
Responsiveness must be continually sustainableCan’t ignore “rare” events
Eliminate all Stop-The-World FallbacksAt modern server scales, any STW fall back is a failure

©2011 Azul Systems, Inc.
The problems that need solving(areas where the state of the art needs improvement)
Robust Concurrent MarkingIn the presence of high mutation and allocation ratesCover modern runtime semantics (e.g. weak refs)
Compaction that is not monolithic-stop-the-world Stay responsive while compacting many-GB heapsMust be robust: not just a tactic to delay STW compaction[current “incremental STW” attempts fall short on robustness]
Non-monolithic-stop-the-world Generational collection Stay responsive while promoting multi-GB data spikesConcurrent or “incremental STW” may be both be okSurprisingly little work done in this specific area

©2011 Azul Systems, Inc.
Azul’s “C4” Collector Continuously Concurrent Compacting Collector
Concurrent, compacting new generation
Concurrent, compacting old generation
Concurrent guaranteed-single-pass markerOblivious to mutation rateConcurrent ref (weak, soft, final) processing
Concurrent CompactorObjects moved without stopping mutatorReferences remapped without stopping mutatorCan relocate entire generation (New, Old) in every GC cycle
No stop-the-world fallbackAlways compacts, and always does so concurrently

©2011 Azul Systems, Inc.
Sample responsiveness improvement
๏ SpecJBB + Slow churning 2GB LRU Cache๏ Live set is ~2.5GB across all measurements๏ Allocation rate is ~1.2GB/sec across all measurements

©2011 Azul Systems, Inc.
Instance capacity test: “Fat Portal”HotSpot CMS: Peaks at ~ 3GB / 45 concurrent users
* LifeRay portal on JBoss @ 99.9% SLA of 5 second response times
©2011 Azul Systems, Inc.
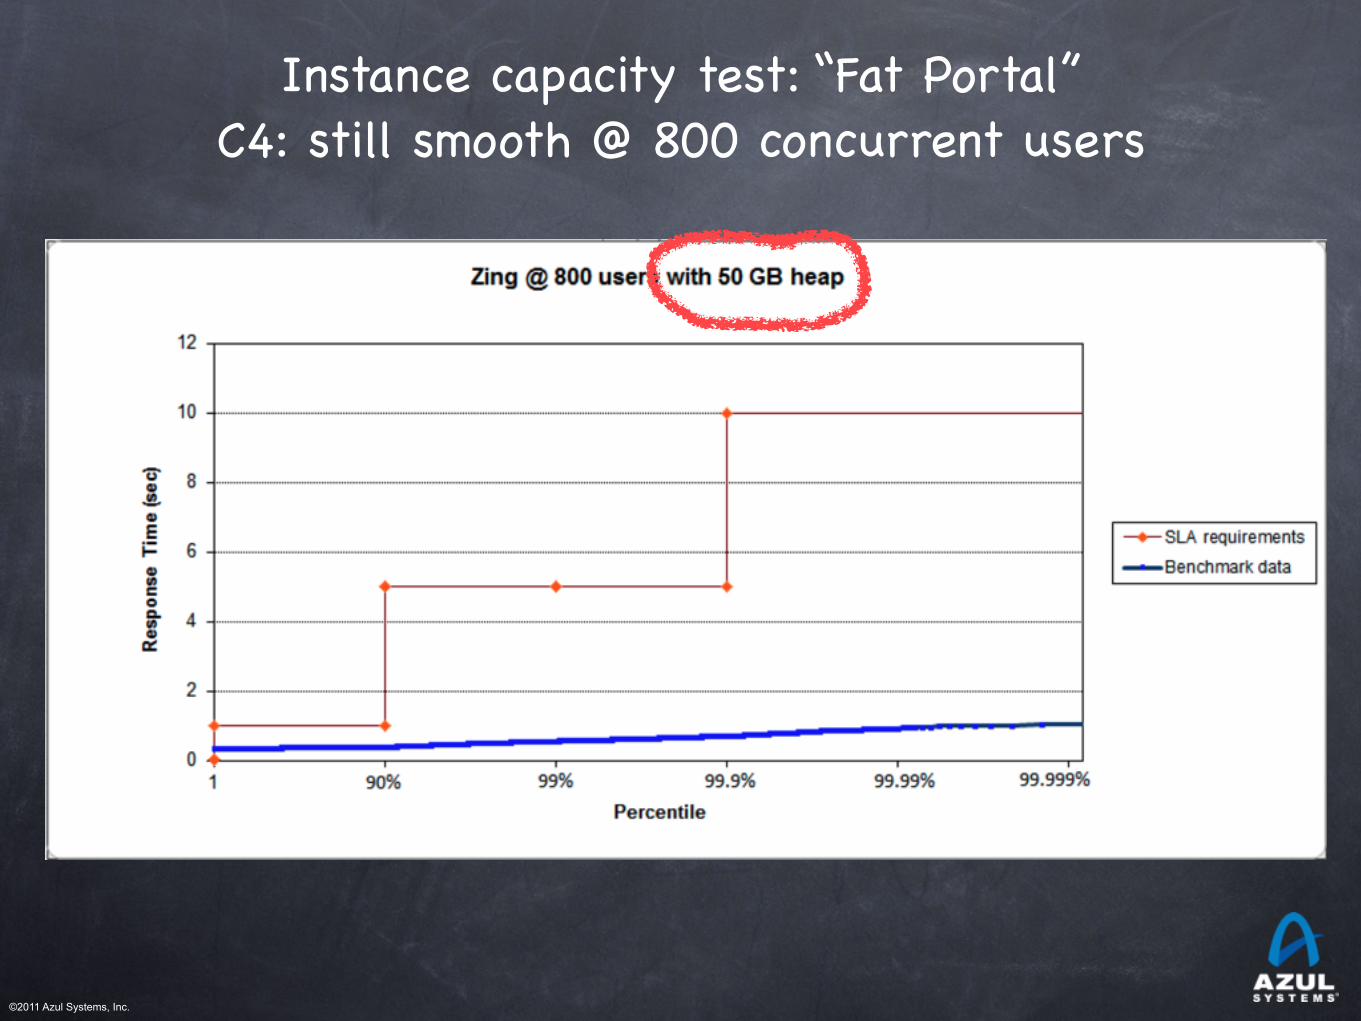
Instance capacity test: “Fat Portal”C4: still smooth @ 800 concurrent users

©2011 Azul Systems, Inc.
Java GC tuning is “hard”…Examples of actual command line GC tuning parameters:
Java -Xmx12g -XX:MaxPermSize=64M -XX:PermSize=32M -XX:MaxNewSize=2g -XX:NewSize=1g -XX:SurvivorRatio=128 -XX:+UseParNewGC -XX:+UseConcMarkSweepGC -XX:MaxTenuringThreshold=0 -XX:CMSInitiatingOccupancyFraction=60 -XX:+CMSParallelRemarkEnabled -XX:+UseCMSInitiatingOccupancyOnly -XX:ParallelGCThreads=12 -XX:LargePageSizeInBytes=256m …
Java –Xms8g –Xmx8g –Xmn2g -XX:PermSize=64M -XX:MaxPermSize=256M-XX:-OmitStackTraceInFastThrow -XX:SurvivorRatio=2 -XX:-UseAdaptiveSizePolicy -XX:+UseConcMarkSweepGC -XX:+CMSConcurrentMTEnabled-XX:+CMSParallelRemarkEnabled -XX:+CMSParallelSurvivorRemarkEnabled-XX:CMSMaxAbortablePrecleanTime=10000 -XX:+UseCMSInitiatingOccupancyOnly-XX:CMSInitiatingOccupancyFraction=63 -XX:+UseParNewGC –Xnoclassgc …

©2011 Azul Systems, Inc.
The complete guide toZing GC tuning
java -Xmx40g

©2011 Azul Systems, Inc.
How can we make full, effective of current server capabilities?
Simple: Deploy Zing 5.0 on Linux


