
Working Paper Research
The internationalization process of firms : From exports to FDI ?
by Paola Conconi, André Sapir and Maurizio Zanardi
October 2010 No 198

NBB WORKING PAPER No. 198 - OCTOBER 2010
Editorial Director
Jan Smets, Member of the Board of Directors of the National Bank of Belgium
Editoral
On October 14-15, 2010 the National Bank of Belgium hosted a Conference on "International trade: threats and opportunities in a globalised world". Papers presented at this conference are made available to a broader audience in the NBB Working Paper Series (www.nbb.be). Statement of purpose:
The purpose of these working papers is to promote the circulation of research results (Research Series) and analytical studies (Documents Series) made within the National Bank of Belgium or presented by external economists in seminars, conferences and conventions organised by the Bank. The aim is therefore to provide a platform for discussion. The opinions expressed are strictly those of the authors and do not necessarily reflect the views of the National Bank of Belgium. Orders
For orders and information on subscriptions and reductions: National Bank of Belgium, Documentation - Publications service, boulevard de Berlaimont 14, 1000 Brussels. Tel +32 2 221 20 33 - Fax +32 2 21 30 42 The Working Papers are available on the website of the Bank: http://www.nbb.be. © National Bank of Belgium, Brussels All rights reserved. Reproduction for educational and non-commercial purposes is permitted provided that the source is acknowledged. ISSN: 1375-680X (print) ISSN: 1784-2476 (online)

The Internationalization Process of Firms:
from Exports to FDI?∗
Paola Conconi
Universite Libre de Bruxelles (ECARES) and CEPR
Andre Sapir
Universite Libre de Bruxelles (ECARES) and CEPR
Maurizio ZanardiUniversite Libre de Bruxelles (ECARES)
Preliminary version
Abstract
We describe a simple model in which domestic firms decide whether to serve aforeign market through exports or horizontal foreign direct investment (FDI). Thischoice involves a trade-off between the higher variable trade costs associated withexports and the higher fixed set-up costs associated with establishing foreign sub-sidiaries. Crucially, firms are uncertain about their profitability in foreign marketsand can only learn it by operating there. To obtain market-specific knowledge,firms may follow an “internationalization process”, serving the foreign market viaexports first and eventually, in some cases, switching to local subsidiary sales. Toassess the validity of the predictions of our model, we use firm-level data on exportand FDI decisions in individual destination markets for all companies registered inBelgium over the period 1997-2008. We show that firms’ strategies to serve foreignmarkets depend not only on the variable and fixed costs associated with exportsand FDI, but also on the export experience they have acquired in that market.
JEL classifications: F10, D21, F13.
Keywords: Exports, FDI, Uncertainty, Experimentation.
∗We are grateful to Emmanuel Dhyne and Harald Fadinger for their useful comments and suggestionsand to Christophe Piette and Marc Mollet for their help and support with data processing. We wishto thank Elena Mattevi for excellent research assistance. Correspondence should be addressed to PaolaConconi, ECARES, Universite Libre de Bruxelles, CP 114, Avenue F. D. Roosevelt 50, 1050 Brussels,Belgium. E-mail: [email protected].
1 Introduction
This paper examines firms’ strategies to serve foreign markets. In particular, it aims
to shed light on the choice between exports and “horizontal” foreign direct investment
(FDI), where the latter refers to an investment in a foreign production facility that is
designed to serve customers in the foreign market. The key question addressed is whether
firms follow an “internationalization process”, serving a foreign market via exports first,
before engaging in FDI. The basic idea is that, if firms must acquire market-specific
knowledge, they will choose to engage first in export activities, which entail higher
variable costs but lower fixed set-up costs, switching to FDI only if they discover that
the foreign market is profitable enough.
A vast literature in international business studies emphasizes that market-specific
knowledge can only be gradually gained through experience in foreign markets, putting
forward the idea that firms follow an “internationalization process” of increasing involve-
ment in foreign markets. One of the earliest and most influential studies in this literature
is by Johanson and Vahlne (1977). They stress the difficulty that firms face to obtain
knowledge about “characteristics of the specific national market — its business climate,
cultural patterns, structure of the market system, and, most importantly characteris-
tics of the individual customer”. To acquire such knowledge, firms follow a process of
increasing involvement in foreign markets, first exporting to individual countries and
eventually, in some cases, establishing foreign subsidiaries there.
In this paper, we provide a simple theoretical model to formalize the idea of firms’
gradual involvement in foreign markets and provide systematic evidence supporting this
internationalization process. In our theoretical analysis, a domestic firm must decide
whether to serve a foreign market, and whether to do so through exports or local sub-
sidiary sales. The firm faces the so-called “proximity-concentration” trade-off between
the higher variable trade costs associated with exports and the higher fixed set-up costs
associated with establishing foreign subsidiaries. In line with the above-mentioned in-
ternational business literature, the firm is uncertain about the profitability of serving
a foreign market and can only learn it by operating there. Under some conditions, the
firm will choose to “test” the foreign market by exporting small amounts first; following
this “trial” phase, it will either exit, expand its export volumes, or switch to FDI. In
this setting, exports and FDI are substitute at any given point in time — since they
represent alternative ways of serving a foreign market — but may be complements over
time — since the knowledge acquired through export experience can lead firms to open
a foreign subsidiary. This implies that countries undergoing trade liberalization reforms
1
may experience first an increase in imports, followed by an increase in FDI.
To assess the validity of the predictions of our model, we employ firm-level data
from the National Bank of Belgium (NBB), which allows us to track the behavior of all
companies registered in Belgium in terms of their export and FDI decisions in individual
destination markets over the period 1997-2008. Using this panel dataset, we investigate
firms’ decisions on how to serve a foreign market over time. In line with previous studies,
our preliminary regression results show that firms’ entry choices in foreign markets de-
pend on the variable and fixed costs associated with exports and FDI. We also find that
the likelihood that a firm will open a subsidiary to serve a foreign market depends on
the export experience acquired by the firm in that market, suggesting that firms follow
a dynamic strategy when serving foreign markets.
Our paper contributes to the literature on the the “proximity-concentration” trade-
off, which has examined the determinants of firms’ choices to serve foreign markets via
exports or horizontal FDI. Our analysis departs from standard theoretical models in
this literature (e.g., Horstmann and Markusen, 1992; Brainard, 1993; Markusen and
Venables, 2000) and from previous empirical studies (e.g., Brainard, 1997) by studying
the role of uncertainty and experimentation in firms’ decision. Recent papers by Help-
man et al. (2004) and Head and Ries (2003) highlight the importance of within-sector
productivity differences in explaining a firm’s choice over export and horizontal FDI and
provide empirical evidence (based on cross-sectional evidence for US and Japanese firms)
showing that the least productive firms serve only the domestic market, the relatively
more productive firms export, and the most productive firms engage in FDI. Rather than
on firm heterogeneity in the domestic market, our analysis focuses on uncertainty and
knowledge acquisition in foreign markers, which can lead firms to switch from export to
FDI.
Our paper is also related to a recent literature on the dynamics of firms’ exporting
strategies. On the empirical front, a series of recent papers have identified some “stylized
facts” about these dynamics. Using data on Colombian manufacturing firms, Eaton et
al. (2008) document that most new exporters do not survive into the next year. New
exporters begin by exporting small amounts but — conditional on survival — they grow
rapidly and account for a substantial proportion of export growth. Further evidence in
line with these patterns is provided by Aeberhardt et al. (2009) for French exporters,
Lawless (2009) for Irish firms, and Albornoz et al. (2010) for Argentinian firms.
Theoretical models seeking to account for these export market dynamics have empha-
sized learning about foreign markets and trade relationships.1 One of the earlier papers
1Standard sunk-cost hysteresis models (e.g., Dixit, 1989; Baldwin and Krugman, 1989; Das et al.,
2

on trade dynamics and incomplete information is Rauch and Watson (2003). They de-
scribe a model with costly search in which a buyer from a developed country is uncertain
about whether exporters from developing countries are able to fill a large scale order.
In this setting, trade relations start small because importers “test” exporters by placing
small orders that reveal their type. Eaton et al. (2010) develop a model where produc-
ers learn about the appeal of their products by devoting resources to finding consumers
and by observing the experiences of competitors. Freund and Pierola (2010) focus on
the incentives of firms to develop new export products in the face of uncertainty about
export costs. Their analysis of the frequency of entry and exit from foreign markets
for Peruvian firms in the non-traditional agricultural sector in Peru shows a process of
“trial and errors”. Arkolakis (2008) builds a model in which firms face convex costs
of advertising and are thus forced to slowly build market share in export markets. An
alternative explanation for why export relations start small and grow if the relationship
is successful is provided by Aeberhardt et al. (2009). Their paper builds on the idea
that exporting firms must find a local distributor in each market; initially, the quality
of the distributor is unknown but exporters learn it as they acquire experience. Most
related to our analysis is the recent work by Albornoz et al. (2010), which our theoretical
model builds on. They develop a tractable model based on learning and experimentation
in which firms discover their profitability in foreign markets only after actually engag-
ing in exporting. Their analysis is focused on firms’ export dynamics across different
destinations and shows that firms experiment their products in one market before even-
tually expanding in other markets (“sequential exporting”). Our focus is instead on how
learning and experimentation within a given destination can lead firms to switch from
exports to FDI (“internationalization process”). To the best of our knowledge, none of
the recent studies on export dynamics has examined the relationship between exports
and FDI and whether export experience can lead firms to open subsidiaries in foreign
countries.
The remainder of this paper is organized as follows. Section 2 presents the theoretical
model. Section 3 describes our dataset and provides some descriptive statistics for
Belgian firms’ involvement in foreign markets. Section 4 and 5 presents our empirical
methodology and our results. Section 6 concludes, discussing ongoing work to extend
our empirical analysis.
2007) and heterogeneous firm models (e.g., Melitz, 2003) emphasize the importance of the start-upcosts that new exporters face and can help to explain patterns of foreign market entry and exit byindividual firms. However, as noted by Ruhl and Willis (2008), they provide little guidance as to whysome exporters are able to expand their foreign sales rapidly while others struggle.
3

2 The model
2.1 Setup
We describe a simple model in which a risk-neutral firm producing good k in its domestic
market must decide whether or not to serve a foreign market i, and whether to do that via
exports or horizontal FDI. To focus on the role of uncertainty and knowledge acquisition
in foreign markets, in our theoretical analysis we abstract from firm heterogeneity in the
domestic market.
Variable costs comprise a unit cost of production, which for simplicity is normalized to
zero, and a unit cost cik for selling to consumers in country i (e.g., capturing distribution
costs in the foreign market). If the firm exports, it bears a unit trade cost equal to τik
(reflecting both transport costs and barriers to trade), and must also incur a fixed cost
equal to FEik (e.g., capturing the costs of dealing with customs procedures). If the firm
engages in FDI, setting up a foreign plant, it avoids trade costs, but incurs higher fixed
costs equal to F Iik > FE
ik .2
The firm faces the following demand in the foreign market:
qik(pik) = aik − pik, (1)
where qik and pik denote the output sold in the foreign market and the corresponding
price.
The main feature of our model is the uncertainty about the profitability of selling
abroad: before serving the foreign market, the firm does not know the unit cost of selling
its product to foreign consumers (captured by cik) and their willingness to pay for its
product (captured by the parameter aik). We denote profitability in the foreign market
by
µik ≡ aik − cik. (2)
We assume that µik is a random variable with a continuous cumulative distribution
function G(.) on the support [µik, µik]. µik is realized with the highest possible demand
intercept (aik) and the lowest possible unit cost (cik); µikis realized instead under the
opposite extreme scenario, i.e., with aik and cik.
To simplify notation, in what follows, we drop country and sector subscripts, with
2In what follows, we will assume that the fixed cost of setting up a foreign subsidiary in a givenmarket is independent of whether a firm has already exported to that market. The implications ofrelaxing this assumption are discussed at the end of this section.
4
the understanding that sectoral variables refer to industry k and country variables refer
to foreign market i. The minimum level of profitability that guarantees that a firm earns
positive profits by entering the foreign market via exports is
µE≡ (FE)1/2 +
τ
2. (3)
We assume the following:
Assumption 1 µ < τ and µ > µE.
The restriction µ < τ ensures that, even if there are no fixed costs associated with
exports (FE = 0), exporting is not always profitable; µ > µE guarantees that exporting
can be profitable under some realizations of µ.
Opening a foreign subsidiary yields positive profits only if µ exceeds the following thresh-
old:
µI≡ (F I)1/2. (4)
To make sure that FDI is profitable for at least some realizations of µ, we impose the
following restriction:
Assumption 2 µ > µI .
For the choice between export and horizontal FDI to be interesting, firms must face
a proximity-concentration trade-off. We thus assume the following:
Assumption 3 µE < µI.
This guarantees that the fixed costs of setting up a foreign subsidiary are large enough
that FDI does not always dominate exports, i.e., F I > 1
4(2(FE)1/2 + τ)2.
2.2 Timing and entry strategies
The timing of a firm’s decisions is as follows:
t = 1: the firm chooses between exporting to the foreign market, setting up a
foreign subsidiary, or not entering the market at all. If the firm decides to enter
via exports (FDI), it pays the per-destination fixed entry cost FE (F I) and chooses
how much to sell in that period. At the end of this period, if the firm has sold a
positive amount, it infers µ from its profit.
5

t = 2: If the firm has not entered the foreign market at t = 1, it decides whether
or not to do so. If the firm has entered at t = 1, it decides whether to exit the
foreign market, serve it under the same mode, or switch mode.
For simplicity, and without loss of generality, we will assume that firms do not
discount the future. Notice that only firms that pay the fixed cost of entering the
foreign market — either FE or F I , depending on the mode of entry — and sell a strictly
positive amount can learn profitability in that market.3
There are three possible strategies to enter the foreign market:
a) No entry in the foreign market at t = 1.
b) Entry via exports at t = 1: in the first period, the firm pays the fixed cost FE,
exports to the foreign market and discovers its profitability; in the second period,
it decides whether to continue serving the foreign market through exports, switch
to FDI, or exit;
c) Entry via FDI at t = 1: in the first period, the firm pays the fixed cost F I and
serves the foreign market through its foreign subsidiary; in the second period, the
firm decides whether to continue serving the foreign market through FDI, switch
to exports, or exit;
In what follows, we solve for the firm’s decisions (in terms of mode of entry and
quantity produced) by backward induction.
2.2.1 Period t = 2
a) No entry at t = 1
In this case, the firm does not enter the foreign market in the second period, earning
zero profits.
b) Entry via exports at t = 1
Consider a firm that has exported to the foreign market in the first period and discovered
its profitability µ. In the second period, it must decide whether to continue exporting,
3The setup is similar to Jovanovic (1982)’s model of firm survival, in which entrepreneurial ability isdispersed in the population of potential entrepreneurs and only known to individuals who have businessexperience.
6

open a foreign subsidiary, or exit the foreign market. If the firm continues to export, its
second-period profits are given by
πEE(τ) ≡ (µ− τ − qEE)qEE. (5)
The firm will choose qEE so as to maximize (5), which yields second-period export sales
equal to
qEE(τ) = Kµ>τµ− τ
2, (6)
where “q” denotes optimal quantity choices and K. is an indicator variable, here de-
noting whether µ > τ . Notice that for lower levels of realized profitability (i.e., µ ≤ τ),
export sales will be equal to zero. Plugging (6) into (5), we can rewrite second-period
export profits as
πEE(τ) = Kµ>τ
(µ− τ
2
)2
. (7)
Alternatively, after discovering its profitability in the foreign market, the firm can decide
to switch to FDI. In this case, its second-period profit are given by
πEI(F I) ≡ (µ− qEI)qEI− F I . (8)
Notice that second-period FDI profits are positive only if µ exceeds the threshold µI
defined in equation (4). Maximization of (8) yields the optimal quantity decision
qEI = Kµ>µI
µ
2. (9)
Profits obtained when opening a subsidiary at t = 2 are thus equal to
πEI(F I) = Kµ>µI
(µ2
4− F I
)
. (10)
Comparing (10) with (7), we can derive the profitability threshold above which a
firm that has exported to the foreign market in the first period will switch from export
to FDI in the second period:
µEI≡
2F I
τ+
τ
2. (11)
Notice that such threshold increases with the fixed costs of setting up a foreign sub-
7
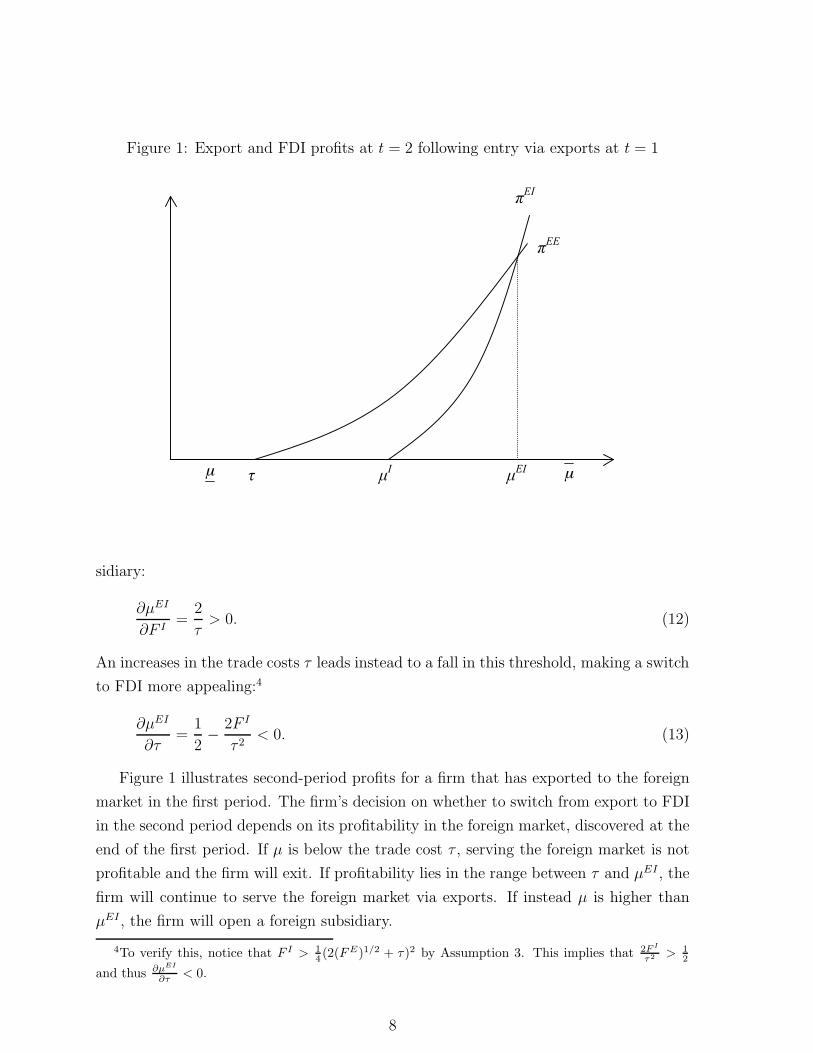
Figure 1: Export and FDI profits at t = 2 following entry via exports at t = 1
1
πEE
πEI
µI
µEI
τ
sidiary:
∂µEI
∂F I=
2
τ> 0. (12)
An increases in the trade costs τ leads instead to a fall in this threshold, making a switch
to FDI more appealing:4
∂µEI
∂τ=
1
2−
2F I
τ 2< 0. (13)
Figure 1 illustrates second-period profits for a firm that has exported to the foreign
market in the first period. The firm’s decision on whether to switch from export to FDI
in the second period depends on its profitability in the foreign market, discovered at the
end of the first period. If µ is below the trade cost τ , serving the foreign market is not
profitable and the firm will exit. If profitability lies in the range between τ and µEI , the
firm will continue to serve the foreign market via exports. If instead µ is higher than
µEI , the firm will open a foreign subsidiary.
4To verify this, notice that F I > 1
4(2(FE)1/2 + τ)2 by Assumption 3. This implies that 2F I
τ2 > 1
2
and thus ∂µEI
∂τ < 0.
8
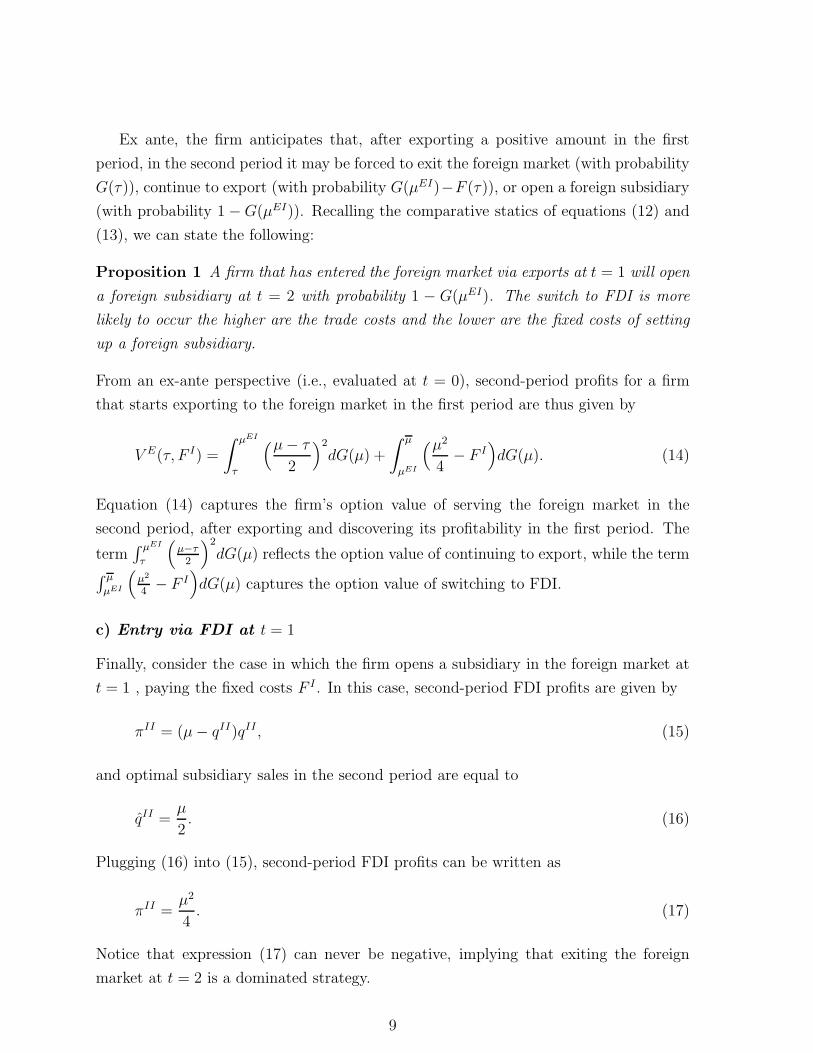
Ex ante, the firm anticipates that, after exporting a positive amount in the first
period, in the second period it may be forced to exit the foreign market (with probability
G(τ)), continue to export (with probability G(µEI)−F (τ)), or open a foreign subsidiary
(with probability 1 −G(µEI)). Recalling the comparative statics of equations (12) and
(13), we can state the following:
Proposition 1 A firm that has entered the foreign market via exports at t = 1 will open
a foreign subsidiary at t = 2 with probability 1 − G(µEI). The switch to FDI is more
likely to occur the higher are the trade costs and the lower are the fixed costs of setting
up a foreign subsidiary.
From an ex-ante perspective (i.e., evaluated at t = 0), second-period profits for a firm
that starts exporting to the foreign market in the first period are thus given by
V E(τ, F I) =
∫ µEI
τ
(µ− τ
2
)2
dG(µ) +
∫ µ
µEI
(µ2
4− F I
)
dG(µ). (14)
Equation (14) captures the firm’s option value of serving the foreign market in the
second period, after exporting and discovering its profitability in the first period. The
term∫ µEI
τ
(
µ−τ2
)2
dG(µ) reflects the option value of continuing to export, while the term∫ µ
µEI
(
µ2
4− F I
)
dG(µ) captures the option value of switching to FDI.
c) Entry via FDI at t = 1
Finally, consider the case in which the firm opens a subsidiary in the foreign market at
t = 1 , paying the fixed costs F I . In this case, second-period FDI profits are given by
πII = (µ− qII)qII , (15)
and optimal subsidiary sales in the second period are equal to
qII =µ
2. (16)
Plugging (16) into (15), second-period FDI profits can be written as
πII =µ2
4. (17)
Notice that expression (17) can never be negative, implying that exiting the foreign
market at t = 2 is a dominated strategy.
9

Figure 2: Export and FDI profits at t = 2 following entry via FDI at t = 1
1
πIE
πII
µE
Exporting in the second period, after having opened a subsidiary in the first, is also
a dominated strategy. To verify this, notice that a firm switching to exports at t = 2
will earn profits equal to
πIE(τ, FE) = Kµ>µE
((µ− τ
2
)2
− FE)
. (18)
Comparing (18) with (17), it is straightforward to verify that, for any level of profitability
µ, ΠII > ΠIE(τ, FE). Thus continuing to serve the foreign market through foreign
subsidiary sales is always preferable to the option of switching to exports. The intuition
for this result is simple: once a firm has paid the fixed costs F I , starting to serve the
foreign market via exports would imply paying additional fixed costs FE and trade costs
τ . We can thus state the following:
Proposition 2 A firm entering the foreign market via FDI at t = 1 will never exit or
switch to exports at t = 2.
Having derived the firm’s expected profits in the second period, we can now move to
the analysis of its entry strategies in the first period.
10

2.2.2 Period t = 1
c) No entry at t = 1
The firm does not enter the foreign market, earning zero profits.
b) Entry via exports at t = 1
From an ex-ante perspective (before discovering its profitability in the foreign market,
at t = 0), the firm will choose export volumes qE to maximize
ωE(τ, FE, F I , qE) ≡
∫ µ
µ
(µ− τ − qE)qEdG(µ)− FE
+KqE>0
∫ µEI
τ
(µ− τ
2
)2
dG(µ) +
∫ µ
µEI
(µ2
4− F I
)
dG(µ)
.(19)
The first line of (19) captures the firm’s expected export profits in the first period. The
second line represents instead expected second-period profits.
Expected first-period profits are positive only if Eµ > µE as defined in (3). In this
case, the firm will choose to export an amount qE = Eµ−τ2
. However, even if Eµ ≤ µE,
the firm may be willing to “test” the foreign market, exporting an arbitrarily small
amount ǫ > 0 in the first period, in order to find out whether serving the foreign market
(via exports or FDI) is actually profitable. For experimentation to occur, the following
condition must hold:
(Eµ− τ − ǫ)ǫ− FE + V E≥ 0. (20)
Expected profits from entering the foreign market at t = 1 via exports can thus be
written as
ΩE(τ, F I , FE, qE) ≡
∫ µ
µE
(µ− τ
2
)2
dG(µ)− FE
+KqE>0
∫ µEI
τ
(µ− τ
2
)2
dG(µ) +
∫ µ
µEI
(µ2
4− F I
)
dG(µ)
.(21)
c) Entry via FDI at t = 1
A firm setting up a foreign subsidiary at t = 1 chooses foreign sales qI to maximize
ωI(F I , qI) ≡
∫ µ
µ
(µ− qI)qIdG(µ)− F I +KqI>0
∫ µ
µ
µ2
4(22)
11

The first two terms capture the firm’s expected profits from FDI at t = 1, while the
second term denotes expected profits at t = 2. Notice that expected first-period profits
are only positive if Eµ exceeds the threshold µI defined in equation (4). However, even if
Eµ < µI , the firm may be willing to engage in FDI and sell an arbitrarily small amount
ǫ > 0 at t = 1. For this to be the case, the following must be true:
(Eµ− ǫ)ǫ− F I +
∫ µ
µ
Eµ2
4≥ 0. (23)
We can thus rewrite the firm’s expected profits from entering the foreign market via FDI
as follows:
ΩI(F I , qI) ≡
∫ µ
µI
(µ)2
4dG(µ)− F I +KqI>0
∫ µ
µ
µ2
4dG(µ). (24)
As discussed above, entering the foreign market via exports has an option value, since
it allows the firm to discover its profitability and to choose between continuing serve the
foreign market via export, switch to FDI, or exit. In contrast, there is no option value in
entering via FDI in the first period, since in this case serving the foreign market through
the foreign affiliate is always the most profitable option in the second period.
2.2.3 Entry strategy
In our analysis above, we have derived export and FDI profits from an ex ante perspec-
tive, i.e., evaluated at t = 0, when the firm does not yet know its profitability. This
allows us to understand how uncertainty about profitability in the foreign market affects
the firm’s decision to enter via exports or FDI.
We have established that, if a firm enters via FDI, it will never exit or switch to
exports as an alternative way to serve the foreign market. If instead a firm enters via
exports, it may continue to serve the market via exports, switch to FDI, or exit. The
firm’s “internationalization strategy” from exports to FDI can be described as follows:
Proposition 3 In the first period, if ΩE(τ, F I , FE) > 0 and ΩE(τ, F I , FE) > ΩI(F I),
the firm will enter the foreign market via exports; in the second period, it will open a
foreign subsidiary with probability 1−G(µEI).
We can show that, when “experimentation” matters, the firm will always follow such a
strategy. To verify this, recall that, if expected profitability is low enough (Eµ ≤ µE),
the firm may be willing to incur a first-period loss to “test” the foreign market, exporting
an arbitrarily small amount to find out whether serving the foreign market (via exports
12

or FDI) is actually profitable. In this case, the firm will never want to enter the foreign
market via FDI. To see this, suppose Eµ = µE. In this case, the firm anticipates that,
if it enters via exports, it will make zero profits in the first period, but positive profits
in the second:
ΩE(τ, F I , FE) =
∫ µEI
τ
(µ− τ
2
)2
dG(µ)
∫ µ
µEI
(µ2
4− F I
)
dG(µ) > 0. (25)
In contrast, when Eµ = µE, expected profits from FDI entry are negative:5
ΩI(F I) =Eµ2
4=
((FE)1/2 + τ2)2
4− F I < 0. (26)
Thus, uncertainty about its profitability in the foreign market can lead the firm to
“experiment” by exporting small amounts first. Following this “trial” phase, the firm
will either exit, expand its export volumes, or switch to FDI.
In our analysis above, we have assumed that setting up a foreign subsidiary is inde-
pendent of whether a firm has already exported to that market. This is the case if FE
includes only fixed costs specific to exporting (e.g., dealing with customs procedures)
and F I captures only the fixed costs linked to FDI (e.g., building a plant in the for-
eign country). However, serving a foreign market may involve other kinds of fixed costs
common to both exports and FDI (e.g., establishing distribution channels, designing a
marketing strategy, dealing with foreign bureaucracies, product standards). In this case,
we could re-write the fixed costs of exports and FDI as FE = K + fE and F I = K + f I ,
respectively, with f I > fE . Changing the formulation of the fixed costs along these
lines will not affect the main results of our analysis, i.e., Propositions 1- 3 will still hold.
Notice, however, that the profitability threshold above which the firm can gain from
opening a foreign subsidiary at t = 2 after having exported at t = 1 will be lower and
equal to µEI = 2fI
τ+ τ
2. This will lead to an increase in the likelihood that the firm will
switch to FDI after entering the foreign market via exports.
To sum up, in our model exports and horizontal FDI are alternative ways in which firms
serve foreign markets. Firms’ should be more (less) likely to export (engage in FDI) the
lower the trade costs and the higher the fixed costs of setting up foreign subsidiaries.
Moreover, firms’ desire to acquire market specific knowledge can lead them to enter a
foreign market via exports first, before switching to FDI. Thus, export experience should
increase the likelihood that firms open foreign subsidiaries.
5This follows from Assumption 3.
13
3 Dataset and descriptive statistics
3.1 Dataset
To assess the validity of the predictions of our model, we exploit detailed information
provided by the National Bank of Belgium (NBB) on foreign activities of all companies
registered in Belgium. For each company, we have information on its exports and foreign
subsidiaries in each destination country, in each year during the 1997-2008 period. This
allows us to track firms’ export and FDI decisions in individual destinations and to
investigate how they serve a foreign market over time.
Our dataset combines information from three main sources (see Table 5 for a defini-
tion of the variables used in our empirical analysis and their sources). The first is the
Central Balance Sheet Data, from which we obtain firm-level information such as size
(e.g., number of employees) and productivity (e.g., value added divided by employment).
The second source is the Foreign Trade Data, which allows us to identify the countries to
which a firm is exporting in a given year and to construct measures of export experience.
(e.g., number of years that the firm has been exporting to a given destination).6 The
last source is the Survey on Foreign Direct Investment, which allows us to identify the
countries and years in which a Belgian firm maintains foreign affiliates.7 From the same
source, we can also determine if the Belgian enterprise is itself part of a multinational
company (i.e., it is the recipient of inward FDI).
We have augmented our dataset with variables derived from other sources. Most
importantly, to control for changes in trade barriers, we have constructed time-varying
averages of applied tariffs by sector and destination, starting from the disaggregate
tariff line data available in the World Integrated Trade Solution (WITS). The procedure
to construct average tariffs is rather cumbersome and involves different steps. The
original tariff data are reported at the 6-digit level of the Harmonized System (HS6),
while the activity of a firm, as identified in the Belgian annual accounts, is defined
by a 5-digit code from the NACE classification. We have thus aggregated HS data
into NACE codes, taking into account that the HS classification changed various times
during our sample period. In order to minimize the subjectivity of such procedure,
we have relied on the fact that WITS also reports average tariffs aggregated at the
3 digits of the ISIC (revision 3) classification. We have found a one-to-one mapping
6Since we only have export data from 1993 and the first year of our sample is 1997, we can onlycalculate export experience considering the last four years
7Notice that a firm may operate different “FDI projects” in a host country. For most of the analysis,we will aggregate all FDI project that a firm has in a given country at time t into one.
14

between 3-digit ISIC and 4-digit NACE classification for about 30% of the NACE codes.
When an ISIC code could map into more than one NACE code, we have recovered
the HS6 tariff lines underlying the ISIC code and manually assigned them to NACE
codes. This procedure was straightforward for about 33% of NACE codes. In the
remaining cases, some discretion had to applied. For about 14% of the NACE codes,
it was impossible to assign only one NACE code to each given HS6. In this case, we
have used a higher level of aggregation by imputing the average tariff of a given ISIC
code to the NACE codes assigned to it.8 Obviously, whenever working directly with
HS6 tariff data, we have tracked the changes in the HS classifications that occurred over
time to ensure consistency. Using this procedures, we have obtained data for tariffs
(MFN or preferential) applied by all available destination countries vis-a-vis imports
from Belgium.
We have also gathered some standard macro variables for the destination countries,
such as GDP and GDP per capita from the World Development Indicators (WDI) and
distance from Belgium (from CEPII). Finally, we have collected information on countries’
“rule of law” from Kaufmann et al. (2009). This captures the enforceability of rules
in a country (with a higher value denoting stronger enforceability), which should affect
the fixed costs associated with serving a foreign market (via exports and even more via
FDI).
In terms of our sample, we focus our analysis on manufacturing firms (i.e., two-digit
NACE codes between 15 and 37) and impose a threshold in terms of employment (i.e.,
minimum 5 employees). Moreover, we only consider destinations outside the EU Single
Market, in which the presence of trade costs gives rise to a proximity-concentration
trade-off. The EU Single Market comprises the 27 EU Member States plus Iceland,
Liechtenstein and Norway through the European Economic Area. Switzerland is also
considered part of it because it has a series of bilateral treaties with the EU. We further
restrict our attention to countries that are member of the WTO (as of 2010). These
criteria still leave us with a large number of Belgian firms that do not export to any
country. In order to keep the analysis manageable, we will consider only firms that have
exported in at least one year during our sample period to at least one country in our set
of possible destinations. These criteria leave us with 6,743 firms.
8In these cases, we are aggregating at a level intermediate between 3 and 4-digit NACE, since anISIC code is a subset of a 3-digit NACE code.
15

3.2 Descriptive statistics
This section provides some preliminary descriptive statistics aimed at understanding how
and where Belgian firms (i.e., firms with a legal status in Belgium) are active. Exploiting
the detailed nature of the available data, we can distinguish three channels in which a
firm can be active in a given country: i) exports; ii) FDI; and iii) licensing.9 Since
only a tiny minority of Belgian firms (i.e., less than 0.4%) engage in foreign markets via
licensing, in what follows we focus on those firms involved in channels i) and ii).
As discussed above, our interest is on export and FDI activities of Belgian firms
outside the Single Market (SM). In Table 1 we thus reports descriptive statistics for all
destinations and then for those ‘Outside SM’. Notice that Belgian firms are very open:
over the entire sample, on average 63% of firms with more than 5 employees export.
The number of Belgian firms is roughly constant during the sample, with the exception
of 2008, when the number of firms decreases substantially as a result of the economic
and financial crisis. The total number of exporting firms is decreasing over time, but
this observation may be partly driven by the fact that the minimum threshold required
for firms to report their intra-EU exports has significantly increased during the sample.
Instead the figures regarding firms exporting outside the single market are not biased,
since the threshold required for firms to report their export activities outside the EU
has remained constant during the sample period (i.e., all transactions whose value is
higher than 1,000 euro or whose weight is bigger than 1,000 Kg). The number of firms
exporting outside the single market has not changed significantly during our sample,
again with the exception of 2008.
Table 1 shows that the number of exporting firms is a subset of total firms and that
firms engaging in outward FDI are an even smaller group (4.6% of the total number of
Belgian firms).10 When considering the location of foreign affiliates, it is clear that most
of them are located within the Single Market. However, the presence outside the Single
Market is clearly increasing over time and reaching a peak in 2006, when the number of
firms with outward FDI is more than double than the number at the beginning of the
sample. Table 2 reports the total number of export and FDI relationships that Belgian
firms maintain every year. The ratio of the figures in Tables 1 and 2 show that firms
export to 11 countries on average. Restricting our attention to the firms that export
outside the Single Market, we see that on average they serve 7 countries outside of
9We do not consider a firm that only imports as being active internationally.10Notice that these statistics have been corrected to eliminate, where possible, a “gap” problem (i.e.,
situations in which the dummy variable for outward FDI of a firm is 0 in a given year, while it is equalto 1 in the previous and subsequent year). The correction implies inputing a 1 when the identifier ofthe FDI project carried out by the firm is the same for the year before and after the occurrence of a 0.
16

Table 1: Population of firms by export and FDI status
Year Total Firms World Outside SMin Belgium Exporting With FDI Exporting With FDI
1997 8,527 5,694 308 3,536 421998 8,763 5,490 346 3,567 471999 8,839 5,516 347 3,593 512000 8,787 5,526 360 3,603 602001 8,667 5,568 435 3,568 772002 8,499 5,521 446 3,532 742003 8,416 5,467 451 3,489 762004 8,350 5,391 464 3,526 842005 8,345 5,307 388 3,548 832006 8,369 5,040 391 3,579 912007 8,372 5,064 379 3,702 902008 7,168 4,561 323 3,371 76
Notes: Only firms with at least 5 employees included. Single Market defined as the EU27 plus Iceland,
Liechtenstein, Norway, and Switzerland.
Table 2: Export and FDI relationships (i.e., all bilateral relationships)
Year Export Relationships FDI RelationshipsWorld Outside SM World Outside SM
1997 55,572 23,420 807 1731998 55,822 23,119 974 2141999 56,025 22,923 1,004 2302000 57,330 23,748 1,127 2832001 58,603 24,135 1,335 3302002 58,693 24,172 1,383 3322003 58,846 24,025 1,369 3362004 60,046 24,517 1,324 3342005 60,774 25,194 1,222 3222006 57,155 25,366 1,312 3902007 57,156 25,591 1,296 3872008 53,408 24,764 1,147 349
Notes: Only firms with at least 5 employees are included. Single Market defined as the EU27 plus
Iceland, Liechtenstein, Norway, and Switzerland. Outward FDI present for only 1 year excluded (except
if occurring in 2008).
17
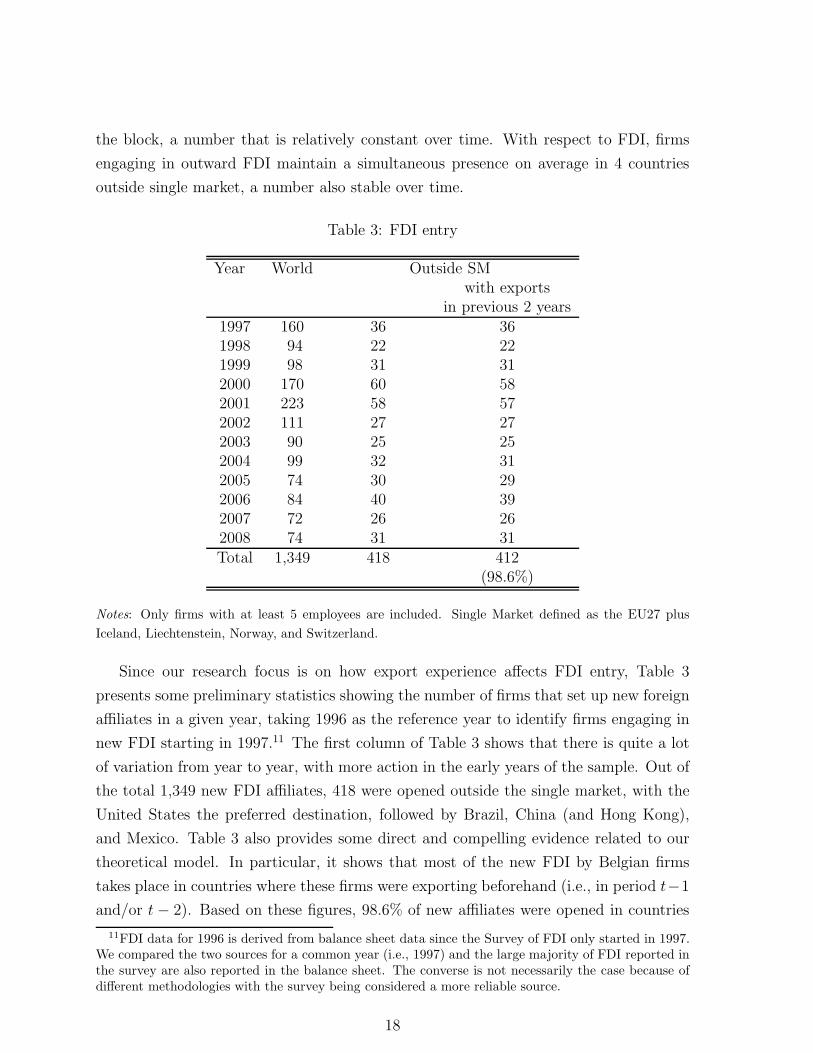
the block, a number that is relatively constant over time. With respect to FDI, firms
engaging in outward FDI maintain a simultaneous presence on average in 4 countries
outside single market, a number also stable over time.
Table 3: FDI entry
Year World Outside SMwith exports
in previous 2 years1997 160 36 361998 94 22 221999 98 31 312000 170 60 582001 223 58 572002 111 27 272003 90 25 252004 99 32 312005 74 30 292006 84 40 392007 72 26 262008 74 31 31Total 1,349 418 412
(98.6%)
Notes: Only firms with at least 5 employees are included. Single Market defined as the EU27 plus
Iceland, Liechtenstein, Norway, and Switzerland.
Since our research focus is on how export experience affects FDI entry, Table 3
presents some preliminary statistics showing the number of firms that set up new foreign
affiliates in a given year, taking 1996 as the reference year to identify firms engaging in
new FDI starting in 1997.11 The first column of Table 3 shows that there is quite a lot
of variation from year to year, with more action in the early years of the sample. Out of
the total 1,349 new FDI affiliates, 418 were opened outside the single market, with the
United States the preferred destination, followed by Brazil, China (and Hong Kong),
and Mexico. Table 3 also provides some direct and compelling evidence related to our
theoretical model. In particular, it shows that most of the new FDI by Belgian firms
takes place in countries where these firms were exporting beforehand (i.e., in period t−1
and/or t − 2). Based on these figures, 98.6% of new affiliates were opened in countries
11FDI data for 1996 is derived from balance sheet data since the Survey of FDI only started in 1997.We compared the two sources for a common year (i.e., 1997) and the large majority of FDI reported inthe survey are also reported in the balance sheet. The converse is not necessarily the case because ofdifferent methodologies with the survey being considered a more reliable source.
18

where the Belgian firms undertaking the FDI were previously exporting. This rate is
only one percentage point lower when considering FDI entry all over the world.
Table 4: Firm size and productivity
Mean St. dev. Min MaxDomestic firmsEmployment 40 73 5 1,542Productivity 0.50 0.91 0.004 43.86
Exporting firmsEmployment 142 446 5 10,283Productivity 0.60 0.49 0.006 12.77
Firms with FDIEmployment 970 1613 12 8,559Productivity 0.77 0.33 0.201 1.67
Notes: Domestic firms defined as those that do not export to any market in our sample 1997; Exporting
firms defined as those that export to at least one market in our sample in 1997. Firms with FDI defined
as those that engage in FDI in at least one markets in our sample in 1997. Employment measured in
units; productivity defined as the ratio of value added to employment (and divided by 100).
Table 4 provides some information on the size and productivity of Belgian firms
engaging in exports and FDI. In particular, we report summary statistics for those firms
in our sample that in the first year of our sample (1997) do not export to any country
(i.e., Domestic firms), those that export to at least one country, and those that engage
in outward FDI in at least one country.12
It should be stressed that these statistics are based on the sample used for our
empirical analysis, which includes only firms that export at least once to at least one
country outside of the Single Market during our sample period. Thus, those firms defined
as ‘Domestic’ would be exporting at some other point in time and, as such, are probably
larger and more productive that truly domestic firms (i.e., firms that do not export to
any country in any period). With this caveat in mind, these descriptive statistics are
in line with the sorting patters suggested by the literature on heterogeneous firms and
trade (e.g., Helpman et al., 2004; Head and Ries, 2003). This suggest that, at a given
point in time, the least productive firms should only sell in the domestic market, the
most productive ones should engage in FDI, while the remaining ones should export.
In our empirical analysis, we will control for size and productivity and show that firms
may change their mode of serving a foreign market over time.
12The same patterns hold for any other year in our sample period.
19

4 Empirical methodology
This section and the next one describe some exploratory regression results, while the
concluding section discusses different ways in which we plan to extend our empirical
analysis.
As a first step, we examine the determinants of a firm’s decision to enter or not a
foreign market, distinguishing between entry via exports and horizontal FDI. The depen-
dent variable in our analysis can thus take three different values, depending on whether
a firm does not serve a foreign market, it exports to that market, or it establishes foreign
subsidiaries. The decision is the result of a continuous latent dependent variable of which
we only observe three discrete outcomes. This latent dependent variable corresponds to
µik in our theoretical model, capturing the profitability of selling good k in destination
market i. Higher values of µik make it more likely, ceteris paribus, that a firm will decide
to serve the foreign market through subsidiary sales.
This setup calls for the use of an ordered probit model, since the three different
categories of the dependent variable can be ordered as a function of µik. The underlying
latent regression model takes the form:
y∗fit = βXfit + εfit (27)
for firm f in destination i at time t where Xfkit is a matrix of regressors (with k denoting
the sector of a firm’s economic activity), β is a vector of coefficients, and εfit is random
error assumed to be normally distributed. However, we do not observe y∗fit but only
three outcomes:
yfit =
0 if κ0 < y∗fit ≤ κ1
1 if κ1 < y∗fit ≤ κ2
2 if κ2 < y∗fit ≤ κ3
(28)
Thus, the probability that one of the three outcomes is realized corresponds to
Prob (yfit = m) = Φ (κm < βXkfit ≤ κm+1) m = 0, 1, 2, (29)
where Φ (·) is the cumulative normal distribution and κ0 and κ3 are taken as −∞ and
+∞, respectively. This is a generalization of a standard probit model but it requires the
estimation of the two cutpoints κ1 and κ2, which split the support of a standard normal
distribution in three regions, corresponding to the three outcomes. These cutpoints bear
a direct link to the theory and we would expect that the data confirm that κ2 > κ1 and
20

that the two are statistically different from each other.
The interpretation of the estimated coefficients is not straightforward because of the
non-linearity of the model and the fact that there are more than two outcomes. In fact,
the marginal effect for the change in the jth regressor is given by
δ [Prob (yfit = m)]
δxjkfit= [φ (κm − βXkfit)− φ (κm+1 − βXkfit)] βj (30)
where φ (·) is the normal density function. Clearly, the marginal effects depend on the full
dataset, the full set of estimated coefficients (including the cutpoints), and the outcome
of interest.13 In order to facilitate the interpretation of the estimated coefficients, in the
tables we report marginal effects for the export and FDI outcomes expressed in terms
of percentage changes of the baseline predicted probability of each outcome.
If the ordered probit model represents the obvious choice given our theoretical model,
it does impose some structure on the data in that it presumes that there is an order
in the outcomes that we observe. An alternative empirical strategy is to avoid any
assumption on the internationalization process that firms follow and not postulate an
order in the choice between exports and FDI as a way to serve a foreign market. As
an alternative empirical strategy, we will thus estimate a multinomial logit, where the
dependent variable is the same as above but the outcome yfit = 2 is not interpreted to
follow after yfit = 1. In this case, the probability of any outcome is modeled as
Prob (yikt = m) =eβ
mXikt
eβ0Xikt + eβ
2Xikt + eβ3Xikt
m = 0, 1, 2 (31)
where one of the three vectors βm needs to be taken as the reference category and set
to zero since the model is underidentified. Then, the remaining two vectors measure the
change in the likelihood of an outcome with respect to this reference category, which we
take to be the yikt = 0 outcome. Also in this case, the estimated coefficients are not
fully informative; hence, we report the marginal effects of the regressors.
Moving to the regressors included in Xfit, we can distinguish variables that are firm
specific, firm-destination specific, sector-destination specific, and destination specific.
Variables like employment, productivity and multinational status fall within the first
group while the export experience of a firm in a given destination market is an important
firm-destination variable since our theoretical model tells us that this an important
determinant of a possible decision to switch from exports to FDI as a way to serve a
13The only general result available is that the sign of βj unambigously determine the sign of themarginal effect for the first (i.e., opposite sign of βj) and last outcome (i.e., same sign as βj).
21

foreign market. We measure export experience with a dummy variable equal to one if a
firm has exported to a particular market at any time during the past four years. Four
years is the maximum window of time that we can consider without encountering any
censoring issue, since our sample begins in 1997 and we have detailed export data from
1993.
Applied tariffs at the 4-digit NACE code are the only (time-varying) sector-destination
variable at our disposal, and one that is crucial since our theoretical model suggests that
the variable costs of exporting (i.e., tariffs and transportation costs) are the main de-
terminant of the mode of entry into a foreign market. The construction of this variable
is quite cumbersome (see discussion in Section 3.1) and is also hampered by the many
missing observations from the original source. In order to reduce the number of missing
observations, we construct our tariff variable as the average of the available applied tar-
iffs during the previous three years. Among the destination specific regressors, distance
between Belgium and the foreign market (measured as the distance between capital
cities) complements tariffs as a proxy for the transport costs associated with exporting.
Moreover, we include GDP to control for the size of the destination country and GDP
per capita as a measure of its level of development. Finally, and especially important for
the FDI decision, we control for the quality of the legal institutions in the destination
market using the variable “rule of law” from Kaufmann et al. (2009).
Finally, we will include year and sector (at the 2-digit NACE level) fixed effects. The
inclusion of destination fixed effects will force us to drop the other destination-specific
regressors, but it would allow us to control in the most comprehensive way for any time-
invariant feature of the foreign markets. Faced with this trade off, we experiment with
both strategies.
5 Preliminary results
Table 6 reports the marginal effects for the decision of exporting and engaging in FDI
for three specifications based on the sample of firms with more than five employees.14
The first two columns refer to what we call a minimal specification where we include
destination (together with year and sectoral) fixed effects instead of the destination-
specific variables. In the second specification we replace the destination fixed effects
with destination specific variables while the last specification focuses on OECD high
14The estimation of an ordered probit model delivers one set of estimated coefficients for all thepossible outcomes. However, the calculation of the marginal effects is specific for each outcome (seeSection 3 for details).
22
income countries in an effort to disentangle horizontal from vertical FDI.
Considering the results from the first specification, with the exception of one regressor
for the FDI decision, the marginal effects present the expected signs and they are all
significant. In particular, it is clear that there is sorting in the various modes, as the
larger and more productive a firm is and the more likely it is that it exports and opens
foreign affiliates. Being itself a part of a multinational company makes it also more likely
to penetrate foreign markets. With respect to the variables that our theoretical model
highlights as key determinants of foreign activities, export experience shows a huge effect
on the probability to export, which is consistent with the significant hysteresis of the
export decision due to substantial sunk costs to export. Importantly, export experience
is also a very important determinant of the likelihood of deciding to engage in FDI.
As expected, higher tariffs discourage exports. However, contrary to what predicted by
our theoretical model, they also discourage FDI. This result is confirmed in some other
specifications and can be explained in different ways (see discussion in Section 6). The
cutpoints are statistically different from each other and confirm the ordering suggested
by our model. Their numerical values clearly suggest that FDI is a rare event since it
occurs only in a very small region in the right tail of the normal distribution.
In the second specification, we replace the destination fixed effects with some destination-
specific variables. First of all, we notice that the Pseudo R2 does not change much,
indicating that most of the variation in the data is not simply explained by the time-
invariant effects. As for the marginal effects, they are broadly in line with those in the
first specification except that the tariff rates are not significant anymore. As for the
destination-specific variables, we see that also distance is insignificant while GDP and
GDP per capita exert a negative and positive effect, respectively, on both outcomes. Fi-
nally, the rule of law presents the expected and positive effect, as stronger enforceability
leads to higher probability of exporting and engaging in FDI.
Admittedly, we are assuming that all instances of FDI observed in our data are of the
horizontal type. However, this is most likely not the case. A way to possibly be more
confident that we are restricting our attention to horizontal FDI is to restrict our sample
of destinations to countries with levels of income per capita similar to Belgium. It has
been argued that horizontal FDI is most prevalent among countries that are similar
in both size and in relative endowments and that “it is similarities between countries
rather than differences that generate the most multinational activities” (Markusen and
Maskus (2001), p. 39). Recent studies that try to distinguish horizontal and vertical
FDI (e.g., Carr et al., 2001; Markusen and Maskus, 2002; Blonigen et al., 2003) also
conclude that horizontal FDI emerge when countries are of similar size and share similar
23

relative factor endowments, while Vertical FDI emerge when countries differ in relative
factor endowments.
Following this reasoning, the last specification in Table 6 only considers OECD high
income countries (i.e., Australia, Canada, Japan, New Zealand, South Korea, and United
States) as possible destinations. Restricting the sample in this way does not seem to
improve the results on our tariffs, which turn out not to be a significant determinant
of either export or FDI. Still, it has to be recognized that tariffs for these high income
countries were already quite low at the beginning of the sample and did not vary much
during the period. Considering the cutpoints, we see that they “move” to the left since
it is much more likely that Belgian based firms export and engage in FDI towards this
large markets.
In Table 7, we exclude firms with fewer than 20 employees, as our model does not apply
to self-employment or very small firms (see also Acemoglu et al., 2009; Alfaro et al.,
2010). In this case, the sample is dramatically reduced but the three specifications do
not provide substantially different results, with one exception. In fact, when considering
the variables destination specific variables (i.e., the second specification), the marginal
effect of the tariff is negative for the export decision but insignificant for FDI, which is
closer to what we would expect based on our theoretical model if FDI is motivated by
tariff-jumping.
Finally, in Table 8 we report the marginal effects for the same specifications as in Table 6
but estimated using a multinomial logit. This provides a more flexible estimation, since it
does not impose the ordering of the three outcomes, and yields two set of coefficients for
the export and FDI decision (taking the outcome yikt = 0 as the reference category). The
results are very much similar to those obtained with an ordered probit. The only notable
difference is that in second specification distance has a negative effect on exports but a
positive one on FDI, as we would expect if distance captures variable costs associated
with exports (e.g., transportation costs), which should make FDI more likely. However,
the effect of tariffs on FDI is still negative (when significant).
In conclusion, our preliminary results suggest that export experience is an important
determinant for the decision of a firm to engage in FDI, as predicted by our theoretical
model. However, we fail to find robust evidence concerning the role that tariffs and
distance should play in the determining the choice between export and FDI. Nevertheless,
as discussed below, the richness of our dataset should allow us to improve considerably
upon the results obtained so far.
24

6 Future work
In Section 2, we have presented a simple model in which firms can serve foreign markets
in two alternative ways: by exporting their products to foreign customers, or by estab-
lishing foreign subsidiaries. Firms invest abroad when the gains from avoiding trade
costs outweigh the costs of maintaining capacity in multiple markets. Differently from
standard models on the proximity-concentration trade off, we assume that firms are
uncertain about foreign market conditions and can only gain market-specific knowledge
through experience. This allows us to formalize the idea of firms’ “internationalization
process” put forward by a vast international business literature: firms may choose to
“test” a foreign market by engaging first in export activities, which entail higher vari-
able costs but lower fixed set-up costs, switching to FDI only if they learn that their
profitability in that market is high enough.
In our empirical analysis so far, we have started to explore the dynamics of firms’
choices to serve individual market destinations, to verify whether export experience
affects a firm’s decision to open a foreign subsidiary. To do so, we have employed firm-
level data from the National Bank of Belgium, which allows us to track the behavior of all
companies registered in Belgium in terms of their export and FDI decisions in individual
destination markets over the period 1997-2008. In line with previous studies, we find that
firms’ entry choice in foreign markets depend on the variable and fixed costs associated
with exports and FDI. Moreover, the likelihood of opening a foreign subsidiary depends
on the export experience acquired in that market. This provides some very preliminary
evidence suggesting that knowledge acquisition may play an important role in firms’s
internationalization decisions.
In the remaining of this section, we discuss three avenues we intend to pursue to
obtain more compelling evidence for the idea that uncertainty can lead to export exper-
imentation and gradual involvement of firms in foreign markets.
Measuring export experience
In our empirical analysis so far, we have examined the determinants of whether a firm
is active — in terms of exports or FDI — in a given market and year. Notice that, by
focusing on the presence in foreign markets, we are not able to precisely measure export
experience. This is because, for some firms in our dataset — those that were already
exporting to a given market in 1993, the first year for which we have export data — we
do not know when they entered the foreign market. Due to this censoring issue, and
given that we have FDI data since 1997, we have measured experience based on whether
25

the firm was exporting to a market during the previous four years.
To better capture the role of uncertainty and knowledge acquisition, we plan to focus
next on firms’ entry into new markets. In particular, we will restrict our analysis to firms
that have started exporting to a given destination from 1997, conditional on not having
exported to this market in the previous four years for which we have detailed trade
data. This will allow us to construct a time-varying measure of export experience for
each firm f entering market i at time t. For example, for a Belgian firm that starts
exporting to China in 1997, its export experience will vary between 0 (in 1997) and
10 years (in 2008, the last year of our dataset). Moreover, we can also define export
experience in terms of the volume of exports, and especially its pattern over time to
discern a possible “test” phase. Given these more precise indicators, we will examine
how the experience acquired by the firm since entering a new destination affects its
decision to open a subsidiary there.
Identifying horizontal FDI
Our theoretical analysis focuses on horizontal FDI as an alternative to exports for serv-
ing foreign markets. In our empirical analysis, we would thus like to identify those
subsidiaries that are established only to produce the firm’s final good in the host coun-
try, so as to avoid paying the trade costs. One way to do so would be to use information
on sales of foreign affiliates (see, for example, Helpman et al., 2004). Unfortunately,
this information is not available in the NBB Survey of Foreign Direct Investment. As
a result, the analysis presented in Section 5 includes information on all foreign sub-
sidiaries of Belgian firms, independently of their purpose. Some of these affiliates may
reflect the international fragmentation of production and vertical FDI motives. Foreign
subsidiaries may also be established to set up distribution centers and sales offices to
penetrate export markets.15 Notice that, in both cases — and particularly in the case
of foreign affiliates established for distribution purposes — exports and FDI should be
complements. This could explain why in some of the specifications reported in Tables
6-8, the marginal effect of tariffs on the FDI decision is negative.
In future work, we plan to use two strategies to better identify whether the FDI
affiliates are horizontal in nature. First, our model suggests that exports and FDI
should be substitutes, so there should be a switch in the mode of entry: once a firm
engages in horizontal FDI, exports to that country should fall. As a matter of fact, the
15The importance of export-supporting FDI and of distribution networks is emphasized by recenttheoretical and empirical studies (e.g., Krautheim, 2007; Arkolakis, 2008; Aeberhardt et al., 2009) andsurveys of outward FDI activities (e.g., China Council for the Promotion of International Trade, 2010).
26

data provide some evidence of a switch. Taking t to be the year in which a firm initiates
outward FDI activity, we can calculate the growth rate of exports between (t− 2 and t)
and between (t and t + 2). For the destinations in our sample, the growth rate before
FDI entry is 57.49% while after entry is 22.73, which is statistically lower at 1% than
in the pre-FDI period. Although a “perfect” substitution would lead to a -100% growth
rate in the second period, the huge decrease that we observe is indicative that there
is a change in the export patterns once FDI takes place. Along this line, we plan to
exploit the detailed nature of the trade dataset at our disposal (which reports firm-level
export and import data by destination and by product (defined at the 8-digit level of
the combined nomenclature). Comparing the exports of a firm’s “core products” to a
given market before and after the opening of a foreign subsidiary, we should observe
a substantial fall in the exports of these products in the presence of horizontal FDI.16
Thus, detailed export data should allow us to isolate horizontal FDI from other types
of foreign investment (vertical FDI and distribution subsidiaries) and establish a better
link between our theoretical and empirical analysis.
Another possibility is to exploit the (spotty) intra-firm trade data available from the
Survey of Foreign Direct Investment. As already suggested, a problem in following this
approach is data availability and its internal consistency (e.g., intra-firm values should
be smaller than reported import/export data for that country). However, exploiting the
available information about intra-firm trade may allow us to rule out some FDI as being
vertical. In order not to confound the effects of multiple FDI projects in a given foreign
market, we will focus only on the first FDI entry (i.e., the first time a Belgian firm opens
a subsidiary in given foreign market)17 and classify FDI as being horizontal only if it
does not lead to substantial intra-firm trade.
Regional markets
A growing recent literature (e.g., Motta and Norman, 1996; Grossman et al., 2006)
stresses the increasing importance of yet a different type of FDI. This is the so-called
“export-platform” FDI, whereby a firm sets up a production facility in a given market
with the objective of serving mainly other destinations in the region. Our theoretical
model applies equally well to this scenario once we re-interpret a foreign market as a
region or trade bloc. To account for export-platform FDI empirically, however, the
16To identify the firm’s core products, we will follow focus on products with the highest export salesto the world, as in Mayer et al. (2010).
17In our preliminary results, FDI occurs in market i whenever a firm declares that it has foreignoperations in this country, independently of the number of distinct FDI project that may coexist incountry i.
27

variables capturing the firm’s mode of entry should not be constructed with the data
of the country where the investment takes place, but using information on the greater
regional market that can be served from that base.
References
Aeberhardt, R., Buono, I., and H. Fadinger (2009). “Learning and the Dynamics
of Exporting: Theory and Evidence from French Firms,” mimeo, University of
Vienna.
Acemoglu, D., P. Aghion, R. Griffith, and F. Zilibotti (2009). “Vertical Integration and
Technology: Theory and Evidence,” Journal of European Economic Association,
forthcoming.
Alfaro, L., P. Conconi, H. Fadinger, and A. F. Newman (2010). “ Trade Policy and
Firm Boundaries”, NBER Working Paper 16118.
Albornoz, F., H. Calvo-Pardo, G. Corcos, and E. Ornelas (2010). “Sequential Export-
ing,” CEP Discussion Paper No 974.
Arkolakis, C. (2008). “Market Penetration Costs and the New Consumers Margin in
International Trade,” NBER Working Paper No. 14214
Baldwin, R. E., and P. Krugman (1989). “Persistent Trade Effects of Large Exchange
Rate Shocks,” Quarterly Journal of Economics 104, 635-54.
Blonigen, B. A., R. B. Davies, and K. Head. (2003). “Estimating The Knowledge-
Capital Model Of The Multinational Enterprise: Comment,” American Economic
Review 93, 980-994.
Blonigen, B. A., and M. Wang (2010). “Inappropriate Pooling of Wealthy and Poor
Countries in Empirical FDI Studies,” in T. Moran, E. Graham, and M. Blomstrom
(eds.), Does Foreign Direct Investment Promote Development?. Washington, DC:
Institute for International Economics, 221-243.
Brainard, S. L. (1993). “A Simple Theory of Multinational Corporations and Trade
with a Trade- Off Between Proximity and Concentration,” NBER Working Paper
No. 4269.
Brainard, L. S. (1997). “An Empirical Assessment of the Proximity- Concentration
Trade-off Between Multinational Sales and Trade,” American Economic Review
87, 520-544.
28

Carr, D, J. R. Markusen, and K. Maskus (2001). “Estimating the Knowledge-Capital
Model of the Multinational Enterprise,” American Economic Review 91, 693-708.
China Council for the Promotion of International Trade (2010). “Survey on Current
Conditions and Intention of Outbound Investment by Chinese Enterprises”.
Das, S., M. J. Roberts, and J. R. Tybout (2007). “Market Entry Costs, Producer
Heterogeneity, and Export Dynamics,” Econometrica 75, 837-873.
Dixit, A. (1989). “Hysteresis, Import Penetration, and Exchange Rate Pass-Through,”
Quarterly Journal of Economics 104, 205-228.
Eaton, J., M. Eslava, M. Kugler, and J. Tybout (2008). “The Margins of Entry into Ex-
port Markets: Evidence from Colombia,” in Helpman, H., Marin, D., and Verdier,
T. (eds.), The Organization of Firms in a Global Economy. Cambridge, MA:
Harvard University Press.
Eaton, J., M. Eslava, C. J. Krizan, M. Kugler, and J. Tybout (2010). “A Search and
Learning Model of Export Dynamics,” mimeo, Pennsylvania State University.
Feenstra, R. C. (2002). “U.S. Exports, 1972-1994: With State Exports and Other U.S.
Data,” NBER Working Paper No. 5990.
Freund, C. L., and M. D. Pierola (2010). “Export Entrepreneurs: Evidence from Peru,”
World Bank Policy Research Working Paper 5407.
Grossman, G. M., E. Helpman, and A. Szeidl (2006). “Optimal Integration Strategies
for the Multinational Firm,” Journal of International Economics 70, 216-238.
Head, K., and J. Ries (2003). “Heterogeneity and the FDI versus Export Decision of
Japanese Manufacturer,” Journal of the Japanese and International Economies
17, 448-467.
Helpman, E., Melitz, M. J., and S. R. Yeaple (2004). “Export versus FDI with Hetero-
geneous Firms,” American Economic Review 94, 300-316.
Horstmann, I., and J. R. Markusen (1992). “Endogenous Market Structures in Inter-
national Trade,” Journal of International Economics 32, 109-29.
Johanson, J., and Vahlne, J.-E. (1977). “The Internationalization Process of the Firm: A
Model of Knowledge Development and Increasing Foreign Market Commitments,”
Journal of International Business Studies 8, 23-32.
Jovanovic, B. (1982). “Selection and the Evolution of Industry,” Econometrica 50,
649-670.
29
Kaufmann, D., A. Kraay, and M. Mastruzzi (2009). “Governance Matters VIII: Ag-
gregate and Individual Governance Indicators, 1996-2008,” World Bank Policy
Research Working Paper 4978.
Krautheim, S. (2007). “Export-Supporting FDI,” EUI Working Papers ECO 2007/24.
Lawless, M. (2009). “Firm Export Dynamics and the Geography of Trade,” Journal of
International Economics 77, 245-254.
Markusen, J.R., and K. E. Maskus (2001). “General-Equilibrium Approaches to the
Multinational Firm: a Review of Theory and Evidence,” in M. Blomstroem, and
L. S. Goldberg, (eds.), Topics in International Economics: A Festschrift in Honor
of Robert E. Lipsey. Chicago: University Chicago Press.
Markusen, J. R., and K. Maskus (2002). “Discriminating Among Alternative Theories
of the Multinational Enterprise,” Review of International Economics 10, 694-707.
Markusen, J. R., and A. J. Venables (2000). “The Theory of Endowment, Intra-industry
and Multinational Trade,” Journal of International Economics 52, 209-34.
Mayer, T., M. J. Melitz, and G. I. P. Ottaviano (2010). “Market size, Competition, and
the Product Mix of Exporters,” mimeo.
Melitz, M. J. (2003). “The Impact of Trade on Intra-Industry Reallocations and Ag-
gregate Industry Productivity,” Econometrica 71, 1695-1725.
Motta, M., and G. Norman . “Does Economic Integration Cause Foreign Direct Invest-
ment?,” International Economic Review 37, 757-783.
Muuls, M., and M. Pisu (2007). “Imports and Exports at the Level of the Firm:
Evidence from Belgium,” BNB Working Paper No. 114.
Rauch, J., and J. Watson (2003). “Starting Small in an Unfamiliar Environment,”
International Journal of Industrial Organization 21, 1021-1042.
Ruhl, K., and J. Willis (2008). “New Exporter Dynamics,” mimeo, New York University.
30

Tab
le5:
Definitionof
variab
lesan
dsources
Variable
Definition
Sou
rce
Employment f
tFirm’sem
ployment(inhundreds)
NBB
CentralBalance
SheetData
Productivityft
Valueadded
divided
byfirm
’sem
ployment(inhundreds)
NBB
CentralBalance
SheetData
MNEft
Dummyequalto
1iffirm
receives
inward
FDI
NBB
Survey
onForeignDirectInvestm
ent
Export
experience
fit
Dummyequalto
1iffirm
exported
tocountryiin
anyoftheprevious4years
NBB
ForeignTradeData
Tariffkit
Averageofapplied
tariffsbycountryiin
sectork(N
ACE
4digit)
WIT
S
Distance
iDistance
betweenBruxellesandthecapitalofcountryi(inthousandskm)
CEPII
GDPit
Gross
DomesticProduct
inconstant2000US$(inbillions)
WDI
GDP
per
capitait
Gross
DomesticProduct
per
capitain
constant2000US$(inthousands)
WDI
Rule
oflaw
itRule
oflaw
index
(higher
values
indicate
betterlegalenforceability)
Kaufm
annetal.
(2009)
31

Tab
le6:
Ordered
probitregression
s(firm
swithmorethan
5em
ployees)
(1)
(2)
(3)
Allcountries
Allcountries
OECD
highincome
Exports
FDI
Exports
FDI
Exports
FDI
Employment f
t6.68%***
6.00%***
5.45%***
4.70%***
0.78%***
6.46%***
Productivityft
0.73%***
0.65%***
0.60%***
0.52%***
1.80%***
14.81%
***
MNEft
139.16%***
118.71%***
113.44%***
91.81%
***
-0.71%
-5.69%
Exportexperience
fit
2533.39%
***
124.43%***
4752.24%
***
120.30%***
83.16%
***
113.93***
Tariff
kit
-41.17%***
-37.02%***
-4.02%
-3.47%
0.37%
3.08%
Distance
i0.25%
0.22%
GDPit
-0.004%***
-0.004%***
GDPper
capita i
t1.34%***
1.15%***
Rule
oflaw
it7.93%***
6.84%***
Yearfixed
effects
included
included
included
Sectorfixed
effects
included
included
included
Destinationfixed
effects
included
not
included
included
Cutpoint1
2.70
3.04
0.53
Cutpoint2
6.31
6.63
3.79
Observations
3,529,921
3,442,793
59,701
Log
pseudolikelihood
-93,194.15
-93,954.64
-27,555.07
PseudoR
20.87
0.87
0.26
Notes:
Thedep
endentvariable
equals0iffirm
fdoes
notexport
anddoes
notengagein
FDIin
countryiattimet,equals1if
itexportsto
countryi,andequals2ifithassubsidiaries
incountryi.
Marginaleff
ects
calculatedatthesample
mean(except
those
forem
ploymentandproductivityforthe‘FDI’outcome,
whichare
setattheaveragevalueoftheobservationsforwhich
thedep
endentvariable
equals
1).
Marginaleff
ects
expressed
aspercentagechanges
inestimatedbaselineprobabilityforan
infinitesim
alchangein
each
regressor(calculatedasdiscretechanges
from
0to
1fordummyvariables).Statisticalsignificance
basedonrobust
standard
errors
inparenthesis;***denotessignificance
at1%
level;**5%
level.
32

Tab
le7:
Ordered
probitregression
s(firm
swithmorethan
20em
ployees)
(1)
(2)
(3)
Allcountries
Allcountries
OECD
highincome
Exports
FDI
Exports
FDI
Exports
FDI
Employment f
t5.64%***
5.26%***
4.58%***
4.12%***
0.67%***
5.86%***
Productivityft
17.04%
***
15.90%
***
13.98%
***
12.57%
***
1.47%***
21.44%
***
MNEft
89.31%
***
81.28%
***
75.55%
***
65.69%
***
-2.05%
***
-17.06%***
Exportexperience
fit
1074.77%
***
121.97%***
242.41%***
118.42%***
80.46%
***
113.20%***
Tariff
kit
-39.59%***
-36.93%***
-6.81%
***
-6.12%
-0.44%
-3.89%
Distance
i0.43%***
0.39%
GDPit
-0.003%***
-0.002%***
GDPper
capita i
t0.82%***
0.74%***
Rule
oflaw
it8.74%***
7.86%***
Yearfixed
effects
included
included
included
Sectorfixed
effects
included
included
included
Destinationfixed
effects
included
not
included
included
Cutpoint1
2.67
3.00
0.57
Cutpoint2
6.28
6.58
3.79
Observations
2,088,340
2,035,795
47,968
Log
pseudolikelihood
-76,916.59
-77,473.83
-22,429.18
PseudoR
20.87
0.86
0.25
Notes:
asin
Table
6
33

Tab
le8:
Multinom
iallogitregression
s(firm
swithmorethan
5em
ployees)
(1)
(2)
(3)
Allcountries
Allcountries
OECD
highincome
Exports
FDI
Exports
FDI
Exports
FDI
Employment f
t2.62%***
7.30%***
2.70%***
4.95%***
0.25%***
6.44%***
Productivityft
0.43%***
0.72%***
0.43%***
0.49%***
0.80%***
22.44%
***
MNEft
59.44%
***
56.47%
***
59.73%
***
22.72%
***
-0.70%
10.51%
Exportexperience
fit
4648.09%
***
105.23%***
676.87%***
97.71%
***
84.80%
***
79.76%
***
Tariff
kit
-16.62%**
-154.11%
***
2.78%
-85.35%***
0.88%
40.29%
Distance
i-0.75%
***
2.90%***
GDPit
-0.01%
***
0.02%***
GDPper
capita i
t1.77%***
-1.50%
***
Rule
oflaw
it-2.94%
**27.86%
***
Yearfixed
effects
included
included
included
Sectorfixed
effects
included
included
included
Destinationfixed
effects
included
not
included
included
Observations
3,529,921
3,442,793
59,701
Log
pseudolikelihood
-87,825.53
-90,191.36
-26,531.73
PseudoR
20.88
0.87
0.29
Notes:
asin
Table
6
34

NBB WORKING PAPER No. 198 - OCTOBER 2010 35
NATIONAL BANK OF BELGIUM - WORKING PAPERS SERIES 1. "Model-based inflation forecasts and monetary policy rules", by M. Dombrecht and R. Wouters, Research
Series, February 2000. 2. "The use of robust estimators as measures of core inflation", by L. Aucremanne, Research Series,
February 2000. 3. "Performances économiques des Etats-Unis dans les années nonante", by A. Nyssens, P. Butzen and
P. Bisciari, Document Series, March 2000. 4. "A model with explicit expectations for Belgium", by P. Jeanfils, Research Series, March 2000. 5. "Growth in an open economy: Some recent developments", by S. Turnovsky, Research Series, May
2000. 6. "Knowledge, technology and economic growth: An OECD perspective", by I. Visco, A. Bassanini and
S. Scarpetta, Research Series, May 2000. 7. "Fiscal policy and growth in the context of European integration", by P. Masson, Research Series, May
2000. 8. "Economic growth and the labour market: Europe's challenge", by C. Wyplosz, Research Series, May
2000. 9. "The role of the exchange rate in economic growth: A euro-zone perspective", by R. MacDonald,
Research Series, May 2000. 10. "Monetary union and economic growth", by J. Vickers, Research Series, May 2000. 11. "Politique monétaire et prix des actifs: le cas des États-Unis", by Q. Wibaut, Document Series, August
2000. 12. "The Belgian industrial confidence indicator: Leading indicator of economic activity in the euro area?", by
J.-J. Vanhaelen, L. Dresse and J. De Mulder, Document Series, November 2000. 13. "Le financement des entreprises par capital-risque", by C. Rigo, Document Series, February 2001. 14. "La nouvelle économie" by P. Bisciari, Document Series, March 2001. 15. "De kostprijs van bankkredieten", by A. Bruggeman and R. Wouters, Document Series, April 2001. 16. "A guided tour of the world of rational expectations models and optimal policies", by Ph. Jeanfils,
Research Series, May 2001. 17. "Attractive prices and euro - Rounding effects on inflation", by L. Aucremanne and D. Cornille,
Documents Series, November 2001. 18. "The interest rate and credit channels in Belgium: An investigation with micro-level firm data", by
P. Butzen, C. Fuss and Ph. Vermeulen, Research series, December 2001. 19. "Openness, imperfect exchange rate pass-through and monetary policy", by F. Smets and R. Wouters,
Research series, March 2002. 20. "Inflation, relative prices and nominal rigidities", by L. Aucremanne, G. Brys, M. Hubert, P. J. Rousseeuw
and A. Struyf, Research series, April 2002. 21. "Lifting the burden: Fundamental tax reform and economic growth", by D. Jorgenson, Research series,
May 2002. 22. "What do we know about investment under uncertainty?", by L. Trigeorgis, Research series, May 2002. 23. "Investment, uncertainty and irreversibility: Evidence from Belgian accounting data" by D. Cassimon,
P.-J. Engelen, H. Meersman and M. Van Wouwe, Research series, May 2002. 24. "The impact of uncertainty on investment plans", by P. Butzen, C. Fuss and Ph. Vermeulen, Research
series, May 2002. 25. "Investment, protection, ownership, and the cost of capital", by Ch. P. Himmelberg, R. G. Hubbard and
I. Love, Research series, May 2002. 26. "Finance, uncertainty and investment: Assessing the gains and losses of a generalised non-linear
structural approach using Belgian panel data", by M. Gérard and F. Verschueren, Research series, May 2002.
27. "Capital structure, firm liquidity and growth", by R. Anderson, Research series, May 2002. 28. "Structural modelling of investment and financial constraints: Where do we stand?", by J.-B. Chatelain,
Research series, May 2002. 29. "Financing and investment interdependencies in unquoted Belgian companies: The role of venture
capital", by S. Manigart, K. Baeyens, I. Verschueren, Research series, May 2002. 30. "Development path and capital structure of Belgian biotechnology firms", by V. Bastin, A. Corhay,
G. Hübner and P.-A. Michel, Research series, May 2002. 31. "Governance as a source of managerial discipline", by J. Franks, Research series, May 2002. 32. "Financing constraints, fixed capital and R&D investment decisions of Belgian firms", by M. Cincera,
Research series, May 2002.

NBB WORKING PAPER No. 198 - OCTOBER 2010 36
33. "Investment, R&D and liquidity constraints: A corporate governance approach to the Belgian evidence", by P. Van Cayseele, Research series, May 2002.
34. "On the origins of the Franco-German EMU controversies", by I. Maes, Research series, July 2002. 35. "An estimated dynamic stochastic general equilibrium model of the euro area", by F. Smets and
R. Wouters, Research series, October 2002. 36. "The labour market and fiscal impact of labour tax reductions: The case of reduction of employers' social
security contributions under a wage norm regime with automatic price indexing of wages", by K. Burggraeve and Ph. Du Caju, Research series, March 2003.
37. "Scope of asymmetries in the euro area", by S. Ide and Ph. Moës, Document series, March 2003. 38. "De autonijverheid in België: Het belang van het toeleveringsnetwerk rond de assemblage van
personenauto's", by F. Coppens and G. van Gastel, Document series, June 2003. 39. "La consommation privée en Belgique", by B. Eugène, Ph. Jeanfils and B. Robert, Document series,
June 2003. 40. "The process of European monetary integration: A comparison of the Belgian and Italian approaches", by
I. Maes and L. Quaglia, Research series, August 2003. 41. "Stock market valuation in the United States", by P. Bisciari, A. Durré and A. Nyssens, Document series,
November 2003. 42. "Modeling the term structure of interest rates: Where do we stand?", by K. Maes, Research series,
February 2004. 43. "Interbank exposures: An ampirical examination of system risk in the Belgian banking system", by
H. Degryse and G. Nguyen, Research series, March 2004. 44. "How frequently do prices change? Evidence based on the micro data underlying the Belgian CPI", by
L. Aucremanne and E. Dhyne, Research series, April 2004. 45. "Firms' investment decisions in response to demand and price uncertainty", by C. Fuss and
Ph. Vermeulen, Research series, April 2004. 46. "SMEs and bank lending relationships: The impact of mergers", by H. Degryse, N. Masschelein and
J. Mitchell, Research series, May 2004. 47. "The determinants of pass-through of market conditions to bank retail interest rates in Belgium", by
F. De Graeve, O. De Jonghe and R. Vander Vennet, Research series, May 2004. 48. "Sectoral vs. country diversification benefits and downside risk", by M. Emiris, Research series,
May 2004. 49. "How does liquidity react to stress periods in a limit order market?", by H. Beltran, A. Durré and P. Giot,
Research series, May 2004. 50. "Financial consolidation and liquidity: Prudential regulation and/or competition policy?", by
P. Van Cayseele, Research series, May 2004. 51. "Basel II and operational risk: Implications for risk measurement and management in the financial
sector", by A. Chapelle, Y. Crama, G. Hübner and J.-P. Peters, Research series, May 2004. 52. "The efficiency and stability of banks and markets", by F. Allen, Research series, May 2004. 53. "Does financial liberalization spur growth?", by G. Bekaert, C.R. Harvey and C. Lundblad, Research
series, May 2004. 54. "Regulating financial conglomerates", by X. Freixas, G. Lóránth, A.D. Morrison and H.S. Shin, Research
series, May 2004. 55. "Liquidity and financial market stability", by M. O'Hara, Research series, May 2004. 56. "Economisch belang van de Vlaamse zeehavens: Verslag 2002", by F. Lagneaux, Document series,
June 2004. 57. "Determinants of euro term structure of credit spreads", by A. Van Landschoot, Research series, July
2004. 58. "Macroeconomic and monetary policy-making at the European Commission, from the Rome Treaties to
the Hague Summit", by I. Maes, Research series, July 2004. 59. "Liberalisation of network industries: Is electricity an exception to the rule?", by F. Coppens and D. Vivet,
Document series, September 2004. 60. "Forecasting with a Bayesian DSGE model: An application to the euro area", by F. Smets and
R. Wouters, Research series, September 2004. 61. "Comparing shocks and frictions in US and euro area business cycle: A Bayesian DSGE approach", by
F. Smets and R. Wouters, Research series, October 2004. 62. "Voting on pensions: A survey", by G. de Walque, Research series, October 2004. 63. "Asymmetric growth and inflation developments in the acceding countries: A new assessment", by S. Ide
and P. Moës, Research series, October 2004. 64. "Importance économique du Port Autonome de Liège: rapport 2002", by F. Lagneaux, Document series,
November 2004.

NBB WORKING PAPER No. 198 - OCTOBER 2010 37
65. "Price-setting behaviour in Belgium: What can be learned from an ad hoc survey", by L. Aucremanne and M. Druant, Research series, March 2005.
66. "Time-dependent versus state-dependent pricing: A panel data approach to the determinants of Belgian consumer price changes", by L. Aucremanne and E. Dhyne, Research series, April 2005.
67. "Indirect effects – A formal definition and degrees of dependency as an alternative to technical coefficients", by F. Coppens, Research series, May 2005.
68. "Noname – A new quarterly model for Belgium", by Ph. Jeanfils and K. Burggraeve, Research series, May 2005.
69. "Economic importance of the Flemish maritime ports: Report 2003", by F. Lagneaux, Document series, May 2005.
70. "Measuring inflation persistence: A structural time series approach", by M. Dossche and G. Everaert, Research series, June 2005.
71. "Financial intermediation theory and implications for the sources of value in structured finance markets", by J. Mitchell, Document series, July 2005.
72. "Liquidity risk in securities settlement", by J. Devriese and J. Mitchell, Research series, July 2005. 73. "An international analysis of earnings, stock prices and bond yields", by A. Durré and P. Giot, Research
series, September 2005. 74. "Price setting in the euro area: Some stylized facts from Individual Consumer Price Data", by E. Dhyne,
L. J. Álvarez, H. Le Bihan, G. Veronese, D. Dias, J. Hoffmann, N. Jonker, P. Lünnemann, F. Rumler and J. Vilmunen, Research series, September 2005.
75. "Importance économique du Port Autonome de Liège: rapport 2003", by F. Lagneaux, Document series, October 2005.
76. "The pricing behaviour of firms in the euro area: New survey evidence, by S. Fabiani, M. Druant, I. Hernando, C. Kwapil, B. Landau, C. Loupias, F. Martins, T. Mathä, R. Sabbatini, H. Stahl and A. Stokman, Research series, November 2005.
77. "Income uncertainty and aggregate consumption”, by L. Pozzi, Research series, November 2005. 78. "Crédits aux particuliers - Analyse des données de la Centrale des Crédits aux Particuliers", by
H. De Doncker, Document series, January 2006. 79. "Is there a difference between solicited and unsolicited bank ratings and, if so, why?", by P. Van Roy,
Research series, February 2006. 80. "A generalised dynamic factor model for the Belgian economy - Useful business cycle indicators and
GDP growth forecasts", by Ch. Van Nieuwenhuyze, Research series, February 2006. 81. "Réduction linéaire de cotisations patronales à la sécurité sociale et financement alternatif", by
Ph. Jeanfils, L. Van Meensel, Ph. Du Caju, Y. Saks, K. Buysse and K. Van Cauter, Document series, March 2006.
82. "The patterns and determinants of price setting in the Belgian industry", by D. Cornille and M. Dossche, Research series, May 2006.
83. "A multi-factor model for the valuation and risk management of demand deposits", by H. Dewachter, M. Lyrio and K. Maes, Research series, May 2006.
84. "The single European electricity market: A long road to convergence", by F. Coppens and D. Vivet, Document series, May 2006.
85. "Firm-specific production factors in a DSGE model with Taylor price setting", by G. de Walque, F. Smets and R. Wouters, Research series, June 2006.
86. "Economic importance of the Belgian ports: Flemish maritime ports and Liège port complex - Report 2004", by F. Lagneaux, Document series, June 2006.
87. "The response of firms' investment and financing to adverse cash flow shocks: The role of bank relationships", by C. Fuss and Ph. Vermeulen, Research series, July 2006.
88. "The term structure of interest rates in a DSGE model", by M. Emiris, Research series, July 2006. 89. "The production function approach to the Belgian output gap, estimation of a multivariate structural time
series model", by Ph. Moës, Research series, September 2006. 90. "Industry wage differentials, unobserved ability, and rent-sharing: Evidence from matched worker-firm
data, 1995-2002", by R. Plasman, F. Rycx and I. Tojerow, Research series, October 2006. 91. "The dynamics of trade and competition", by N. Chen, J. Imbs and A. Scott, Research series, October
2006. 92. "A New Keynesian model with unemployment", by O. Blanchard and J. Gali, Research series, October
2006. 93. "Price and wage setting in an integrating Europe: Firm level evidence", by F. Abraham, J. Konings and
S. Vanormelingen, Research series, October 2006. 94. "Simulation, estimation and welfare implications of monetary policies in a 3-country NOEM model", by
J. Plasmans, T. Michalak and J. Fornero, Research series, October 2006.

NBB WORKING PAPER No. 198 - OCTOBER 2010 38
95. "Inflation persistence and price-setting behaviour in the euro area: A summary of the Inflation Persistence Network evidence ", by F. Altissimo, M. Ehrmann and F. Smets, Research series, October 2006.
96. "How wages change: Micro evidence from the International Wage Flexibility Project", by W.T. Dickens, L. Goette, E.L. Groshen, S. Holden, J. Messina, M.E. Schweitzer, J. Turunen and M. Ward, Research series, October 2006.
97. "Nominal wage rigidities in a new Keynesian model with frictional unemployment", by V. Bodart, G. de Walque, O. Pierrard, H.R. Sneessens and R. Wouters, Research series, October 2006.
98. "Dynamics on monetary policy in a fair wage model of the business cycle", by D. De la Croix, G. de Walque and R. Wouters, Research series, October 2006.
99. "The kinked demand curve and price rigidity: Evidence from scanner data", by M. Dossche, F. Heylen and D. Van den Poel, Research series, October 2006.
100. "Lumpy price adjustments: A microeconometric analysis", by E. Dhyne, C. Fuss, H. Peseran and P. Sevestre, Research series, October 2006.
101. "Reasons for wage rigidity in Germany", by W. Franz and F. Pfeiffer, Research series, October 2006. 102. "Fiscal sustainability indicators and policy design in the face of ageing", by G. Langenus, Research
series, October 2006. 103. "Macroeconomic fluctuations and firm entry: Theory and evidence", by V. Lewis, Research series,
October 2006. 104. "Exploring the CDS-bond basis", by J. De Wit, Research series, November 2006. 105. "Sector concentration in loan portfolios and economic capital", by K. Düllmann and N. Masschelein,
Research series, November 2006. 106. "R&D in the Belgian pharmaceutical sector", by H. De Doncker, Document series, December 2006. 107. "Importance et évolution des investissements directs en Belgique", by Ch. Piette, Document series,
January 2007. 108. "Investment-specific technology shocks and labor market frictions", by R. De Bock, Research series,
February 2007. 109. "Shocks and frictions in US business cycles: A Bayesian DSGE approach", by F. Smets and R. Wouters,
Research series, February 2007. 110. "Economic impact of port activity: A disaggregate analysis. The case of Antwerp", by F. Coppens,
F. Lagneaux, H. Meersman, N. Sellekaerts, E. Van de Voorde, G. van Gastel, Th. Vanelslander, A. Verhetsel, Document series, February 2007.
111. "Price setting in the euro area: Some stylised facts from individual producer price data", by Ph. Vermeulen, D. Dias, M. Dossche, E. Gautier, I. Hernando, R. Sabbatini, H. Stahl, Research series, March 2007.
112. "Assessing the gap between observed and perceived inflation in the euro area: Is the credibility of the HICP at stake?", by L. Aucremanne, M. Collin and Th. Stragier, Research series, April 2007.
113. "The spread of Keynesian economics: A comparison of the Belgian and Italian experiences", by I. Maes, Research series, April 2007.
114. "Imports and exports at the level of the firm: Evidence from Belgium", by M. Muûls and M. Pisu, Research series, May 2007.
115. "Economic importance of the Belgian ports: Flemish maritime ports and Liège port complex - Report 2005", by F. Lagneaux, Document series, May 2007.
116. "Temporal distribution of price changes: Staggering in the large and synchronization in the small", by E. Dhyne and J. Konieczny, Research series, June 2007.
117. "Can excess liquidity signal an asset price boom?", by A. Bruggeman, Research series, August 2007. 118. "The performance of credit rating systems in the assessment of collateral used in Eurosystem monetary
policy operations", by F. Coppens, F. González and G. Winkler, Research series, September 2007. 119. "The determinants of stock and bond return comovements", by L. Baele, G. Bekaert and K. Inghelbrecht,
Research series, October 2007. 120. "Monitoring pro-cyclicality under the capital requirements directive: Preliminary concepts for developing a
framework", by N. Masschelein, Document series, October 2007. 121. "Dynamic order submission strategies with competition between a dealer market and a crossing
network", by H. Degryse, M. Van Achter and G. Wuyts, Research series, November 2007. 122. "The gas chain: Influence of its specificities on the liberalisation process", by C. Swartenbroekx,
Document series, November 2007. 123. "Failure prediction models: Performance, disagreements, and internal rating systems", by J. Mitchell and
P. Van Roy, Research series, December 2007. 124. "Downward wage rigidity for different workers and firms: An evaluation for Belgium using the IWFP
procedure", by Ph. Du Caju, C. Fuss and L. Wintr, Research series, December 2007.

NBB WORKING PAPER No. 198 - OCTOBER 2010 39
125. "Economic importance of Belgian transport logistics", by F. Lagneaux, Document series, January 2008. 126. "Some evidence on late bidding in eBay auctions", by L. Wintr, Research series, January 2008. 127. "How do firms adjust their wage bill in Belgium? A decomposition along the intensive and extensive
margins", by C. Fuss, Research series, January 2008. 128. "Exports and productivity – Comparable evidence for 14 countries", by The International Study Group on
Exports and Productivity, Research series, February 2008. 129. "Estimation of monetary policy preferences in a forward-looking model: A Bayesian approach", by
P. Ilbas, Research series, March 2008. 130. "Job creation, job destruction and firms' international trade involvement", by M. Pisu, Research series,
March 2008. 131. "Do survey indicators let us see the business cycle? A frequency decomposition", by L. Dresse and
Ch. Van Nieuwenhuyze, Research series, March 2008. 132. "Searching for additional sources of inflation persistence: The micro-price panel data approach", by
R. Raciborski, Research series, April 2008. 133. "Short-term forecasting of GDP using large monthly datasets - A pseudo real-time forecast evaluation
exercise", by K. Barhoumi, S. Benk, R. Cristadoro, A. Den Reijer, A. Jakaitiene, P. Jelonek, A. Rua, G. Rünstler, K. Ruth and Ch. Van Nieuwenhuyze, Research series, June 2008.
134. "Economic importance of the Belgian ports: Flemish maritime ports, Liège port complex and the port of Brussels - Report 2006", by S. Vennix, Document series, June 2008.
135. "Imperfect exchange rate pass-through: The role of distribution services and variable demand elasticity", by Ph. Jeanfils, Research series, August 2008.
136. "Multivariate structural time series models with dual cycles: Implications for measurement of output gap and potential growth", by Ph. Moës, Research series, August 2008.
137. "Agency problems in structured finance - A case study of European CLOs", by J. Keller, Document series, August 2008.
138. "The efficiency frontier as a method for gauging the performance of public expenditure: A Belgian case study", by B. Eugène, Research series, September 2008.
139. "Exporters and credit constraints. A firm-level approach", by M. Muûls, Research series, September 2008.
140. "Export destinations and learning-by-exporting: Evidence from Belgium", by M. Pisu, Research series, September 2008.
141. "Monetary aggregates and liquidity in a neo-Wicksellian framework", by M. Canzoneri, R. Cumby, B. Diba and D. López-Salido, Research series, October 2008.
142 "Liquidity, inflation and asset prices in a time-varying framework for the euro area, by Ch. Baumeister, E. Durinck and G. Peersman, Research series, October 2008.
143. "The bond premium in a DSGE model with long-run real and nominal risks", by G. D. Rudebusch and E. T. Swanson, Research series, October 2008.
144. "Imperfect information, macroeconomic dynamics and the yield curve: An encompassing macro-finance model", by H. Dewachter, Research series, October 2008.
145. "Housing market spillovers: Evidence from an estimated DSGE model", by M. Iacoviello and S. Neri, Research series, October 2008.
146. "Credit frictions and optimal monetary policy", by V. Cúrdia and M. Woodford, Research series, October 2008.
147. "Central Bank misperceptions and the role of money in interest rate rules", by G. Beck and V. Wieland, Research series, October 2008.
148. "Financial (in)stability, supervision and liquidity injections: A dynamic general equilibrium approach", by G. de Walque, O. Pierrard and A. Rouabah, Research series, October 2008.
149. "Monetary policy, asset prices and macroeconomic conditions: A panel-VAR study", by K. Assenmacher-Wesche and S. Gerlach, Research series, October 2008.
150. "Risk premiums and macroeconomic dynamics in a heterogeneous agent model", by F. De Graeve, M. Dossche, M. Emiris, H. Sneessens and R. Wouters, Research series, October 2008.
151. "Financial factors in economic fluctuations", by L. J. Christiano, R. Motto and M. Rotagno, Research series, to be published.
152. "Rent-sharing under different bargaining regimes: Evidence from linked employer-employee data", by M. Rusinek and F. Rycx, Research series, December 2008.
153. "Forecast with judgment and models", by F. Monti, Research series, December 2008. 154. "Institutional features of wage bargaining in 23 European countries, the US and Japan", by Ph. Du Caju,
E. Gautier, D. Momferatou and M. Ward-Warmedinger, Research series, December 2008. 155. "Fiscal sustainability and policy implications for the euro area", by F. Balassone, J. Cunha, G. Langenus,
B. Manzke, J Pavot, D. Prammer and P. Tommasino, Research series, January 2009.

NBB WORKING PAPER No. 198 - OCTOBER 2010 40
156. "Understanding sectoral differences in downward real wage rigidity: Workforce composition, institutions, technology and competition", by Ph. Du Caju, C. Fuss and L. Wintr, Research series, February 2009.
157. "Sequential bargaining in a New Keynesian model with frictional unemployment and staggered wage negotiation", by G. de Walque, O. Pierrard, H. Sneessens and R. Wouters, Research series, February 2009.
158. "Economic importance of air transport and airport activities in Belgium", by F. Kupfer and F. Lagneaux, Document series, March 2009.
159. "Rigid labour compensation and flexible employment? Firm-Level evidence with regard to productivity for Belgium", by C. Fuss and L. Wintr, Research series, March 2009.
160. "The Belgian iron and steel industry in the international context", by F. Lagneaux and D. Vivet, Document series, March 2009.
161. "Trade, wages and productivity", by K. Behrens, G. Mion, Y. Murata and J. Südekum, Research series, March 2009.
162. "Labour flows in Belgium", by P. Heuse and Y. Saks, Research series, April 2009. 163. "The young Lamfalussy: An empirical and policy-oriented growth theorist", by I. Maes, Research series,
April 2009. 164. "Inflation dynamics with labour market matching: Assessing alternative specifications", by K. Christoffel,
J. Costain, G. de Walque, K. Kuester, T. Linzert, S. Millard and O. Pierrard, Research series, May 2009. 165. "Understanding inflation dynamics: Where do we stand?", by M. Dossche, Research series, June 2009. 166. "Input-output connections between sectors and optimal monetary policy", by E. Kara, Research series,
June 2009. 167. "Back to the basics in banking? A micro-analysis of banking system stability", by O. De Jonghe,
Research series, June 2009. 168. "Model misspecification, learning and the exchange rate disconnect puzzle", by V. Lewis and
A. Markiewicz, Research series, July 2009. 169. "The use of fixed-term contracts and the labour adjustment in Belgium", by E. Dhyne and B. Mahy,
Research series, July 2009. 170. "Analysis of business demography using markov chains – An application to Belgian data”, by F. Coppens
and F. Verduyn, Research series, July 2009. 171. "A global assessment of the degree of price stickiness - Results from the NBB business survey", by
E. Dhyne, Research series, July 2009. 172. "Economic importance of the Belgian ports: Flemish maritime ports, Liège port complex and the port of
Brussels - Report 2007", by C. Mathys, Document series, July 2009. 173. "Evaluating a monetary business cycle model with unemployment for the euro area", by N. Groshenny,
Research series, July 2009. 174. "How are firms' wages and prices linked: Survey evidence in Europe", by M. Druant, S. Fabiani and
G. Kezdi, A. Lamo, F. Martins and R. Sabbatini, Research series, August 2009. 175. "Micro-data on nominal rigidity, inflation persistence and optimal monetary policy", by E. Kara, Research
series, September 2009. 176. "On the origins of the BIS macro-prudential approach to financial stability: Alexandre Lamfalussy and
financial fragility", by I. Maes, Research series, October 2009. 177. "Incentives and tranche retention in securitisation: A screening model", by I. Fender and J. Mitchell,
Research series, October 2009. 178. "Optimal monetary policy and firm entry", by V. Lewis, Research series, October 2009. 179. "Staying, dropping, or switching: The impacts of bank mergers on small firms", by H. Degryse,
N. Masschelein and J. Mitchell, Research series, October 2009. 180. "Inter-industry wage differentials: How much does rent sharing matter?", by Ph. Du Caju, F. Rycx and
I. Tojerow, Research series, October 2009. 181. "Empirical evidence on the aggregate effects of anticipated and unanticipated US tax policy shocks", by
K. Mertens and M. O. Ravn, Research series, November 2009. 182. "Downward nominal and real wage rigidity: Survey evidence from European firms", by J. Babecký,
Ph. Du Caju, T. Kosma, M. Lawless, J. Messina and T. Rõõm, Research series, November 2009. 183. "The margins of labour cost adjustment: Survey evidence from European firms", by J. Babecký,
Ph. Du Caju, T. Kosma, M. Lawless, J. Messina and T. Rõõm, Research series, November 2009. 184. "Discriminatory fees, coordination and investment in shared ATM networks" by S. Ferrari, Research
series, January 2010. 185. "Self-fulfilling liquidity dry-ups", by F. Malherbe, Research series, March 2010. 186. "The development of monetary policy in the 20th century - some reflections", by O. Issing, Research
series, April 2010.

NBB WORKING PAPER No. 198 - OCTOBER 2010 41
187. "Getting rid of Keynes? A survey of the history of macroeconomics from Keynes to Lucas and beyond", by M. De Vroey, Research series, April 2010.
188. "A century of macroeconomic and monetary thought at the National Bank of Belgium", by I. Maes, Research series, April 2010.
189. "Inter-industry wage differentials in EU countries: What do cross-country time-varying data add to the picture?", by Ph. Du Caju, G. Kátay, A. Lamo, D. Nicolitsas and S. Poelhekke, Research series, April 2010.
190. "What determines euro area bank CDS spreads?", by J. Annaert, M. De Ceuster, P. Van Roy and C. Vespro, Research series, May 2010.
191. "The incidence of nominal and real wage rigidity: An individual-based sectoral approach", by J. Messina, Ph. Du Caju, C. F. Duarte, N. L. Hansen, M. Izquierdo, Research series, June 2010.
192. "Economic importance of the Belgian ports: Flemish maritime ports, Liège port complex and the port of Brussels - Report 2008", by C. Mathys, Document series, July 2010.
193. "Wages, labor or prices: how do firms react to shocks?", by E. Dhyne and M. Druant, Research series, July 2010.
194. "Trade with China and skill upgrading: Evidence from Belgian firm level data", by G. Mion, H. Vandenbussche, and L. Zhu, Research series, September 2010.
195. "Trade crisis? What trade crisis?", by K. Behrens, G. Corcos and G. Mion, Research series, September 2010.
196. "Trade and the global recession", by J. Eaton, S. Kortum, B. Neiman and J. Romalis, Research series, October 2010.
197. "Internationalization strategy and performance of small and medium sized enterprises", by J. Onkelinx and L. Sleuwaegen, Research series, October 2010.
198. "The internationalization process of firms: From exports to FDI?", by P. Conconi, A. Sapir and M. Zanardi, Research series, October 2010.

© Illustrations : Photocase National Bank of Belgium
Layout : Analysis and Research Group Cover : NBB TS – Prepress & Image
Published in October 2010
Editor
Jan SmetsMember of the board of Directors of the National Bank of Belgium
National Bank of Belgium Limited liability company RLP Brussels – Company’s number : 0203.201.340 Registered office : boulevard de Berlaimont 14 – BE -1000 Brussels www.nbb.be


