AGRODEP Working Paper 0020
December 2015
The Impact of Namibia’s Income Tax Reform
A CGE Analysis
Blessing Chiripanhura and Ronald Chifamba
AGRODEP Working Papers contain preliminary material and research results. They have been peer reviewed but have not been subject to a formal external peer review via IFPRI’s Publications Review Committee. They are circulated in order to stimulate discussion and critical comments; any opinions expressed are those of the author(s) and do not necessarily reflect the opinions of AGRODEP.

1

2
About the Authors
Blessing Chiripanhura is a Senior Lecturer at the University of Namibia in Windhoek.
Ronald Chifamba is a Lecturer at the University of Namibia in Windhoek.
Acknowledgements
We would like to acknowledge the seed research funds from AGRODEP, and also the assistance offered by AGRODEP in CGE training.

3
Table of Contents
1. Introduction ........................................................................................................................... 5
2. Structure of the Economy and the Essence of Tax Reforms ............................................. 7
2.1. Taxation, Economic Growth, and Poverty Reduction .................................................... 11
3. The Analytical Framework ................................................................................................. 12
3.1. Main Adjustments to the Standard Model ...................................................................... 15
4. Simulation Results ............................................................................................................... 15
4.1. Impact of the PIT and CIT Reductions ........................................................................... 16
Economic Activity ................................................................................................................................ 16
Trade Flow and Exchange Rate Analysis ............................................................................................. 17
Price Analysis ...................................................................................................................................... 18
Welfare Analysis .................................................................................................................................. 19
4.2. Sensitivity Analysis ......................................................................................................... 20
5. Conclusions and Policy Implications ................................................................................. 21
References .................................................................................................................................... 23
Appendix: Simulation Results ................................................................................................... 25
AGRODEP Working Paper Series ............................................................................................ 27

4
Abstract
This paper uses a computable general equilibrium (CGE) model to analyze and quantify the economy-wide equity and distributional impacts of Namibia’s tax policy reforms introduced in 2013. The effects of the reductions in personal and corporate taxes varied across institutions and markets. For households, a decrease in the effective tax rate directly resulted in higher disposable incomes, especially for urban households that participate in the labor market. Benefits to rural households were lower, principally because of their reliance on subsistence farming and mixed incomes. Households also benefited from falling consumption prices, thus experiencing improvements in their consumption patterns. Further, households experienced increasing returns to labor, but falling employment in the primary and service sectors. Given Namibia’s high unemployment rates, especially among those with little or no education, the tax cut enhanced inequality between skilled and unskilled labor. The tax reforms also resulted in exchange rate depreciation, thus increasing export competitiveness. On the other hand, the country’s reliance on imports meant that the high import bill exerted pressure of the country’s foreign currency reserves. Sectoral analysis shows that the manufacturing sector tended to benefit more from the reforms than other sectors. Output from manufacturing activities increased, together with manufacturing exports. The tax changes appeared to support the national policy of promoting manufacturing activities.
Résumé
Cet article utilise un modèle d'équilibre général calculable (CGE) pour analyser et quantifier les effets macroéconomiques et redistributifs des reformes de la politique fiscale introduites en Namibie en 2013. Les effets de la réduction des impôts des particuliers et des entreprises varient selon les institutions et les marchés. Pour les ménages, une diminution du taux d'imposition effectif a pour conséquence directe des revenus disponibles plus élevés, en particulier pour les ménages urbains qui participent au marché du travail. Les bénéfices pour les ménages ruraux apparaissent plus faibles, principalement en raison de leur dépendance à l'égard de l’agriculture de subsistance et des revenus mixtes. Les ménages bénéficient également de la baisse des prix à la consommation, connaissant ainsi une amélioration de leur profil de consommation. En outre, les ménages connaissent une augmentation de la rémunération du travail, mais une baisse de l'emploi dans les secteurs primaire et tertiaire. Compte tenu des taux de chômage élevé en Namibie, en particulier parmi ceux qui ont peu ou pas d'éducation, la réduction d'impôt renforce les inégalités entre les travailleurs qualifiés et non qualifiés. Les réformes fiscales ont également entraîné une dépréciation du taux de change, augmentant ainsi la compétitivité des exportations. D'autre part, la dépendance du pays aux importations signifie que la facture élevée de ces dernières a exercé des pressions sur les réserves en devises étrangères du pays. L'analyse sectorielle montre que le secteur manufacturier a eu tendance à bénéficier davantage des réformes comparé aux autres secteurs. La production des activités manufacturières augmente, de même que les exportations. Les modifications fiscales semblent soutenir la politique nationale de promotion des activités manufacturières.
5
1. Introduction
In many countries, the central role of government is building infrastructure and establishing a suitable
regulatory framework for economic activities to take place in a safe and predictable environment. The
government finances these activities with money raised from different revenue sources, including taxation
and aid. Taxation is typically used to redistribute income, stabilize the economy, and raise revenue for the
provision of public goods. A properly functioning tax system should promote horizontal and vertical equity,
should have diverse sources of funding, and should be operate efficiently. However, there tends to be a
trade-off between considerations of efficiency and equity. On the one hand, inefficient taxes cause
distortions in factor markets, resulting in lower economic growth; on the other hand, efficient taxes tend to
increase income inequality. Governments therefore must develop policies aimed at raising an optimal
amount of tax revenue from the different sources at their disposal in order to minimize the impact of tax
inefficiencies on the economy. In addition, taxation has important capitalisation effects which impact
savings and investment decisions, given the forward-looking nature of these decisions. Finally, taxation has
significant multiplier effects with the potential to enhance and/or derail policy objectives. When tax changes
bring about changes in capital accumulation decisions, these changes can drive transformations in the
employment of various types of labor, household income sources, consumption patterns, and economic
growth.
Taxes can either be direct (levied on economic agents’ earned income) or indirect (levied on agents’
consumption and/or expenditures). The two main types of direct taxes are personal income taxes (PIT) and
corporate income taxes (CIT). These form the main focus of this paper, given the reductions in these
revenue sources that were introduced in Namibia in 2013. Such changes in a country’s tax policy can impact
macroeconomic variables like growth, the budget balance, income distribution, employment, and poverty.
For example, economic growth accompanied by improving income distribution results in falling poverty
(Son and Kakwani, 2008).
Assuming that a country starts from a balanced budget position, a reduction in direct tax levels has
expansionary macro and micro effects. At the macro level, a tax reduction impacts national income,
consumption, investment, government revenues, and international trade; at micro level, it impacts
household and firm income and expenditure decisions. On the household side, a reduction in PIT results in
an increase in a household’s disposable income. This, in turn, should boost consumption and savings, thus
spurring economic growth. However, a reduction in PIT may result in growing inequality if the benefits of
the tax reduction accumulate more to individuals at the top of the income distribution. At the individual
level, in a theoretical analytical framework of household economics, Chiappori and Lewbel (2015) examine
the substitution and income impacts of a tax reduction on labor supply decisions. A tax reduction increases

6
an individual’s disposable income; if that individual feels well-off enough with the higher disposable
income, he or she may choose to reduce working hours and take more leisure (the income effect). However,
the substitution effect works in the opposite direction. The possibility of higher real income may encourage
the individual to spend more labor hours in order to increase earnings (the substitution effect). Which effect
dominates depends on whether the two (labor and leisure) are normal or inferior goods.
On the firm side, a reduction in CIT increases after-tax profits and boosts business confidence. This may
encourage firms to increase their level of investment, given that higher profits and therefore higher retained
earnings can loosen budget constraints since firms would be able to accumulate more investible funds
internally and may not need to borrow as much. A combination of these effects is anticipated to increase
the level of employment and therefore boost household income.
Given this background, this paper seeks to examine Namibia’s tax policy reforms introduced in the 2013
national budget. These reforms were introduced in the context of a slow-growing economy, high levels of
unemployment, and high income inequality and poverty. In part, Namibia’s poor economic performance
could be attributed to the lag effects of the 2008-09 economic recession in global export markets, especially
in Europe. The reforms were aimed at increasing international competitiveness and compliance by reducing
the incentive for tax avoidance. Reduced taxation was anticipated to help increase the tax base and therefore
the tax collected. The 2013 tax reforms also coincided with the need to reduce the risk associated with the
delayed signing of the Economic Partnership Agreement (EPA) with the European Union.
Our analysis focuses on the impact of the joint introduction of PIT and CIT reforms. The effects of PIT
reduction are important because over 40 percent of rural household income and nearly 75 percent of urban
household income in Namibia comes from employment (NHIES of 2009-10). PIT changes affect
government and household incomes, employment, and household welfare and income distribution, while
CIT changes impact investment decisions, potentially altering the incentive structure and the attractiveness
of the country as an investment destination.
The paper makes two unique contributions, and a third general one. First, the paper is, to our knowledge,
the first to analyze the economy-wide equity and distributional impacts of Namibia’s tax policy reforms.
Secondly, we use a computable general equilibrium (CGE) model to analyze and quantify the impacts of
these policy changes, something that has not yet been done in the context of these tax reforms. The
advantage of using CGE modelling is that it makes it possible to perform a comprehensive joint analysis of
macro and micro data. In addition, general equilibrium analysis is superior to partial equilibrium analysis
because the latter does not account for the full multiplier effects of a policy change on the rest of the
economy. Third, the paper promotes macroeconomic analysis in Namibia by utilizing the publicly available
balanced social accounting matrix based on the 2004 National Accounts data to publicize the use of
quantitative approaches to policy analysis. This is part of an initiative to enhance research capacity and

7
cooperation between the National Planning Commission, the Namibia Statistics Agency, and academic
researchers. The SAM is not readily available (except in a few libraries around the world), but we include
the aggregated version that we use for our analysis with the hope that its availability will stimulate more
research on macroeconomic modelling in the country.
The structure of the paper is as follows. Section Two discusses the structure of Namibia’s economy, the
challenges that it faces, and the tax changes that were introduced in 2013. It also discusses the literature on
tax policy reforms in general. Section Three presents our analytical framework, highlighting the structures
of production and consumption and the relationships between different economic agents in the model. The
model is a standard IFPRI model adapted to suit the Namibian economy and SAM. Section Four presents
the results and analysis, and Section Five concludes.
2. Structure of the Economy and the Essence of Tax Reforms
Namibia’s economic problems and challenges are similar to those of other developing countries in many
ways. However, the country has its own peculiarities that distinguish it from many other countries,
including a very small population (2.3 million people). Namibia is regarded as an upper middle-income
country, with a gross national income per capita of US$5,840 in 2013 (using the World Bank Atlas method).
Like other developing countries, Namibia suffers from high unemployment (pegged at 27.2 percent in 2013
and 30 percent in 2014), a moderate human development index (0.61 in 2013), and an HIV infection rate
of 13.3 percent (in 2012). Further, the country is characterised by high income inequality (given by a Gini
coefficient of 0.59 in 2010) and rather high levels of poverty (averaging 30 percent of households in 2010).
To address these problems, the government requires financial and human resources to develop
infrastructure, provide public goods and services that can improve living standards, and build technical
skills for research and analysis so that national policy formulation is sound and evidence-based. These
activities can help avoid policy debacles like the one seen in 2013 when the Ministry of Finance imposed a
25 percent royalty tax on mining ventures. The mining companies were furious and heavily criticized the
government, arguing that the new tax regime would drive them into bankruptcy. Pressure from the business
sector resulted in the government shelving the tax and promising more consultation before any future policy
pronouncements were made.
As with many developing country economies, Namibia’s economy is driven by primary resources in the
form of mining and quarrying (constituting 11.3 percent of GDP in 2012, of which 8.3 percent was diamond
mining) and agriculture (5 percent) and fisheries (3.8 percent). Since the country is largely dry, the level
and diversity of crop production is limited; the country relies on imports from South Africa for fruits,
chicken, and many other agricultural goods. Namibia’s agricultural sector consists of 6,000 privately

8
owned, large-scale commercial farms (which occupy about 44 percent of the land) and 250,000 smallholder
agricultural households (which occupy 41 percent of the land) that are engaged in subsistence production,
mainly of small grains (Sherbourne, 2013). According to the Namibia Household Income and Expenditure
Survey 2009-10, about 40 percent of the rural population gets the bulk of its income from subsistence
agriculture.
Namibia has an open economy that exports diamonds, fish, grapes, and live animals and meat, both
regionally (especially to South Africa) and internationally (mainly to the European Union). It imports
machinery and equipment, motor vehicles, food, and other consumer goods from the rest of the world. This
openness means that the economy is vulnerable to international economic fluctuations; it is especially
vulnerable to shocks that impact the South African economy because South Africa is Namibia’s main
trading partner and the Namibian dollar is linked to the South African Rand through an exchange rate peg.
Thus, the 2008-09 global financial crisis had adverse effects on Namibia’s economy, especially on its export
markets (e.g. diamonds), and the aftermath of the crisis continues to affect the country. Despite a decline in
returns, however, there was no significant change to foreign direct investment, the bulk of which goes to
the mining sector, following the crisis. Local savings are mainly channelled to South Africa, and since there
was no financial crisis-linked bank failure in that country, local savings were not lost. Further, since
Namibia is classified as a middle-income country, it is not high on the ODA list and therefore did not need
such assistance to deal with the effects of the financial crisis. Principally, Namibia relied on its own
resources to manage the crisis.
Table 1 shows some of Namibia’s macroeconomic characteristics. Like other developing countries, the
country’s data is characterised by inconsistencies across sources and has missing observations. To obtain
more consistent and longer series, we restrict the analysis to data from the World Development Indicators.
In Table 1, we calculate five-year averages for the available series. The table shows that the country has
high income per capita, hence its classification as a middle-income country. Grants generally constitute a
low proportion of total revenue, and there has been a considerable decline in trade taxes’ contribution to
total revenue. The ratio of tax revenue to GDP has been declining since the 1990s, but it remains relatively
high, presumably indicating institutional quality.

9
Table 1: Taxes and other macroeconomic indicators, 1990-2008
Figure 1 shows the structure of government revenue in 2011 and shows that direct taxes (on income and
profits) accounted for 39 percent of total revenue. This was followed by indirect taxes (26.93 percent) and
international trade taxes (24 percent). Trade taxes in the form of revenues from the Southern African
Customs Union (SACU) are very important to the country. Fines and forfeitures and other taxes constituted
less than 1 percent each.
Figure 1: The structure of government revenues, 2011-12
Source: The 2013 Budget Statement, Ministry of Finance
Taxes on income and profits
39.00%
Property taxes0.65%
Domestic taxes on goods and services
26.93%
Taxes on international trade
and transactions24.00%
Other taxes0.71% Entrepreneural &
property income6.79%Fines and
forfeitures0.20%
Admin fees & charges & incidental
sales1.72%
1990-95 1996-2000 2001-08
GNI per capita (PPP current international $) 3970 3844 5220 Grants and other revenue (% of Total revenue) 16.9 10.1 3.2
Gross savings (% of GDP) 33.6 26.1 28.0 Taxes on goods and services (% of Total revenue) 33.0 25.7 8.1 Taxes on international trade (% of Total revenue) 35.0 30.7 10.8
Tax revenue (% of GDP) 35.1 29.1 22.9 Budget deficit (% of GDP) -1.5 -1.1 -1.2
GDP growth (annual %) 5.5 3.5 4.9 GDP per capita growth (annual %) 1.4 0.9 3.3
Source: World Development Indicators, 2015
10
In 2012, tax revenue constituted 94 percent of Namibia’s total revenue, with the remainder coming from
non-tax revenue. The bulk of non-tax revenue came from dividends and profit share (31 percent) and from
diamond royalties (27 percent). Of the total revenue, 38 percent was from direct taxes (PIT and CIT) and
the rest from indirect taxes. The direct tax revenue consisted of 56 percent PIT, 40 percent CIT, and 4
percent withholding tax. The indirect tax structure consisted of customs and excise revenue (64 percent),
value-added tax (34 percent), and environmental taxes and stamp duty (2 percent). This structure illustrates
the importance of taxation as a source of revenue. Relative to countries like South Africa and Botswana,
Namibia has higher average tax rates, which makes the country less competitive. Thus, it was necessary for
the government to introduce some changes in 2013 in order to improve the country’s relative tax status.
The country has a high savings rate, but these savings do not necessarily translate into local investment.
Most of the savings tend to flow into the international market, especially South Africa. This may pose a
challenge to expansionary policies, as the magnitude of the multiplier effects may be reduced by leakages
into the South African economy.
Namibia has recorded positive growth for the past 14 years, with the exception of the year 2009 due to the
global recession. As part of its development initiatives, the country has established national development
plans, of which the fourth is currently in implementation, and a National Vision 2030 under which it seeks
to become an industrialised nation by 2030. It is in the context of the structure and challenges mentioned
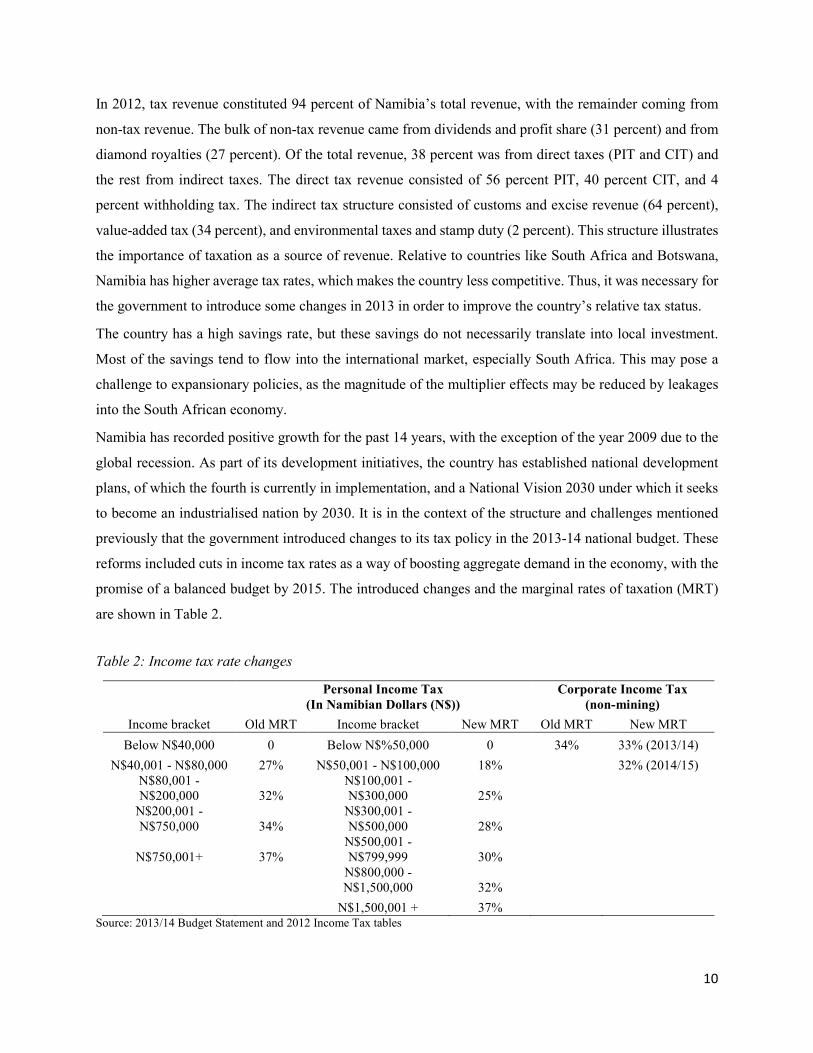
previously that the government introduced changes to its tax policy in the 2013-14 national budget. These
reforms included cuts in income tax rates as a way of boosting aggregate demand in the economy, with the
promise of a balanced budget by 2015. The introduced changes and the marginal rates of taxation (MRT)
are shown in Table 2.
Table 2: Income tax rate changes
Personal Income Tax
(In Namibian Dollars (N$)) Corporate Income Tax
(non-mining) Income bracket Old MRT Income bracket New MRT Old MRT New MRT
Below N$40,000 0 Below N$%50,000 0 34% 33% (2013/14) N$40,001 - N$80,000 27% N$50,001 - N$100,000 18% 32% (2014/15)
N$80,001 - N$200,000 32%
N$100,001 - N$300,000 25%
N$200,001 - N$750,000 34%
N$300,001 - N$500,000 28%
N$750,001+ 37% N$500,001 - N$799,999 30%
N$800,000 - N$1,500,000 32%
N$1,500,001 + 37% Source: 2013/14 Budget Statement and 2012 Income Tax tables

11
The table shows that from 2013, the minimum income threshold was increased by $10,000, and income tax
brackets were widened and increased. In addition, the minimum tax rate was reduced by 9 percentage
points. At a glance, it appears that both low- and high-income earners benefitted most from the tax
reduction. However, the contemporaneous change in tax rates and brackets means that the benefits across
income groups vary. Further, tax policy changes such as these have complex, economy-wide effects
transmitted through various channels.
The corporate income tax was also reduced by 2 percentage points; however, the new CIT level of 33
percent remains higher than that of South Africa (28 percent) and Botswana (22 percent). Thus, overall,
Namibia is still less business-friendly compared to these two countries. This fact is reflected by the World
Bank’s (2013) Doing Business 2013 Report that ranked Namibia number 112 in Africa with regard to ease
of paying taxes, compared to South Africa at 32 and Botswana at 39. Although Namibia has lower
manufacturing taxes (18 percent) than South Africa (28 percent), its manufacturing tax rate remains higher
than that of Botswana (15 percent). These numbers illustrate why the government of Namibia decided to
reform its tax policy as part of its drive to improve international competitiveness.
Other reforms that were introduced in the 2013-14 budget include a proposal to increase tax collection
efficiency by setting up an independent revenue authority and measures to expand the tax base and to reduce
tax evasion. Other reforms introduced include reducing transfer duty brackets and rates and reducing stamp
duty brackets and rates in an effort to encourage citizens to acquire property. In addition, taxes on exports
of raw materials were to be reviewed as a way to encourage value addition. Whether or not these tax reforms
will result in the anticipated outcomes is an empirical issue; some of the policy changes and expected
outcomes remain controversial in the literature.
2.1.Taxation, Economic Growth, and Poverty Reduction
The existing literature shows that taxation has a strong impact on economic growth. In general, lower
taxation is expected to encourage savings and growth in funds for investment. Engen and Skinner (1996)
argue that countries with efficient tax systems tend to have higher rates of economic growth than those with
inefficient systems. However, the relationship between taxation and growth is rather complex and not
straightforward (Gemmell, 1988) because taxation impacts growth indirectly through other variables like
investment, savings, investor perceptions and confidence, and international trade. The relevant elasticities
differ across countries. Let us take the example of the Republic of Ireland; there is no doubt that this
country’s impressive economic growth before 2008-09 financial crisis was, in part, a result of a low
corporate tax regime that attracted large multinational corporations. However, in the context of the global
economic crisis and tax avoidance, the rules allowing lower tax rates were found to be against certain

12
provisions of EU regulations. In the case of Namibia, the ability to attract multinational corporations (other
than in primary resource exploitation) is limited because of infrastructural bottlenecks, shortage of skilled
labor, and a small market.
Another strand of literature follows the taxation-growth-poverty link. The assumption here is that a growing
economy creates jobs, employment increases working households’ incomes, and higher incomes reduce
poverty. Linked to the taxation argument, this means that lower tax rates foster economic growth and that
economic growth reduces poverty (Dollar and Kraay, 2002; Kraay, 2006; Son and Kakwani, 2008).
However, the strength of this view depends on the growth elasticity of poverty. De Silva and Sumarto
(2014) find this elasticity to be low relative to the inequality elasticity of poverty in Indonesia. Olinto et al.
(2014) come to a similar conclusion that downplays the efficacy of economic growth in reducing poverty.
From another angle, one can argue that the growth-poverty link is established through the labor market;
when growth does not create enough jobs, the result is jobless growth, which fails to reduce poverty. The
UNDP Report of 1996, in examining the effects of structural economic reforms, posits that there is no
straightforward link between growth and poverty reduction because the labor market response to growth
may be weak and therefore may not have a significant impact on poverty. Mukherjee (2014), in applying a
Harris-Todaro general equilibrium model to a developing economy (with India as the example), postulates
that under trade reforms, firms tend to adopt capital-intensive production systems, resulting in jobless
growth; UNDP (1996) argues that such jobless growth may increase rather than decrease poverty. This line
of argument is supported by Ravallion (2001), who states that growth is inefficient at reducing poverty,
especially when the growth effects are mainly captured by better-off households, implying that the initial
distribution of resources is a major determinant of the outcome of the distribution of growth subsequent to
a stimulation policy. This argument is supported by Olinto et al., (2014), who argue that in order to attain
higher levels of development, it may be necessary for governments to promote equity over growth because
of the better inequality elasticity of poverty over growth elasticity of poverty. In the following section, we
present the model that we apply to examine the impact of Namibia’s PIT and CIT reforms. Our analysis
seeks to establish the impacts of these tax changes on production, consumption, and welfare.
3. The Analytical Framework
We apply a computable general equilibrium (CGE) model to examine the effects of Namibia’s tax policy
changes. CGE modelling is a standard and comprehensive method of quantifying economy-wide impacts
of shocks and/or policy reforms, given the manifold nature of tax reforms. Such modelling plays an
important role in policy formulation and is used in various policy analysis situations. The model is premised
on sound neoclassical growth theory and features behavioural interactions between households, firms, the

13
government, and the rest of the world. CGE models have been used to examine the impacts of tax changes
in Australia’s tourism sector (Forsyth et al., 2014) and to study the impact of introducing a carbon tax in
South Africa (Alton et al., 2014). The strength of CGE modelling is that it makes it possible to account for
the economy-wide effects of a policy change. As such, a CGE model is best suited for the analysis of the
impacts of Namibia’s tax reforms as the modelling allows for simulations and sensitivity analyses.
The paper adapts a standard IFPRI model to suit the Namibian economy and social accounting matrix
(Lange and Schade, 2008). The standard model is available in the paper by Lofgren, Harris and Robinson
(2002). Here we present a summary of this model, including our modifications to suit the Namibian SAM.
The IFPRI standard model has been used in various studies of macroeconomic policy in Africa, including
by Thurlow (2004), Go et al., (2005), and Bezabih, Chambwera, and Stage (2011) on environmental policy.
The model assumes a small open economy, implying that international trade plays an important role and
that the study country is a price-taker on the international market. It is based on optimizing the behavior of
economic agents, with equilibria in production and in consumption. The model is calibrated to a SAM that
is relatively disaggregated in households. It has equations relating to institutions, factors, activities, and
products. The institutions consist of households, firms, the government, and the rest of the world. There are
three factors of production: labor, both skilled and unskilled, and capital. Factors receive income from
activities and from the rest of the world.
The SAM has nine types of domestic institutions, including six types of households. Households derive
mixed income from commercial and communal land, since production consists of a mix of traditional and
commercial production. They also derive income from the labor market and business activities. In the SAM,
mixed income as a factor of production does not distinguish between its land, labor, and capital components.
There are 30 different activities in the disaggregated SAM, but we aggregate these into four main activities:
primary, manufacturing, private services, and government activities. By the same aggregation, we also have
four products linked to the different activities and one group of trade margins. The trade margins are spread
across domestically produced and marketed products and across exports and imports, and there is no
justifiable way to allocate trade margins to direct purchases from abroad (part of imports).
In production, firms maximize profits subject to the available technology. They optimize their debt-equity
financing decisions as well as their factor input combinations. There is substitution between intermediate
inputs and between factors of production. Firms minimize costs by choosing the most efficient combination
of factors of production. The production technology is specified by a Leontief function of the quantities of
intermediate inputs and value added, while the choice between factors of production is modelled by a
constant elasticity of substitution function, which illustrates imperfect substitutability between the factors.
Activities produce commodities with fixed coefficients. There is efficiency in the factor markets so that
factors are employed up to the point where the marginal productivities equal the factor payments.
14
In commodity markets, domestic output is allocated to domestic consumption and exports; this allocation
is modelled as a constant elasticity of transformation function. There is imperfect transformability in the
supply of domestic output. Domestic demand consists of locally produced goods and imports and is
represented by a constant elasticity of substitution aggregation function. There is imperfect substitutability
in consumption of domestically produced goods and imports (Armington assumption). By the small country
assumption, export demand is infinitely elastic at the given world price and producers receive their exports
revenue less trade margins and tariffs. Import supply is also infinitely elastic at the given world price and
the domestic import price includes import tariffs and applicable trade margins. There is equilibrium in the
goods market. In the factor markets, it is assumed that the wage rate is fixed (to capture the unemployment
in the labor market); thus the supply of labor is endogenous.
Households receive income from factors of production, transfers, and mixed income from activities. They
are endowed with four factors of production (skilled and unskilled labor, mixed income, and gross operating
surplus (capital)). Skilled labor and capital receive payments from the rest of the world. Households
maximize their utility subject to their income constraints. Household income finances consumption, direct
taxes, transfers to other institutions, and savings. Apart from being consumer-producers, households also
consume marketed commodities that are either locally produced or imported. They incur transaction costs
in consumption, which are part of the trade margins. Household consumption is allocated across different
commodities according to a linear expenditure function. Enterprises hire factors of production; they pay
taxes, make transfers to other institutions, and save. Their incomes are modelled in same way as those of
households.
The government collects tax income and receives transfers from other institutions. One peculiarity of the
Namibian economy is that within the Southern African Customs Union (SACU) arrangement, governments
collect import taxes and remit them to the common SACU revenue pool. They then share the revenues using
an agreed-upon formula. On the expenditure side, the government uses its income to buy commodities for
its own consumption and to make transfer payments to other institutions. The rest of the world is linked
with the domestic institutions and factors through the exchange of goods and services and financial
transfers. All transfers between the rest of the world and the domestic economy are fixed in foreign
currency. With regard to macroeconomic balances, we assume fixed foreign savings and a flexible real
exchange rate. Government savings are a flexible residual, while tax rates are fixed (after the change). In
addition, real investment is fixed.

15
3.1.Main Adjustments to the Standard Model
The standard model is general enough to be adaptable to different countries. For perfect adaptation, we
started by transforming the Namibia SAM to suit the base SAM of the standard model. To do so, we had to
share the trade margins to imports, exports, and domestically produced and consumed goods. Imports
consist of two components: imports as recorded in national accounts and direct imports by households. We
assume that direct purchases from abroad by residents already include trade margins.
The standard model SAM disaggregates government income by tax source; we also disaggregate
government income by source (that is, direct tax and indirect tax incomes, value-added tax and import tax
incomes, and export tax income). We set export tax income to zero.1 We modified the way the standard
model reads its SAM to account for transactions in the Namibia SAM which do not appear in the standard
model SAM. We accounted for:
1. Direct purchases abroad by residents;
2. Transfers by the rest of the world to factors;
3. Transfers by the rest of the world to government;
4. Government transfers to the rest of the world; and
5. Factor transfers to the rest of the world.
The Namibian SAM includes non-public institutions serving households (NPISH) as a type of institution.
We account for this by defining it within the household set. All of the new components in the Namibian
SAM that are not in the standard model SAM are incorporated in the model equations.
For the full operation of the model, we assume that the real after-tax wage rate for unskilled labor is fixed,
thus allowing for the unemployment of that type of labor. Labor is mobile across sectors. There are no
export taxes. Direct imports by households already include import taxes and margins. The taxes and margins
in direct imports cannot be justifiably extracted from the given figure. Trade margins are allocated to
exports and domestic demand in proportion to their contribution to total demand. Tax rates and parameters
are calibrated from the model. The domestic price index is set as the numeraire and is therefore fixed in the
simulations. The following section presents the results of the model.
4. Simulation Results
We run the model under the assumption that the government allows the current budget balance to change.
Under this assumption, a tax reduction would cause the level of deficit to increase; as a result, the
government would, in the future, need to come up with ways to address this deficit. Our simulations
1 Although there have been suggestions to impose taxes on some exports, no policy to that effect has been established.
16
consider the outcomes of a joint reduction in PIT and CIT, as well as options that need to be considered in
order to balance the books by the end of the fourth national development plan, given the government’s
argument for future fiscal consolidation, to which it is being nudged by the IMF (2014).
4.1.Impact of the PIT and CIT Reductions
First, we adjust the direct tax rates to their 2012-13 level (given that the SAM is relatively old); then we
simulate the decrease in tax level for the year 2013-14. To scale up the tax rate, we calculated
scaling/adjustment factors that, when multiplied with the tax rates in the SAM, would yield the rates
applicable in fiscal year 2013-14. For the period 2013-14, the effective tax rate (ETR) was 26.4 percent.
For enterprises, the ETR for the same period was 33 percent. Within the enterprises group, the ETR for
manufacturing firms was the lowest, at 18.7 percent, while that for mining firms was the highest, at 55
percent. Thus, between 2012-13 and 2013-14, the PIT effective tax rate was reduced by 6.4 percentage
points.
From our analysis, a reduction in PIT resulted in varying outcomes among the different types of households.
Urban households’ earning wages and salaries experienced the greatest fall in ETR, followed by rural
households engaged in business and commercial farming activities. Other household types realized lower
ETR reductions.
Economic Activity Overall, the tax reduction brought about GDP growth of 0.039 percent. The growth contributed to
improvements in government revenues, which grew by 0.05 percent, driven by growth in tariff revenues.
The small increase in tax revenue indicates that Namibia has very low tax revenue elasticity. The demand
for factors of production increased by 0.26 percent. Domestic output increased by 0.119 percent, which is
0.08 percent more than the GDP growth. This seems to be an indication of the extent of inefficiencies in
manufacturing and government outputs, given that these sectors are the ones that increased following the
tax reforms.
At sectoral level, the reductions had mixed impacts. The tax reduction resulted in a 0.29 percent fall in
primary sector activity and output and a 0.09 percent fall in private services output. On the other hand,
economic activity in the manufacturing sector increased by 0.389 percent. These changes in activity rates
have impacts on materials use and on employment. Economic activity declined in low-skill sectors, and this
decline is transmitted to the labor market. The tax changes are therefore anticipated to result in lower
employment for unskilled labor but higher employment for skilled labor in the manufacturing sector.

17
The fall in economic activity in the primary and private services sectors was accompanied by falling
quantities sold on the domestic market (of 0.293 percent and 0.086 percent, respectively). On the other
hand, the sale of manufactured output on the domestic market increased by 0.322 percent.
The analysis of factor demands shows that the demand for both skilled and unskilled labor decreased in the
primary sector (by 0.412 percent and 0.415 percent, respectively), as well as in the services sector (by 0.091
percent and 0.094 percent, respectively). However, there was growth in the employment of both skilled
labor (0.383 percent) and unskilled labor (0.38 percent) in the manufacturing sector. Since demand for labor
is derived demand, the fall in the demand for primary and services sector outputs resulted in fall in demand
for labor in these sectors. By the same token, higher demand for manufactured output resulted in growth in
demand for labor in that sector. In government, employment grew by an average of 0.1 percent following
the reforms. The demand for capital decreased in both the primary and services sectors, but increased in the
manufacturing and government sectors. These results have important implications for the structure of
Namibia’s labor market, in which the majority of the unemployed have little or no education and hence are
unskilled. The sectors that tend to employ the majority of unskilled workers reduced employment under the
tax reforms, which means that the tax reforms likely increase rather than reduce unemployment.
A reduction in CIT reduces the tax burden on returns from real investments relative to those from financial
investments, thus creating incentives for investors to move their funds into real investment projects. The
tax reduction benefits highly geared firms, given that debt-interest is allowable for tax purposes. As stated
by Gordon and Lee (2001), a reduction in corporate tax leads to a reduction in the debt-asset ratio. The tax
reduction results in higher savings and better cash flow for firms. It is anticipated that retained earnings
increase and that the tax reduction influences firms’ preference for certain types of financing (Radulescu
and Stimmelmayr, 2010). Such changes in preferences potentially cause over-or under-investment.
One of the challenges of Namibia’s economy is a continued channelling of domestic savings abroad. For
this reason, real investment has been held constant in the model. However, since manufacturing sector
output and employment increased under the tax reforms, it appears that enterprises increased their
utilization of existing capacity (that is, they reduced excess capacity); hence there was no need for additional
capacity. In manufacturing, tax savings may have been used to purchase raw materials, thus allowing output
to expand.
Trade Flow and Exchange Rate Analysis The tax reduction impacted the quantity of imports into the country. First, exports increased by 0.425
percent, while imports declined by 1.122 percent. Given that the current account is fixed, the changes in
international trade came about because of an exchange rate depreciation of 0.092 percent.

18
These changes were driven by the decline in the quantities of primary and services sector imports by a
combined 1.38 percent; the quantities of manufactured imports and direct foreign purchases increased by
0.186 percent and 1.96 percent, respectively. The increase in manufactured imports may not be surprising,
given that the country imports about 80 percent of its products, mainly from South Africa. In addition, the
increase in incomes among households with wages and salaries feeds into these households’ demand for
manufactured goods and services, some of which are imported.
The decrease in primary and services sector imports was driven by increases in the prices of imports due to
exchange rate depreciation. The increase in the quantity of manufactured imports and direct purchases from
abroad was mainly driven by households with wages and salaries. This is because imports from countries
within the Southern African Customs Union2, of which Namibia is a member, do not attract high taxes.
This situation poses a policy dilemma for a government trying to build up its foreign exchange reserves.
For example, when Namibia imposed high taxes on second-hand cars older than five years, Namibians
started importing cars through Botswana, thus attracting lower taxes; the government ended up losing tax
revenue to Botswana.
On the export side, manufacturing exports increased by 0.458 percent; this is due to the fact that not all
manufactured products are consumed domestically. The export of primary products increased by 0.003
percent, while that of private services declined by 0.036 percent.
These import and export responses were in part caused by the depreciation of the exchange rate following
the tax reduction. The exchange (that is, domestic currency units per unit of foreign currency) depreciated
by 0.092 percent, making imports more expensive and exports more competitive. The increase in imports
of manufactured products, despite a depreciating exchange rate, indicates that the local manufacturing
sector imports important intermediate goods. This is followed by an increase in manufactured exports.
Price Analysis The depreciation in the exchange rate caused the price of imports to increase across all sectors by 0.092
percent. Export prices increased by 0.284 percent, while domestic producer prices decreased by 0.307
percent. The price of value-added also increased by 0.134 percent.
The sectoral changes that brought about the aggregate price changes are as follows. The export prices of
manufactured products increased by 0.99 percent, while the prices of primary products and services
increased by 0.093 percent and 0.092 percent, respectively. The price of composite commodities increased
for manufactured products (0.044 percent) and services (0.06 percent) but declined for primary products (-
0.332 percent).
2 The Southern African Customs Union consists of South Africa, Botswana, Namibia, Lesotho, and Swaziland.

19
Producer prices of both manufactured and primary products decreased. The manufacturing producer price
declined by 0.024 percent, which is smaller than the consumer price decrease, while the primary product
producer price declined by 0.41 percent, which is much larger than the decline in consumer prices. The fall
in producer prices, coupled with fixed consumer prices, implies falling profit margins. Thus, the model
shows that the primary producer profit margin decreased by a larger proportion than the manufacturing
producer profit margin, given that, overall, there was a positive change to gross operating surplus.
The producer prices of the services and government sectors increased (0.125 percent), indicating higher
returns in the services sector where tourism is regarded a strategic growth sector. The increase in prices is
likely to be a result of growth in demand because of higher disposable incomes in institutions.
The price of value-added also changed in response to the tax changes. The price of value-added in the
primary sector declined by 0.076 percent, but it increased across other sectors (by 0.068 percent for
manufacturing, 0.068 percent for private services, and 0.074 percent for government services).
Welfare Analysis The overall effect of the tax changes was a growth in aggregate demand, but this growth was not uniform.
Urban households earning wages and salaries experienced an overall increase in consumption; however,
the reduction in PIT resulted in overall lower consumption of primary products, especially among rural
households. The consumption of domestically produced manufactured products increased, as well as the
use of government services. Across all sectors, growth in consumption is driven by households earning
wages and salaries. Other households experienced varying levels of consumption reductions.
The net incomes of urban households earning wages and salaries increased by 7.563 percent, but the
incomes of all other types of households decreased. These decreases were larger for urban households
without wages or salaries (averaging 9.66 percent) than for all types of rural households (averaging 2.97
percent). This could be because urban households without wages or salaries do not have a foothold in
employment and hence did not directly benefit from the lower income tax rates.
In the factor markets, the tax reduction resulted in increased returns to both skilled labor (0.074 percent)
and unskilled labor (0.078 percent) across all sectors. The return to capital increased by 0.064 percent. No
wage distortion arose from the tax reduction. The real income effect was slightly higher for unskilled than
skilled labor, in part because the ETR was higher for low-income earners (who are mostly less skilled) than
for high-income earners.
The tax reduction brought about an increase in the consumption of imports, especially among urban
households earning wages and salaries. Higher disposable incomes brought about greater substitution
possibilities in consumption, hence the growth in imports.
20
Because our analytical model is static, it is not possible to establish the full growth effects of the tax change.
However, the government’s expansionary fiscal policies over the past few years have been accompanied
by growth in deficit financing by both households and the government. While the tax reduction positively
impacted disposable incomes, households may have been tempted to spend more instead of reduce their
indebtedness. It is for this reason that the IMF (2014) cautioned about the risks posed by high household
indebtedness.
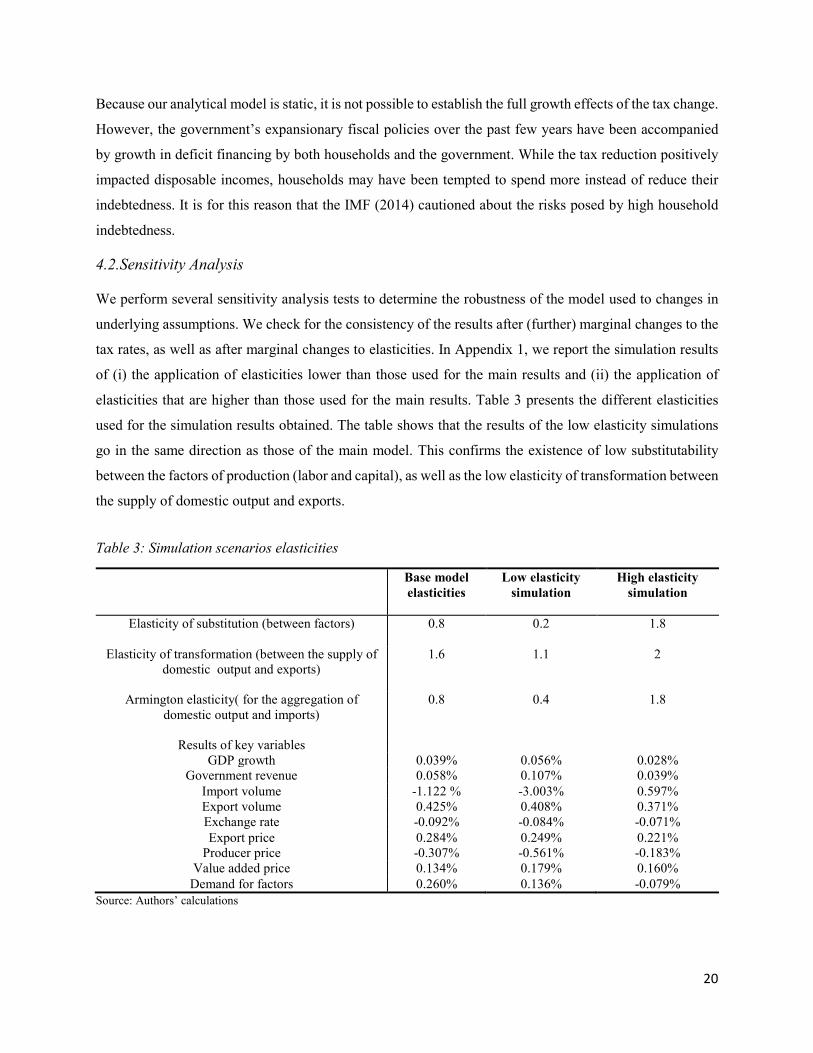
4.2.Sensitivity Analysis
We perform several sensitivity analysis tests to determine the robustness of the model used to changes in
underlying assumptions. We check for the consistency of the results after (further) marginal changes to the
tax rates, as well as after marginal changes to elasticities. In Appendix 1, we report the simulation results
of (i) the application of elasticities lower than those used for the main results and (ii) the application of
elasticities that are higher than those used for the main results. Table 3 presents the different elasticities
used for the simulation results obtained. The table shows that the results of the low elasticity simulations
go in the same direction as those of the main model. This confirms the existence of low substitutability
between the factors of production (labor and capital), as well as the low elasticity of transformation between
the supply of domestic output and exports.
Table 3: Simulation scenarios elasticities
Base model elasticities
Low elasticity simulation
High elasticity simulation
Elasticity of substitution (between factors) 0.8 0.2 1.8
Elasticity of transformation (between the supply of domestic output and exports)
1.6 1.1 2
Armington elasticity( for the aggregation of domestic output and imports)
0.8 0.4 1.8
Results of key variables GDP growth 0.039% 0.056% 0.028%
Government revenue 0.058% 0.107% 0.039% Import volume -1.122 % -3.003% 0.597% Export volume 0.425% 0.408% 0.371% Exchange rate -0.092% -0.084% -0.071% Export price 0.284% 0.249% 0.221%
Producer price -0.307% -0.561% -0.183% Value added price 0.134% 0.179% 0.160%
Demand for factors 0.260% 0.136% -0.079% Source: Authors’ calculations
21
All of the marginal changes produced results that conform with the main results analyzed previously.
Comparing the low elasticity simulation results to the main results shows that under the former, the
economy grows by a larger margin. Government revenue is also higher under the low elasticity simulation,
possibly indicating that, assuming that the true elasticities of the production, consumption and exchange
were lower than the ones used in the main results, the tax reforms would have brought about higher growth
and government revenue than predicted by the model.
Under all simulations, the exchange rate depreciates; however, it depreciates more under the low elasticities
simulation than under the high elasticities simulation. The low elasticity simulation shows a lower increase
in the volume of exports and price of exports than the benchmark. Producer prices fall by a larger percentage
under the high elasticities simulation, and the demand for factors also falls under this simulation. Under the
low elasticity simulation, factor prices respond in the same way as in the main results.
5. Conclusions and Policy Implications
This paper has evaluated the impacts of the tax reforms introduced in Namibia in the 2013-14 budget. It
has examined the impacts of the joint change in personal and corporate taxes, tracing the distributional
effects on households, firms, the government, and international trade. The impacts of these tax policy
changes tend to vary across institutions and markets. For households, a decrease in the effective tax rate
results in higher disposable incomes, especially for urban households that participate in the labor market.
Benefits to rural households are lower, principally because of these households’ reliance on subsistence
farming and mixed incomes. Households also benefit from falling consumption prices, thus experiencing
improvements in their consumption patterns. Further, households experience increasing returns to labor,
but falling employment in the primary and service sectors. Given Namibia’s high unemployment rates,
especially among those with little or no education, the tax cut likely enhances rather than reduce inequality
between skilled and unskilled labor. This is because unskilled and semi-skilled labor tends to be
concentrated in the primary and service sectors. If the policy aim is to reduce unemployment, the
government may to come up with more targeted initiatives to assist unskilled and semi-skilled workers.
Alongside the expansionary policies, it may also be necessary to introduce active labor market policies (e.g.
training and retraining programs and job creation initiatives) that enhance skill formation and acquisition
for better employment opportunities.
Our results also show that the tax reforms resulted in exchange rate depreciation. This outcome is a double-
edged sword in the sense that while depreciation increases export competitiveness, it may also result in a
high import bill in the case of import-dependent economies like Namibia. Namibia has a high dependence
on imports, especially of petroleum products and electricity; thus, the exchange rate depreciation results in

22
a high import bill that puts pressure of the country’s foreign currency reserves. The exchange rate
depreciation could also potentially result in higher inflation, given that electricity and petroleum-based fuels
are industry’s main source of energy. Fortunately, the fall in the international price of petroleum products
has helped taper these inflationary pressures. Households respond to rising disposable incomes by
increasing their consumption of imported products. Because of this response, foreign currency reserves
dwindle, putting further puts pressure on the exchange rate, notwithstanding its pegging to the South
African rand. In this scenario, exchange rate depreciation will likely propagate macroeconomic instability
within the system.
Sectoral analysis shows that the manufacturing sector tends to benefit more from the reforms than other
sectors. Output from manufacturing activities increases, together with manufacturing exports. The tax
changes appear to support the national policy of promoting manufacturing activities. Urban households
with wages and salaries, whose consumption basket contains more imports and manufactured products than
other households, benefit more from the reforms. Overall, the tax reforms impact the economy in some
unexpected ways, and this paper serves as a basis for policymakers to critically evaluate the potential
impacts of future tax policy changes.
23
References
Alton, T., C. Arndt, R. Davies, F. Hartley, K. Makrelov, J. Thurlow, and D. Ubogu. 2014. “Introducing
Carbon Taxes in South Africa.” Applied Energy 116: 344-354.
Bezabih, M., M. Chambwera, and J. Stage. 2011. “Climate Change and Total Factor Productivity in the
Tanzanian Economy.” Climate Policy 11(6): 1289–1302.
Chiappori, P-A. and A. Lewbel. 2015. “Gary Becker’s a Theory of the Allocation of Time.” The Economic
Journal 125 (March): 410–442.
De Silva, I. and S. Sumarto. 2014. “Does Economic Growth Really Benefit the Poor? Income Distribution
Dynamics and Pro-poor Growth in Indonesia.” Bulletin of Indonesian Economic Studies 50(2):
227-242.
Dollar, D. and A. Kraay. 2002. “Growth is Good for the Poor.” Journal of Economic Growth 7: 195-225.
Engen, E. and J. Skinner. 1996. “Taxation and Economic Growth.” National Tax Journal 49(4): 617-42.
Forsyth, P., L. Qwyer, R. Spurr, and T. Pham. 2014. “The Impacts of Australia’s Departure Tax: Tourism
versus the Economy?” Tourism Management 40: 126-136.
Gemmell, N. 1988. “Tax Systems, Tax Revenue and Growth in LDCs: A Review of Empirical Evidence.”
Review of European Economic Policy 23(2): 84-90.
Go, D.S., M. Kearney, S. Robinson, and K. Thierfelder. 2005. “An Analysis of South Africa’s Value Added
Tax.” World Bank Policy Research Working Paper 3671. Washington DC: World Bank.
Gordon, R.H. and Y. Lee. 2001. “Do Taxes Affect Corporate Debt Policy? Evidence from U.S. Corporate
Tax Return Data.” Journal of Public Economics 82(2): 195-224.
Government of Namibia. 2013. Budget Statement: Growing the Economy, Optimizing Development
Outcomes. Jointly Doing More with Less. Windhoek: Ministry of Finance.
International Monetary Fund (IMF). 2014. “2013 Article IV Consultation - Staff Report.” IMF Country
Report No. 14/40. Accessible at http://www.imf.org/external/pubs/ft/scr/2014/cr1440.pdf.
Kraay, A. 2006. “When Is Growth Pro-poor? Evidence from a Panel of Countries.” Journal of Development
Economics 80(1): 198-227.
Lange G. M. and K. Schade. 2008. “A Social Accounting Matrix for Namibia, 2004: A Tool for Analyzing
Economic Growth, Income Distribution and Poverty.” NEPRU Working Paper 112. Windhoek:
Namibian Economic Policy Research Unit.
Lofgren, H., R.L. Harris, and S. Robinson. 2002.” A Standard Computable General Equilibrium (CGE)
Model in GAMS.” Microcomputers in Policy Research No. 5. Washington, DC: International
Food Policy Research Institute.
24
Mukherjee, S. 2014. “Liberalisation and Jobless Growth in Developing Economy.” Journal of Economic
Integration 29(3): 450-469.
Namibia Statistics Agency. 2012. National Household Income and Expenditure Survey 2009-2010.
Windhoek: NSA.
Olinto, P., G.L. Ibarra, and J. Saavedra-Chanduvi. 2014. “Accelerating Poverty Reduction in a Less Poor
World: The Roles of Growth and Inequality.” Poverty Reduction and Economic Management
Network, Policy Research Working Paper 6855. Washington DC: World Bank.
Radulescu, D. and M. Stimmelmayr. 2010. “The Impact of the 2008 German Corporate Tax Reform: A
Dynamic CGE Analysis.” Economic Modelling 27: 454-467.
Ravallion, M. 2001. “Growth, Inequality and Poverty: Looking beyond Averages.” World Development
29(11): 1803-1815.
Sherbourne, R. 2013. Guide to the Namibian Economy 2013/14. Windhoek: Institute for Public Policy
Research.
Son, H.H. and N. Kakwani. 2008. “Global Estimates of Pro-poor Growth.” World Development 36(3):
1048–1066.
Thurlow, J. 2004. “A Dynamic Computable General Equilibrium Model for South Africa: Extending the
Static IFPRI Model.” Trade and Industrial Policy Strategies Working Paper No. 1. Pretoria: Trade
and Industrial Policy Strategies.
UNDP. 1996. Human Development Report 1996: Economic Growth and Human Development. New York:
UNDP.
World Bank. 2013. Doing Business 2013. 10th Edition. Washington DC: World Bank.
______. 2015. World Development Indicators 2015. Washington DC: World Bank.
25
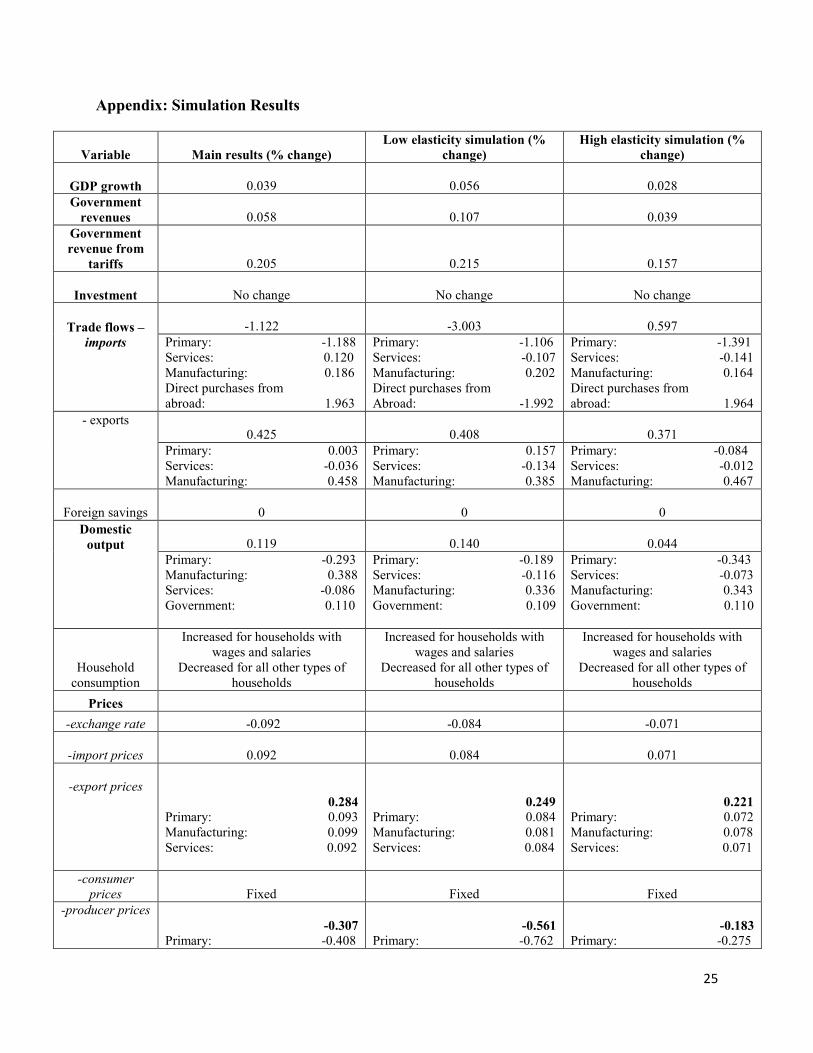
Appendix: Simulation Results
Variable Main results (% change) Low elasticity simulation (%
change) High elasticity simulation (%
change)
GDP growth
0.039
0.056
0.028 Government
revenues
0.058
0.107
0.039 Government revenue from
tariffs
0.205
0.215
0.157
Investment No change
No change
No change
Trade flows – imports
-1.122 -3.003
0.597 Primary: -1.188 Services: 0.120 Manufacturing: 0.186 Direct purchases from abroad: 1.963
Primary: -1.106 Services: -0.107 Manufacturing: 0.202 Direct purchases from Abroad: -1.992
Primary: -1.391 Services: -0.141 Manufacturing: 0.164 Direct purchases from abroad: 1.964
- exports
0.425
0.408
0.371
Primary: 0.003 Services: -0.036 Manufacturing: 0.458
Primary: 0.157 Services: -0.134 Manufacturing: 0.385
Primary: -0.084 Services: -0.012 Manufacturing: 0.467
Foreign savings
0 0 0 Domestic
output
0.119
0.140
0.044
Primary: -0.293 Manufacturing: 0.388 Services: -0.086 Government: 0.110
Primary: -0.189 Services: -0.116 Manufacturing: 0.336 Government: 0.109
Primary: -0.343 Services: -0.073 Manufacturing: 0.343 Government: 0.110
Household consumption
Increased for households with wages and salaries
Decreased for all other types of households
Increased for households with wages and salaries
Decreased for all other types of households
Increased for households with wages and salaries
Decreased for all other types of households
Prices -exchange rate -0.092 -0.084 -0.071
-import prices
0.092
0.084
0.071
-export prices
0.284 Primary: 0.093 Manufacturing: 0.099 Services: 0.092
0.249 Primary: 0.084 Manufacturing: 0.081 Services: 0.084
0.221 Primary: 0.072 Manufacturing: 0.078 Services: 0.071
-consumer prices
Fixed
Fixed
Fixed
-producer prices
-0.307
Primary: -0.408
-0.561
Primary: -0.762
-0.183
Primary: -0.275

26
Manufacturing: -0.024 Services: 0.057 Government: 0.068
Manufacturing: -0.051 Services: 0.102 Government: 0.150
Manufacturing: 0.012 Services: 0.037 Government: 0.043
-value added price
0.134
Primary: -0.076 Manufacturing: 0.068 Services: 0.068 Government: 0.074
0.179
Primary: -0.246 Manufacturing: 0.117 Services: 0.122 Government: 0.180
0.160 Primary: 0.031 Manufacturing: 0.044 Services: 0.044 Government: 0.045
Factor prices
-skilled labor
0.074
0.190
0.044
-unskilled labor
0.078
0.206
0.046
-capital
0.064
0.084
0.043
Demand for factors
0.260
Skilled labor: 0.260 Unskilled labor: -0.022 Capital: 0.022
0.136
Skilled labor: 0.020 Unskilled labor: - 0.010 Capital: 0.106
-0.079
Skilled labor: -0.024 Unskilled labor: -0.036 Capital: -0.019
27
AGRODEP Working Paper Series
0004. Investigating the Linkage between Climate Variables and Food Security in ESA Countries. Mounir
Belloumi. 2014.
0005. Post-Liberalization Markets, Export Firm Concentration, and Price Transmission along Nigerian
Cocoa Supply Chains. Joshua Olusegun Ajetomobi. 2014.
0006. Impact of Agricultural Foreign Aid on Agricultural Growth in Sub-Saharan Africa. A Dynamic
Specification. Reuben Adeolu Alabi. 2014.
0007. Implications of High Commodity Prices on Poverty Reduction in Ethiopia and Policy Options under
an Agriculture-Led Development Strategy. Lulit Mitik Beyene. 2014.
0008. Rainfall and Economic Growth and Poverty: Evidence from Senegal and Burkina Faso. François
Joseph Cabral. 2014.
0009. Product Standards and Africa’s Agricultural Exports. Olayinka Idowu Kareem. 2014.
0010. Welfare Effects of Policy-Induced Rising Food Prices on Farm Households in Nigeria. Adebayo M.
Shittu, Oluwakemi A. Obayelu, and Kabir K. Salman. 2015.
0011. The Impact of Foreign Large-scale Land Acquisitions on Smallholder Productivity: Evidence from
Zambia. Kacana Sipangule and Jann Lay. 2015.
0012. Analysis of Impact of Climate Change on Growth and Yield of Yam and Cassava and Adaptation
Strategies by the Crop Farmers in Southern Nigeria. Nnaemeka Chukwuone. 2015.
0013. How Aid Helps Achieve MDGs in Africa: The Case of Primary Education. Thierry Urbain Yogo.
2015.
0014. Is More Chocolate Bad For Poverty? An Evaluation of Cocoa Pricing Options for Ghana’s
Industrialization and Poverty Reduction. Francis Mulangu, Mario Miranda and Eugenie Maiga.
2015.
0015. Modeling the Determinants of Poverty in Zimbabwe. Carren Pindiriri. 2015.
0016. The Potential Impact of Climate Change on Nigerian Agriculture. Joshua Ajetomobi, Olusanya
Ajakaiye, and Adeniyi Gbadegesin. 2015.
0017. How Did War Dampen Trade in the MENA Region? Fida Karam and Chahir Zaki. 2015.
0018. Rising Global Food Prices and Price Variability: A Blessing or a Curse for Global Food Supply?
Mekbib G. Haile. 2015.
0019. Mother’s Education and Children’s Nutrition Outcomes in Burkina Faso: Is there a Strong Casual
Relationship? Eugenie Maiga. 2015.


