NBER WORKING PAPER SERIES
THE HIGHER EDUCATIONAL TRANSFORMATION OF CHINA AND ITS GLOBALIMPLICATIONS
Yao LiJohn Whalley
Shunming ZhangXiliang Zhao
Working Paper 13849http://www.nber.org/papers/w13849
NATIONAL BUREAU OF ECONOMIC RESEARCH1050 Massachusetts Avenue
Cambridge, MA 02138March 2008
This paper has been written with support from The Centre for International Governance Innovation(CIGI, Waterloo). We are grateful to Weimin Zhou, Kun Peng, and Li Wang for comments. The viewsexpressed herein are those of the author(s) and do not necessarily reflect the views of the NationalBureau of Economic Research.
NBER working papers are circulated for discussion and comment purposes. They have not been peer-reviewed or been subject to the review by the NBER Board of Directors that accompanies officialNBER publications.
© 2008 by Yao Li, John Whalley, Shunming Zhang, and Xiliang Zhao. All rights reserved. Short sectionsof text, not to exceed two paragraphs, may be quoted without explicit permission provided that fullcredit, including © notice, is given to the source.
The Higher Educational Transformation of China and Its Global ImplicationsYao Li, John Whalley, Shunming Zhang, and Xiliang ZhaoNBER Working Paper No. 13849March 2008JEL No. I2,I23
ABSTRACT
This paper documents the major transformation of higher education that has been underway in Chinasince 1999 and evaluates its potential global impacts. Reflecting China's commitment to continuedhigh growth through quality upgrading and the production of ideas and intellectual property as setout in both the 10th (2001-2005) and 11th (2006-2010) five-year plans, this transformation focuseson major new resource commitments to tertiary education and also embodies significant changes inorganizational form. This focus on tertiary education differentiates the Chinese case from other countrieswho earlier at similar stages of development instead stressed primary and secondary education. Thenumber of undergraduate and graduate students in China has been grown at approximately 30% peryear since 1999, and the number of graduates at all levels of higher education in China has approximatelyquadrupled in the last 6 years. The size of entering classes of new students and total student enrollmentshave risen even faster, and have approximately quintupled. Prior to 1999 increases in these areas weremuch smaller. Much of the increased spending is focused on elite universities, and new academic contractsdiffer sharply from earlier ones with no tenure and annual publication quotas often used. All of thesechanges have already had large impacts on China's higher educational system and are beginning tobe felt by the wider global educational structure. We suggest that even more major impacts will followin the years to come and there are implications for global trade both directly in ideas, and in idea derivedproducts. These changes, for now, seem relatively poorly documented in literature.
Yao LiDepartment of EconomicsSocial Science CentreUniversity of Western OntarioLondon, Ontario, Canada, N6A [email protected]
John WhalleyDepartment of EconomicsSocial Science CentreUniversity of Western OntarioLondon, Ontario N6A 5C2 CANADAand [email protected]
Shunming ZhangSchool of Economics and FinanceVictoria University of WellingtonP.O. Box 600 Wellington, [email protected]
Xiliang ZhaoDepartment of EconomicsXiamen [email protected]
1 Introduction
This paper documents the major transformation of higher educational that has been underway
in China since 1999 and evaluates its potential global impacts. Reflecting China’s commitment
to continued high growth through quality upgrading and the production of ideas and
intellectual property as set out in both the 10th (2001-2005) and 11th (2006-2010) five-year
plans, this transformation focuses on major new resource commitments to tertiary education
and also embodies significant changes in organizational form. The number of undergraduate
and graduate students in China has been growing at approximately 30% per year since 1999,
and the number of graduates at all levels of higher education in China has approximately
quadrupled in the last 6 years. The size of entering classes of new students and total student
enrollments have risen even faster, and have approximately quintupled. Prior to 1999 increases
in these areas were much smaller. Much of the increased spending is focused on elite
universities, and new academic contracts differ sharply from earlier ones, with no tenure and
annual publication quotas often used. All of these changes have already had large impacts on
China’s higher educational system and are beginning to be felt by the wider global educational
structure. Skilled labor supply in China now equals around 40% of that in all OECD countries.
The growth rate of student numbers is much higher than in the OECD. We suggest that even
more major impacts will follow for these changes in the years to come and there are
implications for global trade both directly in ideas, and in idea derived products. These changes,
for now, seem relatively poorly documented in literature.
The changes we document in what follows also reflect a wider strategy in China of
attempting to upgrade both the quality and skill content of production through large increases
in higher educational resource inputs, along with a series of other changes in economic policy
in China. This strategy primarily reflects strategic decisions made at high policy levels in
China, and is seemingly not driven by the demand side of labor markets defining potential
requirements of labor of different types. One result so far has been a sharp increase in the
number of individuals with high educational attainment in various areas independently of the
3
size of respective job markets, and this has created significant short term problems of
absorption and unemployment for labor associated with these activities. These education
policies have also been a factor in China’s increasing inequality. The educational
transformation underway in China seemingly differs from that in other low wage economies at
either similar or earlier stages of development, in focusing heavily on tertiary education rather
than on primary or secondary (unlike, say, India).
We suggest that the potential implications for the global educational system are major. We
discuss the relative size of changes in China’s labor force by category relative to the world
supply of labor by type or profession; the possible impacts on academic performance outside
China via potential international paper submissions and publications, and also how the global
supply and trade in ideas and idea related products maybe affected. The paper also speculates
on the effectiveness of these policies. In our final section we also briefly discuss the potential
global implications of these changes in terms of the ways in which perceptions of the education
growth link may change. China seems to be alone among lower income economies in having
focused its educational transformation in recent years on the tertiary educational sector, but at
the same time China is clearly undergoing radical change in many different areas of economic
activity and the educational system is only one of these. Previous efforts in other countries to
use educational transformation as a mechanism either to maintain high growth or to initiate
episodes of high growth have generally been regarded as unsuccessful, but the focus has been
primary and secondary education, not tertiary. In China’s case, these latest efforts seem to be
motivated by a desire to maintain high growth by using educational transformation as the
primary mechanism for skill upgrading and raising total factor productivity. If China succeeds,
other countries may follow with higher educational competition between countries as a
possible outcome.
The rest of the paper is organized as follows. Section 2 sets out broad dimensions of the
educational transformation underway in China, drawing on using the latest countrywide data.
Section 3 analyzes the policy objectives behind these educational policies and how they relate
to the broader development strategy now being used to maintain high growth in the China’s
economy through various types of quality upgrading. Section 4 accesses the effectiveness of
educational transformation policies. Section 5 assesses the wider global implications of the
4
transformation underway in China and Section 6 concludes.
2 The Dimensions of the Higher Educational Transformation in China
The changes which have taken place in China’s higher educational system since 1999 are
relatively poorly documented in available literature, but the changes are large and seemingly
have major implications for economic activity both within China and globally since China is a
large economy with a population of 1.3 billion. Below we set out some dimensions of the
changes involved.
2.1 Large increases in the number of students
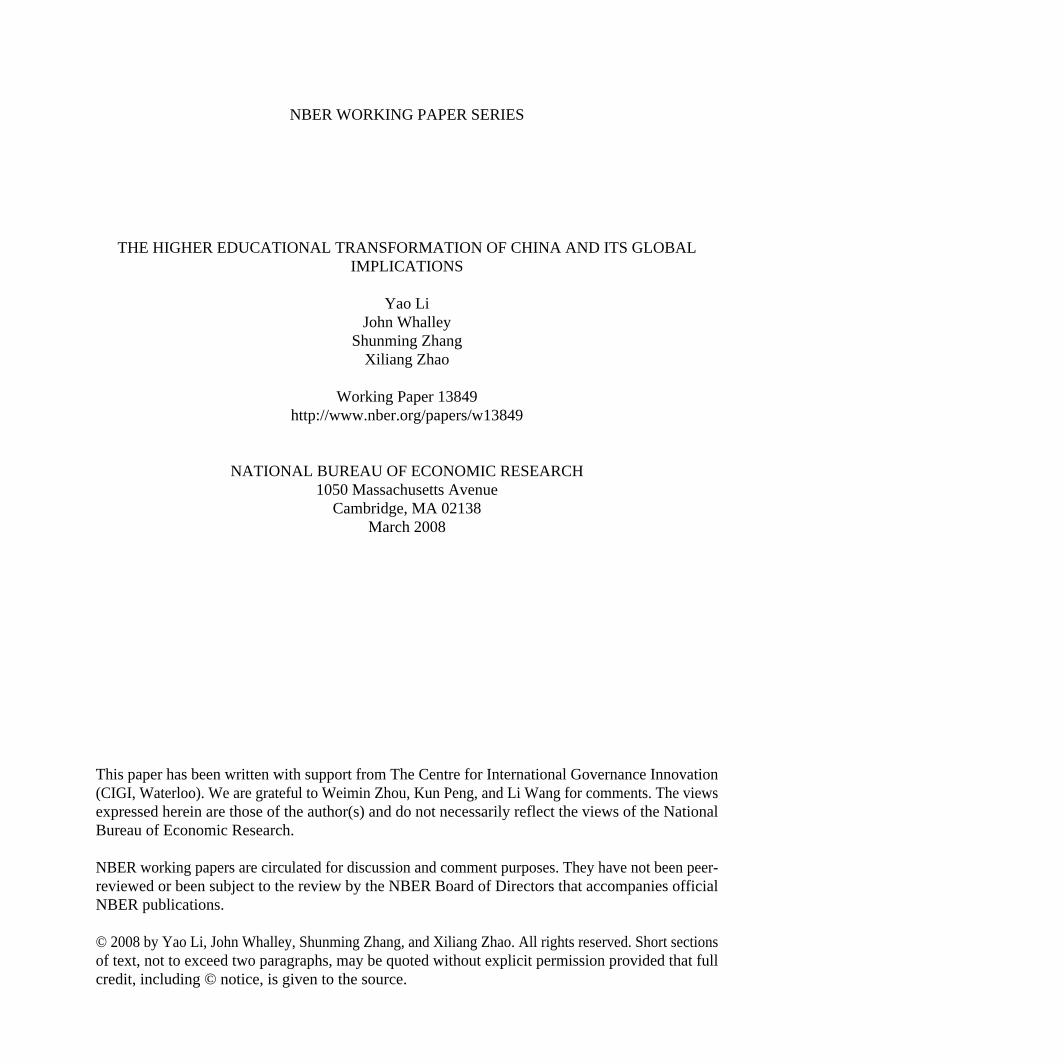
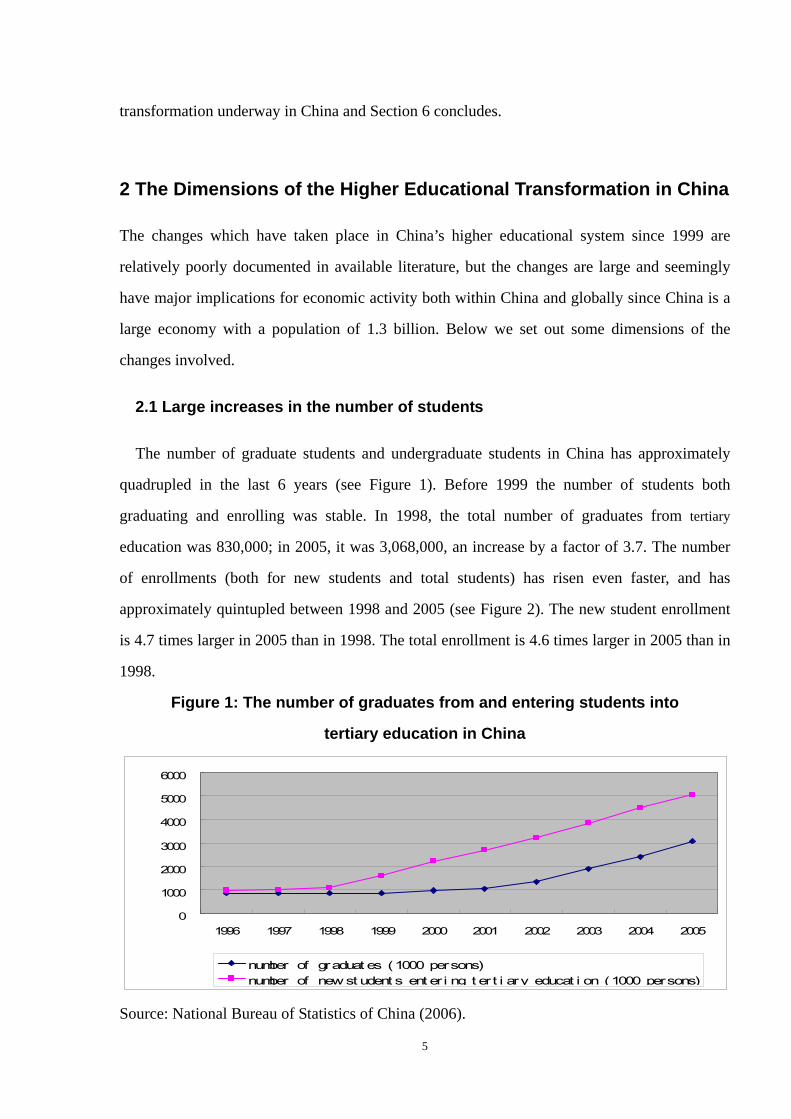
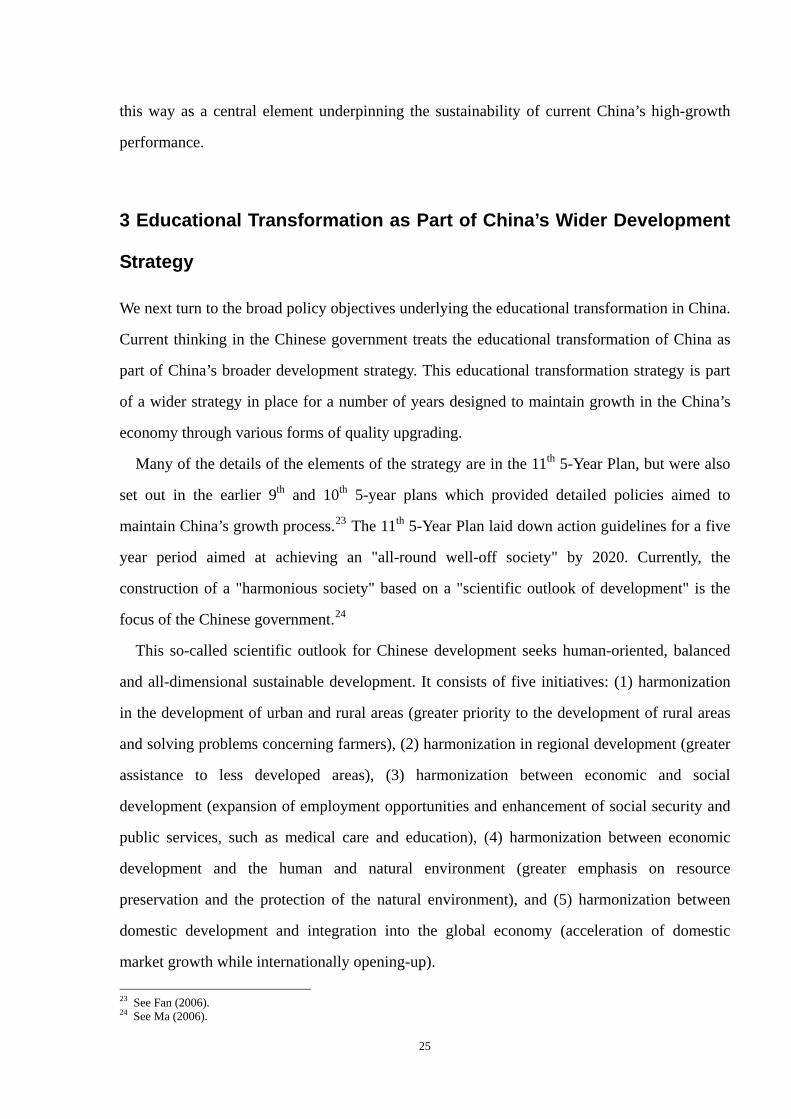
The number of graduate students and undergraduate students in China has approximately
quadrupled in the last 6 years (see Figure 1). Before 1999 the number of students both
graduating and enrolling was stable. In 1998, the total number of graduates from tertiary
education was 830,000; in 2005, it was 3,068,000, an increase by a factor of 3.7. The number
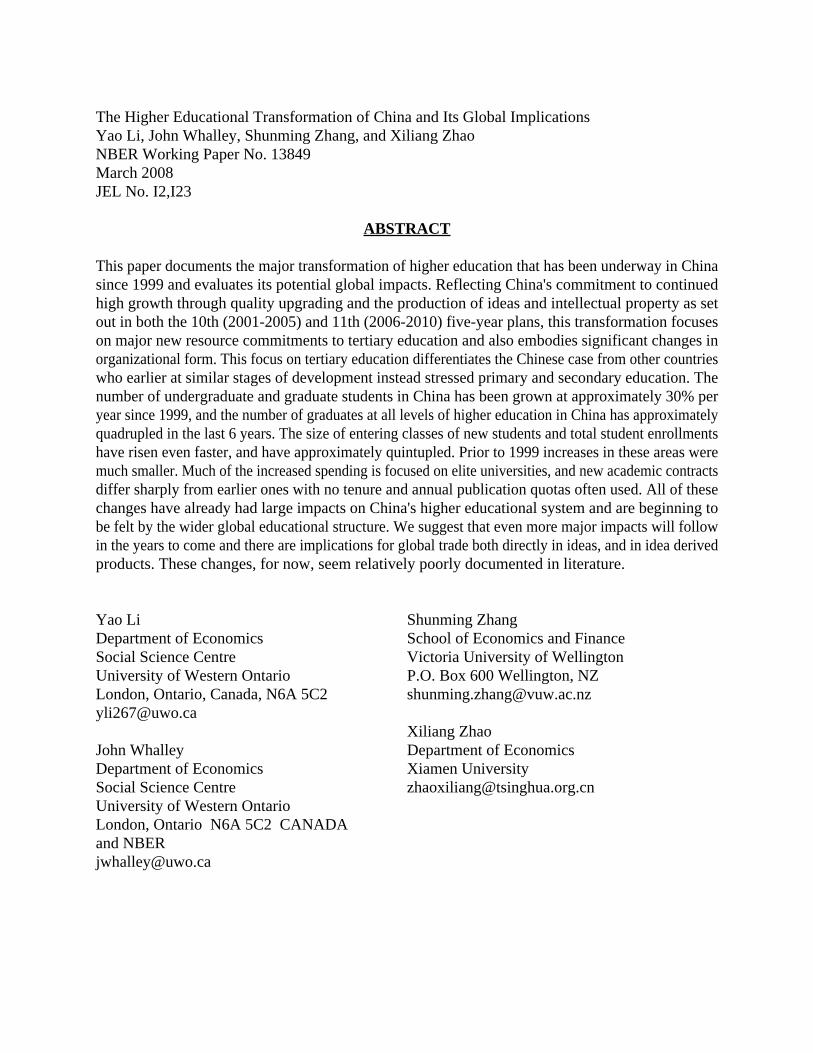
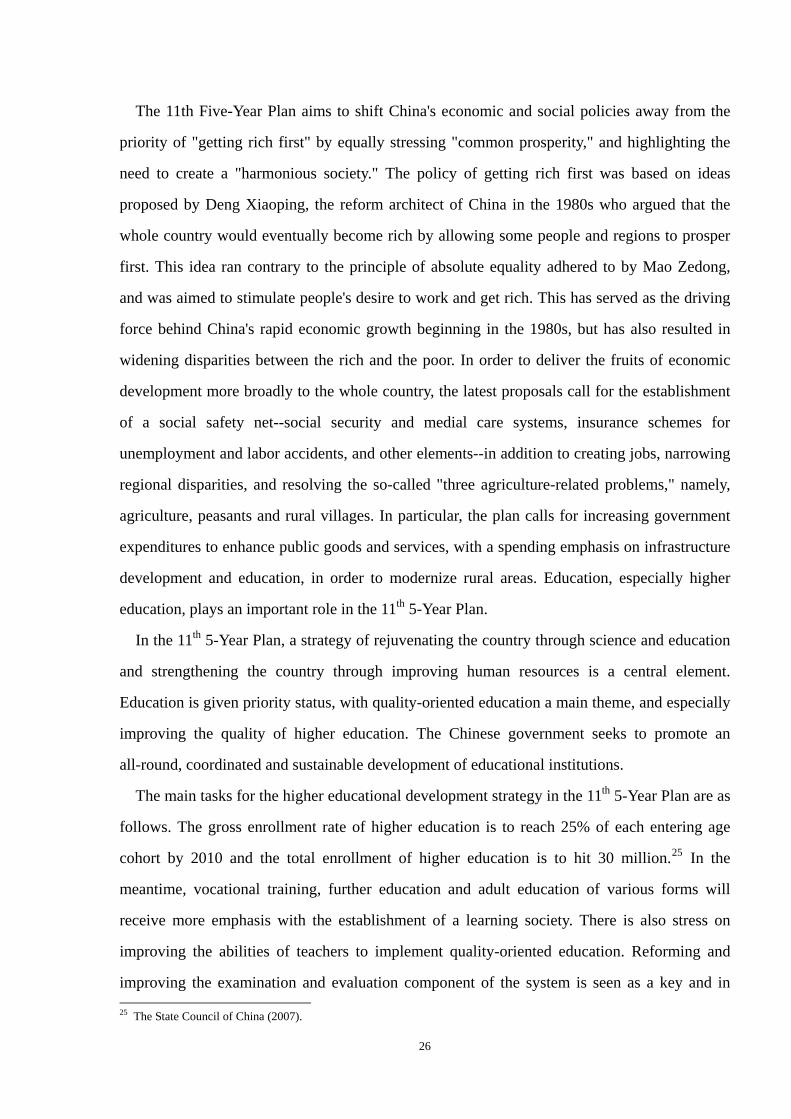
of enrollments (both for new students and total students) has risen even faster, and has
approximately quintupled between 1998 and 2005 (see Figure 2). The new student enrollment
is 4.7 times larger in 2005 than in 1998. The total enrollment is 4.6 times larger in 2005 than in
1998.
Figure 1: The number of graduates from and entering students into
tertiary education in China
0
1000
2000
3000
4000
5000
6000
1996 1997 1998 1999 2000 2001 2002 2003 2004 2005
number of graduat es (1000 persons)number of new st udent s ent er i ng t er t i ary educat i on (1000 persons)
Source: National Bureau of Statistics of China (2006).
5
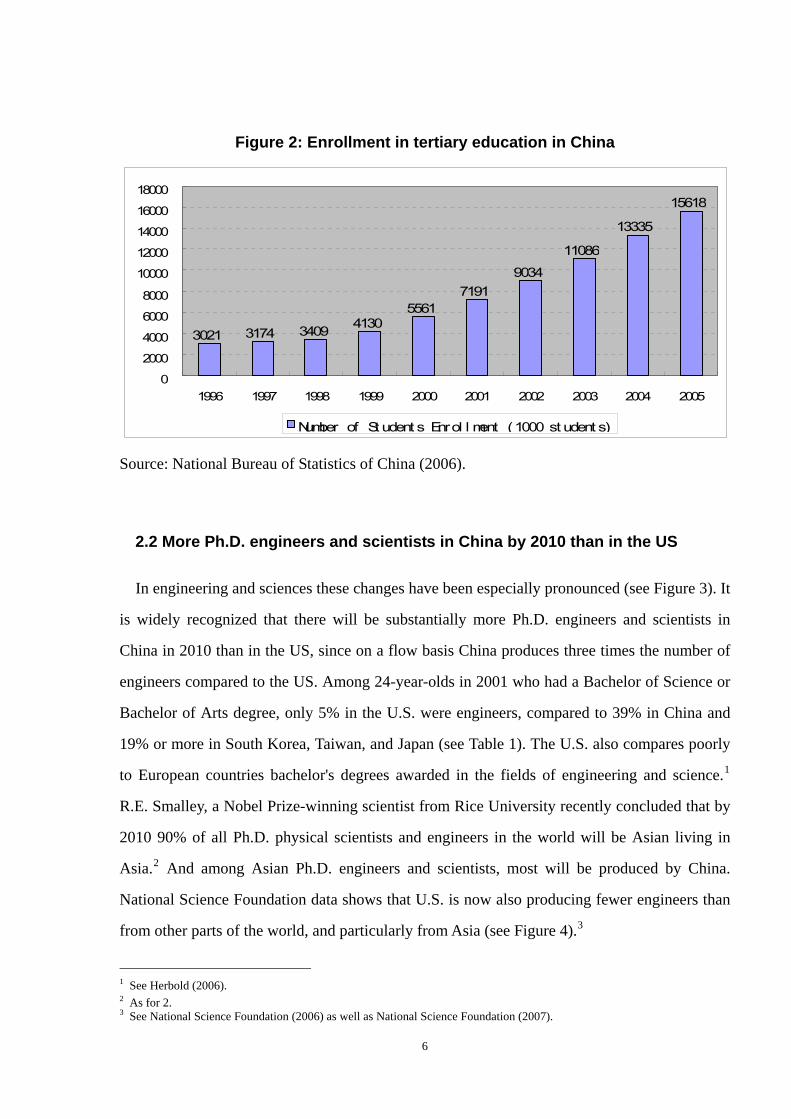
Figure 2: Enrollment in tertiary education in China
3021 3174 3409 41305561
71919034
11086
13335
15618
02000400060008000
1000012000140001600018000
1996 1997 1998 1999 2000 2001 2002 2003 2004 2005
Number of St udent s Enrol l ment (1000 st udent s)
Source: National Bureau of Statistics of China (2006).
2.2 More Ph.D. engineers and scientists in China by 2010 than in the US
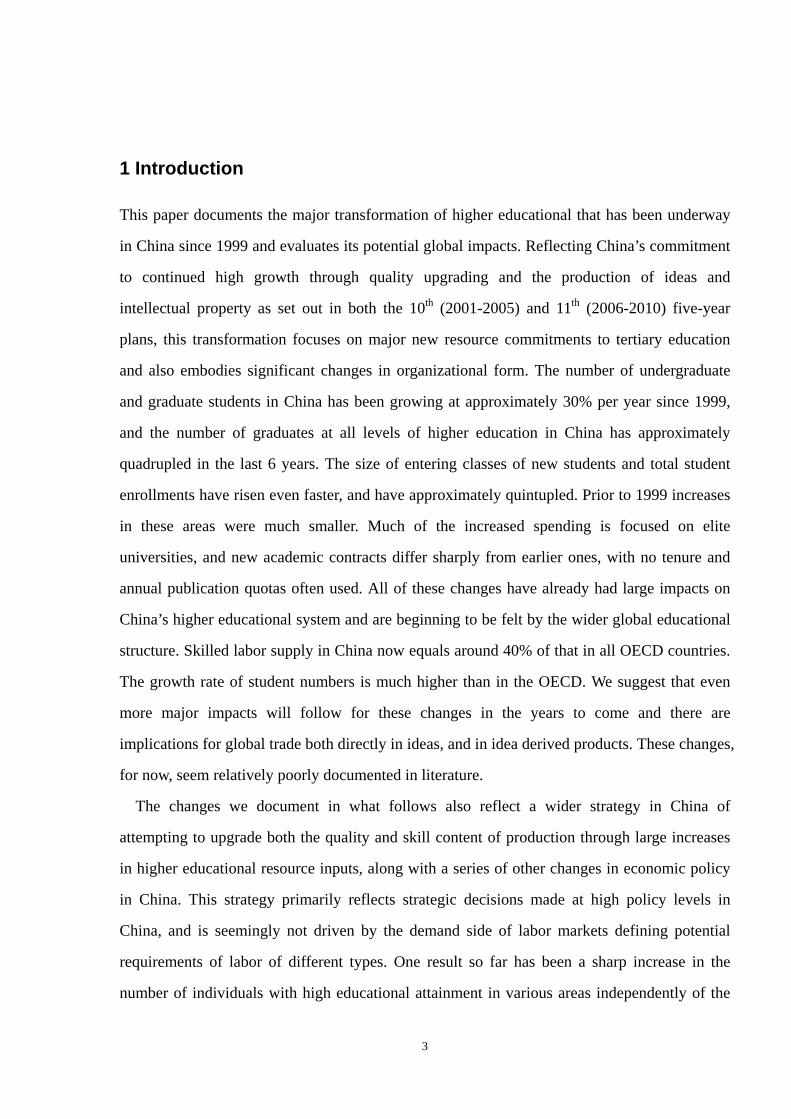
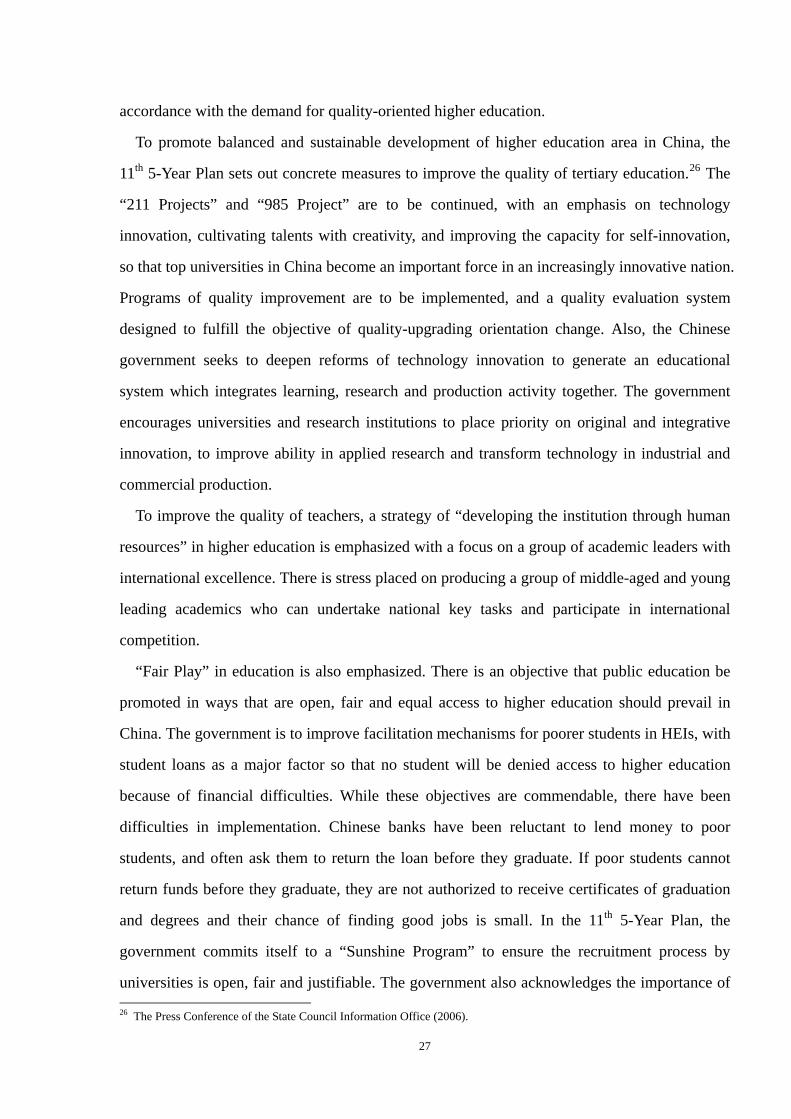
In engineering and sciences these changes have been especially pronounced (see Figure 3). It
is widely recognized that there will be substantially more Ph.D. engineers and scientists in
China in 2010 than in the US, since on a flow basis China produces three times the number of
engineers compared to the US. Among 24-year-olds in 2001 who had a Bachelor of Science or
Bachelor of Arts degree, only 5% in the U.S. were engineers, compared to 39% in China and
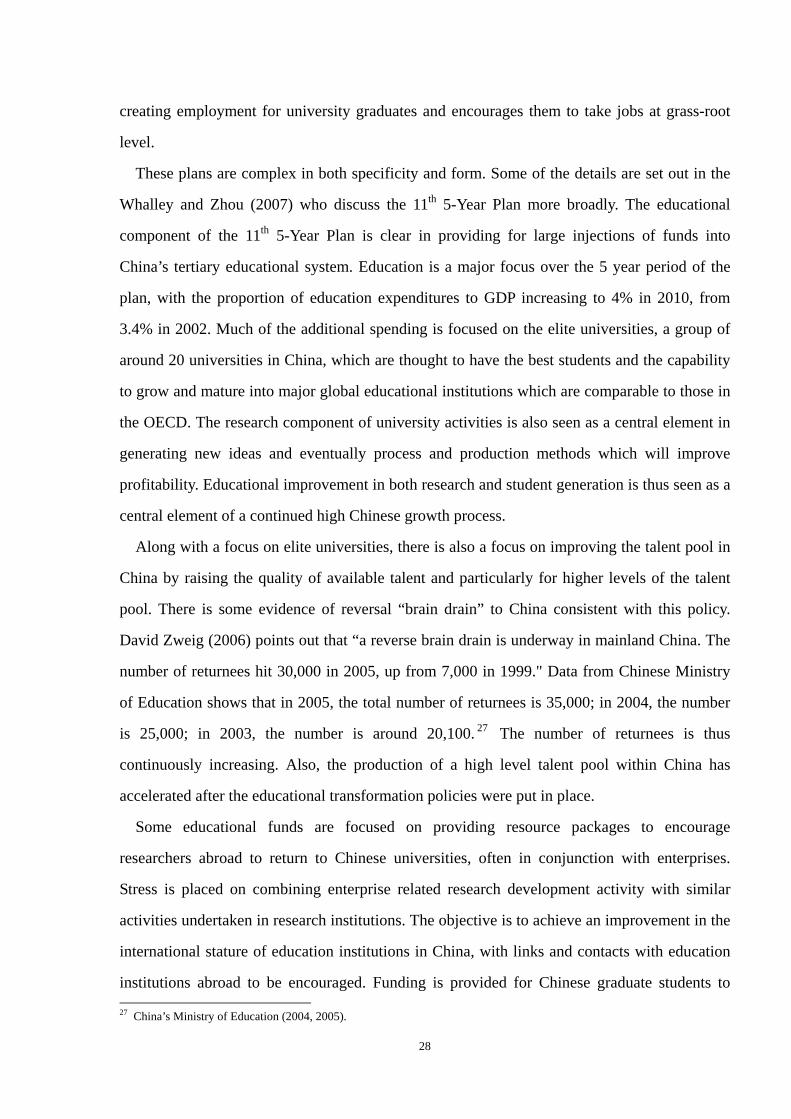
19% or more in South Korea, Taiwan, and Japan (see Table 1). The U.S. also compares poorly
to European countries bachelor's degrees awarded in the fields of engineering and science.1
R.E. Smalley, a Nobel Prize-winning scientist from Rice University recently concluded that by
2010 90% of all Ph.D. physical scientists and engineers in the world will be Asian living in
Asia.2 And among Asian Ph.D. engineers and scientists, most will be produced by China.
National Science Foundation data shows that U.S. is now also producing fewer engineers than
from other parts of the world, and particularly from Asia (see Figure 4).3
1 See Herbold (2006). 2 As for 2. 3 See National Science Foundation (2006) as well as National Science Foundation (2007).
6
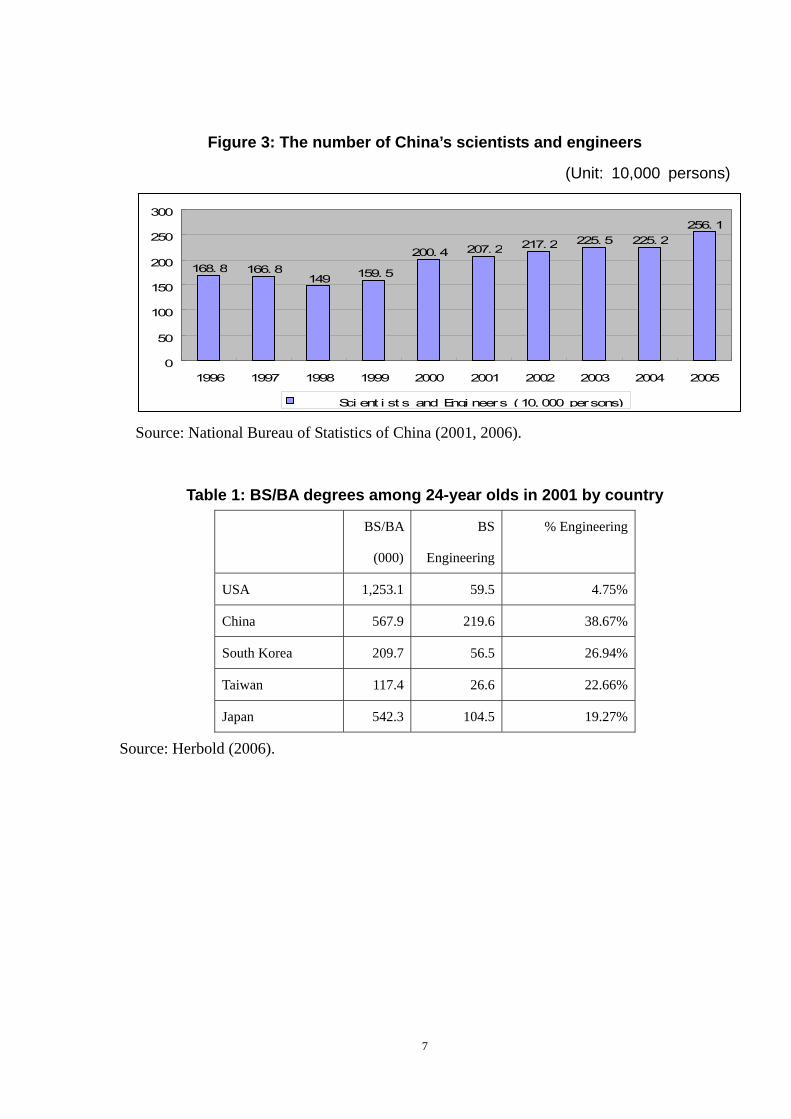
Figure 3: The number of China’s scientists and engineers
(Unit: 10,000 persons)
168. 8 166. 8149 159. 5
200. 4 207. 2 217. 2 225. 5 225. 2256. 1
0
50
100
150
200
250
300
1996 1997 1998 1999 2000 2001 2002 2003 2004 2005
Sci ent i st s and Engi neers (10, 000 persons) Source: National Bureau of Statistics of China (2001, 2006).
Table 1: BS/BA degrees among 24-year olds in 2001 by country
BS/BA
(000)
BS
Engineering
% Engineering
USA 1,253.1 59.5 4.75%
China 567.9 219.6 38.67%
South Korea 209.7 56.5 26.94%
Taiwan 117.4 26.6 22.66%
Japan 542.3 104.5 19.27%
Source: Herbold (2006).
7
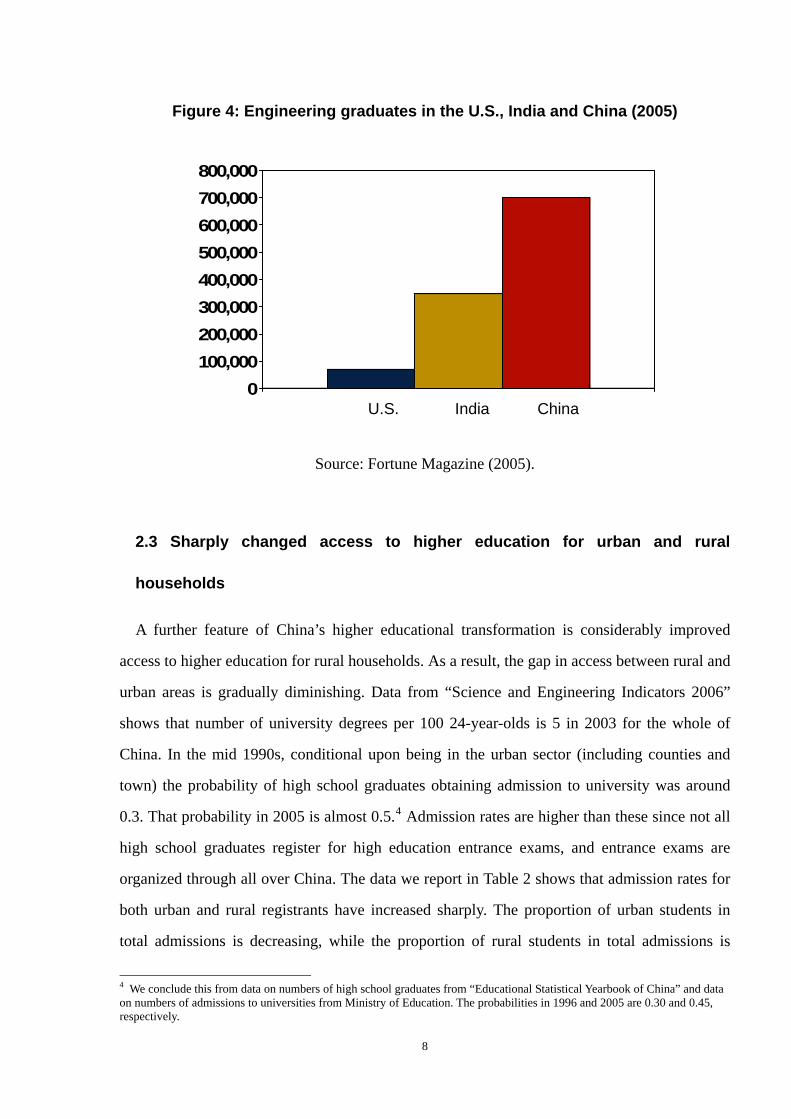
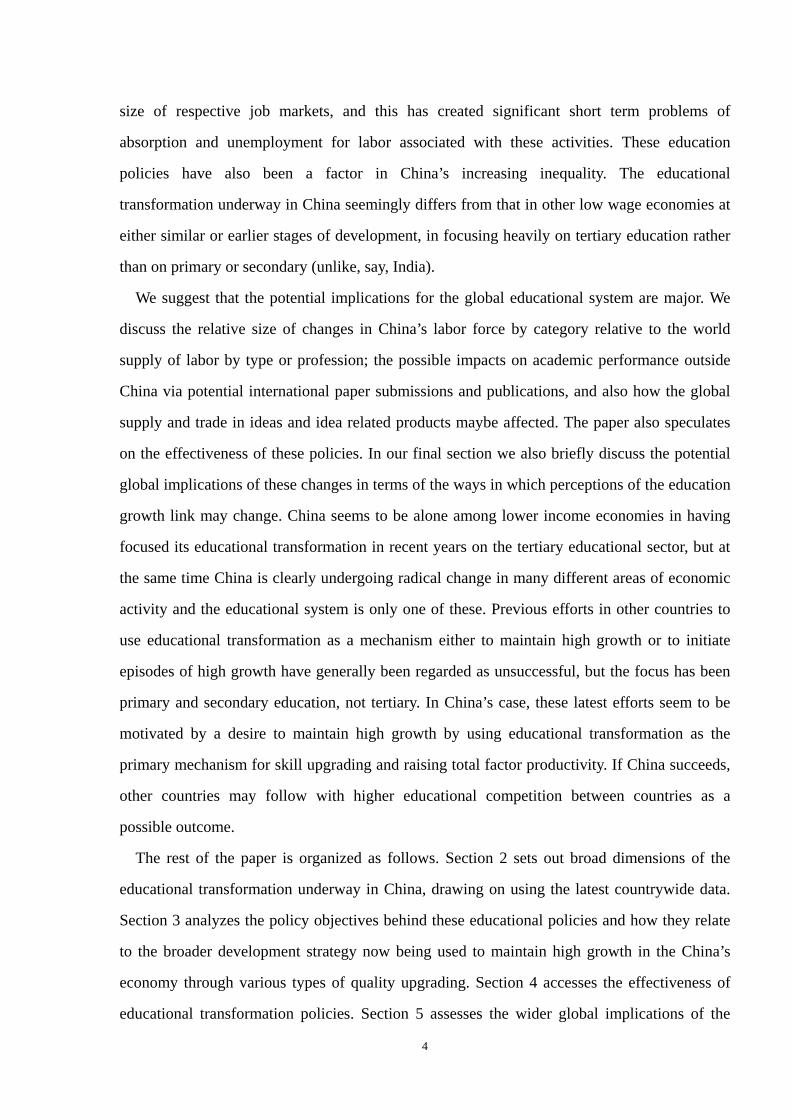
Figure 4: Engineering graduates in the U.S., India and China (2005)
U.S. India China 0
100,000200,000300,000400,000500,000600,000700,000800,000
Source: Fortune Magazine (2005).
2.3 Sharply changed access to higher education for urban and rural
households
A further feature of China’s higher educational transformation is considerably improved
access to higher education for rural households. As a result, the gap in access between rural and
urban areas is gradually diminishing. Data from “Science and Engineering Indicators 2006”
shows that number of university degrees per 100 24-year-olds is 5 in 2003 for the whole of
China. In the mid 1990s, conditional upon being in the urban sector (including counties and
town) the probability of high school graduates obtaining admission to university was around
0.3. That probability in 2005 is almost 0.5.4 Admission rates are higher than these since not all
high school graduates register for high education entrance exams, and entrance exams are
organized through all over China. The data we report in Table 2 shows that admission rates for
both urban and rural registrants have increased sharply. The proportion of urban students in
total admissions is decreasing, while the proportion of rural students in total admissions is
4 We conclude this from data on numbers of high school graduates from “Educational Statistical Yearbook of China” and data on numbers of admissions to universities from Ministry of Education. The probabilities in 1996 and 2005 are 0.30 and 0.45, respectively.
8
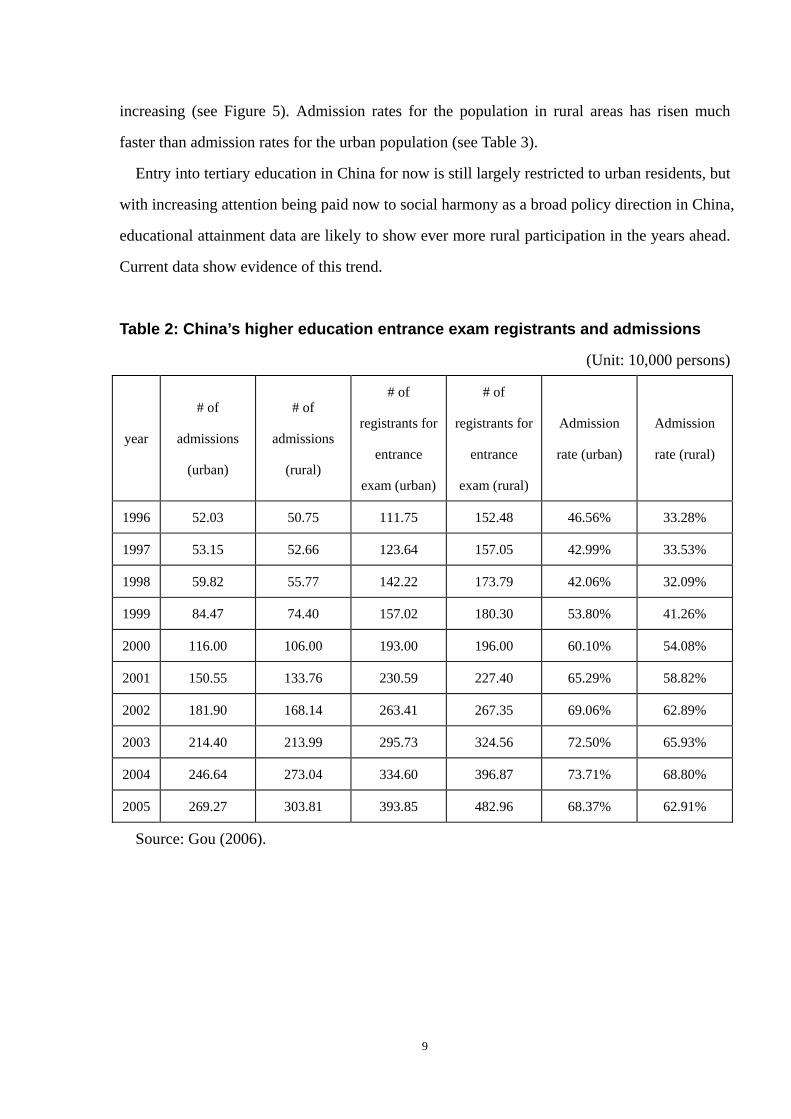
increasing (see Figure 5). Admission rates for the population in rural areas has risen much
faster than admission rates for the urban population (see Table 3).
Entry into tertiary education in China for now is still largely restricted to urban residents, but
with increasing attention being paid now to social harmony as a broad policy direction in China,
educational attainment data are likely to show ever more rural participation in the years ahead.
Current data show evidence of this trend.
Table 2: China’s higher education entrance exam registrants and admissions
(Unit: 10,000 persons)
year
# of
admissions
(urban)
# of
admissions
(rural)
# of
registrants for
entrance
exam (urban)
# of
registrants for
entrance
exam (rural)
Admission
rate (urban)
Admission
rate (rural)
1996 52.03 50.75 111.75 152.48 46.56% 33.28%
1997 53.15 52.66 123.64 157.05 42.99% 33.53%
1998 59.82 55.77 142.22 173.79 42.06% 32.09%
1999 84.47 74.40 157.02 180.30 53.80% 41.26%
2000 116.00 106.00 193.00 196.00 60.10% 54.08%
2001 150.55 133.76 230.59 227.40 65.29% 58.82%
2002 181.90 168.14 263.41 267.35 69.06% 62.89%
2003 214.40 213.99 295.73 324.56 72.50% 65.93%
2004 246.64 273.04 334.60 396.87 73.71% 68.80%
2005 269.27 303.81 393.85 482.96 68.37% 62.91%
Source: Gou (2006).
9
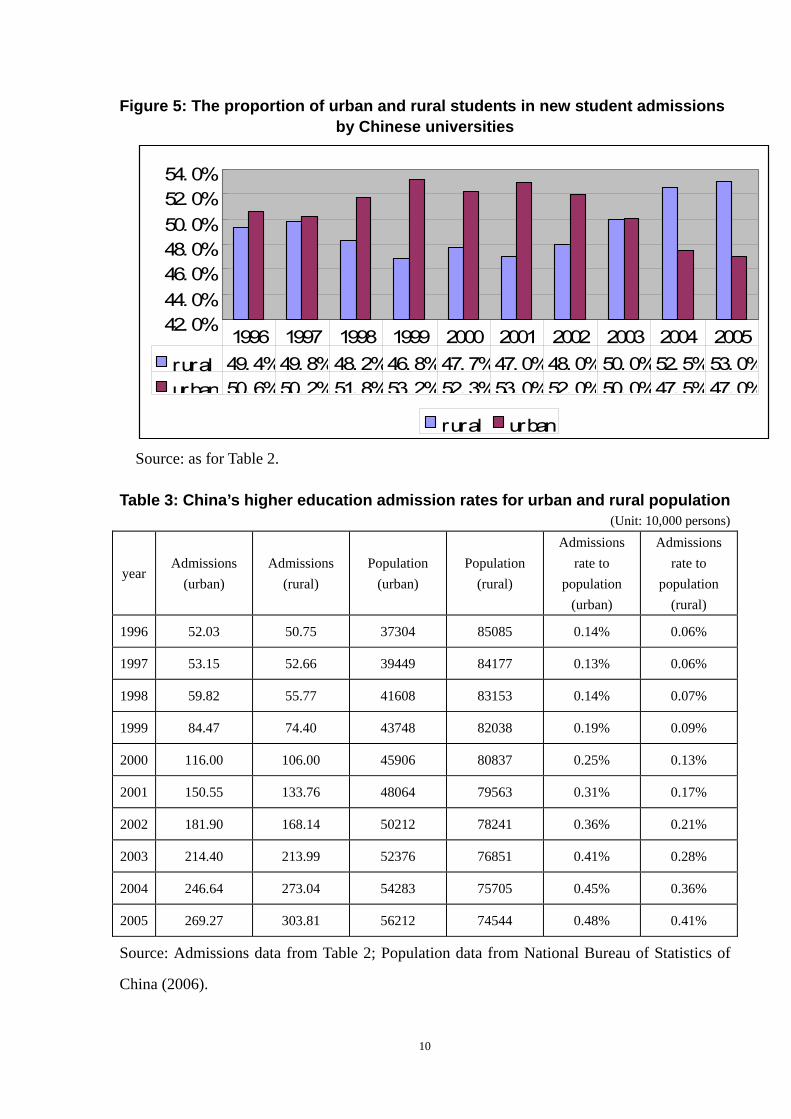
Figure 5: The proportion of urban and rural students in new student admissions by Chinese universities
42.0%44.0%46.0%48.0%50.0%52.0%54.0%
rural urban
rural 49.4%49.8%48.2%46.8%47.7%47.0%48.0%50.0%52.5%53.0%urban 50.6%50.2%51.8%53.2%52.3%53.0%52.0%50.0%47.5%47.0%
1996 1997 1998 1999 2000 2001 2002 2003 2004 2005
Source: as for Table 2.
Table 3: China’s higher education admission rates for urban and rural population
(Unit: 10,000 persons)
year Admissions
(urban) Admissions
(rural) Population
(urban) Population
(rural)
Admissions rate to
population (urban)
Admissions rate to
population (rural)
1996 52.03 50.75 37304 85085 0.14% 0.06%
1997 53.15 52.66 39449 84177 0.13% 0.06%
1998 59.82 55.77 41608 83153 0.14% 0.07%
1999 84.47 74.40 43748 82038 0.19% 0.09%
2000 116.00 106.00 45906 80837 0.25% 0.13%
2001 150.55 133.76 48064 79563 0.31% 0.17%
2002 181.90 168.14 50212 78241 0.36% 0.21%
2003 214.40 213.99 52376 76851 0.41% 0.28%
2004 246.64 273.04 54283 75705 0.45% 0.36%
2005 269.27 303.81 56212 74544 0.48% 0.41%
Source: Admissions data from Table 2; Population data from National Bureau of Statistics of
China (2006).
10
2.4 The promotion of elite universities and consolidation of other universities
A further feature of recent Chinese higher educational policy has been both to promote
so-called “elite” universities and also to consolidate other universities and reduce their numbers.
Elite universities are the top ten universities in China, which receive the largest education
funds from central and local governments. They have priority in selecting students through
national entrance exams and have the best faculty and research resources in China. The focus
of policy is to elevate a small number of Chinese universities to world class status, and both
strengthen them and make them bigger. All universities in China have in recent years been
subject to directives from central ministries to substantially increase their numbers of
undergraduate students, even if significant increase in infrastructure to handle this increase in
student numbers lags. Increases in undergraduates of 30% a year have common in many
universities are as a result of this policy.
In many of China’s major cities there has also been consolidation of universities, with, say, 4
or 5 small universities in the city consolidated into a large single entity as a way of improving
their ranking. This in part reflects incentives pursued by local governments so as to secure
more central funding. Data from the Chinese Ministry of Education show that 431
consolidations occurred between January 12, 1990 and May 15, 2006 and 60% of these
occurred between 1999 and 2006.5 Many of the consolidations involved elite universities. But
this also partly reflects a Chinese government reorientation of higher education in the mid
1990s. under the “211 Higher Education Development Project”6 put forward at the time. This
advocated priority development of about 100 higher educational institutions so that they could
rank among the top universities in the world. For example, Beijing Medical University was
incorporated into Peking University and was formally renamed Faculty of Health Science,
Peking University in 2000. Eventually, the Central Arts and Design College was incorporated
into Tsinghua University and was renamed Faculty of Arts and Design, Tsinghua University in
1999. 5 China’s Ministry of Education (2006a). 6 Announced in 1993, Project 211 is to identify for the 21st century 100 institutions and a number of disciplines of 'world standard' by preferential treatment. See Lang, D. W. and Q. Zha (2004).
11
2.5 A change from quantity- to quality-orientation in education
These higher educational changes have also been accompanied by a change in focus from
quantity flow through in education in the pre 1999 period, to an elevated emphasis on quality
post 1999. Educational attainment in China is now subject to firm quantity indicators which are
designed to drive continued improvement of educational quality by participating institutions.
Funding is now longer simply a matter of increasing the numbers of students enrolled and
universities and institutions of high education in China are now subject to extraordinary
pressures to upgrade themselves in terms of objective rankings. High priority is placed on
international rankings taken as publications in international journals, citations, and
international cooperation. These are used as demonstration of elevation of attainment for each
educational institution and funding is directly linked to these indicators. Some of this focus on
improved educational attainment in China seems to be spontaneous and itself accelerated by
the policy process that exerts the pressure. It is now accepted as important for universities and
related institutions to achieve publication in journals of good ranking and what is generated by
publication citations counts equally for Chinese scholars in appointment, maintenance of
position, and promotion. Indicators of educational attainments in terms of international
rankings across countries, publications of papers, and citations feed directly into annual
performance indicators for Chinese faculty in an ongoing process which goes substantially
beyond the once in a lifetime tenure system outside China. It is not uncommon for an annual
target of three international publications to be set for faculty members, with termination of
employment to occur on non fulfillment. Universities themselves may also be given targets for
improvements in international rankings and activities. The resulting changes in quality of
educational performance both by educational institutions overall and individual faculty
members and students are striking. For instance, China’s share of Asian science and
engineering articles was increased from 14.54% in 1998 to 22.43% in 2003, with an annual
growth rate of 9%.
The primary stress on education attainment is on traditional academic disciplines, especially
sciences, but social sciences and business also enter. Arts has been given relatively low priority.
12
Conventional vocational training as practiced in OECD countries in professions in trades such
as plumbers, electricians, travel agents and hairdressers has been given low priority, but more
recently vocational training has been paid more attention than before. So far, there is limited
professional certification for trades in China and the focus on vocational training has been on
professions -- doctors, nurses, lawyers, dentists and others.
Later in the paper we outline what some of the dimensions of change quality are and stress
that both quality and quantity educational changes are occurring together. It is also important to
stress that the increase in student numbers in both undergraduate and graduate programs of
over 30% per year is much higher than the underlying growth rate of China’s economy, and
these changes are also taking place during a period of demographic transition to one-child per
family.
2.6 Data on China’s educational transformation
While the educational transformation underway since 1999 in China seems major and radical,
surprisingly enough, available data on a system-wide basis is surprisingly sparse. We have
assembled data on numbers of students both entering and graduating by area of study and
educational institution. These areas of attainments include sciences (physics, chemistry,
engineering, computer science and related fields), social sciences (including economics,
political science, psychology and other disciplines), business and business related studies, and
also professions, including doctors, nurses, and lawyers.
In many of these areas, particularly in business, there are now large private costs involved
with educational participation for households in China. Educational attainment is given high
priority in the social structure and the gains in terms of upward social mobility and income
benefits associated with educational attainment are perceived to be large. Entry into education
seemingly generates social inequalities, which is a source of current concern in China given the
rapid increases in income and wealth inequality in recent years.7 There are some data, for
instance, that suggest that it is not uncommon for a substantial proportion of urban and rural
households to devote considerable incomes to tutoring expenditures, so that entrance into an 7 See Zhang (2006) as well as Li (2005).
13
educational institution can be attained by their children.8 A survey conducted by Chinese
Academy of Social Sciences (hereafter CASS) shows that education expenditures for children
ranks No.1 in consumption categories for Chinese households, and overwhelms pension and
house expenditures.9 The proportion of tuition and other education fees to per capita net
income for rural households has increased from 16.6% in 1996 to 33.2% in 2003.10 These costs
are additional to the time costs of parents.
It is also not uncommon for students to study subject material from the age of 6 at which
point that may on average devote 8.6 hours a day at school, with some spending 12 hours a day
in the classroom, according to a survey conducted by the Chinese Youth and Children Research
Center (CYCRC).11 The survey also claimed that the majority of children spend longer hours at
school than their parents spend at work. All of these features thus feed into an educational
process which is now central to both China’s economy and social structure.
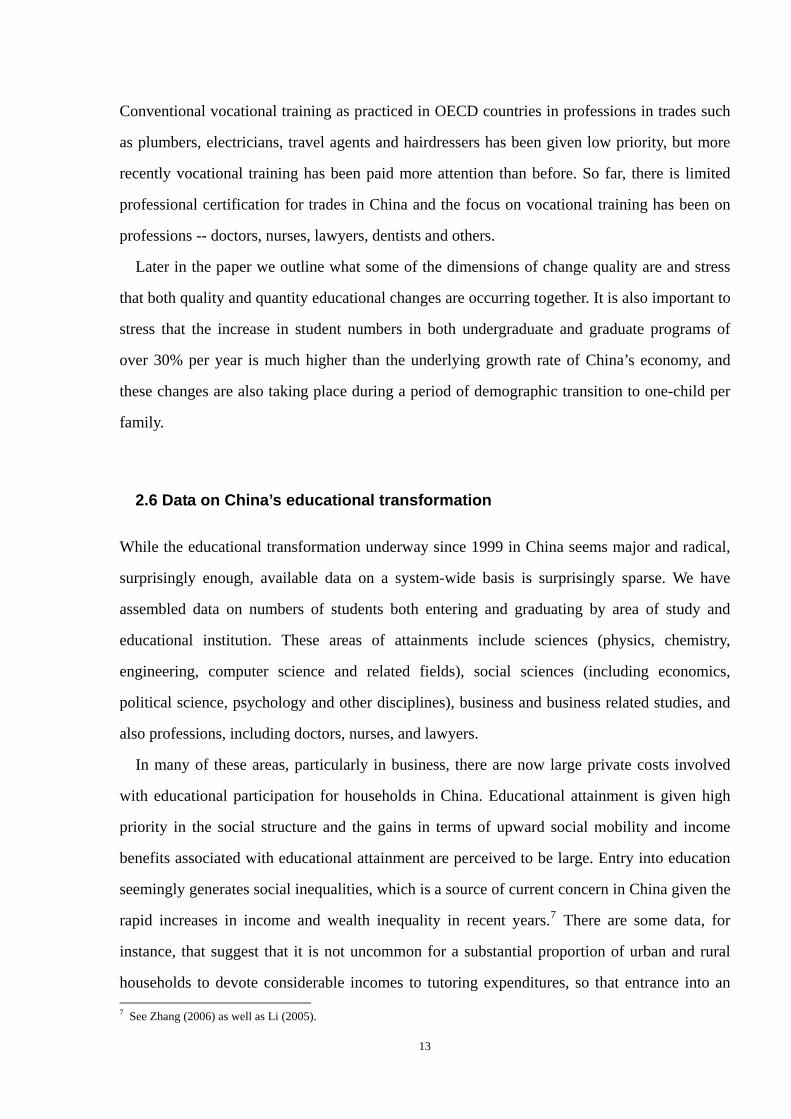
2.6.1 Countrywide data by subject area of study and institution type
Table 4 shows numbers of students in regular HEIs (higher education institutions, including
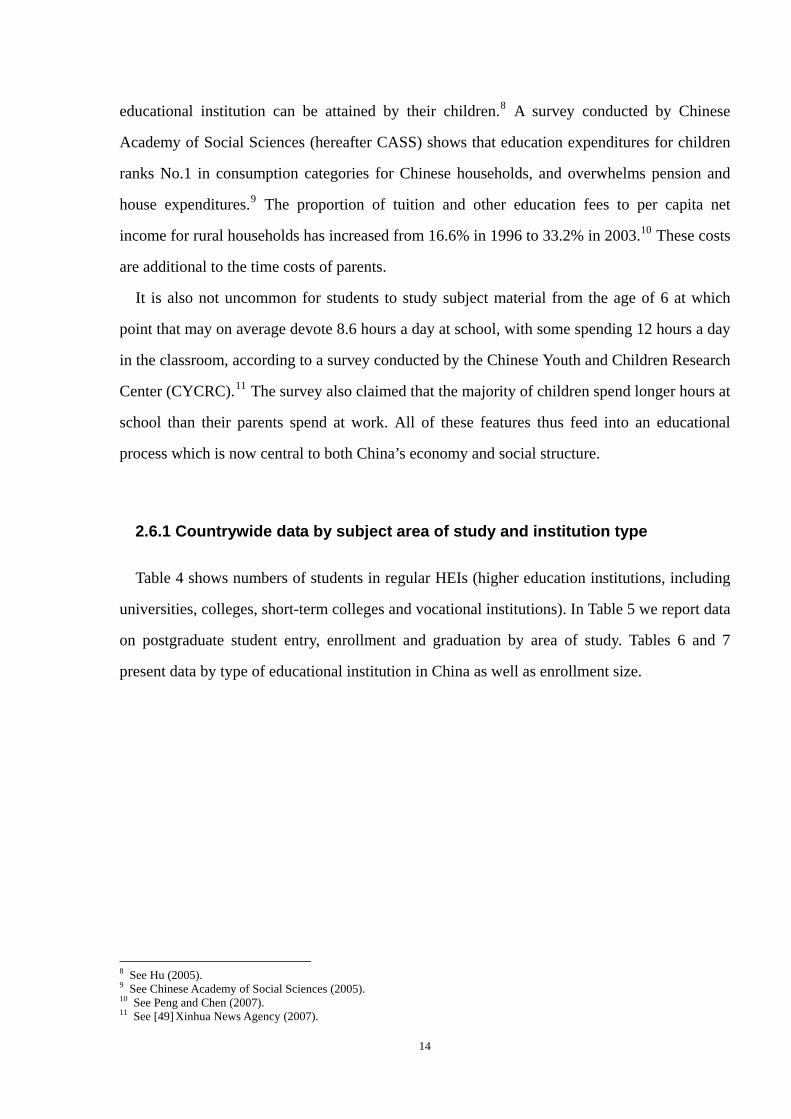
universities, colleges, short-term colleges and vocational institutions). In Table 5 we report data
on postgraduate student entry, enrollment and graduation by area of study. Tables 6 and 7
present data by type of educational institution in China as well as enrollment size.
8 See Hu (2005). 9 See Chinese Academy of Social Sciences (2005). 10 See Peng and Chen (2007). 11 See [49] Xinhua News Agency (2007).
14
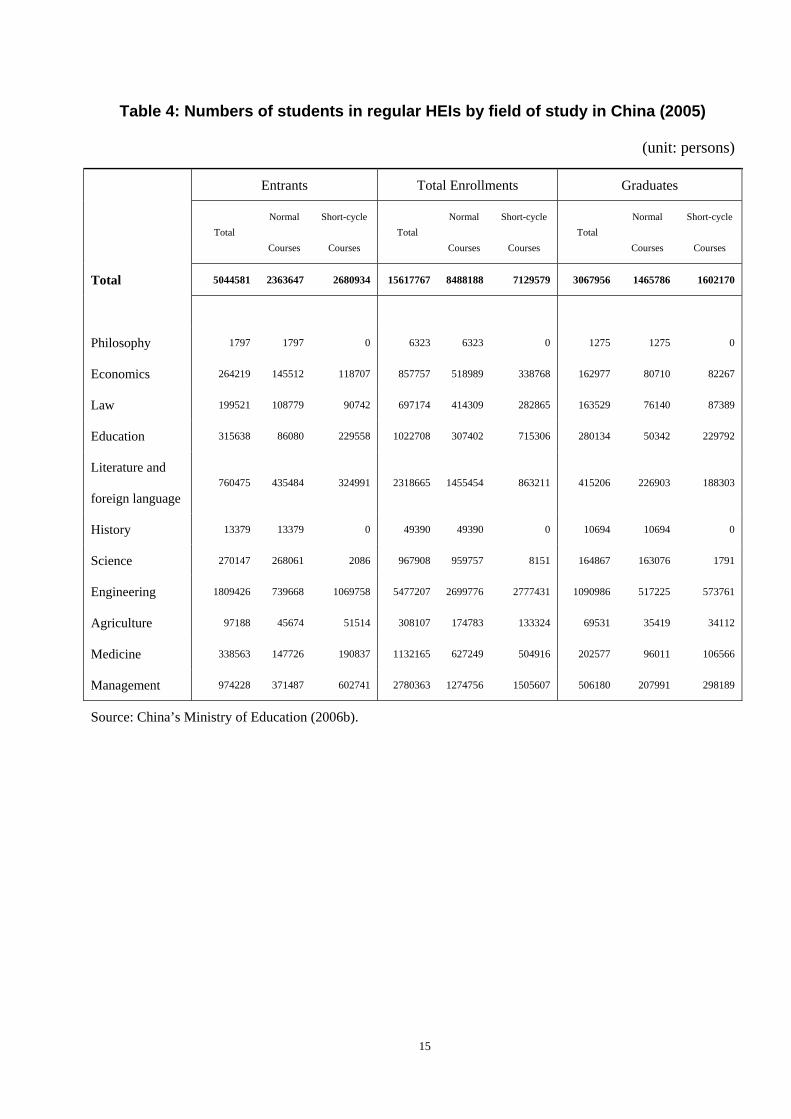
Table 4: Numbers of students in regular HEIs by field of study in China (2005)
(unit: persons)
Entrants Total Enrollments Graduates
Total
Normal Short-cycle Total
Normal Short-cycle Total
Normal Short-cycle
Courses Courses Courses Courses Courses Courses
Total 5044581 2363647 2680934 15617767 8488188 7129579 3067956 1465786 1602170
Philosophy 1797 1797 0 6323 6323 0 1275 1275 0
Economics 264219 145512 118707 857757 518989 338768 162977 80710 82267
Law 199521 108779 90742 697174 414309 282865 163529 76140 87389
Education 315638 86080 229558 1022708 307402 715306 280134 50342 229792
Literature and
foreign language 760475 435484 324991 2318665 1455454 863211 415206 226903 188303
History 13379 13379 0 49390 49390 0 10694 10694 0
Science 270147 268061 2086 967908 959757 8151 164867 163076 1791
Engineering 1809426 739668 1069758 5477207 2699776 2777431 1090986 517225 573761
Agriculture 97188 45674 51514 308107 174783 133324 69531 35419 34112
Medicine 338563 147726 190837 1132165 627249 504916 202577 96011 106566
Management 974228 371487 602741 2780363 1274756 1505607 506180 207991 298189
Source: China’s Ministry of Education (2006b).
15
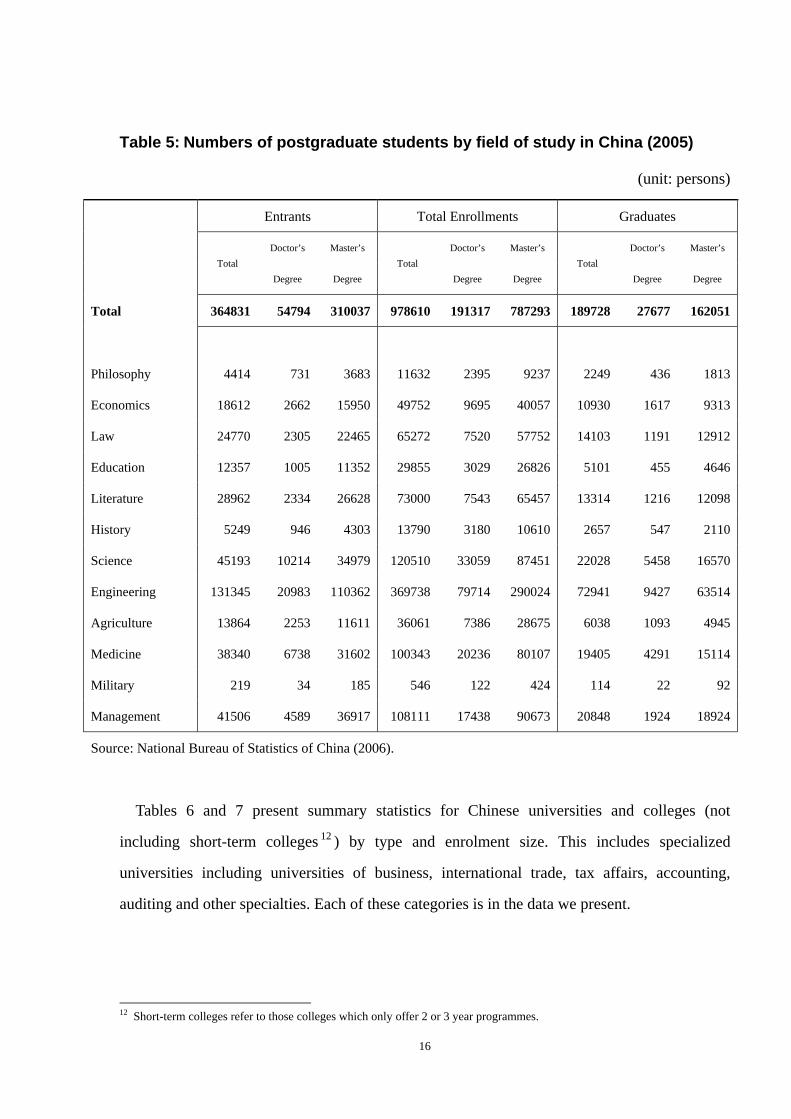
Table 5: Numbers of postgraduate students by field of study in China (2005)
(unit: persons)
Entrants Total Enrollments Graduates
Total
Doctor’s Master’s Total
Doctor’s Master’s Total
Doctor’s Master’s
Degree Degree Degree Degree Degree Degree
Total 364831 54794 310037 978610 191317 787293 189728 27677 162051
Philosophy 4414 731 3683 11632 2395 9237 2249 436 1813
Economics 18612 2662 15950 49752 9695 40057 10930 1617 9313
Law 24770 2305 22465 65272 7520 57752 14103 1191 12912
Education 12357 1005 11352 29855 3029 26826 5101 455 4646
Literature 28962 2334 26628 73000 7543 65457 13314 1216 12098
History 5249 946 4303 13790 3180 10610 2657 547 2110
Science 45193 10214 34979 120510 33059 87451 22028 5458 16570
Engineering 131345 20983 110362 369738 79714 290024 72941 9427 63514
Agriculture 13864 2253 11611 36061 7386 28675 6038 1093 4945
Medicine 38340 6738 31602 100343 20236 80107 19405 4291 15114
Military 219 34 185 546 122 424 114 22 92
Management 41506 4589 36917 108111 17438 90673 20848 1924 18924
Source: National Bureau of Statistics of China (2006).
Tables 6 and 7 present summary statistics for Chinese universities and colleges (not
including short-term colleges 12 ) by type and enrolment size. This includes specialized
universities including universities of business, international trade, tax affairs, accounting,
auditing and other specialties. Each of these categories is in the data we present.
12 Short-term colleges refer to those colleges which only offer 2 or 3 year programmes.
16
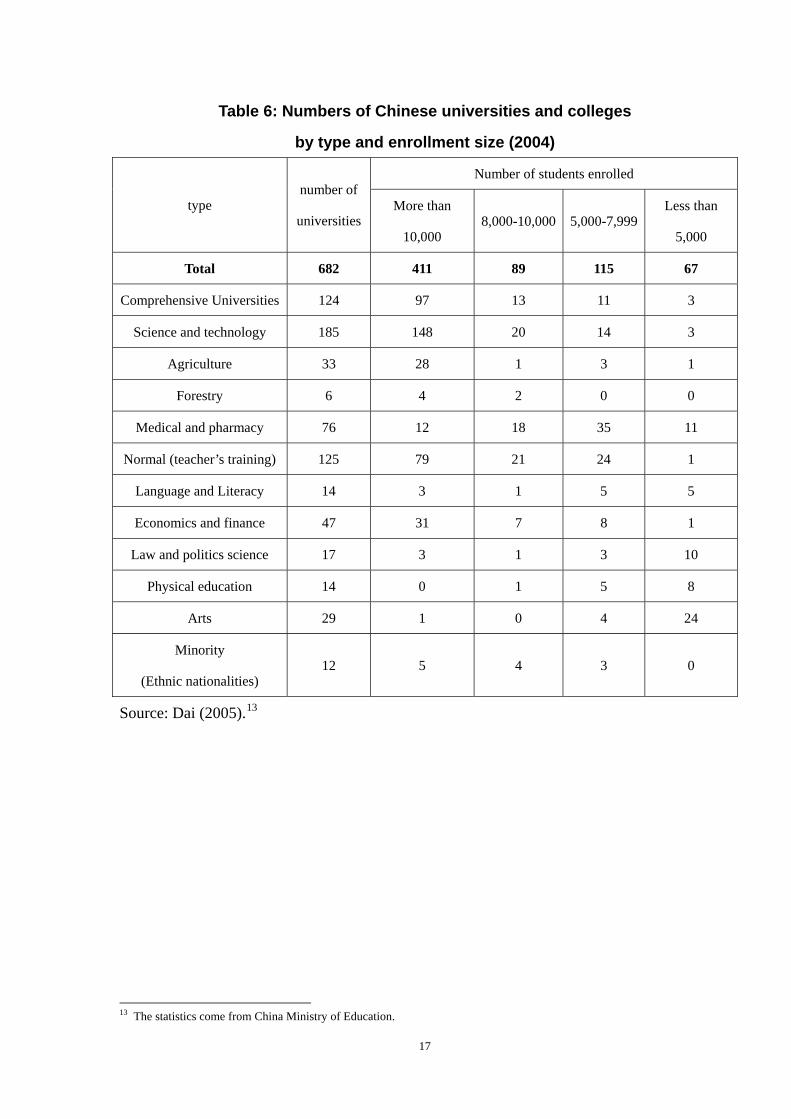
Table 6: Numbers of Chinese universities and colleges
by type and enrollment size (2004)
type number of
universities
Number of students enrolled
More than
10,000 8,000-10,000 5,000-7,999
Less than
5,000
Total 682 411 89 115 67
Comprehensive Universities 124 97 13 11 3
Science and technology 185 148 20 14 3
Agriculture 33 28 1 3 1
Forestry 6 4 2 0 0
Medical and pharmacy 76 12 18 35 11
Normal (teacher’s training) 125 79 21 24 1
Language and Literacy 14 3 1 5 5
Economics and finance 47 31 7 8 1
Law and politics science 17 3 1 3 10
Physical education 14 0 1 5 8
Arts 29 1 0 4 24
Minority
(Ethnic nationalities) 12 5 4 3 0
Source: Dai (2005).13
13 The statistics come from China Ministry of Education.
17
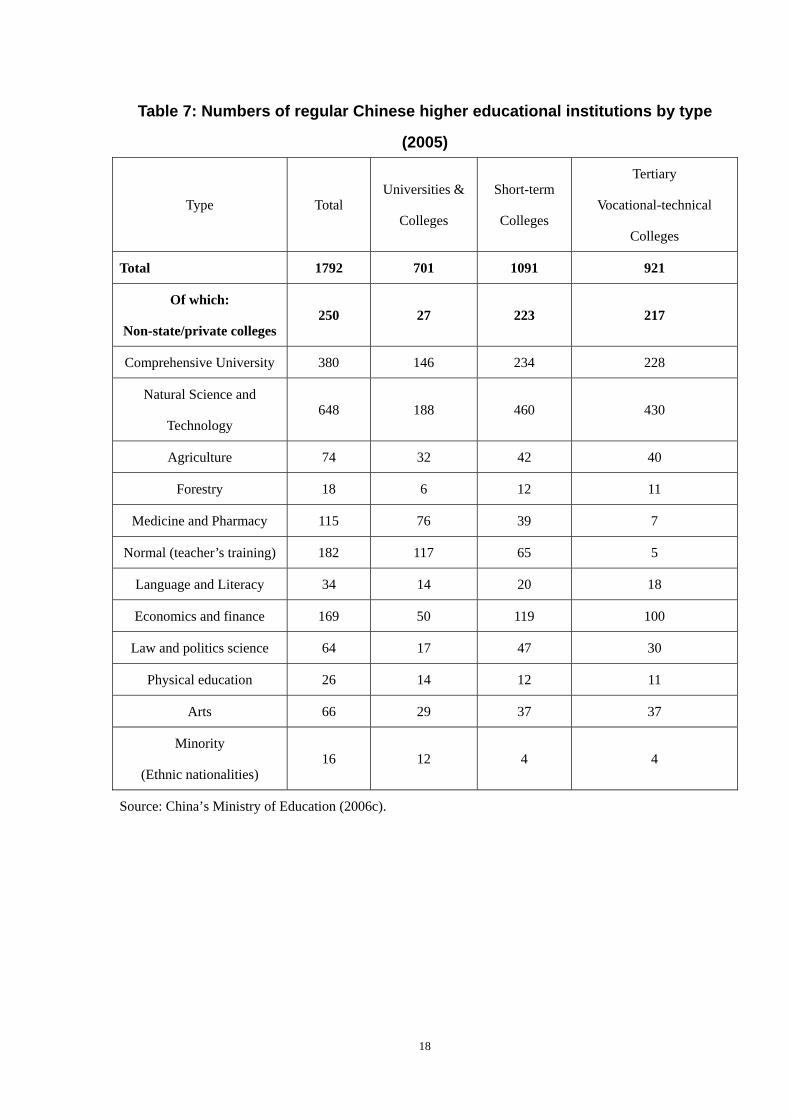
Table 7: Numbers of regular Chinese higher educational institutions by type
(2005)
Type Total Universities &
Colleges
Short-term
Colleges
Tertiary
Vocational-technical
Colleges
Total 1792 701 1091 921
Of which:
Non-state/private colleges 250 27 223 217
Comprehensive University 380 146 234 228
Natural Science and
Technology 648 188 460 430
Agriculture 74 32 42 40
Forestry 18 6 12 11
Medicine and Pharmacy 115 76 39 7
Normal (teacher’s training) 182 117 65 5
Language and Literacy 34 14 20 18
Economics and finance 169 50 119 100
Law and politics science 64 17 47 30
Physical education 26 14 12 11
Arts 66 29 37 37
Minority
(Ethnic nationalities) 16 12 4 4
Source: China’s Ministry of Education (2006c).
18
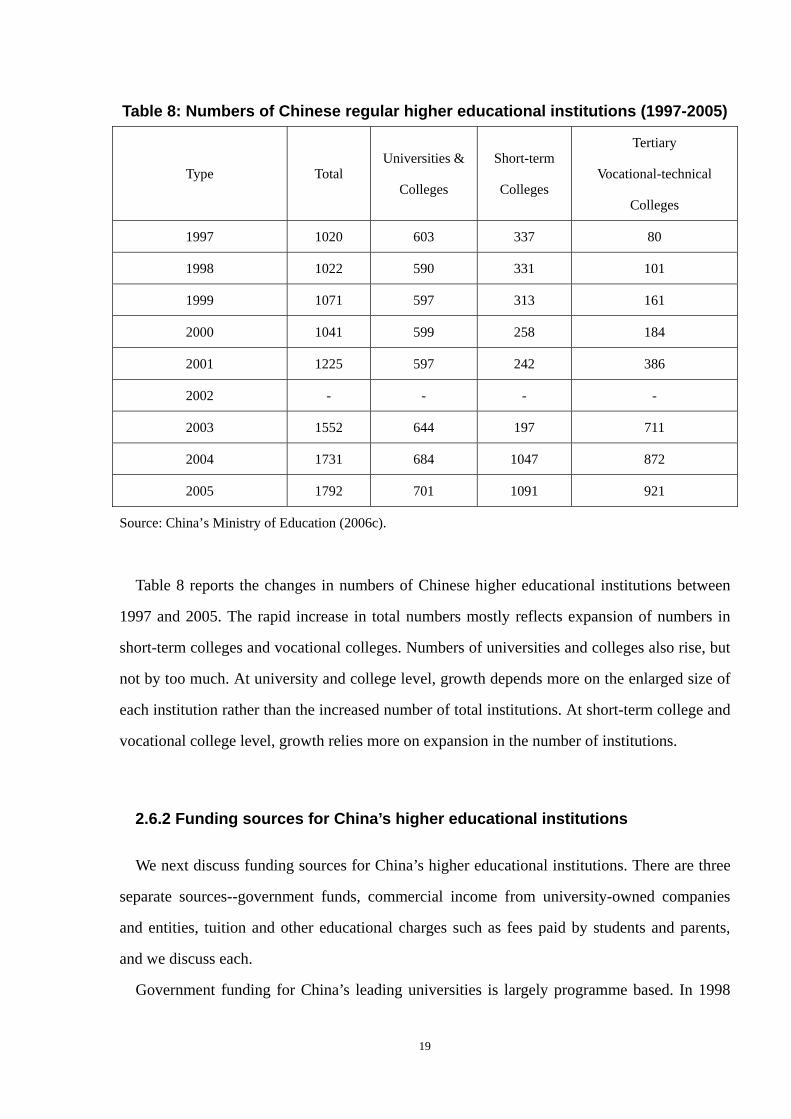
Table 8: Numbers of Chinese regular higher educational institutions (1997-2005)
Type Total Universities &
Colleges
Short-term
Colleges
Tertiary
Vocational-technical
Colleges
1997 1020 603 337 80
1998 1022 590 331 101
1999 1071 597 313 161
2000 1041 599 258 184
2001 1225 597 242 386
2002 - - - -
2003 1552 644 197 711
2004 1731 684 1047 872
2005 1792 701 1091 921
Source: China’s Ministry of Education (2006c).
Table 8 reports the changes in numbers of Chinese higher educational institutions between
1997 and 2005. The rapid increase in total numbers mostly reflects expansion of numbers in
short-term colleges and vocational colleges. Numbers of universities and colleges also rise, but
not by too much. At university and college level, growth depends more on the enlarged size of
each institution rather than the increased number of total institutions. At short-term college and
vocational college level, growth relies more on expansion in the number of institutions.
2.6.2 Funding sources for China’s higher educational institutions
We next discuss funding sources for China’s higher educational institutions. There are three
separate sources--government funds, commercial income from university-owned companies
and entities, tuition and other educational charges such as fees paid by students and parents,
and we discuss each.
Government funding for China’s leading universities is largely programme based. In 1998
19
under a special “985” Project,14 10 of China's leading universities were given three-year grants
in excess of 30 billion RMB (current price) for quality improvements (Wang, 2002). Included
in the first round of 985 Project grants were Peking, Tsinghua, Fudan, Zhejiang, and Nanjing
Universities.15 Peking and Tsinghua universities, the top two ranked institutions, each received
1.8 billion RMB. Afterwards, the Ministry of Education cooperated with provincial or
municipal governments and other departments to also develop Shanghai Jiaotong University,
Xi’an Jiaotong University, Science and Technology University of China and Harbin Industry
University (see Table 9). According to 2003 data,16 those Project 985 universities in this phase
of support accounted for only 1% of the total higher education enrollments, but their key labs
accounted for almost a half of the whole annual research funds, 20% of post-graduate student
enrolment and 30% of doctoral candidates. Project 985 funds provided these universities with
considerable support. These grants were awarded in addition to financial support provided by a
further 211 Project under a separate program aimed at developing 100 quality universities for
China for the 21st century. In 2004, the second phase of the 985 Project was launched and the
number of universities covered was enlarged to 30.17
China’s 11th Five-Year Plan provides detailed information on the amount of resources
devoted to improved educational attainment within the Chinese higher educational system.
Much of this information is unfortunately not consolidated in a consistent way across
institutions. Generally, the financing arrangements involved are institution specific, and no
more information is given by the institutions themselves.
We have been able to collect some information for a small number of HEIs and top elite
institutions in China and use this to generate data on the amount of government funding
flowing into these institutions. Table 9 provides this data with funding in the year of 2004
categorized by their sizes. The top 11 universities (those universities included in the 985
Project at the first phase) received more than 17.43 billion RMB from government funds in
14 Project 985 was officially approved in May 1998 during the centennial anniversary of Peking University, when the Ministry of Education appealed to the top leadership for reserving China's 1% of its annual revenue in 3 consecutive years, from 1999 to 2001, for the purpose of building world class universities in China. The objective of the large extra investment is to promote the around 10 universities into world well-known universities. 15 Both Peking University and Tsinghua University were granted $225 million each over five years, while Nanjing University and Shanghai Jiaotong University received $150 million each. See World Education News & Reviews (2006). 16 See Zhou Mansheng, Deputy Director-General of National Center for Education Development Research. “Developing the Chinese High-Level Universities, Enhancing the Competitiveness”. 17 See World Education News & Reviews (2006).
20
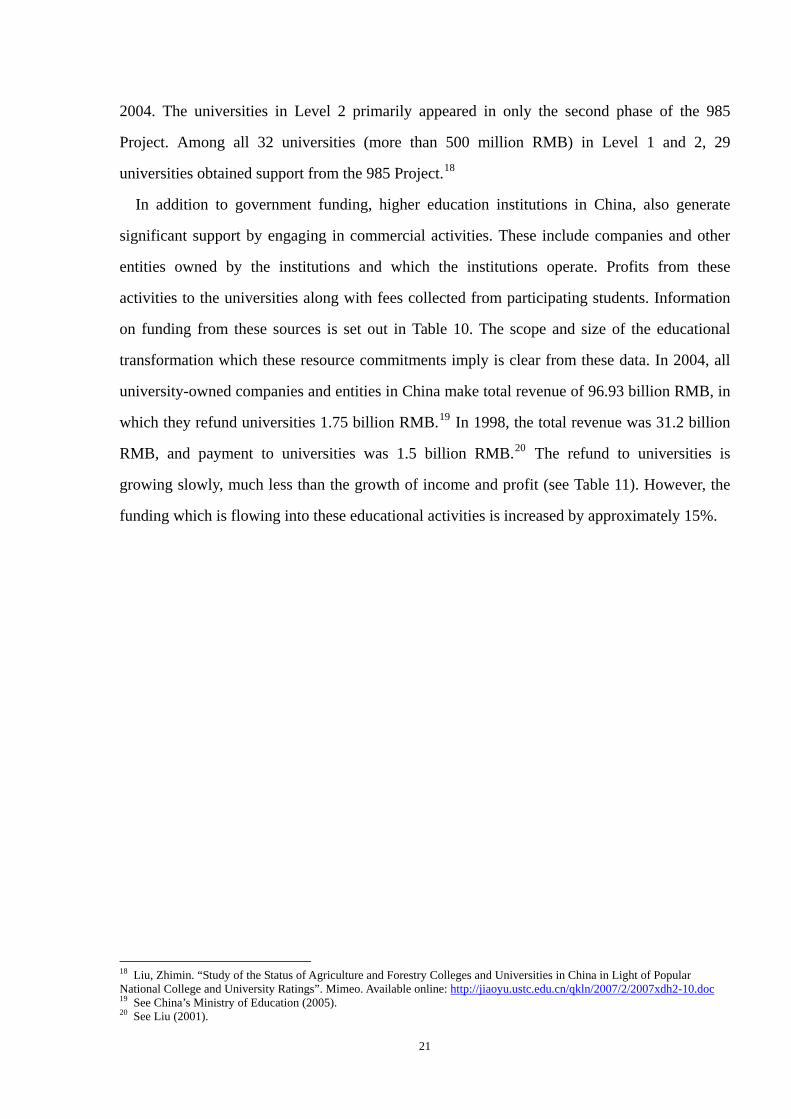
2004. The universities in Level 2 primarily appeared in only the second phase of the 985
Project. Among all 32 universities (more than 500 million RMB) in Level 1 and 2, 29
universities obtained support from the 985 Project.18
In addition to government funding, higher education institutions in China, also generate
significant support by engaging in commercial activities. These include companies and other
entities owned by the institutions and which the institutions operate. Profits from these
activities to the universities along with fees collected from participating students. Information
on funding from these sources is set out in Table 10. The scope and size of the educational
transformation which these resource commitments imply is clear from these data. In 2004, all
university-owned companies and entities in China make total revenue of 96.93 billion RMB, in
which they refund universities 1.75 billion RMB.19 In 1998, the total revenue was 31.2 billion
RMB, and payment to universities was 1.5 billion RMB.20 The refund to universities is
growing slowly, much less than the growth of income and profit (see Table 11). However, the
funding which is flowing into these educational activities is increased by approximately 15%.
18 Liu, Zhimin. “Study of the Status of Agriculture and Forestry Colleges and Universities in China in Light of Popular National College and University Ratings”. Mimeo. Available online: http://jiaoyu.ustc.edu.cn/qkln/2007/2/2007xdh2-10.doc 19 See China’s Ministry of Education (2005). 20 See Liu (2001).
21
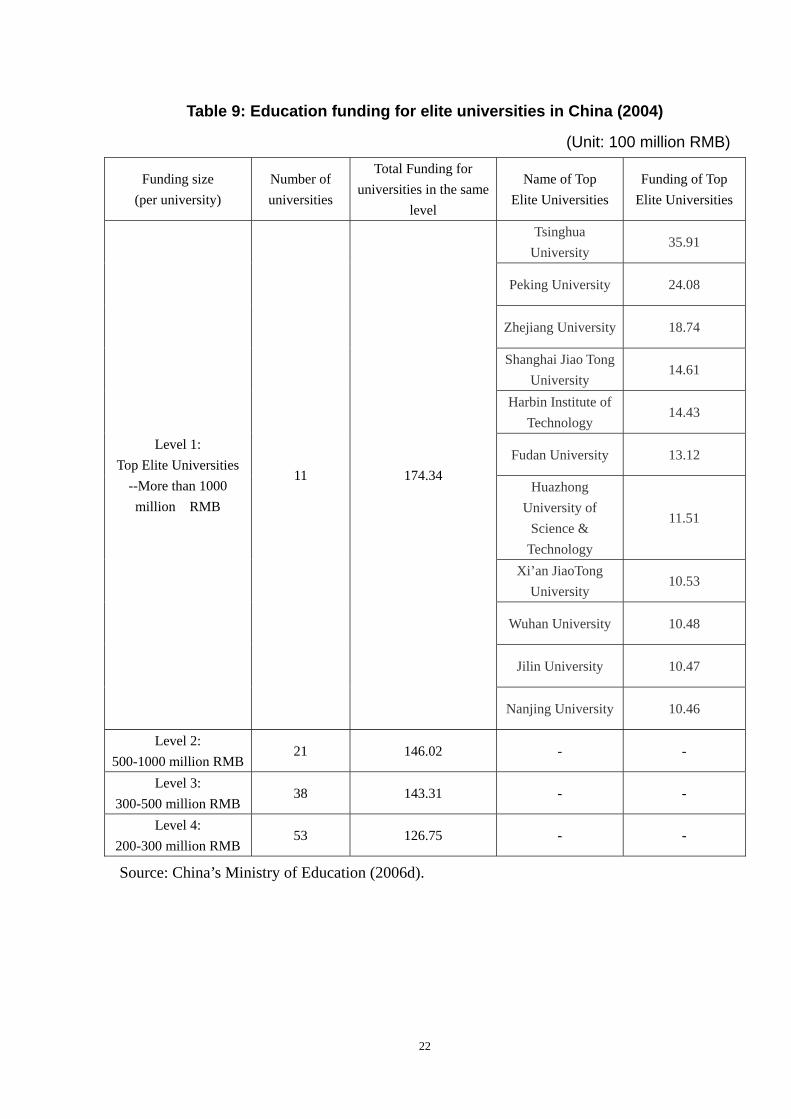
Table 9: Education funding for elite universities in China (2004)
(Unit: 100 million RMB)
Funding size (per university)
Number of universities
Total Funding for universities in the same
level
Name of Top Elite Universities
Funding of Top Elite Universities
Level 1: Top Elite Universities
--More than 1000 million RMB
11 174.34
Tsinghua University
35.91
Peking University 24.08
Zhejiang University 18.74
Shanghai Jiao Tong University
14.61
Harbin Institute of Technology
14.43
Fudan University 13.12
Huazhong University of
Science & Technology
11.51
Xi’an JiaoTong University
10.53
Wuhan University 10.48
Jilin University 10.47
Nanjing University 10.46
Level 2: 500-1000 million RMB
21 146.02 - -
Level 3: 300-500 million RMB
38 143.31 - -
Level 4: 200-300 million RMB
53 126.75 - -
Source: China’s Ministry of Education (2006d).
22
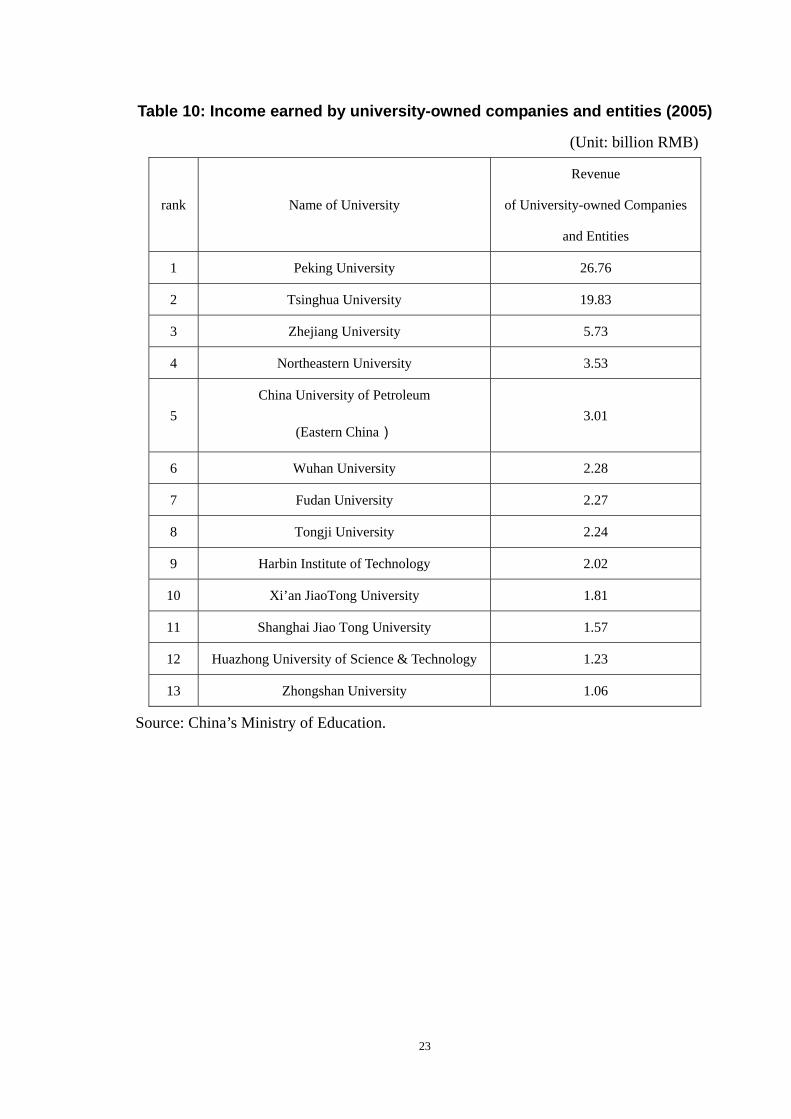
Table 10: Income earned by university-owned companies and entities (2005)
(Unit: billion RMB)
rank Name of University
Revenue
of University-owned Companies
and Entities
1 Peking University 26.76
2 Tsinghua University 19.83
3 Zhejiang University 5.73
4 Northeastern University 3.53
5 China University of Petroleum
(Eastern China) 3.01
6 Wuhan University 2.28
7 Fudan University 2.27
8 Tongji University 2.24
9 Harbin Institute of Technology 2.02
10 Xi’an JiaoTong University 1.81
11 Shanghai Jiao Tong University 1.57
12 Huazhong University of Science & Technology 1.23
13 Zhongshan University 1.06
Source: China’s Ministry of Education.
23
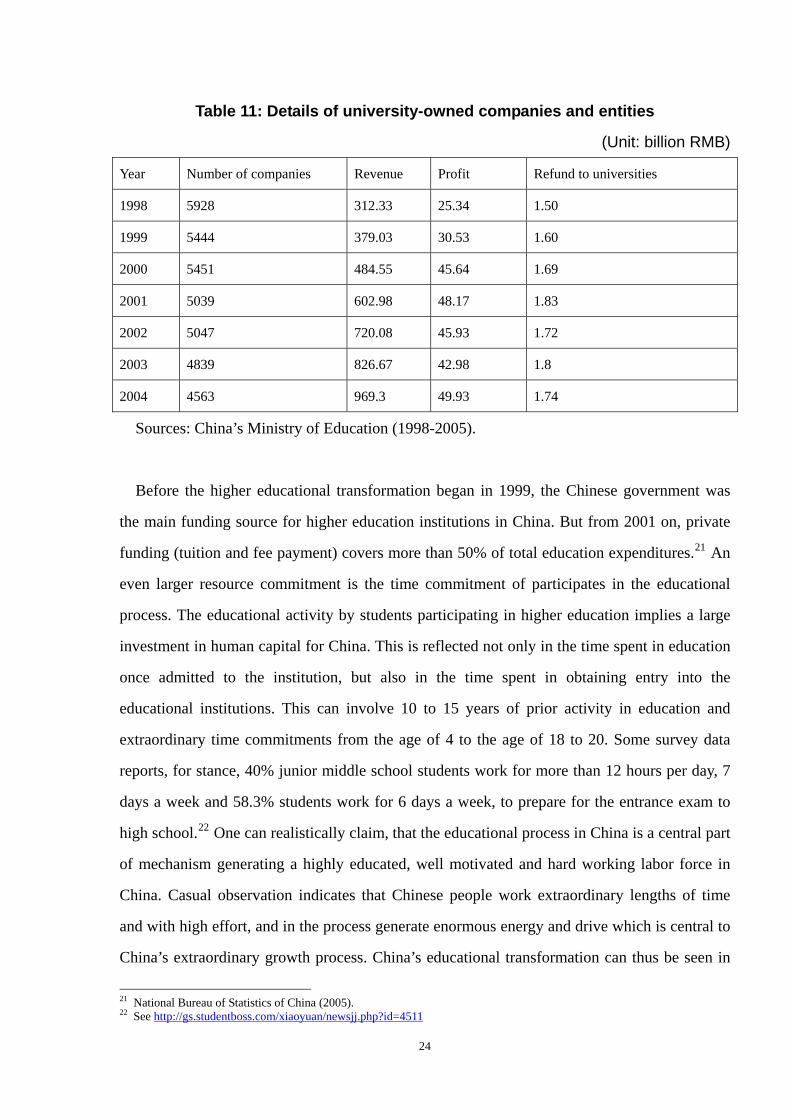
Table 11: Details of university-owned companies and entities
(Unit: billion RMB)
Year Number of companies Revenue Profit Refund to universities
1998 5928 312.33 25.34 1.50
1999 5444 379.03 30.53 1.60
2000 5451 484.55 45.64 1.69
2001 5039 602.98 48.17 1.83
2002 5047 720.08 45.93 1.72
2003 4839 826.67 42.98 1.8
2004 4563 969.3 49.93 1.74
Sources: China’s Ministry of Education (1998-2005).
Before the higher educational transformation began in 1999, the Chinese government was
the main funding source for higher education institutions in China. But from 2001 on, private
funding (tuition and fee payment) covers more than 50% of total education expenditures.21 An
even larger resource commitment is the time commitment of participates in the educational
process. The educational activity by students participating in higher education implies a large
investment in human capital for China. This is reflected not only in the time spent in education
once admitted to the institution, but also in the time spent in obtaining entry into the
educational institutions. This can involve 10 to 15 years of prior activity in education and
extraordinary time commitments from the age of 4 to the age of 18 to 20. Some survey data
reports, for stance, 40% junior middle school students work for more than 12 hours per day, 7
days a week and 58.3% students work for 6 days a week, to prepare for the entrance exam to
high school.22 One can realistically claim, that the educational process in China is a central part
of mechanism generating a highly educated, well motivated and hard working labor force in
China. Casual observation indicates that Chinese people work extraordinary lengths of time
and with high effort, and in the process generate enormous energy and drive which is central to
China’s extraordinary growth process. China’s educational transformation can thus be seen in
21 National Bureau of Statistics of China (2005). 22 See http://gs.studentboss.com/xiaoyuan/newsjj.php?id=4511
24
this way as a central element underpinning the sustainability of current China’s high-growth
performance.
3 Educational Transformation as Part of China’s Wider Development
Strategy
We next turn to the broad policy objectives underlying the educational transformation in China.
Current thinking in the Chinese government treats the educational transformation of China as
part of China’s broader development strategy. This educational transformation strategy is part
of a wider strategy in place for a number of years designed to maintain growth in the China’s
economy through various forms of quality upgrading.
Many of the details of the elements of the strategy are in the 11th 5-Year Plan, but were also
set out in the earlier 9th and 10th 5-year plans which provided detailed policies aimed to
maintain China’s growth process.23 The 11th 5-Year Plan laid down action guidelines for a five
year period aimed at achieving an "all-round well-off society" by 2020. Currently, the
construction of a "harmonious society" based on a "scientific outlook of development" is the
focus of the Chinese government.24
This so-called scientific outlook for Chinese development seeks human-oriented, balanced
and all-dimensional sustainable development. It consists of five initiatives: (1) harmonization
in the development of urban and rural areas (greater priority to the development of rural areas
and solving problems concerning farmers), (2) harmonization in regional development (greater
assistance to less developed areas), (3) harmonization between economic and social
development (expansion of employment opportunities and enhancement of social security and
public services, such as medical care and education), (4) harmonization between economic
development and the human and natural environment (greater emphasis on resource
preservation and the protection of the natural environment), and (5) harmonization between
domestic development and integration into the global economy (acceleration of domestic
market growth while internationally opening-up). 23 See Fan (2006). 24 See Ma (2006).
25
The 11th Five-Year Plan aims to shift China's economic and social policies away from the
priority of "getting rich first" by equally stressing "common prosperity," and highlighting the
need to create a "harmonious society." The policy of getting rich first was based on ideas
proposed by Deng Xiaoping, the reform architect of China in the 1980s who argued that the
whole country would eventually become rich by allowing some people and regions to prosper
first. This idea ran contrary to the principle of absolute equality adhered to by Mao Zedong,
and was aimed to stimulate people's desire to work and get rich. This has served as the driving
force behind China's rapid economic growth beginning in the 1980s, but has also resulted in
widening disparities between the rich and the poor. In order to deliver the fruits of economic
development more broadly to the whole country, the latest proposals call for the establishment
of a social safety net--social security and medial care systems, insurance schemes for
unemployment and labor accidents, and other elements--in addition to creating jobs, narrowing
regional disparities, and resolving the so-called "three agriculture-related problems," namely,
agriculture, peasants and rural villages. In particular, the plan calls for increasing government
expenditures to enhance public goods and services, with a spending emphasis on infrastructure
development and education, in order to modernize rural areas. Education, especially higher
education, plays an important role in the 11th 5-Year Plan.
In the 11th 5-Year Plan, a strategy of rejuvenating the country through science and education
and strengthening the country through improving human resources is a central element.
Education is given priority status, with quality-oriented education a main theme, and especially
improving the quality of higher education. The Chinese government seeks to promote an
all-round, coordinated and sustainable development of educational institutions.
The main tasks for the higher educational development strategy in the 11th 5-Year Plan are as
follows. The gross enrollment rate of higher education is to reach 25% of each entering age
cohort by 2010 and the total enrollment of higher education is to hit 30 million.25 In the
meantime, vocational training, further education and adult education of various forms will
receive more emphasis with the establishment of a learning society. There is also stress on
improving the abilities of teachers to implement quality-oriented education. Reforming and
improving the examination and evaluation component of the system is seen as a key and in 25 The State Council of China (2007).
26
accordance with the demand for quality-oriented higher education.
To promote balanced and sustainable development of higher education area in China, the
11th 5-Year Plan sets out concrete measures to improve the quality of tertiary education.26 The
“211 Projects” and “985 Project” are to be continued, with an emphasis on technology
innovation, cultivating talents with creativity, and improving the capacity for self-innovation,
so that top universities in China become an important force in an increasingly innovative nation.
Programs of quality improvement are to be implemented, and a quality evaluation system
designed to fulfill the objective of quality-upgrading orientation change. Also, the Chinese
government seeks to deepen reforms of technology innovation to generate an educational
system which integrates learning, research and production activity together. The government
encourages universities and research institutions to place priority on original and integrative
innovation, to improve ability in applied research and transform technology in industrial and
commercial production.
To improve the quality of teachers, a strategy of “developing the institution through human
resources” in higher education is emphasized with a focus on a group of academic leaders with
international excellence. There is stress placed on producing a group of middle-aged and young
leading academics who can undertake national key tasks and participate in international
competition.
“Fair Play” in education is also emphasized. There is an objective that public education be
promoted in ways that are open, fair and equal access to higher education should prevail in
China. The government is to improve facilitation mechanisms for poorer students in HEIs, with
student loans as a major factor so that no student will be denied access to higher education
because of financial difficulties. While these objectives are commendable, there have been
difficulties in implementation. Chinese banks have been reluctant to lend money to poor
students, and often ask them to return the loan before they graduate. If poor students cannot
return funds before they graduate, they are not authorized to receive certificates of graduation
and degrees and their chance of finding good jobs is small. In the 11th 5-Year Plan, the
government commits itself to a “Sunshine Program” to ensure the recruitment process by
universities is open, fair and justifiable. The government also acknowledges the importance of 26 The Press Conference of the State Council Information Office (2006).
27
creating employment for university graduates and encourages them to take jobs at grass-root
level.
These plans are complex in both specificity and form. Some of the details are set out in the
Whalley and Zhou (2007) who discuss the 11th 5-Year Plan more broadly. The educational
component of the 11th 5-Year Plan is clear in providing for large injections of funds into
China’s tertiary educational system. Education is a major focus over the 5 year period of the
plan, with the proportion of education expenditures to GDP increasing to 4% in 2010, from
3.4% in 2002. Much of the additional spending is focused on the elite universities, a group of
around 20 universities in China, which are thought to have the best students and the capability
to grow and mature into major global educational institutions which are comparable to those in
the OECD. The research component of university activities is also seen as a central element in
generating new ideas and eventually process and production methods which will improve
profitability. Educational improvement in both research and student generation is thus seen as a
central element of a continued high Chinese growth process.
Along with a focus on elite universities, there is also a focus on improving the talent pool in
China by raising the quality of available talent and particularly for higher levels of the talent
pool. There is some evidence of reversal “brain drain” to China consistent with this policy.
David Zweig (2006) points out that “a reverse brain drain is underway in mainland China. The
number of returnees hit 30,000 in 2005, up from 7,000 in 1999." Data from Chinese Ministry
of Education shows that in 2005, the total number of returnees is 35,000; in 2004, the number
is 25,000; in 2003, the number is around 20,100. 27 The number of returnees is thus
continuously increasing. Also, the production of a high level talent pool within China has
accelerated after the educational transformation policies were put in place.
Some educational funds are focused on providing resource packages to encourage
researchers abroad to return to Chinese universities, often in conjunction with enterprises.
Stress is placed on combining enterprise related research development activity with similar
activities undertaken in research institutions. The objective is to achieve an improvement in the
international stature of education institutions in China, with links and contacts with education
institutions abroad to be encouraged. Funding is provided for Chinese graduate students to 27 China’s Ministry of Education (2004, 2005).
28
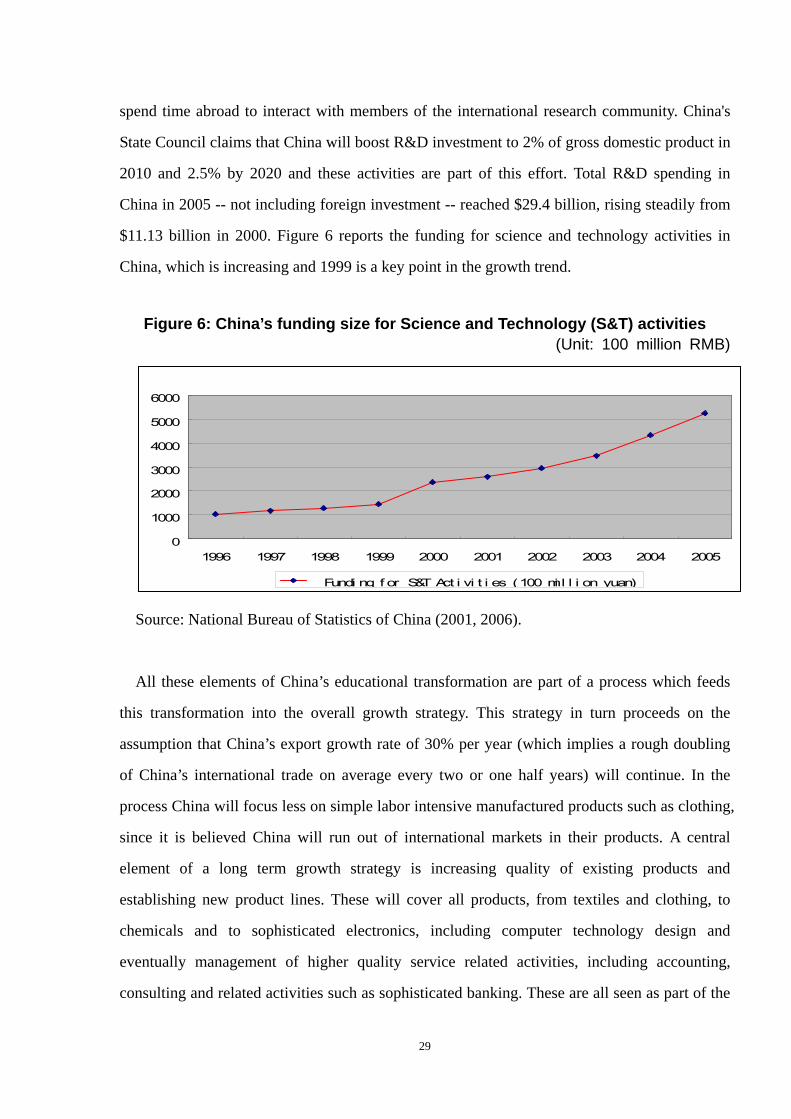
spend time abroad to interact with members of the international research community. China's
State Council claims that China will boost R&D investment to 2% of gross domestic product in
2010 and 2.5% by 2020 and these activities are part of this effort. Total R&D spending in
China in 2005 -- not including foreign investment -- reached $29.4 billion, rising steadily from
$11.13 billion in 2000. Figure 6 reports the funding for science and technology activities in
China, which is increasing and 1999 is a key point in the growth trend.
Figure 6: China’s funding size for Science and Technology (S&T) activities
(Unit: 100 million RMB)
0
1000
2000
3000
4000
5000
6000
1996 1997 1998 1999 2000 2001 2002 2003 2004 2005
Fundi ng f or S&T Act i vi t i es (100 mi l l i on yuan)
Source: National Bureau of Statistics of China (2001, 2006).
All these elements of China’s educational transformation are part of a process which feeds
this transformation into the overall growth strategy. This strategy in turn proceeds on the
assumption that China’s export growth rate of 30% per year (which implies a rough doubling
of China’s international trade on average every two or one half years) will continue. In the
process China will focus less on simple labor intensive manufactured products such as clothing,
since it is believed China will run out of international markets in their products. A central
element of a long term growth strategy is increasing quality of existing products and
establishing new product lines. These will cover all products, from textiles and clothing, to
chemicals and to sophisticated electronics, including computer technology design and
eventually management of higher quality service related activities, including accounting,
consulting and related activities such as sophisticated banking. These are all seen as part of the
29
growth process and educational transformation is a route to this goal.
It is worth emphasizing, however, that the transformation in higher education in China is
only part for a wide overall growth strategy, and there is equal focus on other elements, as
improved research development tax credits which have already been targeted towards specific
industries and zones in the country. There is also a focus on large mega projects involving
technology, infrastructure and other areas. Many of these are set out in Whalley and Zhou
(2007). Maintaining progress on all these fronts is central to China’s policy with education and
the generation of ideas and talent as key to the effort.
4 Evaluating the Impacts of China’s Educational Transformation
Policies
We next discuss the effectiveness of the education policies in China we discuss above. The
potential benefits to China are in large part reflected in estimates of the rate of return to
education in China. But we also note the central issue of the extent to which the educational
process in China serves as a screening device, and if so whether more efficient screening is
available. We also suggest that in part entry to tertiary education in China is motivated by
incentives to relocate abroad in high wage countries using education as the visa obtaining
mechanism. To the extent this is true the soul return to China from expanded education is
smaller than the private return. We finally discuss the impacts of China’s educational
transformation on total factor productivity, and implicitly on growth performance.
4.1 Estimates of rates of return on education in China
A central issue in evaluating the effectiveness of educational transformation policies in
China is assessing the rates of return on educational investment in China. In this area there are
sharply differing results from available studies.
One recent study by Heckman and Li (2004) estimates the return on higher education in
China allowing for heterogeneous returns and for self-selection into schooling using micro data
from China in 2000 since in Chinese urban areas, heterogeneity in returns is substantial. They
30
draw an earlier work by Carneiro et al. (2001), which emphasizes comparative advantage in the
labor market for schooling. Their estimate is that for a randomly selected young person from an
urban area (in six provinces-Beijing, Guangdong, Zhejiang, Sichuan, Liaoning and Shaanxi)
those attending a 4-year college experience a 43% increase in lifetime earnings (nearly 11%
annually) in 2000, compared with just 36% (nearly 9% annually) for those who do not attend.
Their estimate is that on average the return to four-year college attendance in the sense of
average treatment effect (ATE)28 is very high, 43% on average and 11% annually for young
people in the urban areas in China. These estimates are all higher than the conventional OLS
(ordinary least squares) estimates (29%, annual returns of 7.25%) of a Mincer model applied
by them to the same data, which in turn are higher than the OLS estimates reported for earlier
time periods. Heckman and Li (2004) suggest that these estimates imply that, after more than
twenty years of economic reform with market orientation, the average return to education in
China measured by OLS or ATE has increased substantially when compared with figures for
early period.29 Skills are now being rewarded more adequately than they have been in the past
in China.
The Heckman and Li (2004) estimates of the rate of return on years of schooling in China
suggest that the social return to China’s educational transformation policies is high and helps in
maintaining high growth (see Section 4.4). However, other recent studies by Chinese scholars
have cast doubt on the size of the Heckman return estimates. These studies suggest that the rate
of return may be much more modest. For instance, Wang (2007) estimates the rates of return to
years of schooling for migrant workers and urban local workers, and her estimates are 4.6%
and 5.7% respectively in 2001 and 5.0% and 6.7% respectively in 2005. It implies that hourly
earnings of migrant workers increased by 4.6% for every additional years of schooling, and
hourly earnings of urban local workers increased by 5.7% for every additional years of
schooling, holding all other factors fixed. Wang’s estimates are, however, general return to
schooling, not specific to college education.
Other studies, however, suggest that rates of return to education in China will continue to 28 Average Treatment Effect (ATE): The term ‘treatment effect’ refers to the causal effect of a binary (0–1) variable on an outcome variable of scientific or policy interest. Let Y1i denote the potential earnings of individual i if he were to receive training and let Y0i denote the potential earnings of individual i if not. Let E[·] denote the mathematical expectation operator, i.e., the population average of a random variable. ATE=E[Y1i – Y0i]. 29 Chow (2001) presents estimates of OLS-generated rates of return in the 1980s and early 1990s.
31
increase. Zhang and Zhao (2002), Li (2003), and Yang (2004) show that there is evidence that
in the past 15 years, rates of returns on schooling in China have increased. Fleisher et al. (2004)
estimate that the OLS return to college education increased sharply between 1995 and 2002. In
the year of 2000, it remained approximately 7.1% per year of college. The average treatment
effect of college education was 11.85% in 1995 and 23.2% in 2002 in terms of the percentage
return per year of college.
Most of these estimate the return to education in general more so than tertiary education and
focus on the return to years of schooling in the combined system. The incremental returns
associated with tertiary education conditional on attainment of primary and secondary
education have only recently received attention. It is the size of these which is critical to an
assessment of the success of China’s educational transformation.
4.2 Education as a filter/screening
A critical issue in evaluating the effectiveness of China’s educational transformation policies
is whether one views education in China as screening as distinct from human capital formation.
A particularly important element in the Chinese case is that tertiary education, through entrance
to foreign professional programmes is in part a visa obtaining mechanism for entry to high
wage economies, and as such the private return to education in China may be influenced by
this element in the educational process. Generally, the return on the international cohort
provided to employers through education that arrives to employers is not reflected in available
studies of the rate of return to schooling and as such estimates of the private rate of return
understate the real rate of return.
The main contributors to this discussion reflect the work of Spence (1973) and Arrow (1973)
who argued that higher education conveys information to employers about differing abilities of
individuals and acts as a screening device, and hence educational processes may be viewed as
providing a filter. Arrow suggested that the filter mechanism is useful to employers with
imperfect information on individual (potential) productivities and college educations act as a
double filter, once in selection (entering) and once again in grading. Arrow also suggested that
mere admission to college may perform the screening function. Spence (1973) had earlier put
forward similar ideas arguing that education was primarily served to select individuals, without
32
really influencing their productivity in future professional life. Under this view a person’s
productive efficiency is as an intrinsic quality, which may depend on a wide range of factors,
but over which education exerts little influence. According to Spence, if productive efficiency
is not observable by potential employers, then success as a student serves to signal the presence
of productive characteristics. Spence (1973) argued that under this view of the world that if
education serves solely to signal productive capacities to employers, workers have a tendency
to overeducate themselves. The direct value added to society from education may thus be
relatively small.
Thus, if the educational process in China serves mainly as a mechanism for employers to
distinguish between high and low attainment individuals, the return to education to employers
lies in allowing them to sort individuals by ability, attitude and other characteristics using
educational attainment. If this is the case, one can argue that the screening mechanism is best
served by undergraduate education and graduate education adds relatively little benefit as a
filter. If this is the case, then the component of China’s educational transformation focused on
research and graduate training may be inefficient social investment.
One can go further and argue that the significant increases in graduate education in China do
little to enhance filtering, and only delay employment. One could even suggest that current
high unemployment rates experienced by undergraduates in China generate political pressure
for more graduate education as a way of absorbing (postponing) undergraduate unemployment.
Data from Ministry of Personnel shows that in 2006 number of total graduates from higher
education institutions hit 4 million but the total demand for college graduates in China was
only 1.66 million. It implies that nearly 60% of college graduates faced unemployment
following graduation.30 Under this view, the radical changes which have taken place since
1999 can be seen in part as a mechanism from absorbing undergraduate unemployment and
delaying the eventual labor market adjustments associated with a large pool of younger
workers entering the labor force with an additional 4 years of university under graduate
education.
Finally, a key issue for China that needs to be injected into this discussion is that educational
screening in the Chinese case can also be for entry to foreign graduate schools and, eventually, 30 See http://news.qq.com/a/20060716/001002.htm
33

residence abroad in high wage countries. These returns are private returns to departees, but not
social returns to China as a nation. They are not reflected in current empirical studies, and may
dominate other components of the rates of return on tertiary education for the top portion of
recent educational cohorts.
The evaluation of China’s educational transformation policies therefore if in terms of its
growth and efficiency contribution to the economy thus rests heavily on ones view of the
educational process. Rates of return to education reflect different interpretations as to the
nature of the education process. If education is viewed as screening more so than direct
generation associated of human capital, then marginal benefits to employers need to be
factored in as well as observed higher returns to workers through higher wages. As such
education viewed as a screening mechanism may raise social rates of return beyond those
generated empirically.
4.3 Impacts of education on inequality
A further element in an evaluation of China’s educational transformation policies is the
impact of educational transformation on inequality. Fleisher et al. (2004) claim that changes in
rates of return to schooling have paralleled rising income inequality, suggesting a link between
inequality and schooling. According to Yang (1999), by the late 1990s China had surpassed
most other countries for which data are available in rising income inequality, and by 2000
China had one of the most unequal income distributions in the world (Yang, 2002).
China’s unequal society has been the focus of recent studies (Li and Zhao, 2006; Yue, et al.,
2006). According to the data released by Asia Development Bank, China's Gini coefficient rose
from 0.41 in 1993 to 0.47 in 2004,31 almost the highest country in Asia and approaching Latin
American levels. The income disparity between the households in eastern and western and
coastal/noncoastal areas has also increased. The Gini coefficients for urban and rural areas
separately are 0.34 (Yin et al. 2006) and 0.38 (National Bureau Statistics, 2006). Other studies
show similar numbers. For instance, Wang (2007) uses China Urban Labor Survey (CULS) to
88831 Economist.com: “Asia’s rich and poor”, Aug 9th, 2007, from The Economist print edition. Available online: http://www.economist.com/world/asia/displaystory.cfm?story_id=9616
34
calculate the urban Gini coefficient as 0.3969 in 2005 and 0.3476 in 2001. In other words, the
Gini coefficient numbers are smaller among urban and rural areas, but if urban and rural areas
are taken as a whole, the Gini coefficient rises to 0.47. This suggests that income disparity
between towns and villages is a key element in inequality.
A further statistic is that ratio of urban to rural incomes in China has risen from 1.8 in the
mid 1980s up to around 3.3 or 3.4 today (Li and Luo, 2007). This change seems closely related
to the major educational transformation underway in China since this transformation focuses
on tertiary education rather primary or secondary. Also, the objective of maintaining growth
through higher tertiary educational expenditures seems likely to intensify inequality issues in
China. In turn, one can argue that increasingly educational attainment is now focused on rural
rather than urban households, and the process of educational transformation may be a factor
which will also progressively combat relatively inequality in China.
According to Fleisher and Wang (2004b) and Heckman (2004), though there was a sharp
acceleration in schooling expenditures in the previous decade in China, the proportion of the
population attending college remained small. Fleisher et al. (2004) argued that the proportion
of the population aged 20 and higher with a college degree in China was less than 3.2% in
1993 and grew to only 3.5% in 2000 according to 1993 and 2000 population census (National
Bureau of Statistics of China, 1994 and 2002). The more critical number, however, is the
fraction of the entering age cohort who receives higher education and this is much higher and
increasing. And even though the proportion of the total population with higher education is
small, the magnitude of the population with higher education is large globally and the total
number of higher education graduates in China ranks first in the world labor supply.
4.4 Impacts on growth
The evaluation of impacts of educational changes in China on growth performance is
another central element in an overall evaluation of the impacts of China’s educational
transformation. The issue is impacts both on total factor productivity and the rate of growth of
labor productivity adjusted to account for changes in educational quality in human capital.
Recent extensive literature on growth accounting in China (Li, et al. (2005)) has tried to
35

understand the determinants of high growth performance in China and how growth
performance could change in the years ahead as well as the role of various elements of changes
in policy, and the changed international environment on the Chinese economy. Much of the
literature applies simple growth accounting in the traditional Solow (1957) and Denison (1967)
to the Chinese economy, and attempts to try to understand the primary determinants of growth.
In recent years, work in this area by Shantong Li32 underpins many of these policies set out in
the 11th 5-Year Plan in China which focuses on quality upgrading and specifically on
educational transformation as a central element of growth.
The original Solow paper on the U.S. used the time series back to the 1870s and used time
derivatives of an aggregate production function to produce the famous Solow growth
accounting equation that overall growth rates can be decomposed into a rate of growth of
Hicks-neutral technical change and a weighted sum of rates of growth of factor inputs where
weights are given by factor shares. Solow used long time series data for the US to come to the
conclusion that approximately 85% of the US growth was due to technical change and not to
the accumulation of factor inputs. If this view is also accepted for the Chinese case, how
educational transformation will relate to overall total factor productivity growth becomes key
in evaluating the impacts of China’s educational policies. Subsequent work however,
challenged the Solow-Denison view of the world. Christensen and Jorgenson (1969) noted that
changes in the quality of factor inputs would also play a major role in growth performance as
educational input is one of those elements able to dramatically reduce the Solow residual by
taking into account quality change in factor inputs.
The work by Shantong Li on China comes to the conclusion that total factor productivity
growth in China was a less central driver of growth as in the original Solow work on the US.
Factor accumulation was a more major determinant of China’s growth. Using this work, the
11th 5-Year Plan sets targets that the proportion of growth to be accounted for by total factor
productivity growth should rise to 60% and educational transformation is seen as a key element
of this. However, other more recent work focused on the role of foreign direct investment (FDI)
in China’s growth accounting decomposes the Chinese economy into FDI and non-FDI
economy and challenges this view. Whalley and Xin (2006) provide a growth accounting 32 See Li, Hou, Liu, and He (2005).
36
calculation for China which suggests most of Chinese total factor productivity growth over the
last twenty years is accounted for by growth in foreign invested enterprises and specifically by
foreign direct investment into the Chinese economy. Under this view the role of educational
transformation in China’s growth would be significant diminished in terms of its potential
impact on growth performance.
Other work in growth accounting area involving Shai (2004) and Berges and Shai (2007)
uses a dual approach rather than the original Solow direct approach as modified by Denison
and also comes to the conclusion that factor accumulation in the Chinese case has been less
central for growth than previously been thought. Thus growth accounting literature suggests
that higher educational transformation in China in terms of its impact on growth has been
influenced by international environment in which China has been operating with the role of
foreign direct investment potentially and the significance of factor accumulation as against
technical progress in terms of generation of growth an important issue.
5 Potential Global Implications of China’s Educational
Transformation
In this section we discuss the potential global implications of China’s educational
transformation. China is now a large entity in the global economy and the changes in China’s
education policies since 1999 also have important implications both for global educational
structure and the global economy itself.
5.1 Changes in outputs of educated labor in China as a percentage of world
supply
The first is the impacts these changes imply for global labor markets, and trade in products
incorporating skilled rather than the less skilled labor that has largely characterized China’s
export growth thus far. In Table 12 we present data which indicates in broad terms the total
supply of graduates by field of study both from OECD countries and China. The total global
37
supply of graduates has been changing from the late 1990s through until 2003 (the latest
complete data for OECD countries), and this enables calculations to be made of the global
changes in educational outputs. The data in Table 12 clearly show that outputs in China are
now a significant percentage of world supplies by area and profession. Moreover, the
percentage changes reflecting China’s production of graduates has increased significantly due
to the post 1999 educational transformation policies. In all areas, numbers of graduates in
China are growing much faster than in the OECD countries.
Table 13 reports data for Science and Engineering (S&E) Indicators 2006 published by the
US National Science Foundation. In 2002, more than 9 million students worldwide earned a
first university degree, and students earned more than 3 million of these in S&E fields. These
worldwide totals only include countries for which recent data are available (primarily countries
in Asia, Europe, and North America) and are an underestimate. Asian universities account for
almost 1.5 million of the world's S&E degrees in 2002, and China provides a significant
proportion of these at 15.77%.
Nowadays many educated Chinese workers and those with educational skills remain in
China constrained by immigration restrictions in the OECD. To the extent that economic
activity in the OECD is relatively mobile and can move to China through outsourcing then the
impact of China’s educational transformation activities becomes more important for global
location of productivities. Since the 1990’s, there has been outsourcing of manufacturing of the
U.S electronics and other industries. Initially outsourcing was to recontract manufacturing
suppliers, and was mostly offshore and largely to China. Whalley (2007) discusses recent
literature on outsourcing accessing what seems to be happening in China as China proceeds
with her historic transformation of high growth and integration into the world economy. Much
of the world’s commercial electronics are made in China, and outsourcing in this area in China
is growing rapidly. 33 The educational transformation process in China will seemingly
underscore this trend.
33 See Donahoe (2003).
38
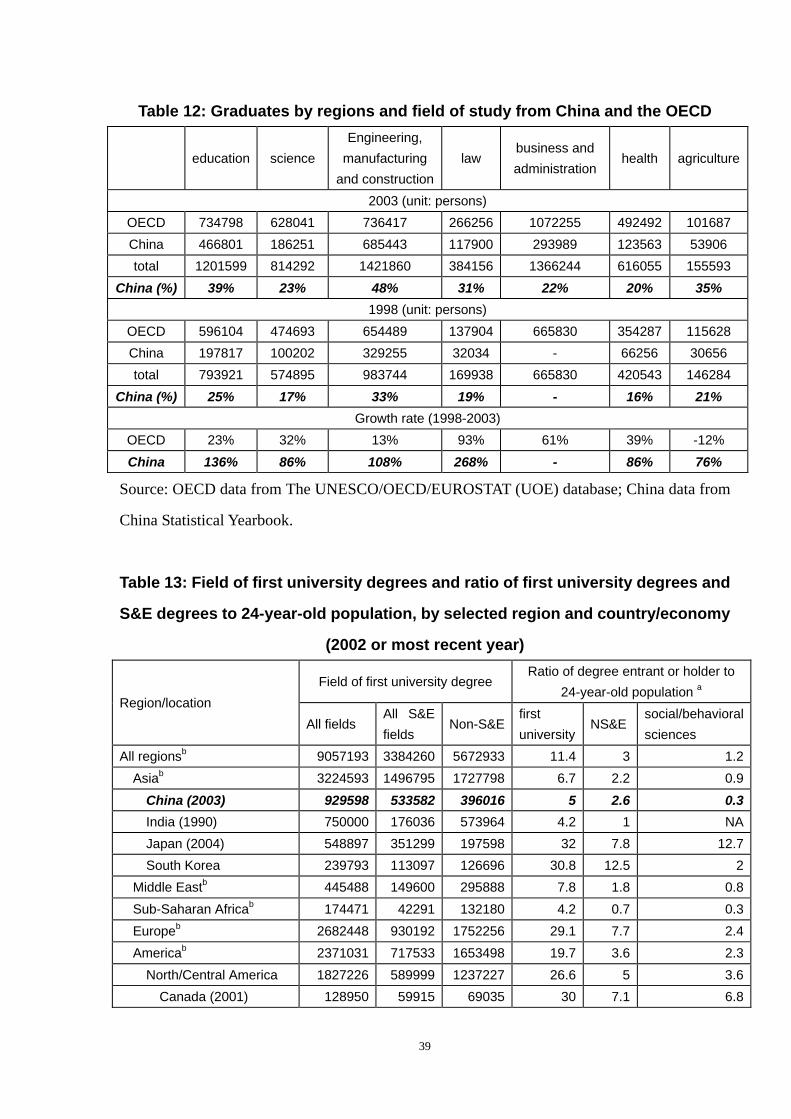
Table 12: Graduates by regions and field of study from China and the OECD
education science Engineering,
manufacturing and construction
law business and administration
health agriculture
2003 (unit: persons) OECD 734798 628041 736417 266256 1072255 492492 101687 China 466801 186251 685443 117900 293989 123563 53906 total 1201599 814292 1421860 384156 1366244 616055 155593
China (%) 39% 23% 48% 31% 22% 20% 35% 1998 (unit: persons)
OECD 596104 474693 654489 137904 665830 354287 115628 China 197817 100202 329255 32034 - 66256 30656 total 793921 574895 983744 169938 665830 420543 146284
China (%) 25% 17% 33% 19% - 16% 21% Growth rate (1998-2003)
OECD 23% 32% 13% 93% 61% 39% -12% China 136% 86% 108% 268% - 86% 76%
Source: OECD data from The UNESCO/OECD/EUROSTAT (UOE) database; China data from
China Statistical Yearbook.
Table 13: Field of first university degrees and ratio of first university degrees and
S&E degrees to 24-year-old population, by selected region and country/economy
(2002 or most recent year)
Region/location Field of first university degree
Ratio of degree entrant or holder to 24-year-old population a
All fields All S&E fields
Non-S&Efirst university
NS&E social/behavioral sciences
All regionsb 9057193 3384260 5672933 11.4 3 1.2Asiab 3224593 1496795 1727798 6.7 2.2 0.9
China (2003) 929598 533582 396016 5 2.6 0.3India (1990) 750000 176036 573964 4.2 1 NAJapan (2004) 548897 351299 197598 32 7.8 12.7South Korea 239793 113097 126696 30.8 12.5 2
Middle Eastb 445488 149600 295888 7.8 1.8 0.8Sub-Saharan Africab 174471 42291 132180 4.2 0.7 0.3Europeb 2682448 930192 1752256 29.1 7.7 2.4Americab 2371031 717533 1653498 19.7 3.6 2.3
North/Central America 1827226 589999 1237227 26.6 5 3.6Canada (2001) 128950 59915 69035 30 7.1 6.8
39
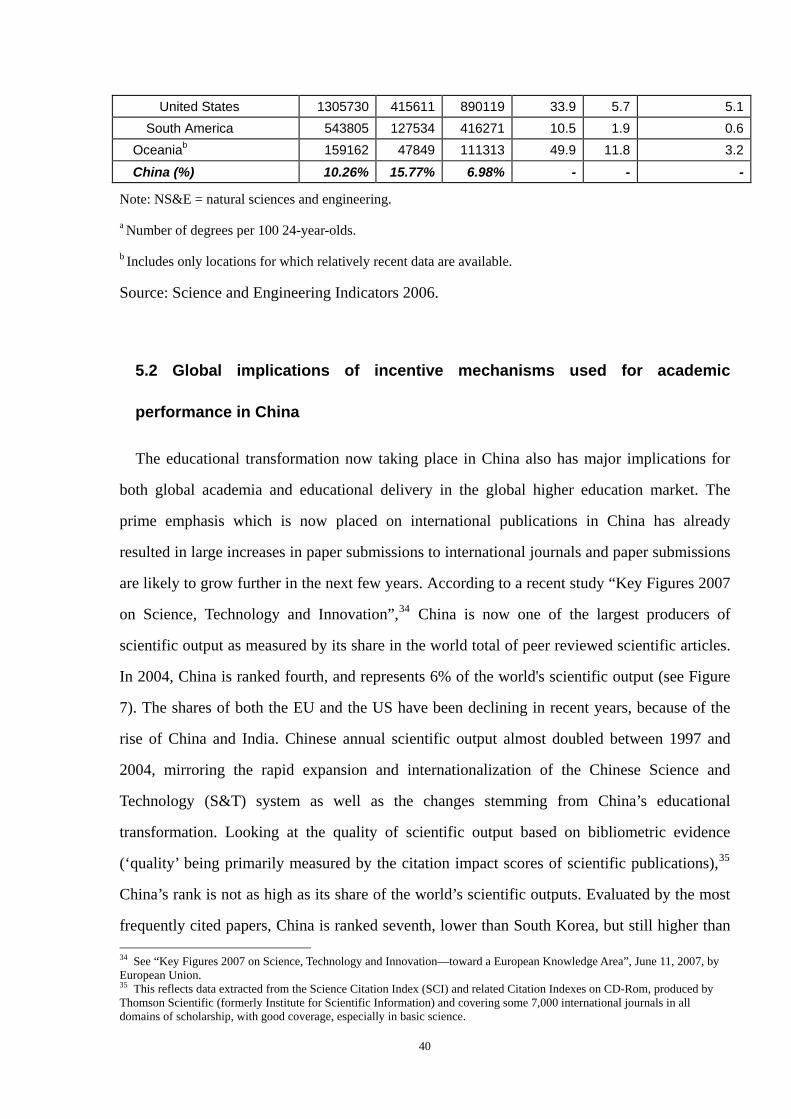
United States 1305730 415611 890119 33.9 5.7 5.1South America 543805 127534 416271 10.5 1.9 0.6
Oceaniab 159162 47849 111313 49.9 11.8 3.2
China (%) 10.26% 15.77% 6.98% - - -
Note: NS&E = natural sciences and engineering.
a Number of degrees per 100 24-year-olds.
b Includes only locations for which relatively recent data are available.
Source: Science and Engineering Indicators 2006.
5.2 Global implications of incentive mechanisms used for academic
performance in China
The educational transformation now taking place in China also has major implications for
both global academia and educational delivery in the global higher education market. The
prime emphasis which is now placed on international publications in China has already
resulted in large increases in paper submissions to international journals and paper submissions
are likely to grow further in the next few years. According to a recent study “Key Figures 2007
on Science, Technology and Innovation”,34 China is now one of the largest producers of
scientific output as measured by its share in the world total of peer reviewed scientific articles.
In 2004, China is ranked fourth, and represents 6% of the world's scientific output (see Figure
7). The shares of both the EU and the US have been declining in recent years, because of the
rise of China and India. Chinese annual scientific output almost doubled between 1997 and
2004, mirroring the rapid expansion and internationalization of the Chinese Science and
Technology (S&T) system as well as the changes stemming from China’s educational
transformation. Looking at the quality of scientific output based on bibliometric evidence
(‘quality’ being primarily measured by the citation impact scores of scientific publications),35
China’s rank is not as high as its share of the world’s scientific outputs. Evaluated by the most
frequently cited papers, China is ranked seventh, lower than South Korea, but still higher than 34 See “Key Figures 2007 on Science, Technology and Innovation—toward a European Knowledge Area”, June 11, 2007, by European Union. 35 This reflects data extracted from the Science Citation Index (SCI) and related Citation Indexes on CD-Rom, produced by Thomson Scientific (formerly Institute for Scientific Information) and covering some 7,000 international journals in all domains of scholarship, with good coverage, especially in basic science.
40
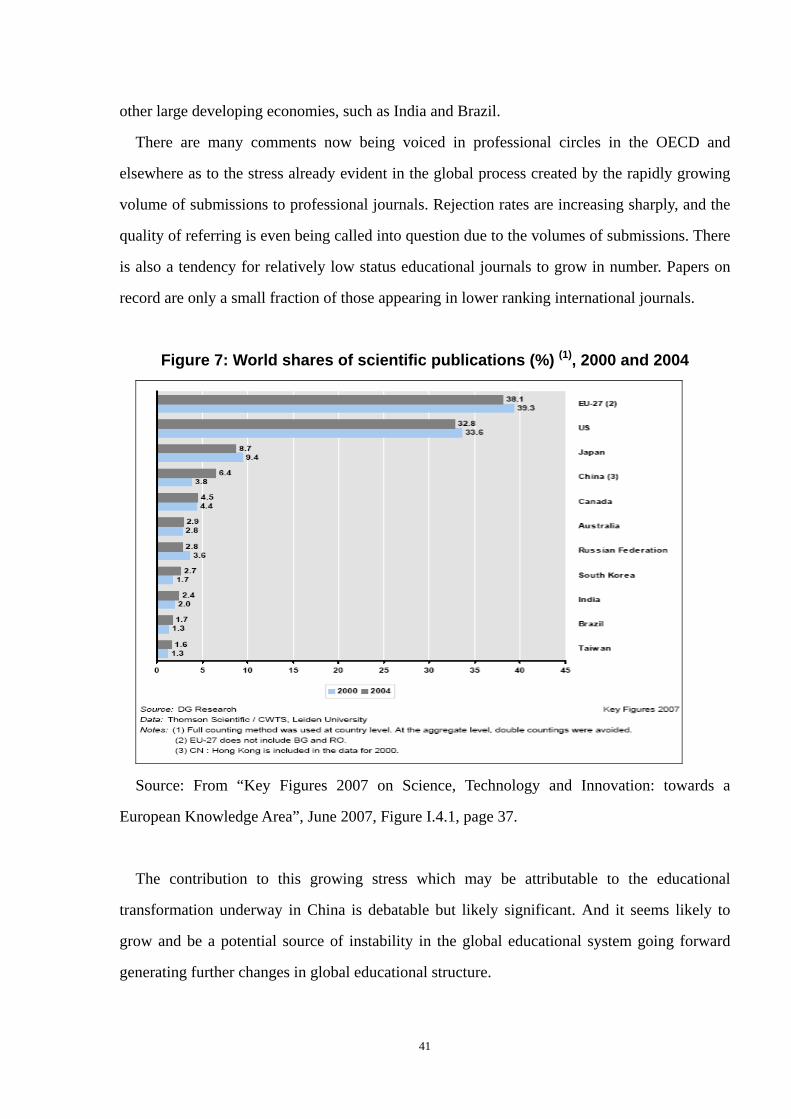
other large developing economies, such as India and Brazil.
There are many comments now being voiced in professional circles in the OECD and
elsewhere as to the stress already evident in the global process created by the rapidly growing
volume of submissions to professional journals. Rejection rates are increasing sharply, and the
quality of referring is even being called into question due to the volumes of submissions. There
is also a tendency for relatively low status educational journals to grow in number. Papers on
record are only a small fraction of those appearing in lower ranking international journals.
Figure 7: World shares of scientific publications (%) (1), 2000 and 2004
Source: From “Key Figures 2007 on Science, Technology and Innovation: towards a
European Knowledge Area”, June 2007, Figure I.4.1, page 37.
The contribution to this growing stress which may be attributable to the educational
transformation underway in China is debatable but likely significant. And it seems likely to
grow and be a potential source of instability in the global educational system going forward
generating further changes in global educational structure.
41
5.3 Global implications of contractual arrangements in Chinese universities
The contractual arrangements in universities in China are a further element of China’s
educational transformation, and portend future global change. They are sharply different from
those in the OECD. Before the 1999 educational transformation in China, teaching in
institutions of higher learning effectively involved a lifelong employment contract, which any
college or university could not override. But along with the changes in numbers of students in
China’s higher education system, the tenure system for professors in universities and colleges
has been changed significantly. The first changes were made by Peking University in reforming
its deep-rooted academic tenure system, and this was followed by other Chinese elite
universities. These reforms were implemented in February 2004. Taking Peking University as
an example, the reforms are that only professors enjoy lifelong employment, and the university
does not offer tenured positions to associate professors, lecturers and assistant professors.
Associate professors in arts and sciences and lecturers in all subjects are offered employment
contracts up to 12 years. If associate professors and lecturers fail in their promotions after
appraisal and examination of their academic attainments within the contracted period, they are
dismissed.
Contractual arrangements elsewhere in China’s universities differ even more from Western
academic practice. It is now common for researchers and scholars in many Chinese universities
to receive only 3 year contracts and these contracts differ sharply by individual circumstance.
And individuals receiving contracts are often given quotas in terms of the number of the
publications in designated journals which should be attained within a limited period of time. It
is not uncommon for these quotas to specify 3 papers per year in international journals,
although what is accepted as an international journal varies sharply from institute to institute. It
is also the case that individuals receiving such contracts may be given payment directly related
to publication performance. Again global incentives for paper submissions and papers
publication are intensified by these developments.
Since this new structure sharply differs from that in the OECD countries, it will likely
produce pressures in the wider international community outside China for changes elsewhere
because of the competitive pressures which will be created. Institutions in the OECD and
42
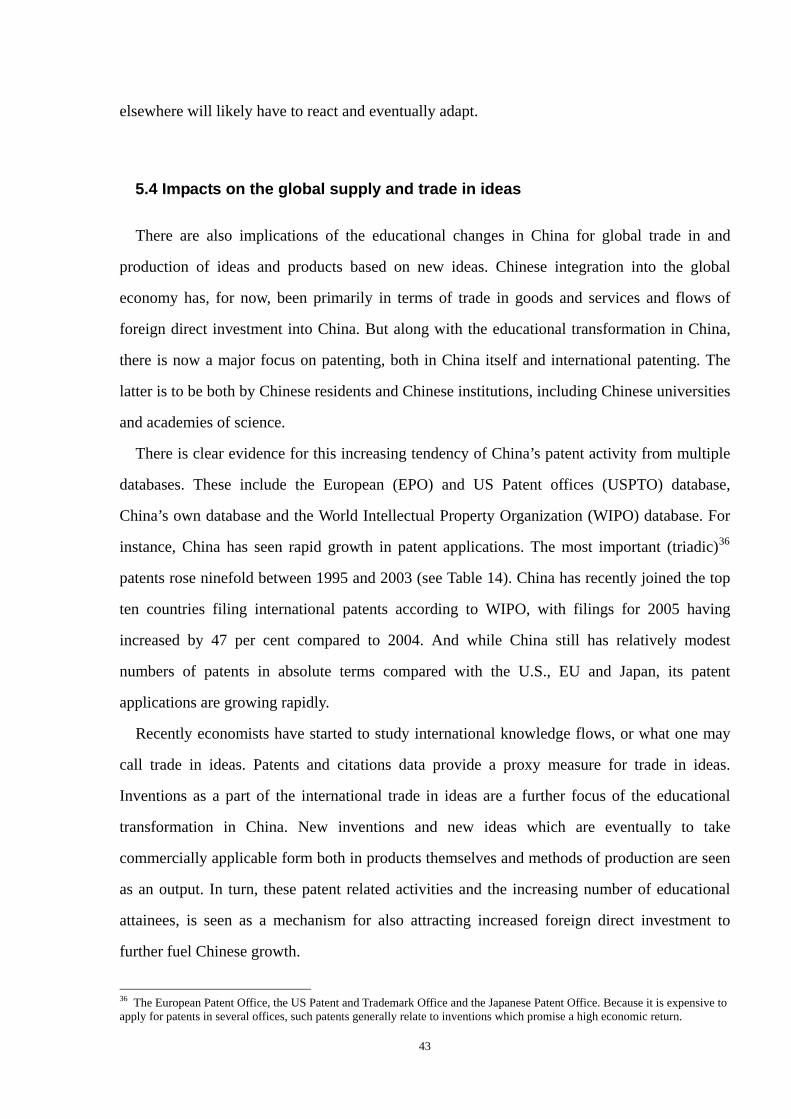
elsewhere will likely have to react and eventually adapt.
5.4 Impacts on the global supply and trade in ideas
There are also implications of the educational changes in China for global trade in and
production of ideas and products based on new ideas. Chinese integration into the global
economy has, for now, been primarily in terms of trade in goods and services and flows of
foreign direct investment into China. But along with the educational transformation in China,
there is now a major focus on patenting, both in China itself and international patenting. The
latter is to be both by Chinese residents and Chinese institutions, including Chinese universities
and academies of science.
There is clear evidence for this increasing tendency of China’s patent activity from multiple
databases. These include the European (EPO) and US Patent offices (USPTO) database,
China’s own database and the World Intellectual Property Organization (WIPO) database. For
instance, China has seen rapid growth in patent applications. The most important (triadic)36
patents rose ninefold between 1995 and 2003 (see Table 14). China has recently joined the top
ten countries filing international patents according to WIPO, with filings for 2005 having
increased by 47 per cent compared to 2004. And while China still has relatively modest
numbers of patents in absolute terms compared with the U.S., EU and Japan, its patent
applications are growing rapidly.
Recently economists have started to study international knowledge flows, or what one may
call trade in ideas. Patents and citations data provide a proxy measure for trade in ideas.
Inventions as a part of the international trade in ideas are a further focus of the educational
transformation in China. New inventions and new ideas which are eventually to take
commercially applicable form both in products themselves and methods of production are seen
as an output. In turn, these patent related activities and the increasing number of educational
attainees, is seen as a mechanism for also attracting increased foreign direct investment to
further fuel Chinese growth.
36 The European Patent Office, the US Patent and Trademark Office and the Japanese Patent Office. Because it is expensive to apply for patents in several offices, such patents generally relate to inventions which promise a high economic return.
43
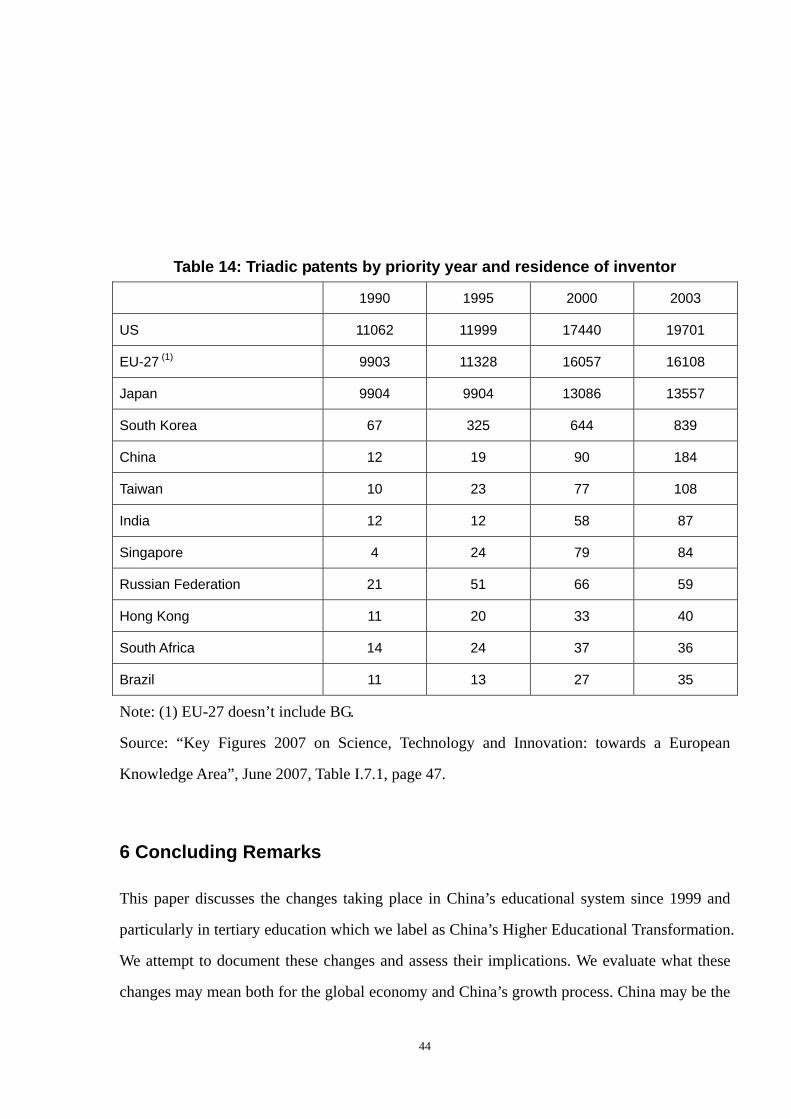
Table 14: Triadic patents by priority year and residence of inventor
1990 1995 2000 2003
US 11062 11999 17440 19701
EU-27 (1) 9903 11328 16057 16108
Japan 9904 9904 13086 13557
South Korea 67 325 644 839
China 12 19 90 184
Taiwan 10 23 77 108
India 12 12 58 87
Singapore 4 24 79 84
Russian Federation 21 51 66 59
Hong Kong 11 20 33 40
South Africa 14 24 37 36
Brazil 11 13 27 35
Note: (1) EU-27 doesn’t include BG.
Source: “Key Figures 2007 on Science, Technology and Innovation: towards a European
Knowledge Area”, June 2007, Table I.7.1, page 47.
6 Concluding Remarks
This paper discusses the changes taking place in China’s educational system since 1999 and
particularly in tertiary education which we label as China’s Higher Educational Transformation.
We attempt to document these changes and assess their implications. We evaluate what these
changes may mean both for the global economy and China’s growth process. China may be the
44
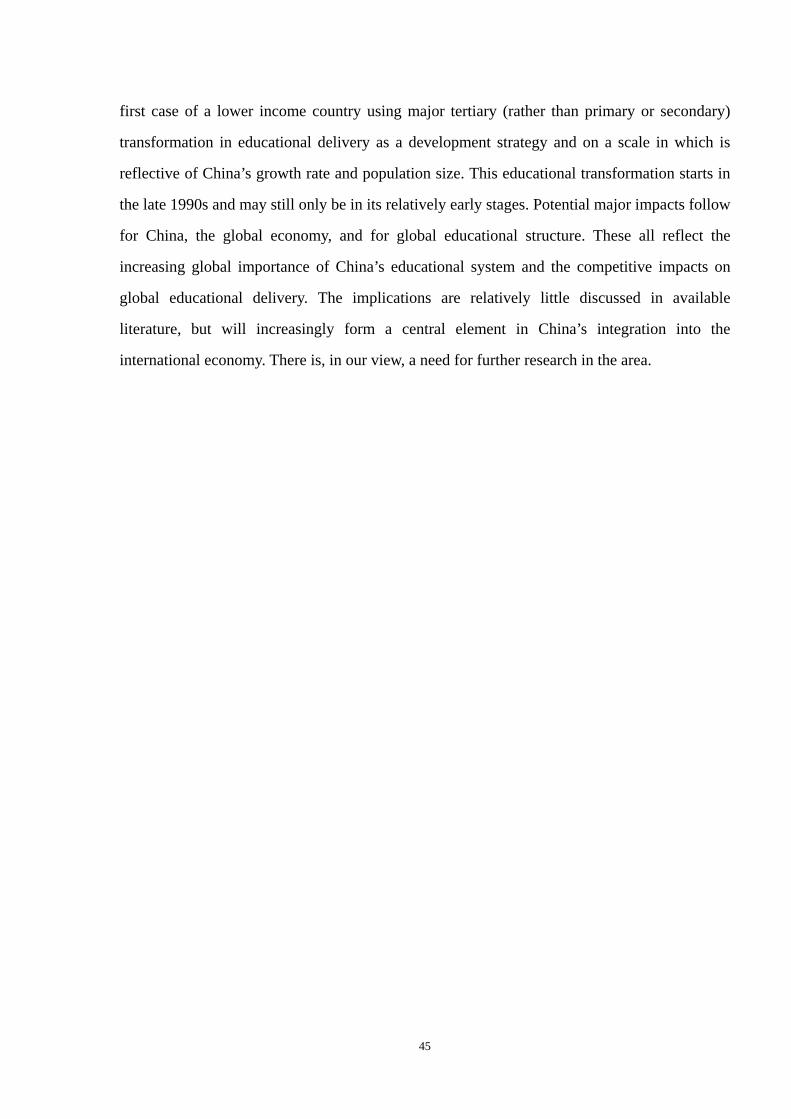
first case of a lower income country using major tertiary (rather than primary or secondary)
transformation in educational delivery as a development strategy and on a scale in which is
reflective of China’s growth rate and population size. This educational transformation starts in
the late 1990s and may still only be in its relatively early stages. Potential major impacts follow
for China, the global economy, and for global educational structure. These all reflect the
increasing global importance of China’s educational system and the competitive impacts on
global educational delivery. The implications are relatively little discussed in available
literature, but will increasingly form a central element in China’s integration into the
international economy. There is, in our view, a need for further research in the area.
45
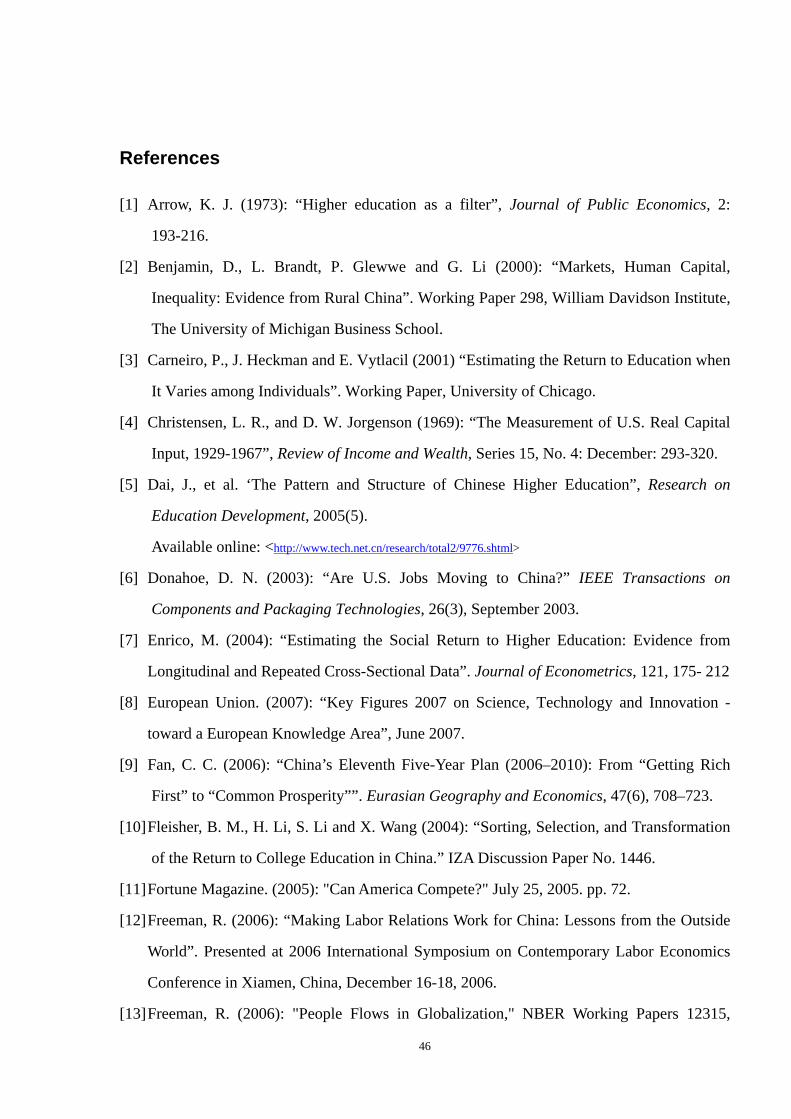
References
[1] Arrow, K. J. (1973): “Higher education as a filter”, Journal of Public Economics, 2:
193-216.
[2] Benjamin, D., L. Brandt, P. Glewwe and G. Li (2000): “Markets, Human Capital,
Inequality: Evidence from Rural China”. Working Paper 298, William Davidson Institute,
The University of Michigan Business School.
[3] Carneiro, P., J. Heckman and E. Vytlacil (2001) “Estimating the Return to Education when
It Varies among Individuals”. Working Paper, University of Chicago.
[4] Christensen, L. R., and D. W. Jorgenson (1969): “The Measurement of U.S. Real Capital
Input, 1929-1967”, Review of Income and Wealth, Series 15, No. 4: December: 293-320.
[5] Dai, J., et al. ‘The Pattern and Structure of Chinese Higher Education”, Research on
Education Development, 2005(5).
Available online: <http://www.tech.net.cn/research/total2/9776.shtml>
[6] Donahoe, D. N. (2003): “Are U.S. Jobs Moving to China?” IEEE Transactions on
Components and Packaging Technologies, 26(3), September 2003.
[7] Enrico, M. (2004): “Estimating the Social Return to Higher Education: Evidence from
Longitudinal and Repeated Cross-Sectional Data”. Journal of Econometrics, 121, 175- 212
[8] European Union. (2007): “Key Figures 2007 on Science, Technology and Innovation -
toward a European Knowledge Area”, June 2007.
[9] Fan, C. C. (2006): “China’s Eleventh Five-Year Plan (2006–2010): From “Getting Rich
First” to “Common Prosperity””. Eurasian Geography and Economics, 47(6), 708–723.
[10] Fleisher, B. M., H. Li, S. Li and X. Wang (2004): “Sorting, Selection, and Transformation
of the Return to College Education in China.” IZA Discussion Paper No. 1446.
[11] Fortune Magazine. (2005): "Can America Compete?" July 25, 2005. pp. 72.
[12] Freeman, R. (2006): “Making Labor Relations Work for China: Lessons from the Outside
World”. Presented at 2006 International Symposium on Contemporary Labor Economics
Conference in Xiamen, China, December 16-18, 2006.
[13] Freeman, R. (2006): "People Flows in Globalization," NBER Working Papers 12315,
46
National Bureau of Economic Research, Inc.
[14] Gou, R. (2006) “Explore on China’s High Education Equality from Admission to Urban
and Rural Students”, Research on Education Development, 2006 (5A), 29-31.
[15] Heckman, J. J. and X. Li (2003): “Selection Bias, Comparative Advantage and
Heterogeneous Returns to Education: Evidence from China in 2000”. NBERWorking
Papers 9877.
[16] Herbold, R. J. (2006): “K-12 Establishment is Putting America’s Industrial Leadership at
Risk”, USA Today (Society for the Advancement of Education), March, 2006.
Available online: <http://findarticles.com/p/articles/mi_m1272/is_2730_134/ai_n16108107>
[17] Kwan, C. H. (2005): “The 11th Five-Year Plan as a Steppingstone to Realizing an
"All-Round Well-Off Society"”, October.
Available online: <http://www.rieti.go.jp/en/china/05102401.html>
[18] Lang, D. W. and Q. Zha (2004): “Comparing Universities: A Case Study between Canada
and China.” Higher Education Policy, December, 17(4), 339-354.
Available online: <http://www.palgrave-journals.com/hep/journal/v17/n4/full/8300061a.html>
[19] Li, S. (2005): “Features of China’s Income Inequality”. Presented in The 56th China
Reform International Forum, Beijing, China. December 2005.
[20] Li, S., Y. Hou, Y. Liu, and J. He (2005): "China's Economic Growth Potential and
Prospect Analysis," Management World, Vol. 9.
[21] Li, S. and C. Luo (2007): “Recalculating China’s Urban and Rural Income Inequality.”
Journal of Peking University, 2, 111-120.
[22] Li, S. and R. Zhao (2006): “Market Reform and Income Inequality”. Hongfan Review, 3
(2).
[23] Liu, J. (2001): “Statistics Analytical Report on University-owned Companies and Entities
in China (1998)”. Available online: <http://www.edu.cn/20010821/189449.shtml>
[24] Liu, Z. (2007): “Study of the Status of Agriculture and Forestry Colleges and Universities
in China in Light of Popular National College and University Ratings”. Education and
Modernization. Vol. 2.
Available online: <http://jiaoyu.ustc.edu.cn/qkln/2007/2/2007xdh2-10.doc>
[25] Ma, K. (China National Development and Reform Commission) (2006): “The 11th
47
Five-Year Plan: Targets, Paths and Policy Orientation”. March 2006.
Available online: <http://en.ndrc.gov.cn/newsrelease/t20060323_63813.htm>
[26] Peng, P. and W. Chen (2007): “Study on China’s High School Education Cost.” Journal of
Education Development Research. Vol. 4.
Available online: <http://www.cee.edu.cn/show_news.jsp?id=4178>
[27] Solow, R. M. (1957): “Technical Change and the Aggregate Production Function”, Review
of Economics und Statistics, 39(3), 312-320.
[28] Spence, M. (1973): “Job market signaling,” Quarterly Journal of Economics, 87, 355-374.
[29] Wang, H. (2002): “High profile universities in China compete for ¥30 billion
governmental appropriation, and to be 'world class' in 10 years)”, 21CN BUSINESS
HERALD, 27 May 2002: 1 & 3.
[30] Wang, M. (2007): “Overall Earnings Inequalities in Urban China and Earnings
Differentials between Migrant Workers and Urban Local Workers”. The IDRC/CIGI
Young China Scholars Poverty Research Network. Second Annual Meeting. May 2007.
Beijing.
[31] Whalley, J. (2007): “China and Outsourcing,” Paper presented at Industry Canada
Conference on Outsourcing, held at Rotman School, University of Toronto, Oct. 2006 and
forthcoming.
[32] Whalley, J. and S. Zhang (2006): “A Numerical Simulation Analysis of Labour Mobility
(Hukou) Restrictions in China”. Journal of Development Economics, 83, 392 – 410.
[33] Whalley, J. and X. Xin (2006): "China's FDI and Non-FDI Economies and the
Sustainability of Future High Chinese Growth," NBER Working Papers 12249, National
Bureau of Economic Research, Inc.
[34] Whalley, J. and W. Zhou (2007): “Technology Upgrading and China's Growth Strategy to
2020”. The Centre for International Governance Innovation (CIGI) Working Paper No.21.
March 2007, Waterloo, Ontario.
[35] Yin, H., S. Li, and Q. Deng (2006): "Income Mobility in Urban China." Economics
Research. 2006. Vol. 10.
[36] Yue, X., T. Sicular, S. Li, and B. Gustafsson (2006): “Explaining Incomes and Inequality
in China”, included in Gustafsson, B., S. Li and T. Sicular eds. Inequality and Public
48
Policy in China, to be published by Cambridge University Press.
[37] Zhang, H. (2006): “Urban-Rural Inequality in Education Opportunity and the Increasing
Income Gap: Evidence from provincial pooled cross-sectional data”. Journal of Shanxi
Finance and Economics University. 28(2), 31-38.
[38] Zhang, J., Y. Zhao, A. Park and X. Song (2005): “Economic Returns to Schooling in
Urban China, 1988-2001”. Journal of Comparative Economics 33, 730 – 752
[39] Zhao, Y. (1997): “Labor Migration and Returns to Rural Education in China”. American
Journal of Agricultural Economics 79, 1278 – 1287.
[40] China Education Press (2007): “The 11th 5-year Plan in China’s Education”.
Available online: <http://www.edu.cn/zong_he_429/20070530/t20070530_235363.shtml>
[41] China’s Ministry of Education (1991-1997). China Educational Statistics Yearbook.
[42] China’s Ministry of Education (1998-2005). “Statistics Report on China’s
University-owned Companies and Entities (1998-2005)”. Available online:
< http://www.edu.cn/20010821/189449.shtml>
< http://www.edu.cn/20010101/19698.shtml>
< http://www.cutech.edu.cn/cn/kjcy/xbcytj/2005/08/1179971252173016.htm>
[43] China’s Ministry of Education (2004, 2005). “Statistics on China’s Talents Studying
Abroad (2003, 2004)”.
Available online: <http://www.edu.cn/tong_ji_366/20060323/t20060323_87921.shtml>
<http://www.gxzs.com.cn/2006/info.asp?classid=7&ArticleID=227>
[44] China’s Ministry of Education (2005). “Statistics Analytical Report on University-owned
Companies and Entities in China (2004)”. Available online:
<http://www.cutech.edu.cn/cn/kjcy/xbcytj/2005/08/1179971252173016.htm>
[45] China’s Ministry of Education (2006a): “Consolidation of Universities since 1990 in
China”. Available online: <http://www.moe.edu.cn/edoas/website18/level3.jsp?tablename=621&infoid=19558>
[46] China’s Ministry of Education (2006b). China Educational Statistics Yearbook.
[47] China’s Ministry of Education (2006c). China Education Statistics (Online version).
Available online: <http://www.stats.edu.cn>
[48] China’s Ministry of Education (2006d). “Education Expenses of 123 Universities in
China”. Available online: <http://www.cutech.edu.cn/cn/dxph/qt/2006/04/1179971248304994.htm>
49
50
[49] Chinese Academy of Social Sciences (2005): “China’s Education Blue Paper”.
Available online: <http://gb.cri.cn/14714/2007/01/15/[email protected]>
[50] National Bureau of Statistics of China (2001, 2006). China Statistical Yearbook (2001,
2006).
[51] National Bureau of Statistics of China (2005). “How much is China’s educational
expenditures?”. Available online: <http://news.xinhuanet.com/report/2005-06/16/content_3093744.htm>
[52] National Science Foundation (2006). Science and Engineering Indicators 2006. Chapter 2.
[53] National Science Foundation (2007). “Asia's Rising Science and Technology Strength:
Comparative Indicators for Asia, the European Union, and the United States”. NSF 07-319.
Arlington, VA.
[54] The Press Conference of the State Council Information Office (2006): “China’s
Educational Development in the 10th 5-year Period and the 11th 5-year Plan”.
Available online: <http://www.moe.edu.cn/edoas/website18/info18515.htm>
[55] The State Council of China (2007): “The 11th 5-year Plan Outline for National Education
Development”. Available online: <http://news.xinhuanet.com/edu/2007-05/24/content_6143354.htm> or
<http://news.xinhuanet.com/politics/2007-06/11/content_6226661.htm>
[56] World Education News & Reviews (2006). “WENR, August 2006: China”. Vol. 19(4).
Available online: <http://www.wes.org/eWENR/06aug/china.htm>
[57] Xinhua News Agency (2007): “China's Children Too Busy for Playtime.” May, 2007.
Available online: <http://english.peopledaily.com.cn/200705/13/eng20070513_374164.html>


