
The Global Financial Centres Index 25
MARCH 2019
Financial Centre Futures
In March 2007, Z/Yen released the first edition of the GFCI, which continues to provide evaluations of competitiveness and rankings for the major financial centres around the world. We are pleased to present the twenty-fifth edition of the Global Financial Centres Index (GFCI 25).
In July 2016, the China Development Institute (CDI) in Shenzhen and Z/Yen Partners in London established a strategic partnership for research into financial centres. We continue our collaboration in producing the GFCI.
The GFCI is updated every March and September and receives considerable attention from the global financial community. The index serves as a valuable reference for policy and investment decisions.
Z/Yen is the City of London's leading commercial think-tank. Z/Yen was founded in 1994 to promote societal advance through better finance and technology. Z/Yen has built its practice around a core of high-powered project managers, supported by experienced technical specialists so that clients get expertise they need, rather than just resources available. The firm is headquartered in London, but Z/Yen is committed to the ‘virtual office’ concept and is an intense user of technology in order to improve flexibility and benefit staff.
The CDI is a leading national think-tank that develops solutions to public policy challenges through broad-scope and in-depth research to help advance China’s reform and opening-up to world markets. The CDI has been working on the promotion and development of China’s financial system since its establishment 30 years ago. Based on rigorous research and objective analysis, CDI is committed to providing innovative and pragmatic reports for governments at different levels in China and corporations at home and abroad.
The authors of this report, Mark Yeandle and Mike Wardle, would like to thank Bikash Kharel, Michael Mainelli, Carol Feng, Peng Yu, and the rest of the GFCI team for their contributions with research, modelling, and ideas.

The Global Financial Centres Index 25 | 1
Foreword
The release of the Global Financial Centres Index is always an important day in the calendar for Dubai International Financial Centre.
This year is particularly special for us as the DIFC celebrates 15 years of facilitating trade and investment flows across the Middle East, Africa and South Asia (MEASA) region.
The Centre was established in 2004 with the vision to become a global financial hub, which we have successfully achieved under the guidance and support of His Highness Sheikh Mohammed bin Rashid Al Maktoum, Vice President and Prime Minister of the UAE and Ruler of Dubai.
Since then, DIFC has grown into one of the world’s most advanced financial centres, and the leading financial hub for the region. We are home to an internationally-recognised, independent regulator and a proven judicial system with an English common law framework, as well as the region’s largest financial ecosystem of more than 23,000 professionals working across over 2,100 active registered companies.
Now, we are entering a new period of growth through the recently announced plans for DIFC 2.0, which reframes our vision. The 13 million square feet development will drive growth within the regional financial landscape and foster an environment where innovation and entrepreneurship thrive.
Indeed, we are already seeing our vision coming to life in so many ways, from the growth of emerging sectors, such as aviation financing and FinTech, to the size of the wealth and asset management sector at DIFC. The latter now stands at almost US$ 500 billion dollars, which is testament to the capital being raised in the Centre.
By continuing to align with the national government agenda that aims to ensure Dubai’s sustained prosperity and accelerate the development journey of the Emirate, DIFC will remain at the forefront of financial sector advancement.
H.E. Essa Kazim
Governor
Dubai International Financial Centre
2 | The Global Financial Centres Index 25
GFCI 25 Summary And Headlines Overview
• We researched 112 centres for this edition of the Global Financial Centres Index (GFCI 25). The number of financial centres in the main index has increased from 100 to 102 with the addition of Stuttgart, Kuwait City and Nairobi from the associate centres list and the exclusion of Trinidad & Tobago which did not obtain a sufficient number of assessments. There are ten associate centres awaiting potential inclusion in the main index.
• GFCI 25 was compiled using 133 instrumental factors. These quantitative measures are provided by third parties including the World Bank, The Economist Intelligence Unit, the OECD, and the United Nations. Details can be found in Appendix 4.
• The instrumental factors were combined with 29,065 financial centre assessments provided by respondents to the GFCI online questionnaire (globalfinancialcentres.net/survey).
• A breakdown of the 2,373 respondents is shown in Appendix 2. Further details of the methodology behind GFCI 25 are in Appendix 3.
• Performance across the index was encouraging as respondents are more confident about the future than in GFCI 24. Within the top 30 centres in the index, 26 centres rose in the ratings while one fell and three remained stationary. Only 16 of the 102 centres fell in the ratings.
The Results
Leading Centres
• New York remains in first place in the index, seven points head of London. Hong Kong is only four points behind London in third and Singapore remains in fourth place;
• Shanghai remains ahead of Tokyo in fifth place in the index although Tokyo gained ten points in the ratings;
• Toronto rose 27 points and gained four places to seventh. Zurich, Beijing, and Frankfurt remained in the top ten.
Western Europe
• This region did well after a mixed performance in GFCI 24. Thirteen of the top 15 Western European centres rose in the ratings with particularly strong performances by Monaco, Madrid and Edinburgh. Only Luxembourg and Amsterdam saw modest declines;
• The centres that are most likely to benefit from Brexit did well, with Zurich, Frankfurt, Paris, and Dublin all gaining ground. Amsterdam was the only centre in Western Europe that dropped more than ten points in the ratings.

The Global Financial Centres Index 25 | 3
Asia/Pacific
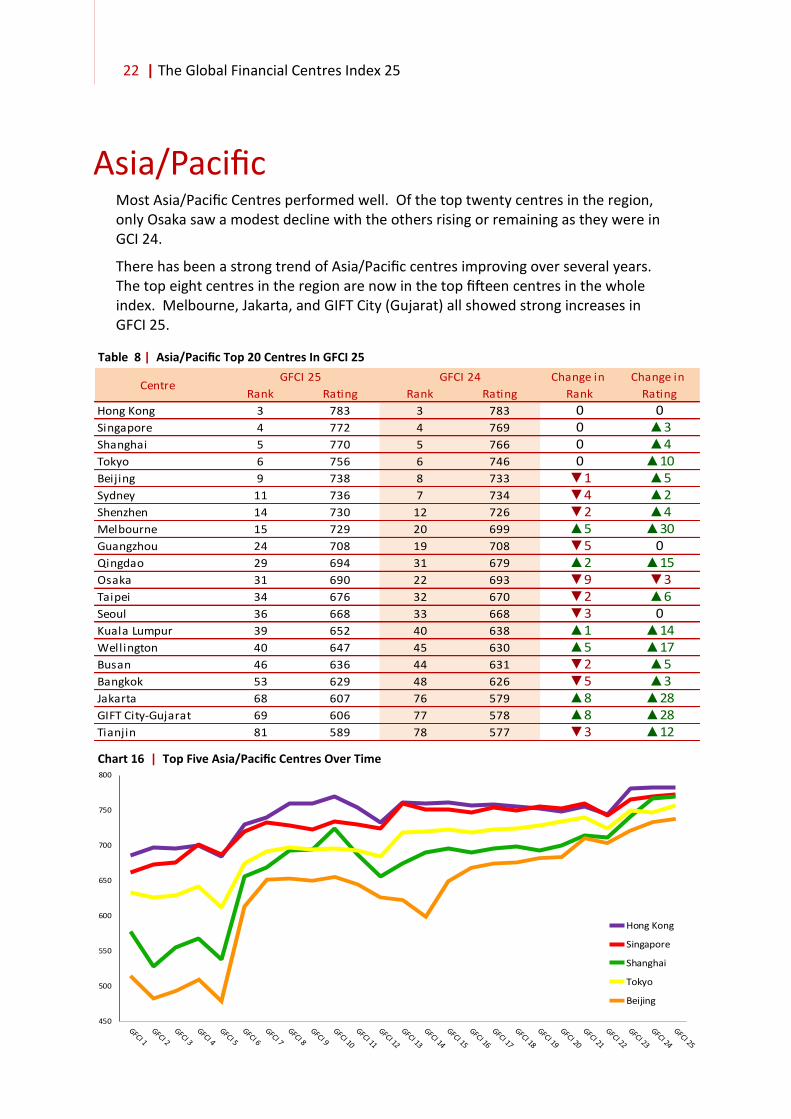
• Most Asia/Pacific Centres performed well. Of the top twenty centres in the region, only Osaka saw a modest decline with the others rising or remaining as they were in GFCI 24;
• There has been a strong trend of Asia/Pacific centres improving over several years. The top eight centres in the region are now in the top fifteen centres in the whole index;
• Melbourne, Jakarta, and GIFT City (Gujarat) all showed strong increases in GFCI 25.
North America
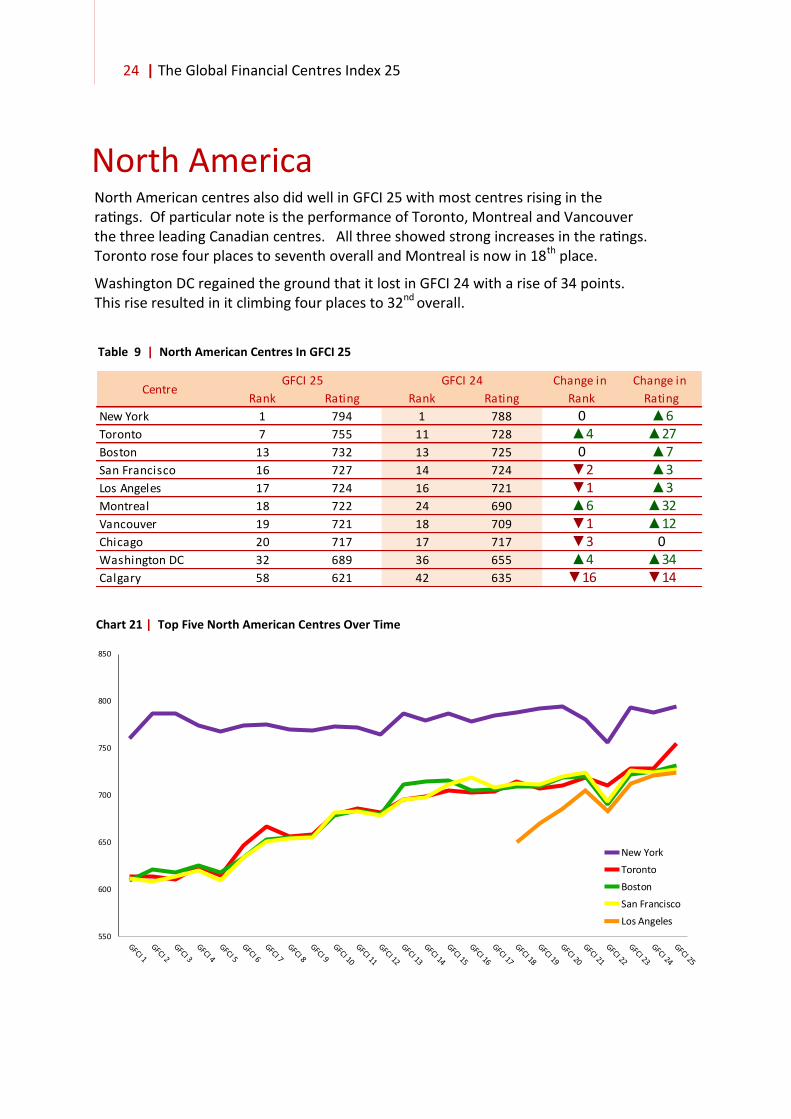
• North American centres also did well in GFCI 25 with most centres rising in the ratings. Of particular note is the performance of Toronto, Montreal and Vancouver, the three leading Canadian centres. All three showed strong increases in the ratings. Toronto rose four places to seventh overall and Montreal is now in 18th place;
• Washington DC regained the ground that it lost in GFCI 24 with a rise of 34 points. This rise resulted in it climbing four places to 32nd overall.
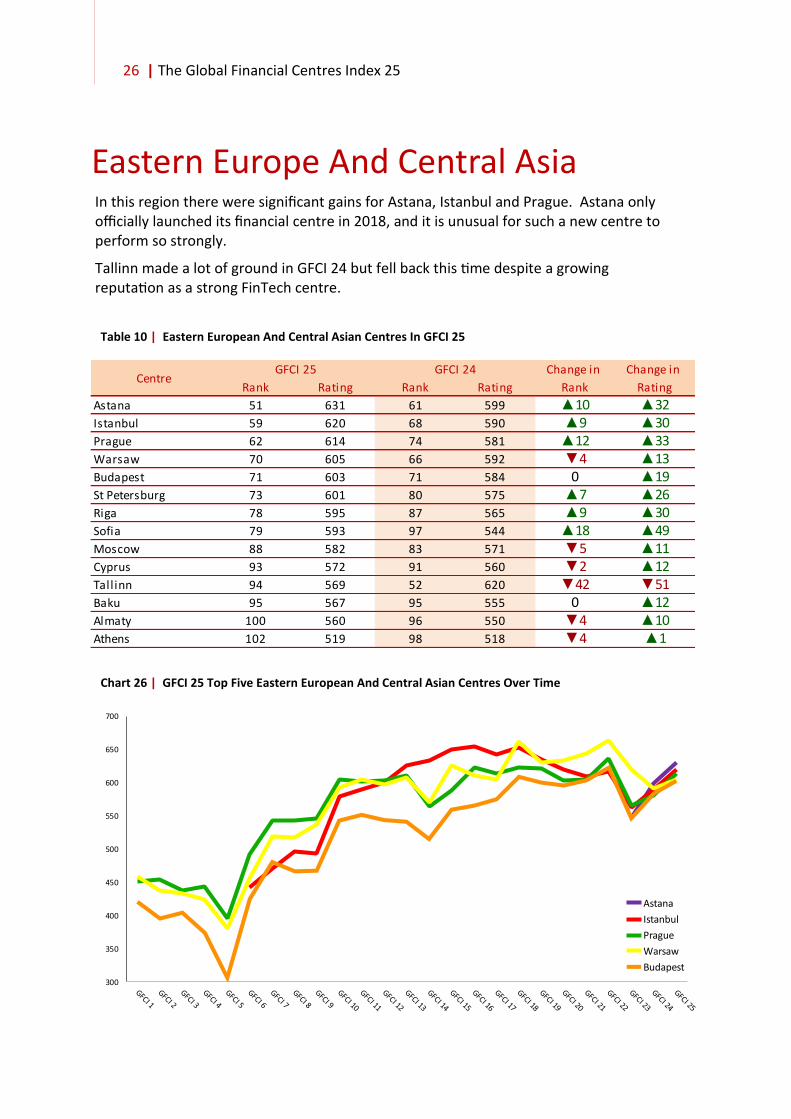
Eastern Europe And Central Asia
• There were significant gains for Astana, Istanbul and Prague. Astana only officially launched its financial centre in 2018, and it is unusual for such a new centre to perform so strongly;
• Tallinn made a lot of ground in GFCI 24 but fell back this time despite a growing reputation as a strong FinTech centre.
Middle East And Africa
• Dubai, Casablanca, and Abu Dhabi continued to rise in the index. Doha lost some of the ground it made in GFCI 24;
• Kuwait City and Nairobi were new entrants to the index, with Kuwait ranking 57th in its first entry.
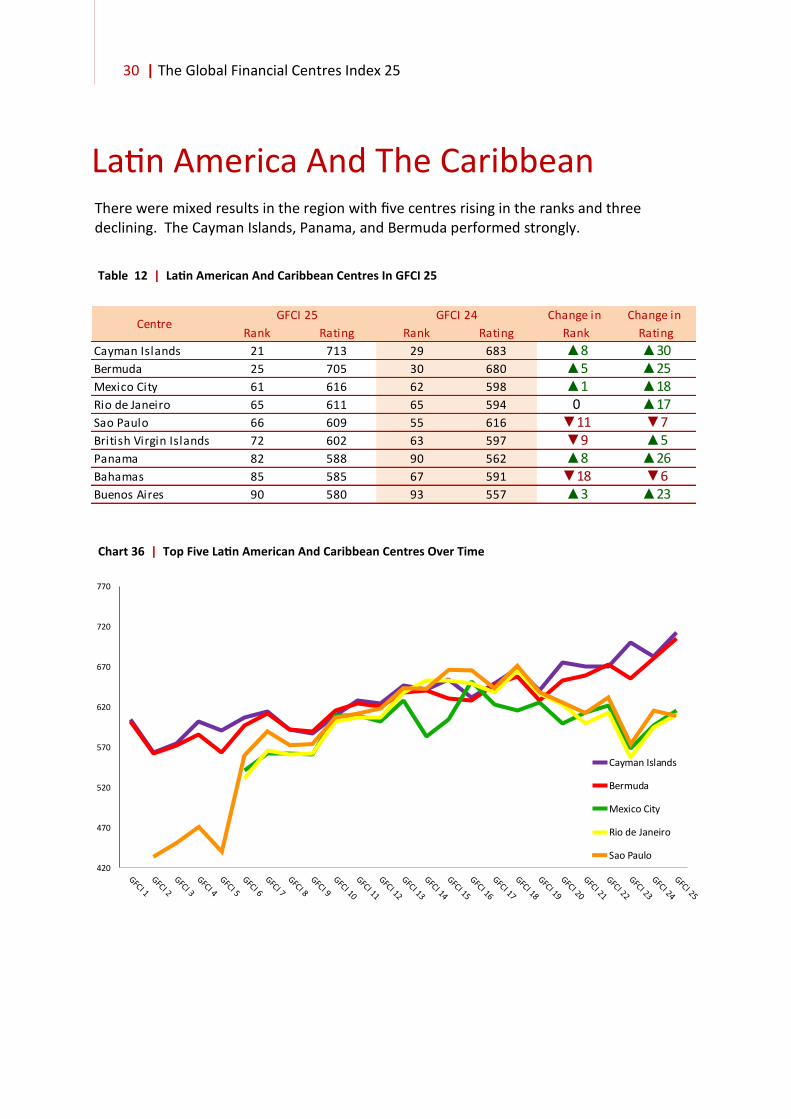
Latin America And The Caribbean
• There were mixed results in the region with five centres rising in the ranks and three declining. The Cayman Islands, Panama, and Bermuda performed strongly.
Island Centres
• The British Crown dependencies showed a mixed performance with Jersey making a small gain, the Isle of Man moving up but Guernsey dropping 15 places in the index to 75th place.
4 | The Global Financial Centres Index 25
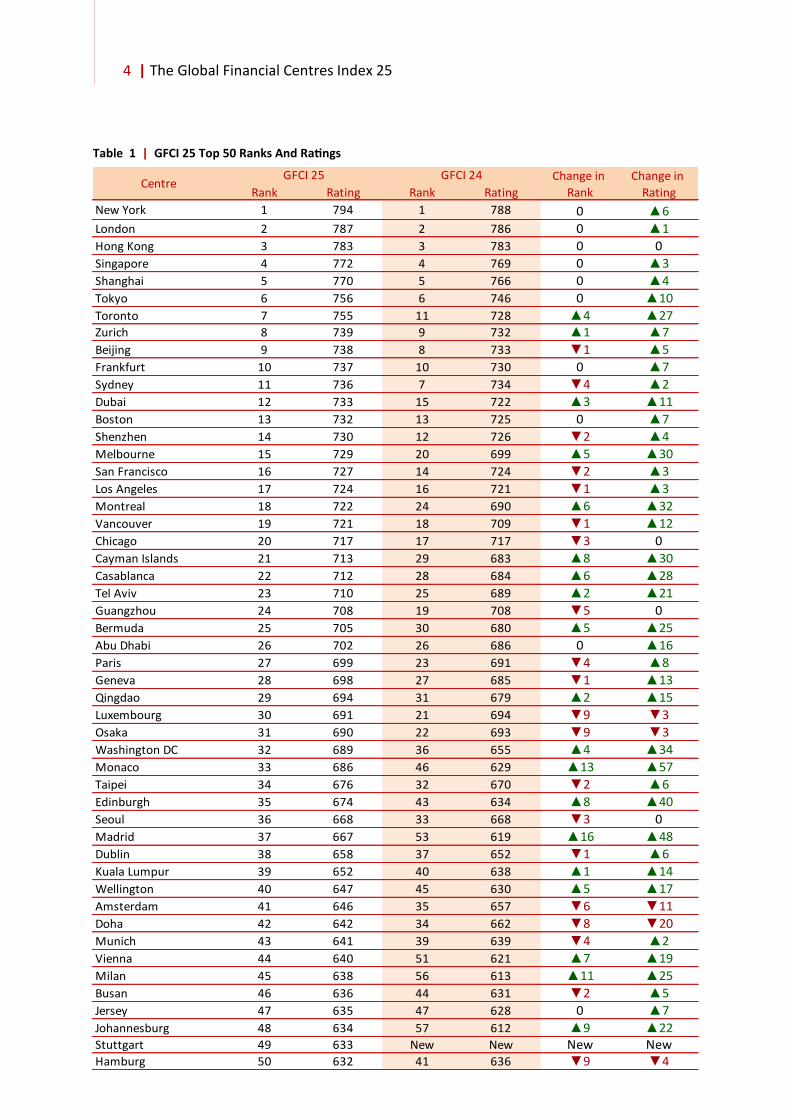
Table 1 | GFCI 25 Top 50 Ranks And Ratings
Change in Change in
Rank Rating Rank Rating Rank Rating
New York 1 794 1 788 0 ▲6
London 2 787 2 786 0 ▲1
Hong Kong 3 783 3 783 0 0
Singapore 4 772 4 769 0 ▲3
Shanghai 5 770 5 766 0 ▲4
Tokyo 6 756 6 746 0 ▲10
Toronto 7 755 11 728 ▲4 ▲27Zurich 8 739 9 732 ▲1 ▲7
Beijing 9 738 8 733 ▼1 ▲5
Frankfurt 10 737 10 730 0 ▲7
Sydney 11 736 7 734 ▼4 ▲2
Dubai 12 733 15 722 ▲3 ▲11
Boston 13 732 13 725 0 ▲7
Shenzhen 14 730 12 726 ▼2 ▲4
Melbourne 15 729 20 699 ▲5 ▲30
San Francisco 16 727 14 724 ▼2 ▲3
Los Angeles 17 724 16 721 ▼1 ▲3
Montreal 18 722 24 690 ▲6 ▲32
Vancouver 19 721 18 709 ▼1 ▲12
Chicago 20 717 17 717 ▼3 0
Cayman Islands 21 713 29 683 ▲8 ▲30
Casablanca 22 712 28 684 ▲6 ▲28
Tel Aviv 23 710 25 689 ▲2 ▲21
Guangzhou 24 708 19 708 ▼5 0
Bermuda 25 705 30 680 ▲5 ▲25
Abu Dhabi 26 702 26 686 0 ▲16
Paris 27 699 23 691 ▼4 ▲8
Geneva 28 698 27 685 ▼1 ▲13
Qingdao 29 694 31 679 ▲2 ▲15
Luxembourg 30 691 21 694 ▼9 ▼3
Osaka 31 690 22 693 ▼9 ▼3
Washington DC 32 689 36 655 ▲4 ▲34
Monaco 33 686 46 629 ▲13 ▲57
Taipei 34 676 32 670 ▼2 ▲6
Edinburgh 35 674 43 634 ▲8 ▲40
Seoul 36 668 33 668 ▼3 0
Madrid 37 667 53 619 ▲16 ▲48
Dublin 38 658 37 652 ▼1 ▲6
Kuala Lumpur 39 652 40 638 ▲1 ▲14
Wellington 40 647 45 630 ▲5 ▲17
Amsterdam 41 646 35 657 ▼6 ▼11
Doha 42 642 34 662 ▼8 ▼20
Munich 43 641 39 639 ▼4 ▲2
Vienna 44 640 51 621 ▲7 ▲19
Milan 45 638 56 613 ▲11 ▲25
Busan 46 636 44 631 ▼2 ▲5
Jersey 47 635 47 628 0 ▲7
Johannesburg 48 634 57 612 ▲9 ▲22Stuttgart 49 633 New New New NewHamburg 50 632 41 636 ▼9 ▼4
CentreGFCI 24GFCI 25

The Global Financial Centres Index 25 | 5
Table 1 (Continued) | GFCI 25 Remaining Ranks And Ratings
Change in Change in
Rank Rating Rank Rating Rank Rating
Astana 51 631 61 599 ▲10 ▲32Brussels 52 630 54 617 ▲2 ▲13Bangkok 53 629 48 626 ▼5 ▲3Mauritius 54 628 49 625 ▼5 ▲3Stockholm 55 627 58 611 ▲3 ▲16Cape Town 56 626 38 651 ▼18 ▼25Kuwait City 57 625 New New New NewCalgary 58 621 42 635 ▼16 ▼14Istanbul 59 620 68 590 ▲9 ▲30Lisbon 60 619 70 585 ▲10 ▲34Mexico City 61 616 62 598 ▲1 ▲18Prague 62 614 74 581 ▲12 ▲33Glasgow 63 613 50 622 ▼13 ▼9Oslo 64 612 64 596 0 ▲16Rio de Janeiro 65 611 65 594 0 ▲17Sao Paulo 66 609 55 616 ▼11 ▼7Bahrain 67 608 59 607 ▼8 ▲1Jakarta 68 607 76 579 ▲8 ▲28GIFT City-Gujarat 69 606 77 578 ▲8 ▲28Warsaw 70 605 66 592 ▼4 ▲13Budapest 71 603 71 584 0 ▲19British Virgin Islands 72 602 63 597 ▼9 ▲5St Petersburg 73 601 80 575 ▲7 ▲26Helsinki 74 599 94 556 ▲20 ▲43Guernsey 75 598 60 603 ▼15 ▼5Copenhagen 76 597 81 573 ▲5 ▲24Liechtenstein 77 596 73 582 ▼4 ▲14Riga 78 595 87 565 ▲9 ▲30Sofia 79 593 97 544 ▲18 ▲49Gibraltar 80 591 75 580 ▼5 ▲11Tianjin 81 589 78 577 ▼3 ▲12Panama 82 588 90 562 ▲8 ▲26Reykjavik 83 587 84 570 ▲1 ▲17Isle of Man 84 586 85 568 ▲1 ▲18Bahamas 85 585 67 591 ▼18 ▼6Rome 86 584 72 583 ▼14 ▲1Chengdu 87 583 79 576 ▼8 ▲7Moscow 88 582 83 571 ▼5 ▲11Malta 89 581 88 564 ▼1 ▲17Buenos Aires 90 580 93 557 ▲3 ▲23Riyadh 91 575 69 588 ▼22 ▼13Mumbai 92 573 92 558 0 ▲15Cyprus 93 572 91 560 ▼2 ▲12Tallinn 94 569 52 620 ▼42 ▼51Baku 95 567 95 555 0 ▲12New Delhi 96 565 82 572 ▼14 ▼7
Nairobi 97 564 New New New New
Manila 98 562 86 566 ▼12 ▼4
Hangzhou 99 561 89 563 ▼10 ▼2
Almaty 100 560 96 550 ▼4 ▲10
Dalian 101 520 100 499 ▼1 ▲21
Athens 102 519 98 518 ▼4 ▲1
CentreGFCI 25 GFCI 24
6 | The Global Financial Centres Index 25
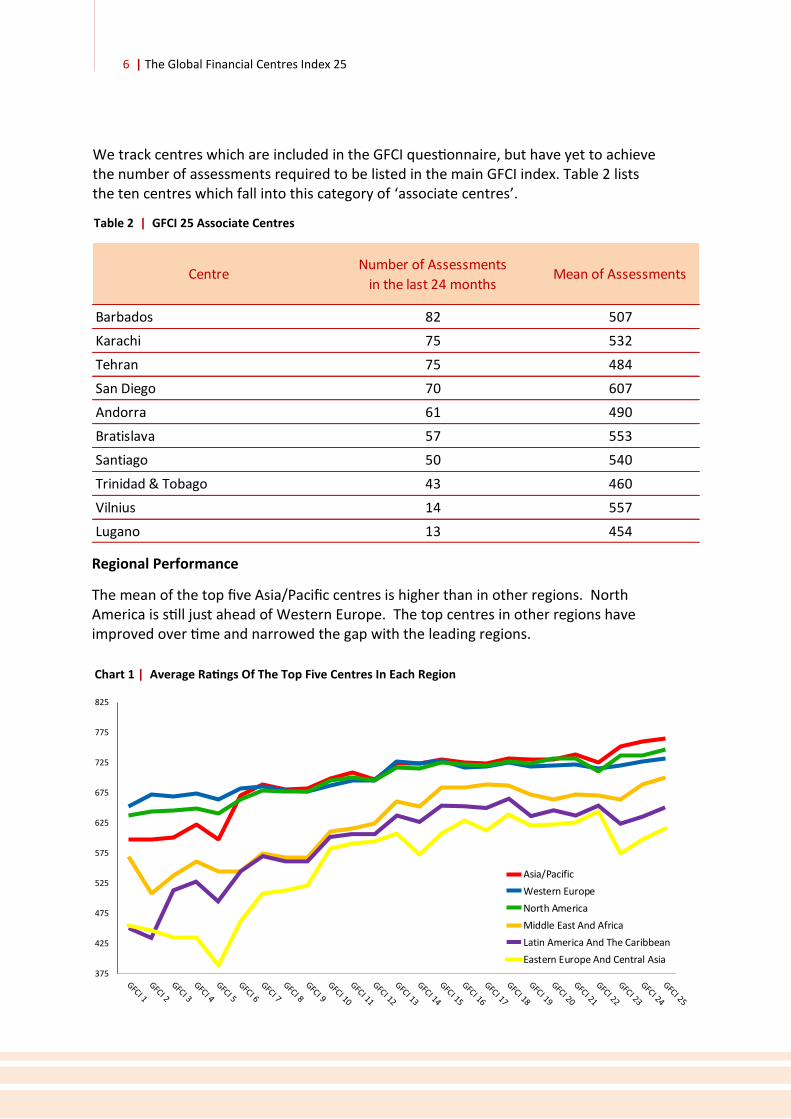
Table 2 | GFCI 25 Associate Centres
Regional Performance
The mean of the top five Asia/Pacific centres is higher than in other regions. North America is still just ahead of Western Europe. The top centres in other regions have improved over time and narrowed the gap with the leading regions.
We track centres which are included in the GFCI questionnaire, but have yet to achieve the number of assessments required to be listed in the main GFCI index. Table 2 lists the ten centres which fall into this category of ‘associate centres’.
Chart 1 | Average Ratings Of The Top Five Centres In Each Region
375
425
475
525
575
625
675
725
775
825
Asia/Pacific
Western Europe
North America
Middle East And Africa
Latin America And The Caribbean
Eastern Europe And Central Asia
CentreNumber of Assessments
in the last 24 monthsMean of Assessments
Barbados 82 507
Karachi 75 532
Tehran 75 484
San Diego 70 607
Andorra 61 490
Bratislava 57 553
Santiago 50 540
Trinidad & Tobago 43 460
Vilnius 14 557
Lugano 13 454

The Global Financial Centres Index 25 | 7
The Top Five Centres
New York remains in first place in GFCI 25 and has increased its lead over London to seven points. Hong Kong, Singapore, and Shanghai have all continued to close the gap on the leaders, with Hong Kong now only four points behind London. When we started tracking financial centres, Shanghai was 193 points behind the leader. It is now just 17 points behind.
Chart 2 | The Top Five Centres— GFCI Ratings Over Time
“The top Asian centres, are to my mind, leading the way at the moment.”
INVESTMENT BANKER BASED IN STUTTGART
520
570
620
670
720
770
820
870
New York
London
Hong Kong
Singapore
Shanghai
8 | The Global Financial Centres Index 25
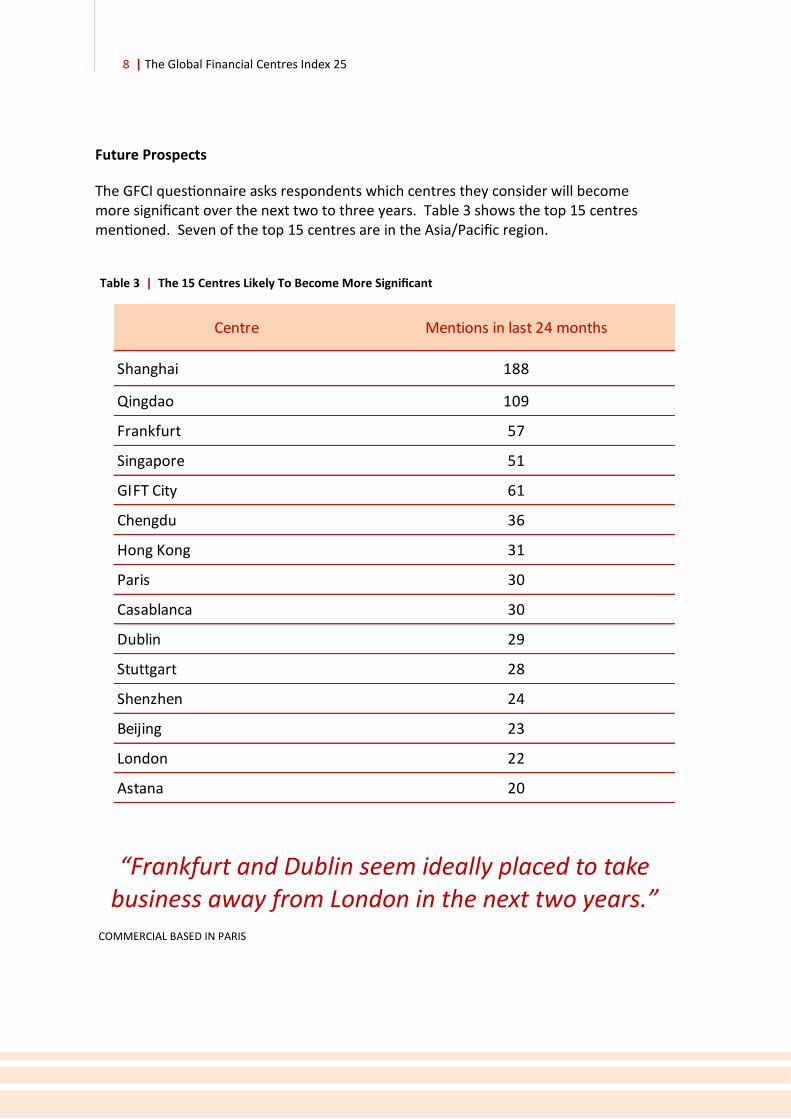
Future Prospects
The GFCI questionnaire asks respondents which centres they consider will become more significant over the next two to three years. Table 3 shows the top 15 centres mentioned. Seven of the top 15 centres are in the Asia/Pacific region.
Table 3 | The 15 Centres Likely To Become More Significant
“Frankfurt and Dublin seem ideally placed to take business away from London in the next two years.”
COMMERCIAL BASED IN PARIS
Centre Mentions in last 24 months
Shanghai 188
Qingdao 109
Frankfurt 57
Singapore 51
GIFT City 61
Chengdu 36
Hong Kong 31
Paris 30
Casablanca 30
Dublin 29
Stuttgart 28
Shenzhen 24
Beijing 23
London 22
Astana 20

The Global Financial Centres Index 25 | 9
Chart 3 | GFCI Areas Of Competitiveness
Areas Of Competitiveness The instrumental factors used in the GFCI model are grouped into five broad areas of competitiveness: Business Environment, Human Capital, Infrastructure, Financial Sector Development, and Reputation. These areas and the instrumental factor groups which comprise each area are shown in chart 3.
Business Environment
Human Capital InfrastructureFinancial Sector
DevelopmentReputation
Areas of Competitiveness
Political Stability
and Rule of Law
Institutional and Regulatory
Environment
Macroeconomic Environment
Tax and Cost Competitiveness
Availability of Skilled Personnel
Flexible Labour Market
Education and Development
Quality of Life
Built Infrastructure
ICT Infrastructure
Transport Infrastructure
Sustainable Development
Depth and Breadth of
Industry Clusters
Availability of Capital
Market Liquidity
Economic Output
City Brand and Appeal
Level of Innovation
Attractiveness and Cultural
Diversity
Comparative Positioning with Other Centres
10 | The Global Financial Centres Index 25
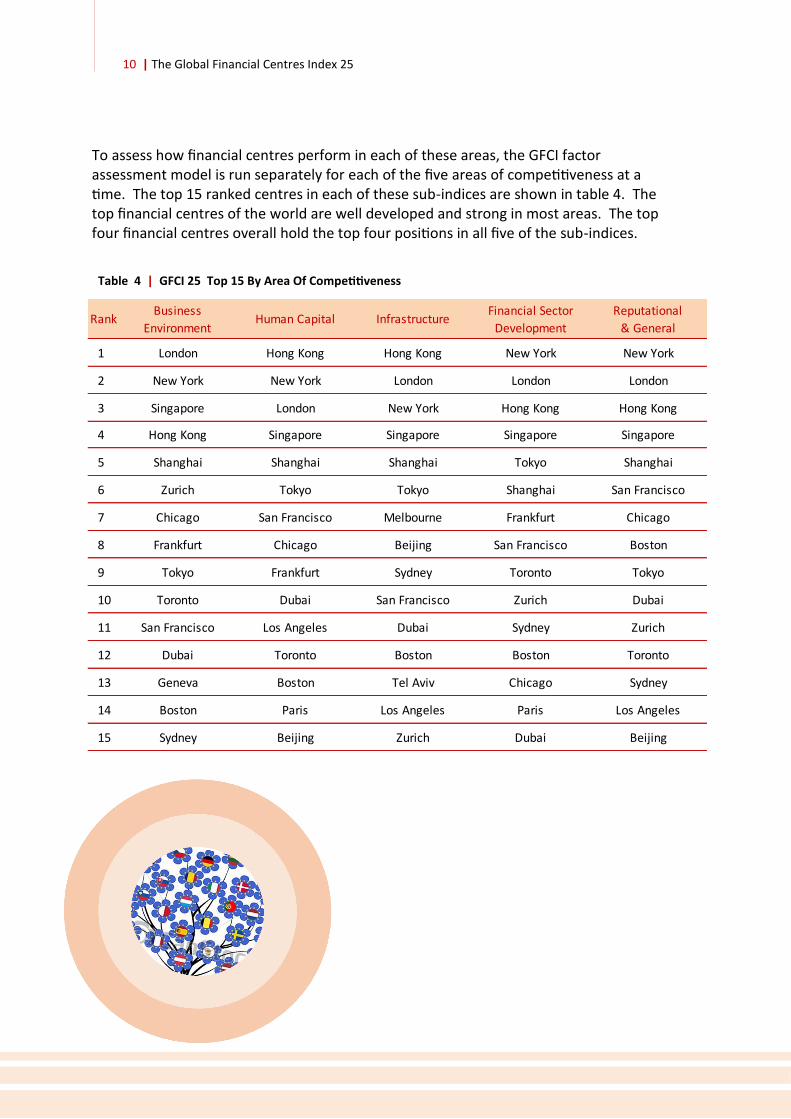
Table 4 | GFCI 25 Top 15 By Area Of Competitiveness
To assess how financial centres perform in each of these areas, the GFCI factor assessment model is run separately for each of the five areas of competitiveness at a time. The top 15 ranked centres in each of these sub-indices are shown in table 4. The top financial centres of the world are well developed and strong in most areas. The top four financial centres overall hold the top four positions in all five of the sub-indices.
RankBusiness
EnvironmentHuman Capital Infrastructure
Financial Sector
Development
Reputational
& General
1 London Hong Kong Hong Kong New York New York
2 New York New York London London London
3 Singapore London New York Hong Kong Hong Kong
4 Hong Kong Singapore Singapore Singapore Singapore
5 Shanghai Shanghai Shanghai Tokyo Shanghai
6 Zurich Tokyo Tokyo Shanghai San Francisco
7 Chicago San Francisco Melbourne Frankfurt Chicago
8 Frankfurt Chicago Beijing San Francisco Boston
9 Tokyo Frankfurt Sydney Toronto Tokyo
10 Toronto Dubai San Francisco Zurich Dubai
11 San Francisco Los Angeles Dubai Sydney Zurich
12 Dubai Toronto Boston Boston Toronto
13 Geneva Boston Tel Aviv Chicago Sydney
14 Boston Paris Los Angeles Paris Los Angeles
15 Sydney Beijing Zurich Dubai Beijing

The Global Financial Centres Index 25 | 11
Factors affecting Competitiveness
The GFCI questionnaire asks respondents to indicate which factors of competitiveness they consider the most important at this time. The number of times that each area was mentioned and the key issues raised by respondents are shown in table 5.
Table 5 | GFCI 24 Main Areas Of Competitiveness
“We have reluctantly decided to move to mainland Europe. We cannot wait until the Brexit
debacle is sorted out”
FUND MANAGER BASED IN LONDON
Area of CompetitivenessNumber of
MentionsMain Issues
The regulatory environment is still the most important factor
Levels of corruption seem to be getting worse
The rule of law must be enforced
The importance of attracting talent is increasing
The free movement of skilled people is crucial (will Brexit impede this in Europe?)
Reduced human rights and freedom are harming some centres
Improved air connectivity is now the top priority for some centres
Centres are becoming more aware of creating 'ecosystems'
ICT Infrastructure is noiw taken for granted in the leading centres
Increased competition means that more intense marketing is vital
Reputation for a good quality of life remains important
A good reputation takes a long time to build
Financial Institutions looking at relocation decisions, especially in London
Having a critical mass of international organisaions remains important
Being able to meet clients face-to-face increases business
Financial Sector Development 428
Human Capital 522
Infrastructure 480
Reputation 478
Business Environment 555

12 | The Global Financial Centres Index 25
GFC
I 2
5 R
atin
g
Asia/Pacific
Eastern Europe & Central Asia
North America
Latin America & the Caribbean
Middle East & Africa
Western Europe
New York London
Hong Kong Singapore
GFC
I 2
5 R
atin
g
Asia/Pacific
Eastern Europe & Central Asia
North America
Latin America & the Caribbean
Middle East & Africa
Western Europe
New York London
Hong Kong
Singapore
In developing our research into financial centres, we have found that the level of corruption and the rule of law are significant factors in a financial centre’s competitiveness. Chart 4 plots GFCI ratings against the Corruption Perceptions Index and Chart 5 plots GFCI rating against the Rule Of Law. These charts demonstrate the correlation of these factors with the GFCI 25 ratings (the size of the bubble indicates the relative GDP of each centre).
The Rule Of Law And Corruption
Chart 4 | GFCI 25 Rating Against Corruption Perceptions (Supplied by Transparency International)
Chart 5 | GFCI 25 Rating Against the Rule Of Law (Supplied by the World Bank)
Increased Rule Of Law
Lower Perceptions Of Corruption
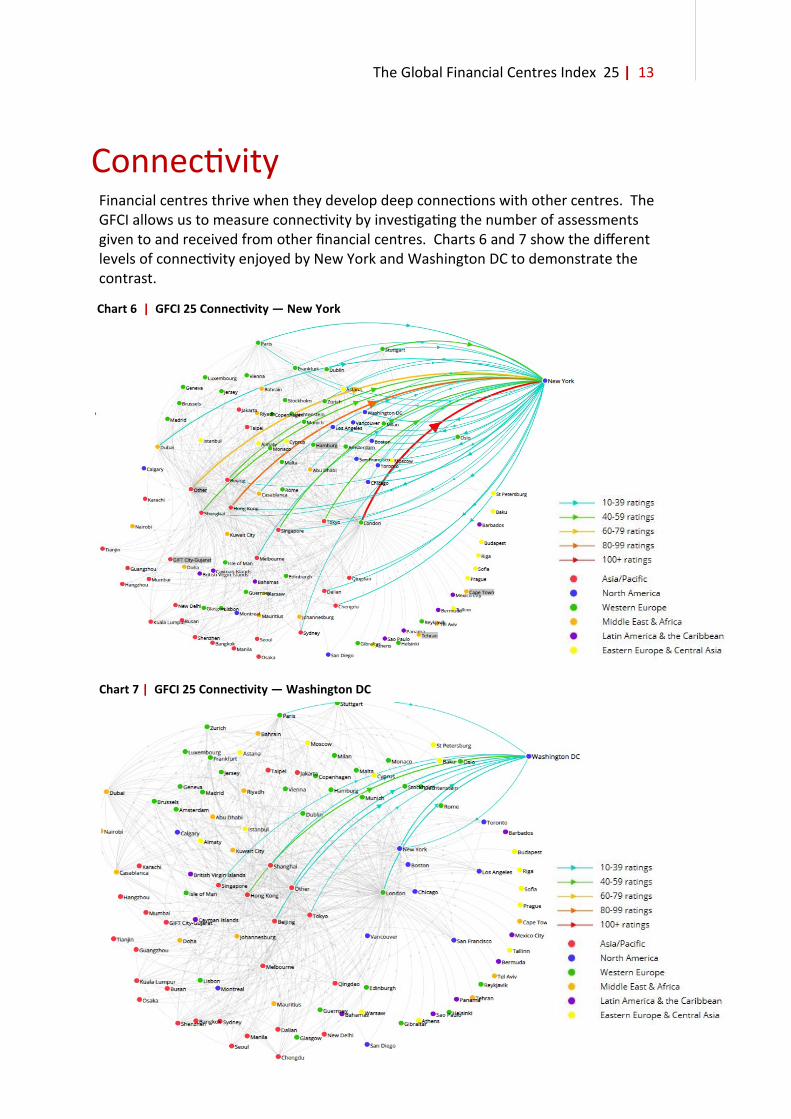
The Global Financial Centres Index 25 | 13
Connectivity Financial centres thrive when they develop deep connections with other centres. The GFCI allows us to measure connectivity by investigating the number of assessments given to and received from other financial centres. Charts 6 and 7 show the different levels of connectivity enjoyed by New York and Washington DC to demonstrate the contrast.
Chart 7 | GFCI 25 Connectivity — Washington DC
Chart 6 | GFCI 25 Connectivity — New York
14 | The Global Financial Centres Index 25
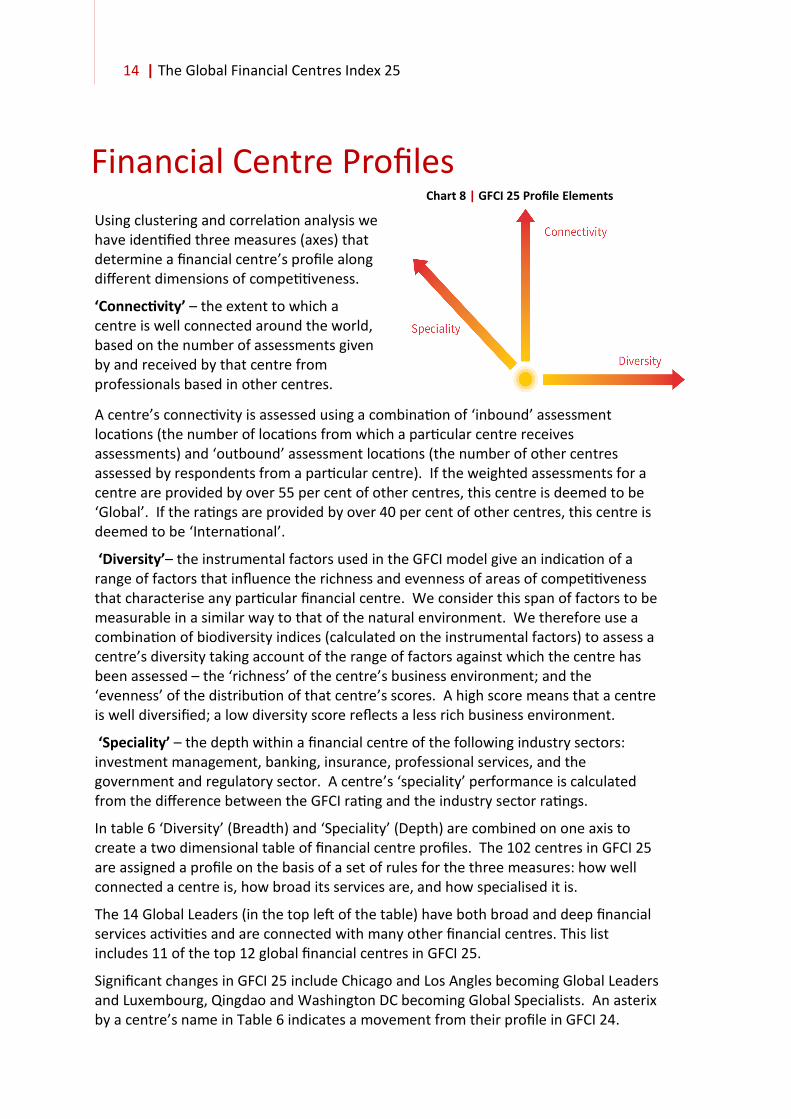
Using clustering and correlation analysis we have identified three measures (axes) that determine a financial centre’s profile along different dimensions of competitiveness.
‘Connectivity’ – the extent to which a centre is well connected around the world, based on the number of assessments given by and received by that centre from professionals based in other centres.
Financial Centre Profiles Chart 8 | GFCI 25 Profile Elements
A centre’s connectivity is assessed using a combination of ‘inbound’ assessment locations (the number of locations from which a particular centre receives assessments) and ‘outbound’ assessment locations (the number of other centres assessed by respondents from a particular centre). If the weighted assessments for a centre are provided by over 55 per cent of other centres, this centre is deemed to be ‘Global’. If the ratings are provided by over 40 per cent of other centres, this centre is deemed to be ‘International’.
‘Diversity’– the instrumental factors used in the GFCI model give an indication of a range of factors that influence the richness and evenness of areas of competitiveness that characterise any particular financial centre. We consider this span of factors to be measurable in a similar way to that of the natural environment. We therefore use a combination of biodiversity indices (calculated on the instrumental factors) to assess a centre’s diversity taking account of the range of factors against which the centre has been assessed – the ‘richness’ of the centre’s business environment; and the ‘evenness’ of the distribution of that centre’s scores. A high score means that a centre is well diversified; a low diversity score reflects a less rich business environment.
‘Speciality’ – the depth within a financial centre of the following industry sectors: investment management, banking, insurance, professional services, and the government and regulatory sector. A centre’s ‘speciality’ performance is calculated from the difference between the GFCI rating and the industry sector ratings.
In table 6 ‘Diversity’ (Breadth) and ‘Speciality’ (Depth) are combined on one axis to create a two dimensional table of financial centre profiles. The 102 centres in GFCI 25 are assigned a profile on the basis of a set of rules for the three measures: how well connected a centre is, how broad its services are, and how specialised it is.
The 14 Global Leaders (in the top left of the table) have both broad and deep financial services activities and are connected with many other financial centres. This list includes 11 of the top 12 global financial centres in GFCI 25.
Significant changes in GFCI 25 include Chicago and Los Angles becoming Global Leaders and Luxembourg, Qingdao and Washington DC becoming Global Specialists. An asterix by a centre’s name in Table 6 indicates a movement from their profile in GFCI 24.

The Global Financial Centres Index 25 | 15
Table 6 | GFCI 25 Financial Centre Profiles
Broad & Deep Relatively Broad Relatively Deep Emerging
Global Leaders Global Diversified Global Specialists Global Contenders
Abu Dhabi Amsterdam Astana Chengdu*
Bei jing Brussels Luxembourg* Moscow*
Chicago* Dubl in Qingdao*
Dubai Frankfurt Shenzhen
Hong Kong Milan Washington DC*
London Paris*
Los Angeles* San Francisco
New York
Shanghai
Singapore
Sydney
Tokyo
Toronto
Zurich
Established
International
International
Diversified
International
Specialists
International
Contenders
Boston Athens* Almaty Bri ti sh Virgin Is lands*
Calgary Bangkok* Bermuda Buenos Aires*
Geneva Copenhagen Busan* Dal ian
Hamburg* Edinburgh Casablanca Doha*
Kuala Lumpur Is tanbul* Cayman Is lands Hangzhou*
Madrid* Johannesburg GIFT Ci ty-Gujarat* Jakarta*
Melbourne Rome* Guangzhou Malta*
Montreal Stockholm Guernsey New Delhi*
Munich* Vienna* Jersey
Seoul* Rio de Janeiro*
Stuttgart (New) Taipei
Vancouver
Established Players Local Diversified Local Specialists Evolving Centres
Budapest Glasgow* Bahamas Bahra in
Mexico Ci ty Hels inki Baku* Cyprus
Osaka Lisbon Cape Town Gi lbra l tar*
Prague Os lo Is le of Man Mani la*
Wel l ington Tel Aviv* Kuwait Ci ty (New) Mauri tius*
Warsaw* Liechtenstein Mumbai*
Monaco Nairobi (New)
Panama Reykjavik
Riga* Riyadh
Sao Paulo* Tal l inn*
Sofia Tianjin
St Petersburg
Global
Local
International
16 | The Global Financial Centres Index 25
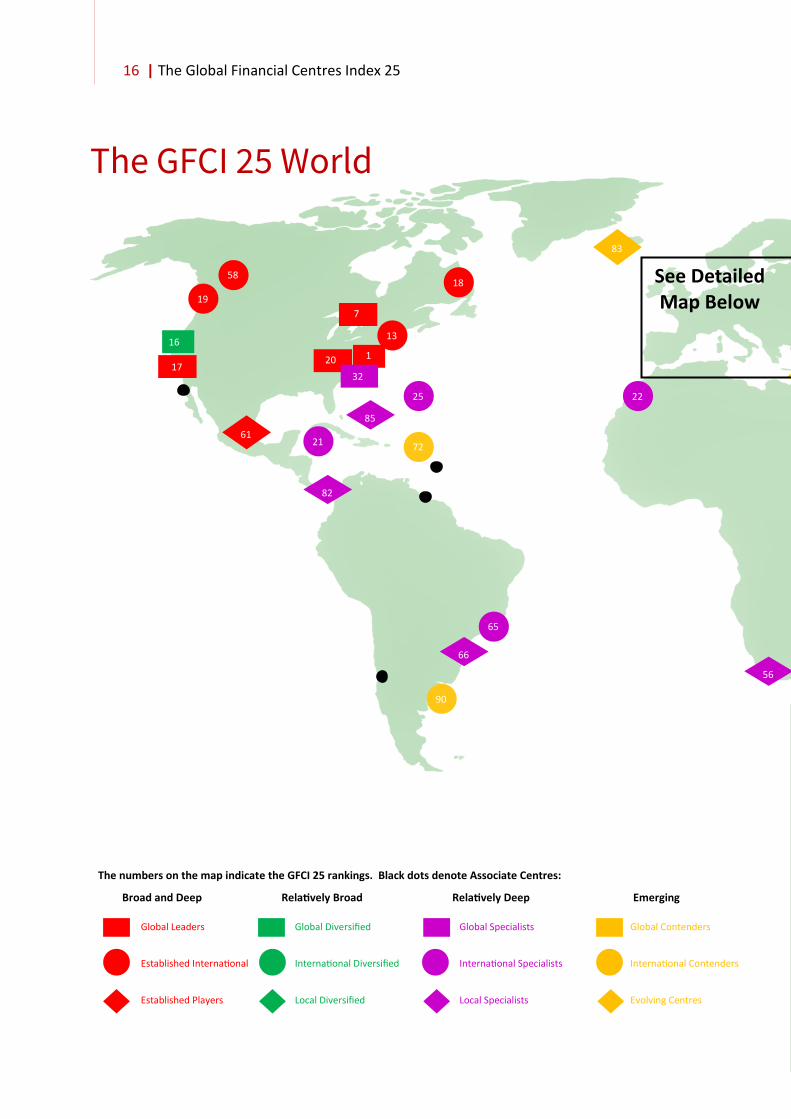
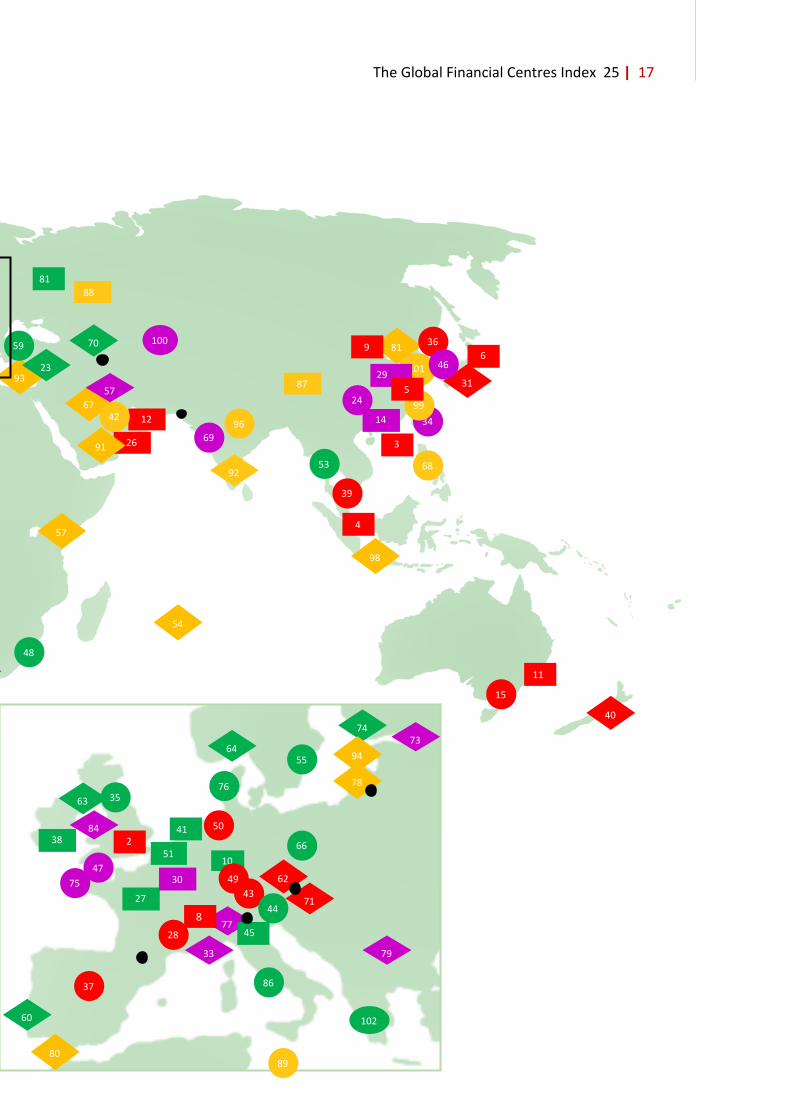
The numbers on the map indicate the GFCI 25 rankings. Black dots denote Associate Centres:
Broad and Deep Relatively Broad Relatively Deep Emerging
Global Leaders Global Diversified Global Specialists Global Contenders
Established International International Diversified International Specialists International Contenders
Established Players Local Diversified Local Specialists Evolving Centres
See Detailed Map Below
7
1
58 18
13
19
72
22
21
25
85
61
56
82
83
16
The GFCI 25 World
17 20
32
65
66
90
The Global Financial Centres Index 25 | 17
14
77
93
59
8
2
3
4
6
12
81 9
11
26
41
51 38
10
39
28
15
66
67 42
35
55
48
76
100
24
71
62
31
60
74
64
84
33 79
73
98
78
57
45
81
101
75
47
34
40
50
37
43
36
49
27
102
53
86
44
63
23
70
30
29 46
69
54
57
80
87
88
91
94
92
96
89
99
68
5

18 | The Global Financial Centres Index 25
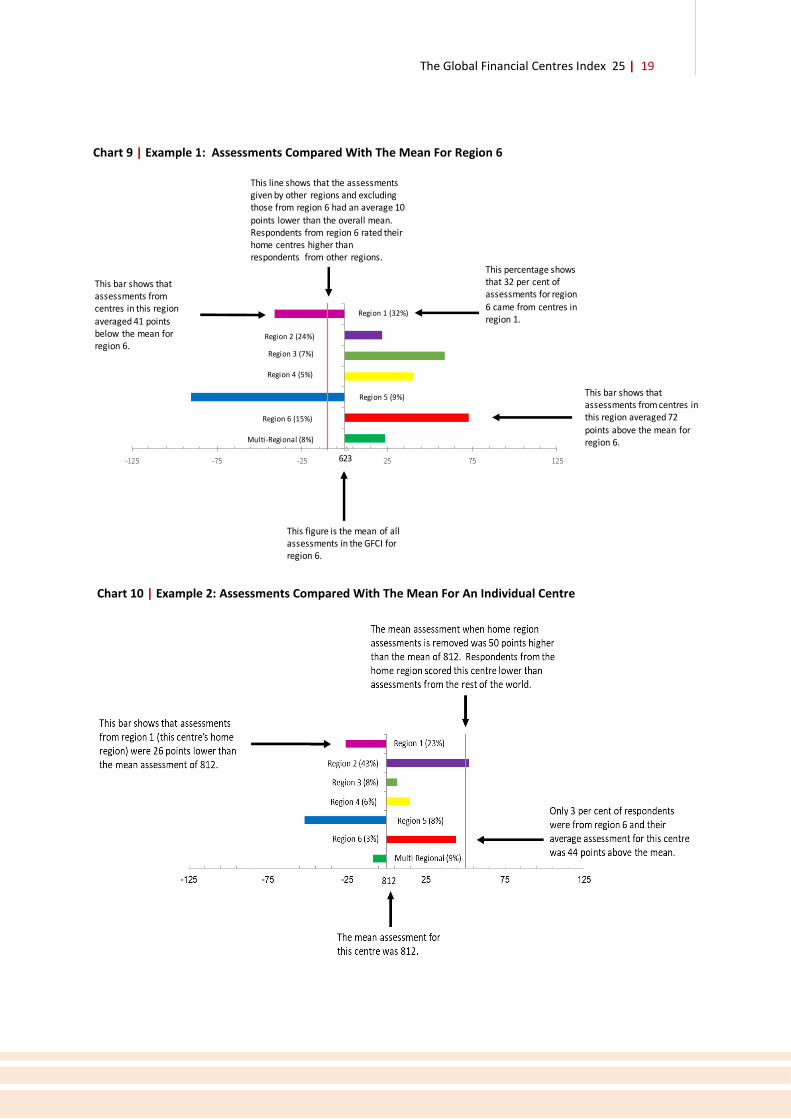
Regional Analysis In our analysis of the GFCI data, we look at six regions of the world to explore the competitiveness of their financial centres.
Alongside the ranks and ratings of centres, we look at trends in the leading centres in each region; and investigate the average assessments received by regions and centres in more detail.
We display this analysis in charts which show:
• the mean assessment provided to that region or centre;
• the difference in the mean assessment when home region assessments are removed from the analysis;
• the difference between the mean and the assessments provided by other regions;
• the proportion of assessments provided by each region.
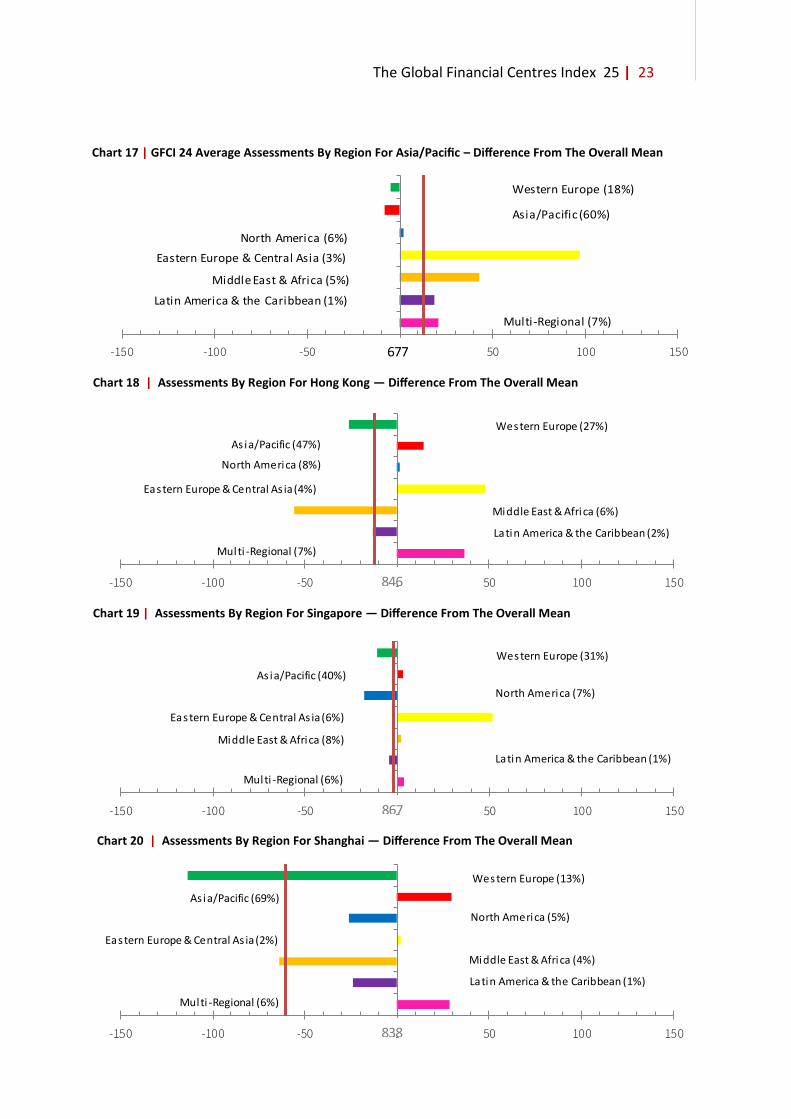
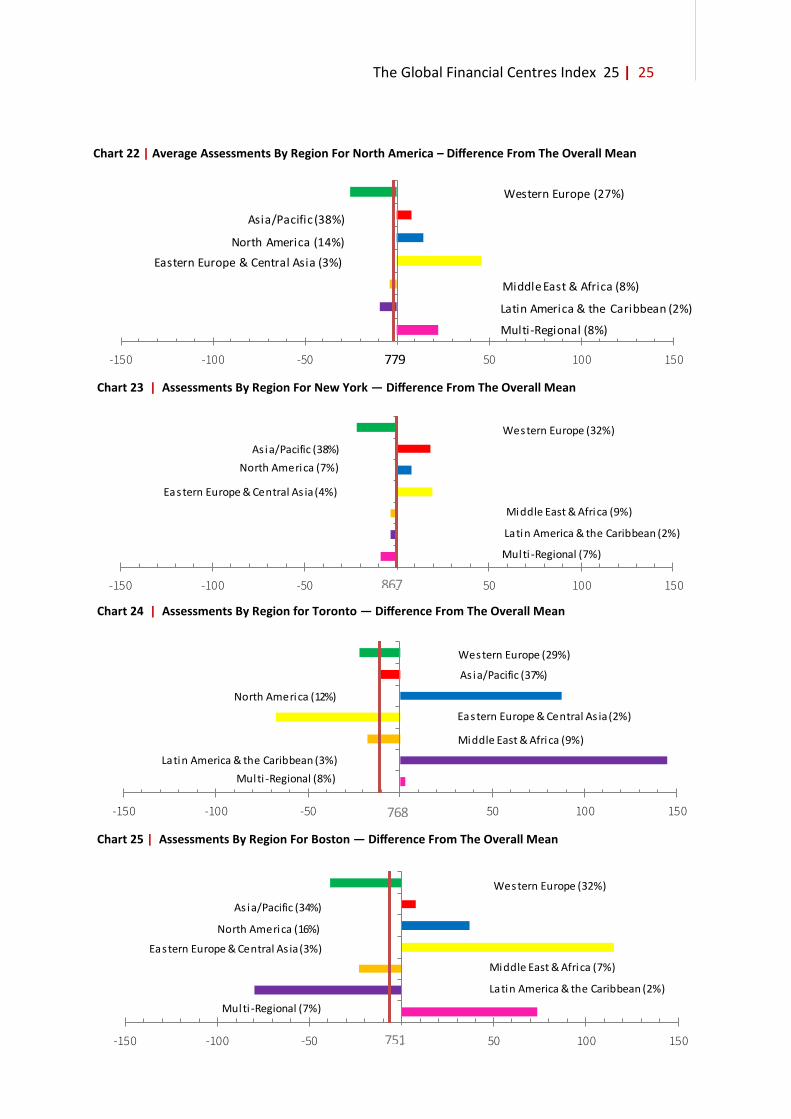
Charts 9 and 10 show examples of these analyses. Coloured bars to the left of the vertical axis indicate that respondents from that region gave lower than the average assessments. Bars to the right indicate respondents from that region gave higher than average assessments. It is important to recognise that assessments given to a centre by people based in that centre are excluded to remove ‘home’ bias.
The additional vertical axis (in red) shows the mean of assessments when assessments from the home region are removed. The percentage figure noted by each region indicates the percentage of the total number of assessments that are from that region.
“We are currently being hampered by a needless trade war. There are too many politicians who think
they understand business and economics.”
HEAD OF EXCHANGE BASED IN ISTANBUL
The Global Financial Centres Index 25 | 19
Chart 9 | Example 1: Assessments Compared With The Mean For Region 6
Chart 10 | Example 2: Assessments Compared With The Mean For An Individual Centre
Region 1 (32%)
Region 2 (24%)
Region 3 (7%)
Region 4 (5%)
Region 5 (9%)
Region 6 (15%)
Multi-Regional (8%)
623-125 -75 -25 25 75 125
This figure is the mean of all assessments in the GFCI for region 6.
This bar shows that assessments from centres in this region averaged 72 points above the mean for region 6.
This bar shows that assessments from centres in this region averaged 41 points below the mean for region 6.
This percentage shows that 32 per cent of assessments for region
6 came from centres in region 1.
This line shows that the assessments given by other regions and excluding those from region 6 had an average 10 points lower than the overall mean. Respondents from region 6 rated their home centres higher than respondents from other regions.
20 | The Global Financial Centres Index 25
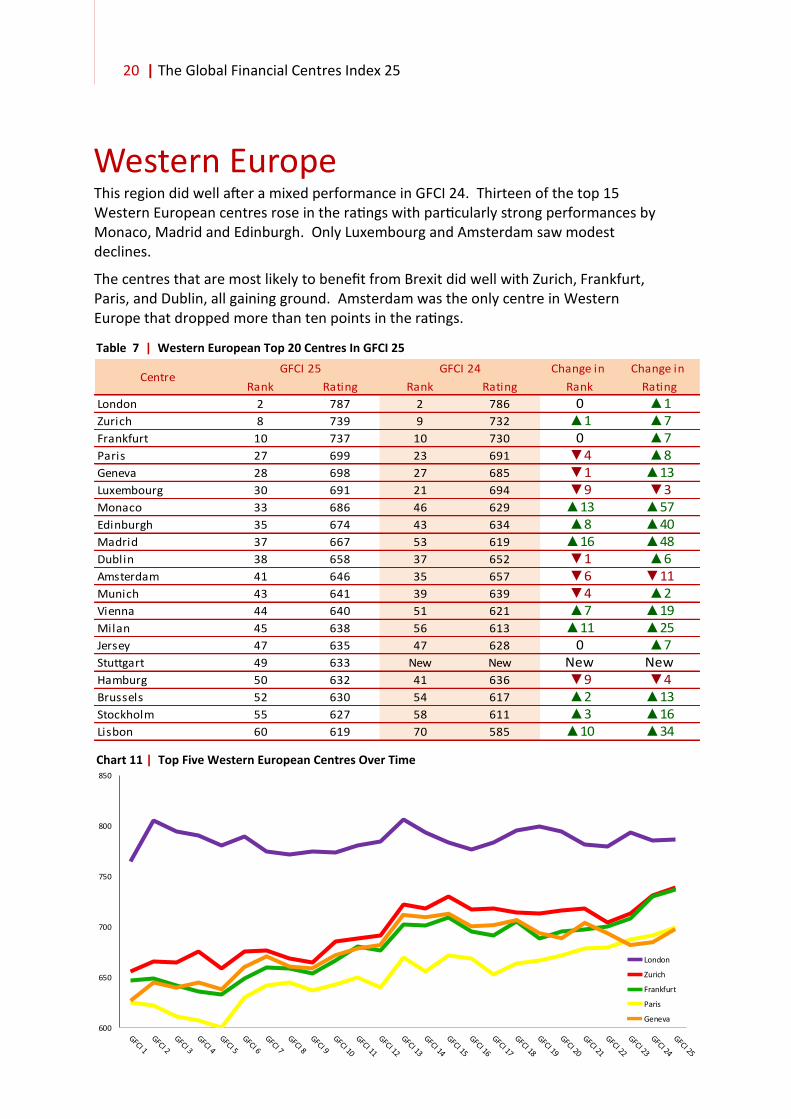
Western Europe This region did well after a mixed performance in GFCI 24. Thirteen of the top 15 Western European centres rose in the ratings with particularly strong performances by Monaco, Madrid and Edinburgh. Only Luxembourg and Amsterdam saw modest declines.
The centres that are most likely to benefit from Brexit did well with Zurich, Frankfurt, Paris, and Dublin, all gaining ground. Amsterdam was the only centre in Western Europe that dropped more than ten points in the ratings.
Table 7 | Western European Top 20 Centres In GFCI 25
Chart 11 | Top Five Western European Centres Over Time
600
650
700
750
800
850
London
Zurich
Frankfurt
Paris
Geneva
Change in Change in
Rank Rating Rank Rating Rank Rating
London 2 787 2 786 0 ▲1Zurich 8 739 9 732 ▲1 ▲7Frankfurt 10 737 10 730 0 ▲7Paris 27 699 23 691 ▼4 ▲8Geneva 28 698 27 685 ▼1 ▲13Luxembourg 30 691 21 694 ▼9 ▼3Monaco 33 686 46 629 ▲13 ▲57Edinburgh 35 674 43 634 ▲8 ▲40Madrid 37 667 53 619 ▲16 ▲48Dublin 38 658 37 652 ▼1 ▲6Amsterdam 41 646 35 657 ▼6 ▼11Munich 43 641 39 639 ▼4 ▲2Vienna 44 640 51 621 ▲7 ▲19Milan 45 638 56 613 ▲11 ▲25Jersey 47 635 47 628 0 ▲7Stuttgart 49 633 New New New NewHamburg 50 632 41 636 ▼9 ▼4Brussels 52 630 54 617 ▲2 ▲13Stockholm 55 627 58 611 ▲3 ▲16Lisbon 60 619 70 585 ▲10 ▲34
GFCI 24GFCI 25Centre

The Global Financial Centres Index 25 | 21
Chart 13 | Assessments By Region For London — Difference From The Overall Mean
Chart 14 | Assessments By Region For Zurich — Difference From The Overall Mean
Chart 12| Average Assessments By Region For Western Europe – Difference From The Overall Mean
Chart 15 | Assessments By Region For Frankfurt — Difference From The Overall Mean
Western Europe (45%)
Asia/Pacific (24%)
North America (6%)
Eastern Europe & Central Asia (5%)
Middle East & Africa (10%)
Latin America & the Caribbean (2%)
Multi-Regional (8%)
-150 -100 -50 0 50 100 150681
Western Europe (27%)
As ia/Pacific (37%)
North America (8%)
Eastern Europe & Central As ia (6%)
Middle East & Africa (11%)
Latin America & the Caribbean (2%)
Multi -Regional (9%)
-150 -100 -50 0 50 100 150858
Western Europe (45%)
As ia/Pacific (25%)
North America (6%)
Eastern Europe & Central As ia (5%)
Middle East & Africa (9%)
Latin America & the Caribbean (2%)
Multi -Regional (8%)
-150 -100 -50 0 50 100 150786
Western Europe (48%)
As ia/Pacific (26%)
North America (6%)
Eastern Europe & Central As ia (5%)
Middle East & Africa (7%)
Latin America & the Caribbean (2%)
Multi -Regional (7%)
-150 -100 -50 0 50 100 150771
22 | The Global Financial Centres Index 25
Asia/Pacific Most Asia/Pacific Centres performed well. Of the top twenty centres in the region,
only Osaka saw a modest decline with the others rising or remaining as they were in GCI 24.
There has been a strong trend of Asia/Pacific centres improving over several years. The top eight centres in the region are now in the top fifteen centres in the whole index. Melbourne, Jakarta, and GIFT City (Gujarat) all showed strong increases in GFCI 25.
Table 8 | Asia/Pacific Top 20 Centres In GFCI 25
Chart 16 | Top Five Asia/Pacific Centres Over Time
450
500
550
600
650
700
750
800
Hong Kong
Singapore
Shanghai
Tokyo
Beijing
Change in Change in
Rank Rating Rank Rating Rank Rating
Hong Kong 3 783 3 783 0 0Singapore 4 772 4 769 0 ▲3Shanghai 5 770 5 766 0 ▲4Tokyo 6 756 6 746 0 ▲10Beijing 9 738 8 733 ▼1 ▲5Sydney 11 736 7 734 ▼4 ▲2Shenzhen 14 730 12 726 ▼2 ▲4Melbourne 15 729 20 699 ▲5 ▲30Guangzhou 24 708 19 708 ▼5 0Qingdao 29 694 31 679 ▲2 ▲15Osaka 31 690 22 693 ▼9 ▼3Taipei 34 676 32 670 ▼2 ▲6Seoul 36 668 33 668 ▼3 0Kuala Lumpur 39 652 40 638 ▲1 ▲14Wellington 40 647 45 630 ▲5 ▲17Busan 46 636 44 631 ▼2 ▲5Bangkok 53 629 48 626 ▼5 ▲3Jakarta 68 607 76 579 ▲8 ▲28GIFT City-Gujarat 69 606 77 578 ▲8 ▲28Tianjin 81 589 78 577 ▼3 ▲12
GFCI 24Centre
GFCI 25
The Global Financial Centres Index 25 | 23
Chart 18 | Assessments By Region For Hong Kong — Difference From The Overall Mean
Chart 20 | Assessments By Region For Shanghai — Difference From The Overall Mean
Chart 17 | GFCI 24 Average Assessments By Region For Asia/Pacific – Difference From The Overall Mean
Chart 19 | Assessments By Region For Singapore — Difference From The Overall Mean
844
Western Europe (27%)
As ia/Pacific (47%)
North America (8%)
Eastern Europe & Central As ia (4%)
Middle East & Africa (6%)
Latin America & the Caribbean (2%)
Multi -Regional (7%)
-150 -100 -50 0 50 100 150846
Western Europe (31%)
As ia/Pacific (40%)
North America (7%)
Eastern Europe & Central As ia (6%)
Middle East & Africa (8%)
Latin America & the Caribbean (1%)
Multi -Regional (6%)
-150 -100 -50 0 50 100 150867
Western Europe (13%)
As ia/Pacific (69%)
North America (5%)
Eastern Europe & Central As ia (2%)
Middle East & Africa (4%)
Latin America & the Caribbean (1%)
Multi -Regional (6%)
-150 -100 -50 0 50 100 150838
Western Europe (18%)
Asia/Pacific (60%)
North America (6%)
Eastern Europe & Central Asia (3%)
Middle East & Africa (5%)
Latin America & the Caribbean (1%)
Multi-Regional (7%)
-150 -100 -50 0 50 100 150677
24 | The Global Financial Centres Index 25
North America North American centres also did well in GFCI 25 with most centres rising in the
ratings. Of particular note is the performance of Toronto, Montreal and Vancouver the three leading Canadian centres. All three showed strong increases in the ratings. Toronto rose four places to seventh overall and Montreal is now in 18th place.
Washington DC regained the ground that it lost in GFCI 24 with a rise of 34 points. This rise resulted in it climbing four places to 32nd overall.
Table 9 | North American Centres In GFCI 25
Chart 21 | Top Five North American Centres Over Time
Change in Change in
Rank Rating Rank Rating Rank Rating
New York 1 794 1 788 0 ▲6Toronto 7 755 11 728 ▲4 ▲27Boston 13 732 13 725 0 ▲7San Francisco 16 727 14 724 ▼2 ▲3Los Angeles 17 724 16 721 ▼1 ▲3Montreal 18 722 24 690 ▲6 ▲32Vancouver 19 721 18 709 ▼1 ▲12Chicago 20 717 17 717 ▼3 0Washington DC 32 689 36 655 ▲4 ▲34Calgary 58 621 42 635 ▼16 ▼14
GFCI 24Centre
GFCI 25
550
600
650
700
750
800
850
New York
Toronto
Boston
San Francisco
Los Angeles
The Global Financial Centres Index 25 | 25
Chart 24 | Assessments By Region for Toronto — Difference From The Overall Mean
Chart 25 | Assessments By Region For Boston — Difference From The Overall Mean
Chart 22 | Average Assessments By Region For North America – Difference From The Overall Mean
Chart 23 | Assessments By Region For New York — Difference From The Overall Mean
Western Europe (27%)
Asia/Pacific (38%)
North America (14%)
Eastern Europe & Central Asia (3%)
Middle East & Africa (8%)
Latin America & the Caribbean (2%)
Multi-Regional (8%)
-150 -100 -50 0 50 100 150779
Western Europe (32%)
As ia/Pacific (38%)
North America (7%)
Eastern Europe & Central As ia (4%)
Middle East & Africa (9%)
Latin America & the Caribbean (2%)
Multi -Regional (7%)
-150 -100 -50 0 50 100 150867
Western Europe (32%)
As ia/Pacific (34%)
North America (16%)
Eastern Europe & Central As ia (3%)
Middle East & Africa (7%)
Latin America & the Caribbean (2%)
Multi -Regional (7%)
-150 -100 -50 0 50 100 150751
Western Europe (29%)
As ia/Pacific (37%)
North America (12%)
Eastern Europe & Central As ia (2%)
Middle East & Africa (9%)
Latin America & the Caribbean (3%)
Multi -Regional (8%)
-150 -100 -50 0 50 100 150768
26 | The Global Financial Centres Index 25
Eastern Europe And Central Asia In this region there were significant gains for Astana, Istanbul and Prague. Astana only
officially launched its financial centre in 2018, and it is unusual for such a new centre to perform so strongly.
Tallinn made a lot of ground in GFCI 24 but fell back this time despite a growing reputation as a strong FinTech centre.
Table 10 | Eastern European And Central Asian Centres In GFCI 25
Chart 26 | GFCI 25 Top Five Eastern European And Central Asian Centres Over Time
Change in Change in
Rank Rating Rank Rating Rank Rating
Astana 51 631 61 599 ▲10 ▲32Istanbul 59 620 68 590 ▲9 ▲30Prague 62 614 74 581 ▲12 ▲33Warsaw 70 605 66 592 ▼4 ▲13Budapest 71 603 71 584 0 ▲19St Petersburg 73 601 80 575 ▲7 ▲26Riga 78 595 87 565 ▲9 ▲30Sofia 79 593 97 544 ▲18 ▲49Moscow 88 582 83 571 ▼5 ▲11Cyprus 93 572 91 560 ▼2 ▲12Tallinn 94 569 52 620 ▼42 ▼51Baku 95 567 95 555 0 ▲12Almaty 100 560 96 550 ▼4 ▲10Athens 102 519 98 518 ▼4 ▲1
GFCI 24Centre
GFCI 25
300
350
400
450
500
550
600
650
700
Astana
Istanbul
Prague
Warsaw
Budapest
The Global Financial Centres Index 25 | 27
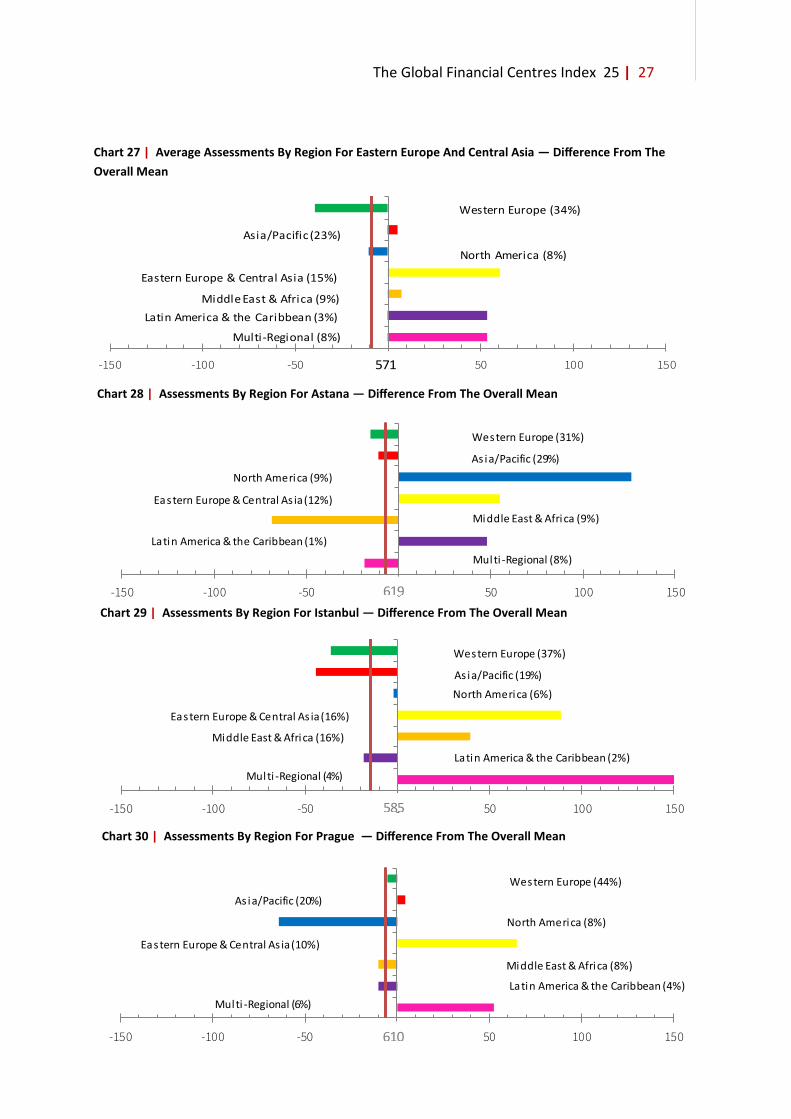
Chart 28 | Assessments By Region For Astana — Difference From The Overall Mean
Chart 29 | Assessments By Region For Istanbul — Difference From The Overall Mean
Chart 30 | Assessments By Region For Prague — Difference From The Overall Mean
-238
Chart 27 | Average Assessments By Region For Eastern Europe And Central Asia — Difference From The
Overall Mean
Western Europe (34%)
Asia/Pacific (23%)
North America (8%)
Eastern Europe & Central Asia (15%)
Middle East & Africa (9%)
Latin America & the Caribbean (3%)
Multi-Regional (8%)
-150 -100 -50 0 50 100 150571
Western Europe (31%)
As ia/Pacific (29%)
North America (9%)
Eastern Europe & Central As ia (12%)
Middle East & Africa (9%)
Latin America & the Caribbean (1%)
Multi -Regional (8%)
-150 -100 -50 0 50 100 150619
Western Europe (37%)
As ia/Pacific (19%)
North America (6%)
Eastern Europe & Central As ia (16%)
Middle East & Africa (16%)
Latin America & the Caribbean (2%)
Multi -Regional (4%)
-150 -100 -50 0 50 100 150585
Western Europe (44%)
As ia/Pacific (20%)
North America (8%)
Eastern Europe & Central As ia (10%)
Middle East & Africa (8%)
Latin America & the Caribbean (4%)
Multi -Regional (6%)
-150 -100 -50 0 50 100 150610

28 | The Global Financial Centres Index 25
In this region Dubai, Casablanca, and Abu Dhabi continued to rise in the index. Doha lost some of the ground it made in GFCI 24. Kuwait City and Nairobi were new entrants to the index, with Kuwait ranking 57th in its first entry. Respondents from centres in the Middle East and Africa scored other regional centres lower than the mean, as did respondents from Western Europe and Latin America & the Caribbean.
Table 11 | Middle East And African Centres In GFCI 25
Chart 31 | GFCI 25 Top Five Middle East And African Centres Over Time
The Middle East And Africa
Change in Change in
Rank Rating Rank Rating Rank Rating
Dubai 12 733 15 722 ▲3 ▲11Casablanca 22 712 28 684 ▲6 ▲28Tel Aviv 23 710 25 689 ▲2 ▲21Abu Dhabi 26 702 26 686 0 ▲16Doha 42 642 34 662 ▼8 ▼20Johannesburg 48 634 57 612 ▲9 ▲22Mauritius 54 628 49 625 ▼5 ▲3Cape Town 56 626 38 651 ▼18 ▼25Kuwait City 57 625 New New New NewBahrain 67 608 59 607 ▼8 ▲1Riyadh 91 575 69 588 ▼22 ▼13Nairobi 97 564 New New New New
GFCI 24Centre
GFCI 25
400
450
500
550
600
650
700
750
Dubai
Casablanca
Tel Aviv
Abu Dhabi
Doha

The Global Financial Centres Index 25 | 29
Chart 34 | Assessments By Region For Casablanca — Difference From The Overall Mean
Chart 35 | Assessments By Region For Tel Aviv — Difference From The Overall Mean
Chart 32 | Average Assessments By Region For The Middle East And Africa — Difference From The
Overall Mean
Chart 33 | Assessments By Region For Dubai — Difference From The Overall Mean
Western Europe (34%)
Asia/Pacific (23%)
North America (6%)
Eastern Europe & Central Asia (6%)
Middle East & Africa (20%)
Latin America & the Caribbean (2%)
Multi-Regional (9%)
-150 -100 -50 0 50 100 150655
Western Europe (36%)
Asia/Pacific (28%)
North America (5%)
Eastern Europe & Central As ia (8%)
Middle East & Africa (13%)
Latin America & the Caribbean (1%)
Multi -Regional (9%)
-150 -100 -50 0 50 100 150735
Western Europe (42%)
Asia/Pacific (20%)
North America (6%)
Eastern Europe & Central As ia (3%)
Middle East & Africa (17%)
Latin America & the Caribbean (1%)
Multi -Regional (12%)
-150 -100 -50 0 50 100 150697
Western Europe (50%)
As ia/Pacific (12%)
North America (11%)
Eastern Europe & Central As ia (6%)
Middle East & Africa (10%)
Latin America & the Caribbean (3%)
Multi -Regional (7%)
-150 -100 -50 0 50 100 150671
30 | The Global Financial Centres Index 25
Latin America And The Caribbean There were mixed results in the region with five centres rising in the ranks and three declining. The Cayman Islands, Panama, and Bermuda performed strongly.
Table 12 | Latin American And Caribbean Centres In GFCI 25
Chart 36 | Top Five Latin American And Caribbean Centres Over Time
Change in Change in
Rank Rating Rank Rating Rank Rating
Cayman Islands 21 713 29 683 ▲8 ▲30Bermuda 25 705 30 680 ▲5 ▲25Mexico City 61 616 62 598 ▲1 ▲18Rio de Janeiro 65 611 65 594 0 ▲17Sao Paulo 66 609 55 616 ▼11 ▼7British Virgin Islands 72 602 63 597 ▼9 ▲5Panama 82 588 90 562 ▲8 ▲26Bahamas 85 585 67 591 ▼18 ▼6Buenos Aires 90 580 93 557 ▲3 ▲23
GFCI 24Centre
GFCI 25
420
470
520
570
620
670
720
770
Cayman Islands
Bermuda
Mexico City
Rio de Janeiro
Sao Paulo
The Global Financial Centres Index 25 | 31
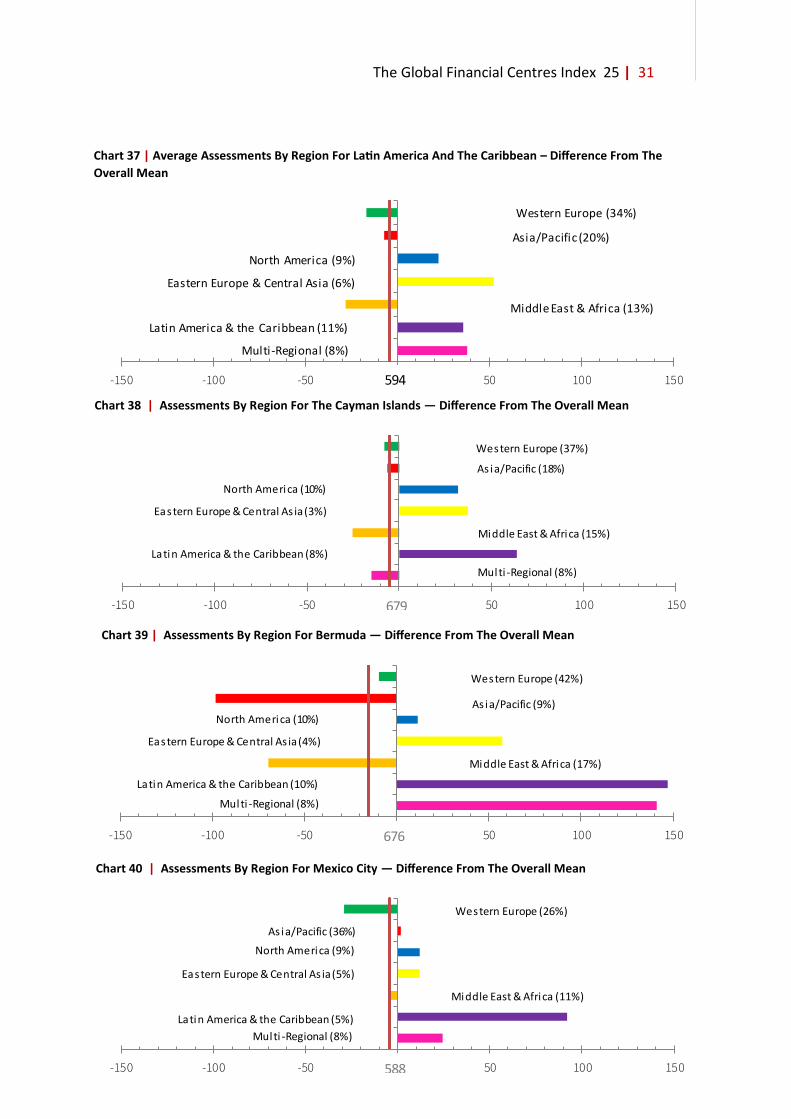
Chart 38 | Assessments By Region For The Cayman Islands — Difference From The Overall Mean
Chart 39 | Assessments By Region For Bermuda — Difference From The Overall Mean
Chart 40 | Assessments By Region For Mexico City — Difference From The Overall Mean
198
Chart 37 | Average Assessments By Region For Latin America And The Caribbean – Difference From The
Overall Mean
Western Europe (34%)
Asia/Pacific (20%)
North America (9%)
Eastern Europe & Central Asia (6%)
Middle East & Africa (13%)
Latin America & the Caribbean (11%)
Multi-Regional (8%)
-150 -100 -50 0 50 100 150594
Western Europe (37%)
As ia/Pacific (18%)
North America (10%)
Eastern Europe & Central As ia (3%)
Middle East & Africa (15%)
Latin America & the Caribbean (8%)
Multi -Regional (8%)
-150 -100 -50 0 50 100 150679
Western Europe (42%)
As ia/Pacific (9%)
North America (10%)
Eastern Europe & Central As ia (4%)
Middle East & Africa (17%)
Latin America & the Caribbean (10%)
Multi -Regional (8%)
-150 -100 -50 0 50 100 150676
Western Europe (26%)
As ia/Pacific (36%)
North America (9%)
Eastern Europe & Central As ia (5%)
Middle East & Africa (11%)
Latin America & the Caribbean (5%)
Multi -Regional (8%)
-150 -100 -50 0 50 100 150588

32 | The Global Financial Centres Index 25
While the GFCI is calculated using only assessments from other centres, we ask respondents about the prospects of the centre in which they are based; and specifically whether their ‘home’ centre will become more or less competitive. In general, people are more optimistic about the future of their own centre than people outside that centre. However, respondents in London are less optimistic than those in other centres, reflecting the continuing uncertainty about future trading relations with the E.U. and the rest of the world after Brexit.
Home Centre Prospects
Chart 41 | Home Centre Prospects — New York Chart 42 | Home Centre Prospects — London
Chart 43 | Home Centre Prospects — Hong Kong Chart 44 | Home Centre Prospects — Singapore
The Global Financial Centres Index 25 | 33
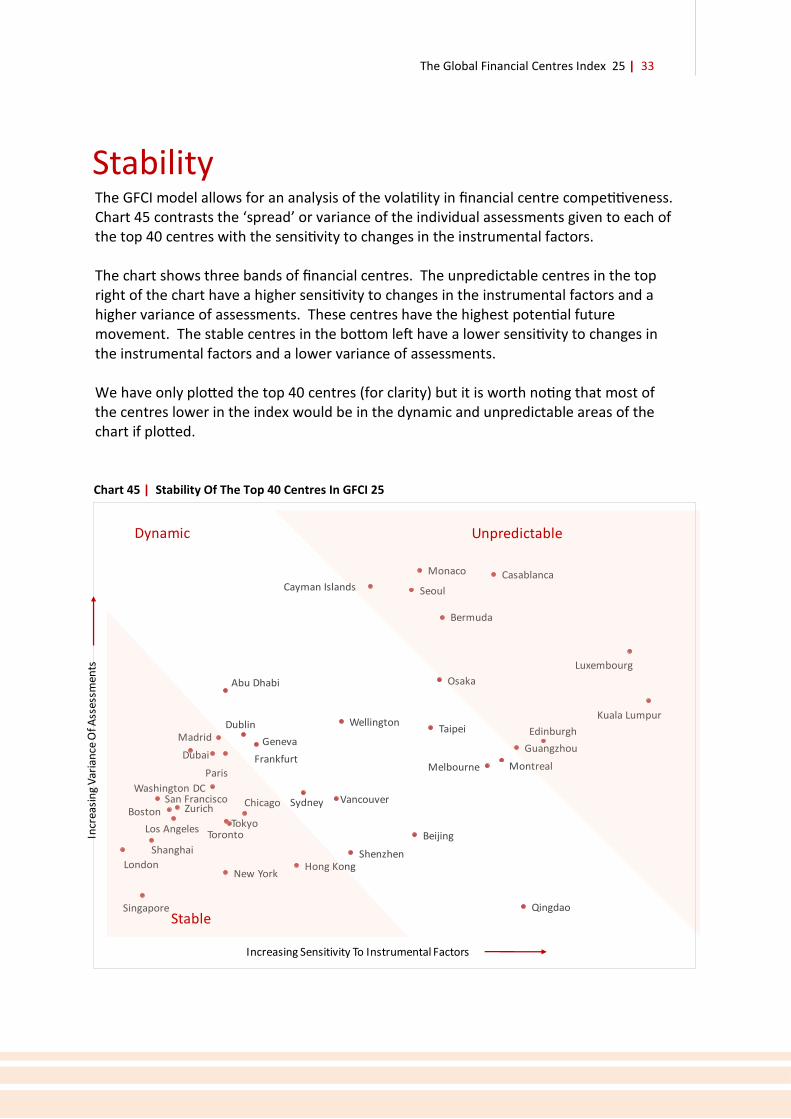
Stability The GFCI model allows for an analysis of the volatility in financial centre competitiveness. Chart 45 contrasts the ‘spread’ or variance of the individual assessments given to each of the top 40 centres with the sensitivity to changes in the instrumental factors. The chart shows three bands of financial centres. The unpredictable centres in the top right of the chart have a higher sensitivity to changes in the instrumental factors and a higher variance of assessments. These centres have the highest potential future movement. The stable centres in the bottom left have a lower sensitivity to changes in the instrumental factors and a lower variance of assessments. We have only plotted the top 40 centres (for clarity) but it is worth noting that most of the centres lower in the index would be in the dynamic and unpredictable areas of the chart if plotted.
Chart 45 | Stability Of The Top 40 Centres In GFCI 25
New YorkLondon Hong Kong
Singapore
Shanghai
TokyoToronto
Zurich
Beijing
Frankfurt
Sydney
Dubai
Boston
Shenzhen
Melbourne
San Francisco
Los Angeles
Montreal
VancouverChicago
Cayman IslandsCasablanca
Guangzhou
Bermuda
Abu Dhabi
Paris
Geneva
Qingdao
Luxembourg
Osaka
Washington DC
Monaco
Taipei Edinburgh
Seoul
MadridDublin
Kuala LumpurWellington
UnpredictableDynamic
Stable
Increasing Sensitivity To Instrumental Factors
Incr
easi
ng
Var
ian
ce O
f Ass
essm
ents
34 | The Global Financial Centres Index 25
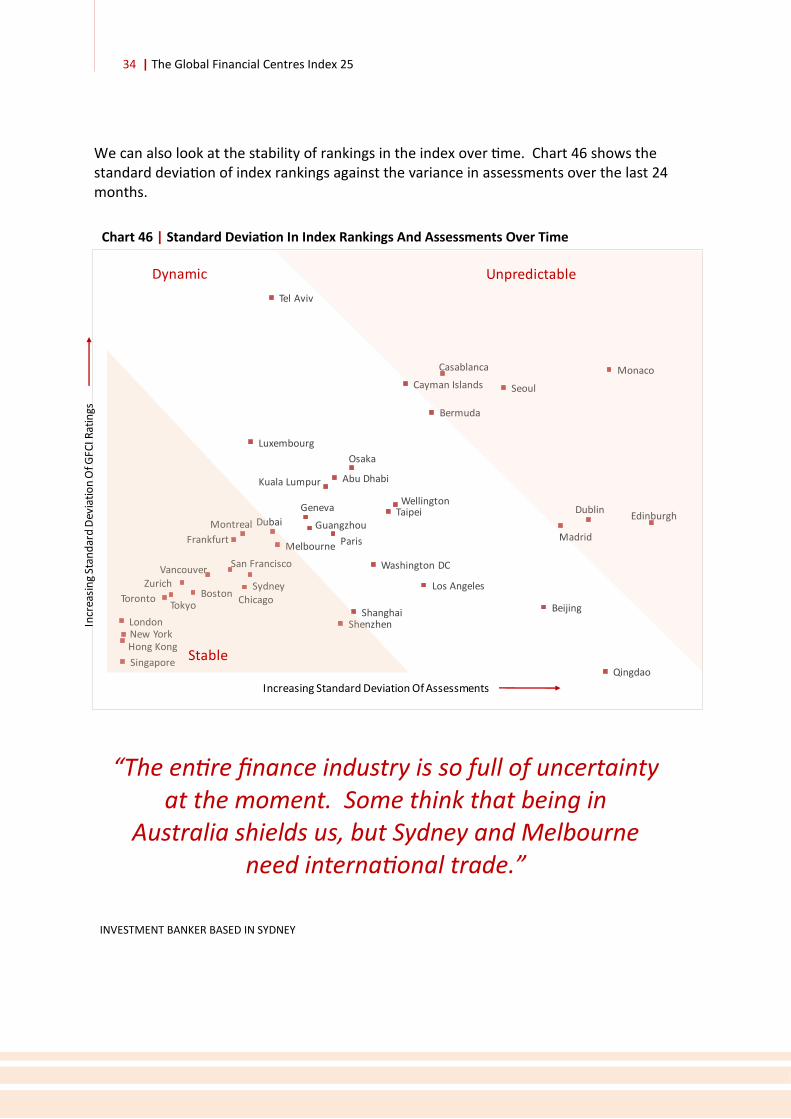
We can also look at the stability of rankings in the index over time. Chart 46 shows the standard deviation of index rankings against the variance in assessments over the last 24 months.
Chart 46 | Standard Deviation In Index Rankings And Assessments Over Time
“The entire finance industry is so full of uncertainty at the moment. Some think that being in
Australia shields us, but Sydney and Melbourne need international trade.”
INVESTMENT BANKER BASED IN SYDNEY
New YorkLondon
Hong Kong
Singapore
ShanghaiTokyo
Toronto
Zurich
Beijing
Frankfurt
Sydney
Dubai
Boston
Shenzhen
Melbourne
San Francisco
Los Angeles
Montreal
Vancouver
Chicago
Cayman Islands
Casablanca
Tel Aviv
Guangzhou
Bermuda
Abu Dhabi
Paris
Geneva
Qingdao
Luxembourg
Osaka
Washington DC
Monaco
Taipei Edinburgh
Seoul
Madrid
Dublin
Kuala Lumpur
Wellington
UnpredictableDynamic
Stable
Increasing Standard Deviation Of Assessments
Incr
easi
ng
Stan
dar
d D
evia
tio
n O
f GFC
I Rat
ings

The Global Financial Centres Index 25 | 35
Table 13 | GFCI 25 Top 15 Centres Assessments And Ratings — Reputational Advantage
We look at reputation in the GFCI model by examining the difference between the weighted average assessment given to a financial centre and the overall rating in the index. The first measure reflects the average score a centre receives from financial professionals across the world, adjusted for time, with more recent assessments given more weight. (see Appendix 3 for details). The second measure is the GFCI rating itself, which represents the assessments adjusted to take account of the instrumental factors. If a centre has a higher average assessment than its GFCI rating, this indicates that respondents’ perceptions of a centre are more favourable than the quantitative measures alone suggest.
Table 13 shows the top 15 centres with the greatest positive difference between the average assessment and the GFCI rating. Eight of the top 15 centres in terms of reputational advantage are in the Asia/Pacific region. Washington DC, New York, and London also show a strong reputational advantage. This may be due to strong marketing or general awareness.
Reputation
Centre - Top 15Weighted Average
Assessment
GFCI 25
Rating
GFCI 25 Reputational
Advantage
Qingdao 832 694 138
Singapore 867 772 95
Wellington 740 647 93
Washington DC 776 689 87
Shanghai 845 770 75
New York 866 794 72
London 856 787 69
Sydney 805 736 69
Hong Kong 847 783 64
Stuttgart 694 633 61
Tokyo 815 756 59
San Francisco 782 727 55
Zurich 788 739 49
Shenzhen 769 730 39
Frankfurt 772 737 35

36 | The Global Financial Centres Index 25
Table 14 shows the 15 centres with the greatest reputational disadvantage. This indicates that respondents’ perceptions of a centre are less favourable than the quantitative measures alone would suggest.
Table 14 | GFCI 25 Bottom 15 Centres Assessments And Ratings — Reputational Disadvantage
“I am actually feeling quite positive about the future of financial services in London. This game is all
about trust and London still has a fantastic reputation.”
ASSET MANAGER BASED IN LONDON
Centre - Bottom 15Weighted Average
Assessment
GFCI 25
Rating
GFCI 25 Reputational
Advantage
Bahamas 546 585 -39
Cyprus 528 572 -44
Monaco 641 686 -45
Glasgow 564 613 -49
Jakarta 558 607 -49
Kuwait City 568 625 -57
Guangzhou 639 708 -69
GIFT City-Gujarat 533 606 -73
Nairobi 480 564 -84
Riga 509 595 -86
Sofia 495 593 -98
Tianjin 451 589 -138
Chengdu 426 583 -157
Busan 452 636 -184
Dalian 308 520 -212
The Global Financial Centres Index 25 | 37
Industry Sectors
Table 15 | GFCI 25 Industry Sector Sub-Indices — Top Fifteen
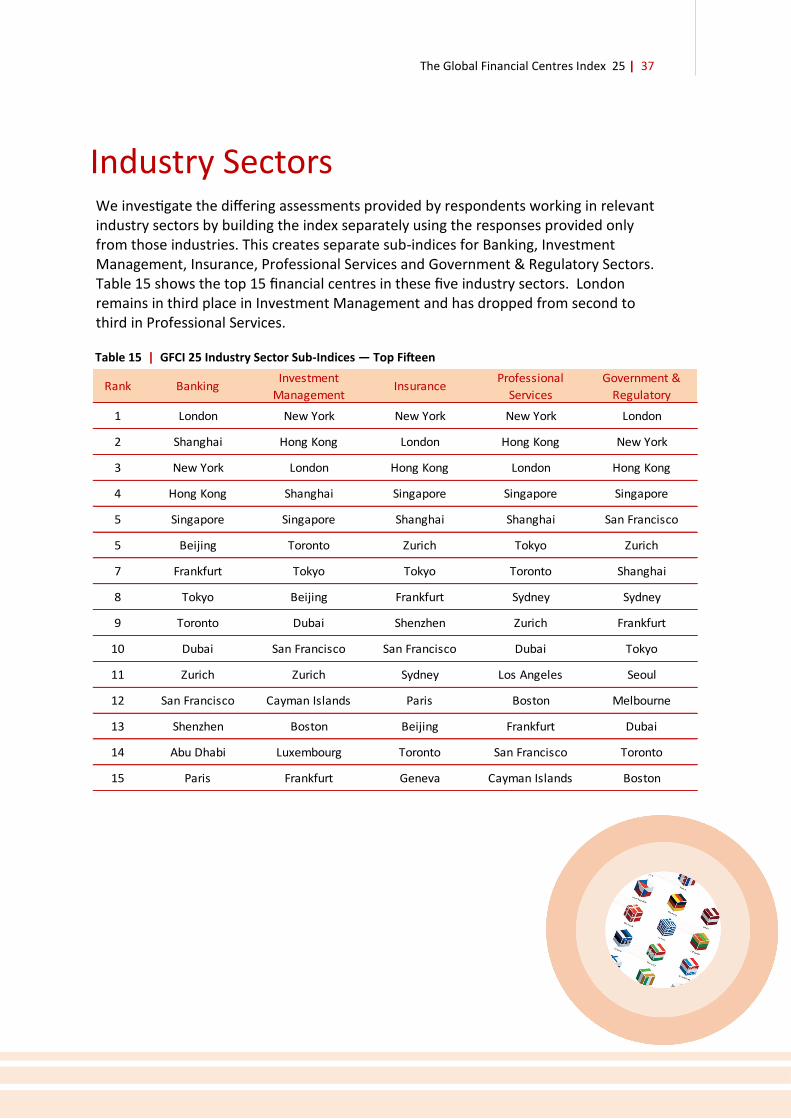
We investigate the differing assessments provided by respondents working in relevant industry sectors by building the index separately using the responses provided only from those industries. This creates separate sub-indices for Banking, Investment Management, Insurance, Professional Services and Government & Regulatory Sectors. Table 15 shows the top 15 financial centres in these five industry sectors. London remains in third place in Investment Management and has dropped from second to third in Professional Services.
Rank BankingInvestment
ManagementInsurance
Professional
Services
Government &
Regulatory
1 London New York New York New York London
2 Shanghai Hong Kong London Hong Kong New York
3 New York London Hong Kong London Hong Kong
4 Hong Kong Shanghai Singapore Singapore Singapore
5 Singapore Singapore Shanghai Shanghai San Francisco
5 Beijing Toronto Zurich Tokyo Zurich
7 Frankfurt Tokyo Tokyo Toronto Shanghai
8 Tokyo Beijing Frankfurt Sydney Sydney
9 Toronto Dubai Shenzhen Zurich Frankfurt
10 Dubai San Francisco San Francisco Dubai Tokyo
11 Zurich Zurich Sydney Los Angeles Seoul
12 San Francisco Cayman Islands Paris Boston Melbourne
13 Shenzhen Boston Beijing Frankfurt Dubai
14 Abu Dhabi Luxembourg Toronto San Francisco Toronto
15 Paris Frankfurt Geneva Cayman Islands Boston
38 | The Global Financial Centres Index 25
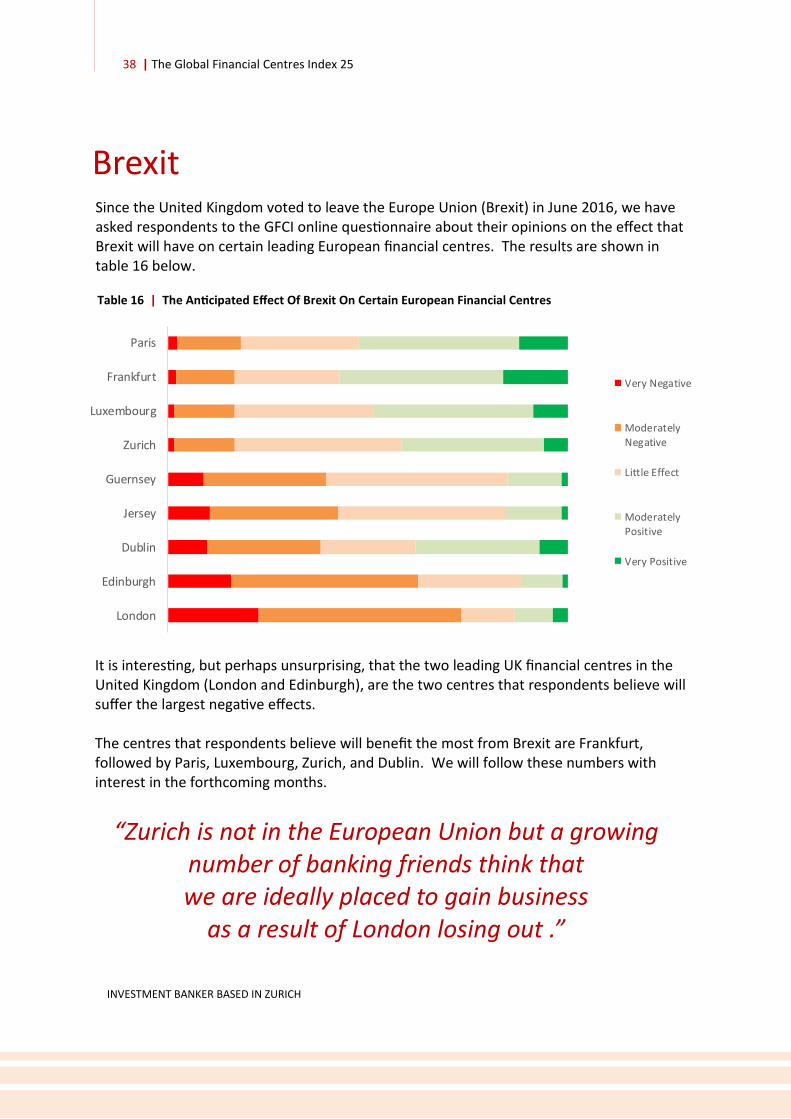
Brexit Since the United Kingdom voted to leave the Europe Union (Brexit) in June 2016, we have asked respondents to the GFCI online questionnaire about their opinions on the effect that Brexit will have on certain leading European financial centres. The results are shown in table 16 below.
Table 16 | The Anticipated Effect Of Brexit On Certain European Financial Centres
It is interesting, but perhaps unsurprising, that the two leading UK financial centres in the United Kingdom (London and Edinburgh), are the two centres that respondents believe will suffer the largest negative effects. The centres that respondents believe will benefit the most from Brexit are Frankfurt, followed by Paris, Luxembourg, Zurich, and Dublin. We will follow these numbers with interest in the forthcoming months.
London
Edinburgh
Dublin
Jersey
Guernsey
Zurich
Luxembourg
Frankfurt
Paris
Very Negative
Moderately
Negative
Little Effect
Moderately
Positive
Very Positive
“Zurich is not in the European Union but a growing number of banking friends think that we are ideally placed to gain business
as a result of London losing out .”
INVESTMENT BANKER BASED IN ZURICH

The Global Financial Centres Index 25 | 39
We have been asked by a number of finance professionals about the prospects of us producing a comparable index to the GFCI but focusing on the financial centres that are the most competitive locations for fostering a FinTech industry. We have not yet collected sufficient data to produce a full report but the questionnaire responses to date give us a few interesting clues:
Respondents feel that the four most important elements to attract FinTech start-ups are (in order) the regulatory environment, the availability of skilled people, access to finance and ICT Infrastructure.
Respondents feel that the four most important areas of FinTech activity currently are (in order) Big Data Analytics, Cyber Security, Payment Transaction Systems and Trading Platforms. We will continue to monitor responses to this areas of our online questionnaire with interest. If you would like to participate please do so at: globalfinancialcentres.net/survey.
FinTech
Table 17 | The Leading FinTech Centres
Center Rating
London 843
New York 830
Singapore 830
Shanghai 799
San Francisco 791
Tokyo 768
Shenzhen 732
Frankfurt 707
Tel Aviv 692
Paris 680
Berlin 673
Sydney 667
Toronto 660
Amsterdam 651
Dublin 630
40 | The Global Financial Centres Index 25
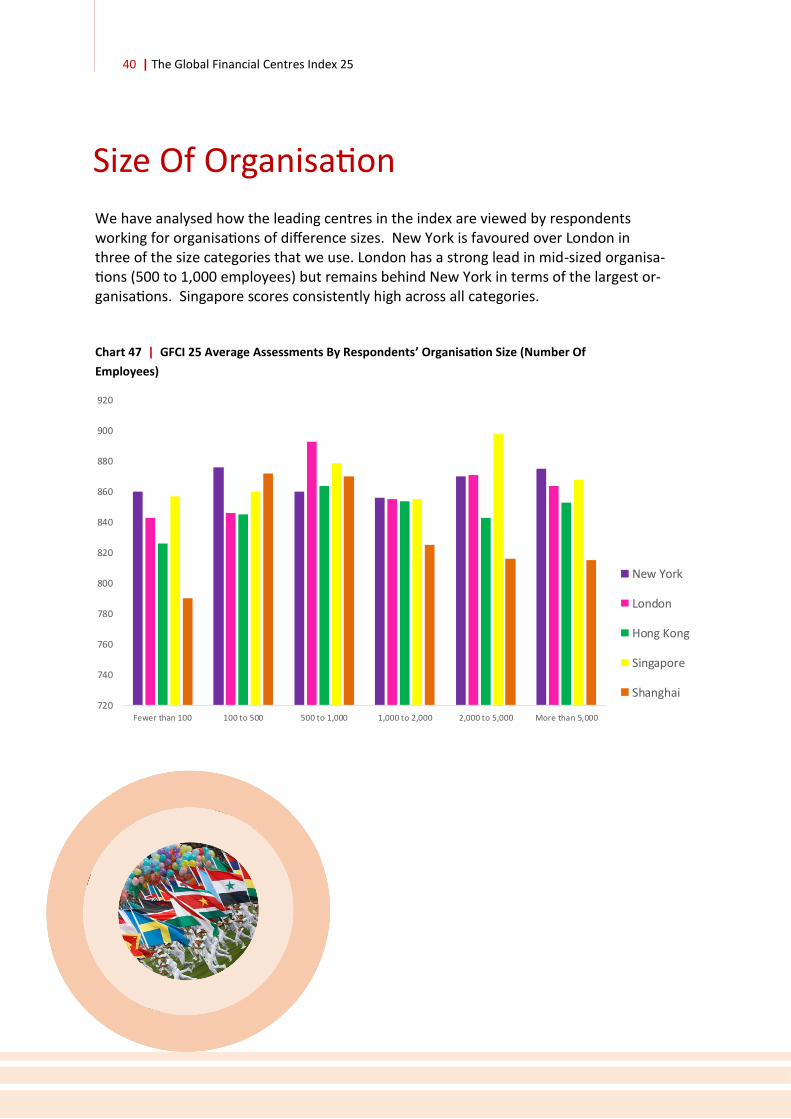
Size Of Organisation
Chart 47 | GFCI 25 Average Assessments By Respondents’ Organisation Size (Number Of
Employees)
We have analysed how the leading centres in the index are viewed by respondents working for organisations of difference sizes. New York is favoured over London in three of the size categories that we use. London has a strong lead in mid-sized organisa-tions (500 to 1,000 employees) but remains behind New York in terms of the largest or-ganisations. Singapore scores consistently high across all categories.
720
740
760
780
800
820
840
860
880
900
920
Fewer than 100 100 to 500 500 to 1,000 1,000 to 2,000 2,000 to 5,000 More than 5,000
New York
London
Hong Kong
Singapore
Shanghai
The Global Financial Centres Index 25 | 41
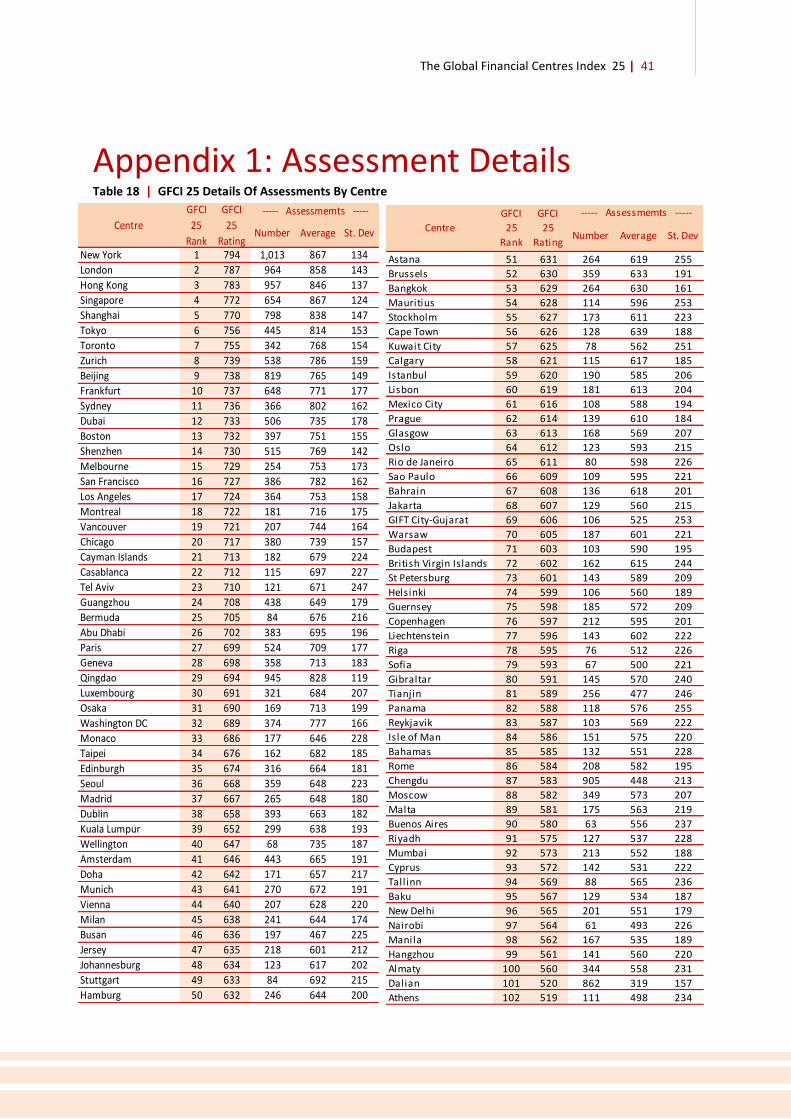
Appendix 1: Assessment Details Table 18 | GFCI 25 Details Of Assessments By Centre
Number Average St. Dev
New York 1 794 1,013 867 134
London 2 787 964 858 143
Hong Kong 3 783 957 846 137
Singapore 4 772 654 867 124
Shanghai 5 770 798 838 147
Tokyo 6 756 445 814 153
Toronto 7 755 342 768 154
Zurich 8 739 538 786 159
Beijing 9 738 819 765 149
Frankfurt 10 737 648 771 177
Sydney 11 736 366 802 162
Dubai 12 733 506 735 178
Boston 13 732 397 751 155
Shenzhen 14 730 515 769 142
Melbourne 15 729 254 753 173
San Francisco 16 727 386 782 162
Los Angeles 17 724 364 753 158
Montreal 18 722 181 716 175
Vancouver 19 721 207 744 164
Chicago 20 717 380 739 157
Cayman Islands 21 713 182 679 224
Casablanca 22 712 115 697 227
Tel Aviv 23 710 121 671 247
Guangzhou 24 708 438 649 179
Bermuda 25 705 84 676 216
Abu Dhabi 26 702 383 695 196
Paris 27 699 524 709 177
Geneva 28 698 358 713 183
Qingdao 29 694 945 828 119
Luxembourg 30 691 321 684 207
Osaka 31 690 169 713 199
Washington DC 32 689 374 777 166
Monaco 33 686 177 646 228
Taipei 34 676 162 682 185
Edinburgh 35 674 316 664 181
Seoul 36 668 359 648 223
Madrid 37 667 265 648 180
Dublin 38 658 393 663 182
Kuala Lumpur 39 652 299 638 193
Wellington 40 647 68 735 187
Amsterdam 41 646 443 665 191
Doha 42 642 171 657 217
Munich 43 641 270 672 191
Vienna 44 640 207 628 220
Milan 45 638 241 644 174
Busan 46 636 197 467 225
Jersey 47 635 218 601 212
Johannesburg 48 634 123 617 202
Stuttgart 49 633 84 692 215
Hamburg 50 632 246 644 200
----- Assessmemts -----Centre
GFCI
25
Rank
GFCI
25
Rating Number Average St. Dev
Astana 51 631 264 619 255
Brussels 52 630 359 633 191
Bangkok 53 629 264 630 161
Mauritius 54 628 114 596 253
Stockholm 55 627 173 611 223
Cape Town 56 626 128 639 188
Kuwait City 57 625 78 562 251
Calgary 58 621 115 617 185
Istanbul 59 620 190 585 206
Lisbon 60 619 181 613 204
Mexico City 61 616 108 588 194
Prague 62 614 139 610 184
Glasgow 63 613 168 569 207
Oslo 64 612 123 593 215
Rio de Janeiro 65 611 80 598 226
Sao Paulo 66 609 109 595 221
Bahrain 67 608 136 618 201
Jakarta 68 607 129 560 215
GIFT City-Gujarat 69 606 106 525 253
Warsaw 70 605 187 601 221
Budapest 71 603 103 590 195
British Virgin Islands 72 602 162 615 244
St Petersburg 73 601 143 589 209
Helsinki 74 599 106 560 189
Guernsey 75 598 185 572 209
Copenhagen 76 597 212 595 201
Liechtenstein 77 596 143 602 222
Riga 78 595 76 512 226
Sofia 79 593 67 500 221
Gibraltar 80 591 145 570 240
Tianjin 81 589 256 477 246
Panama 82 588 118 576 255
Reykjavik 83 587 103 569 222
Isle of Man 84 586 151 575 220
Bahamas 85 585 132 551 228
Rome 86 584 208 582 195
Chengdu 87 583 905 448 213
Moscow 88 582 349 573 207
Malta 89 581 175 563 219
Buenos Aires 90 580 63 556 237
Riyadh 91 575 127 537 228
Mumbai 92 573 213 552 188
Cyprus 93 572 142 531 222
Tallinn 94 569 88 565 236
Baku 95 567 129 534 187
New Delhi 96 565 201 551 179
Nairobi 97 564 61 493 226
Manila 98 562 167 535 189
Hangzhou 99 561 141 560 220
Almaty 100 560 344 558 231
Dalian 101 520 862 319 157
Athens 102 519 111 498 234
Centre
GFCI
25
Rank
GFCI
25
Rating
----- Assessmemts -----
42 | The Global Financial Centres Index 25
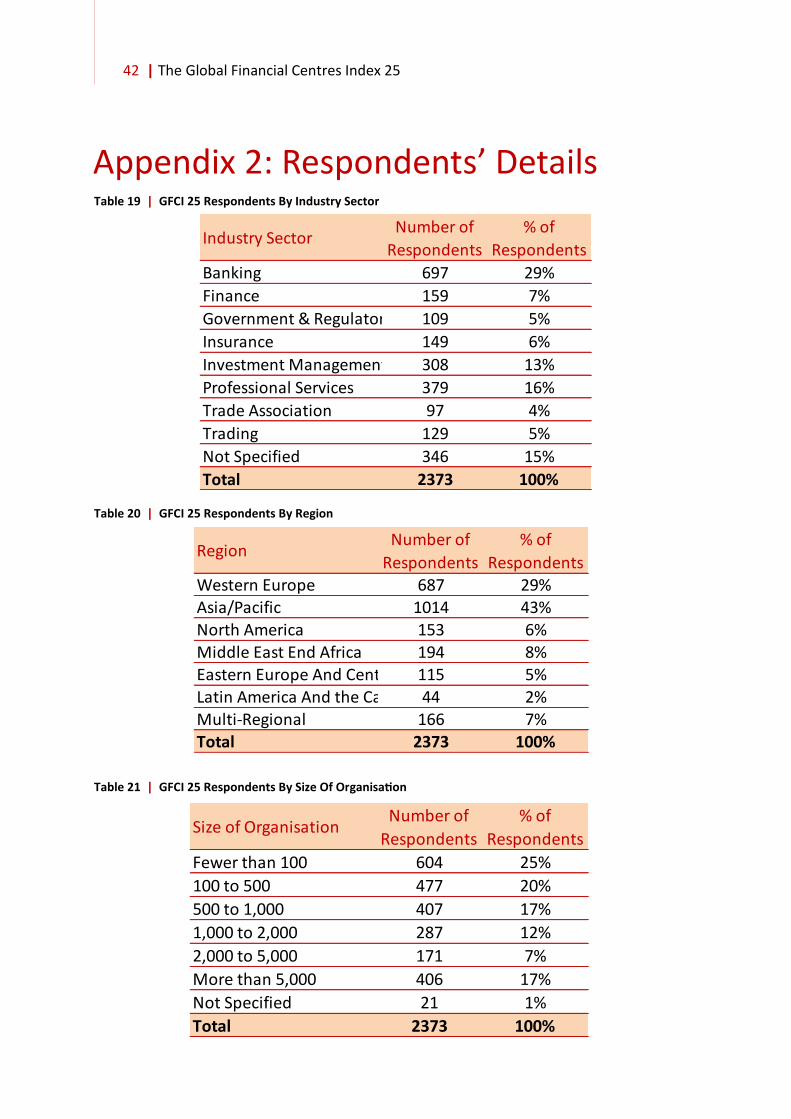
Appendix 2: Respondents’ Details Table 19 | GFCI 25 Respondents By Industry Sector
Table 20 | GFCI 25 Respondents By Region
Table 21 | GFCI 25 Respondents By Size Of Organisation
Industry SectorNumber of
Respondents
% of
Respondents
Banking 697 29%
Finance 159 7%
Government & Regulatory 109 5%
Insurance 149 6%
Investment Management 308 13%
Professional Services 379 16%
Trade Association 97 4%
Trading 129 5%
Not Specified 346 15%
Total 2373 100%
RegionNumber of
Respondents
% of
Respondents
Western Europe 687 29%
Asia/Pacific 1014 43%
North America 153 6%
Middle East End Africa 194 8%
Eastern Europe And Central Asia115 5%
Latin America And the Caribbean44 2%
Multi-Regional 166 7%
Total 2373 100%
Size of OrganisationNumber of
Respondents
% of
Respondents
Fewer than 100 604 25%
100 to 500 477 20%
500 to 1,000 407 17%
1,000 to 2,000 287 12%
2,000 to 5,000 171 7%
More than 5,000 406 17%
Not Specified 21 1%
Total 2373 100%
The Global Financial Centres Index 25 | 43
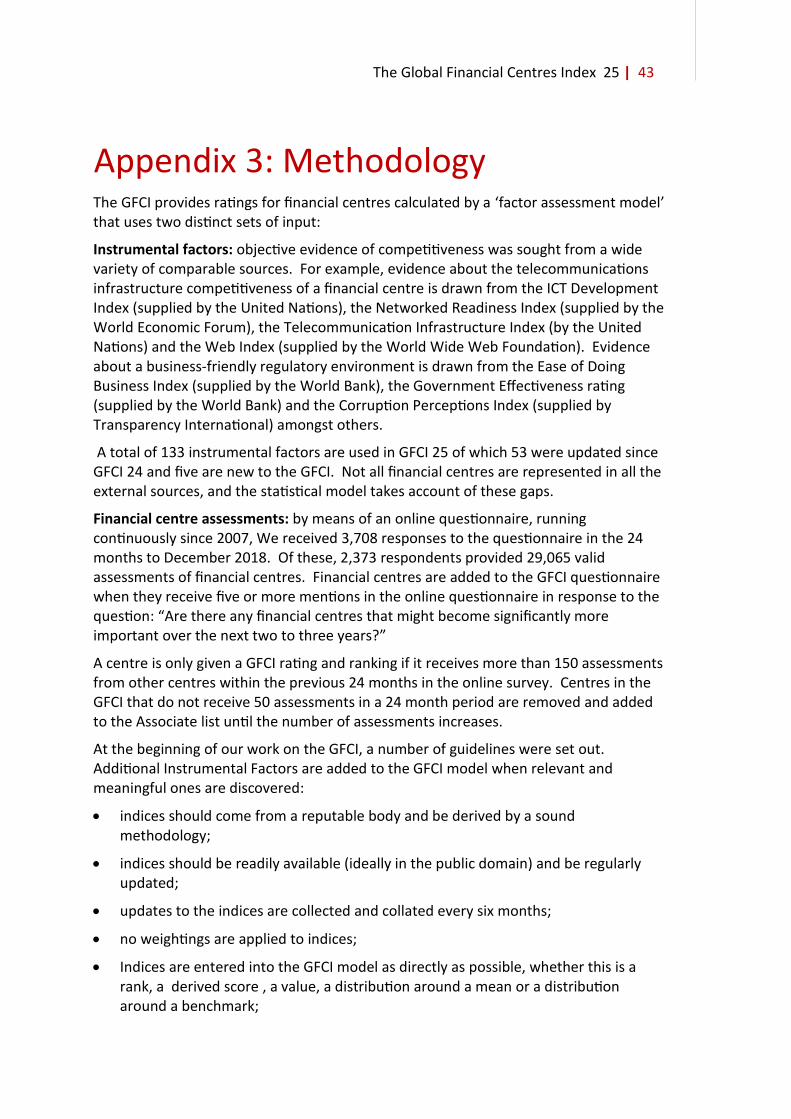
Appendix 3: Methodology The GFCI provides ratings for financial centres calculated by a ‘factor assessment model’ that uses two distinct sets of input:
Instrumental factors: objective evidence of competitiveness was sought from a wide variety of comparable sources. For example, evidence about the telecommunications infrastructure competitiveness of a financial centre is drawn from the ICT Development Index (supplied by the United Nations), the Networked Readiness Index (supplied by the World Economic Forum), the Telecommunication Infrastructure Index (by the United Nations) and the Web Index (supplied by the World Wide Web Foundation). Evidence about a business-friendly regulatory environment is drawn from the Ease of Doing Business Index (supplied by the World Bank), the Government Effectiveness rating (supplied by the World Bank) and the Corruption Perceptions Index (supplied by Transparency International) amongst others.
A total of 133 instrumental factors are used in GFCI 25 of which 53 were updated since GFCI 24 and five are new to the GFCI. Not all financial centres are represented in all the external sources, and the statistical model takes account of these gaps.
Financial centre assessments: by means of an online questionnaire, running continuously since 2007, We received 3,708 responses to the questionnaire in the 24 months to December 2018. Of these, 2,373 respondents provided 29,065 valid assessments of financial centres. Financial centres are added to the GFCI questionnaire when they receive five or more mentions in the online questionnaire in response to the question: “Are there any financial centres that might become significantly more important over the next two to three years?”
A centre is only given a GFCI rating and ranking if it receives more than 150 assessments from other centres within the previous 24 months in the online survey. Centres in the GFCI that do not receive 50 assessments in a 24 month period are removed and added to the Associate list until the number of assessments increases.
At the beginning of our work on the GFCI, a number of guidelines were set out. Additional Instrumental Factors are added to the GFCI model when relevant and meaningful ones are discovered:
• indices should come from a reputable body and be derived by a sound methodology;
• indices should be readily available (ideally in the public domain) and be regularly updated;
• updates to the indices are collected and collated every six months;
• no weightings are applied to indices;
• Indices are entered into the GFCI model as directly as possible, whether this is a rank, a derived score , a value, a distribution around a mean or a distribution around a benchmark;

44 | The Global Financial Centres Index 25
• if a factor is at a national level, the score will be used for all centres in that country; nation-based factors will be avoided if financial centre (city) - based factors are available;
• if an index has multiple values for a city or nation, the most relevant value is used (and the method for judging relevance is noted);
• if an index is at a regional level, the most relevant allocation of scores to each centre is made (and the method for judging relevance is noted);
• if an index does not contain a value for a particular city, a blank is entered against that centre (no average or mean is used).
Creating the GFCI does not involve totalling or averaging scores across instrumental factors. An approach involving totalling and averaging would involve a number of difficulties:
• indices are published in a variety of different forms: an average or base point of 100 with scores above and below this; a simple ranking; actual values (e.g. $ per square foot of occupancy costs); a composite ‘score’;
• indices would have to be normalised, e.g. in some indices a high score is positive while in others a low score is positive;
• not all centres are included in all indices;
• the indices would have to be weighted.
The guidelines for financial centre assessments by respondents are:
• responses are collected via an online questionnaire which runs continuously. A link to this questionnaire is emailed to the target list of respondents at regular intervals and other nterested parties can fill this in by following the link given in the GFCI publications;
• financial centre assessments will be included in the GFCI model for 24 months after they have been received;
• respondents rating fewer than three or more than half of the centres are excluded from the model;
• respondents who do not say where they work are excluded;
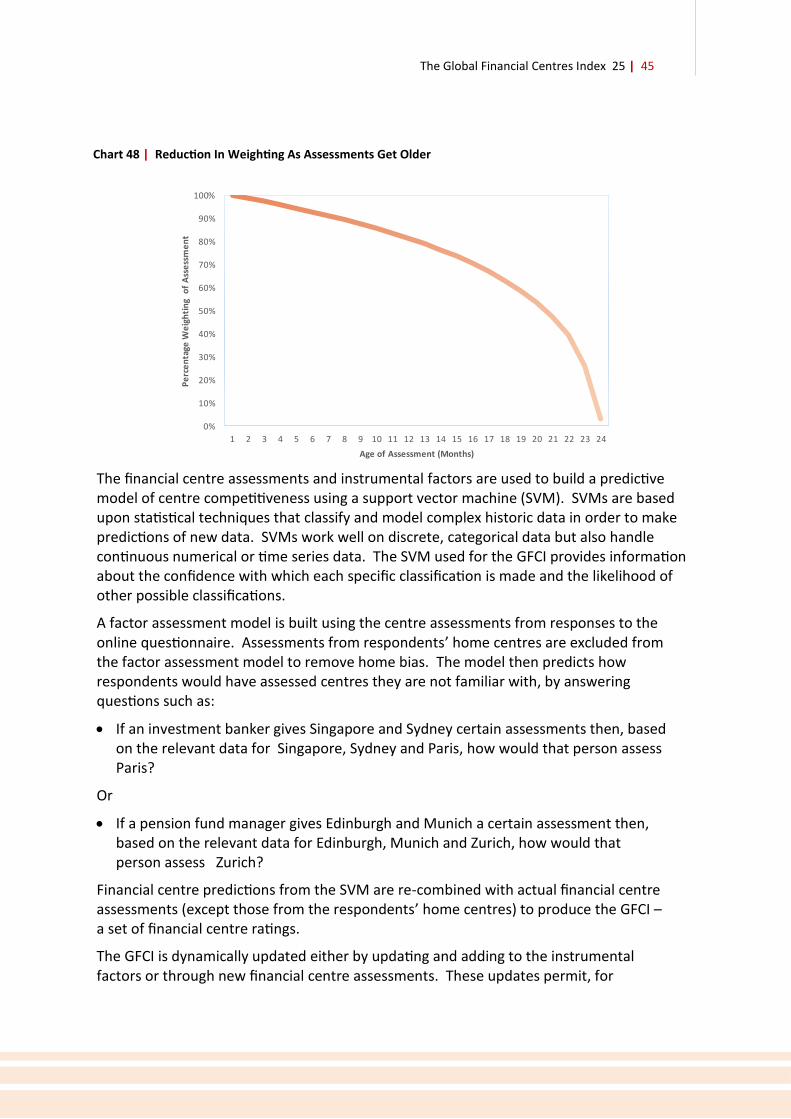
• financial centre assessments from the month when the GFCI is created are given full weighting and earlier responses are given a reduced weighting on a log scale.
The Global Financial Centres Index 25 | 45
Chart 48 | Reduction In Weighting As Assessments Get Older
0%
10%
20%
30%
40%
50%
60%
70%
80%
90%
100%
1 2 3 4 5 6 7 8 9 10 11 12 13 14 15 16 17 18 19 20 21 22 23 24
Pe
rce
nta
ge W
eig
hti
ng
of
Ass
ess
me
nt
Age of Assessment (Months)
The financial centre assessments and instrumental factors are used to build a predictive model of centre competitiveness using a support vector machine (SVM). SVMs are based upon statistical techniques that classify and model complex historic data in order to make predictions of new data. SVMs work well on discrete, categorical data but also handle continuous numerical or time series data. The SVM used for the GFCI provides information about the confidence with which each specific classification is made and the likelihood of other possible classifications.
A factor assessment model is built using the centre assessments from responses to the online questionnaire. Assessments from respondents’ home centres are excluded from the factor assessment model to remove home bias. The model then predicts how respondents would have assessed centres they are not familiar with, by answering questions such as:
• If an investment banker gives Singapore and Sydney certain assessments then, based on the relevant data for Singapore, Sydney and Paris, how would that person assess Paris?
Or
• If a pension fund manager gives Edinburgh and Munich a certain assessment then, based on the relevant data for Edinburgh, Munich and Zurich, how would that person assess Zurich?
Financial centre predictions from the SVM are re-combined with actual financial centre assessments (except those from the respondents’ home centres) to produce the GFCI – a set of financial centre ratings.
The GFCI is dynamically updated either by updating and adding to the instrumental factors or through new financial centre assessments. These updates permit, for

46 | The Global Financial Centres Index 25
instance, a recently changed index of rental costs to affect the competitiveness rating of the centres.
It is worth drawing attention to a few consequences of basing the GFCI on instrumental factors and questionnaire responses:
• several indices can be used for each competitive factor;
• a strong international group of ‘raters’ has developed as the GFCI progresses;
• sector-specific ratings are available using the business sectors represented by questionnaire respondents. This makes it possible to rate Frankfurt as competitive in Banking (for example) while less competitive Insurance (for example);
• the factor assessment model can be queried in a ‘what if’ mode – “how much would London rental costs need to fall in order to increase London’s ranking against New York?”
Part of the process of building the GFCI is extensive sensitivity testing to changes in factors of competitiveness and financial centre assessments.
There are over ten million data points in the current GFCI model. The accuracy of predictions given by the SVM are regularly tested against actual assessments.
Factor of CompetitivenessInstrumental Factor
Instrumental Factor
Instrumental Factor
Instrumental Factor
Instrumental Factor
Factor of Competitiveness
Factor of Competitiveness
Factor of Competitiveness
Factor of Competitiveness
Financial Centre Assessments from
Online Questionnaire
Instrumental Factor Updates
Change in Financial Centre Assessments
Instrumental Factor Prediction Engine (SVM)
UpdatedGFCI
Chart 49 | The GFCI Process

The Global Financial Centres Index 25 | 47
Appendix 4: Instrumental Factors Table 22 | Top 30 Instrumental Factors By Correlation With GFCI 25
Instrumental Factor R-squared
Global Power City Index 0.497
Innovation Cities Global Index 0.406
Household Net Financial Wealth 0.405
Citizens Domestic Purchasing Power 0.389
Household Net Adjusted Disposable Income 0.367
Wage Comparison Index 0.362
Price Levels 0.337
World Competitiveness Scoreboard 0.333
IESE Cities In Motion Index 0.333
Global Competitiveness Index 0.333
Business Environment Rankings 0.318
Global Cities Index 0.312
Quality of Roads 0.307
Financial Secrecy Index 0.304
Best Countries for Business 0.294
Logistics Performance Index 0.290
Government Effectiveness 0.287
Global Innovation Index 0.286
Sustainable Cities Index 0.284
Best Countries 0.269
Cost of Living City Rankings 0.266
Global Enabling Trade Report 0.264
JLL Real Estate Transparency Index 0.264
Domestic Credit Provided by Banking Sector 0.244
Networked Readiness Index 0.241
Quality of Domestic Transport Network 0.237
Business Process Outsourcing Location Index 0.236
Global Cybersecurity Index 0.235
Regulatory Quality 0.224
Office Occupancy Cost 0.223
48 | The Global Financial Centres Index 25
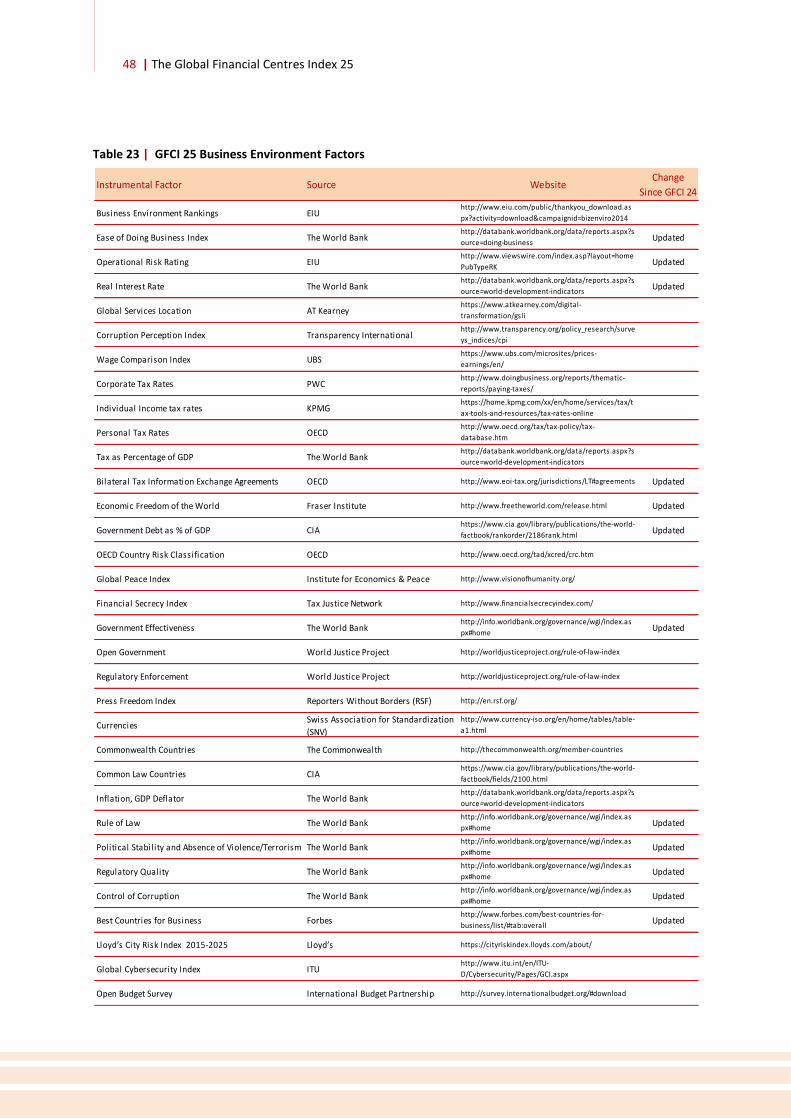
Table 23 | GFCI 25 Business Environment Factors
Instrumental Factor Source WebsiteChange
Since GFCI 24
Business Environment Rankings EIUhttp://www.eiu.com/public/thankyou_download.as
px?activity=download&campaignid=bizenviro2014
Ease of Doing Business Index The World Bankhttp://databank.worldbank.org/data/reports.aspx?s
ource=doing-businessUpdated
Operational Risk Rating EIUhttp://www.viewswire.com/index.asp?layout=home
PubTypeRKUpdated
Real Interest Rate The World Bankhttp://databank.worldbank.org/data/reports.aspx?s
ource=world-development-indicatorsUpdated
Global Services Location AT Kearneyhttps://www.atkearney.com/digital-
transformation/gsli
Corruption Perception Index Transparency Internationalhttp://www.transparency.org/policy_research/surve
ys_indices/cpi
Wage Comparison Index UBShttps://www.ubs.com/microsites/prices-
earnings/en/
Corporate Tax Rates PWC http://www.doingbusiness.org/reports/thematic-
reports/paying-taxes/
Individual Income tax rates KPMGhttps://home.kpmg.com/xx/en/home/services/tax/t
ax-tools-and-resources/tax-rates-online
Personal Tax Rates OECDhttp://www.oecd.org/tax/tax-policy/tax-
database.htm
Tax as Percentage of GDP The World Bankhttp://databank.worldbank.org/data/reports.aspx?s
ource=world-development-indicators
Bilateral Tax Information Exchange Agreements OECD http://www.eoi-tax.org/jurisdictions/LT#agreements Updated
Economic Freedom of the World Fraser Institute http://www.freetheworld.com/release.html Updated
Government Debt as % of GDP CIAhttps://www.cia.gov/library/publications/the-world-
factbook/rankorder/2186rank.htmlUpdated
OECD Country Risk Classification OECD http://www.oecd.org/tad/xcred/crc.htm
Global Peace Index Institute for Economics & Peace http://www.visionofhumanity.org/
Financial Secrecy Index Tax Justice Network http://www.financialsecrecyindex.com/
Government Effectiveness The World Bankhttp://info.worldbank.org/governance/wgi/index.as
px#homeUpdated
Open Government World Justice Project http://worldjusticeproject.org/rule-of-law-index
Regulatory Enforcement World Justice Project http://worldjusticeproject.org/rule-of-law-index
Press Freedom Index Reporters Without Borders (RSF) http://en.rsf.org/
CurrenciesSwiss Association for Standardization
(SNV)
http://www.currency-iso.org/en/home/tables/table-
a1.html
Commonwealth Countries The Commonwealth http://thecommonwealth.org/member-countries
Common Law Countries CIAhttps://www.cia.gov/library/publications/the-world-
factbook/fields/2100.html
Inflation, GDP Deflator The World Bankhttp://databank.worldbank.org/data/reports.aspx?s
ource=world-development-indicators
Rule of Law The World Bankhttp://info.worldbank.org/governance/wgi/index.as
px#homeUpdated
Political Stability and Absence of Violence/Terrorism The World Bankhttp://info.worldbank.org/governance/wgi/index.as
px#homeUpdated
Regulatory Quality The World Bankhttp://info.worldbank.org/governance/wgi/index.as
px#homeUpdated
Control of Corruption The World Bankhttp://info.worldbank.org/governance/wgi/index.as
px#homeUpdated
Best Countries for Business Forbeshttp://www.forbes.com/best-countries-for-
business/list/#tab:overallUpdated
Lloyd’s City Risk Index 2015-2025 Lloyd’s https://cityriskindex.lloyds.com/about/
Global Cybersecurity Index ITUhttp://www.itu.int/en/ITU-
D/Cybersecurity/Pages/GCI.aspx
Open Budget Survey International Budget Partnership http://survey.internationalbudget.org/#download
The Global Financial Centres Index 25 | 49
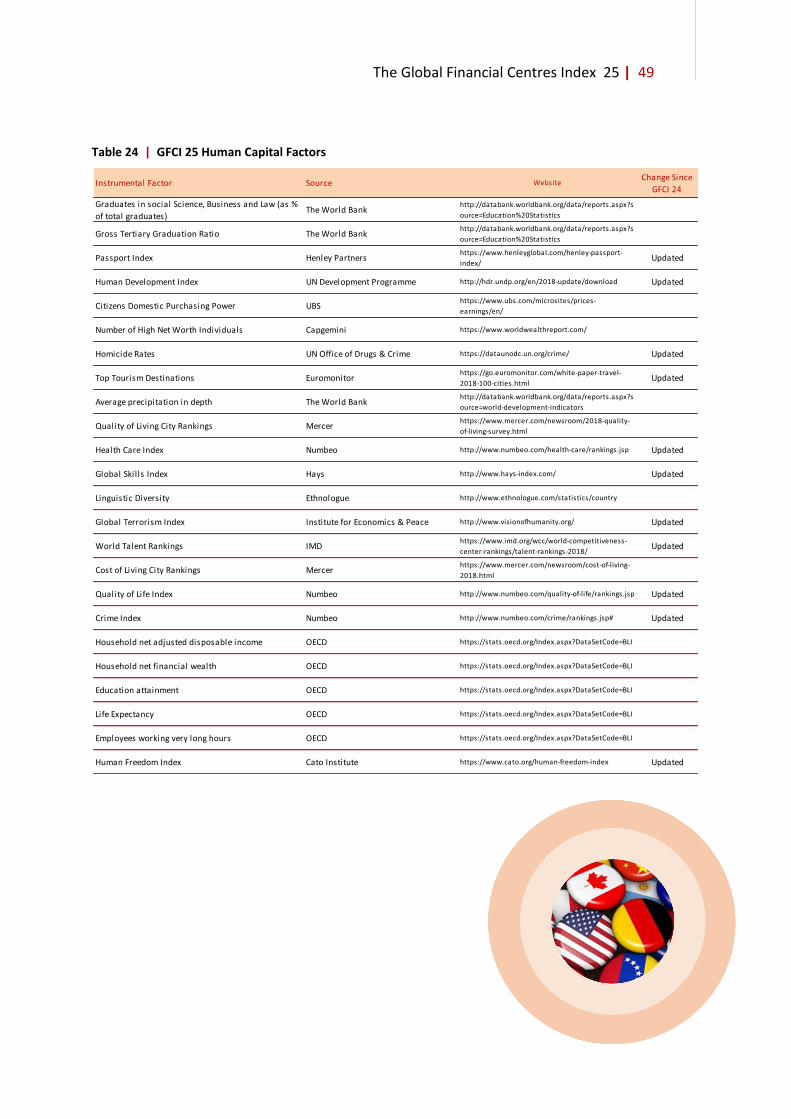
Table 24 | GFCI 25 Human Capital Factors
Instrumental Factor Source WebsiteChange Since
GFCI 24
Graduates in social Science, Business and Law (as %
of total graduates)The World Bank
http://databank.worldbank.org/data/reports.aspx?s
ource=Education%20Statistics
Gross Tertiary Graduation Ratio The World Bankhttp://databank.worldbank.org/data/reports.aspx?s
ource=Education%20Statistics
Passport Index Henley Partnershttps://www.henleyglobal.com/henley-passport-
index/Updated
Human Development Index UN Development Programme http://hdr.undp.org/en/2018-update/download Updated
Citizens Domestic Purchasing Power UBShttps://www.ubs.com/microsites/prices-
earnings/en/
Number of High Net Worth Individuals Capgemini https://www.worldwealthreport.com/
Homicide Rates UN Office of Drugs & Crime https://dataunodc.un.org/crime/ Updated
Top Tourism Destinations Euromonitorhttps://go.euromonitor.com/white-paper-travel-
2018-100-cities.htmlUpdated
Average precipitation in depth The World Bankhttp://databank.worldbank.org/data/reports.aspx?s
ource=world-development-indicators
Quality of Living City Rankings Mercerhttps://www.mercer.com/newsroom/2018-quality-
of-living-survey.html
Health Care Index Numbeo http://www.numbeo.com/health-care/rankings.jsp Updated
Global Skil ls Index Hays http://www.hays-index.com/ Updated
Linguistic Diversity Ethnologue http://www.ethnologue.com/statistics/country
Global Terrorism Index Institute for Economics & Peace http://www.visionofhumanity.org/ Updated
World Talent Rankings IMDhttps://www.imd.org/wcc/world-competitiveness-
center-rankings/talent-rankings-2018/Updated
Cost of Living City Rankings Mercerhttps://www.mercer.com/newsroom/cost-of-living-
2018.html
Quality of Life Index Numbeo http://www.numbeo.com/quality-of-life/rankings.jsp Updated
Crime Index Numbeo http://www.numbeo.com/crime/rankings.jsp# Updated
Household net adjusted disposable income OECD https://stats.oecd.org/Index.aspx?DataSetCode=BLI
Household net financial wealth OECD https://stats.oecd.org/Index.aspx?DataSetCode=BLI
Education attainment OECD https://stats.oecd.org/Index.aspx?DataSetCode=BLI
Life Expectancy OECD https://stats.oecd.org/Index.aspx?DataSetCode=BLI
Employees working very long hours OECD https://stats.oecd.org/Index.aspx?DataSetCode=BLI
Human Freedom Index Cato Institute https://www.cato.org/human-freedom-index Updated
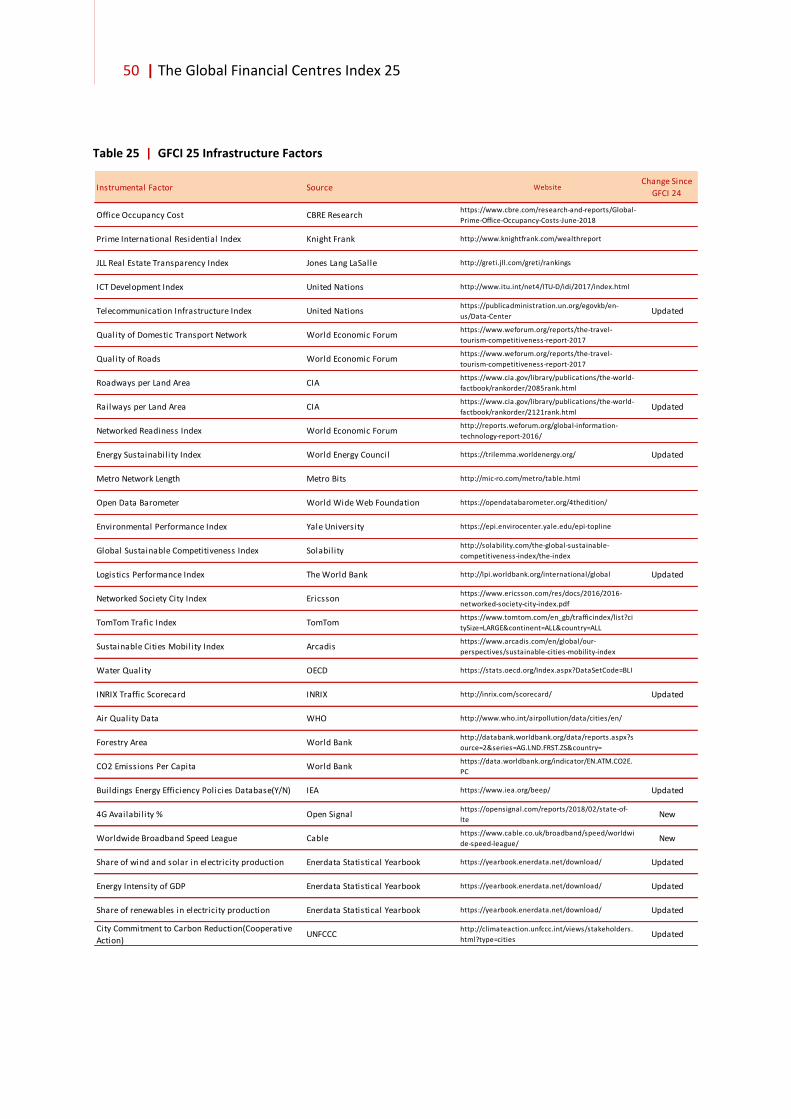
50 | The Global Financial Centres Index 25
Table 25 | GFCI 25 Infrastructure Factors
Instrumental Factor Source WebsiteChange Since
GFCI 24
Office Occupancy Cost CBRE Researchhttps://www.cbre.com/research-and-reports/Global-
Prime-Office-Occupancy-Costs-June-2018
Prime International Residential Index Knight Frank http://www.knightfrank.com/wealthreport
JLL Real Estate Transparency Index Jones Lang LaSalle http://greti.jll.com/greti/rankings
ICT Development Index United Nations http://www.itu.int/net4/ITU-D/idi/2017/index.html
Telecommunication Infrastructure Index United Nationshttps://publicadministration.un.org/egovkb/en-
us/Data-CenterUpdated
Quality of Domestic Transport Network World Economic Forumhttps://www.weforum.org/reports/the-travel-
tourism-competitiveness-report-2017
Quality of Roads World Economic Forumhttps://www.weforum.org/reports/the-travel-
tourism-competitiveness-report-2017
Roadways per Land Area CIAhttps://www.cia.gov/library/publications/the-world-
factbook/rankorder/2085rank.html
Railways per Land Area CIAhttps://www.cia.gov/library/publications/the-world-
factbook/rankorder/2121rank.htmlUpdated
Networked Readiness Index World Economic Forumhttp://reports.weforum.org/global-information-
technology-report-2016/
Energy Sustainability Index World Energy Council https://trilemma.worldenergy.org/ Updated
Metro Network Length Metro Bits http://mic-ro.com/metro/table.html
Open Data Barometer World Wide Web Foundation https://opendatabarometer.org/4thedition/
Environmental Performance Index Yale University https://epi.envirocenter.yale.edu/epi-topline
Global Sustainable Competitiveness Index Solabilityhttp://solability.com/the-global-sustainable-
competitiveness-index/the-index
Logistics Performance Index The World Bank http://lpi.worldbank.org/international/global Updated
Networked Society City Index Ericssonhttps://www.ericsson.com/res/docs/2016/2016-
networked-society-city-index.pdf
TomTom Trafic Index TomTomhttps://www.tomtom.com/en_gb/trafficindex/list?ci
tySize=LARGE&continent=ALL&country=ALL
Sustainable Cities Mobility Index Arcadishttps://www.arcadis.com/en/global/our-
perspectives/sustainable-cities-mobility-index
Water Quality OECD https://stats.oecd.org/Index.aspx?DataSetCode=BLI
INRIX Traffic Scorecard INRIX http://inrix.com/scorecard/ Updated
Air Quality Data WHO http://www.who.int/airpollution/data/cities/en/
Forestry Area World Bank http://databank.worldbank.org/data/reports.aspx?s
ource=2&series=AG.LND.FRST.ZS&country=
CO2 Emissions Per Capita World Bankhttps://data.worldbank.org/indicator/EN.ATM.CO2E.
PC
Buildings Energy Efficiency Policies Database(Y/N) IEA https://www.iea.org/beep/ Updated
4G Availability % Open Signalhttps://opensignal.com/reports/2018/02/state-of-
lteNew
Worldwide Broadband Speed League Cablehttps://www.cable.co.uk/broadband/speed/worldwi
de-speed-league/New
Share of wind and solar in electricity production Enerdata Statistical Yearbook https://yearbook.enerdata.net/download/ Updated
Energy Intensity of GDP Enerdata Statistical Yearbook https://yearbook.enerdata.net/download/ Updated
Share of renewables in electricity production Enerdata Statistical Yearbook https://yearbook.enerdata.net/download/ Updated
City Commitment to Carbon Reduction(Cooperative
Action)UNFCCC
http://climateaction.unfccc.int/views/stakeholders.
html?type=citiesUpdated
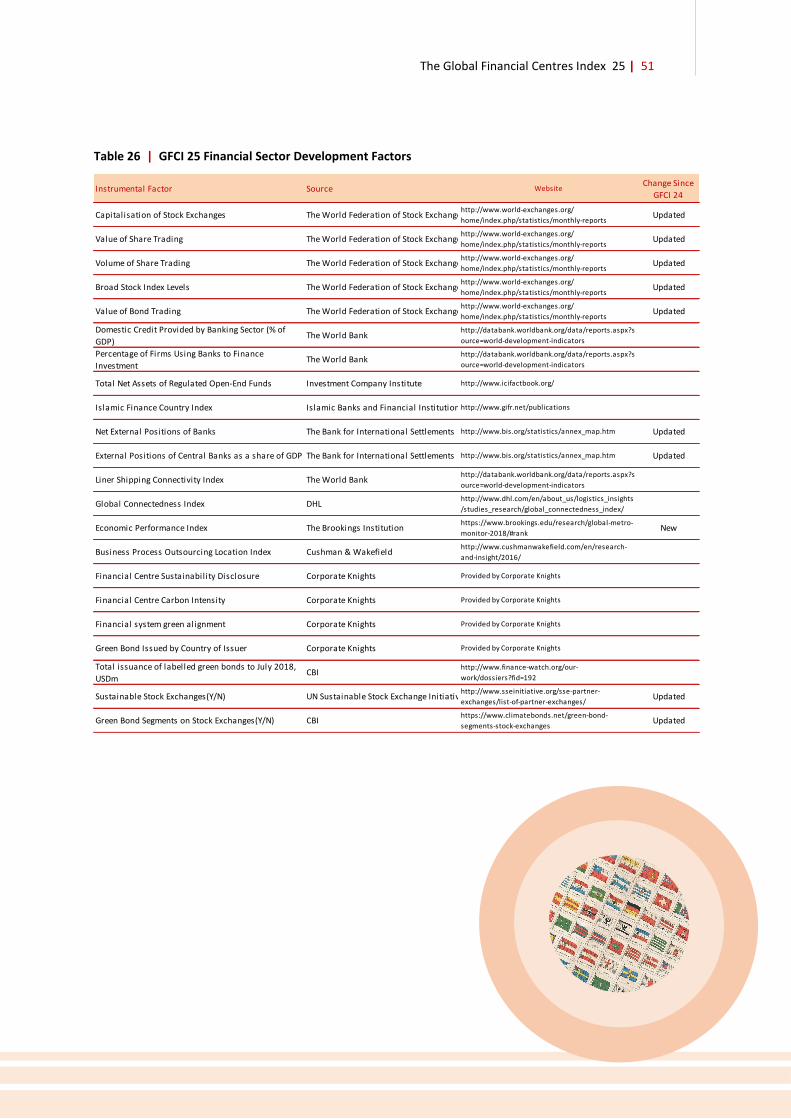
The Global Financial Centres Index 25 | 51
Table 26 | GFCI 25 Financial Sector Development Factors
Instrumental Factor Source WebsiteChange Since
GFCI 24
Capitalisation of Stock Exchanges The World Federation of Stock Exchangeshttp://www.world-exchanges.org/
home/index.php/statistics/monthly-reportsUpdated
Value of Share Trading The World Federation of Stock Exchangeshttp://www.world-exchanges.org/
home/index.php/statistics/monthly-reportsUpdated
Volume of Share Trading The World Federation of Stock Exchangeshttp://www.world-exchanges.org/
home/index.php/statistics/monthly-reportsUpdated
Broad Stock Index Levels The World Federation of Stock Exchangeshttp://www.world-exchanges.org/
home/index.php/statistics/monthly-reportsUpdated
Value of Bond Trading The World Federation of Stock Exchangeshttp://www.world-exchanges.org/
home/index.php/statistics/monthly-reportsUpdated
Domestic Credit Provided by Banking Sector (% of
GDP)The World Bank
http://databank.worldbank.org/data/reports.aspx?s
ource=world-development-indicators
Percentage of Firms Using Banks to Finance
InvestmentThe World Bank
http://databank.worldbank.org/data/reports.aspx?s
ource=world-development-indicators
Total Net Assets of Regulated Open-End Funds Investment Company Institute http://www.icifactbook.org/
Islamic Finance Country Index Islamic Banks and Financial Institutionshttp://www.gifr.net/publications
Net External Positions of Banks The Bank for International Settlements http://www.bis.org/statistics/annex_map.htm Updated
External Positions of Central Banks as a share of GDP The Bank for International Settlements http://www.bis.org/statistics/annex_map.htm Updated
Liner Shipping Connectivity Index The World Bankhttp://databank.worldbank.org/data/reports.aspx?s
ource=world-development-indicators
Global Connectedness Index DHLhttp://www.dhl.com/en/about_us/logistics_insights
/studies_research/global_connectedness_index/
Economic Performance Index The Brookings Institutionhttps://www.brookings.edu/research/global-metro-
monitor-2018/#rankNew
Business Process Outsourcing Location Index Cushman & Wakefieldhttp://www.cushmanwakefield.com/en/research-
and-insight/2016/
Financial Centre Sustainability Disclosure Corporate Knights Provided by Corporate Knights
Financial Centre Carbon Intensity Corporate Knights Provided by Corporate Knights
Financial system green alignment Corporate Knights Provided by Corporate Knights
Green Bond Issued by Country of Issuer Corporate Knights Provided by Corporate Knights
Total issuance of labelled green bonds to July 2018,
USDmCBI
http://www.finance-watch.org/our-
work/dossiers?fid=192
Sustainable Stock Exchanges(Y/N) UN Sustainable Stock Exchange Initiativehttp://www.sseinitiative.org/sse-partner-
exchanges/list-of-partner-exchanges/Updated
Green Bond Segments on Stock Exchanges(Y/N) CBIhttps://www.climatebonds.net/green-bond-
segments-stock-exchangesUpdated

52 | The Global Financial Centres Index 25
Table 27 | GFCI 25 Reputation Factors
Instrumental Factor Source WebsiteChange Since
GFCI 24
World Competitiveness Scoreboard IMDhttps://www.imd.org/wcc/world-competitiveness-
center-rankings/
Global Competitiveness Index World Economic Forumhttp://reports.weforum.org/global-competitiveness-
report-2018/competitiveness-rankings/Updated
Foreign Direct Investment Inflows UNCTADhttp://unctadstat.unctad.org/wds/TableViewer/tabl
eView.aspx?ReportId=96740Updated
FDI Confidence Index AT Kearneyhttps://www.atkearney.com/foreign-direct-
investment-confidence-index
GDP per Person Employed(constant 2011 PPP $) The World Bankhttp://databank.worldbank.org/data/reports.aspx?s
ource=world-development-indicatorsUpdated
Global Innovation Index INSEADhttp://www.globalinnovationindex.org/content.aspx
?page=GII-HomeUpdated
Global Intellectual Property Index Taylor Wessing http://www.taylorwessing.com/ipindex/
RPI (% change on year ago) The Economisthttps://www.economist.com/economic-and-
financial-indicators/2018/10/11/Updated
Price Levels UBShttps://www.ubs.com/microsites/prices-
earnings/en/
Number of International Association Meetings World Economic Forumhttp://reports.weforum.org/travel-and-tourism-
competitiveness-report-2017/Updated
Innovation Cities Global Index 2ThinkNow Innovation Citieshttps://www.innovation-cities.com/innovation-
cities-index-2018-global/Updated
Big Mac Index The Economist http://www.economist.com/content/big-mac-index Updated
Sustainable Economic Development Boston Consulting Group https://www.bcg.com/en-gb/publications/2018 Updated
Global Enabling Trade Report World Economic Forumhttps://www.weforum.org/focus/global-enabling-
trade-report-2016
Good Country Index Good Country Party https://www.goodcountryindex.org/results
Legatum Prosperity Index Legatum Institute http://www.prosperity.com/#!/ranking Updated
IESE cities in motion index IESE http://citiesinmotion.iese.edu/indicecim/?lang=en
FDI Inward Stock as a Percentage of GDP UNCTADhttp://unctad.org/en/Pages/DIAE/World%20Investm
ent%20Report/Annex-Tables.aspx
Sustainable Cities Index Arcadishttps://www.arcadis.com/en/global/our-
perspectives/sustainable-cities-index-2018/Updated
Global Cities Index AT Kearneyhttps://www.atkearney.com/2018-global-cities-
report
Quality of Nationality Index Henley Partners https://nationalityindex.com/#
Best Countries U.S.News https://www.usnews.com/news/best-
countries/overall-full-listNew
Global Power City Index The Mori Memorial Foundationhttp://mori-m-
foundation.or.jp/english/ius2/gpci2/index.shtmlNew

The Global Financial Centres Index 25 | 53
Abu Dhabi Global Market (ADGM), an international financial centre in the capital of the UAE, opened for business in October 2015. Strategically situated in Abu Dhabi, ADGM augments Abu Dhabi’s leading position as a global hub for business and finance and serves as a strategic link connecting the growing economies of the MENA region, Asia and the rest of the world.
ADGM has been awarded “Financial Centre of the Year (MENA)” for three consecutive years and recognised as Top FinTech Hub in MENA for its innovative initiatives, high regulatory standards and strategic contributions to the financial industry. ADGM’s achievements are anchored by Abu Dhabi’s forte in private banking, wealth management, asset management and financial innovation. ADGM comprises three independent Authorities, the Financial Services Regulatory Authority, the Registration Authority and ADGM Courts, working together as one entity to support Abu Dhabi and the UAE’s sustainable growth.
[email protected] / www.adgm.com
Vantage Financial Centres is an exclusive club of financial centres around the world run by Z/Yen Partners for organisations looking for a deeper understanding of financial centre competitiveness. Members receive enhanced access to GFCI data, marketing opportunities, and training for centres seeking to enhance their profile and reputation.
Luxembourg for Finance (LFF) is the Agency for the Development of the Financial Centre. It is a public-private partnership between the Luxembourg Government and the Luxembourg Financial Industry Federation (PROFIL). Founded in 2008, its objective is to develop Luxembourg’s financial services industry and identify new business opportunities.
LFF connects international investors to the range of financial services provided in Luxembourg, such as investment funds, wealth management, capital market operations or advisory services. In addition to being the first port of call for foreign journalists, LFF cooperates with the various professional associations and monitors global trends in finance, providing the necessary material on products and services available in Luxembourg.
Furthermore, LFF manages multiple communication channels, organises seminars in international business locations, and takes part in selected world-class trade fairs and congresses.
luxembourgforfinance.com
Gujarat International Finance Tec-City (GIFT), Gujarat, India has set up International Financial Services Centre (IFSC) which is the only approved IFSC in India. The GIFT IFSC is a gateway for inbound and outbound business from India. Centre is fast emerging as a preferred destination for undertaking International Financial Services. The GIFT IFSC covers Banking, Insurance, Capital Market and allied services covering law firms, accounting firms and professional services firms.
It provides very competitive cost of operation with competitive tax regime, single window clearance, relaxed Company Law provisions, International Arbitration Centre with overall facilitation of doing business.
Dipesh Shah at [email protected]
www.giftgujarat.in
The Long Finance initiative grew out of the London Accord, a 2005 agreement among investment researchers to share environmental, social and governance research with policy-makers and the public. Long Finance was established more formally by Z/Yen Group and Gresham College from 2007 with the aim of exploring long-term thinking across a global network of people.
We work on researching innovative ways of building a more sustainable financial system. In so doing, we try to operate openly and emulate scientific ideals. At the same time, we are looking to create a supportive and caring community where people can truly question the accepted paradigms of risk and reward.
www.longfinance.net
54 | The Global Financial Centres Index 25
The AIFC is the new destination for business offering ample opportunity for growth. AIFC is the unrivalled financial centre in the region to facilitate an access to world class capital markets and asset management industry. It also promotes financial technology and drives the development of niche markets such as Islamic and green finance in the region.
Located at the heart of Eurasia, AIFC provides un-precedented conditions and opportunities for its participants and investors: legal system based on the principles of the English law, independent regulatory framework consistent with internationally recog-nised standards, no corporate tax regime, depth and breadth in financial services and instruments’ offer-ing, simplified visa and labour regimes, English as a working language. Astana strives to become the gateway to the Eurasian Economic Union and has already been dubbed “The Buckle on the Belt”—key regional financial services hub for the Belt and Road.
Tolkyn Takishova at [email protected] www.aifc.kz
Vantage Financial Centres is an exclusive club of financial centres around the world run by Z/Yen Partners for organisations looking for a deeper understanding of financial centre competitiveness. Members receive enhanced access to GFCI data, marketing opportunities, and training for centres seeking to enhance their profile and reputation.
Since 2009 Busan Metropolitan City has been developing a financial hub specialising in maritime finance and derivatives. With its strategic location in the center of the southeast economic block of Korea and the crossroads of a global logistics route, Busan envisions growing into an international financial city in Northeast Asia. Following the successful launch of the 63-story Busan International Finance Center in 2014, the second phase development of the Busan Financial Hub will be completed in 2018 and is expected to provide world-class business infrastructure for financial institutions.
BIFC offers an attractive incentive package to global financial leaders and cooperation network of Busan Metropolitan City, Busan International Financial City Promotion Center, and Financial Hub Korea will support you to identify opportunities in Busan, one of the fastest developing cities in Asia.
www.bifc.kr/eng
BUSAN INTERNATIONAL
FINANCE
CENTER
Casablanca Finance City is an African financial and business hub located at the crossroads of continents. Recognized as the leading financial center in Africa, and partner of the largest financial centers in the world, CFC has built a strong and thriving community of members across four major categories: financial companies, regional headquarters of multinationals, service providers and holdings.
CFC offers its members an attractive value proposition and a premium “Doing Business” support that fosters the deployment of their activities in Africa. Driven by the ambition to cater to its community, CFC is committed to promoting its members expertise across the continent, while enabling fruitful business and partnership synergies through its networking platform.
Manal Bernoussi at [email protected] www.casablancafinancecity.com
Based in Shenzhen, Guangdong Province China Development Institute (CDI) is a market oriented, non-governmental think tank which was founded in 1989 on approval from the Chinese State Council. CDI was designated as one of the 25 China Top Think Tanks in 2015. CDI is committed to providing proactive, innovative and practical research and consultation for China’s central and local governments and businesses at home and abroad. Its research and consultation is centered on macro strategy, regional economy, urbanization, industrial development and policies, business strategy and investment decision-making.
CDI has been exploring to improve its mechanism and operation models which are beneficial to development of non-governmental think tank. With leadership of its Board of Directors, CDI is in the charge of its President. There are more than 140 employees in CDI, 70% of them are researchers.
Carol Feng at [email protected] www.cdi.org.cn
The Global Financial Centres Index 25 | 55
Finance Montréal’s mandate is to promote Montréal as a world-class financial hub and foster cooperation among its member institutions to accelerate the industry’s growth. With renowned research capacities in artificial intelligence and a booming fintech sector, Montréal offers an experienced, diversified and innovative pool of talent as well as a stable, low cost and dynamic business environment.
For financial institutions searching for an ideal location to set up an intelligent service centre and operationalize their digital transformation, Finance Montréal can advise on the advantageous tax incentives aimed at facilitating the establishment and development of financial services corporations in the city.
[email protected] www.finance-montreal.com/en
Please find out more at: www.vantagefinancialcentres.net
or by contacting Mark Yeandle at [email protected]
Since the establishment of the International Financial Services Centre (IFSC) in Ireland in 1987, Ireland's IFS sector has experienced rapid growth to become a truly nationwide industry with a mix of indigenous and international firms specialising in sub-sectors such as asset management and investment management, aviation finance, banking, fintech and payments, and insurance and reinsurance.
IFS Ireland takes a public-private partnership approach to promoting Ireland as being at the vanguard of financial services due to our English speaking, common law, pro-enterprise environment which is underpinned by membership of the European Union (EU) and the Single Market, a strong and independent regulator and readily available talent thanks to our world-class education system.
Seoul is a rising star among the financial cities of the world. It is already one of the top 10 cities in the world based on various indices, and it has many more opportunities to offer as a financial hub and great growth potential. Seoul believe global financial companies are our true partners for growth. There are many incentives provided to global financial companies that enter into Seoul, such as the financial incentives provided when moving into IFC, so that we can all jointly work towards the growth and development of the financial market.
It is sure that Seoul will become a top star of global financial hubs in the near future! Pay close attention to Seoul's potentials and preemptively gain a foothold in the Seoul financial hub. Seoul is the gateway to Northeast Asia and the world.
Daehur Kim at [email protected] /www.seoul.go.kr/main/index.jsp
Dubai International Financial Centre (DIFC) is one of the world’s most advanced financial centres, and the leading financial hub for the Middle East, Africa and South Asia (MEASA), which comprises 72 countries with an approximate population of 3 billion and a nominal GDP of US$ 7.7 trillion.
DIFC is home to an internationally recognised, independent regulator and a proven judicial system with an English common law framework, as well as the region’s largest financial ecosystem of more than 22,000 professionals working across over 2,000 active registered companies
The Centre’s vision is to drive the future of finance. Today, it offers one of the region’s most comprehensive FinTech and venture capital environments, including cost-effective licensing solutions, fit-for-purpose regulation, innovative accelerator programmes, and funding for growth-stage start-ups.
www.difc.ae
www.zyen.com Z/Yen helps organisations make better choices – our clients consider us a commercial
think-tank that spots, solves and acts. Our name combines Zen and Yen –
“a philosophical desire to succeed” – in a ratio, recognising that all decisions are trade-
offs. One of Z/Yen’s specialisms is the study of the competitiveness of financial centres
around the world. A summary of this work is published every six months as the Global
Financial Centres Index. Z/Yen also publishes the Global Green Finance Index that
seeks to encourage financial centres to become greener and develop financial services
in a way that enables society to live within planetary boundaries.
www.globalfinancialcentres.net Financial Centre Futures is a programme within the Long Finance Initiative that initiates discussion on the changing landscape of global finance, seeking to explore how finance might work in the future. Financial Centre Futures comprises the Global Financial Centres Index, the Global Green Finance Index and other research publications that explore major changes to the way we will live and work in the financial system of the future.
en.cdi.org.cn The China Development Institute (CDI) is a non-governmental think tank that develops
solutions to public policy challenges through broad-scope and in-depth research to
help advance China’s reform and opening-up to world markets. The CDI has been
working on the promotion and development of China’s financial system since its
establishment nine years ago. Based on rigorous research and objective analysis, CDI is
committed to providing prospective, innovative and pragmatic reports for governments
at different levels in China and corporations at home and abroad.
CO-PRODUCED BY
PRODUCED BY
PUBLISHED BY LONG FINANCE AND FINANCIAL CENTRE FUTURES
www.longfinance.net Long Finance is a Z/Yen initiative designed to address the question “When would we know our financial system is working?” This question underlies Long Finance’s goal to improve society’s understanding and use of finance over the long-term. In contrast to the short-termism that defines today’s economic views the Long Finance timeframe is roughly 100 years.


