The Future of Mass Transit Development in Thailand
ByMr. Athibhu Chitranukroh
Rail development Information Center
Austria Showcase “Railway Technology 2011”8th June, 2011
Dusit Thani Hotel, Bangkok Thailand
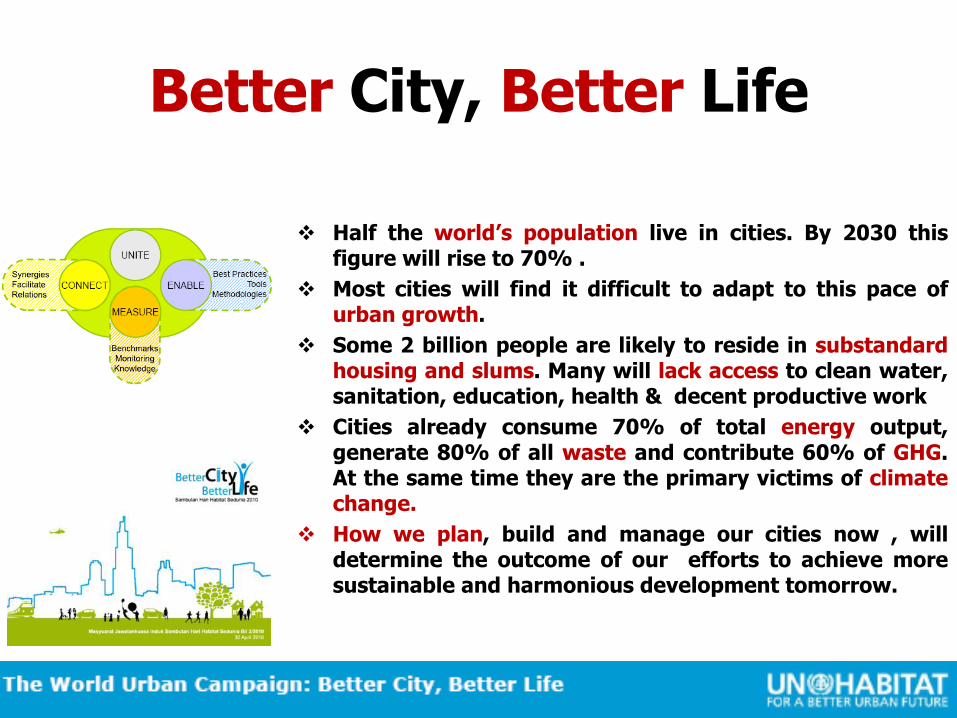
Better City, Better Life
Half the world’s population live in cities. By 2030 this figure will rise to 70% .
Most cities will find it difficult to adapt to this pace of urban growth.
Some 2 billion people are likely to reside in substandardhousing and slums. Many will lack access to clean water, sanitation, education, health & decent productive work
Cities already consume 70% of total energy output, generate 80% of all waste and contribute 60% of GHG. At the same time they are the primary victims of climate change.
How we plan, build and manage our cities now , will determine the outcome of our efforts to achieve more sustainable and harmonious development tomorrow.

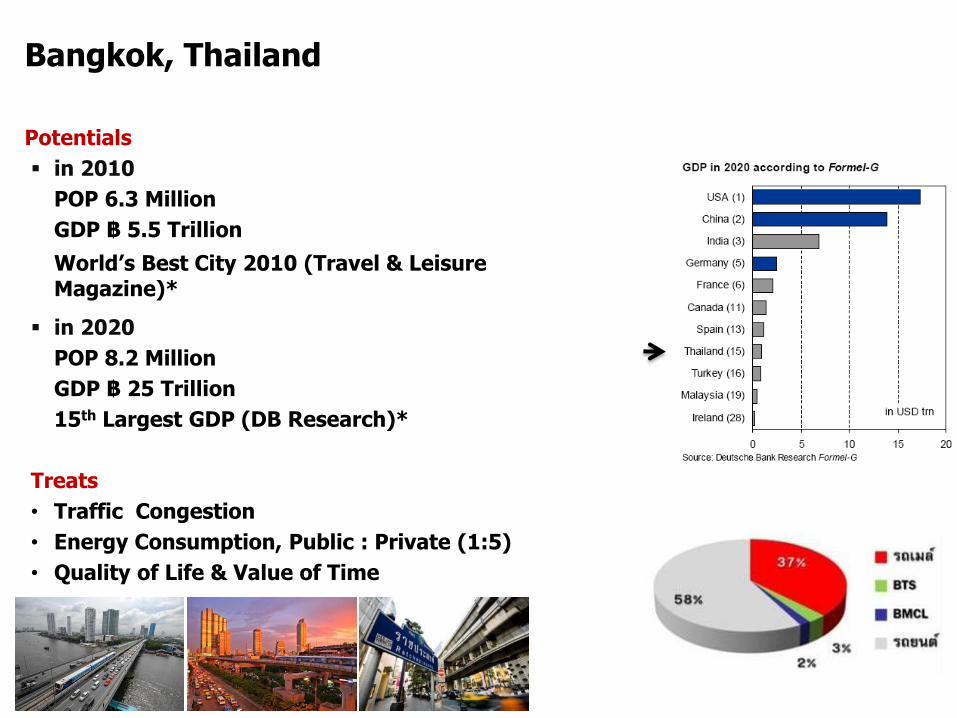
Bangkok, Thailand
Potentials
in 2010
POP 6.3 Million
GDP ฿ 5.5 Trillion
World’s Best City 2010 (Travel & Leisure Magazine)*
in 2020
POP 8.2 Million
GDP ฿ 25 Trillion
15th Largest GDP (DB Research)*
Treats
• Traffic Congestion
• Energy Consumption, Public : Private (1:5)
• Quality of Life & Value of Time

Traffic in Bangkok

Transport Problems in Bangkok
Safety & Accident
Level of Service
Law Enforcement

Solutions
“Road for Transport People not Vehicles”Average passenger per car in Bangkok 1.3 passengers

8
Urban Management & Planning

Sustainable development
Solution:• Promote Public Transport• Satellite Towns & Proactive Urban planning • Connection facilities & Common ticket
• Demand Mgt. : Road Pricing, Limited Parking Space
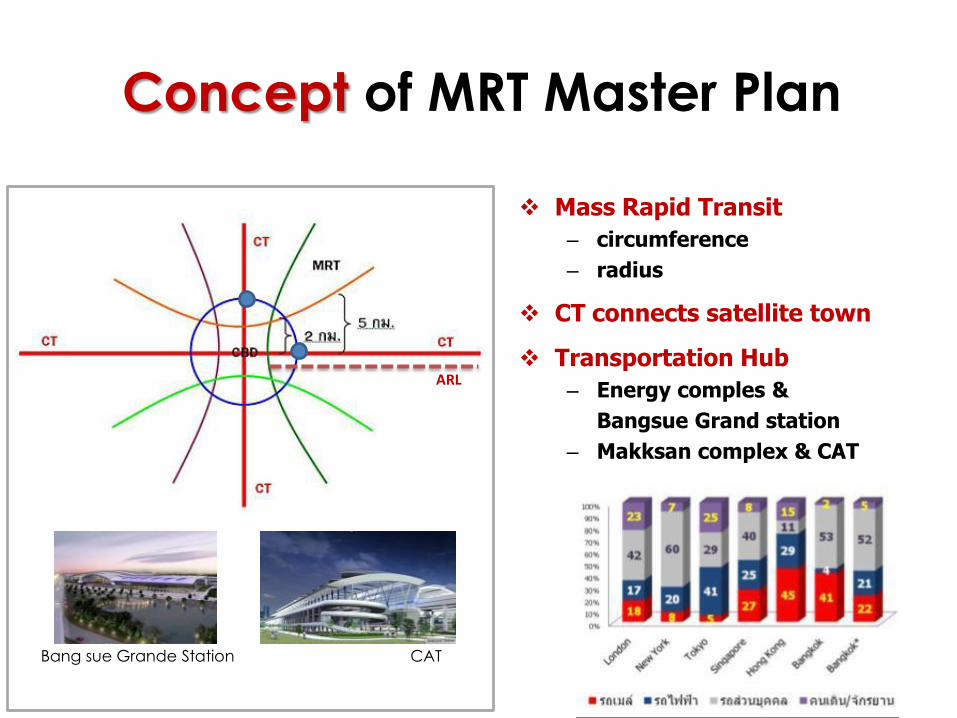
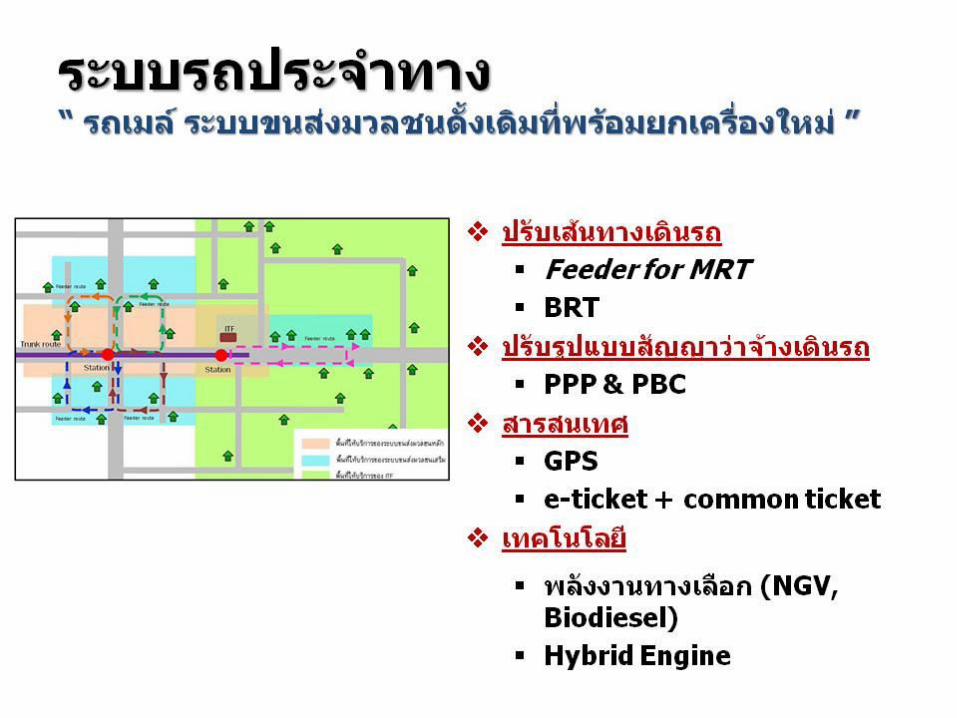
Concept of MRT Master Plan
Mass Rapid Transit
– circumference
– radius
CT connects satellite town
Transportation Hub
– Energy comples &
Bangsue Grand station
– Makksan complex & CAT
Bang sue Grande Station CAT
ARL
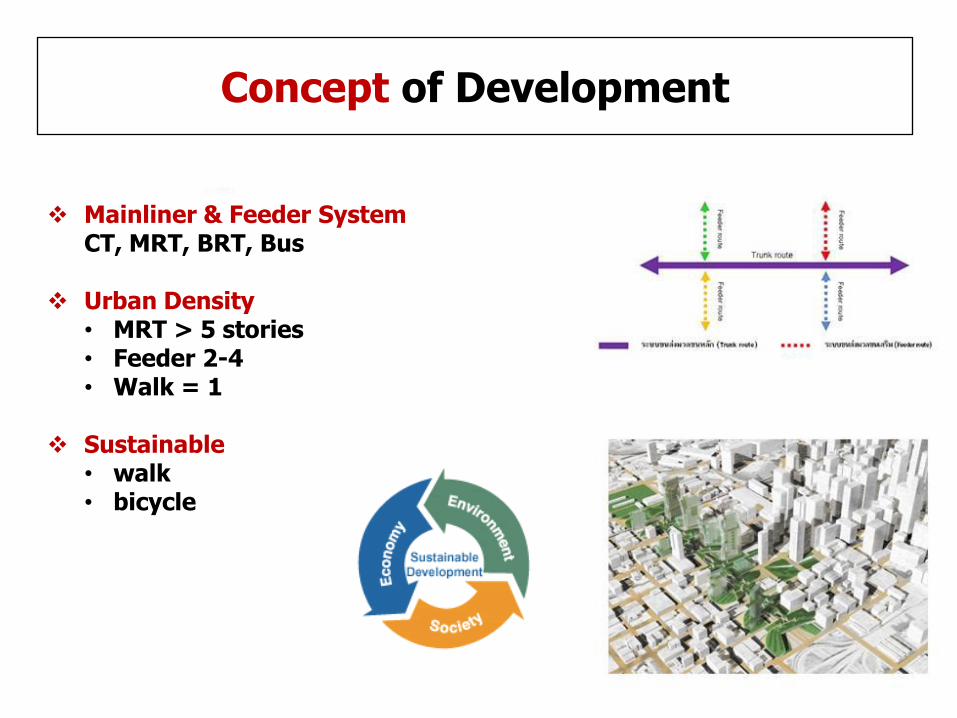
Concept of Development
Mainliner & Feeder SystemCT, MRT, BRT, Bus
Urban Density• MRT > 5 stories • Feeder 2-4• Walk = 1
Sustainable• walk• bicycle

12
Cabinet resolution 9 March 2010- approved MMAP
- start urgent phase projects ,155 km.
0
5
10
15
20
0-5 5-10 10-20
ม ร ย
ม ม
ร ย นย ม ม
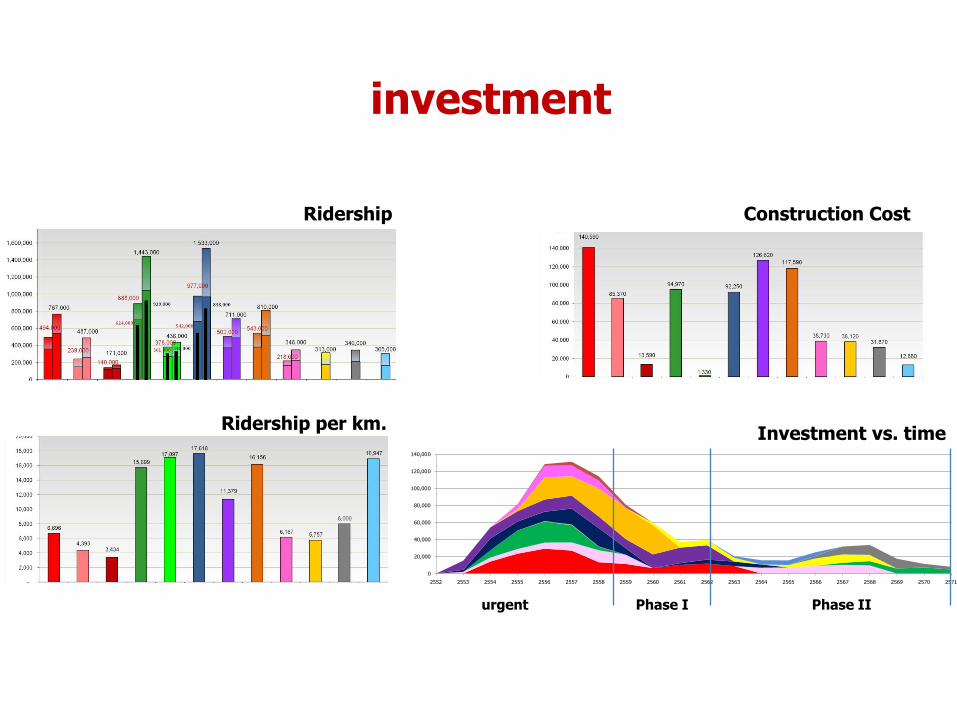
investment
Ridership Construction Cost
Ridership per km.
0
20 000
40 000
60 000
80 000
100 000
120 000
140 000
2552 2553 2554 2555 2556 2557 2558 2559 2560 2561 2562 2563 2564 2565 2566 2567 2568 2569 2570 2571
Airport Rail Link
Investment vs. time
urgent Phase I Phase II

Green Line (Sky Train) 24 km
Blue Line (Underground) 20 km
Light Green Line Extension
ต สิน- ยนใหญ่
2 2 km
Airport Rail Link 28 5 km
Service & Operating 74 5 km
Light Green Line Extension
ยนใหญ-่บ ห ้
5 3 km
Dark Green Line Extension
ส ข ย ่ นนุ -แบริ
5 25 km
Purple Line 23 km
Red Line Commuter Train
(Bangsue-Talingchun)
15 km
Under Construction 48.6 km
0 2 5 10กม.Km.
Red Line Commuter Train
(Bangsue Rangsit)
36 km Bidding
Red Line Commuter Train
(Missing Link)
16.5 km *2012
4th Q
Dark Green Line Extension
(north)
11.4 km 2011
1st Q
Dark Green Line Extension
(South)
12.8 km 2011
1st Q
Prepare Bidding
Urgent Phase :145 km
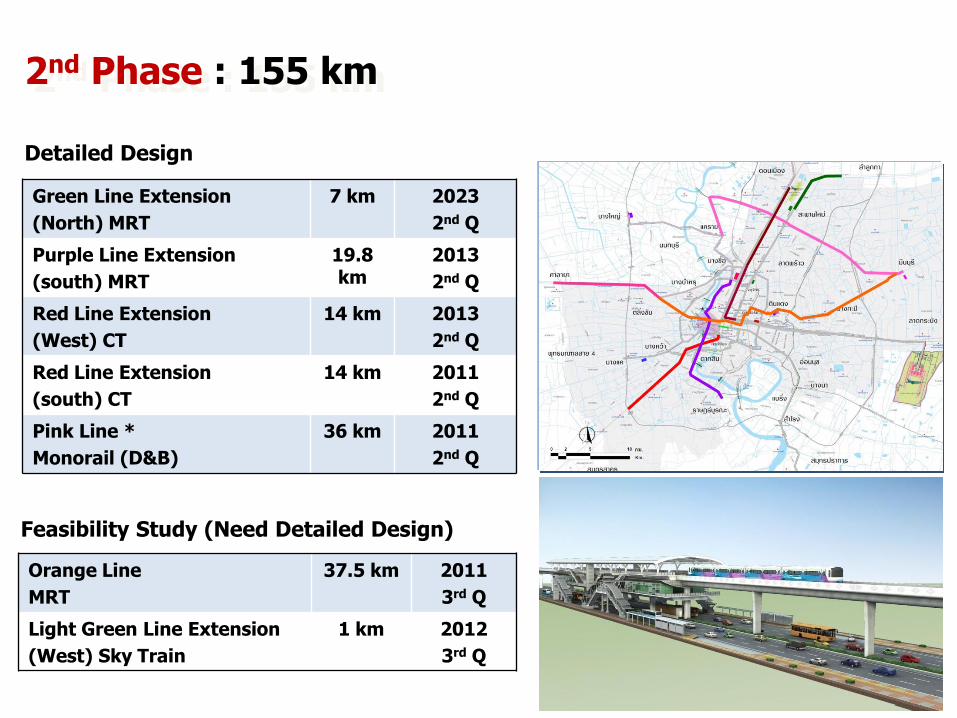
Green Line Extension
(North) MRT
7 km 2023
2nd Q
Purple Line Extension
(south) MRT
19.8 km
2013
2nd Q
Red Line Extension
(West) CT
14 km 2013
2nd Q
Red Line Extension
(south) CT
14 km 2011
2nd Q
Pink Line *
Monorail (D&B)
36 km 2011
2nd Q
Detailed Design
Feasibility Study (Need Detailed Design)
Orange Line
MRT
37.5 km 2011
3rd Q
Light Green Line Extension
(West) Sky Train
1 km 2012
3rd Q
2nd Phase : 155 km
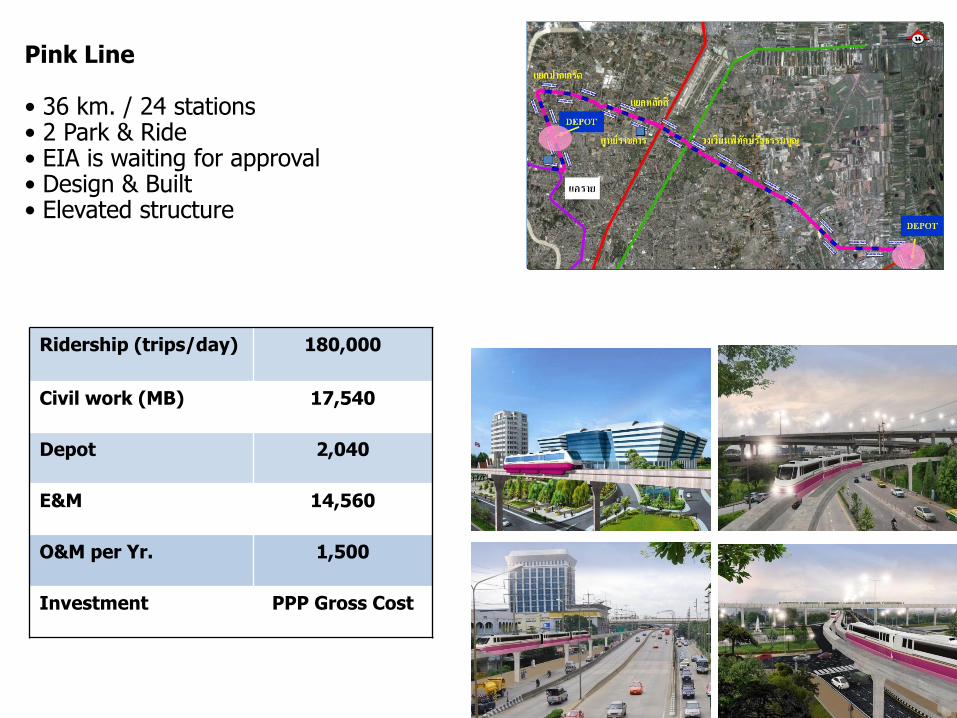
Pink Line
• 36 km. / 24 stations• 2 Park & Ride • EIA is waiting for approval• Design & Built• Elevated structure
Ridership (trips/day) 180,000
Civil work (MB) 17,540
Depot 2,040
E&M 14,560
O&M per Yr. 1,500
Investment PPP Gross Cost

Average Speed 30 km/hrHeadway 5 min (peak hour)Capacity 80 passengers/busFare ฿10-20


High-speed TrainIn Thailand
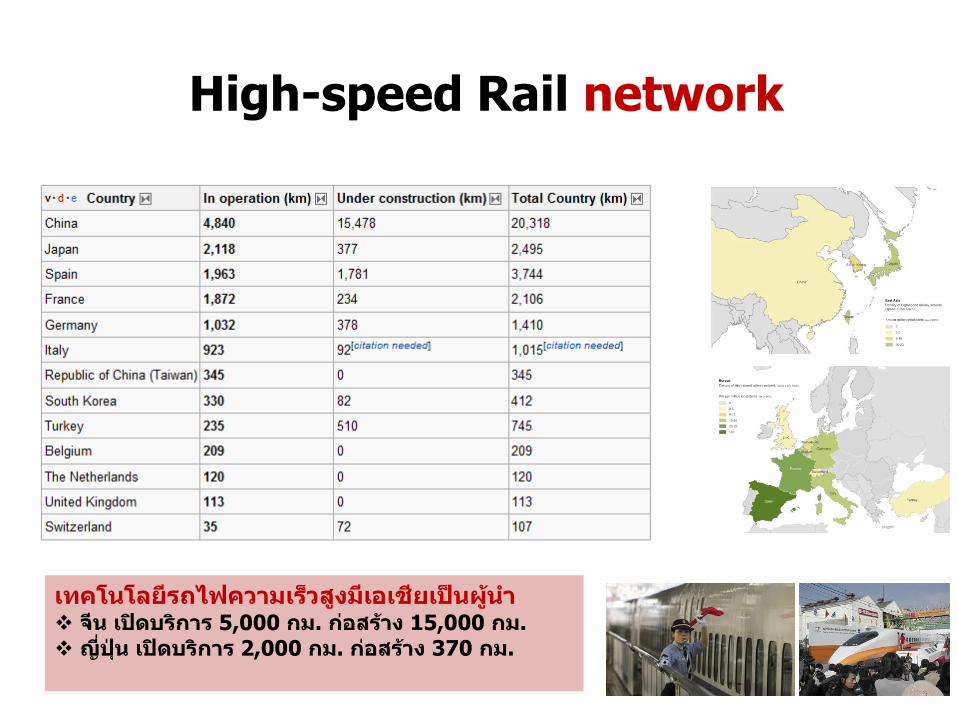
High-speed Rail network
ท โนโ ย รถไฟ ม ร ส ม ย ป็นผ ้น น ปิดบริ ร 5,000 ม ่ สร้ 15,000 ม ญ ปุ่น ปิดบริ ร 2,000 ม ่ สร้ 370 ม

When should we invest High-speed Train?
• Demand Lead
“ม ม รญิท รษฐ ิ พ ย พ แ ้ ึ ทุนโ ร สร้ พ ้นฐ น” ่น
รณ ญ ปุ่น ม มต ้ ร ดินท ร ห ่ Tokyo แ Osaka ส ม น ิน ม ุ ร บิน ึ ได้ ่สร้ Shinkansen ึ ไม่ม ม ส ย
• Supply Lead
“โ ร สร ้ พ น้ฐ นน ม ริญท รษฐ ิ ม ส ่ ม ”
รณ น สร้ รถไฟ ม ร ส ม ม ส ญั แ ร มน มท ส ด ม ซึ รขย ยต ัท รษฐ ิ ข ม แ ปร ท
ม ม ส ย แต่ พิ ม ร ตบิโตท รษฐ ิ

รมต รถไฟ นปรับ ด ม ร รถไฟหั ร สุน
“ผ ้ น ย รส นั นปร สัมพันธ ิ ร ม ข ร ทร รถไฟ น ย ห ั หย่ ผิ ่ ร ห ่ ให้สัมภ ษณ ับนิตยส ร ไ (第一财经) ม ันท 13 ม ย ่ ส หรับรถไฟ ม ร ส ทั้ หมดท สร้ ขึ้นใหม่ ปรับ ัตร ร 350 ม ม ป็น300 ม ม ” พ 1 ด ่ โดยส ร พิ ม ร ข้ ถึ ข ผ ้โดยส ร 2 ด ม ส ย ุบัติ หตุ ท โนโ ย
Challenging issues:1 Passengers VS Fare2 Technology VS Investment3. Local assembly VS Safety
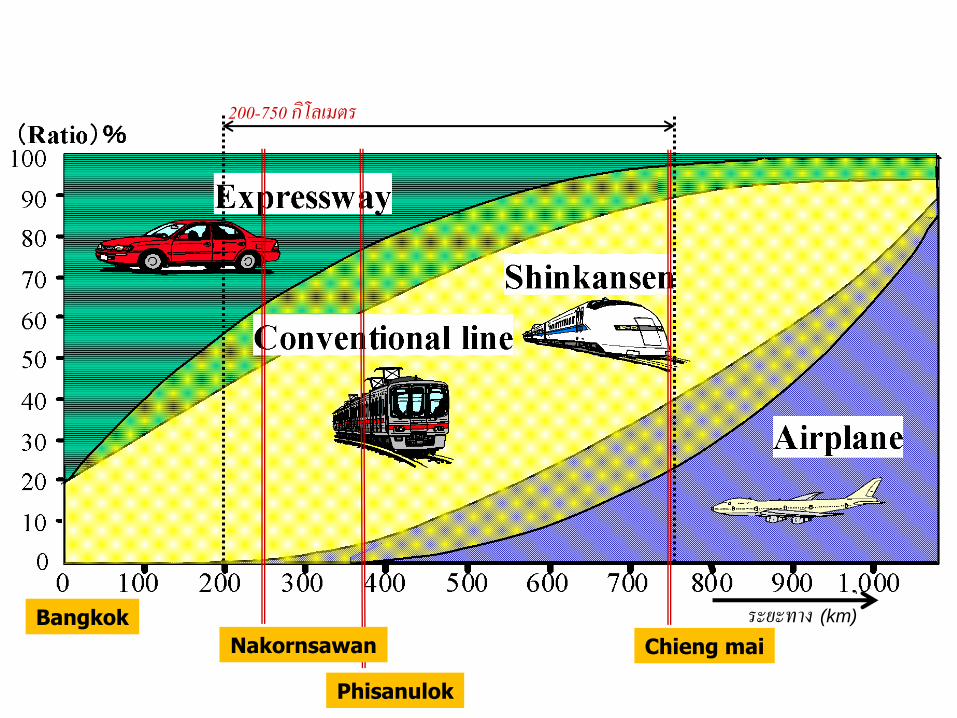
Chieng mai
Phisanulok
Nakornsawan
Bangkok ระยะทาง (km)
200-750 กิโลเมตร
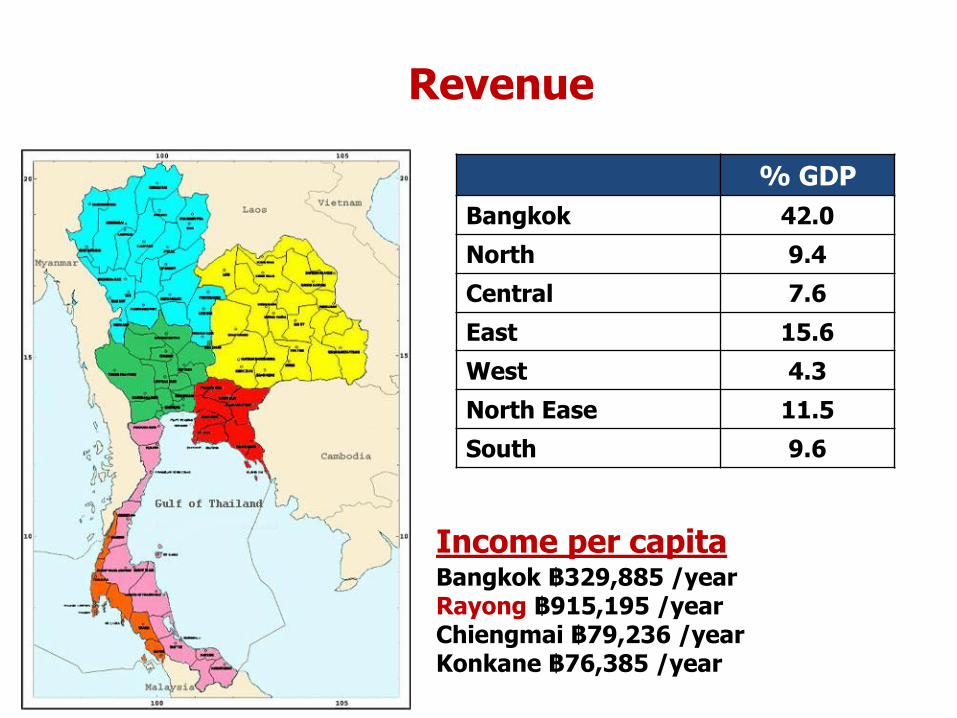
% GDP
Bangkok 42 0
North 9 4
Central 7 6
East 15 6
West 4 3
North Ease 11 5
South 9 6
Income per capitaBangkok ฿329,885 yearRayong ฿915,195 yearChiengmai ฿79,236 year Konkane ฿76,385 year
Revenue

ระยอง
ไป ปาดังเบซาร์
อุบลราชธานี
เชียงใหม่
1
คุนหมิง
2
3
4
5
นคราชสีมา
หนองคาย
No Line km ridership
per dayEIRR FIRR
1 Bkk – Nongkuy 615 41,000 17.76 31.93
2 Bkk -Padangbeaesa 985 44,200 15.42 32.64
3 Bkk – Rayong 330 12,800 12.32 22.49
4 Bkk – chiengmai 745 34,800 13.58 23.53
assumption :*
PPP Gross cost
fare ฿1 6 km increase every 5th year 2 5% annually
Discount rate 5%
concession period 30 Yrs + 7 Yrs Construction
Thank you


