
P R E S E N TAT I O N F O R
Utah Association of Orthodontists
Friday –February 26, 2016
Copyright 2016. All rights reserved.
The Financial Life Cycle of the Orthodontist
Business & Personal Financial Planning Strategies for Dental Professionals

Cambridge Wealth Counsel
Counsel . Plan. Prosper.
Robert Hockett , CFP®
robert@cwcounsel .comw w w. c a m b r i d ge we a l t h co u n s e l . co m
8 0 1 - 7 83 - 2 2 4 1
O f f i ce s i n A t l a n t a a n d S a l t L a ke C i t y- S e r v i n g C l i e n t s Na t i o nw i d e -
Copyright 2016. All rights reserved.

Our Firm
• Fee-Only® Fiduciary—Comprehensive Wealth Management
• Founded in 1996
• Clients in 16 states—over 52% are licensed professionals
• Advisors have ~17 years of experience
Who we are » 1. Ortho Financial Life-Cycle » 2. Client Case Studies » 3. Audience Questions
Robert Hockett Barry Kaplan Brandy Wright

Our Dental Clients
Licensed professionals who desire to work with trusted experts to accomplish their most important personal, family and business goals—without conflicts of interest.
•Practice Types
• General dentists
• Specialists: Ortho, Endo, Pedo, Perio, Pros, Oral Surgery
•Financial Ranges for Dentists
• Personal Net Income: $225K to $1.35MM
• Total Net Worth: Generally $500K to $12MM
Who we are » 1. Ortho Financial Life-Cycle » 2. Client Case Studies » 3. Audience Questions

Our Wealth Services
• Goal setting• Life and career coaching• Cash flow analysis• Insurance review• Tax planning• Estate planning• Charitable giving
• Investment management• Retirement planning• Financing negotiation• Business real estate consulting• Strategic practice planning • Dental practice purchase
Who we are » 1. Ortho Financial Life-Cycle » 2. Client Case Studies » 3. Audience Questions

“5 Star Wealth Manager
Best In Client Satisfaction”Atlanta Magazine, 2006 – 2015
“Top Fee-Only Firms” Utah Business , 2011
“ Top 10 Fee-Only Firms” Atlanta Business Chronicle. 2004 - 2012
Recognition
Who we are » 1. Ortho Financial Life-Cycle » 2. Client Case Studies » 3. Audience Questions
Media Coverage
Who we are » 1. Ortho Financial Life-Cycle » 2. Client Case Studies » 3. Audience Questions

Presentation Overview
1. The Financial Life-Cycle of the Orthodontist
2. Client Case Studies
3. Audience Questions
Copyright 2016. All rights reserved.

Copyright 2016. All rights reserved.
Part 1.The Financial Life-Cycle of the
Orthodontist
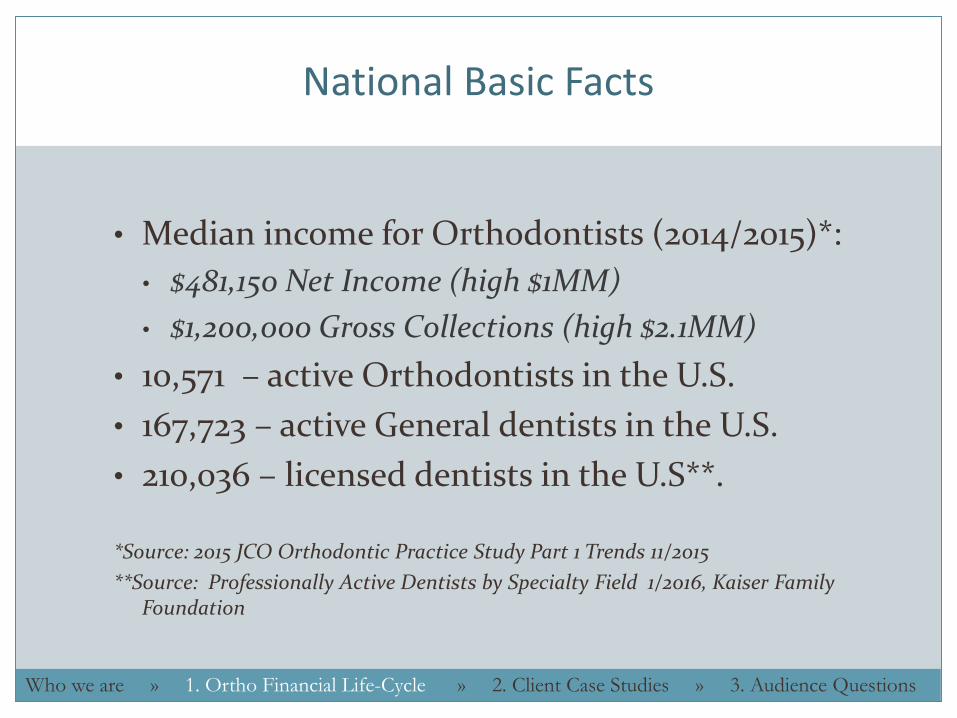
National Basic Facts
• Median income for Orthodontists (2014/2015)*:
• $481,150 Net Income (high $1MM)
• $1,200,000 Gross Collections (high $2.1MM)
• 10,571 – active Orthodontists in the U.S.
• 167,723 – active General dentists in the U.S.
• 210,036 – licensed dentists in the U.S**.
*Source: 2015 JCO Orthodontic Practice Study Part 1 Trends 11/2015
**Source: Professionally Active Dentists by Specialty Field 1/2016, Kaiser Family Foundation
Who we are » 1. Ortho Financial Life-Cycle » 2. Client Case Studies » 3. Audience Questions
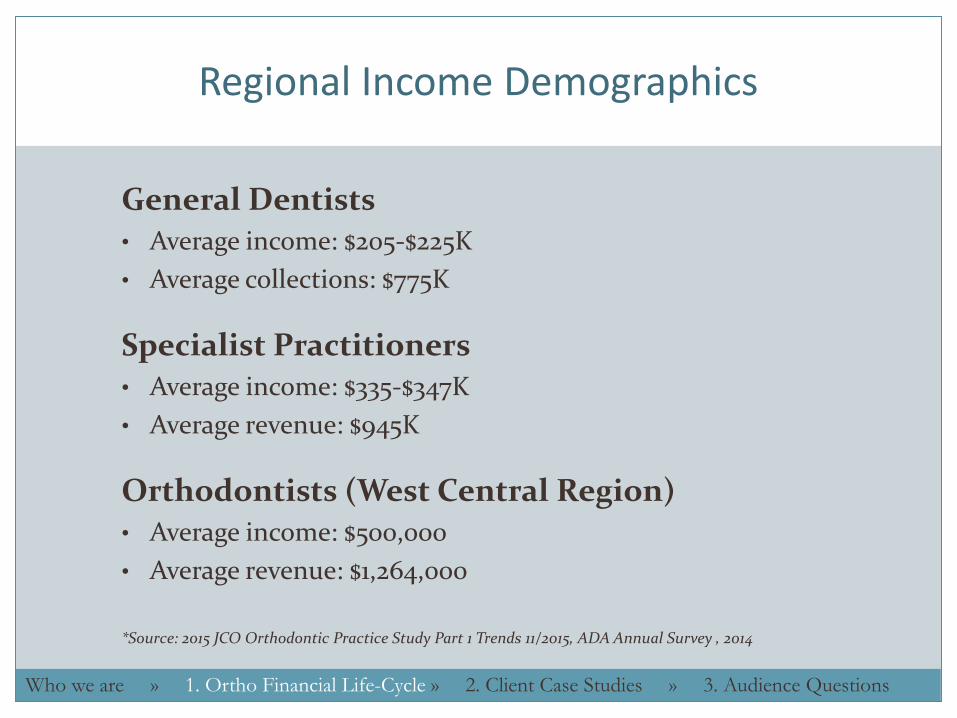
Regional Income Demographics
General Dentists• Average income: $205-$225K
• Average collections: $775K
Specialist Practitioners• Average income: $335-$347K
• Average revenue: $945K
Orthodontists (West Central Region)• Average income: $500,000
• Average revenue: $1,264,000
*Source: 2015 JCO Orthodontic Practice Study Part 1 Trends 11/2015, ADA Annual Survey , 2014
Who we are » 1. Ortho Financial Life-Cycle » 2. Client Case Studies » 3. Audience Questions

Local Demographics
Utah Dental Practitioner Statistics: 1,946• 97.3% male, 2.7% female
• 1,538 General Dentists
• 137 Orthodontists
• 11:1 Utah Ratio of Dentists to Orthodontists
• 16:1 National Ratio of Dentists to Orthodontists
• 1,600 patients per dentist
Source: American Dental Association, 2014
Source: Professionally Active Dentists by Specialty Field 1/2016, Kaiser Family Foundation
Who we are » 1. Ortho Financial Life-Cycle » 2. Client Case Studies » 3. Audience Questions

Big Dental Trends
• Retirement Age Extends (61/68/75)
• Debt Profile 350/500/950K in Student Debt
• Solo vs. Group Practice (30% Group Now)
• Corporate Dentistry
• Technology War –Expensive –Narrows Gap GP/SP
• Accepted Services “Creep”, Weekend Ortho, Invisilign
• Perceptions of Retirement Spending –too Low for 60% of dentists
• Govt Regs – 2013 HIPPA Omnibus Final Rule
• Required Agreements w/Vendors / 250-500K Fines
• Mandatory Disclosure for Cybersecurity breach (lost iPad)
• All computers recommended encrypted
• Be very careful and become compliant (1/24/2013)
Who we are » 1. Ortho Financial Life-Cycle » 2. Client Case Studies » 3. Audience Questions

Where do you fit in?
Who we are » 1. Ortho Financial Life-Cycle » 2. Client Case Studies » 3. Audience Questions

Financial Life-Cycle: Stages
=
Professional Adolescence
Professional Maturity
Full Financial Freedom
Target Ages 28-40 35-60 55-90
Milestones Build financial foundations
Wealth accumulation and advanced planning
Wealth harvest and preservation
Timeline
Who we are » 1. Ortho Financial Life-Cycle » 2. Client Case Studies » 3. Audience Questions
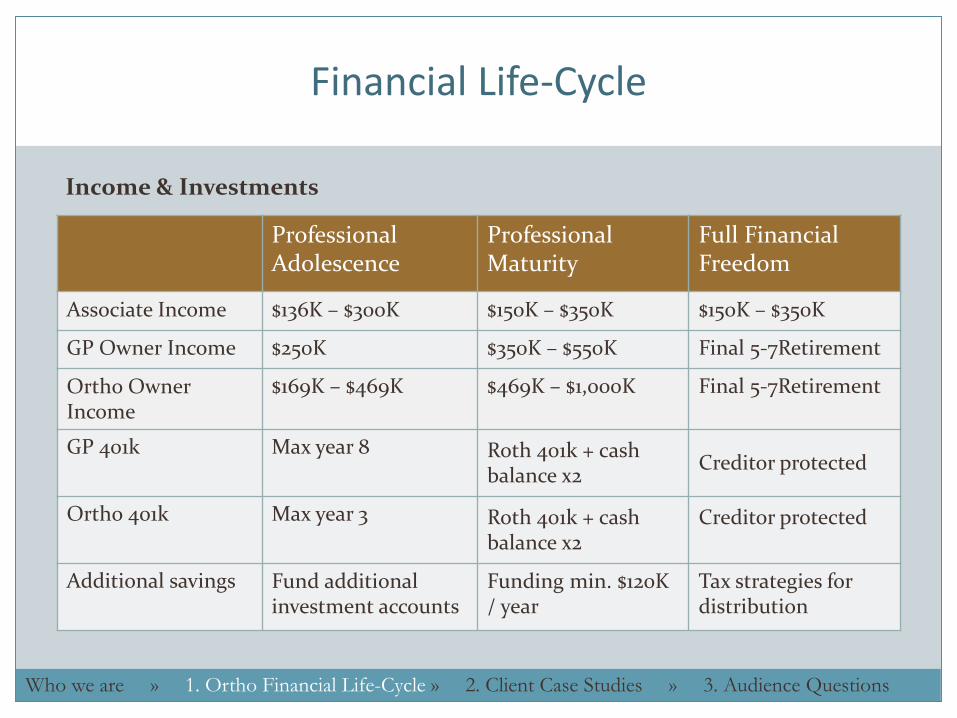
Financial Life-Cycle
=
Professional Adolescence
Professional Maturity
Full Financial Freedom
Associate Income $136K – $300K $150K – $350K $150K – $350K
GP Owner Income $250K $350K – $550K Final 5-7Retirement
Ortho Owner Income
$169K – $469K $469K – $1,000K Final 5-7Retirement
GP 401k Max year 8 Roth 401k + cash balance x2
Creditor protected
Ortho 401k Max year 3 Roth 401k + cash balance x2
Creditor protected
Additional savings Fund additional investment accounts
Funding min. $120K / year
Tax strategies for distribution
Income & Investments
Who we are » 1. Ortho Financial Life-Cycle » 2. Client Case Studies » 3. Audience Questions

Financial Life-Cycle:
=
Professional Adolescence
Professional Maturity
Full Financial Freedom
Housing Careful, start modest
Move to dream home & pay it down
Mortgage paid off
Student Loans Student loan interest non-deductible
Debt paid off Student loans paid off
Personal Debt
Who we are » 1. Ortho Financial Life-Cycle » 2. Client Case Studies » 3. Audience Questions

Financial Life-Cycle
=
Professional Adolescence
Professional Maturity
Full Financial Freedom
Business: Startup 10-15 year amort. Debt paid off 5-7 years – prep sale
Business: Buy-in 10-15 year amort. Debt paid off Prepare for sale to partners
Business: Purchase 10-15 year amort. Debt paid off 5-7 years – prep sale
Commercial Property
Save down payment
Pay down building Building paid off –rent to buyer
Business Debt
Who we are » 1. Ortho Financial Life-Cycle » 2. Client Case Studies » 3. Audience Questions

Why Stages?
• The three stages represent specific financial levels of progress with the goal to transition through the levels “on time” or early.
• The penalty for transition delay:• Financial hardship for family
• Additional Broad Pressure:• Increasing supply of “practitioners” (more grads + later
retirement)
• Technology War, Pricing Pressure, Corporate Practices
Who we are » 1. Ortho Financial Life-Cycle » 2. Client Case Studies » 3. Audience Questions
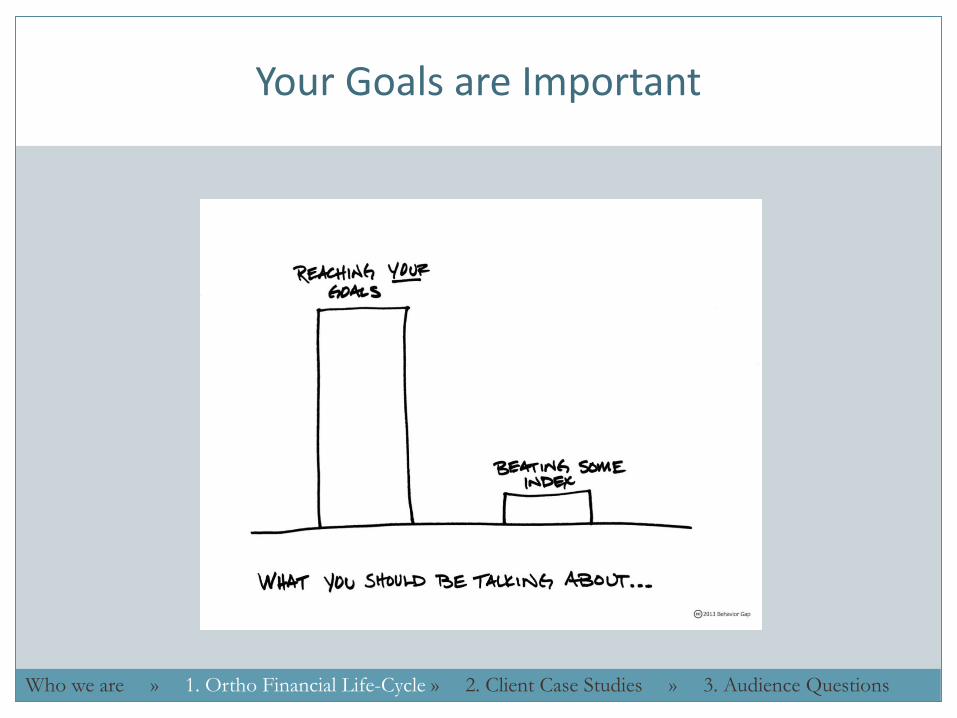
Your Goals are Important
Who we are » 1. Ortho Financial Life-Cycle » 2. Client Case Studies » 3. Audience Questions

Where do you fit in?
Lack of knowledge can often be a hurdle in reaching our hard fought goals
By helping our clients through the three stages we have developed tools, techniques and strategies to speed up the transition process
Read our comprehensive guidebook for Orthodontic professionals—available soon!
Who we are » 1. Ortho Financial Life-Cycle » 2. Client Case Studies » 3. Audience Questions
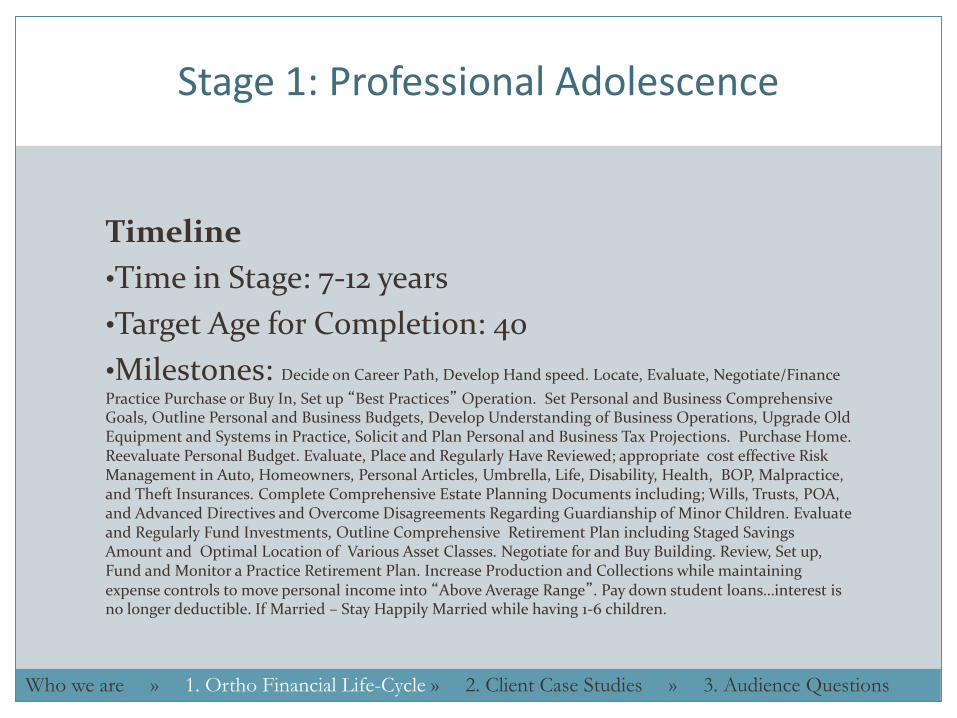
Stage 1: Professional Adolescence
Timeline
•Time in Stage: 7-12 years
•Target Age for Completion: 40
•Milestones: Decide on Career Path, Develop Hand speed. Locate, Evaluate, Negotiate/Finance
Practice Purchase or Buy In, Set up “Best Practices” Operation. Set Personal and Business Comprehensive Goals, Outline Personal and Business Budgets, Develop Understanding of Business Operations, Upgrade Old Equipment and Systems in Practice, Solicit and Plan Personal and Business Tax Projections. Purchase Home. Reevaluate Personal Budget. Evaluate, Place and Regularly Have Reviewed; appropriate cost effective Risk Management in Auto, Homeowners, Personal Articles, Umbrella, Life, Disability, Health, BOP, Malpractice, and Theft Insurances. Complete Comprehensive Estate Planning Documents including; Wills, Trusts, POA, and Advanced Directives and Overcome Disagreements Regarding Guardianship of Minor Children. Evaluate and Regularly Fund Investments, Outline Comprehensive Retirement Plan including Staged Savings Amount and Optimal Location of Various Asset Classes. Negotiate for and Buy Building. Review, Set up, Fund and Monitor a Practice Retirement Plan. Increase Production and Collections while maintaining expense controls to move personal income into “Above Average Range”. Pay down student loans…interest is no longer deductible. If Married – Stay Happily Married while having 1-6 children.
Who we are » 1. Ortho Financial Life-Cycle » 2. Client Case Studies » 3. Audience Questions

Stage 1: Professional Adolescence - 28-40
Beginning of phase End of phase
Associate income $136,000 – $300,000 $180,000 – $300,000
Owner income $169,000 – $469,000 $350,000 – $680,000
Housing debt $450,000 $750,000 (home #2)
Student debt $390,000 (max) $150,000 (min.)
Business debt (start-up) $500,000 $138,000 (12 yrs 5.5%)
Business debt (buy-in) $600,000 $166,000 (12 yrs 5.5%)
Business debt (purchase) $850,000 $247,000 (12 yrs 5.5%)
Business debt (property) $950,000 $606,000 (7 yrs 5.5%)
401k (GP) $0/year $53,000/year +$18K
Additional savings $15,000/year $120,000/year
Who we are » 1. Ortho Financial Life-Cycle » 2. Client Case Studies » 3. Audience Questions
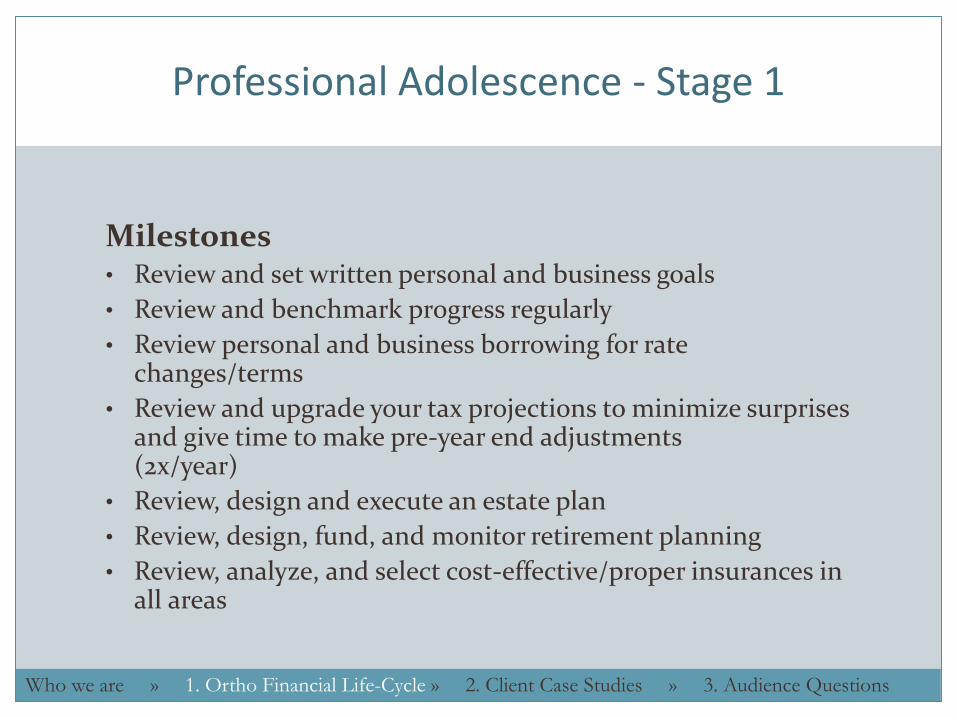
Professional Adolescence - Stage 1
Milestones• Review and set written personal and business goals
• Review and benchmark progress regularly
• Review personal and business borrowing for rate changes/terms
• Review and upgrade your tax projections to minimize surprises and give time to make pre-year end adjustments (2x/year)
• Review, design and execute an estate plan
• Review, design, fund, and monitor retirement planning
• Review, analyze, and select cost-effective/proper insurances in all areas
Who we are » 1. Ortho Financial Life-Cycle » 2. Client Case Studies » 3. Audience Questions
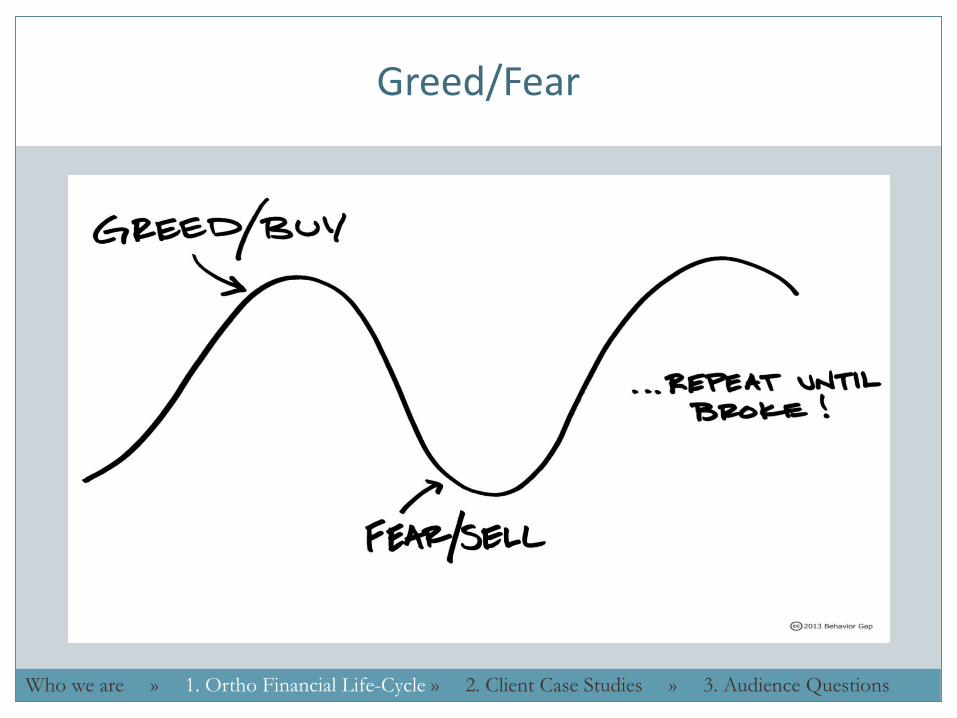
Greed/Fear
Who we are » 1. Ortho Financial Life-Cycle » 2. Client Case Studies » 3. Audience Questions

Stage 1: Professional Adolescence
Key Strategies• Eliminate all undisclosed conflicts of interest
• Have Fee-Only Fiduciary assemble an Expert Team that will collaborate well and is dedicated to your personal and business success:
• Comprehensive wealth manager, corporate attorney, estate planning attorney, CPA, bookkeeper, seasoned insurance agency, third party custodian for investments
Who we are » 1. Ortho Financial Life-Cycle » 2. Client Case Studies » 3. Audience Questions

Stage 1: Professional Adolescence
Key Strategies• Four key areas of focus in years 1-7
1. Manage spending
2. Avoid non-productive debt (debt for toys)
3. Focus on optimizing business / learning the ropes
4. Save and invest aggressively from early on
• Common mistakes
• Overspending: Pent up demand of dentist & spouse IS REAL
• Over-buy on first house
Who we are » 1. Ortho Financial Life-Cycle » 2. Client Case Studies » 3. Audience Questions

Stage 2: Professional Maturity
Timeline
•Years in Stage: 20-25 years
•Target Ages in Stage: 35-60
•Milestones: Continue with review and monitoring of changing needs in the areas
of personal and business goals. Personal and business budgets and benchmarks. This stage focuses on building on the Financial Foundation created in Stage 1. Laser focus on harnessing business cash flow to complete debt payoff of practice, equipment, and buildings and build personal wealth. Student loans are retired in this Stage. Investment Wealth will go from $1-8 Million in liquid assets as rigorous funding of the 401k plan/ DB Plan and annual Taxable Investment Targets are reached. Practice revenue target is 3rd
and 4th Quartile. Ortho Income Target $469K-$1,000K.
Who we are » 1. Ortho Financial Life-Cycle » 2. Client Case Studies » 3. Audience Questions

Stage 2: Professional Maturity - 35-60
Beginning of phase End of phase
Associate income $180,000 – $300,000 $200,000 – $350,000
Owner income $467,000 – $680,000 $469,000 – $1,000,000
Housing debt $750,000 (home #2) $400,000
Student debt $150,000 (min.) $0
Business debt (start-up) $138,000 (12 yrs 5.5%) $0
Business debt (buy-in) $166,000 (12 yrs 5.5%) $0
Business debt (purchase) $247,000 (12 yrs 5.5%) $0
Business debt (property) $606,000 (7 yrs 5.5%) $0
401k (GP) $53K/year + $18K $59K/year + $18K
Additional savings $50,000 – $120,000/year $120,000/year+
Who we are » 1. Ortho Financial Life-Cycle » 2. Client Case Studies » 3. Audience Questions

Stage 2: Professional Maturity
Milestones• Track business cash flow (33% of orthodontists have a written
practice budget*)
• Set annual investment and capital goals to harness cash to fund preset targets. As debt is paid off and more cash flows through both the business and personal accounts it becomes more crucial
• Review, analyze and monitor areas of tax, insurance, estate planning, retirement projections and investments regularly
* Source: 2015 JCO Orthodontic Practice Study Part 1 Trends, 11/2015
Who we are » 1. Ortho Financial Life-Cycle » 2. Client Case Studies » 3. Audience Questions

Stage 3: Full Financial Freedom
Timeline
•Years in Stage: 25-35 years
•Target Ages in Stage: 55-90
•Milestones: Wealth Harvesting and Preservation are the Milestones in Stage 3.
Continue with review and monitoring of changing needs in the areas of personal and business goals. Personal and business budgets and benchmarks. This stage focuses on preparing the business for sale and maximizing the net after tax amount. The net proceeds of sale are then invested in the taxable investment accounts. The Investment portfolio is sizeable and the asset allocation is managed for Wealth Harvesting and Inflation hedge. Monte Carlo Retirement Modeling is used to regularly back check probabilities of success in retirement. Downsize house -pay off all debt. Develop Personal and Family Legacy Goals.
Who we are » 1. Ortho Financial Life-Cycle » 2. Client Case Studies » 3. Audience Questions

Stage 3: Full Financial Freedom - 55-90
Beginning of Phase Retirement
Associate income $250,000 – $350,000 --
Owner income $469,000 – $1,300,000 --
Housing debt $400,000 Value: $1MM
Student debt $0 $0
Business debt (start-up) $0 Value: $950K – $1,600K
Business debt (buy-in) $0 Value: $950K – $1,600K
Business debt (purchase) $0 Value: $950K – $1,600K
Business debt (property) $0 Value: $750K – $1.5MM
401k (GP) $59K/year + $18K Value: $2.5MM – $4.5MM
Additional savings $85K – $120K annually Value: $2.8MM – $5.5MM
Who we are » 1. Ortho Financial Life-Cycle » 2. Client Case Studies » 3. Audience Questions

Stage 3: Full Financial Freedom
Key Strategy• Commercial Property Ownership/Practice Sale
• 50-60% of practitioners own their office/building
• Capital / Debt: $750K to $1.5 million
• Purchase 5+ years into practice. Pay off within 15-20 years
• Rent to buyer of practice for $5-$9K per month
• Practice Revenue of $1,250K = $937,000 Sales price.
• Sales prices range from 0.70 to 1.0 + X gross revenues
• The stronger / more profitable the practice the higher the multiple.
• Location, stable patients, net income , growth are key to value
Who we are » 1. Ortho Financial Life-Cycle » 2. Client Case Studies » 3. Audience Questions

A Word on Investments
• Stage 1 – Stage 3: Investments play an increasingly important role
• Retirement is about spending and monthly cash flow
• Pillars of full financial freedom:
• Investment accounts
• Commercial real estate
• Practice sale value
Who we are » 1. Ortho Financial Life-Cycle » 2. Client Case Studies » 3. Audience Questions
Copyright 2016 All rights reserved.
Part 2.Client Case Studies

Retirement
• Timing: 25 to 35 years in practice• Annual Spending: $150K to $240K (after tax)• Housing:
• No debt on house• Downsize at or in retirement
• Business: • Sell practice• Work part-time
• Investments: • $4 - $10 million in investment assets + commercial property
Who we are » 1. Ortho Financial Life-Cycle » 2. Client Case Studies » 3. Audience Questions

Retirement Projection #1
Dr. Alfred B. New: Assumptions• Married, 36 years old, retirement at 65, live to age 90• Retirement spending: $15K month ($180K annually)• Save $53K/year plus $18K/ year from age 35 until age 65• Sell practice for $850K before taxes ($637,500 after taxes)• 4 year college for 3 kids at $20K per year per child• Inflation: 3%• Pre-retirement returns: 8%• Post-retirement returns: 7%• Tax Rates 30/28%• Fat Tails
Who we are » 1. Ortho Financial Life-Cycle » 2. Client Case Studies » 3. Audience Questions

Retirement Projection #1 Monte Carlo Simulation – Case 1
Who we are » 1. Ortho Financial Life-Cycle » 2. Client Case Studies » 3. Audience Questions

Retirement Projection #1 and #2: Results
Dr. Alfred B. New Results•Projection #1
• Result in Monte Carlo Simulation: 74% success rate
•Projection # 2 • To achieve 94% success Dr. New must also save
$50K per year in taxable investment accounts from now until retirement (29 more years)
Retirement is about monthly spending after work ends
Who we are » 1. Ortho Financial Life-Cycle » 2. Client Case Studies » 3. Audience Questions

Retirement Projection #2 Save Additional $50K – Case 1
Who we are » 1. Ortho Financial Life-Cycle » 2. Client Case Studies » 3. Audience Questions
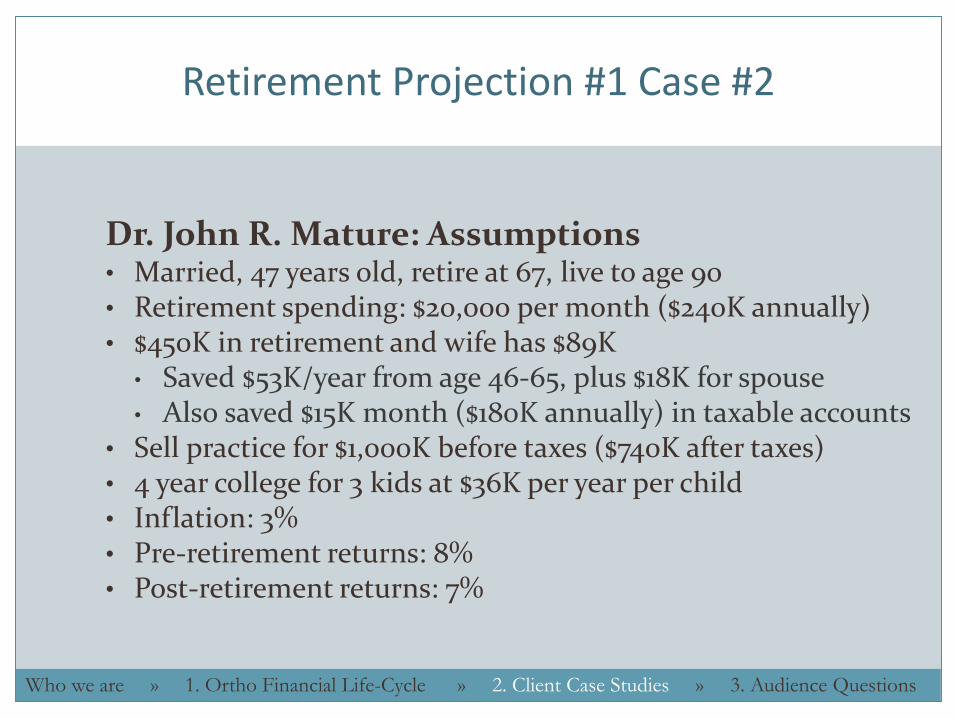
Retirement Projection #1 Case #2
Dr. John R. Mature: Assumptions• Married, 47 years old, retire at 67, live to age 90• Retirement spending: $20,000 per month ($240K annually)• $450K in retirement and wife has $89K
• Saved $53K/year from age 46-65, plus $18K for spouse• Also saved $15K month ($180K annually) in taxable accounts
• Sell practice for $1,000K before taxes ($740K after taxes)• 4 year college for 3 kids at $36K per year per child • Inflation: 3%• Pre-retirement returns: 8%• Post-retirement returns: 7%
Who we are » 1. Ortho Financial Life-Cycle » 2. Client Case Studies » 3. Audience Questions

Retirement Projection #1 Monte Carlo Simulation – Case 2
Who we are » 1. Ortho Financial Life-Cycle » 2. Client Case Studies » 3. Audience Questions

Retirement Projection #2 Results
Dr. John R. Mature Results• Results in Monte Carlo Simulation 91% success rate
Retirement is about monthly spend after work ends.
Who we are » 1. Ortho Financial Life-Cycle » 2. Client Case Studies » 3. Audience Questions

Another Word on Investments
• Investment returns in projections range from 7-8%
• The most sure way to fail in retirement is to let greed and fear or lack of focus control your investment strategy.
• We use institutional class mutual funds with
• Very low costs
• Tax efficient management
• Patient long term performance focus
Who we are » 1. Ortho Financial Life-Cycle » 2. Client Case Studies » 3. Audience Questions

Who we are » 1. Ortho Financial Life-Cycle » 2. Client Case Studies » 3. Audience Questions
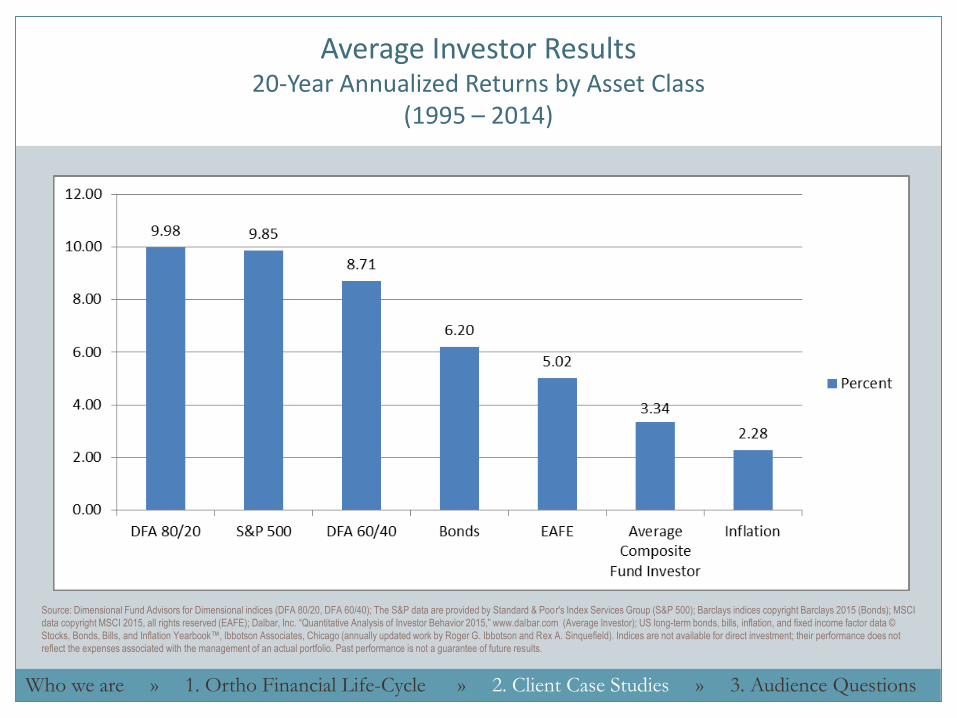
Average Investor Results20-Year Annualized Returns by Asset Class
(1995 – 2014)
Source: Dimensional Fund Advisors for Dimensional indices (DFA 80/20, DFA 60/40); The S&P data are provided by Standard & Poor's Index Services Group (S&P 500); Barclays indices copyright Barclays 2015 (Bonds); MSCI
data copyright MSCI 2015, all rights reserved (EAFE); Dalbar, Inc. “Quantitative Analysis of Investor Behavior 2015,” www.dalbar.com (Average Investor); US long-term bonds, bills, inflation, and fixed income factor data ©
Stocks, Bonds, Bills, and Inflation Yearbook™, Ibbotson Associates, Chicago (annually updated work by Roger G. Ibbotson and Rex A. Sinquefield). Indices are not available for direct investment; their performance does not
reflect the expenses associated with the management of an actual portfolio. Past performance is not a guarantee of future results.
Who we are » 1. Ortho Financial Life-Cycle » 2. Client Case Studies » 3. Audience Questions

Cambridge Wealth Counsel
WM=IC + AP + RMWealth Mgmt. = Investment Consulting + Advanced Planning + RM
• Investment Consulting—Fee-Only Fiduciary—No Conflicts of Interest
• Advanced planning
• Wealth enhancement
• Wealth protection
• Wealth transfer
• Charitable gifting
• Relationship management
• Expert team / client relationship management
Who we are » 1. Ortho Financial Life-Cycle » 2. Client Case Studies » 3. Audience Questions

Ortho - Client Case Study #1
• 15 years in practice, $275K net income per year
• Single, male, early 50’s, Southeast U.S.
• Associate for first 10 years of practice
• Poor location
• Management issues
• Overhead and staff costs too high
• Very average marketing
• Scheduling not optimized
Who we are » 1. Ortho Financial Life-Cycle » 2. Client Case Studies » 3. Audience Questions

Ortho- Client Case Study #2
• 23 years in practice, $650K income per year• Married, age 58, West Coast
• Owns building (paid off by retirement date)
• Purchased practice 21 years ago
• Tax optimized: • 401k $53K + $6K catch up + $24K spouse
• Saves / invests $84K per year in taxable accounts
• Vacation 6 weeks per year (one European vacation)
• Ends work day at 4:30 P.M.—will retire at 62
Who we are » 1. Ortho Financial Life-Cycle » 2. Client Case Studies » 3. Audience Questions

Ortho- Client Case Study #2
• 11 years in practice, $900K income per year • Net Income $900K per year – 2015
• Married, age 43, 4 kids, Southwest U.S.
• Business / Marketing undergraduate degree
• Cold start-up; $1M gross revenue by year four
• 401k plan: $53K per year + $18K for spouse
• Purchased $1 million building
• Saves $300K per year.
• Works four days a week
• Will be able to retire at age 60
Who we are » 1. Ortho Financial Life-Cycle » 2. Client Case Studies » 3. Audience Questions

New Regs for Combo 401K/Cash Balance Plans
IRS Revenue Regulation 2014-41• Since 2010 historic high degree of uncertainty surrounding such
plans:
• 2 main areas—of historic concern
• Employees covered
• 5 Years of “must fund” commitments
• That has now changed!!!!!!
• New Comparability—40% coverage requirement
• 5 Year Plan Level Commitment
• 2 Year Funding Commitment
• Dial in Contributions (fund/not fund)—Up or Down for remaining 3 years if constructed correctly.
Who we are » 1. Ortho Financial Life-Cycle » 2. Client Case Studies » 3. Audience Questions

Cash Balance Case Study #1
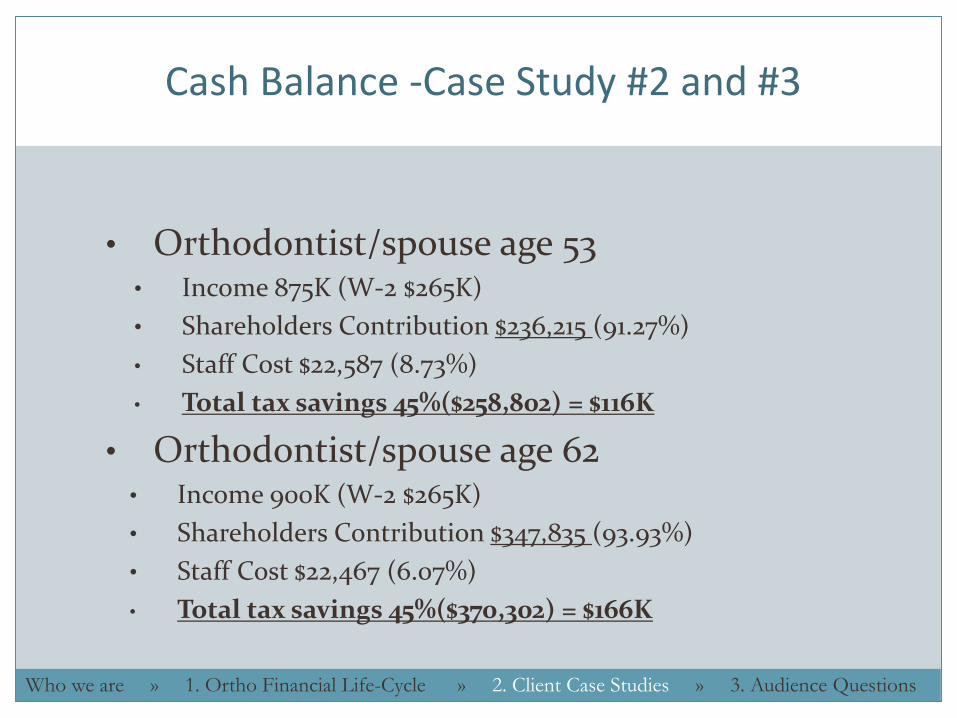
Cash Balance -Case Study #2 and #3
• Orthodontist/spouse age 53• Income 875K (W-2 $265K)
• Shareholders Contribution $236,215 (91.27%)
• Staff Cost $22,587 (8.73%)
• Total tax savings 45%($258,802) = $116K
• Orthodontist/spouse age 62• Income 900K (W-2 $265K)
• Shareholders Contribution $347,835 (93.93%)
• Staff Cost $22,467 (6.07%)
• Total tax savings 45%($370,302) = $166K
Who we are » 1. Ortho Financial Life-Cycle » 2. Client Case Studies » 3. Audience Questions

Conclusion
Copyright 2016. All rights reserved.
• Dental Practice can be both rewarding and challenging. Working with the right professional team in the right way will help you move through the 3 Stages of the Ortho Financial Life-Cycle in the most reasonable way - saving you time, frustration and money. Strong consistent progress brings peace of mind and a sense of satisfaction.
• To explore a deeper working relationship with our firm—sign up for a 1-hour one-on-one meeting for tomorrow between 9am – 3pm.
For other information about our firm visit www.cwcounsel.com or contact Robert Hockett at 801-783-2241 or [email protected]

Persistence
Copyright 2016. All rights reserved.
“Nothing in the world can take the place of persistence. Talent will not; nothing is more common than unsuccessful men with talent. Genius will not; unrewarded genius is almost a proverb. Education will not; the world is full of educated derelicts. Persistence and determination alone are omnipotent.”
– Calvin Coolidge

Copyright 2016. All rights reserved.
DisclosuresCambridge Wealth Counsel (“CWC”) is an SEC registered investment adviser with its principal place of business in the State of Georgia. Registration does not imply a certain level of skill or training. CWC may only transact business in those states in which it is notice filed, or qualifies for an exemption or exclusion from notice filing requirements.
This publication is provided for informational and educational purposes only. No information contained herein is to be construed as the provision of legal, tax, or personalized investment advice. Before making decisions with legal, tax, or accounting ramifications, you should consult the appropriate professionals for advice that is specific to your situation. Information contained herein is subject to change without notice, and should not be considered as a solicitation to buy or sell any security. Some portions of this publication include the use of forecasting tools. These are intended as informational aids solely for your convenience, and in no way should any client or prospective client interpret these aids as a method by which investment decisions should be made. We do not guarantee the accuracy of the information resulting from their use and disclaim all warranties, both express and implied, regarding their operation and use and from the information resulting therefrom. Certain statements contained herein are forward-looking statements which point to future possibilities. Due to known and unknown risks, other uncertainties and other factors, actual results may differ materially from the results portrayed in such forward-looking statements. The illustrative results presented regarding the likelihood of various investment outcomes in the future are hypothetical in nature, do not reflect actual investment results, and are not a guarantee of future results. Illustrative returns presented are not reflective of any specific product and do not consider the deduction of any fees or expenses that may be incurred by persons investing in specific products. Financial forecasts, rates of return, risk, inflation, and other assumptions have been used as the basis for the illustrative results presented. The illustrative results presented in no way reflect the performance of any CWC product or any account of any CWC client, which may vary materially from the results portrayed for various reasons, including but not limited to, the investment objectives, financial situations and financial needs of CWC clients; differences in products and investment strategies offered by CWC; and other factors relevant to the management of CWC client accounts.
Performance for composites and indices included in the Average Investor Results are provided for illustrative and educational purposes only. The “Quantitative Analysis of Investor Behavior 2015” (“QAIB”) measures the effects of investor decisions to buy, sell and switch into and out of mutual funds over short and long term timeframes and was conducted by an independent third party, Dalbar, Inc., a research firm specializing in financial services. QAIB uses data from the Investment Company Institute (ICI), Standard & Poor’s, Barclays Capital Index Products and proprietary sources to compare mutual fund investor returns to an appropriate set of benchmarks. Covering the period from January 1, 1985 to December 31, 2014, the study utilizes mutual fund sales, redemptions and exchanges each month as the measure of investor behavior. These behaviors reflect the “average investor.” Based on this behavior, the analysis calculates the “average investor return” for various periods. These results are then compared to the returns of respective indices.
The performance results for composites shown herein do not reflect the impact that material economic factors could have had on a portfolio manager’s decision-making process. For example, factors such as 1) timing of purchases and sales of securities, 2) length of time positions are held, 3) market and/or sector trends, 4) client restrictions, and/or 5) other unforeseen factors that could have had a material influence on the performance results of a client’s account if actual trading had taken place. Past performance may not be indicative of future results and the performance of a specific individual client account may vary substantially from the performance results of the indices presented herein, in part because client accounts may be allocated among several portfolios and different asset allocations based on individual clients’ preferences and circumstances. Additionally, investor performance will vary from the performance results presented based on the timing of their investments and capital contributions and withdrawals. CWC makes no representation that the results presented herein reflect the typical experience of a CWC client nor that current or prospective clients will experience similar results in comparable situations. Different types of investments involve varying degrees of risk, and there can be no assurance that any specific investment or investment strategy will be profitable or equal the results portrayed herein. The benchmark indices have been provided to allow for comparison with well-known and widely recognized benchmark indices and are not intended to directly correspond to any strategic allocation among asset classes that CWC has targeted for its current or prospective clients. It is not possible to directly invest in any benchmark index, as indices are hypothetical vehicles that serve as market indicators and do not account for the deduction of management fees or transaction costs generally associated with investable products, which otherwise have the effect of reducing the performance of an actual investment portfolio. CWC is not required to allocate a client’s portfolio among asset classes in accordance with the benchmark indices shown herein and may make tactical departures from target allocations in its discretion.

Copyright 2016. All rights reserved.
DisclosuresThe securities held in clients’ accounts following a particular strategy may differ significantly from the securities included in any benchmark indices shown herein, and the volatility of the funds may differ significantly from that of the benchmark indices. References to specific indices and composites are presented principally to illustrate CWC’s investment methodology or approach and are not being referenced to demonstrate CWC’s performance or investment results. The references to the indices and composites mentioned herein should not be considered as personalized investment advice and should not be considered as an endorsement, solicitation or recommendation to purchase or sell any security. CWC is under no obligation to hold any equity position for any time period and CWC’s current recommendations are subject to change at any time without notice. The Average Investor Results and its corresponding discussion herein should not be regarded as a complete analysis of the subject discussed. All expressions of opinion reflect the judgment of the authors as of the date of publication and are subject to change without prior written notice. Information included herein has been obtained from sources that CWC believes to be reliable; however, CWC cannot guarantee the accuracy of such information, assure its completeness, or guarantee that information will not change without notice. As such, CWC takes no responsibility for any such information incorporated herein prepared by any unaffiliated third party. All such information is provided solely for convenience purposes only and all users thereof should be guided accordingly. A description of each index discussed herein is available from us upon request.
Case studies are provided for illustrative purposes only and are meant to provide examples of CWC’s processes and methodologies. Past performance is no guarantee of future results. The results portrayed in case studies are not representative of all of CWC’s clients or clients’ experiences. No portion of this publication is to be interpreted as a testimonial or endorsement of CWC’s investment advisory services by any organization or entity referenced that CWC has worked with. Additionally, any references to current, past or prospective clients should not be considered representative of all of CWC clients or clients’ experiences with CWC, or an endorsement of CWC or the investment advisory services provided by CWC by any current, past or prospective client. It is not known whether any clients referenced approve or disapprove of CWC or the services the clients received from CWC. An individual’s experience may vary based on his or her individual circumstances and there can be no assurance that CWC will be able to achieve similar results in comparable situations.
Five Star Wealth Managers do not pay a fee to be included in the research or the final list of Five Star Wealth Managers. The Five Star award is not indicative of the wealth managers’ future performance. Wealth managers may or may not use discretion in their practice and therefore may not manage their clients’ assets. The inclusion of a wealth manager on the Five Star Wealth Manager list should not be construed as an endorsement of the wealth manager by Five Star Professional or the magazine. Working with a Five Star Wealth Manager or any wealth manager is no guarantee as to future investment success nor is there any guarantee that the selected wealth managers will be awarded this accomplishment by Five Star Professional in the future. Five Star Professional is not an advisory firm and the content of this article should not be considered financial advice. The award methodology does not evaluate the quality of services provided.
Atlanta’s Top 10 NAPFA Fee-Only Investment Advisers are ranked by assets under management, including discretionary and nondiscretionary accounts as reported on Form ADV Part 1. The list includes fee-only National Association of Personal Financial Advisors (NAPFA) member firms. Inclusion on this list is not an endorsement of the firm or an implication that the listing of the firm indicates a certain level of quality. All information is based on responses from the firms to Atlanta Business Chronicle surveys.
For additional information about CWC, including fees and services, send for our disclosure statement as set forth on Form ADV from CWC using the contact information herein. Please read the disclosure statement carefully before you invest or send money..
Sources: Dimensional Fund Advisors for Dimensional Indices (DFA 80/20, DFA 60/40); The S&P data are provided by Standard & Poor’s Index Services Group (S&P 500); Barclays indices copyright Barclays 2015 (Bonds); MSCI data copyright MSCI 2015, all rights reserved (EAFE); Dalbar, Inc. “Quantitative Analysis of Investor Behavior 2015,” www.dalbar.com (Average Investor); US long-term bonds, bills, inflation, and fixed income factor data © Stocks, Bonds, Bills, and Inflation Yearbook™, Ibbotson Associates, Chicago (annually updated work by Roger G. Ibbotson and Rex A. Sinquefield).

Copyright 2016 All rights reserved.
Cambridge Wealth Counsel
Counsel . Plan. Prosper.
Robert Hockett , CFP®
robert@cwcounsel .comw w w. c a m b r i d ge we a l t h co u n s e l . co m
8 0 1 - 7 83 - 2 2 4 1
O f f i ce s i n A t l a n t a a n d S a l t L a ke C i t y- S e r v i n g C l i e n t s Na t i o nw i d e -


