Microsoft Research. Technical Report. MSR-TR-2015-30.
© 2015 Microsoft Corporation. All rights reserved. Page 1
The Emerging Role of Data Scientists
on Software Development Teams
April 12, 2015
Technical Report
MSR-TR-2015-30
Microsoft Research
Microsoft Corporation
One Microsoft Way
Redmond, WA 98052
Microsoft Research. Technical Report. MSR-TR-2015-30.
© 2015 Microsoft Corporation. All rights reserved. Page 2
The Emerging Role of Data Scientists on Software Development Teams
Miryung Kim University of California,
Los Angeles, USA
Thomas Zimmermann Robert DeLine Andrew Begel Microsoft Research, Redmond, WA, USA
{tzimmer, rdeline, andrew.begel}@microsoft.com
ABSTRACT
Creating and running software produces large amounts of raw data
about the development process and the customer usage, which can
be turned into actionable insight with the help of skilled data scien-
tists. Unfortunately, data scientists with the analytical and software
engineering skills to analyze these large data sets have been hard to
come by; only recently have software companies started to develop
competencies in software-oriented data analytics. To understand
this emerging role, we interviewed data scientists across several
product groups at Microsoft. In this paper, we describe their educa-
tion and training background, their raison d’être in software engi-
neering contexts, and the type of problems on which they work. We
identify five distinct working styles of data scientists and describe
a set of strategies that they employ to increase the impact and ac-
tionability of their work.
Categories and Subject Descriptors: D.2.9 [Management]
General Terms: Management, Measurement, Human Factors.
Keywords: Data Science, Software Analytics, Data Scientist
1. INTRODUCTION Software teams are increasingly using data analysis to inform their
engineering and business decisions [1] and to build data solutions
that utilize data in software products [2]. The people behind data
gathering and analysis are called data scientists, a term coined by
DJ Patil and Jeff Hammerbacher in 2008 to define their jobs at
LinkedIn and Facebook [3]. The mission of a data scientist is to
transform data into insight, providing guidance for leaders to take
action [4]. As one example, when Windows Explorer (a tool for file
management) was redesigned for Windows 8 [5], data scientists on
the Windows team analyzed user telemetry data and discovered that
while the top ten most often-used commands accounted for 81.2%
of all of commands that users invoked, only two of them were eas-
ily accessible from the command bar in the user interface. Based on
this insight, the team redesigned the user experience to make these
hidden commands more prominent.
Until recently, data scientists were found mostly on software teams
whose products were data-intensive, like internet search and adver-
tising. Today, we have reached an inflection point where many soft-
ware teams are starting to adopt data-driven decision making. The
role of data scientist is becoming standard on development teams,
alongside existing roles like developers, testers, program managers.
In a 2014 email to employees, the CEO of Microsoft Satya Nadella
emphasized the importance of data science for today’s software
business: “Each engineering group will have data and applied sci-
ence resources that will focus on measurable outcomes for our
products” [6].
This emerging role of data scientist has not yet been described in
the software engineering literature. There have been a few studies
documenting the pain points of data scientists face in their daily
work, based on participants from many different types of business
[7] [8]. However, the context of software development presents
several differences that merit study. First, in software development,
data analysis not only influences decision making, the analysis it-
self can be the product, like Amazon product recommendations,
Netflix movie recommendations, or search results in Bing. Second,
the flexibility of software makes it easy for data scientists to run
controlled experiments [9], like A/B tests when a web service redi-
rects a fraction of its traffic to an experimental version to measure
the effect on user behavior. Finally, with more rapid and continuous
releases of software [10], data scientists can more effectively oper-
ationalize data analysis by iteratively updating the software to
gather new data and automatically produce new analysis results.
These opportunities are not present in the business intelligence
practices in other industries.
To investigate this emerging role, we interviewed 16 data scientists
from eight different product organizations within Microsoft. Dur-
ing the period of our interviews, Microsoft was in the process of
defining an official “career path” for employees in the role of data
scientist, that is, defining the knowledge and skills expected of the
role at different career stages. This process made Microsoft a par-
ticularly fruitful location to conduct our research, and several of our
participants took part in this process. We investigated the following
research questions:
Q1. What kinds of data science competencies are important for
a large software company?
Q2. What are the educational and training backgrounds of data
scientists?
Q3. What kinds of problems and activities do data scientists work on?
Q4. What are the working styles of data scientists in software
development teams?
This paper makes the following contributions:
Characterization of the roles of data scientists in a large software
company. (Section 4)
Explores various working styles of data scientists. (Section 5)
Provides strategies for increasing impact and actionability of
data science. (Section 6)
This paper concludes with a discussion of implications (Section 7).
Microsoft Research. Technical Report. MSR-TR-2015-30.
© 2015 Microsoft Corporation. All rights reserved. Page 3
2. RELATED WORK The work related to this paper falls into general data science and
software analytics.
Data Science has become popular over the past few years as com-
panies have recognized the value of data, either in data products, or
to optimize operations and to support decision making. Not only
did Davenport and Patil proclaim that data scientist would be “the
sexiest job of the 21st century,” [11] many authors have published
data science books based on their own experiences (see books by
O’Neill and Schutt [12], Foreman [13], or May [14]). Patil summa-
rized strategies to hire and build effective data science teams based
on his experience in building the data science team at LinkedIn [3].
We found a small number of studies which systematically focused
on how data scientists work inside a company. Fisher et al. inter-
viewed sixteen data analysts at Microsoft working with large da-
tasets, with the goal of identifying pain points from a tooling per-
spective [7]. They uncovered tooling challenges such as data inte-
gration, cost estimation problems for cloud computing, difficulties
shaping data to the computing platform, and the need for fast itera-
tion on the analysis results. Our findings are complementary to
theirs but they did not describe the roles that data scientists play
within software development teams.
In a survey, Harris et al. asked 250+ data science practitioners how
they viewed their skills, careers, and experiences with prospective
employers [15]. Then, they clustered the survey respondents into
four roles: Data Businesspeople, Data Creatives, Data Developers,
and Data Researchers. They also observed evidence for so-called
“T-shaped” data scientists, who have a wide breadth of skills with
depth in a single skill area. Harris et al. focus on general business
intelligence analysts rather than data scientists in a software devel-
opment organization. Harris et al also does not provide contextual,
deeper findings on what types of problems that they work on, and
the strategies that they use to increase the impact of their work.
Kandel et al. conducted interviews with 35 enterprise analysts in
healthcare, retail, marketing, and finance [8]. The study focuses on
recurring paint points, challenges, and barriers for adopting visual
analytics tools. Unlike our work, their study does not investigate
how data scientists contribute to software engineering tasks, such
as software usage data (telemetry) collection, fault localization and
defect prediction, in software development contexts.
Companies of all kinds have long employed business intelligence
analysts to improve sales and marketing strategies, for example by
putting diapers on sale near displays of beer. However, the data sci-
entists we study are different in that they are an integral part of the
software engineering staff and focus their attention on software-
oriented data and applications.
Software Analytics is a subfield of analytics with the focus on soft-
ware data. Software data can take many forms such as source code,
changes, bug reports, code reviews, execution data, user feedback,
and telemetry information. Davenport, Harris, and Morison [4] de-
fine analytics “as the use of analysis, data, and systematic reasoning
to make decisions.” According to an Accenture survey of 254 US
managers in industry, however, up to 40 percent of major decisions
are based on gut feel rather than facts [16]. Due to the recent boom
in big data, several research groups have pushed for greater use of
data for decision making [17, 18, 19], and have shared their expe-
riences collaborating with industry on analytics projects [20, 18,
21].
Analysis of software data has a long tradition in the empirical soft-
ware engineering, software reliability, and mining software reposi-
tories communities [1]. Software analytics has been the dedicated
topic of tutorials and panels at the ICSE conference [22, 23], as well
as special issues of IEEE Software (July 2013 and September
2013). Zhang et al. [24] emphasized the trinity of software analytics
in the form of three research topics (development process, system,
users) as well as three technology pillars (information visualization,
analysis algorithms, large-scale computing). Buse and Zimmer-
mann argued for a dedicated data science role in software projects
[19] and presented an empirical survey with software professionals
on guidelines for analytics in software development [25]. They
identified typical scenarios and ranked popular indicators among
software professionals. Begel and Zimmermann collected 145
questions that software engineers would like to ask data scientists
to investigate [26]. None of this work has focused on the character-
ization of data scientists on software teams, which is one of the
contributions of this paper.
Many startup software companies such as LinkedIn, Twitter, and
Facebook employ data scientists to analyze user behavior and user-
provided content data [27] [28] [29]. However, the authors of these
published reports concentrate mainly on their “big data” pipeline
architectures and implementations, and ignore the organizational
architecture and work activities of the data scientists themselves.
Microsoft data scientists investigate similar customer-facing issues
as these social media companies, but also analyze their own soft-
ware teams’ engineering processes and activities to look for ways
to improve productivity and software quality. Their focus on the
company’s employees is similar to Google’s [30] [31] [32], how-
ever, Google’s articles focus on singular data science experiments.
Our study describes the daily work lives of the data scientists who
carry out the work.
It is common to expect that action and insight should drive the col-
lection of data. Goal-oriented approaches use goals, objectives,
strategies, and other mechanisms to guide the choice of data to be
collected and analyzed. For example, the Goal/Question/Metric
(GQM) paradigm [33] proposes a top-down approach to define
measurement; goals lead to questions, which are then answered
with metrics. Other well-known approaches are GQM+ (which
adds business alignment to GQM) [34], Balanced Scorecard (BSC)
[35], and Practical Software Measurement [36].
Basili et al. [37] proposed the Experience Factory, which is an in-
dependent organization to support a software development organi-
zation in collecting experiences from their projects. The Experience
Factory packages these experiences (for example, in models) and
validates and reuses experiences in future projects. Some of the
team structures that we observed in the interviews were similar to
an Experience Factory in spirit; however, many data scientists were
also directly embedded in the development organizations. While
some experiences can be reused across different products, not all
insight is valid and actionable in different contexts.
3. METHODOLOGY
3.1 Interviews of Data Scientists We interviewed people who acted in the role of data scientists, and
then formed a theory of the roles that data scientists play in software
development organizations.
Protocol. We conducted one-hour long, semi-structured interviews
giving us the advantage of allowing unanticipated information to
be mentioned [38]. All interviews were conducted by two people.
Each was led by the first author, who was accompanied by one of
the other three authors (as schedules permitted) who took notes and
asked additional questions. Interviews were audio-taped and later
transcribed for analysis. They started with an introduction, a short
explanation of the research being conducted, and demographic
Microsoft Research. Technical Report. MSR-TR-2015-30.
© 2015 Microsoft Corporation. All rights reserved. Page 4
questions. Participants were then asked about the role they played
on their team, their data science-related background, their current
project(s), and their interactions with other employees. We also
asked for stories about successes, pitfalls, and the changes that data
is having on their team’s practices. Our interview guide is in Ap-
pendix A.
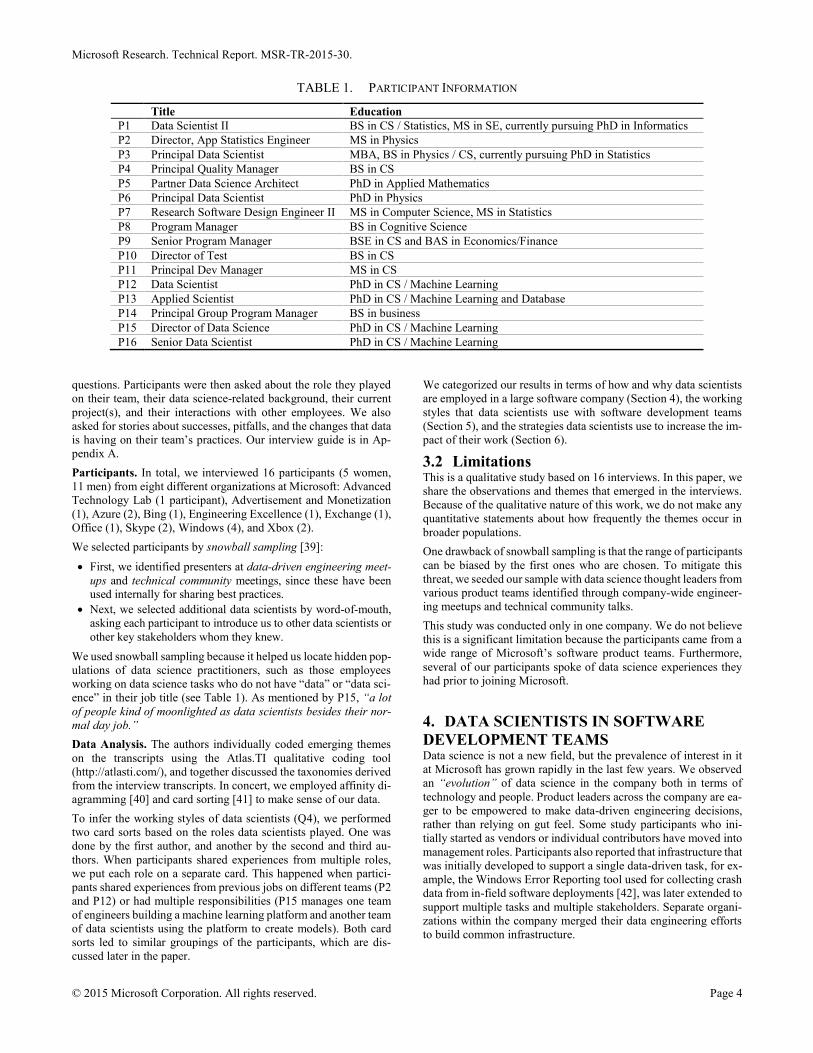
Participants. In total, we interviewed 16 participants (5 women,
11 men) from eight different organizations at Microsoft: Advanced
Technology Lab (1 participant), Advertisement and Monetization
(1), Azure (2), Bing (1), Engineering Excellence (1), Exchange (1),
Office (1), Skype (2), Windows (4), and Xbox (2).
We selected participants by snowball sampling [39]:
First, we identified presenters at data-driven engineering meet-
ups and technical community meetings, since these have been used internally for sharing best practices.
Next, we selected additional data scientists by word-of-mouth,
asking each participant to introduce us to other data scientists or
other key stakeholders whom they knew.
We used snowball sampling because it helped us locate hidden pop-
ulations of data science practitioners, such as those employees
working on data science tasks who do not have “data” or “data sci-
ence” in their job title (see Table 1). As mentioned by P15, “a lot
of people kind of moonlighted as data scientists besides their nor-
mal day job.”
Data Analysis. The authors individually coded emerging themes
on the transcripts using the Atlas.TI qualitative coding tool
(http://atlasti.com/), and together discussed the taxonomies derived
from the interview transcripts. In concert, we employed affinity di-
agramming [40] and card sorting [41] to make sense of our data.
To infer the working styles of data scientists (Q4), we performed
two card sorts based on the roles data scientists played. One was
done by the first author, and another by the second and third au-
thors. When participants shared experiences from multiple roles,
we put each role on a separate card. This happened when partici-
pants shared experiences from previous jobs on different teams (P2
and P12) or had multiple responsibilities (P15 manages one team
of engineers building a machine learning platform and another team
of data scientists using the platform to create models). Both card
sorts led to similar groupings of the participants, which are dis-
cussed later in the paper.
We categorized our results in terms of how and why data scientists
are employed in a large software company (Section 4), the working
styles that data scientists use with software development teams
(Section 5), and the strategies data scientists use to increase the im-
pact of their work (Section 6).
3.2 Limitations This is a qualitative study based on 16 interviews. In this paper, we
share the observations and themes that emerged in the interviews.
Because of the qualitative nature of this work, we do not make any
quantitative statements about how frequently the themes occur in
broader populations.
One drawback of snowball sampling is that the range of participants
can be biased by the first ones who are chosen. To mitigate this
threat, we seeded our sample with data science thought leaders from
various product teams identified through company-wide engineer-
ing meetups and technical community talks.
This study was conducted only in one company. We do not believe
this is a significant limitation because the participants came from a
wide range of Microsoft’s software product teams. Furthermore,
several of our participants spoke of data science experiences they
had prior to joining Microsoft.
4. DATA SCIENTISTS IN SOFTWARE
DEVELOPMENT TEAMS Data science is not a new field, but the prevalence of interest in it
at Microsoft has grown rapidly in the last few years. We observed
an “evolution” of data science in the company both in terms of
technology and people. Product leaders across the company are ea-
ger to be empowered to make data-driven engineering decisions,
rather than relying on gut feel. Some study participants who ini-
tially started as vendors or individual contributors have moved into
management roles. Participants also reported that infrastructure that
was initially developed to support a single data-driven task, for ex-
ample, the Windows Error Reporting tool used for collecting crash
data from in-field software deployments [42], was later extended to
support multiple tasks and multiple stakeholders. Separate organi-
zations within the company merged their data engineering efforts
to build common infrastructure.
TABLE 1. PARTICIPANT INFORMATION
Title Education
P1 Data Scientist II BS in CS / Statistics, MS in SE, currently pursuing PhD in Informatics
P2 Director, App Statistics Engineer MS in Physics
P3 Principal Data Scientist MBA, BS in Physics / CS, currently pursuing PhD in Statistics
P4 Principal Quality Manager BS in CS
P5 Partner Data Science Architect PhD in Applied Mathematics
P6 Principal Data Scientist PhD in Physics
P7 Research Software Design Engineer II MS in Computer Science, MS in Statistics
P8 Program Manager BS in Cognitive Science
P9 Senior Program Manager BSE in CS and BAS in Economics/Finance
P10 Director of Test BS in CS
P11 Principal Dev Manager MS in CS
P12 Data Scientist PhD in CS / Machine Learning
P13 Applied Scientist PhD in CS / Machine Learning and Database
P14 Principal Group Program Manager BS in business
P15 Director of Data Science PhD in CS / Machine Learning
P16 Senior Data Scientist PhD in CS / Machine Learning

Microsoft Research. Technical Report. MSR-TR-2015-30.
© 2015 Microsoft Corporation. All rights reserved. Page 5
4.1 Important Data Science Competencies Data-driven decision making has increased the demand for data sci-
entists with statistical knowledge and skills. Specifically partici-
pants described the increasing need for knowledge about experi-
mental design, statistical reasoning, and data collection.
Demand for Experimentation. As the test-in-production para-
digm for on-line services has taken off, our participants recognized
the opportunity and need for designing experiments with real user
data [43]. Real customer usage data is much easier to obtain, and is
more authentic than the simulated data test engineers create for an-
ticipated usage scenarios.
Instead of having an army of testers to go off and generate a
bunch of data, that data's already here. It's more authentic be-
cause it’s real customers on real machines, real networks. You
no longer have to simulate and anticipate what the customer’s
going to do. [P10]
Participants mentioned an increase in the demand for experiment-
ing with alternative software implementations in order to assess the
requirements and utility of new software features. Over the last dec-
ade, randomized two-variant experiments (called A/B testing) are
being used to assess the utility of software prototypes and features,
particularly in online services like web search. Because there are
endless possibilities for alternative software designs, data scientists
and engineering teams build software systems with an inherent ca-
pability to inject changes, called flighting.
You create an environment where, for example, in search, where
I can actually experiment based on a mockup, if you will, of the
idea. I can actually come up with a set of ideas, broad ideas
about my work, and I can actually deploy them in some easy
way. [P5]
Do I change the size? Do I change the font? There are so many
things you could do… We’re trying to flight things. It has capa-bility to inject changes. [P11]
Several participants took it upon themselves to both design incen-
tive systems that could get users to adopt a product feature and to
create user telemetry and surveys that would measure whether the
systems worked.
So we create a game that gets people to repetitively use the fea-
ture. And then we watch what happens when we take the game away. Did it stick or did it not stick? [P13]
Demand for Statistical Rigor. In the analysis of data, participants
told us that there is an increasing demand for statistical rigor. Data
scientists and their teams conduct formal hypothesis testing, report
confidence intervals, and determine baselines through normaliza-
tion.
For example, when Participant P2 (who worked on estimating fu-
ture failures) reported her estimate to her manager, the manager
asked how confident she was. She gave him a hard number, sur-
prising him because whenever he had asked the question to previ-
ous employees, he had just been told highly confident or not very
confident.
He was like “So, you are giving me some predictions. How con-
fident are you that this is what we get?” And I’m looking and go,
“What do you mean? It’s 95 percent! It’s implied in all the test-
ing. This is how we define this whole stuff.” And he goes, “Wow, this is the first time I’m getting this answer.” [P2]
There has been a similar increase in the demand for conducting for-
mal hypothesis testing. For example, instead of reasoning about av-
erages or means, engineering teams want to see how different their
observation is from random chance:
When I do my analyses, I always have a null hypothesis and an
alternative hypothesis. [P3]
Data scientists also have to determine a baseline of usual behavior
so they can normalize incoming data about system behavior and
telemetry data that are collected from a large set of machines under
many different conditions.
I’ve got all of these different clients out in the wild running on
all these different servers. I want to get a general sense of what things feel like on a normal Monday. [P8]
Demand for Data Collection Rigor. When it comes to collecting
data, data scientists discussed how much data quality matters and
how many data cleaning issues they have to manage. Many partic-
ipants mentioned that a large portion of their work required the
cleaning and shaping of data just to enable data analysis. This aligns
with a recent article on New York Times that said that 80% of data
science work requires data “janitor work” [44].
We need to cleanse the data, because there are all sorts of data
quality issues [often, due to] imperfect instrumentation. [P11]
Furthermore, data collection itself requires a sophisticated engi-
neering system that tries to satisfy many engineering, organiza-
tional, and legal requirements.
What about storage, what about speed? What about legal, what
about privacy? There is an entire gamut of things that you need to jump through hoops to collect the instrumentation. [P1]
4.2 Background of Data Scientists One column in Table 1 shows the educational background of the
study participants. Data scientists often do not have a typical four-
year degree in Computer Science [14]. In our study, 11 of 16 par-
ticipants have degrees in Computer Science; however, many also
have joint degrees from other fields such as statistics, physics,
math, bio-informatics, applied math, business, economics, and fi-
nance. Their interdisciplinary backgrounds contribute their strong
numerical reasoning skills for data analysis. 11 participants have
higher education degrees (PhD or MS), and many have prior job
experiences with dealing with big data.
Several non-CS participants expressed a strong passion for data.
I love data, looking and making sense of the data. [P2]
I’ve always been a data kind of guy. I love playing with data.
I’m very focused on how you can organize and make sense of data and being able to find patterns. I love patterns. [P14]
When data scientists hire other data scientists, they sometimes look
for skill sets that mirror how they were themselves trained. When
one team manager with a PhD in machine learning spoke about hir-
ing new employees for his data science tools team, he said that he
looks for “hackers.”
So, the typical guys on my team have some PhD in a quantitative
field with machine learning background and the ability to code.
They have to manipulate data. The other very essential skill is
[that] we want programming. It's almost like ... a hacker-type skill set. [P15]
Microsoft Research. Technical Report. MSR-TR-2015-30.
© 2015 Microsoft Corporation. All rights reserved. Page 6
Another data science team manager with strong statistics back-
ground demanded the same from everyone on his team:
My people have to know statistics. They need to be able to an-
swer sample size questions, design experiment questions, know standard deviations, p-value, confidence intervals, etc. [P2]
Our participants’ background in higher education also contributes
to how they view the work of data science. Usually, the problems
and questions are not given in advance. A large portion of their re-
sponsibility is to identify important questions that could lead to im-
pact. Then they iteratively refine questions and approaches to the
analyses. Participants from a variety of product teams discussed
how their training in a PhD program contributed to the working
style they use to identify important questions and iteratively refine
questions and approaches.
It has never been, in my four years, that somebody came and
said, “Can you answer this question?” I mostly sit around think-
ing, “How can I be helpful?” Probably that part of your PhD is
you are figuring out what is the most important questions. [P13]
I have a PhD in experimental physics, so pretty much, I am used
to designing experiments. [P6]
Doing data science is kind of like doing research. It looks like a
good problem and looks like a good idea. You think you may
have an approach, but then maybe you end up with a dead end. [P5]
4.3 Problems that Data Scientists Work on Our participants said they worked on many kinds of problems rang-
ing from performance and quality regression, user engagement and
feature assessment, debugging and root cause analysis, bug repro-
duction, server log anomaly detection, failure rate estimation and
failure planning. They also worked on business-specific problems,
such as detecting fraud in e-commerce, identifying a mode of trans-
portation for mobile users, and assessing advertisement ranking and
news recommendations. Here are just a few of the example tasks
that participants told us they worked on.
Performance Regression. Are we getting better in terms of crashes
or worse? [P3] How long did it take to detect when a new fea-ture has blown up your system? [P1]
Requirements Identification. If you see the repetitive pattern where people don’t recognize, the feature is there. [P3]
Fault Localization and Root Cause Analysis. What areas of the
product are failing and why? [P3] How many failures are there per day? [P11]
Bug Prioritization. Oh, cool. Now we know which bugs we should fix first. Then how can we reproduce this error? [P5]
Server Anomaly Detection. We are interested in anomaly detection
on real time servers in general. [P7] Is this application log ab-
normal w.r.t. the rest of the data? [P12]
Failure Rate Estimation. Is the beta ready to ship? [P8]
Customer Understanding. How long do our users use the app?
[P1] What are the most popular features? [P4] Is my feature
used in a way that improves the customer’s productivity? [P6]
Cost Benefit Analysis. How much money can we save if we improve
the AUC for this machine learning classifier? [P15] How many
customer service calls can we prevent if we detect this type of anomaly? [P9]
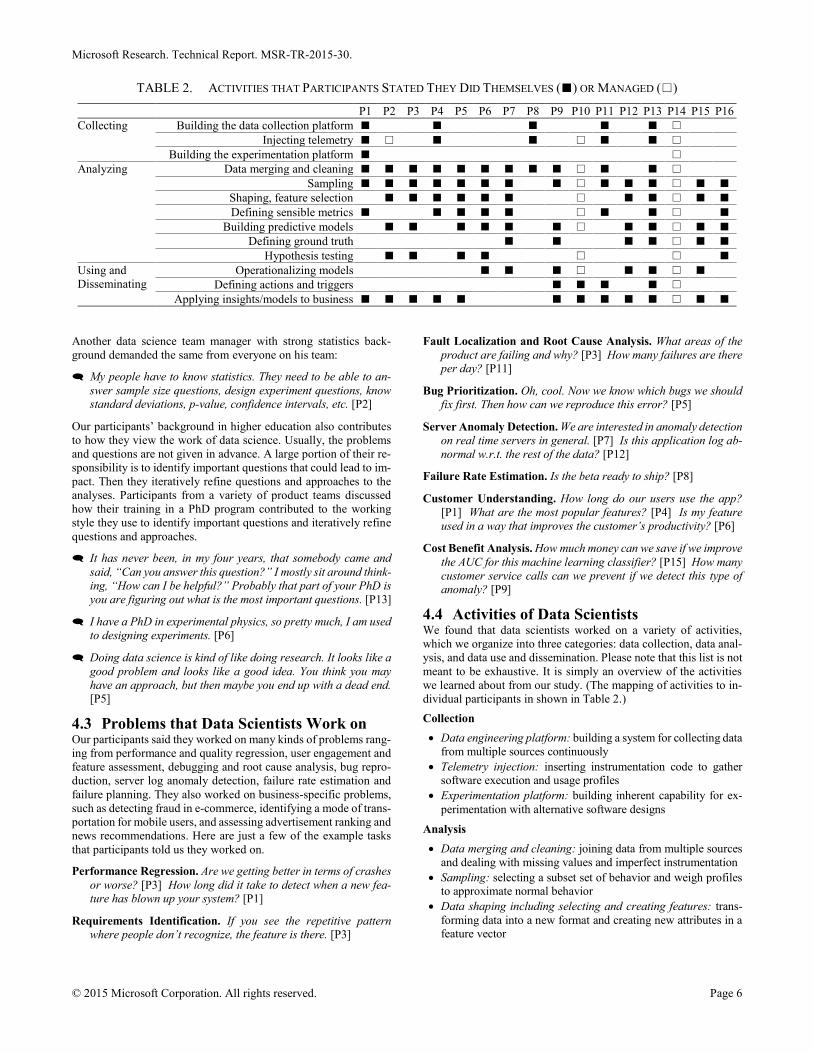
4.4 Activities of Data Scientists We found that data scientists worked on a variety of activities,
which we organize into three categories: data collection, data anal-
ysis, and data use and dissemination. Please note that this list is not
meant to be exhaustive. It is simply an overview of the activities
we learned about from our study. (The mapping of activities to in-
dividual participants in shown in Table 2.)
Collection
Data engineering platform: building a system for collecting data
from multiple sources continuously
Telemetry injection: inserting instrumentation code to gather software execution and usage profiles
Experimentation platform: building inherent capability for ex-
perimentation with alternative software designs
Analysis
Data merging and cleaning: joining data from multiple sources
and dealing with missing values and imperfect instrumentation
Sampling: selecting a subset set of behavior and weigh profiles to approximate normal behavior
Data shaping including selecting and creating features: trans-
forming data into a new format and creating new attributes in a feature vector
TABLE 2. ACTIVITIES THAT PARTICIPANTS STATED THEY DID THEMSELVES (■) OR MANAGED (□)
P1 P2 P3 P4 P5 P6 P7 P8 P9 P10 P11 P12 P13 P14 P15 P16
Collecting Building the data collection platform ■ ■ ■ ■ ■ □
Injecting telemetry ■ □ ■ ■ □ ■ ■ □
Building the experimentation platform ■ □
Analyzing Data merging and cleaning ■ ■ ■ ■ ■ ■ ■ ■ ■ □ ■ ■ □
Sampling ■ ■ ■ ■ ■ ■ ■ ■ □ ■ ■ ■ □ ■ ■
Shaping, feature selection ■ ■ ■ ■ ■ ■ □ ■ ■ □ ■ ■
Defining sensible metrics ■ ■ ■ ■ ■ □ ■ ■ □ ■
Building predictive models ■ ■ ■ ■ ■ ■ □ ■ ■ □ ■ ■
Defining ground truth ■ ■ ■ ■ □ ■ ■
Hypothesis testing ■ ■ ■ ■ □ □ ■
Using and
Disseminating
Operationalizing models ■ ■ ■ □ ■ ■ □ ■
Defining actions and triggers ■ ■ ■ ■ □
Applying insights/models to business ■ ■ ■ ■ ■ ■ ■ ■ ■ ■ □ ■ ■
Microsoft Research. Technical Report. MSR-TR-2015-30.
© 2015 Microsoft Corporation. All rights reserved. Page 7
Defining sensible metrics: defining metrics that are sensible to
data consumers
Building predictive models: building predictive models by ap-
plying machine learning, data mining, and statistics.
Defining ground truths: defining class labels and scenarios of anomalies
Hypothesis testing: setting a null hypothesis and an alternative
hypothesis and estimating the confidence level of rejecting the
null hypothesis using various statistical methods.
Use and Dissemination
Operationalizing predictive models: integrating predictive mod-
els into software products and systems by invoking right models at a right point
Defining actions and triggers: defining automated actions and
triggers for different labels of predictions.
Translating insights and models to business values: explaining
the value of insights and predictive models using domain-spe-
cific terms.
4.5 Organization of Data Science Teams We observed five different ways of organizing a data science team
or employing data scientists within an existing organization.
The “Triangle” model. In a triangle team structure, one third of
the team are data scientists who perform analysis work and who
have a strong statistics background; another third are called data
stewards who perform data shaping and cleaning tasks; and the
rest collects customer usage data (telemetry) through instrumen-tation of software and hardware. [P2, P14]
The “Hub and Spoke” model. In this model, a centralized team
builds a common piece of data collection and analysis platform,
where the spoke teams have local knowledge and come up with local models. [P1, P4]
The “Consulting” model. An organization consults both internal
and external customers by creating custom models and solving data problems of other teams within Microsoft. [P12]
The “Individual Contributor”. A software development team
has a data scientist as an individual contributor. [P13]
The “Virtual Team” model. The individual contributors from
different teams form a virtual team and share common data col-
lection and analysis tools for data science work. [P3]
5. DATA SCIENTIST WORKING STYLES Though the role of data scientist is relatively new in software de-
velopment, the interviews reveal commonalities in how the partic-
ipants function on their teams. Nonetheless, each of our participants
has followed a unique path to their current role.
Based on two card sorts (described in Section 3.1), we grouped the
participants into five distinct styles of data scientists. The first au-
thor initially grouped participants by their primary activities. The
other authors iterated on this work, and collaboratively refined the
groups to the ones listed in this section. These working style groups
are not mutually exclusive because some participants [P2, P12,
P15] discussed their work on several different product teams.
In the next subsections, we characterize the nature of each style and
include a participant success story to exemplify it.
5.1 Insight Providers This working style characterizes data scientists who play an inter-
stitial role between managers and engineers within a product group
[P2, P3, P9]. The managers want to take actions to achieve business
goals such as increased customer adoption, improved product qual-
ity, or ship decisions. These data scientists guide the managers’ ac-
tions by analyzing product and customer data collected by the
teams’ engineers. Their communication and coordination skills are
key—they negotiate with engineers to get the data they need, iterate
with managers to understand and refine their goals, and communi-
cate their findings clearly to the team.
Example. P2 worked on a product line in which the managers
needed to know whether an upgrade was of sufficient quality to
push to all products in the family. At first, she struggled to get qual-
ity crash data from the engineers:
I basically tried to eliminate from the vocabulary the notion of
“You can just throw the data over the wall ... She’ll figure it
out.” There’s no such thing. I’m like, “Why did you collect this
data? Why did you measure it like that? Why did you measure
this many samples, not this many? Where did this all come from?”
She worked with management to get a clear goal:
It should be as good as before. It should not deteriorate any per-
formance, customer user experience that they have. Basically people shouldn’t know that we’ve even changed [it].
Her analysis was able to determine a confidence interval on the
probability of field failures, allowing the team to know when they
reached the quality bar.
5.2 Modeling Specialists This working style is practiced by data scientists who act as expert
consultants, partnering with Insight Providers to support other
teams’ data-driven decision making [P7, P12]. In this case, both P7
and P12 are experts in machine learning, though conceptually other
forms of expertise (statistics, survey design) would fit here as well.
Example. P7 is an expert in time series analysis and works with P9
to help her team automatically detect anomalies in their telemetry
data.
The PMs [Program Managers] and the Dev Ops from that
team...through what they daily observe, come up with a new set
of time series data that they think has the most value and then
they will point us to that, and we will try to come up with an
algorithm or with a methodology to find the anomalies for that
set of time series. [P7]
5.3 Polymaths This working style describes data scientists who “do it all,” e.g.,
forming a business goal, instrumenting a system to collect the re-
quired data, doing necessary analyses or experiments, and com-
municating the results to business leaders [P12, P13, P16].
Example. P13 works on a product that serves advertisements and
explores her own ideas for new advertisement data models.
So I am the only scientist on this team. I'm the only scientist on
sort of sibling teams and everybody else around me are like just
straight-up engineers.
She expressed enthusiasm for her ability to operationalize her own
models.
For months at a time I'll wear a dev hat and I actually really
enjoy that, too. ... I spend maybe three months doing some anal-
ysis and maybe three months doing some coding that is to inte-
grate whatever I did into the product. … I do really, really like
my role. I love the flexibility that I can go from being developer to being an analyst and kind of go back and forth.
Microsoft Research. Technical Report. MSR-TR-2015-30.
© 2015 Microsoft Corporation. All rights reserved. Page 8
5.4 Platform Builders This working style is demonstrated by seven data scientists who
build shared data platforms used across several product teams [P1,
P4, P6, P8, P11, P14, and P15]. Of these seven, six work on plat-
forms for data collection, storage, and querying, while the last, P15,
works on a service for building and deploying machine learning
models. A defining characteristic of this working style is that its
members’ outputs are software systems designed to be reusable
across many different product and business goals. The platform
builders’ work balances both engineering and scientific concerns.
For example, data collection software must be reliable, performant,
low-impact, and widely deployable. On the other hand, the software
should provide data that are sufficiently precise, accurate, well-
sampled, and meaningful enough to support statistical analysis.
Their expertise in both software engineering and data analysis ena-
bles them to make trade-offs between these concerns.
We found two kinds of data platform builders. Participants P1, P4,
P8 and P11 work with on systems that involve Microsoft’s oldest
forms of data collection, including Windows Error Reporting [42]
and Reliability Analysis Component [45]. Their work unites these
data sources into a common platform to fit current business goals.
Participants P6, P14, and P15 work on new systems, allowing them
to reconsider previous decisions. For example, P14 works on a new
common logging platform, and has the freedom to design new data
schemas.
Example. P4 worked on a data platform that collects crash data and
worked on making it actionable to developers.
You come up with something called a bucket feed. It is a name
of a function most likely responsible for the crash in the small
bucket. We found in the source code who touch last time this
function. He gets the bug. And we filed [large] numbers a year with [a high] percent fix rate.
5.5 Team Leaders The last working style describes senior data scientists who run their
own data science teams [P2, P5, P10, and P15]. In addition to man-
aging their teams, they also act as data science “evangelists,” push-
ing for the adoption of data-driven decision making within their
business organization or the company as a whole. Data team leaders
work with senior company leaders to inform broad business deci-
sions.
Example. P10 and his team of data scientists estimated the number
of bugs that would remain open when a product was scheduled to
ship.
When the leadership saw this gap [between the estimated bug
count and the goal], the allocation of developers towards new
features versus stabilization shifted away from features toward
stabilization to get this number back.
P10 emphasized his role as intermediary between his data scientist
and his management:
Sometimes people who are real good with numbers are not as
good with words (laughs), and so having an intermediary to sort
of handle the human interfaces between the data sources and the
data scientists, I think, is a way to have a stronger influence.
[Acting] an intermediary so that the scientists can kind of stay focused on the data.
6. STRATEGIES FOR INCREASING
IMPACT AND ACTIONABILITY When we asked the participants about their experiences in data sci-
ence work that had impact and/or led to action, we heard several
success stories. For example, several participants mentioned that
their work on user engagement analysis led to new features which
emerged from repetitive sequences of user actions that did not map
to existing features. In some cases, their work also led the team to
deprecate unused features. For example, Participant P3 said there
was a feature that required a large amount of code, but nobody used
it. His data science work led to identifying and deprecating the un-
used feature. Participant P2’s work on failure rate estimation led to
releasing a product earlier than the expected schedule, e.g., rolling
a release to the whole world two weeks earlier. Another project on
defect prediction enabled the team to rebalance resources to focus
on bug fixing work rather than adding new features. Root cause
analysis of crash data led to automated bug filing and monitoring
to reduce crash rates. Server log anomaly detection work led to re-
ducing development operation cost.
In this section, we describe various strategies that data scientists
shared with us in order to increase the impact and actionability of
their work, i.e., to ensure that their results matter for the company.
Actionability is actually a big thing. If it’s not actionable, the
engineers then look at you, say, “I don’t know what to do with
this, so don’t even bother me.” [P11]
6.1 Choose the Right Questions An important strategy for success is to choose the right questions
for the right team. Participant P5, a Team Leader, described three
conditions that must be met before his data science team engages
in a project: priority, actionability, and commitment:
(a) Is it a priority for the organization (b) is it actionable, if I
get an answer to this, is this something someone can do some-
thing with? and, (c), are you as the feature team — if you're
coming to me or if I'm going to you, telling you this is a good
opportunity — are you committing resources to deliver a
change? If those things are not true, then it's not worth us talking
anymore. [P5]
As part of this strategy, it is important to define actions in addition
to focusing on the insight. Participant P9 provided an example in
the context of server log anomaly detection, where each anomaly
should trigger some action:
You need to think about, “If you find this anomaly, then what?”
Just finding an anomaly is not very actionable. What I do also
involves thinking, “These are the anomalies I want them to de-
tect. Based on these anomalies, I’m going to stop the build. I’m
going to communicate to the customer and ask them to fix some-
thing on their side.” [P9]
There are many more questions to pursue than you have time and
resources for. Choose questions that enable the stakeholders to
achieve their goals.
6.2 Work Closely with Your Consumers Another strategy that was mentioned in several interviews was to
interact closely and engage with the stakeholders who plan to con-
sume the results from the data analysis. They often set up channels
such as weekly data meet-ups [P3] and “brown bag” (i.e., bring
your own) lunches [P13] to regularly deliver project outcomes.
Microsoft Research. Technical Report. MSR-TR-2015-30.
© 2015 Microsoft Corporation. All rights reserved. Page 9
It is important for stakeholders to define the questions and scenarios
addressed by data analysis early and often.
You begin to find out, you begin to ask questions, you being to
see things. And so you need that interaction with the people that
own the code, if you will, or the feature, to be able to learn to-
gether as you go and refine your questions and refine your an-swers to get to the ultimate insights that you need. [P5]
As an example, Participant P7, a Modeling Specialist, and Partici-
pant P9, an Insight Provider, iteratively defined anomalies because
the ground truth required for each analysis was often not known in
advance.
You have communication going back and forth where you will
find what you’re actually looking for, what is anomalous and
what is not anomalous in the set of data that they looked at. [P7]
When you’re seeing this part of the data, this one’s good versus
here’s setting that ground truth. Here’s where you should have
alerted. Here’s where you shouldn’t have done anything. That’s
something that we are continuing to iterate on, but that’s some-thing that was fairly labor-intensive. [P9]
Iterate with the stakeholders to interpret the data and to identify
and refine important questions and scenarios.
6.3 Validate Your Data The validation of quantitative data through qualitative channels was
also mentioned as a criteria to ensure that measurements are mean-
ingful and lead to correct actions. Participant P4 discussed the im-
portance of validating his product’s telemetry data through subjec-
tive channels:
If you could survey everybody every ten minutes, you don’t need
telemetry. The most accurate is to ask everybody all the time.
The only reason we do telemetry is that [asking people all the
time] is slow and by the time you got it, you’re too late. So you
can consider telemetry and data an optimization. So what we do
typically is 10% are surveyed and we get telemetry. And then we calibrate and infer what the other 90% have said. [P4]
Triangulate multiple data sources to increase the confidence in
the analysis results.
6.4 Put Results into Perspective Many participants emphasized the need to explain findings in sim-
ple terms to non-experts, especially to management.
A super smart data scientist, their understanding and presenta-
tion of their findings is usually way over the head of the manag-
ers…so my guidance to [data scientists], is dumb everything
down to seventh-grade level, right? And whether you're writing or you're presenting charts, you know, keep it simple. [P10]
Fancy is bad. Fancy requires you to be there in order for the
person reading it to figure out what’s going on. So, the easier,
dumber, the better. [P1]
Talking to non-experts also required the development of intuitive
measurements. Participant P4 measured the impact of a software
crash by the associating it with how many minutes his customers
wasted because of it — a number that is easy to understand and
assess over time.
It’s not even about precision and recall of your algorithm. It’s
about, “Hey. How did this make the lives of our end-users bet-
ter? How did this help us understand our tenants better? What
did this do for this service?” [P9]
Other participants said it was important to “translate” findings
into business values, such as dollars saved, customer calls pre-
vented, or the number of days early that a product can be
shipped. Precision, recall, and ROC curves, while popular with
data scientists and academics, are less useful when presenting
findings to analytics consumers. In terms of convincing, if you
just present all these numbers like precision and recall factors…
that is important from the knowledge sharing model transfer
perspective. But if you are out there to sell your model or ideas,
this will not work because the people who will be in the decision-
making seat will not be the ones doing the model transfer. So,
for those people, what we did is cost benefit analysis where we
showed how our model was adding the new revenue on top of
what they already had. [P12]
Occasionally, information is “lost in translation,” i.e., when find-
ings are simplified for people with no statistical training.
So I think part of the problem is that a lot of the people aren't
given training in statistics… So you got some p-value of .01.
“Oh, gee, should I be happy or sad? What does that mean?” And
they don't necessarily know that. So I have to explain things in terms that might not be forceful enough. [P3]
Translate analysis results to familiar concepts that are important
for the stakeholders’ decisions.
6.5 Go the Last Mile: Operationalize Models Several interviewees reported “going the last mile” to actively con-
tribute to the operationalization of their predictive models.
Data science has this wide spectrum, right? All the way from
business understanding to modelling to deployment and change management. [P15]
Data scientists embedded in some product teams often switched
modes between modelling and deployment.
I kind of flip back and forth. I say I spend maybe three months
doing some analysis, and maybe three months doing some cod-ing that is to integrate whatever I did into the product. [P13]
Going the last mile is more difficult for data scientists who work as
Modeling Specialists, such as Participants P7 and P12. With each
product team they were assigned to help, they had to get their algo-
rithms running on a new infrastructure, and too often, had to make
code changes to the infrastructure, itself.
Getting your algorithm at the right point to make sure right mod-
els are loaded. That’s a big issue we face. [P7]
They accepted [the model] and they understood all the results
and they were very excited about it. Then, there’s a phase that
comes in where the actual model has to go into production. …
You really need to have somebody who is confident enough to take this from a dev side of things. [P12]
Many stakeholders want to deploy predictive models as part of
the product. Embrace your role in the entire end-to-end scenario.
Microsoft Research. Technical Report. MSR-TR-2015-30.
© 2015 Microsoft Corporation. All rights reserved. Page 10
7. IMPLICATIONS The findings in this paper have several implications for research,
practice, and education.
7.1 Research Many development teams now include data scientists as a standard
role, alongside developers, testers, and program managers. For re-
searchers, this new team composition changes the context in which
problems are pursued. Many development teams are already col-
lecting and monitoring data about user behavior, software execu-
tion, and team activities, as well as contextual data sources like so-
cial media. This means that researchers can assume the availability
of such data, as well as an expert team member to handle them, as
an ingredient for solving problems. Conversely, new technology
that ignores the availability of such data could be less attractive for
adoption in industry. Given the novelty of the role, emerging data
scientist will also experience frustrations and inefficiencies, which
are another target for research. While some of frustrations have
been explored in some related work [7] [15], we expect distinct
challenges for software-oriented data scientists.
We observed a strong influence of higher education on data science
(11 of the participants had PhD or MS degrees). To an extent, this
is a testament to the transfer of many years of software engineering
research to practice. The problems that data scientists work on —
bug prediction, debugging, release planning, and anomaly detection
in server telemetry — and the analysis methods that they use for
solving these problems are similar to those employed in the soft-
ware engineering research field for the past decade. As techniques
that were once novel in the research literature become standard
among data scientists, researchers will need will need to refocus to
stay ahead. As one example, researchers could invent new analysis
techniques to allow data scientists to analyze new kinds of data. Or
they could focus on better tool support to automate the collection
and analysis of data. Validating operationalized data solutions is a
challenging task that requires “careful inspection to understand the
provenance and distribution of each piece of data, of the problem
domain, and of the practices used” [2], including assessing the
quality of data. We expect that debugging for software-oriented
data scientists will have a bright future.
We believe that the strategies that data scientists use to ensure the
impact and actionability of their work can also be used to increase
the impact of software engineering research. The data scientists
shared the importance of going the last mile to operationalize the
predictive models and tailor the value of their insights for each ben-
eficiary. Our participants reported that while precision, recall, and
ROC curves are commonly used to evaluate (predictive) research,
they are not effective in gaining buy-in from engineers or prompt-
ing management to take action. To increase the impact of research,
we need think of other ways of putting results into perspective than
simply reporting increases in precision and recall.
7.2 Practice The software world has changed over the past years. With cloud-
based systems, the availability of operational data has significantly
increased. Monetization of software now more heavily relies on a
good understand of how customers use a software. There are also
new opportunities for more efficient software development such as
testing in production [43] [46] and the ability to flight changes for
a short time before making them final [9]. We believe that these
changes lead to an increased demand for data scientists in the soft-
ware industry similar to what we see in other industries. By 2018,
the U.S. may face a shortage of as many as 190,000 people with
analytical expertise and of 1.5 million managers and analysts with
the skills to make data-driven decisions, according to a report by
the McKinsey Global Institute [47].
In this new world that is ruled by data, software companies have to
figure out what data scientists really are, what skills they need, who
to hire, and where to put them in their organization. The success
stories, activities, and working styles of data scientists, which we
reported in this paper, can serve as guidelines for structuring soft-
ware organizations to include data scientists and to improve data-
driven engineering decision making. Data scientists who are hired
into software development teams can also learn how to improve the
impact and actionability of data science work from the strategies
shared by other data scientists.
7.3 Education As illustrated by the Polymath working style, data science is not
always embodied as a distinct role on the team, but sometimes as a
skillset that blends with other skills such as software development.
Polymaths may become the prevalent work style, if data science
follows the precedent of software testing. Historically, testing was
the domain of a distinct role of testers. Later, however, with the rise
of unit testing and test-driven development, testing became a skill
the developer role practiced as well [48]. Similarly, over time, data
science may become less of a distinct role and more a skillset that
many team members employ. Indeed, every team role has distinct
information needs that could be answered through data analysis.
For instance, program managers have questions about feature use;
testers have questions about hot paths; developers have questions
about execution.
The cross-role need for data analysis suggests that data science
could become a new fundamental for undergraduates in computer
science/informatics. Today’s curricula reflect the current preva-
lence of treating data scientists as a separate role by dividing data
analysis courses from programming courses. The 2013 ACM Cur-
riculum Guidelines for Undergraduate Computer Science [49], for
example, splits knowledge that our participants discussed across
several knowledge areas, including Intelligent Systems (for exam-
ple Reasoning Under Uncertainty, Natural Language Processing),
Information Management (e.g., Data Modeling, Query Languages,
Data Mining), and Software Development Fundamentals. While
curricula are typically designed to allow students to mix and match
to design their own program, the partitioning makes it difficult for
students to emerge with a mix of development and data analysis
skills.
The characterization of data scientists in this paper can also be used
in software engineering courses to illustrate real-life data science.
The activities that data scientists participate in and the skill sets re-
quired can be useful to undergraduate and graduate educators who
teach computer science, statistics, and data science courses. Data
scientists need to combine a deep understanding of software engi-
neering problems, strong numerical reasoning skills, strong pro-
gramming skills, and the ability to communicate the value of mod-
els and insights in domain- and business-specific terms. Computer
science students commonly hold wildly inaccurate preconceptions
about the character of the work they will encounter in their future
software engineering careers [50, 51]
8. CONCLUSION In this paper we characterized the role of data scientists in a large
software company. We observed a demand for designing experi-
ments with real user data and reporting results with statistical rigor.
We shared activities, several success stories, and five distinct styles
of data scientists. We also reported strategies that data scientists use
to ensure that their results are relevant to the company.
Microsoft Research. Technical Report. MSR-TR-2015-30.
© 2015 Microsoft Corporation. All rights reserved. Page 11
ACKNOWLEDGMENTS We thank all interview participants for sharing their story, connect-
ing us with other data scientists, and providing insights. We thank
Alan Ho, Judith Bishop, Brendan Murphy, Kim Herzig, Michaela
Greiler, Tom Ball, Ben Zorn, Sumit Gulwani, Todd Mytkowitz,
Chris Bird, Nachi Nagappan, Mike Barnett, Ratul Mahajan, Jae-
yeon Jung, and Madan Musuvathi for their curiosity. Miryung Kim
performed this work as a visiting researcher at Microsoft Research.
Miryung Kim was in part supported by NSF grants 1238498,
1149391, and 1117902.
APPENDIX A: INTERVIEW GUIDE INTRODUCTION
GOAL. The emerging role and impact of data scientists in software
development teams.
Our goal is to conduct a broad survey on how “big software
data” impacts engineering teams across different organizations
at Microsoft, and how data scientists and other team members
coordinate, communicate, and make decisions based on data-driven insights.
Spread best practices for making data-driven engineering deci-
sions.
LOGISTICS
Confidentiality. Anonymization. Participant sign off.
Audio Recording.
DEMOGRAPHICS
How long have you been at Microsoft?
What do you do at Microsoft?
ROLE. What do you consider your role to be here?
BACKGROUND
How did you get into data science? Background / training / edu-
cation/ resources that you've taken to help with your job
CURRENT PROJECT. Tell me about your current project:
Analysis / decision support questions?
Kinds of data?
How long?
SUCCESS STORY in the PAST: (specific / particular one)
What kinds of information/ insights?
Who/ How do you work with and share insights?
What happened as a result of your analysis? Can you tell us
about business impact?
PITFALL in the PAST: (specific / particular one)
What kinds of information / insights?
Who / How do you work with and share insights?
Training / resources would you need?
What would make your job more effective?
TREND & IMPACT. How data is changing your team?
TOOL/ ENVIRONMENT
Would you show us your work environment? Tools, Data?
CONTACT
Is there anybody else that we should talk to? Others who work
with data—the ones are producing, storing, and using the infor-
mation, etc.
REFERENCES
[1] T. Menzies and T. Zimmermann, "Software Analytics: So
What?," IEEE Software, vol. 30, no. 4, pp. 31-37, July 2013.
[2] A. Mockus, "Engineering big data solutions.," in Fose '14:
Proceedings of the on Future of Software Engineering,
Hyderabad, India, 2014.
[3] D. Patil, Building Data Science Teams, O'Reilly, 2011.
[4] T. H. Davenport, J. G. Harris and R. Morison, Analytics at
Work: Smarter Decisions, Better Results, Harvard Business
Review Press, 2010.
[5] A. Simons, "Improvements in Windows Explorer,"
http://blogs.msdn.com/b/b8/archive/2011/08/29/improvements-
in-windows-explorer.aspx, 2011.
[6] S. Nadella, "Starting FY15 - Bold Ambition & Our Core,"
http://www.microsoft.com/en-us/news/ceo/index.html, 2014.
[7] D. Fisher, R. DeLine, M. Czerwinski and S. M. Drucker,
"Interactions with big data analytics," Interactions, vol. 19, no.
3, pp. 50-59, 2012.
[8] S. Kandel, A. Paepcke, J. Hellerstein and J. Heer, "Enterprise
Data Analysis and Visualization: An Interview Study," in IEEE
Visual Analytics Science & Technology (VAST), 2012.
[9] R. Kohavi, R. Longbotham, D. Sommerfield and R. M. Henne,
"Controlled experiments on the web: survey and practical
guide," Data Mining and Knowledge Discovery, vol. 18, no. 1,
pp. 140-181, 2009.
[10] B. Adams, S. Bellomo, C. Bird, T. Marshall-Keim, F. Khomh
and K. Moir, "The Practice and Future of Release Engineering:
A Roundtable with Three Release Engineers," IEEE Software,
vol. 32, no. 2, pp. 42-49, 2015.
[11] T. H. Davenport and D. Patil, "Data Scientist: The Sexiest Job
of the 21st Century," Harvard Business Review, pp. 70-76,
OCtober 2012.
[12] C. O'Neil and R. Schutt, Doing Data Science: Straight Talk
from the Frontline, O'Reilly Media, 2013.
[13] J. W. Foreman, Data Smart: Using Data Science to Transform
Information into Insight, Wiley, 2013.
[14] T. May, The New Know: Innovation Powered by Analytics,
Wiley, 2009.
[15] H. D. Harris, S. P. Murphy and M. Vaisman, Analyzing the
Analyzers: An Introspective Survey of Data Scientists and
Their Work, O'Reilly, 2013.
[16] Accenture, Most U.S. Companies Say Business Analytics Still
Future Goal, Not Present Reality,
http://newsroom.accenture.com/article_display.cfm?article_id=
4777, 2008.
[17] A. E. Hassan and T. Xie, "Software intelligence: the future of
mining software engineering data," in FOSER '10: Proceedings
of the Workshop on Future of Software Engineering Research,
2010.
[18] D. Zhang, Y. Dang, J.-G. Lou, S. Han, H. Zhang and T. Xie,
"Software Analytics as a Learning Case in Practice:
Approaches and Experiences," in MALETS '11: Proceedings
International Workshop on Machine Learning Technologies in
Software Engineering, 2011.
[19] R. P. L. Buse and T. Zimmermann, "Analytics for software
development," in FOSER '10: Proceedings of the Workshop on
Future of Software Engineering Research, 2010.
[20] J.-G. Lou, Q. W. Lin, R. Ding, Q. Fu, D. Zhang and T. Xie,
"Software Analytics for Incident Management of Online
Services: An Experience Report," in ASE '13: Proceedings of
Microsoft Research. Technical Report. MSR-TR-2015-30.
© 2015 Microsoft Corporation. All rights reserved. Page 12
the Internation Conference on Automated Software
Engineering, 2013.
[21] T. Menzies, C. Bird, T. Zimmermann, W. Schulte and E.
Kocaganeli, "The Inductive Software Engineering Manifesto:
Principles for Industrial Data Mining," in MALETS '11:
Proceedings International Workshop on Machine Learning
Technologies in Software Engineering, 2011.
[22] D. Zhang and T. Xie, "Software analytics: achievements and
challenges," in ICSE '13: Proceedings of the 2013 International
Conference on Software Engineering, 2013.
[23] D. Zhang and T. Xie, "Software Analytics in Practice," in ICSE
'12: Proceedings of the International Conference on Software
Engineering., 2012.
[24] D. Zhang, S. Han, Y. Dang, J.-G. Lou, H. Zhang and T. Xie,
"Software Analytics in Practice," IEEE Software, vol. 30, no. 5,
pp. 30-37, September 2013.
[25] R. P. Buse and T. Zimmermann, "Information needs for
software development analytics," in ICSE '12: Proceedings of
34th International Conference on Software Engineering, 2012.
[26] A. Begel and T. Zimmermann, "Analyze This! 145 Questions
for Data Scientists in Software Engineering," in ICSE'14:
Proceedings of the 36th International Conference on Software
Engineering, Hyderabad, India, 2014.
[27] J. Lin and D. Ryaboy, "Scaling Big Data Mining Infrastructure:
The Twitter Experience," SIGKDD Explorations, vol. 14, no. 2,
pp. 6-19, April 2013.
[28] A. Thusoo, Z. Shao, S. Anthony, D. Borthakur, N. Jain, J. S.
Sen, R. Murhty and H. Liu, "Data Warehousing and Analytics
Infrastructure at Facebook," in Proceedings of ACM SIGMOD
International Conference on Management of Data, New York,
NY, 2010.
[29] R. Sumbaly, J. Kreps and S. Shah, "The Big Data Ecosystem at
LinkedIn," in Proceedings of the ACM SIGMOD International
Conference on Management of Data, New York, NY, 2013.
[30] H. Seo, C. Sadowski, S. Elbaum, E. Aftandilian and R.
Bowdidge, "Programmers' Build Errors: A Case Study (at
Google)," in Proceedings of the 36th International Conference
on Software Engineering, New York, NY, 2014.
[31] C. Lewis, Z. Lin, C. Sadowski, X. Zhu, R. Ou and J. E.
Whitehead, Jr., "Does Bug Prediction Support Human
Developers? Findings from a Google Case Study," in
Proceedings of the 2013 Internation Conference on Software
Engineering, Piscataway, NJ, 2013.
[32] N. Ayawah and W. Pugh, "The Google FindBugs fixit," in
Proceedings of the 19th International Symposium on Software
Testing and Analysis, New York, NY, 2010.
[33] V. R. Basili, "Software modeling and measurement: the
Goal/Question/Metric paradigm," College Park, MD, USA ,
1992.
[34] V. R. Basili, M. Lindvall, M. Regardie, C. Seaman, J. Heidrich,
J. Münch, D. Rombach and A. Trendowicz, "Linking software
development and business strategy through measurement.,"
IEEE Computer, vol. 43, p. 57–65, 2010.
[35] R. Kaplan and D. Norton, "The balanced scorecard—measures
that drive performance," Harvard Business Review, pp. 71-80,
January/February 1992.
[36] J. McGarry, D. Card, C. Jones, B. Layman, E. Clark, J. Dean
and F. Hall, Practical Software Measurement: Objective
Information for Decision Makers, Addison-Wesley
Professional, 2001.
[37] V. R. Basili, "The experience factory and its relationship to
other," in ESEC'93: Proceedings of European Software
Engineering Conference on Software Engineering , 1993.
[38] C. B. Seaman, "Qualitative Methods," in Guide to Advanced
Empirical Software Engineering, F. Shull, J. Singer and D. I.
Sjøberg, Eds., Springer, 2008.
[39] L. Goodman, "Snowball sampling," Annals of Mathematical
Statistics, vol. 32, no. 1, p. 148–170, 1961.
[40] S. J. Janis and J. E. Shade, Improving Performance Through
Statistical Thinking, ASQ Quality Press, 2000.
[41] D. Spencer, Card Sorting: Designing Usable Categories,
Rosenfeld Media, 2009.
[42] K. Glerum, K. Kinshumann, S. Greenberg, G. Aul, V. Orgovan,
G. Nichols, D. Grant, G. Loihle and G. Hunt, "Debugging in the
(Very) Large: Ten Years of Implementation and Experience,"
in SOSP '09: Proceedings of the 22nd ACM Symposium on
Operating Systems Principles, 2009.
[43] R. Musson and R. Smith, "Data Science in the Cloud: Analysis
of Data from Testing in Production," in TTC '13: Proceedings
of the International Workshop on Testing the Cloud , 2013.
[44] S. Lohr, For Big Data Scientists, “Janitor Work” is Key Hurdle
to Insights, New York Times, Aug. 17, 2014.
http://www.nytimes.com/2014/08/18/technology/for-big-data-
scientists-hurdle-to-insights-is-janitor-work.html?_r=1.
[45] P. L. Li, R. Kivett, Z. Zhan, S.-e. Jeon, N. Nagappan, B.
Murphy and A. J. Ko, "Characterizing the differences between
pre- and post- release versions of software," in ICSE '11:
Proceedings of the 33rd International Conference on Software
Engineering , 2011.
[46] R. Musson, J. Richards, D. Fisher, C. Bird, B. Bussone and S.
Ganguly, "Leveraging the Crowd: How 48,000 Users Helped
Improve Lync Performance," IEEE Software, vol. 30, no. 4, pp.
38-45, 2013.
[47] McKinsey Global Institute, Big data: The next frontier for
innovation, competition, and productivity,
http://www.mckinsey.com/insights/business_technology/big_da
ta_the_next_frontier_for_innovation, 2011.
[48] T. Xie, N. Tillmann, J. d. Halleux and W. Schulte, "Future of
developer testing: building quality in code," in FoSER '10
Proceedings of the FSE/SDP workshop on Future of software
engineering research, 2010.
[49] The Joint Task Force on Computing Curricula, Association for
Computing Machinery (ACM), IEEE Computer Society,
Computer Science Curricula 2013: Curriculum Guidelines for
Undergraduate Degree Programs in Computer Science, New
York, NY: ACM, 2013.
[50] M. Hewner, "Undergraduate conceptions of the field of
computer science," in ICER '13: Proceedings of the
international ACM conference on International computing
education research, 2013.
[51] L. A. Sudol and C. Jaspan, "Analyzing the strength of
undergraduate misconceptions about software engineering," in
ICER '10: Proceedings of the international workshop on
Computing education research, 2010.


