
The effect of vibratory stress on the weldingmicrostructure and residual stress distribution
A S M Y Munsi*, A J Waddell and C A Walker
Department of Mechanical Engineering, University of Strathclyde, Glasgow, Scotland, UK
Abstract: Previous studies have suggested that weld microstructure may be modi�ed by the presence
of static stresses. In this investigation, vibratory stress was applied to mild steel specimens while they
were being welded to observe its effect on the residual stress, microstructure and hardness of the
material. Residual stresses were found to decrease in response to vibration whether it was applied
during welding or after welding. It was found that the applied stress in�uenced the grain growth process
in the weld. As a result of the treatment the hardness of the material was found to be increased by 25 per
cent.
Keywords: residual stress, vibratory stress relief, vibratory weld conditioning, microstructure, phase
transformation
1 INTRODUCTION
Welding processes inevitably induce a state of residual
stress into materials and products. This poses a series of
problems, in terms of dimensional stability, corrosion
cracking, reduced fatigue life and structural integrity. The
conventional way to relieve the residual stresses is by
post-weld heat treatment (PWHT), which is an effective
process, but it suffers from several disadvantages: the
cost of treatment in terms of equipment and energy is
high; the growth of oxide scale on the surface implies the
need for subsequent �nishing processes to remove the
scale; in many metals, annealing relieves residual stresses
at the cost of important mechanical properties and, in
some metals, PWHT is unable to relieve the residual
stresses. The use of vibration to modify welding residual
stress has been reported, but as yet the process has not
received a detailed investigation.
The current study is part of a detailed investigation [1]
that was aimed at �nding out whether the vibratory
method could be used systematically to relieve residual
stresses in welded joints. Two forms of treatment have
been investigated with vibratory stress relief (VSR):
‘during-welding’ treatment and ‘post-weld’ treatment. In
the ‘during-welding’ treatments the specimens are
welded while the specimens are being vibrated. On the
other hand, in the ‘post-weld’ treatments the specimens
are welded without any treatment, the specimens cool and
then the vibratory treatments are carried out. The investi-
gation reported here relates to both ‘during-welding’ and
‘post-weld’ treatments. In addition to the residual stress,
this study investigated the effect of vibratory stress on the
crystallographic orientation and change in the hardness of
the weldments due to VSR treatment.
2 BACKGROUND OF THIS RESEARCH
Previous studies involving both ‘during-welding’ and
‘post-weld’ treatments have reported the effect of treat-
ment on residual stresses. It would appear that the effect
of vibration on welding microstructure has not been
reported so far. Only one published paper [1] has been
found that applied a rigid body motion vibration to the
specimens and found an improvement in mechanical
properties of the material. Munsi [2], Aoki and Nishimura
[3], Aoki et al. [4], Maekawa et al. [5] and Nakagiri et al.
[6] have investigated ‘during-welding’ treatments. The
results of those investigations were mixed, in that some
found a reduction in residual stresses and the others con-
cluded with a negative comment. Buhler and Pfalzgraf
[7], Shanker et al. [8], Sonsino et al. [9], Wozney and
Crawmer [10], Houck [11], Botros [12], Rich [13] and
Fenghua and Dexin [14] have all reported on ‘post-weld’
treatments. Buhler and Pfalzgraf [7] reported negative
results. Houck [11] and Botros [12] reported a large
degree of success in reducing residual stress from a high
99
The MS was received on 15 March 2000 and was accepted afterrevision for publication on 19 January 2001.*Corresponding author: Department of Mechanical Engineering,University of Strathclyde, James Weir Building, 75 Montrose Street,Glasgow G1 1XJ, Scotland, UK.
tensile value to an isotropic distribution of negative
stress. Rich [13] was highly successful in reducing the
residual stress from 200 to 38 MPa. Wozney and
Crawmer [10] reported no change in residual stress as a
result of vibratory treatment. Fenghua and Dexin [14]
found a signi�cant reduction in residual stress due to
vibratory treatment, whereas arti�cial ageing showed a
lower reduction than the VSR treatment. Sonsino [9]
found a very small or negligible reduction in residual
stress and commented that VSR could not replace heat
treatment.
Bhadeshia [15] showed that, due to the presence of a
uniaxial applied stress, the form of the transformation
products of the weld (martensite, acicular ferrite, etc.)
became anisotropic. Campbell [16] noticed that grain
re�nement occurred and the mechanical properties were
improved in castings due to the application of vibration
during casting.
It has been established that both ‘during-welding’ and
‘post-weld’ vibration treatments can reduce residual
stresses [2–8, 11–14]. It has also been established that
uniaxial stress causes a change [15] in the grain
orientation, and vibratory stress causes grain re�nement
[16] in cast irons. From the above �ndings, it was
postulated that, like uniaxial stress, vibratory stress
would in�uence grain orientation during the process of
cooling. It was assumed that there might be a relationship
between the reduction in residual stresses and change in
the grain orientation and grain re�nement. This study was
carried out to explore the relationship between the
residual stresses, grain structures and change in hardness
of the materials.
3 TEST SPECIMENS AND MATERIAL
PROPERTIES
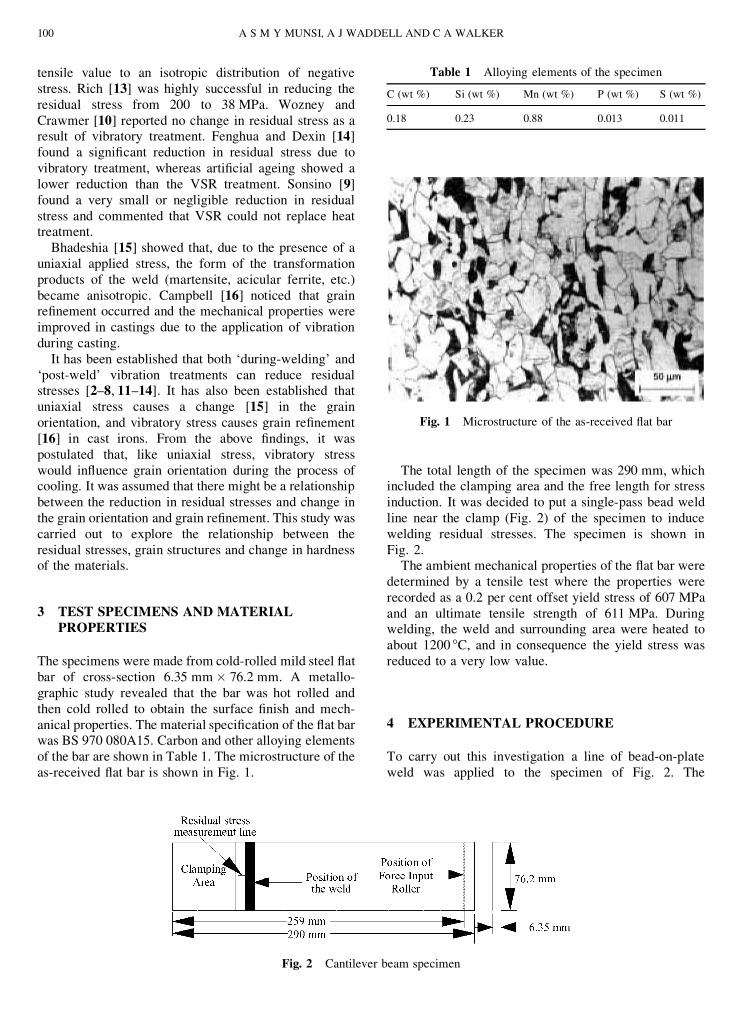
The specimens were made from cold-rolled mild steel �at
bar of cross-section 6.35 mm £ 76.2 mm. A metallo-
graphic study revealed that the bar was hot rolled and
then cold rolled to obtain the surface �nish and mech-
anical properties. The material speci�cation of the �at bar
was BS 970 080A15. Carbon and other alloying elements
of the bar are shown in Table 1. The microstructure of the
as-received �at bar is shown in Fig. 1.
The total length of the specimen was 290 mm, which
included the clamping area and the free length for stress
induction. It was decided to put a single-pass bead weld
line near the clamp (Fig. 2) of the specimen to induce
welding residual stresses. The specimen is shown in
Fig. 2.
The ambient mechanical properties of the �at bar were
determined by a tensile test where the properties were
recorded as a 0.2 per cent offset yield stress of 607 MPa
and an ultimate tensile strength of 611 MPa. During
welding, the weld and surrounding area were heated to
about 1200 °C, and in consequence the yield stress was
reduced to a very low value.
4 EXPERIMENTAL PROCEDURE
To carry out this investigation a line of bead-on-plate
weld was applied to the specimen of Fig. 2. The
Table 1 Alloying elements of the specimen
C (wt %) Si (wt %) Mn (wt %) P (wt %) S (wt %)
0.18 0.23 0.88 0.013 0.011
Fig. 1 Microstructure of the as-received �at bar
Fig. 2 Cantilever beam specimen
100 A S M Y MUNSI, A J WADDELL AND C A WALKER

experimental set-up for this investigation is shown in Fig.
3. Some specimens were welded without any treatment
and some were vibrated applying different levels of
vibratory amplitudes while they were being welded. The
frequency of vibration was kept constant at 25 Hz. In the
‘during-welding’ treatment the welding speed, heat input
and time of vibration were kept constant, and the
amplitude of vibration was varied in which the applied
stress range was from §48 to §288 MPa. Of the
unvibrated specimens, some of them were kept as control
specimens and some were ‘post-weld’ vibratory treated
to relieve the residual stresses. In the ‘post-weld’ treat-
ment the applied stress was kept constant to §300 MPa
and the time of vibration was varied. The residual stresses
of the specimens were measured using an X-ray diffrac-
tometer. The residual stresses of the ‘during-welding’
treated specimens were compared with the residual
stresses with the control specimens. In the ‘post-weld’
treated specimens, the specimens were vibrated in several
steps and the change in the residual stresses due to
treatments was investigated.
The specimens were cut, polished and etched for
metallurgical investigation. In the etching process, 2 per
cent Nital (2 parts nitric acid and 98 parts methanol) was
used as the etching agent. A constant speed of welding
(338 mm/min) was maintained using a stepper-motor-
driven welding torch carrier. The voltage and current in
the welding process were 25 V and 195 A respectively. A
second batch of specimens was processed at a higher
level of heat input. The welding conditions of the two
batches are shown in Table 2.
The welding conditions of the second batch were
changed to increase the heat input to the weld to increase
the width of the heat-affected zone (HAZ) to facilitate a
detailed investigation of the HAZ. It was observed that, in
samples of low heat input, there was not any micro-
structural difference between vibrated and unvibrated
samples. The details of the result are described in the
experimental result section. The different zones of the
weld are shown in the schematic diagram in Fig. 4.
Investigation was carried out in the welds and in the HAZ
(at the weld toe, and on the side of the specimen opposite
the weld).
5 APPLIED STRESS CALIBRATION
The dynamically applied stress was calibrated using a P-
3500 digital strain indicator, an accelerometer, a double
integrator and a multimeter. The calibration was carried
out on the experimental set-up shown in Fig. 3. A strain
gauge was �xed on the selected area (for residual stress
measurement see Fig. 2) of the specimen to measure the
applied stresses in the longitudinal directions. An
accelerometer was attached to the vibrating roller clamp
(Fig. 3). Vibration was applied to the clamp and the
corresponding applied stress at the selected area was
measured. The amplitude of vibration was varied and the
corresponding applied stress was recorded. From the
recorded data the applied stress was calculated in terms of
displacement amplitude of the vibrating clamp. The
calibration constant was found to be 1 V (r.m.s.) equal to
97.9 MPa.
It should be noted here that the above calibration
would be directly valid for the ‘post-weld’ treatments as
Fig. 3 Experimental set-up: �exural vibration treatment of the cantilever beam (MIG, metal inert gas)
Table 2 Welding conditions of the two batches of specimens
Voltage (V) Current (A)Welding speed(mm/min) Number of passes
25 195 338 125.5 204 284 1
THE EFFECT OF VIBRATORY STRESS ON THE WELDING MICROSTRUCTURE 101

it would apply a similar stress to the specimens, but for
the ‘during-welding’ treatments the applied stress in this
calibration would not apply to the real applied stresses.
These would be different due to the localized softening of
the parent metal during welding. Also the non-linear
mechanical properties due to the change in temperature
would cause further complication. However, the calibra-
tion is still valid, since it does ensure that a known degree
of vibration is applied to each specimen.
6 RESIDUAL STRESS MEASUREMENT
The residual stresses were measured using a scanning
X-ray diffractometer (Proto iXRD). After calibrating the
X-ray diffractometer and determining the material elastic
constant, the error band of the diffractometer itself was
reduced to §10 MPa. This error band was used for ‘post-
weld’ treatments. However, for ‘during-welding’ treat-
ments the error band was increased to §20 MPa
considering the fact that in ‘during-welding’ treatment
process the residual stresses of different specimens were
compared after treatment, where there was a possibility
of material property difference from specimen to speci-
men although the specimens were prepared from the
same bar. Contrarily, in the ‘post-weld’ treatment, the
residual stress of the same specimen was compared
before and after treatments, and so there was no possi-
bility of material property difference.
In the X-ray measurement the single-exposure tech-
nique was used, where a line map was measured on the
selected line of the specimens (Fig. 2). The measure-
ments were carried out using a �xed-position X-ray head,
with the goniometer table moved to locate the measure-
ment point under the head. The movement of the
goniometer under the X-ray head was controlled by a
computer. The specimens were located on the goniometer
table using a positioning jig, with six point supports used
to locate the specimens precisely in position each time.
The specimens were levelled using a precision dial
indicator. After positioning the specimens on the jig, they
were clamped using a clamping screw, which prevented
any movement of the specimens relative to the goni-
ometer table and clamping jigs. Since the specimens were
prepared from bright mild steel, there was not any scale
on the surface. After completion of welding, the surface
was cleaned using a soft tissue paper and then the residual
stress measurement was carried out, i.e. no further
surface treatment was carried out. The conditions of the
X-ray measurements are shown in Table 3.
Fig. 4 A schematic diagram of the various subzones of the HAZ approximately corresponding to the alloywith C0 (0.15 wt% C) indicated on the Fe–Fe3C equilibrium. (After Easterling [17])
Table 3 X-ray measurement conditions
X-ray type Cr KaDiameter of the X-ray beam 1 mmBragg angle 156.1°
Measurement angle b 30°
Oscillation of b angle 0°
Peak �t GaussianNumber of exposure 2Error band in ‘post-weld’ treatment §10 MPaError band in ‘during-welding’ treatment §20 MPa
102 A S M Y MUNSI, A J WADDELL AND C A WALKER
7 EXPERIMENTAL RESULTS
7.1 Investigation of residual stresses
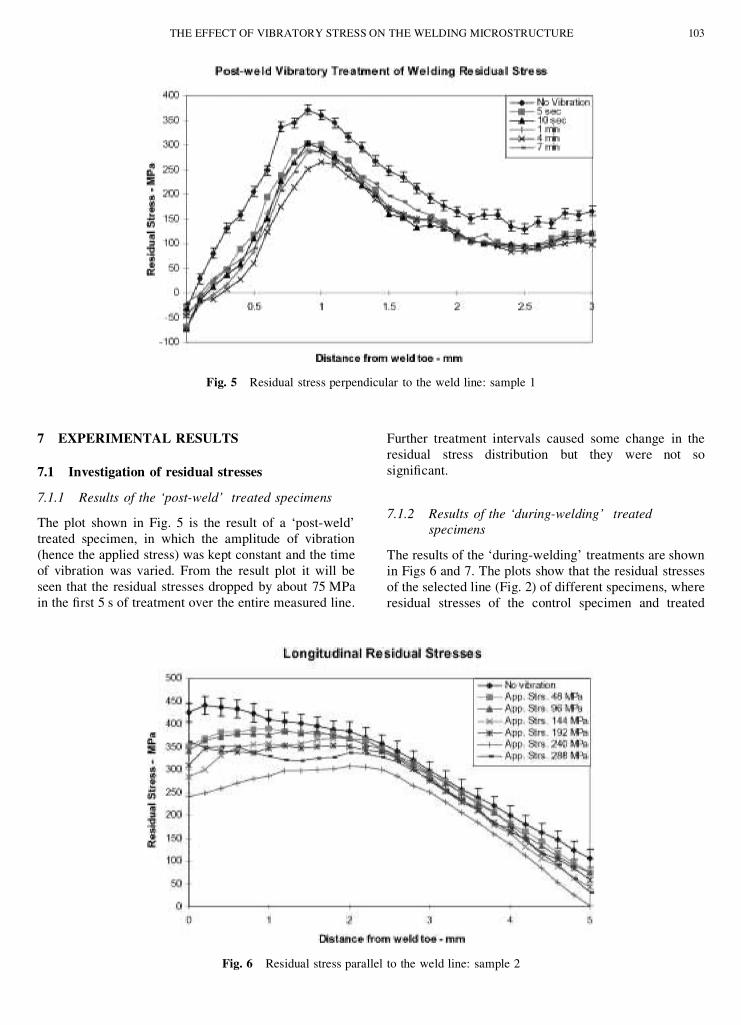
7.1.1 Results of the ‘post-weld’ treated specimens
The plot shown in Fig. 5 is the result of a ‘post-weld’
treated specimen, in which the amplitude of vibration
(hence the applied stress) was kept constant and the time
of vibration was varied. From the result plot it will be
seen that the residual stresses dropped by about 75 MPa
in the �rst 5 s of treatment over the entire measured line.
Further treatment intervals caused some change in the
residual stress distribution but they were not so
signi�cant.
7.1.2 Results of the ‘during-welding’ treated
specimens
The results of the ‘during-welding’ treatments are shown
in Figs 6 and 7. The plots show that the residual stresses
of the selected line (Fig. 2) of different specimens, where
residual stresses of the control specimen and treated
Fig. 5 Residual stress perpendicular to the weld line: sample 1
Fig. 6 Residual stress parallel to the weld line: sample 2
THE EFFECT OF VIBRATORY STRESS ON THE WELDING MICROSTRUCTURE 103

specimens are shown for ease of analysis. In the �rst plot
(Fig. 6), the residual stresses parallel to the weld line are
shown and, in the second plot (Fig. 7), the residual
stresses perpendicular to the weld line are shown.
It will be seen from the plot that the residual stresses
parallel to the weld line were found to decrease with the
application of a low level of applied stress (§48 MPa).
With increase in the applied stress the residual stress was
found to decrease further. However, beyond a certain
level of applied stress the residual stress did not decrease
further. The residual stresses perpendicular to the weld
line were found to increase with the application of a low
stress (§48 MPa) and were found to increase further with
an increase in the applied stress. Beyond a certain level of
applied stress (§192 MPa), a further decrease in the
residual stress was observed.
7.2 Crystallographic investigations
7.2.1 Investigation of ‘post-weld’ treated specimens
Different sections of the weld and surrounding area of the
‘post-weld’ treated specimens were cut, polished and
etched for this investigation. This found no difference
between the microstructure of ‘post-weld’ treated speci-
mens and untreated (control) specimens, in line with prior
expectations.
7.2.2 Investigation of ‘during-welding’ treated
specimens
Investigation of weld toe. Investigation was carried out
in the weld toe (in the HAZ). The weld toe was polished
and etched. In the welds of low heat input, the HAZ was
small (0.6–0.8 mm). This made it dif�cult to observe the
characteristics of the microstructure in detail. However,
no signi�cant difference between the microstructures of
the vibrated and unvibrated (control) specimens was
found. In the specimens of high heat input some
differences between the microstructures of the HAZ
were observed. However, they were not clear due to the
small width (0.35–0.5 mm) of the grain growth zone.
Investigation in the side opposite the weld. The side
opposite the weld of the plate was investigated. In low
heat input welds there was no difference between the
crystallographic structures of the vibrated and unvibrated
specimens. However, an increase in the heat input in the
specimens caused a signi�cant difference. In the high
heat input specimens, observation of the oxide bands
showed that the peak temperature of the investigated area
was between 1150 and 1300 °C; i.e. the investigated area
was in the grain growth zone (shown in Fig. 4). In this
investigation, one specimen was welded without any
vibration and six were vibrated applying three different
amplitudes while the specimens were being welded
(Table 4). For the unvibrated control specimen, �ve
Fig. 7 Residual stress perpendicular to the weld line: sample 2
Table 4 Applied stresses and time of vibrations to the
specimens
Number of specimensprocessed
Applied stress level(MPa)
Time of vibration(min)
2 §75 2*2 §150 2*2 §224 2*
* The time of vibration 2 min) includes 16 s of welding time.
104 A S M Y MUNSI, A J WADDELL AND C A WALKER
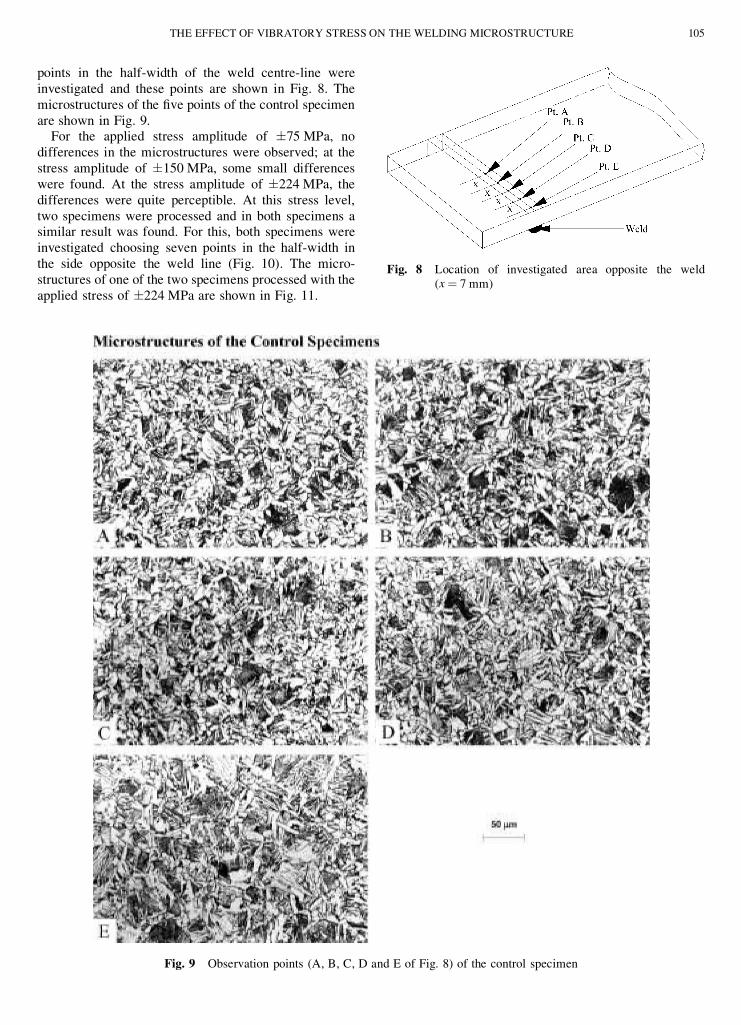
points in the half-width of the weld centre-line were
investigated and these points are shown in Fig. 8. The
microstructures of the �ve points of the control specimen
are shown in Fig. 9.
For the applied stress amplitude of §75 MPa, no
differences in the microstructures were observed; at the
stress amplitude of §150 MPa, some small differences
were found. At the stress amplitude of §224 MPa, the
differences were quite perceptible. At this stress level,
two specimens were processed and in both specimens a
similar result was found. For this, both specimens were
investigated choosing seven points in the half-width in
the side opposite the weld line (Fig. 10). The micro-
structures of one of the two specimens processed with the
applied stress of §224 MPa are shown in Fig. 11.
Fig. 8 Location of investigated area opposite the weld
(x ˆ 7 mm)
Fig. 9 Observation points (A, B, C, D and E of Fig. 8) of the control specimen
THE EFFECT OF VIBRATORY STRESS ON THE WELDING MICROSTRUCTURE 105

The microstructures of the control specimen (Fig. 9)
were compared with the microstructures of the specimens
vibrated at an applied stress of §224 MPa (Fig. 11). The
microstructures of the unvibrated specimen were found to
be isotropic, with no particular arrangement of the crystal
structure. The vibrated specimens showed a completely
different picture in that the crystals were found to be
arranged according to the direction of the applied
stresses. The ferrite crystals were found to form at
approximately §45° to the direction of the applied
stresses (see, in particular, points C, D, E and F of
Fig. 11). The orientations of the crystals were found to
be position dependent in the specimen. At the mid-
width there was a very small or negligible orientation
of the crystals but towards the edge of the specimen
the orientation increased and again very near to the
edge the orientation was found to be very small.
Figure 12 explains the trend of the crystal structure
arrangements.
Investigation in the weld microstructure. The weld top
surface was polished and etched. The control specimen
was compared with specimens subjected to an applied
stress of §224 MPa. The crystal structures of the weld
top of the control specimens showed a random pattern
structure with no particular trend of arrangement of the
crystal structures. In the specimens vibrated at stress
amplitude of §224 MPa, some pattern arrangement of the
crystal structures was observed. Ferrite crystals were
found to be aligned according to the directions of the
applied stress. However, this pattern was not particularly
evident.
Investigation in the sectioned weld. The welds were
sectioned for observation (Fig. 13). The section faces
were polished and etched. On the section face, three
points were observed, details of which are shown in Fig.
14.
For points A and B of Fig. 14, the vibrated specimens
showed the approximately §45° alignment pattern of the
crystal structures. Point A of Fig. 14 showed a more
clearly de�ned cross pattern than that of point B. The
ferrite crystal cross patterns were found to form at
approximately §45° to the direction of the applied
stresses. Near the weld toe (point C in Fig. 14), no
particular orientation was found. The ferrite grains at the
observed points (points A, B and C) of the control
specimens were in a random pattern, with no particular
orientation.
Comparison of crystal size. For comparison of the size
of the crystals, point A (of Fig. 14) of a welded section
was magni�ed similar to that of the magni�cation of the
as-received �at bar of Fig. 1. In the vibrated sample (Fig.
15) the grain sizes were found to be re�ned and aligned
approximately §45° to the applied stress due to the
vibratory stresses.
7.3 Investigation of hardness of the specimens
The hardnesses of the control specimens and specimens
subjected to vibration were measured. Two groups of
specimens were tested. In the �rst group, a total of four
points were measured (points A, B, C and D of Fig. 8). In
the second group, all �ve points (A, B, C, D and E) of Fig.
8 were measured. The hardnesses of the two groups are
shown in Tables 5 and 6.
In the �rst group the specimens subjected to an applied
stress of §150 MPa showed similar hardnesses to the
hardnesses of the control specimens. With increase in the
applied stress to §224 MPa, the hardnesses of the metal
increased by up to 19 per cent. In the second group the
applied stress was §224 MPa, and the hardnesses were
found to increase by up to 25 per cent in comparison with
those of the control specimens.
106 A S M Y MUNSI, A J WADDELL AND C A WALKER
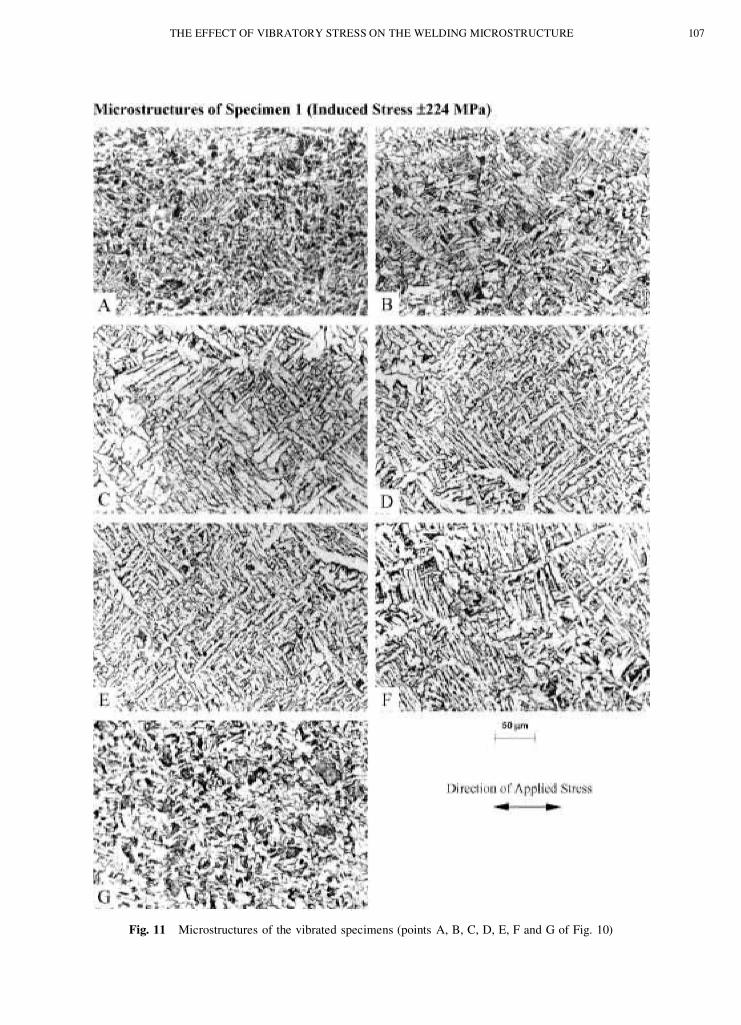
Fig. 11 Microstructures of the vibrated specimens (points A, B, C, D, E, F and G of Fig. 10)
THE EFFECT OF VIBRATORY STRESS ON THE WELDING MICROSTRUCTURE 107

8 DISCUSSION OF RESULTS
In the ‘post-weld’ treatment, the residual stresses perpen-
dicular to the weld line were measured. The stress levels
were found to decrease by about 75 MPa in the �rst 5 s of
vibration. An increase in the vibration time did not show
any further decrease in residual stress. The metallurgical
investigation of the ‘post-weld’ treated specimens
showed no difference between the microstructures of
the control specimens and the microstructure of ‘post-
weld’ treated specimens. This implies that ‘post-weld’
vibratory treatment does not result in any microstructural
difference, which is visible in optical microscopy (as
could be anticipated).
The residual stresses parallel and perpendicular to the
weld line of the ‘during-welding’ treated specimens were
Fig. 12 Applied shear stresses on the side opposite the weld (reproduced from a �nite element softwareANSYS plot) and percentage of ferrite crystals oriented approximately §45° to the applied stress axis
Fig. 13 Position of the sectioned area under investigation
108 A S M Y MUNSI, A J WADDELL AND C A WALKER

measured. The residual stresses parallel to the weld line
were found to decrease at low levels of applied stresses.
An increase in the applied stress caused a further decrease
but to a lesser degree. The residual stresses perpendicular
to the weld line were found to increase with application
of a small and medium range of applied stresses but after
a certain level of applied stress the residual stresses were
found to decrease. The metallurgical investigation of the
specimens of low heat input showed no observable
difference in the microstructures. The samples of high
heat input showed cross patterns of the ferrite crystal
structures in the direction at approximately §45° to the
stress axis. This result shows agreement with the work of
Bhadeshia [15], who applied a uniaxial static stress to the
specimens and found anisotropy in the crystal structures.
It may be concluded that, like the static stress used in
Bhadeshia’s work, the dynamic applied stresses have a
similar effect on the transformation products of austenite.
This orientation of the change in the crystal structure
appears to be related to the dynamic applied shear stress
characteristics of the specimens. The dynamic stress
applied to the specimens was determined by a �nite
element analysis (Fig. 12). It was found that the
distribution of the dynamic shear stresses in the speci-
mens was similar to the trend of the crystal orientation
found in this investigation. The similarity of the curves in
Fig. 12 tend to indicate that the change in structure is
related to the applied shear stress.
The orientations of the crystals of the specimens were
observed from two perpendicular planes of the weld (Figs
10 and 14), and from both observation planes the
orientation of the ferrite crystals was seen to be at
approximately §45° to the stress axis. This implies that
the orientation was not simply 45° to the stress axis. This
angle may be determined from the cube shown in Fig. 16,
where the crystals are seen to be aligned at 45° to the
Fig. 14 Position of the investigated area of the weld sections
Fig. 15 Microstructure of point A of Fig. 14
Table 5 Vickers hardnesses of vibrated and control speci-
mens (�rst group)
Measurementpoint
Vickers hardness*Maximumincrease inhardness(%)
Controlspecimen
Appliedstress§150 MPa
Appliedstress§224 MPa
A 177.4 158.7 180.6 2B 161.5 162.6 188.7 17C 165.4 159.3 190.8 15D 158.7 159.8 189.4 19
* The error band of the Vickers hardness numbers is §2.
Table 6 Vickers hardnesses of the vibrated and control
specimens (second group)
Measurementpoint
Vickers hardness
Maximum increasein hardness (%)
Controlspecimen
Applied stress§224 MPa
A 159.8 185.9 16B 160.4 188 17C 158.7 193.6 22D 161.5 194.4 20E 165.9 208.1 25
Fig. 16 Viewing direction of the crystal orientations
THE EFFECT OF VIBRATORY STRESS ON THE WELDING MICROSTRUCTURE 109
stress axis on two perpendicular planes. This can only
happen if the crystals are aligned along the diagonal of
the cube. If the observation axes are X and Y and the force
axis is Z, then the orientation angle with the stress axis is
y ˆ 55° (Fig. 16).
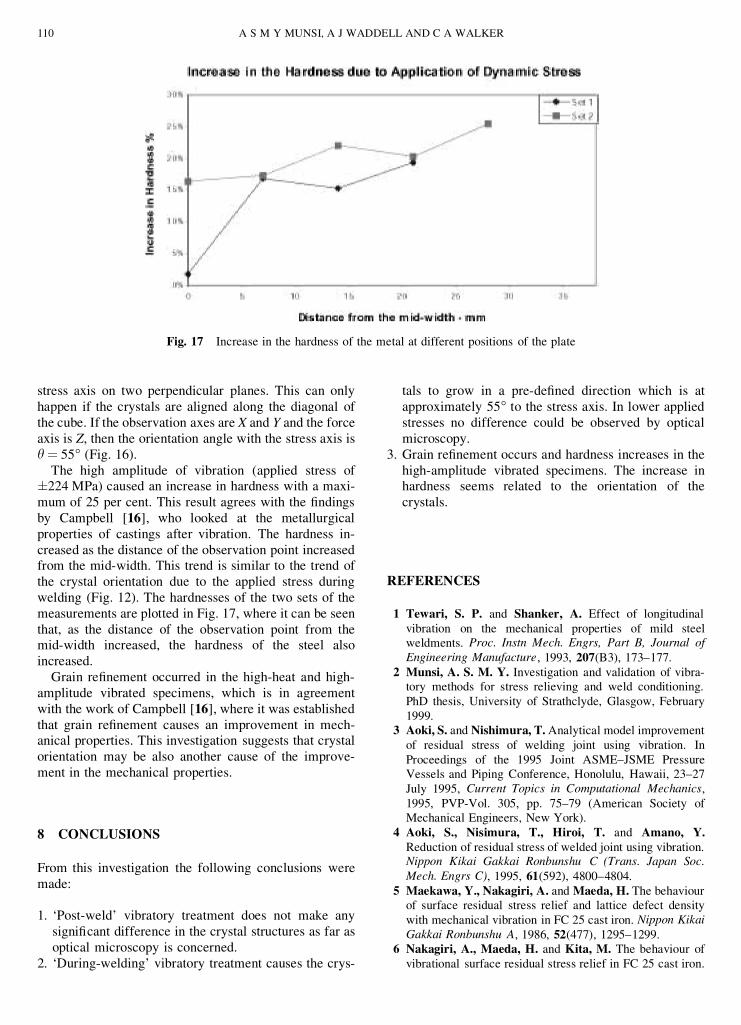
The high amplitude of vibration (applied stress of§224 MPa) caused an increase in hardness with a maxi-
mum of 25 per cent. This result agrees with the �ndings
by Campbell [16], who looked at the metallurgical
properties of castings after vibration. The hardness in-
creased as the distance of the observation point increased
from the mid-width. This trend is similar to the trend of
the crystal orientation due to the applied stress during
welding (Fig. 12). The hardnesses of the two sets of the
measurements are plotted in Fig. 17, where it can be seen
that, as the distance of the observation point from the
mid-width increased, the hardness of the steel also
increased.
Grain re�nement occurred in the high-heat and high-
amplitude vibrated specimens, which is in agreement
with the work of Campbell [16], where it was established
that grain re�nement causes an improvement in mech-
anical properties. This investigation suggests that crystal
orientation may be also another cause of the improve-
ment in the mechanical properties.
8 CONCLUSIONS
From this investigation the following conclusions were
made:
1. ‘Post-weld’ vibratory treatment does not make any
signi�cant difference in the crystal structures as far as
optical microscopy is concerned.
2. ‘During-welding’ vibratory treatment causes the crys-
tals to grow in a pre-de�ned direction which is at
approximately 55° to the stress axis. In lower applied
stresses no difference could be observed by optical
microscopy.
3. Grain re�nement occurs and hardness increases in the
high-amplitude vibrated specimens. The increase in
hardness seems related to the orientation of the
crystals.
REFERENCES
1 Tewari, S. P. and Shanker, A. Effect of longitudinal
vibration on the mechanical properties of mild steel
weldments. Proc. Instn Mech. Engrs, Part B, Journal of
Engineering Manufacture, 1993, 207(B3), 173–177.
2 Munsi, A. S. M. Y. Investigation and validation of vibra-
tory methods for stress relieving and weld conditioning.
PhD thesis, University of Strathclyde, Glasgow, February
1999.
3 Aoki, S. and Nishimura, T. Analytical model improvement
of residual stress of welding joint using vibration. In
Proceedings of the 1995 Joint ASME–JSME Pressure
Vessels and Piping Conference, Honolulu, Hawaii, 23–27
July 1995, Current Topics in Computational Mechanics,
1995, PVP-Vol. 305, pp. 75–79 (American Society of
Mechanical Engineers, New York).
4 Aoki, S., Nisimura, T., Hiroi, T. and Amano, Y.
Reduction of residual stress of welded joint using vibration.Nippon Kikai Gakkai Ronbunshu C (Trans. Japan Soc.
Mech. Engrs C), 1995, 61(592), 4800–4804.
5 Maekawa, Y., Nakagiri, A. and Maeda, H. The behaviour
of surface residual stress relief and lattice defect density
with mechanical vibration in FC 25 cast iron. Nippon Kikai
Gakkai Ronbunshu A, 1986, 52(477), 1295–1299.
6 Nakagiri, A., Maeda, H. and Kita, M. The behaviour of
vibrational surface residual stress relief in FC 25 cast iron.
Fig. 17 Increase in the hardness of the metal at different positions of the plate
110 A S M Y MUNSI, A J WADDELL AND C A WALKER

Nippon Kikai Gakkai Ronbunshu A, 1984, 50(452), 751–
757.
7 Buhler, H. and Pfalzgraf, H. G. Investigation into the
reduction of residual welding stresses by alternating stress
tests or mechanical vibration. Schweisse Schreiden, 1964,
16(5), 178–184.
8 Shanker, S., Wood, W. E. and Khan, K. H. Effect of
vibratory stress relief treatments on residual stress in mild
steel butt welds. In Proceedings of the 12th National
SAMPE Technical Conference, 7–9 October 1980, pp.
776–786.
9 Sonsino, S. M., Muller, F., deBack, J. and Gresnigt, A.
M. In�uence of stress relieving by vibration on the fatigue
behaviour of welded joints in comparison to post-weld heat
treatment. Fatigue Fracture Engng Mater. Structs, 1996,
19(6), 703–708.
10 Wozney, G. P. and Crawmer, G. R. An investigation of
vibration stress relief in steel. Weld. Res. Suppl., 1968,
23(9), 411–419.
11 Houck, F. Putting vibration to work. Mech. Engng, 1966,
88(9), 48–50.
12 Botros, B. M. Residual stresses in welded steel structure. II.
SME technical paper MF80-305, 1980.
13 Rich, S. R. Quantitative measurement of vibratory stress
relief. Weld. Engr, 1969, 54(3), 44–45.
14 Fenghua, S. and Dexin, F. Tests of residual stress on
welded structure under vibratory stress relief. J. Dalian
Univ. Technol., August 1994, 34(4), 390–393.
15 Bhadeshia, H. K. D. H. Possible effects of stress on steel
weld microstructure. In Mathematical Modelling of Weld
Phenomena., Vol. 2, 1995, pp. 71–118 (Institute of
Materials, London).
16 Campbell, J. Effect of vibration during solidi�cation. Int.
Metals Rev., 1981, 26(2), 71–108.
17 Easterling, K. Introduction to the Physical Metallurgy of
Welding, 1992 (Butterworth–Heinemann, Oxford).
THE EFFECT OF VIBRATORY STRESS ON THE WELDING MICROSTRUCTURE 111


