
The Effect of Regulatory Harmonization on Cross-border Labor Migration: Evidence from the Accounting Profession*
Matthew J. Bloomfield Booth School of Business, University of Chicago
Ulf Brüggemann
School of Business and Economics, Humboldt University of Berlin
Hans B. Christensen Booth School of Business, University of Chicago
Christian Leuz
Booth School of Business, University of Chicago & NBER
September 2016
Abstract The paper examines whether international regulatory harmonization increases cross-border labor migration. To study this question, we analyze European Union (EU) initiatives that harmonized accounting and auditing standards. Regulatory harmonization should reduce economic mobility barriers, essentially making it easier for accounting professionals to move across countries. Our research design compares the cross-border migration of accounting professionals relative to tightly-matched other professionals before and after regulatory harmonization. We find that international labor migration in the accounting profession increases significantly relative to other professions. We provide evidence that this effect is due to harmonization, rather than increases in the demand for accounting services during the implementation of the rule changes. The findings illustrate that diversity in rules constitutes an economic barrier to cross-border labor mobility and, more specifically, that accounting harmonization can have a meaningful effect on cross-border migration.
JEL classification: D10, E24, F22, F55, F66, J44, J61, J62, K22, L51, L84, M41, M42 Key Words: Accounting harmonization, Regulation, IFRS, European Union, Labor migration
and mobility
* Accepted by Mark Lang. We appreciate the helpful comments of Mary Barth, Jannis Bischof, Matthias Breuer, Willem Buijink, Richard, Crowley, Scott Emett, Joachim Gassen, Chris Hansen, Alan Jagolinzer, Morris Kleiner, Michael Welker, Steve Zeff as well as workshop participants at Bristol University, University of Chicago, Colorado Summer Accounting Research Conference, Cornell University, EAA Annual Congress 2015, University of Exeter, Frankfurt School of Finance and Management, Global Issues in Accounting Conference 2014, IHW Halle, University of Illinois at Urbana-Champaign, Lancaster University, London Business School, University of Manchester, University of Paderborn, Queen’s University, Rice University, Erasmus University Rotterdam, Vienna University of Economics and Business, WHU, XI Workshop on Empirical Research in Financial Accounting and University of Zurich. This study is based on data from Eurostat, Labour Force Survey, 2002-2010. The responsibility for all conclusions drawn from the data lies entirely with the authors. We thank Marie Johann (DAAD) for kindly providing data on the Erasmus program. Christian Leuz gratefully acknowledges research funding provided by the Initiative on Global Markets (IGM) at the University of Chicago Booth School of Business.

1
1. Introduction
In recent years, we have witnessed a strong push towards global convergence of rules in
many areas of regulation. These initiatives are often intended to ease cross-border investments
and to improve the allocation of capital (e.g., FSAP, 1999). Research in accounting and finance
has analyzed whether regulatory harmonization indeed increases cross-border capital flows and
has associated benefits such as increased liquidity and lower cost of capital (see Leuz and
Wysocki, 2016, for an overview). Capital, however, is not the only factor of production for
which diversity in rules could create economic barriers to mobility. Regulatory harmonization
should also make it easier for professionals to seek employment outside of their home country,
which in turn should improve the efficiency of labor markets. Indeed, labor mobility could be an
important adjustment mechanism through which regions adjust to asymmetric economic shocks,
especially in a currency union such as the Eurozone (Mundell, 1961; Farhi and Werning, 2014).
However, there is no evidence on the role and potential benefits of regulatory harmonization for
cross-border labor mobility.
In this paper, we analyze the effects of regulatory harmonization affecting the accounting
profession in the European Union (EU) on cross-border labor migration. This setting has several
desirable features from a research-design perspective. First, the accounting profession generally
has a higher level of standardization than comparable occupations (Madsen, 2011), and
regulatory harmonization has typically taken the form of adopting identical rules (or standards).
Both factors should make it easier to detect an effect of regulatory harmonization on labor
migration in the accounting profession, if there is one. Second, there is free movement of labor in
the EU. Free movement of labor ensures that we can focus on regulatory harmonization and
economic barriers, rather than immigration policies and other explicit restrictions. Third, there
has been a relatively sharp increase in regulatory harmonization for the accounting profession in

2
the EU in recent years. In particular, two EU initiatives have substantially harmonized the rules
relevant to those working in the accounting profession: (1) after mandatory reporting under IFRS
publicly traded firms use identical accounting standards; (2) Directive 2006/43/EC harmonized
statutory audits of companies’ annual accounts and consolidated financial statements. We
analyze changes in cross-border labor mobility around these regulatory changes. Henceforth, we
refer to these changes also as “the treatment”.
Our data are based on the EU’s annual Labour Force Survey (LFS). The LFS is meant to
generate a representative sample for each country using a standardized methodology, which
substantially improves the comparability of mobility statistics across countries. In addition, the
LFS data are collected at the individual level, giving us a rich set of demographics to control for
other factors that affect migration. Following the literature, our main analysis is based on
changes in a stock measure of migrants, i.e., the number of individuals that have a foreign
nationality and were born abroad (Martí and Ródenas 2007; Bonin et al., 2008). To get closer to
migration flows around regulatory changes, we also present analyses using a novel quasi-flow
measure that starts from the stock measure but counts only foreigners that recently changed jobs,
who are more likely to have moved in response to accounting and auditing harmonization.
Our identification strategy exploits that the regulatory changes primarily affect the
accounting profession. Thus, we perform a difference-in-differences estimation comparing
changes in cross-border mobility of accounting professionals with changes in mobility of other
professions around regulatory harmonization. We estimate the effects relative to three separate
control groups: legal professionals, all other professionals, and a combination of business people.
We control for demographic characteristics known to determine migration (i.e., gender, marital
status, age, education level, and the presence of children), including all possible interactions of
these characteristics in order to account for non-linearities in these categorical demographics. In

3
addition, we estimate the effects within country and year to account for unrelated changes and
shocks affecting labor mobility of professionals (e.g., changes in economic growth,
unemployment benefits, national adjustments to survey methodology, etc.). To further tighten
our design, we perform a double-matched difference-in-differences analysis. We pair accounting
and control professionals from a given country by the exact same characteristics (e.g., single
males, in Germany, between 25-29 years old, without children, with a university degree) for a
year in the pre-treatment period and a year in the post-treatment period, creating a quadruplet.
We then compute the relative change in mobility rates within each quadruplet. This double-
matched approach assures perfect overlap in characteristics across treatment and control groups
as well as across time and hence controls for composition changes in the survey sample.
Using the above setting and design, we find that cross-border labor migration increases
for accounting professionals relative to matched professionals around the EU harmonization of
accounting and auditing standards. The estimated increase in labor mobility is fairly similar
across specifications and control groups. In our preferred (and most restrictive) specifications,
the magnitude is between 20% and 22% of the pre-treatment mobility rate. This percentage
increase implies that 10,000 to 16,000 accounting professionals moved within the EU as a result
of regulatory harmonization, which is economically significant.
An important challenge for estimating the cross-border mobility effects of regulatory
harmonization is that even regulatory changes without harmonization could increase labor
mobility simply by changing the demand for accounting services. To see this, consider the
Sarbanes-Oxley Act (SOX), which is not intended to harmonize accounting and auditing in the
U.S. 1 Nevertheless, SOX likely increases labor mobility in the U.S. due to changes in the
1 We thank one of our reviewers for providing this example. We note that regulatory harmonization can also change demand (e.g., by lowering the wages for accountants). As such knock-on effects are still the result of harmonization, we do not attempt to separate them in our empirical analyses (see Section 2).

4
demand for accounting services leading to new matches between employers and accountants
(e.g., with respect to internal control skills). Such demand effects could confound our analysis
and overstate the cross-border mobility effects due to harmonization.
However, a non-harmonizing regulatory change such as SOX should affect both the
demand for domestic and foreign accountants. For example, new matching of accountants and
employers can take place across borders but also domestically. In contrast, cross-border
harmonization effects should be specific to foreigners. Thus, we introduce controls for changes
in domestic job mobility to absorb demand effects. Doing so hardly changes the estimated
treatment coefficient, which is inconsistent with a demand explanation for our results.
Next, we perform a series of robustness tests that evaluate other design assumptions and
data challenges. First, our analysis assumes that the mobility trends in the accounting profession
would have been parallel to those in the control groups had there been no regulatory
harmonization in accounting. To assess the validity of this assumption, we provide graphical
evidence that the pre- period trends are similar. We also show that pre-treatment mobility rates
are close once we control for demographic characteristics. In addition, we consider several
potential violations of the parallel-trends assumption, including differential changes in cross-
border student mobility as well as licensing rules, and find that they cannot explain our results.
Second, we face two major data constraints. One constraint is that the LFS dataset does
not provide researchers with job codes at the most granular level. Hence, we cannot perfectly
identify accountants and auditors. For instance, the treatment group also contains personnel and
career professionals. However, as long as the fraction of non-accountants in the treatment group
does not systematically change around harmonization, which we verify to be the case, the
difference-in-differences analysis takes care of this data issue.

5
The other LFS data constraint is that it is difficult to construct reliable flow measures of
cross-border migration: low incidence rates cause a mini-domain problem (Purcell and Kish,
1980) and sampling techniques cause inconsistencies with population registers (Martí and
Ródenas, 2007). We therefore base our main analysis on a stock measure and a novel quasi-flow
measure using information about recent job changes. However, for these two measures, the
timing of migration cannot be determined, yet naturally matters given our research question.
Again, this data limitation should not affect the difference-in-differences analysis as long as the
rate of earlier migration outside the relevant analysis window does not systematically change
over time. We further mitigate this issue by using a quasi-flow measure, which has a time
dimension based on job changes. In addition, we provide sensitivity tests using two flow
measures, for which we can determine the exact timing of migration. While these tests confirm
that flow measures have low incidence rates resulting in noisier estimates, we still find
significantly positive mobility effects after regulatory harmonization among those individuals
who are expected to be most responsive (i.e., singles without children, especially when they are
young or work for large employers), which corroborates our main results.
Finally, we examine cross-country variation in the migration effects. We find that our
results continue to hold when we restrict the analysis to EU-15 source and destination countries.
The estimates are smaller but still significant, which is noteworthy because prior research finds
that the migration response in the EU-15 is generally low, for instance, when it comes to labor
market shocks (Bonin et al., 2008; Dao et al., 2014; OECD, 2014). Showing the results hold
within the EU-15 also alleviates the concern that EU enlargement unduly influences our
estimates. We also examine other sources of cross-country variation, such as the degree to which
audit standards are harmonized, the fraction of public firms that adopt IFRS, licensing rules, and
the market share of Big-4 auditors. While it is difficult to ex ante sign predictions for these
6
factors as well as to isolate their effects empirically, the evidence suggests that cross-border
migration effects are stronger when there is more harmonization, licensing rules are less strict,
and Big-4 auditors have a larger market share, consistent with the interpretation that regulatory
harmonization drives our results.
Our paper makes several contributions to the literature. First, the literature on accounting
harmonization focuses almost exclusively on informational effects in capital markets.2 However,
accounting harmonization potentially also affects the efficiency of labor markets, which would
be economically important. Our study is the first to examine and document this effect. Our
findings, which demonstrate relatively strong effects from accounting and auditing
harmonization on cross-border labor mobility, may appear inconsistent with recent evidence
suggesting that the capital-market effects attributable to accounting harmonization via IFRS
adoption are fairly modest or even non-existent (e.g., Daske et al., 2008; Christensen et al.,
2013). A potential explanation for weak capital-market results is that reporting standards grant
managers discretion with respect to their application. Hence, capital-market effects hinge
critically on whether harmonized standards alter managers’ reporting incentives and the extent to
which standards are being enforced (e.g., Ball et al., 2003; Burgstahler et al., 2006; Daske et al.,
2013). The role of these forces is less obvious in a labor market setting. For instance, accountants
and auditors need to know the relevant accounting and auditing rules to perform their jobs even
if the standards grant managers discretion. Moreover, formal harmonization could have effects
even when enforcement is weak. Therefore, we do not view our findings as inconsistent with
those in the capital-market literature.
2 See, e.g., Barth (2006), Soderstrom and Sun (2007), Hail et al. (2010) and Brüggemann et al. (2013) for reviews. There are two exceptions. Wu and Zhang (2009) document an increase in the sensitivity of CEO turnover to net earnings after voluntary IFRS adoption. Balsam et al. (2015) find an increase in CFO pay around IFRS adoption consistent with better monitoring and increased responsibility. There is also an accounting literature examining labor market outcomes for executives (see Armstrong et al., 2010) and for analysts (see Healy and Palepu, 2001).

7
Second, we contribute to the economics literature on cross-border labor migration. Much
of this prior literature has focused on the effect of wage and unemployment differentials as well
as legal barriers in the form of immigration laws (Zaiceva and Zimmermann, 2008; Skupnik,
2013) or occupational licensing rules (Holen, 1965; Kleiner et al., 1982). Immigration laws and
occupational licensing rules are explicit government-enforced rules restricting who can move
into a particular country or who can offer services in a particular market. The general result in
this literature is that explicit restrictions create mobility barriers (see Kleiner, 2000, for an
overview). International differences in the rules governing work practices or professions, which
are the focus of our study, are different in that they constitute an implicit economic barrier, rather
than an explicit government intervention aimed at restricting entry. Disparate professional rules
are more akin to frictions that impede the portability of social security (D’Addio and Cavalleri,
2015) and tax differentials that encourage migration (e.g., Conway and Houtenville, 1998, 2001;
Bakija and Slemrod, 2004; Coomes and Hoyt, 2008; Kleven et al., 2014). However, access to
social security and tax differentials create direct monetary incentives to migrate (or not), whereas
disparate rules create economic barriers via the required human capital investments by potential
migrants.
Showing that differential professional rules indeed constitute a substantial barrier to
cross-border labor mobility illustrates that the costs of learning and practicing other standards are
economically significant. It further suggests that regulatory harmonization can be a policy
instrument to improve cross-border mobility and labor market efficiency. Indeed, creating and
improving the EU’s “internal market,” in which goods, services, capital, and people can move
freely, is the main motivation for regulatory harmonization (e.g., FSAP, 1999). Our evidence
suggests that disparate rules can be an economic barrier to cross-border migration and that
regulatory harmonization can have economically large effects on mobility (even within the EU-

8
15 where migration responses are typically low). We acknowledge, however, that our findings
are limited to the accounting profession, for which harmonization could arguably play a greater
role. Hence, the magnitude of our estimates needs to be interpreted carefully.
2. Conceptual Underpinnings and Institutional Setting
In their migration decision, individuals trade off the initial costs of migration against the
expected increase in income (Roy, 1951; Sjaastad, 1962; Borjas, 1987) as well as other potential
benefits from moving, including better educational and job opportunities for their children. The
costs of migration include transportation costs, income losses during migration, non-portable
social rights losses, and psychological costs (Stark and Bloom, 1985; Massey et al. 1993;
D’Addio and Cavalleri, 2015).
Another obstacle and hence cost of migration could come from differential rules and
regulations of which knowledge is relevant when working in a particular profession. For
instance, an auditor, lawyer, or building engineer who wants to move abroad needs to learn and
know the accounting and auditing standards, laws, and building codes of the destination country,
respectively, in order to perform the job. Thus, diversity in rules could act as an implicit
economic barrier to labor migration, even when entry into the profession is unrestricted.
Harmonization of professional rules across countries should, ceteris paribus, reduce this
mobility barrier and hence could increase cross-border labor migration. Consistent with this
argument, the EU’s regulatory harmonization intends to improve the functioning of the internal
market so that goods, services, capital, and people can move freely. For instance, the Financial
Services Action Plan (FSAP), which was established in 1999 with the goal to improve and
harmonize EU financial market regulation through a series of legislative initiatives, explicitly
cites the plan’s potential to increase labor migration as one of the motivations for regulatory
9
reform.3 Providing some anecdotal evidence, comment letters sent to the European Commission
for its “Consultation on the Impact of IAS Regulation in the EU” in 2014 cite increased labor
migration as one of the benefits from the IFRS mandate (see Internet Appendix, Table IA1).
Nevertheless, it is not obvious that regulatory harmonization significantly increases labor
mobility. The benefits from harmonizing professional rules could be too small relative to other
costs involved in migrating to another country to have a meaningful effect on cross-border labor
mobility. In addition, it is possible that local accounting and auditing practices persist after the
formal harmonization of the rules (e.g., Kvaal and Nobes 2010, 2012). To the extent these local
traditions make it difficult for foreigners to practice in the country even when the rules are the
same, regulatory harmonization is much less effective.
Thus, our study aims to analyze whether differential rules indeed constitute a substantial
economic barrier and to shed light on the effectiveness of (formal) regulatory harmonization as a
policy instrument to increase labor migration. We study the impact of regulatory harmonization
on labor migration in the context of the accounting profession for several reasons. First,
accounting and auditing standards play an important role in the profession, and learning how to
apply them likely is a significant human capital investment. For instance, knowledge of
accounting standards is required for any accountant involved in the production of general-
purpose financial statements, regardless of whether they work as preparers or auditors. Second,
there has been substantial regulatory harmonization in accounting and auditing, which affected
virtually all aspects of the profession. Third, accounting harmonization has generally taken the
form of explicitly adopting a common set of standards issued in English by an international
3 The FSAP’s motivation discusses among other things that “lack of a Community framework can also discourage labour mobility.” The discussion, however, is framed in terms of reforms to the EU pension systems. So far, the EU has passed Directive 2003/41/EC, which facilitates the operation of pension funds across member states. The European Commission is also proposing regulation that would make pensions portable across member states. Such regulation would also remove an economic mobility barrier (but its effects would occur after our sample period).

10
organization. Thus, there is almost complete formal harmonization of the accounting rules and
the remaining country-level variation in the rules after harmonization is relatively minor. Prior to
regulatory harmonization, however, there were substantial differences in countries’ accounting
and auditing standards.4 Thus, harmonization has the potential to eliminate economic barriers for
auditors and accountants. Fourth, the large auditing firms are set up as international networks,
enabling them to take advantage of accounting and auditing harmonization.
In addition, there are several advantages to studying labor migration in the EU. In
principle, labor can move freely among EU member states. Free movement of labor is a
fundamental principle enshrined in Article 45 of the “Treaty on the Functioning of the European
Union,” which grants EU citizens the right to work in another EU country without a work permit.
The absence of explicit immigration restrictions makes it easier for us to examine economic
barriers and to measure the effect of regulatory harmonization on labor migration.5 Furthermore,
the EU has been on the forefront of international regulatory harmonization in the accounting
profession and changes in recent years have been substantial. In 2005, the application of IFRS
became mandatory in the consolidated financial statements for almost all publicly traded firms in
the EU. In addition, private companies can voluntarily adopt IFRS in many member states.
Hence, IFRS adoption affects all accountants working for publicly-traded firms, voluntary IFRS
adopters as well as for audit firms that have any of these as clients.
Importantly, IFRS adoption is not the only source of regulatory harmonization in the
EU’s accounting profession. With Directive 2006/43, later amended by Directive 2008/30, the 4 For evidence on prior accounting standard differences, see Bae et al. (2008). There is no comparable study for differences in auditing standards. However, about half the EU countries did not even translate national auditing standards into English prior to regulatory harmonization. In addition, seven (eleven) countries had additional national reporting (procedural) requirements that ISA did not have. This comparison understates the actual differences in auditing rules because we do not consider legal audit requirements or more minor differences that have also been harmonized (see Internet Appendix, Table IA2, for details). 5 Initially, some EU member states imposed labor mobility restrictions for citizens of new member states after its enlargement in 2004. In principle, such restrictions should affect all professions, not just accountants. Nevertheless, we provide sensitivity analyses, in which we restrict the sample and mobility to EU-15 countries only. See Table 5.

11
EU harmonized statutory auditing requirements. The main purpose of Directive 2006/43 was to
harmonize the audit process and establish a single market for audit services across the EU
member states (Heß and Stefani, 2012). Its provisions were substantial and ranged from
harmonization of educational requirements and ethical standards to granting the European
Commission the option to mandate the adoption of International Standards on Auditing (ISA)
throughout the EU. Auditing standards specify procedural and reporting requirements for
auditors regarding issues such as independence, documentation, certification, and sampling,
regardless of whether they audit private or public firms. As such the harmonization of auditing
standards has an even wider reach in terms of firms than IFRS adoption, affecting all external
auditors in the profession, but it does not directly affect accountants outside of auditing. The
European Commission has not yet mandated ISA adoption but, in anticipation of a mandate, all
member states have adopted ISA in some form—many around the time of IFRS adoption.6
In sum, the accounting profession in the EU provides a powerful setting to estimate the
effect of regulatory harmonization on labor migration. Several of the above factors should make
it easier to identify and establish an effect of regulatory harmonization on labor migration, if one
exists. At the same time, these factors imply that the magnitude of the treatment effect for the
accounting profession may not generalize to other professions. Moreover, while the setting is
well-suited, it also poses a number of research-design challenges.
First, accounting harmonization in the EU has been an ongoing process for many years.
In fact, harmonization of national accounting standards and audit regulation began in corporate
law long before IFRS and ISA adoption with the 4th, 7th, and 8th Company Law Directives in
1978, 1983, and 1984, respectively. These early initiatives to harmonize accounting regulation
could reduce the effect of the more recent initiatives and hence reduce the power of the setting.
6 By 2012, only seven EU countries had not fully adopted ISA. See Internet Appendix, Table IA9a, for details.

12
However, it is important to recognize that national accounting and auditing standards were
formally different until IFRS and ISA adoption. From a labor market perspective, it is likely that
formal harmonization and knowledge of the detailed standards themselves matter a great deal,
even if national standards are similar in spirit or yield similar reporting outcomes.
Second, determining the timing of the potential treatment effect is challenging. For one,
labor mobility is likely to be a relatively slow moving construct, which should make any
response to harmonization more gradual. In addition, it is not obvious when regulatory
harmonization begins to affect labor mobility, despite the fact that the effective dates themselves
are sharply defined.7 For instance, the first mandated IFRS financials were not disclosed until
2006, but accountants and auditors would already have done much of the work that goes into the
preparation of the financial statements and the audits in 2005. Thus, labor mobility could
increase even ahead of regulatory harmonization, especially if preparers, audit firms, and
universities train people in anticipation of IFRS and ISA adoption. At the same time, it may take
considerable time before people with the required knowledge are able to take advantage of the
reduction in economic barriers. Based on these institutional considerations, it seems reasonable
to expect effects from regulatory harmonization to begin at some point in 2005 but to gradually
increase in subsequent years. As we are unsure about the start date and as several of our analyses
require symmetric pre- and post-windows, we exclude the years 2005 to 2007 and compute the
average treatment effects from 2008 and until the end of our sample period in 2010. In
untabulated sensitivity analyses, we use the years 2006 to 2008 as well as 2006 to 2010 as the
post-treatment period, and find similar results.
7 Mandatory IFRS adoption applies to fiscal years beginning in or after January 2005. The adoption of Audit Directive 2006/43 followed one year later in 2006.
13
A third design challenge is that the regulatory changes we study can have demand effects
that are unrelated to harmonization as well as “knock-on” demand effects that stem from
increased labor migration. The former are demand effects that would arise after regulatory
changes even when there is no harmonization (e.g., after the introduction of SOX in the U.S.).
We discuss these effects, and how we control for them, in Section 4.2. In addition, regulatory
harmonization can also have demand effects. For instance, increased cross-border migration
should contribute to the equalization of wages across EU countries, which in turn could spur the
demand for accounting services and further increase labor mobility. We do not attempt to
separate such knock-on demand effects in our analysis as their source is harmonization and
hence they should be included in the estimates.
3. Data and Descriptive Statistics
3.1 LFS Dataset
We base our analysis on the EU’s Labour Force Survey (LFS). The LFS dataset is
compiled by Eurostat, the statistical office of the EU. 8 The group of participating countries
comprises the 28 EU member states, three EFTA countries (Iceland, Norway and Switzerland)
and two EU candidate countries (Macedonia and Turkey).9 The LFS dataset is based on quarterly
or annual interviews that are conducted by the national statistical offices of the participating
countries. The national statistical offices follow strict guidelines laid out in EU Regulation when
8 Researchers at academic institutions can gain access to the LFS data for scientific purposes after an approval process. Eurostat provides detailed information on the LFS data and the application process for researchers on its website: http://ec.europa.eu/eurostat/en/web/microdata/european-union-labour-force-survey. 9 We include Iceland, Norway, and Switzerland in the sample even though they are not EU members. Citizens of these European Free Trade Association (EFTA) countries have the right of free movement within the European Economic Area (EEA), which includes 28 EU members, Iceland, and Norway. Switzerland is not a member of the EEA but its citizens have the same free movement rights through bilateral agreements. Iceland and Norway have adopted EU regulation that harmonizes accounting and auditing standards. In Switzerland, IFRS is not mandatory (Nobes and Zeff, 2015) but audit and accounting standards have effectively been harmonized with the EU. The results are not sensitive to including Switzerland in the sample. For simplicity, we refer to the three additional countries as member states or EU countries. The dataset is reduced to 29 countries because the annual LFS files provide no or very limited information from Croatia, Malta and the two EU candidates during our sample period.

14
they survey their populations. The guidelines ensure that the sample is representative of the
populations in each country and that the collection methods, questions, definitions, and
classifications are (almost) identical across countries. The standardized methodology
substantially improves the comparability of statistics across countries compared to data used in
previous studies. Indeed, lack of comparability has often hampered international migration
studies in the past, as they had to rely on disparate data sources with different definitions and
collection methods, e.g., population registers, border control, permit, or census data (Rendall et
al., 2003). In contrast, the LFS data allow us to estimate consistent migration measures across all
EU member states through time, which to our knowledge makes it unique.
Despite these important advantages, the LFS dataset also has drawbacks. In particular, it
is not a panel dataset that follows the same individuals through time but instead is a combination
of separate cross-sections, raising the concern that changes in sample composition over time
could affect our inferences. This concern is mitigated by Eurostat’s sampling techniques that are
specifically designed to ensure representativeness and comparability across years. In addition,
the LFS dataset offers a large set of demographic characteristics, which allow us to match
individuals on these characteristics over time (see Section 4.3 for details on our double-matched
analysis). Another potential issue with the dataset is that certain variables are provided to
researchers in an aggregated form only. For instance, the LFS dataset does not provide the
specific country of origin for migrants but instead provides regional information, which prevents
us from examining bilateral migration flows between countries.
LFS data are provided in quarterly and annual files. We conduct our analysis on the
annual files due to the limited availability of quarterly data in the first half of the sample period.
Our sample period starts in 2002, three years before the first fiscal year for which reporting
under IFRS was mandatory and four years before the EU adopted Directive 2006/43. Our sample

15
period ends in 2010. We do not include years before 2002 and after 2010 because the coding of
several key variables, notably the job codes, was different before and after these years. As
several migration metrics require an analysis with symmetric pre- and post-windows (see also
Footnote 14), our sample period focuses on the years 2002 to 2004 and 2008 to 2010,
respectively. We further restrict the sample to LFS respondents who are between 20 and 59 years
old, because this group is likely to be active in the workforce.
The resulting dataset comprises 10.3 million respondents from 29 countries with yearly
totals varying between 1.1 and 2.5 million. Eurostat computes a weighting factor for each
respondent based on his/her representativeness in the country’s population. The total weighted
number of respondents is about 1,672 million, when adding over all countries and all sample
years. The weighted number of respondents in a given year roughly maps into the countries’ total
population between the ages of 20 and 59 (see first two columns of Table 1 for further details).
3.2 Treatment and Control Samples
We identify our treatment and control groups through the LFS item ISCO3D, which
indicates the respondents’ job based on the current version of the International Standard
Classification of Occupations (ISCO-88) at the three-digit level. 10 Our treatment group
(“accountants”) consists of all respondents with ISCO3D equal to 241 which includes
accountants (ISCO-88 = 2411) but also personnel and career professionals (ISCO-88 = 2412)
and other business professionals such as account executives or market research analysts (ISCO-
88 = 2419). Hence, the treatment group includes non-accountants who are not directly affected
by regulatory harmonization in the accounting profession. The inclusion of non-accountants does
not pose a problem in our research design provided their fraction remains roughly constant
10 Item ISCO3D focuses on people who are in employment and is set to missing for respondents who are unemployed, inactive, in military service, or younger than 15 years old.

16
through time. To gauge concerns about measurement error and the validity of this assumption,
we obtain aggregate statistics on the fraction of accountants (ISCO-88 = 2411) within the group
of professionals with ISCO3D = 241 through a special request to Eurostat. The statistics are
based on a sample of 16 countries over the period 2002 to 2010 and show that the fraction of
accountants in ISCO3D = 241 is by far the largest and amounts to roughly 50% and, more
importantly, varies little over time. Thus, the inclusion of non-accountants does not appear to be
an issue and, if anything, is likely to attenuate the observed treatment effect.
We construct three control groups. The first control group comprises legal professionals
(“legal pros”), which we define as all respondents with ISCO3D equal to 242. This group
includes lawyers (ISCO-88 = 2421), judges (ISCO-88 = 2422), and other legal professionals
such as coroners or notaries (ISCO-88 = 2429). Legal professionals are comparable to
accountants in that both professions require substantial education and expert knowledge to apply
a certain set of rules. As there are risks to choosing one benchmark profession based on
conceptual comparability, the second control group (“all pros”) consists of all other respondents
in the job code group “professionals,” which are all at the same professional level (as indicated
by the first digit of ISCO-88 = 2). This group includes lawyers, physicists, engineers, computing
professionals, and teachers, among others. We exclude architects, veterinary surgeons, and
healthcare professionals (ISCO3D = 214, 222, 223) from the “all pros” group because Directive
2005/36 entered into force in 2005 and granted these three professions automatic recognition of
their licenses to practice in all EU countries. Including them would likely violate the parallel
trends assumption.11 The third control group (“biz people”) consists of respondents with other
business jobs, but at different professional levels. We use the following ISCO3D job codes to 11 Like other professions with national licensing requirements, accountants and auditors can apply for recognition of a foreign license in any EU country. Recognition is, however, not automatic and may require taking a test. We examine the potentially confounding effect of changes in licensing and recognition rules in the Internet Appendix (see Sections IA6 and IA9).

17
define the group of business people: 121 (directors and chief executives), 122 (production and
operations department managers), 123 (other department managers), 131 (general managers),
341 (finance and sales associates), and 342 (business service agents and trade brokers).
Our treatment group of accounting professionals comprises 105,940 respondents from 26
countries over the sample period.12 The number of respondents in the control group of legal
professionals (all professionals) [business people] is 39,480 (600,982) [748,313], when adding
over all countries and sample years (see Table 1 for further details).
We recognize various trade-offs in choosing a control group. For instance, legal
professionals are conceptually appealing but the group is relatively small, which limits matching.
In contrast, the group of all professionals provides a large sample of people working at the same
professional level. The latter is desirable but their jobs are in some cases quite different from the
jobs of accountants. The third group, in turn, comprises people that all work in business jobs but
at higher or lower job levels, which is not ideal. Since there are pros and cons to each group, we
estimate treatment effects using all three control groups.
In the Internet Appendix (Table IA3), we present the distribution of demographic
characteristics of accounting professionals and the three control groups. We focus on
demographic characteristics that prior literature has shown to affect migration, i.e., gender, age,
marital status, number of children, and education level (see Krieger, 2004, for an overview). The
demographic distributions for the accounting professionals and the three control groups are
remarkably similar, except for the educational level. Based on these statistics, legal professionals
and all professionals appear to be most comparable to the accounting professionals in terms of
demographic characteristics that previous research shows determine cross-border migration
12 The final sample comprises only 26 countries because Bulgaria, Poland and Slovenia do not provide ISCO3D information at the three-digit level (i.e., we cannot distinguish treatment and control groups).

18
decisions. Hence, those two are our preferred control groups. But even the distributions for
accountants and business people are still quite similar.13
3.3 Measuring Migration
For our first migration metric (NATBIRTH), we code respondents that have a foreign
nationality and were born outside the host country in which the survey was conducted as a
migrant (or mobile). This simple stock measure of migration is reliable and refers to data items
that are widely available in the LFS dataset. It is also the preferred migration metric in prior
studies using the LFS database (Martí and Ródenas, 2007; Bonin et al., 2008). Note that this
definition does not count individuals that moved to the host country a long time ago and in the
meantime have adopted its nationality, which is favorable in our setting considering that we
intend to study relatively recent mobility decisions around regulatory harmonization.
However, as a stock measure, NATBIRTH does not indicate when migration occurred.
This data limitation should not affect our difference-in-differences analysis as long as the rate of
earlier migration outside the analysis window does not systematically change over time.
Although we have no reason to believe that such systematic changes occurred, we construct a
second quasi-flow measure that mitigates this concern. Specifically, we use NATBIRTH but
count only migrants who recently changed their jobs (NATBIRTH_CHG). We identify job
changes through LFS item STARTIME (“time in months since the person started current
employment”) and define recent job changes as those that occurred (a) in/after 1999 for the pre-
treatment period, and (b) in/after 2005 for the post-treatment period.
The idea behind this refinement is that migrations due to accounting and auditing
harmonization typically involve a change of employment and hence we attempt to preclude
13 The larger discrepancies likely reflect the fact that business people work at higher (e.g., managers) or lower (e.g., associates) job levels than the accounting professionals, as indicated by the first digit of the ISCO3D.

19
earlier migrations from the stock measure. However, NATBIRTH_CHG is not perfect and not
necessarily better than NATBIRTH. The former still counts people as migrants who moved many
years ago but recently changed jobs within the host country. At the same time, NATBIRTH_CHG
does not count people that move to a different country within the same firm (e.g., on cross-
border assignments, which are quite common in large audit firms).
The LFS dataset also allows the construction of metrics that amount to flow measures.
While these flow measures are conceptually desirable given the time dimension of our research
question, they have severe drawbacks, which we discuss in Section 5.1. Our main analysis
therefore focuses on the established stock measure, NATBIRTH, and our novel migration
measure, NATBIRTH_CHG, which has a time dimension to it. We also present sensitivity
analyses using two flow metrics despite their severe shortcomings (see Section 5.1).
3.4 Descriptive Statistics
In Table 2, we report descriptive statistics for the sample used in the regression analysis.
For this analysis, we impose two more sample restrictions relative to Table 1. First, as discussed
in Section 2, we exclude years 2005 to 2007 because (a) the exact starting point of regulatory
harmonization is ambiguous and (b) NATBIRTH_CHG requires symmetric pre- and post-
treatment periods. 14 Second, we restrict the sample to respondents with at least an upper-
secondary education. Respondents that have not obtained this educational level are rare among
the accounting professionals but also within most control groups, except for business people (see
Internet Appendix, Table IA3).
The analysis naturally restricts the sample to observations with non-missing information
on all control variables as well as on the mobility metrics. As shown in Table 2, information 14 Symmetry is necessary because, by construction, NATBIRTH_CHG increases over time. For instance, a foreigner who is surveyed in 2008 counts as mobile in the post-treatment period only if the person has changed jobs in the last three years. In 2009, however, a person counts as mobile if she has changed jobs in the last four years, resulting in an upward trend as the window expands (relative to a fixed starting point).

20
indicating whether an individual has children is missing with some frequency in the LFS dataset,
as some countries do not provide this information in all survey years. To preserve a relatively
balanced sample across time, we treat missing information on the number of children as a
separate category when matching on demographics or creating fixed effects for them.15 We also
combine upper-secondary and post-secondary education levels as well as tertiary and doctoral
education levels. The fraction of individuals with education at the post-secondary level and at the
doctoral level is very small (see Internet Appendix, Table IA3) and the data are too sparse to
create separate categories and the full set of interactions for these education levels. All of our
statistical analyses require that both NATBIRTH and NATBIRTH_CHG be non-missing. The
samples for the analyses using LFS weights are slightly smaller because the weighing factor is
missing for some individuals.
Taken together, the final sample for our main analyses comprises individuals from 26
countries for the years 2002 to 2004 and 2008 to 2010, who are between 20 and 59 years old, and
whose highest degree of education is at least at the upper secondary level. Table 2 reports the
number of observations for accounting professionals and the three control groups that meet the
above criteria and have non-missing control variables. Table 2 also reports the mean mobility
rates of accounting professionals, legal professionals, all professionals, and business people
using our main mobility metrics NATBIRTH and NATBIRTH_CHG. Accounting professionals
exhibit the highest mobility rates. However, these statistics include sample years after regulatory
harmonization and do not yet control for (or match on) demographic characteristics. We provide
a formal comparison of pre-treatment mobility rates in Section 4.
15 As we conduct the analysis within bins of certain demographics and within country, this design choice should be innocuous and primarily help sample representativeness as well as power. For Ireland, we have the number of children only for the post-treatment period, which we set to missing to allow matching with observations in the pre-treatment period.

21
Table IA4 in the Internet Appendix also presents descriptive by-country migration
statistics for NATBIRTH and NATBIRTH_CHG. We provide these statistics separately for the
pre- and the post-treatment periods and based on a matched sample to facilitate comparisons with
our Section 4 analyses. Table IA4 shows considerable variation in both the fraction of migrants
as well as the changes in this fraction across host countries. We note that the fraction of migrants
is not higher in the post-treatment period for all countries, as one would probably expect.
Comparing the change in the migration rate for accountants with the rate for all professionals, 58
(58) percent of the countries exhibit a positive change for NATBIRTH (NATBIRTH_CHG).
However, most of the negative changes are close to zero, and when we count only absolute
changes that exceed 0.5 percentage points, then 76 (80) percent of the countries exhibit positive
changes for NATBIRTH (NATBIRTH_CHG).
4. Effect of Regulatory Harmonization on Migration
4.1 Difference-in-Differences Analysis
We begin with a difference-in-differences analysis using individual-level regressions.
This design is useful in that many potential confounds “wash out” in one of the two differences.
For example, contemporaneous but unrelated regulatory changes that affect both the treatment
and the control groups wash out in the first difference. Similarly, time-invariant measurement
problems for one group wash out in the second difference.
Our identification strategy rests on the assumption that mobility trends for the treatment
group would have been parallel to those in the control groups had there been no regulatory
harmonization in the accounting profession. We therefore begin by graphing mobility rates over
time. Figure 1 compares aggregate mobility rates based on the NATBIRTH measure across
treatment and control groups over time (before matching). The graphs suggest that the mobility

22
rates of all groups move in concert during the years 2002 to 2004. In other words, the mobility
rates of accounting professionals and the three control groups behave similarly prior to
regulatory harmonization. The levels of the mobility rates are also similar for three of the groups
before harmonization. The mobility rates for the legal professionals are considerably lower
throughout the sample period (in the unmatched sample), but they still move remarkably in
parallel with the accounting professionals over the pre-treatment period. Thus, mobility patterns
over the pre-treatment period lend support to the parallel-trend assumption. After 2005, the
mobility rate of the accountants increases and does so more strongly than the mobility rates of
the three control groups. The relative increase is strongest against legal professionals and all
professionals, and less pronounced against business people. By 2010, the mobility rate of
accounting professionals is substantially above the rates of the control groups, which is
descriptively consistent with a mobility effect from regulatory harmonization.16
We formally test for a mobility effect at the individual level. The granularity of this
analysis is a major advantage as it allows us to control for demographic characteristics of the
respondents that are unrelated to treatment but predicted to affect cross-border mobility.
Specifically, we include gender, marital status, age, education level, and the presence of one or
more children under the age of 15 living in the household, all measured at the time of the survey.
As these characteristics are all categorical, we control for them with fixed effects for all possible
combinations of the variables. In total, we include 192 fixed effects (one for each bin). The fixed
effects imply that we estimate the treatment effect within bin, i.e., for individuals with the same
demographic characteristics. Aside from finely controlling for individual characteristics that
affect mobility, the fully interacted fixed-effect structure avoids extrapolation and functional-
16 In the Internet Appendix, we graph the time trends in the aggregate mobility rates for the four groups from 2002 to 2013 (see Section IA5). Figure IA5 shows that the differences in mobility rates between the accountants and the three control groups persist until 2013. We do not use the extended period due to the job code changes in 2011.

23
form assumptions for the control variables. As a result, the estimation is less susceptible to non-
linearities in the data (e.g., Cochran and Rubin, 1973; Rubin, 1973 and 1979), which is a
particular concern when working with categorical variables as in our setting.
We also include country-accountant and country-year fixed effects. The purpose of the
country-accountant fixed effects is to eliminate differences in mobility rates for accounting
professionals and the respective control groups across countries as well as to account for
differential frequencies in accounting professionals across countries. The country-year fixed
effects eliminate country-specific shocks as well as trends in mobility common to all professions
in a given country (e.g., due to shocks to economic growth or changes to the survey
methodology). Thus, in this regression design, the treatment effect is identified by differences in
the time-series variation in mobility rates between professions within countries and within bins
combining various demographic characteristics. We draw statistical inferences based on standard
errors clustered by country-job group with job group indicating either accounting professionals
or the respective control group. Since our sample comprises 26 countries, this approach yields 52
clusters, which strikes us as conservative.17
In Table 3 Panel A, we present OLS regression results for each of the three different
control groups.18 In the first six columns, we use NATBIRTH as our migration measure and
present regressions with and without weighing observations by the statistical weight provided for
17 However, the homogeneity assumption required for clustering standard errors becomes more important yet can be tenuous as the number of clusters becomes small. We therefore follow the suggestions in Conley et al. (2016) and also draw inferences using a Fama-MacBeth procedure as a robustness check. We group countries into six European regions by geography and language. This grouping allows for even more cross-sectional dependence than the country-job clustering. We then draw inferences in a Fama-MacBeth fashion based on six separate diff-in-diff regressions, one for each region, and find that our inferences are similar (albeit at lower significance levels as is expected with only five degrees of freedom). See also Internet Appendix IA4 for more details on the region results. 18 We estimate OLS regressions rather than logit or probit models to avoid an incidental parameter problem given the heavy use of fixed effects. However, OLS regressions may be biased with a binary dependent variable. The double-matched approach presented in Section 4.3 does not suffer from this potential problem. As a sensitivity test we also estimate probit models. The inferences are consistent across the two estimation methods holding the sample constant. The probit analysis yields statistically weaker results for the legal professionals but slightly stronger results for the other two control groups.

24
each individual in the LFS dataset. In the last six columns, we present the results using our
refined migration measure, NATBIRTH_CHG. The relevant coefficient estimates for the
interaction term Accountant * Post are positive and always statistically significant for the first
two control groups. The estimates are also positive but only marginally significant in two of four
specifications when using business people as the control group. Overall, these findings are
consistent with the hypothesis that regulatory harmonization increases cross-border labor
migration.
In gauging the magnitude of the coefficients, we focus on regression estimates using LFS
weights, as the weights likely make the sample and hence the estimates more representative of
the EU population. The estimated treatment effect with LFS weights is generally around 70 basis
points and even larger when benchmarking against legal professionals. For NATBIRTH, these
estimates imply an 18% increase in cross-border migration of accounting professionals relative
to their pre-treatment migration rate and benchmarking against the two large control groups.
Using NATBIRTH_CHG, the corresponding percentage effect is around 30 percent given the
refined measure exhibits a lower pre-treatment migration rate. The fact that the percentage
effects are similar when benchmarking against all professionals and against business people
indicates that the statistically weaker results against business people are primarily a matter of
statistical power. The coefficient magnitudes and percentage treatment effects are similar albeit
slightly weaker in the regressions without LFS weights.
Arguably, an even better way to gauge the economic magnitude of our estimates is to
compute the increase in the total number of accounting professionals that migrate as a result of
regulatory harmonization. 19 Towards this end, we determine the average number of survey
19 For instance, this translation mitigates downward bias in the percentage effects that can arise from the fact that the treatment group contains non-accountants, which presumably do not increase in mobility.

25
respondents from the accounting profession in any given year, invert the LFS weights to obtain
an estimate for the population of accountants, and then multiply this number with the regression
estimate for the increase in migration. Using coefficients from the LFS-weighted regressions in
Panel A, we estimate that the increase in the number of migrating accountants is between 16,000
and 18,000 individuals, but could be as large as 30,000 individuals when using the legal
professionals as a control group.20 Such increases seem economically significant. We obtain very
similar estimates for the increase in migrating accounting professionals using both migration
measures. The consistency across these two measures is reassuring and supports our argument
that the difference-in-differences design strips out “stale” mobility that occurred earlier in life
and is unrelated to regulatory harmonization. Considering that the primary distinction between
NATBIRTH and NATBIRTH_CHG is that the latter has been better purged of stale mobility, the
two measures should provide similar treatment effects.21
In sum, the results in Panel A provide consistent evidence that regulatory harmonization
in the accounting profession led to a substantial increase in cross-border migration. In the
remainder of Section 4, we focus on two issues that could confound this interpretation. First, we
examine to what extent demand effects induce an upward bias in our estimates. Second, we
address the concern that our analysis is not based on a panel, raising the possibility that changes
in sample composition drive our results. In the Internet Appendix, we discuss two further
concerns, which could amount to a violation of the parallel-trends assumption: differential
20 The population of accountants comprises about 2.3 million people in the sample countries according to our estimates based on the number of respondents and their LFS weights. Multiplying this number with the relevant coefficient estimate on the interaction term Accountant * Post yields an estimate for the increase in migration due to regulatory harmonization over the post-treatment effect. For example, the second specification in Table 3, Panel A (NATBIRTH, with LFS weights and all pros as control group), shows a coefficient estimate of 0.723. This translates into an increase of about 16,600 migrating accountants (0.723 * 2.3 million / 100). 21 One could also consider the incremental explanatory power of the harmonization variable in explaining migration. However, as many individual-level factors play into a migration decision, most of the variation comes from individual characteristics, which we control for with an extensive fixed-effect structure. Hence, the incremental R-squared for the harmonization indicator is not surprisingly close to zero.

26
changes in cross-border student mobility as well as in the recognition of occupational
qualifications. We find no evidence that such changes explain our results (see Section IA6).
4.2 Separating Regulatory Harmonization and Demand Effects
An important concern about the findings in Section 4.1 is that the documented increase
in cross-border migration reflects demand effects stemming from new regulation, rather than
regulatory harmonization per se. Regulatory changes can affect the demand for accounting
services and as a result increase job mobility even without harmonization. For instance, the
implementation of SOX likely increased the demand for accounting and auditing services for
some time. In addition, it is conceivable that SOX created new opportunities for accounting
professionals with certain skills (e.g., related to internal controls) and that these professionals
move to new firms if their services are of greater value elsewhere. This new matching of
employees and firms can also increase job mobility for some time.22
We first note that we scale our migration measures by the number of professionals in the
country (and year). Such scaling captures at least some of the demand effects. For instance, if a
(non-harmonizing) regulatory shock like SOX increases the demand for accountants and does so
symmetrically for domestic and foreign accountants, then the construction of the mobility
measure already controls for the demand effect. However, demand shocks could be asymmetric.
Furthermore, the new matching need not imply an influx of people into the accounting
profession (i.e., the denominator does not have to increase). Thus, demand effects from
regulatory changes could still affect our results.
22 Consistent with these arguments and the notion that IFRS adoption also increases the demand for accounting services, there is evidence that the cost of preparing financial statements (ICAEW, 2007) and audit fees (De George et al. 2010) increase around IFRS adoption, although most of the effects are limited to the year of adoption. To limit the influence of such demand effects, we exclude the sample years 2005 to 2007, which is the period over which EU countries adopted IFRS and harmonized national audit standards with ISA.

27
To gauge this concern, we use the insight that demand effects also imply an increase in
domestic job mobility. For instance, the new matching of employees and firms after a SOX-like
regulatory change can take place across borders but also domestically. In contrast, supply-side
effects due to cross-border harmonization should primarily pertain to foreigners. We therefore
introduce a variable to control for domestic job mobility. If our results largely reflect demand
effects, then controlling for domestic job mobility should attenuate the coefficient of interest.
We create a variable that measures Domestic job mobility at the country-year-profession
level. The variable is the proportion of domestic people who recently changed their jobs in a
given year, country, and profession, which essentially captures disruptions of existing matches
and re-matching within a profession. We identify job changes through LFS item STARTIME
(“time in months since the person started current employment”) and define recent job changes as
those that occurred (a) in/after 1999 for the pre-treatment period, and (b) in/after 2005 for the
post-treatment period.
In Table 3, Panel B, we report the result controlling for Domestic job mobility for each of
the three control groups, both migration measures as well as with and without using the LFS
weights. The coefficients on Domestic job mobility are positive in all and statistically significant
in some specifications—consistent with concurrent increases in domestic job mobility and hence
demand effects around regulatory changes. More importantly, however, introducing this control
variable barely changes the estimated treatment coefficients and, if anything, strengthens the
results when using business people as a control group. Thus, the findings in Panel B are not
consistent with the concern that the results reflect demand effects. Such effects may be present
in the data but they do not appear to affect our coefficients of interest in a material way.
While the regressions controlling for domestic job mobility go a long way towards
separating demand and harmonization effects, we conduct additional tests using the country-

28
level correlations of labor migration inflows and outflows to specifically gauge the presence of
asymmetric demand shocks across countries (see Internet Appendix, Section IA7). If the
increase in migration around harmonization is driven by asymmetric demand shocks, countries
with relatively small demand shocks should act as “sources,” experiencing an increase in
outflows and decline in inflows, while countries with relatively large demand shocks act as
“sinks” having an increase in inflows and decrease in outflows, leading to a negative correlation
of country-level changes in inflows and outflows. Contrary to this, we find that changes in
country-level in- and outflows are positively associated for accountants relative to all
professionals. Indeed, using (without using) the LFS weights, the relative changes in in- and
outflows have the same sign for 83 (83) percent of the countries for which we have sufficient
data to calculate pre- and post-harmonization migration flows. The positive correlation is more
consistent with a harmonization effect than an asymmetric demand effect (see Tables IA7a and
IA7b for details).23
Nevertheless, we acknowledge that it is difficult to separate supply and demand effects
entirely. They can be endogenously connected. As noted earlier, it is possible that increased
cross-border migration due to regulatory harmonization contributes to the equalization of wages
across EU countries, which would likely lower wages and in turn could spur the demand for
accounting services. In our view, it would be appropriate to include such knock-on demand
effects in the estimation of the treatment effect (as the source is harmonization). For this reason,
including domestic job mobility in the model could over-control and is not without costs.
23 Finally, we note that demand effects due to implementation or new matching should be of limited duration. Once the new rules are implemented and the re-matching has taken place, labor migration rates should decrease. However, when we extend Figure 1 to 2013, we find that the migration effect persists after 2010 and does not look like a temporary demand effect (see Section IA5).

29
4.3 Double-Matched Difference-in-Differences Estimates
The LFS dataset consists of separate annual cross-sections of survey respondents. It is not
a panel dataset that follows individuals through time. Thus, changes in sample composition over
time can potentially bias the treatment effect and produce spurious inferences. For example,
suppose that, relative to the control group, accountants living in Sweden exhibit persistently high
mobility rates. If for some reason the sample composition changes over time such that Sweden is
overrepresented in the post-treatment period relative to the pre-treatment period, then such
changes could upward bias the estimated treatment effects in the regression analysis presented in
Sections 4.1 and 4.2. We note that the LFS weights mitigate this possibility but we perform a
“double-matched” difference-in-differences analysis to further alleviate this concern. The idea is
to form quadruplets of individuals with identical characteristics and then to compute the
difference-in-differences within each matched quadruplet, which eliminates sample composition
effects.
We implement this approach as follows: Within each country and year, we first match all
accounting professionals and all control group observations with the exact same characteristics
for gender, marital status, age, education level, and the presence of one or more children under
the age of 15 living in the household. We then match across time, linking pre-treatment
accounting professionals to post-treatment accounting professionals with the exact same
characteristics, and do the same for the control observations. We drop all observations that
cannot be matched. This double-matching yields a collection of quadruplets, each consisting of
accounting professionals and controls before and after harmonization that are jointly identical
except for their occupation (some are accountants and some are in control professions) and
survey year (some are pre-treatment and some are post-treatment). Thus, we have precisely the

30
variation required for a difference-in-differences analysis, but hold everything else constant. We
illustrate this design in Figure 2.
In order to implement the double-matched approach, we must specify a “year-pair”
linking a pre-treatment year with a particular post-treatment year. For each year t of the pre-
treatment period (2002-2004) we define year t+6 as the corresponding year (e.g., observations in
2002 are matched to observations in 2008).24 For example, an accountant living in Germany in
2002 with a particular combination of demographic characteristics is included in the double-
matched sample if and only if there is at least one lawyer (control) living in Germany in 2002
with identical characteristics and there is at least one lawyer and one accountant living in
Germany in 2008 with those same characteristics. For instance, as the LFS does not contain data
for Italy in the pre-treatment period, all observations for Italy drop out of this analysis. This
example illustrates why the double-matched approach eliminates sample composition changes.
Within-quadruplet estimation of the treatment effect requires that we equally weigh the
four components of a quadruplet. However, not all quadruplets are equally informative. There is
substantial heterogeneity in the number of individuals contained within each quadruplet. Small
countries and unusual demographic combinations (e.g., single men in their late 50s with young
children living in the household) produce potentially less informative difference-in-differences
estimates. To address this issue, we give each quadruplet a weight equal to the minimum sample
size in the quadruplet’s four components. The idea is that the information of the quadruplet is
ultimately constrained by the sample size of the four components. By defining the weight at the
level of the quadruplet, we ensure that the within-quadruplet estimate reflects an equal-weighted
24 In so doing, we again exclude years 2005-2007. By focusing on later post-treatment years, our results should be less susceptible to temporary demand effects in mobility (e.g., if audit firms import workers to help with IFRS implementation for a limited time). As a robustness test, we alternatively define year t+4 as the corresponding year and hence exclude years 2009 and 2010 (as well as 2005). This alternative definition yields only slightly smaller treatment effects that are statistically significant in most specifications. These attenuated results are consistent with the gradual increase in the mobility rates of accounting professionals after 2005 documented in Figure 1.

31
difference-in-differences, but allow the informational value of each difference-in-differences to
vary across quadruplets. The reported treatment effect is hence a weighted average across the
effects for the quadruplets. We again draw statistical inferences based on standard errors
clustered by country-job group (48 clusters).
The double-matched approach is obviously very demanding. Comparing panels in Table
3 shows that we lose a substantial fraction of our sample due to double-matching. For this
reason, we focus on the control group of all professionals, which offers a large sample of
individuals at the same professional level and with similar demographic characteristics as the
accountants (see Internet Appendix, Table IA3).25 At the same time, double-matching provides
tighter identification and also makes the pre-treatment mobility rates quite similar across
treatment and control groups.
Table 3, Panel C, presents the estimated treatment effects from the double-matched
difference-in-differences analyses. Again, we find positive and statistically significant increases
in cross-border labor migration after regulatory harmonization using both NATBIRTH and
NATBIRTH_CHG. Our estimates using the LFS weights indicate that cross-border migration of
accountants increases by 42 to 69 basis points relative to all professionals. The estimates without
LFS weights are similar (59 to 65 basis points). Weighted and unweighted estimates imply fairly
similar percentage increases in cross-border migration of accounting professionals relative to the
pre-treatment migration rates (20% and 11% for NATBIRTH; 22% and 19% for
NATBIRTH_CHG, respectively). These percentage effects are quite comparable to those
reported for the regression analysis in Table 3, Panels A and B, which is reassuring.26 As before,
25 We report findings for the other control groups in the Internet Appendix, Table IA8. The effects are generally larger in magnitude when using legal professionals, and smaller and less significant using business people. 26 In unreported tests, we gauge the sensitivity of the results to the inclusion of specific countries by implementing a jackknife procedure, dropping each country in turn and computing separate treatment effects each time. The

32
we gauge the economic magnitude of the treatment effects by translating them into an absolute
increase in the number of accounting professionals that migrate as a result of regulatory
harmonization. We proceed analogously and invert the LFS weights to obtain population
estimates. The treatment effects imply an increase of roughly 10,000 to 16,000 accountants.27
These numbers are slightly smaller than those reported in Section 4.1, but conceptually superior.
Finally, as isolating harmonization effects is a central challenge of our paper, we
conclude the double-matched analysis with an additional test that further mitigates the concern
that our results reflect demand effects that would arise even for non-harmonizing (SOX-like)
regulatory changes. In the spirit of the tests reported in Section 4.2, we estimate the effects
solely among people that recently changed their jobs. As a result of this sample restriction, we
essentially estimate the cross-border migration effects relative to domestic job mobility, which
should control for demand effects. We present the results in the last column of Table 3, Panel C.
The estimated treatment effects remain statistically significant and are even larger in
magnitude within the subsample of workers who recently changed jobs. Specifically, using the
LFS weights we find that cross-border migration of accountants increases by 137 basis points
after regulatory harmonization, relative to all other professionals.28 Finding significant treatment
effects even in the subsample of domestic and foreign people that recently changed their jobs
further increases our confidence that regulatory harmonization caused the increase in cross-
border labor migration for accounting professionals.
strongest attenuation occurs when we drop the Switzerland but the treatment effect decreases by only 20% and remains statistically significant at the 1%-level. 27 For details on how to compute these numbers, see Footnote 20. 28 Since the population of accountants comprises about 942,000 people who recently changed their jobs according to the number of respondents and their LFS weights, the estimated treatment effect implies an increase of roughly 13,000 migrating accountants (1.374 * 0.942 million / 100). This is in line with the estimates reported in our main analysis based on the full sample

33
5. Sensitivity Analyses and Cross-Sectional Heterogeneity in Treatment Effects
In this section, we examine alternative flow measures of migration as well as cross-
sectional heterogeneity in the treatment effects. The flow measures also allow us to examine
cross-sectional variation in the treatment effects based on the demographic characteristics of the
respondents because for the flow measures these characteristics are by design measured in close
proximity to the time of migration. For the stock-based measures, we examine cross-sectional
variation in the treatment effects based on institutional (country-level) characteristics.
5.1 Flow Labor Migration Measures and Cross-Sectional Differences by Demographics
Prior work using the LFS dataset prefers to use stock measures of migration due to major
concerns about the flow measures that can be constructed based on the LFS dataset (Martí and
Ródenas, 2007; Bonin et al., 2008; Skupnik, 2013). Our earlier analyses therefore follow the
prior literature and use a stock measure based on nationality and country of birth (NATBIRTH).
We also construct a novel quasi-flow measure (NATBIRTH_CHG), which starts from the stock
measure but counts only foreigners that recently changed jobs, making it more likely that
migration occurred recently. We have discussed the pros and cons of the two measures in Section
3.3 and noted that the difference-in-differences design addresses shortcomings of these
measures, provided these shortcomings are constant through time (or do not change
systematically with regulatory harmonization). While we have no indication of systematic
changes in the direction of our results, this section presents sensitivity analyses using two flow
measures that ensure migration occurs in a window around regulatory harmonization.
Importantly, we do not construct these two measures simply as changes in the stock of foreigners
but instead rely on different items from the LFS dataset to determine the time of migration.
We base the first flow measure (YEARESID) on the number of years for which an
individual who was born abroad (LFS item COUNTRYB) has been a resident in the host country

34
(LFS item YEARESID). YEARESID defines individuals as mobile if they were born abroad and
moved to the host country in/after 1999 (for sample years 2002 to 2004) or in/after 2005 (for
sample years 2008 to 2010). This measure allows us to determine the exact time of the migration,
both relative to the treatment (i.e., before or after regulatory harmonization) and relative to the
respondent’s age (i.e., we can rule out migrations during childhood). While these features of the
YEARESID measure are desirable for our identification strategy, there are also major drawbacks.
First, the measure mechanically increases over time and hence requires a symmetric pre- and
post-estimation window (see Footnote 14). Second, its construction implies relatively low
incidence rates, meaning that the number of survey participants who are foreigners and have
moved within the analysis window is low. The low incidence rate can cause a mini-domain
problem making survey-based estimates unreliable (Purcell and Kish, 1980). This issue arises in
our setting when we form bins of observations matched on demographic characteristics,
especially in countries with few observations in the LFS dataset (e.g., Luxembourg). Bins with
few observations might indicate a migration rate of zero in a given profession (and country),
even when the true migration rate for the profession is positive, simply because none of the
respondents in that profession (with certain characteristics) migrated in recent years. Similarly,
with low base migration rates, adding a single migrant could produce a large percentage change,
which in turn can make estimates of changes in the migration rates noisy.
For the second flow measure (COUNTR1Y), we use the question regarding the place of
residence one year before the survey (LFS item COUNTR1Y).29 This measure also allows us to
determine the exact time of the migration and it has the desirable feature that respondent
29 We note that some of the mobility captured by COUNTR1Y is repatriation, that is, workers moving back to their home countries after spending time abroad. However, harmonization could increase the number of accountants returning to their home countries (e.g., after IFRS adoption, expatriates of German companies may no longer be needed to help with German GAAP reporting in foreign subsidiaries). This return migration should be counted as harmonization-induced cross-border migration. We obtain smaller but still economically meaningful treatment effects when excluding repatriations from the COUNTR1Y analysis.

35
characteristics are measured close to the time of the move. The latter feature facilitates cross-
sectional tests using variation in demographic characteristics. As LFS data measure demographic
variables at the time the person is surveyed, rather than the time of the move, stock-based
measures do not necessarily have this feature, which makes cross-sectional analyses using
demographic characteristics problematic.30
While COUNTR1Y may seem ideally suited for our analysis, it has several severe
drawbacks. First, it counts only very recent migration; a foreign resident who moved two or three
years prior to the survey is coded as non-mobile when using COUNTR1Y. As a consequence,
COUNTR1Y has even lower incidence (or migration) rates than YEARESID, exacerbating the
problems that we described earlier.31 Second, and perhaps more importantly, the LFS sampling
techniques can systematically bias COUNTR1Y, which results in major discrepancies with
population registers (Martí and Ródenas, 2007). One reason for the discrepancies is that some
countries survey the same individuals for several quarters reaching into adjacent years. The lack
of sample replacement implies that a certain fraction of the answers regarding COUNTR1Y
change mechanically. For instance, an individual that moved in the first quarter of 2003 and is
surveyed for 6 quarters starting in the third quarter of 2003 has to change the answer to
COUNTR1Y by the second quarter of 2004. Martí and Ródenas (2007) show that the sample
replacement rates differ across countries and that the problem can be quite severe in some
countries (e.g., in Austria, Germany and Sweden). Third, in some countries and sample years, the
30 This is particularly true for people that moved a long time ago. When computing average treatment effects, the design difference-out those that moved a long time ago. However, they could still skew cross-sectional tests. For instance, if migrants are more likely to have children and marry after they move to a new foreign country relative to the average respondent, then cross-sectional splits for NATBIRTH may not yield meaningful results. For this reason, we perform cross-sectional splits based on demographic characteristics for the two flow measures only. 31 Illustrating the problem, we find that if we form bins for accountants and lawyers by country, year and personal characteristics, 98% contain a migration rate of zero using COUNTR1Y.
36
data item to code COUNTR1Y has not been collected (see Table 1), creating gaps in the time
series, which is problematic for a study like ours that relies on changes over time.
Given the shortcomings of the flow measures, we use them for sensitivity tests only. For
the same reasons, we do not necessarily expect the coefficient estimates from these tests to map
into the earlier analyses using stock-based measures. To mitigate the mini-domain problem, we
use the control group of all professionals, which provides a large sample of individuals at the
same professional level as accountants and with similar demographics (Internet Appendix, Table
IA3). We also conduct several cross-sectional splits by demographic characteristics. These splits
serve two purposes. First, by showing that increases in migration occur in sub-populations that
should be more responsive to regulatory harmonization, we increase the confidence in our
findings. Second, by splitting into subsamples for which mobility rates are larger, we increase
power and hence mitigate the problems due to low incidence rates.
Based on prior empirical evidence, we expect single respondents without children to be
more mobile (Mincer, 1978) and therefore to be more likely to respond to regulatory
harmonization. We also expect young people (20-39 years old) and people that work for large
employers (50+ employees, in local unit) to be more responsive. Young people do most of the
technical work in audit firms and thus their jobs require the most detailed knowledge of rules.
Similarly, large audit firms have a higher fraction of large clients relative to small audit firms
and large clients are most likely to report under IFRS, both mandatorily and voluntarily (e.g., Le
Vourc’h and Morand, 2011). These considerations determine our split variables.
In Table 4, we present difference-in-differences estimates for various combinations of
these splits. We obtain each estimate using the same double-matched approach described in
Section 4.3. As expected, the mobility rates for the flow measures are lower than for NATBIRTH,
especially for COUNTR1Y. Consistent with our prediction that cross-border mobility is higher

37
for (1) singles without young children, (2) younger workers and (3) workers at larger firms, we
find that pre-treatment mobility rates increase as we introduce the three restrictions cumulatively.
Using pre-treatment averages for YEARESID (COUNTR1Y) with LFS weights, the mobility rate
climbs from 133 (18) basis points for the full sample to as high as 254 (58) basis points for the
most restricted subsample. Thus, we expect these restrictions to be effective in mitigating the
mini domain problem and increasing power.
In interpreting the treatment effects, we focus on LFS-weighted estimates as they adjust
for discrepancies in sample size across countries and/or across time by anchoring the weights in
countries’ populations. We find that the estimated treatment effects are insignificant for the full
sample, although for YEARESID the estimates are positive and sizeable relative to the pre-
treatment mobility rates. Thus, the statistical insignificance is likely explained by the mini-
domain problem, which reduces the reliability of the estimated treatment effects and is most
severe in the full sample. Indeed, when we restrict the analysis to subsamples with higher
migration base rates, treatment effects and statistical significance begin to increase. Using
YEARESID (COUNTR1Y), the estimated coefficients are significant in all subsamples and
indicate, for instance, that labor migration of single accountants without children increases by
roughly 46 (52) basis points relative to all other (matched) professionals. Further restricting to
younger, single workers without children working at large firms, the treatment effects indicate an
increase in cross-border labor migration by 173 and 77 basis points for YEARESID and
COUNTR1Y, respectively.
The estimated effects are quite large relative to the pre-treatment mobility rates. We also
gauge the economic magnitude of the estimates by computing the implied increase in the number
of migrants over the post-treatment period. Restricting the computations to statistically
significant coefficients, the flow measures yield an estimate between 3,000 and 5,000 individuals

38
using YEARESID and 6,000 and 10,000 for COUNTR1Y.32 While these estimates are smaller
than those in Section 4.3, they are still economically meaningful. It is also important to keep in
mind that they apply to restrictive subsamples and hence have to be interpreted in that context.
In sum, the results for the flow measure in Table 4 corroborate our earlier findings using
stock-based migration measures. As expected, statistical power of the flow measures is low but
the relatively large percentage effects in subsamples that should be more responsive to regulatory
harmonization are reassuring. Overall, the evidence is consistent with the interpretation that
regulatory harmonization has a sizeable effect on cross-border migration of accountants.
5.2 Cross-Country Variation in Treatment Effects
Institutional differences across countries likely affect migration patterns. For instance,
prior research finds that East European citizens respond more strongly to economic shocks that
should lead to migration than Western European citizens (Dao et al., 2014). Such cross-country
differences may also shape migration responses to regulatory harmonization. In addition,
country-level differences in the extent of harmonization as well as with respect to explicit entry
barriers such as licensing rules can lead to cross-sectional variation in the treatment effects. We
explore such cross-country differences in this section.
5.2.1 Treatment Effects in East and West Europe
In 2004 and 2007, the EU was enlarged by in total twelve new, mainly Eastern European
member states (EU-10 and EU-2). 33 EU membership gave the citizens of the twelve new
32 As before, we gauge the economic magnitude by multiplying the treatment effect with an estimate for the relevant population of accountants. For example, the population of accountants who are young singles without kids and working at larger firms comprises about 275,000 people in the sample countries according to our estimates based on the number of respondents and their LFS weights. Multiplying this number with the relevant treatment effect for YEARESID (with LFS weights) yields an increase of about 4,750 migrating accountants due to regulatory harmonization over the post-treatment period (1.731 * 275,000 / 100). Multiplying the population estimate with the relevant treatment effect for COUNTR1Y (with LFS weights) yields an increase of about 2,100 migrating accountants per year (0.771 * 275,000 / 100). This yearly effect translates into an increase of about 6,300 migrating accountants over the post-treatment period (2,100 people * 3 years).

39
member states access to the labor markets of the EU-15 countries with certain restrictions for a
transition period (for details, see Zaiceva and Zimmermann, 2008; Skupnik, 2013). Prior
research finds that labor mobility among the mainly Western European countries that became EU
members before 2004 (EU-15) is relatively low compared to, for instance, the United States
(Bonin et al., 2008; OECD, 2014). Since the EU-15 has not had formal restrictions on labor
mobility for decades, a widespread conjecture is that EU-15 mobility rates are low because of
implicit barriers, such as language or culture, which are difficult to change.34
It is therefore interesting to examine whether regulatory harmonization increased labor
mobility even within EU-15 countries. We present results from two specifications in Table 5. In
the first specification (EU-15 host countries only), we use the same design as in Table 3, Panel
A, but focus on the subsample of individuals surveyed in the EU-15. In the second specification
(EU-15 host and EU-15 source countries only), we also focus on respondents from EU-15 but in
addition, we count as migrants only those individuals who were born in the EU-15 and have an
EU-15 nationality. In both specifications, we focus on the more restrictive design that uses
NATBIRTH_CHG and controls for domestic job mobility.
We find that the treatment effects are very similar when we restrict the sample to EU-15
host countries (first three columns of Table 5). Restricting to EU-15 host and source countries,
we still find significant treatment effects, but they are slightly smaller in magnitude, consistent
with prior literature indicating lower within-EU-15 mobility and migration responses (cited
above). In light of this work, it is noteworthy that we find significant within EU-15 migration
effects after regulatory harmonization. This finding also eases the concern that EU enlargement
33 In 2004, the following countries became EU members: Cyprus, Czech Republic, Estonia, Hungary, Latvia, Lithuania, Malta, Poland, Slovakia, and Slovenia (EU10). In 2007, Bulgaria and Romania became members (EU2). 34 Related to the role of culture and language, we estimate treatment effects within six regions that are defined based on language and geography. The results show substantial regional differences in the response to accounting harmonization. See Internet Appendix IA4.

40
and the removal of labor migration restrictions on workers from EU-10 and EU-2 countries are
responsible for the documented migration effects of accounting professionals.
5.2.2 Variation in Treatment Effects by the Extent of Harmonization and Licensing Rules
In this section, we explore cross-sectional variation in the estimated treatment effects. We
focus on variables related to the extent of harmonization and professional entry barriers.
However, we note that it is difficult to ex ante sign cross-sectional differences in the treatment
effects. One reason is that cross-sectional variation also affects the size of the profession in the
first place. In addition, cross-border migration is not the only margin along which the system can
adjust after the regulatory change. Consider, for instance, the prediction that countries with a
larger fraction of publicly-listed firms that need to report under IFRS should see a larger inflow
of migrants. While sensible, it is conceivable that these countries already had a much larger
accounting profession to begin with and hence even if they receive a larger number of migrants,
the relative effect of migration could be larger in countries with fewer publicly-traded firms
reporting under IFRS (and a smaller audit profession). Furthermore, countries with a larger
fraction of publicly-traded firms could also see a larger domestic inflow into the accounting and
auditing profession after IFRS adoption. As a result, it is again not clear that the inflow of
migrants (scaled by the size of the profession) is necessarily larger in countries with more
publicly-traded firms reporting under IFRS. It is also worth noting that at the country-level,
many institutional variables are highly correlated and difficult to separate.
With these limitations in mind, we explore cross-sectional variation along two
dimensions. We view the evidence as descriptive only. First, we explore proxies for the extent of
regulatory harmonization, i.e., the extent to which audit standards are being harmonized and the
size of public equity markets to GDP (which is related to how widespread IFRS adoption is in
the economy). Second, we explore proxies for the extent to which regulatory harmonization is

41
likely to affect migration to a country, i.e., the market share of Big 4 auditors and remaining
professional entry barriers in the form of licensing requirements. Due to their descriptive nature,
we present these analyses in the Internet Appendix only (see Section IA9).
The analyses indicate that the treatment effects tend to be larger in magnitude when
accounting and auditing harmonization is greater, i.e., in countries that fully adopted ISA and
have large equity markets (see Table IA9b, Panels A and B). The estimated treatment effects are
also larger in magnitude in countries with low licensing requirements and a high Big 4 auditor
market share (see Table IA9b, Panels C and D). In all cases and for all control groups, the results
directionally make sense but the differences in the treatment effects between the high and the
low groups are often not statistically significant. As the differences are often large in magnitude,
we find this evidence suggestive and descriptively useful.
6. Conclusion
This paper examines the effect of international regulatory harmonization on cross-border
labor migration. The idea is that diversity in professional rules presents an economic barrier to
cross-border mobility and hence harmonization makes it easier for people to migrate. To analyze
this idea, we exploit an increase in harmonization for the accounting profession in the EU in
recent years, namely the mandate to report under IFRS and a directive that harmonized statutory
audits of companies’ financial statements.
Our identification strategy relies on the idea that regulatory harmonization primarily
affected the accounting profession. Thus, we perform a difference-in-differences analysis
comparing changes in mobility of accounting professionals around regulatory harmonization
with changes in mobility of other professions using three separate control groups: legal
professionals, all (other) professionals, and a combination of (other) business people. We control

42
for demographic characteristics that prior studies have shown as related to migration decisions
(i.e., gender, marital status, age, education level, and the presence of children), including all
possible interactions of these characteristics. In addition, we estimate the effects within country
and year to account for unrelated changes and shocks affecting labor mobility of professionals.
To further tighten our design, we perform a double-matched difference-in-differences analysis
that pairs individuals with the same characteristics from the same country before and after
harmonization.
We find that, after regulatory harmonization, cross-border labor migration in the
accounting profession increases by roughly 20% to 22% of the pre-treatment mobility rate,
relative to all other professionals. This percentage increase translates into an increase in the total
number of migrants by 10,000 to 16,000 accounting professionals in our double-matched
specifications. We document this increase using several mobility measures and show that it is
sustained over time.
Importantly, we obtain significant treatment effects even after controlling for changes in
domestic job mobility as well as among individuals that recently changed their jobs. It is
therefore unlikely that our results merely reflect changes in the demand for accounting services,
rather than regulatory harmonization. Demand effects due to new regulation should be limited in
time and affect both domestic and foreign professionals. We also show that the increase in cross-
border migration exists when we limit the analysis to EU-15 host and source countries. Thus, our
results do not reflect EU enlargement or a migration wave from Eastern to Western Europe.
Finally, we provide descriptive evidence suggesting that the migration effects are stronger when
there is more harmonization, licensing rules are less strict, and Big-4 auditors have a larger
market share, consistent with regulatory harmonization driving our results.
43
Overall, we conclude that diversity in rules and regulations constitutes an important
economic barrier to cross-border labor migration. More specifically, our results imply that
accounting and auditing harmonization can reduce this barrier and have a meaningful effect on
cross-border migration. Regulatory harmonization could therefore be an important policy
instrument to improve cross-border mobility and, ultimately, the efficiency of international labor
markets. However, we acknowledge that our findings are limited to the accounting profession,
which may be more responsive to regulatory harmonization than other professions. It is also
possible that the financial crisis, which partially overlaps with our sample period, exacerbated
unemployment and/or wage differentials across the EU, which in turn increased the magnitude of
the treatment effect of regulatory harmonization (relative to what it would have been without the
crisis). Finally, we emphasize that the LFS dataset has several drawbacks in measuring cross-
border mobility around regulatory harmonization and in identifying accounting professionals.
For all these reasons, readers should interpret the magnitude of the estimated treatment effects
carefully.

44
References
Armstrong, C.S., Guay, W.R., Weber, J.P., 2010. The role of information and financial reporting in corporate governance and debt contracting. Journal of Accounting and Economics 50, 179–234.
Ball, R., Robin, A., Wu, J.S., 2003. Incentives versus standards: properties of accounting income in four East Asian countries. Journal of Accounting and Economics 36, 235–270.
Balsam S., Gordon, E. A., Li, X., 2015. Mandatory Disclosure Reform, Monitoring, and Executive Compensation. Working paper, Temple University.
Bakija, J., Slemrod, J., 2004. Do the rich flee from high state taxes? Evidence from federal estate tax returns. Working paper, Williams College, University of Michigan.
Barth, M.E., 2006. Research, standard setting, and global financial reporting. Foundations and Trends in Accounting 1, 71–165.
Bonin, H., Eichhorst, W., Florman, C., Hansen, M.O., Skiöld, L., Stuhler, J., Tatsiramos, K., Thomasen, H., Zimmermann, K.F., 2008. Geographic mobility in the European Union: Optimising its economic and social benefits. IZA Research Report No. 19, Institute for the Study of Labor.
Borjas, G.J., 1987. Self-Selection and the earnings of immigrants. American Economic Review 77, 531–553.
Brüggemann, U., Hitz, J.-M., Sellhorn, T., 2013. Intended and unintended consequences of mandatory IFRS adoption: a review of extant evidence and suggestions for future research. European Accounting Review 22, 1–37.
Burgstahler, D.C., Hail, L., Leuz, C., 2006. The importance of reporting incentives: earnings management in European private and public firms. The Accounting Review 81, 983–1016.
Christensen, H.B., Hail, L., Leuz, C., 2013. Mandatory IFRS reporting and changes in enforcement. Journal of Accounting and Economics 56, 147–177.
Cochran, W.G., Rubin, D.B., 1973. Controlling bias in observational studies: A review. The Indian Journal of Statistics 35, 417–446.
Conley, T., Goncalves, S. and Hansen, C., 2016, Performing statistical inference with dependence: a review. Working paper, Western University, University of Chicago.
Conway, K.S., Houtenville, A.J., 1998. Do the elderly vote with their feet? Public Choice 97, 663–685.
Conway, K.S., Houtenville, A.J., 2001. Elderly migration and state fiscal policy: Evidence from the 1990 Census migration flows. National Tax Journal 54, 103–123.
Coomes, P.A., Hoyt, W.H., 2008. Income taxes and the destination of movers to multistate MSAs. Journal of Urban Economics 63, 920–937.
d'Addio, A.C. and Cavalleri, M.C., 2015. Labour Mobility and the Portability of Social Rights in the EU. CESifo Economic Studies 61, 346-376.
Dao, M., Furceri, D. Loungani, P., 2014. Regional labor market Adjustments in the United States and Europe. IMF Working Paper WP/14/26.

45
Daske, H., Hail, L., Leuz, C., Verdi, R., 2008. Mandatory IFRS reporting around the world: early evidence on the economic consequences. Journal of Accounting Research 46, 1085–1142.
Daske, H., Hail, L., Leuz, C., Verdi, R., 2013. Adopting a label: heterogeneity in the economic consequences around IAS/IFRS adoptions. Journal of Accounting Research 51, 495–547.
De George, E. T., Ferguson, C. B., Spear, N. A., 2013. How much does IFRS cost? IFRS adoption and audit fees. The Accounting Review 88, 429–62.
Farhi, E., Werning, I., 2014. Labor mobility within currency unions. Working paper, Harvard University, MIT.
FSAP, 1999. Financial Services Action Plan. Implementing the framework for financial markets: action plan. Communication of the Commission, 232.
Hail, L., Leuz, C., Wysocki, P.D., 2010. Global accounting convergence and the potential adoption of IFRS by the U.S. (part I): conceptual underpinnings and economic analysis. Accounting Horizons 24, 355–394.
Healy, P.M., Palepu, K.G., 2001. Information asymmetry, corporate disclosure, and the capital markets: a review of the empirical disclosure literature. Journal of Accounting and Economics 31, 405–440.
Heß, B., Stefani, U., 2012. Audit market regulation and supplier concentration around the world: empirical evidence. Working paper, University of Konstanz.
Holen, A.S., 1965. Effects of professional licensing arrangements on interstate labor mobility and resource allocation. Journal of Political Economy 73, 492-498.
ICAEW, 2007, EU implementation of IFRS and the Fair Value Directive. ICAEW, London.
Kleiner, M.M., 2000. Occupational Licensing. Journal of Economic Perspectives 14, 189–202.
Kleiner, M.M., Gay, R.S., Greene, K., 1982. Barriers to labor migration: The case of occupational licensing. Industrial Relations: A Journal of Economy and Society 21, 383–391.
Kleven, H.J., C. Landais, E. Saez, and E. Schultz, 2014. Migration and Wage Effects of Taxing Top Earners: Evidence of the Foreigners’ Tax Scheme in Denmark. Quarterly Journal of Economics 129, 333–78
Krieger, H., 2004. Migration trends in an enlarged Europe. European Foundation for the Improvement of Living and Working Conditions, Dublin.
Kvaal, E., Nobes, C., 2010. International differences in IFRS policy choice: A research note. Accounting and Business Research 40, 173–187.
Kvaal, E., Nobes, C., 2012. IFRS policy changes and the continuation of national patterns of IFRS practice. European Accounting Review 21, 343–371.
Leuz, C., Wysocki, P., 2016. The economics of disclosure and financial reporting regulation: Evidence and suggestions for Future Research. Journal of Accounting Research 54, 525-622.
Le Vourc’h, J., Morand, P., 2011. Study on the effects of the implementation of the acquis on statutory audits of annual and consolidated accounts including the consequences on the audit market, Final report, ESCP Europe.

46
Madsen, P.E., 2011. How standardized is accounting? The Accounting Review 86, 1679–1708.
Martí, M., Ródenas, C., 2007. Migration estimation based on the labour force survey: an EU-15 perspective. International Migration Review 41, 101–126.
Massey, D. S., Arango, J., Hugo, G., Kouaouci, A., Pellegrino, A., Taylor, E., 1993. Theories of international migration: A review and appraisal. Population and Development Review 19, 431–466
Mincer, J., 1978. Family migration decisions. Journal of Political Economy 86, 749-773.
Mundell, R.A., 1961. A theory of optimum currency areas. American Economic Review 51, 657–665.
Nobes, C. W., Zeff, S. A., 2015. Have Canada. Japan or Switzerland Adopted IFRS? Australian Accounting Review, forthcoming.
OECD, 2014. Migration as an adjustment mechanism in the crisis? A comparison of Europe and the United States. OECD Social, Employment and Migration Working Papers No. 155.
Parey, M., Waldinger, F., 2011, Studying abroad and the effect on international labour market mobility: Evidence from the introduction of ERASMUS. Economic Journal 121, 194–222.
Purcell, N.J., Kish, L., 1980. Postcensal estimates for local areas (or domains). International Statistical Review 48, 3–18.
Rendall, M.S., Tomassini, C., Elliot, D.J., 2003. Estimation of annual international migration from the Labour Force Surveys of the United Kingdom and the continental European Union. Statistical Journal of the United Nations 20, 219–234.
Roy, A.D., 1951. Some thoughts on the distribution of earnings. Oxford Economic Papers, New Series 3, 135–146.
Rubin, D.B., 1973. Matching to remove bias in observational studies. Biometrics 29, 159-183.
Rubin, D.B., 1979. Using multivariate matched sampling and regression adjustment to control bias in observational studies. Journal of the American Statistical Association 74, 318–328.
Sjaastad, L.A., 1962. The costs and returns of human migration. Journal of Political Economy 70, 80–93.
Skupnik, C., 2013. “Welfare Magnetism” in the EU-15? Why the EU enlargement did not start a race to the bottom of welfare states. Working paper, Freie Universität Berlin.
Soderstrom, N.S., Sun, K.J., 2007. IFRS adoption and accounting quality: a review. European Accounting Review 16, 675–702.
Stark, O., Bloom, D.E., 1985. The new economics of labor migration. American Economic Review 75, 173–178.
Wu, J.S., Zhang, I.X., 2009. The voluntary adoption of internationally recognized accounting standards and firm internal performance evaluation. The Accounting Review 84, 1281–1309.
Zaiceva, A., Zimmermann, K.F., 2008. Scale, diversity, and determinants of labour migration in Europe. Oxford Review of Economic Policy 24, 427-451.

47
TABLE 1
Description of LFS dataset
Table 1 presents details on the composition of our dataset at the country level. Our analysis is based on the EU’s Labor Force Survey (LFS). The LFS dataset provides information from 29 European countries over the years 2002 to 2010. Our sample period focuses on the years 2002 to 2004 and 2008 to 2010, respectively. In the second column, we report the total number of survey respondents (raw and LFS weighted) in the LFS dataset who are between 20 and 59 years old. Our sample focuses on the following professions: The treatment group comprises respondents with job code 241 (business professionals primarily accountants). The control group comprises legal professionals (job code 242), all professionals (all job codes with first digit 2, except 241, 214, 222 and 223) or business people (job codes 121, 122, 123, 131, 341 and 342). We report the raw number of respondents for treatment and control groups in the middle of the table. Our sample is reduced to 26 countries, because Bulgaria, Poland and Slovenia do not provide job codes at the three digit level (i.e., respondents with job codes 241 cannot be identified). In the last two columns of the table, we report country-level statistics on the coverage of our mobility metrics. Stock-based measures are NATBIRTH and NATBIRTH_CHG (see Table 2 for details). Flow measures are YEARESID and COUNTR1Y (see Table 4 for details). Coverage details for COUNTR1Y are presented in parentheses if they differ from the coverage details for YEARESID. The superscript + denotes gaps in the coverage time series (e.g., 2002-2010+ indicates that the mobility metric is available for years 2002 and 2010 but not for all years in between).
Treatment(Accountants)
Control(Legal pros)
Control(All pros)
Control(Biz people)
Number of respondents
LFS weighted(in '000)
Number of respondents
Number of respondents
Number of respondents
Number of respondents Stock measures Flow measures
Austria 394,442 27,436 2,880 1,710 22,771 40,448 all all
Belgium 223,058 34,622 4,206 1,293 20,396 20,048 all all
Bulgaria 126,625 25,379 0 0 0 0 2006-2010 2006-2010
Cyprus 86,654 2,491 1,567 485 5,877 5,917 all all
Czech Republic 486,237 36,274 5,411 1,429 22,916 35,988 all all
Denmark 190,995 17,640 4,678 554 17,205 16,351 all all
Estonia 42,673 4,442 732 103 2,826 4,339 all all
Finland 167,458 17,078 1,126 313 10,539 11,578 all all [2002-2007]
France 833,687 193,451 876 2,390 57,215 71,881 all all [2002-2010+]Germany 607,135 273,650 6,240 2,592 38,573 34,830 all all
Greece 586,674 35,829 3,904 3,584 37,626 43,844 all all
Hungary 601,543 33,850 5,111 1,552 29,546 37,487 all all
Iceland 35,521 971 735 256 3,899 3,815 all all [2002]
Ireland 480,646 14,305 7,900 1,790 34,390 54,700 all 2002-2010+ [none]Italy 1,313,874 195,315 7,775 6,732 54,524 95,848 2005-2010 all
Latvia 71,291 7,645 1,227 308 4,706 6,255 2004-2010 all
Lithuania 125,379 11,262 3,656 473 8,549 10,811 all all
Luxembourg 56,960 1,594 2,202 530 5,367 3,923 all all
Netherlands 353,578 54,360 8,604 2,243 36,428 44,193 all all [2006-2010]
Norway 91,248 15,270 1,079 290 5,501 8,766 all all [2002-2005]
Poland 559,474 130,259 0 0 0 0 2004-2010 2004-2010 [all]
Portugal 331,237 35,521 1,676 976 13,275 19,919 all all
Romania 481,245 74,745 1,791 1,641 21,564 9,554 2004-2010 2004-2010 [2002-2010+]Slovakia 225,808 19,083 2,074 596 11,317 12,548 2003-2010 2003-2010
Slovenia 151,935 7,108 0 0 0 0 all all [2008-2010]
Spain 473,571 152,741 1,858 2,448 26,578 32,834 all all
Sweden 627,015 28,778 17,437 2,381 61,941 54,818 all all [2006-2010]
Switzerland 202,076 25,438 5,249 1,071 19,170 9,446 all all [2010]
United Kingdom 398,166 195,196 5,946 1,740 28,283 58,172 all all [2002-2010+]Total 10,326,205 1,671,730 105,940 39,480 600,982 748,313
Host country
Coverage of mobility metrics(years available)
LFS Dataset(2002-2004, 2008-2010)

48
TABLE 2
Descriptive statistics for the variables in regression analysis
Table 2 presents descriptive statistics for the variables in the regression analysis in Table 3. In the second column, we present LFS-weighted statistics (i.e., each observation is weighted with the statistical weight for the individual provided in the LFS dataset). In the last column, we report statistics based on the raw number of survey respondents (i.e., not LFS weighted). Our sample comprises individuals from 26 countries for the years 2002 to 2004 and 2008 to 2010, respectively. We focus on individuals who are between 20 and 59 years old, and whose highest degree of education is at least at the upper secondary level. In addition, we require non-missing information on all control variables as well as on the mobility metrics NATBIRTH and NATBIRTH_CHG. NATBIRTH defines respondents as migrants (or mobile) if they have a foreign nationality and were born outside the host country in which the survey was conducted. NATBIRTH_CHG is based on NATBIRTH but, as a further requirement, defines only those respondents as migrants who recently changed their jobs. We define recent job changes as those that occurred (a) in/after 1999 for the pre-treatment period (2002 to 2004), and (b) in/after 2005 for the post-treatment period (2008 to 2010). The treatment group comprises accountants. The control group comprises legal professionals, all professionals or business people. For details on the composition of treatment and control groups, see Table 1. The upper (middle) part of Table 2 shows statistics on the mobility metric NATBIRTH (NATBIRTH_CHG). The lower part presents statistics on the following control variables for the treatment group of accountants: Domestic job mobility is the proportion of domestic people in a particular job code who recently changed their jobs in a given year, country, and profession. Recent job changes are again defined as those that occurred (a) in/after 1999 for the pre-treatment period, and (b) in/after 2005 for the post-treatment period. Female yes/no is a binary variable and equals one if the individual is female, and zero otherwise. Age is the age of the individual measured by the middle value of 5-year bins. Has kids yes/no is a binary variable and equals one if the individual has one or more children under the age of 15 living in the same household at the time of the survey, and zero otherwise. Single yes/no is a binary variable and equals one if the individual is single, and zero otherwise (married, divorced or widowed). Higher education yes/no is a binary variable and equals one if the highest degree of the individual is at the tertiary or doctoral level, and zero if it is at the upper or post-secondary level.
Obs. Mean Obs. Mean
Mobility yes/no (NATBIRTH)
Treatment (Accountants) 97,821 4.96% 99,061 5.40%
Control (Legal pros) 35,541 2.46% 37,182 2.65%
Control (All pros) 526,678 4.42% 560,701 3.98%
Control (Biz people) 560,804 4.43% 600,772 3.56%
Mobility yes/no (NATBIRTH_CHG)
Treatment (Accountants) 97,821 2.86% 99,061 2.82%
Control (Legal pros) 35,541 1.36% 37,182 1.36%
Control (All pros) 526,678 2.24% 560,701 1.88%
Control (Biz people) 560,804 2.09% 600,772 1.60%
Control variables (Accountants)
Domestic job mobility 97,821 39.62% 99,061 37.83%
Female yes/no 97,821 0.465 99,061 0.499
Age 97,821 38.927 99,061 39.861
Has kids yes/no 62,552 0.340 63,792 0.353
Single yes/no 97,821 0.369 99,061 0.342
Higher education yes/no 97,821 0.720 99,061 0.729
VariablesLFS weighted (no)LFS weighted (yes)

49
TABLE 3
Difference-in-differences analysis of cross-border mobility effects from regulatory harmonization
Panels A and B of Table 3 present results from OLS regressions that test for differences in mobility trends between the treatment group (accountants) and the control groups (legal professionals, all professionals or business people). Our sample comprises individuals from 26 countries for the years 2002 to 2004 and 2008 to 2010, respectively. The dependent variable is a binary variable and equals one if the individual is mobile according to the relevant mobility metric (NATBIRTH or NATBIRTH_CHG), and zero otherwise. The independent variables are defined as follows: Accountant is a binary variable equal to one for individuals from the treatment group (job code 241), and zero for individuals from the relevant control group. Post is a binary variable equal to one for years 2008 to 2010, and zero for years 2002 to 2004. We include fixed effects to control for differences in individuals’ characteristics (Bin), country-specific mobility differences between the treatment and the control group (Country*Accountant) and country-specific mobility trends (Country*Year). Bin introduces 192 separate fixed effects, one for each combination of the control variables: gender, age, presence of children, marital status, and education level (see Table 2 for details). These fixed effects control for the full set of interactions between all control variables. Panel A (Panel B) present results from the baseline regressions (with Domestic job mobility as additional control). Domestic job mobility is the proportion of domestic people in a particular job code who recently changed their jobs in a given
Panel A: Baseline regressions
Accountant * Post 1.309** 0.738** 0.716 0.694** 0.830*** 0.452* 1.127** 0.767** 0.669* 0.622** 0.703*** 0.330
(2.34) (2.05) (1.64) (2.53) (3.76) (1.75) (2.05) (2.53) (1.92) (2.42) (2.86) (1.44)
Control group Legal pros All pros Biz people Legal pros All pros Biz people Legal pros All pros Biz people Legal pros All pros Biz people
Observations 133,362 624,499 658,625 136,243 659,762 699,833 133,362 624,499 658,625 136,243 659,762 699,833
R-squared 0.10 0.05 0.04 0.24 0.13 0.10 0.06 0.04 0.03 0.12 0.07 0.06
Country * Accountant
Country * Year
Independent variablesLFS weighted (yes)
Country * Accountant
Country * YearCountry * Year
Dependent variable: Mobility yes/no (NATBIRTH_CHG)
LFS weighted (yes)
Bin
LFS weighted (no)
Bin
Dependent variable: Mobility yes/no (NATBIRTH)
Bin
LFS weighted (no)
Bin
Country * Accountant
Country * Year
Fixed effects Country * Accountant
Panel B: Baseline regressions with domestic job mobility control
Accountant * Post 1.232** 0.730** 0.776* 0.670** 0.810*** 0.550** 1.083* 0.753** 0.747** 0.608** 0.695*** 0.447*
(2.19) (2.07) (1.80) (2.45) (3.88) (2.04) (1.99) (2.58) (2.32) (2.47) (2.98) (1.91)
Domestic job mobility 0.047 0.013 0.078* 0.046 0.020 0.060* 0.029 0.023 0.102*** 0.046 0.008 0.072**
(1.19) (0.39) (1.97) (1.09) (0.72) (1.86) (0.87) (0.72) (3.15) (1.17) (0.25) (2.40)
Control group Legal pros All pros Biz people Legal pros All pros Biz people Legal pros All pros Biz people Legal pros All pros Biz people
Observations 133,362 624,499 658,625 136,243 659,762 699,833 133,362 624,499 658,625 136,243 659,762 699,833
R-squared 0.10 0.05 0.04 0.24 0.13 0.10 0.06 0.04 0.03 0.12 0.07 0.06
Bin
Country * Accountant
Country * Year Country * Year
Bin
Country * Accountant
Independent variablesLFS weighted (yes) LFS weighted (yes)
Dependent variable: Mobility yes/no (NATBIRTH_CHG)Dependent variable: Mobility yes/no (NATBIRTH)
LFS weighted (no)
Fixed effects
Bin
Country * Accountant
Country * Year
LFS weighted (no)
Bin
Country * Accountant
Country * Year

50
TABLE 3 (continued)
year and country (see Table 2 for details). In the first six columns of Panels A and B, we use NATBIRTH as migration measure and present regression results with and without weighing observations by the statistical weight provided for each individual in the LFS dataset. In the last six columns of Panels A and B, we present the results using NATBIRTH_CHG, both with and without LFS weights. NATBIRTH defines respondents as mobile if they have a foreign nationality and were born outside the host country in which the survey was conducted. NATBIRTH_CHG is based on NATBIRTH but, as a further requirement, defines only those respondents as migrants who recently changed their jobs (see Table 2 for details). The table reports OLS coefficient estimates and t-statistics (in parentheses). We multiply the coefficient estimates by 100 for expositional purposes. The t-statistics are based on robust standard errors with one-way clustering by country-job group. ***, **, * indicate statistical significance at the 1%, 5% and 10% levels (two-sided), respectively.

51
TABLE 3 (continued)
Panel C of Table 3 presents results from a double matched difference-in-differences analysis that tests for differences in mobility trends between the treatment group (accountants) and the control group of all professionals. The sample comprises individuals from 24 countries for the years 2002 to 2004 and 2008 to 2010 (Italy drops out due to missing mobility metrics in the pre-treatment period; Romania drops out because job codes are only available at the three digit level in the pre-treatment period). The sample is restricted to pairs of treatment and control group individuals with the same characteristics for a year in the pre-treatment period and a year in the post-treatment period (see Figure 2 for details on the double matched difference-in-differences approach). We match on gender, age, presence of children, marital status, and education level (see Table 2 for details). The left (middle) part of the table presents results based on the full sample using NATBIRTH (NATBIRTH_CHG) as mobility metric. NATBIRTH defines respondents as mobile if they have a foreign nationality and were born outside the host country in which the survey was conducted. NATBIRTH_CHG is based on NATBIRTH but, as a further requirement, defines only those respondents as migrants who recently changed their jobs (see Table 2 for details). The right part of the table also uses NATBIRTH as mobility metric but focuses on the subsample of people who recently changed jobs. We define recent job changes as those that occurred (a) in/after 1999 for the pre-treatment period (2002 to 2004), and (b) in/after 2005 for the post-treatment period (2008 to 2010). The table reports the mobility rate in percent for each cell in the difference-in-differences analysis (treatment and control; pre and post) and presents results both with and without LFS weights. The treatment effect is the weighted average of the quadruplet treatment effects using the minimum number of individuals from treatment or control entering the quadruplet as a weight. The t-statistics (in parentheses) are based on robust standard errors with one-way clustering by country-job group. ***, **, * indicate statistical significance at the 1%, 5% and 10% levels (two-sided), respectively. ^ indicates statistical significance at the 10% level (one-sided).
Panel C: Double matched diff-in-diff analysis
LFS weighted (yes) (a) Treatment (Accountants) 3.402 5.118 1.717 1.924 2.919 0.994 4.540 7.467 2.927 (b) Control (All pros) 3.940 4.965 1.026 2.050 2.621 0.571 5.388 6.941 1.553
Difference (a) - (b) -0.538 0.1530.691***
(4.02) -0.126 0.2970.423**(2.83) -0.849 0.526
1.374***(3.06)
ObservationsLFS weighted (no) (a) Treatment (Accountants) 6.013 7.605 1.592 3.098 4.205 1.107 7.808 10.205 2.397 (b) Control (All pros) 6.066 7.010 0.944 3.063 3.581 0.518 8.793 10.442 1.649
Difference (a) - (b) -0.053 0.5950.648***
(2.66) 0.035 0.6240.589*(1.89) -0.985 -0.237
0.749*(1.97)
Observations
482,603 482,603 135,776
498,950 498,950 137,827
Only recent job changers
Pre-period(1)
Post-period(2)
Difference(2) - (1)
Mobility rate: NATBIRTHMobility rate: NATBIRTH_CHGFull sample
Double matcheddiff-in-diff analysis Pre-period
(1)Post-period
(2)Difference(2) - (1)
Mobility rate: NATBIRTH
Pre-period(1)
Post-period(2)
Difference(2) - (1)

52
TABLE 4
Difference-in-differences analysis of cross-border mobility effects using flow-based metrics
Table 4 presents results from the double matched difference-in-differences analysis with two alternative mobility metrics (YEARESID and COUNTR1Y). The sample comprises individuals from 26 countries for the years 2002 to 2004 and 2008 to 2010, respectively (25 countries for COUNTR1Y because this item is not available for Ireland). The research design is the same as in the analysis presented in Panel C of Table 3. All results in this table are based on tests that use all professionals as the control group. The alternative mobility metrics are as follows: YEARESID defines individuals as mobile if they were born abroad and moved to the host country in/after 1999 (for sample years 2002 to 2004) or in/after 2005 (for sample years 2008 to 2010). COUNTR1Y defines individuals as mobile if they moved to the host country within the last year. We report results for the full sample as well as for the following subsamples: Singles without kids focuses on individuals who are single (Single yes/no = 1) and who do not have children aged less than 15 years living in the same household (Has kids yes/no = 0). Young singles without kids focuses on singles without children who are less than 40 years old (20 <= Age< 40). Young Singles without kids at big employer focuses on young singles without children who work for a firm with more than 50 employees (LFS item SIZEFIRM measured at local unit). The table reports pre-treatment mobility rates in percent for the treatment group, minimum-sample weighted treatment effects as defined in Figure 2, t-statistics (in parentheses) as well as the number of quadruplets and observations in these quadruplets. We report these statistics both with and without LFS weights. The t-statistics are based on robust standard errors with one-way clustering by country-job group. ***, **, * indicate statistical significance at the 1%, 5% and 10% levels (two-sided), respectively. ^ indicates statistical significance at the 10% level (one-sided).
LFS weighted (yes)
LFS weighted (no)
LFS weighted (yes)
LFS weighted (no)
LFS weighted (yes)
LFS weighted (no)
LFS weighted (yes)
LFS weighted (no)
Mobility rate: YEARESID Pre-treatment mobility 1.330 2.351 1.621 2.314 1.674 2.483 2.538 3.652
Treatment effect0.267(1.10)
0.107(0.55)
0.458^(1.56)
0.168(0.93)
0.501*(1.72)
0.277^(1.50)
1.731***(6.02)
0.798**(2.32)
Observations 480,241 496,620 84,724 86,717 71,769 73,358 22,747 23,297Mobility rate: COUNTR1Y Pre-treatment mobility 0.185 0.199 0.424 0.399 0.422 0.434 0.583 0.526
Treatment effect0.101(1.48)
0.041(0.41)
0.521***(2.99)
0.367*(1.75)
0.566**(3.06)
0.417*(1.77)
0.771***(5.05)
0.427(0.80)
Observations 365,627 366,997 70,736 70,972 60,791 60,987 18,296 18,303
Young singleswithout kidsDouble matched
diff-in-diff analysis
Full sample Singleswithout kids
Young singleswithout kids at big employer

53
TABLE 5
Migrations to and within EU-15 around regulatory harmonization
Table 5 presents for two sets of specifications on migrations to and within EU-15 countries: The first set of regressions is restricted to the subsample of survey individuals from EU-15 host countries. The second set of regressions is restricted to individuals from EU-15 host countries and, in addition, to migrants from EU-15 source countries (i.e., the dependent variable equals one only if a mobile individual was born inside the EU-15 and has a EU-15 nationality). The research design is the same as in the regression analysis presented in Panel B of Table 3. All regression results in this table are based on LFS weighted observations. The table reports OLS coefficient estimates and t-statistics (in parentheses). We multiply the coefficient estimates by 100 for expositional purposes. The t-statistics are based on robust standard errors with one-way clustering by country-job group. ***, **, * indicate statistical significance at the 1%, 5% and 10% levels (two-sided), respectively.
Accountant * Post 1.122* 0.775** 0.821** 0.640** 0.518** 0.541**
(1.80) (2.32) (2.28) (2.62) (2.51) (2.51)
Domestic job mobility 0.039 0.031 0.130*** 0.029 -0.004 0.030
(0.90) (0.70) (3.56) (1.28) (-0.21) (1.40)
Control group Legal pros All pros Biz people Legal pros All pros Biz people
Observations 98,075 468,711 493,418 98,075 468,711 493,418
R-squared 0.06 0.03 0.03 0.07 0.02 0.02
Independent variablesEU-15 host countries only
Fixed effects
Bin
Country * Accountant
Country * Year
Bin
Country * Accountant
Country * Year
Dependent variable: Mobility yes/no (NATBIRTH_CHG)
EU-15 host and EU-15 source countries only
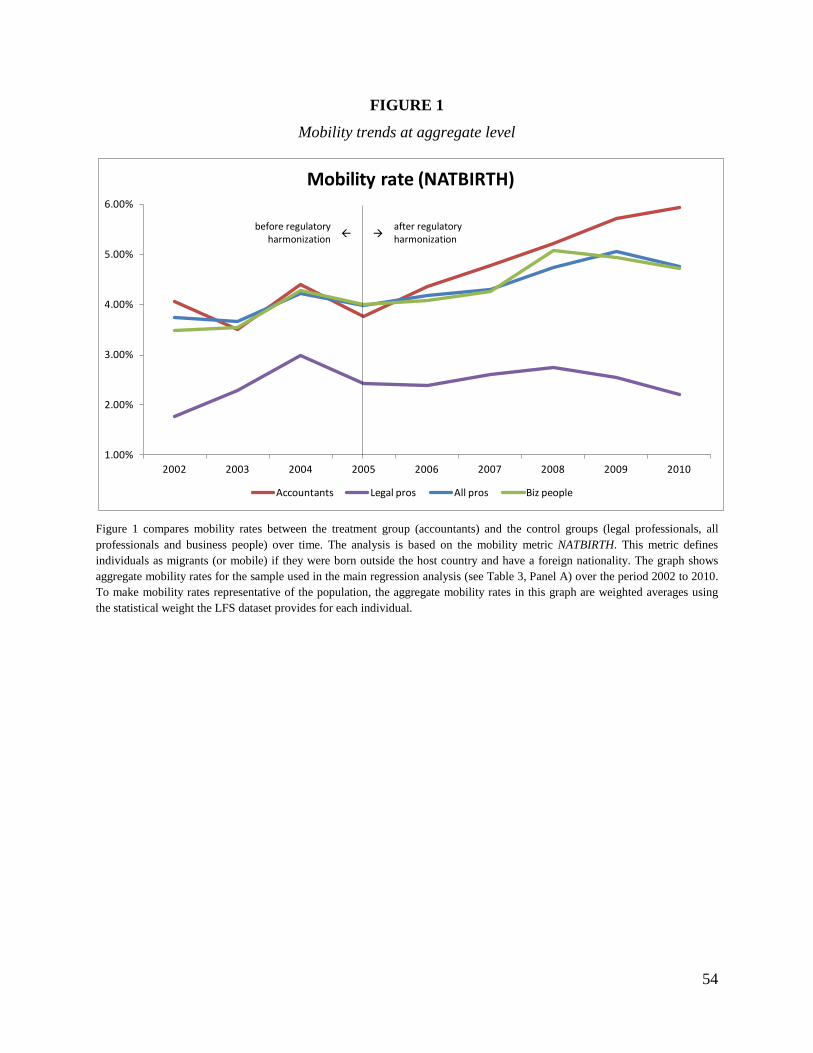
54
FIGURE 1
Mobility trends at aggregate level
Figure 1 compares mobility rates between the treatment group (accountants) and the control groups (legal professionals, all professionals and business people) over time. The analysis is based on the mobility metric NATBIRTH. This metric defines individuals as migrants (or mobile) if they were born outside the host country and have a foreign nationality. The graph shows aggregate mobility rates for the sample used in the main regression analysis (see Table 3, Panel A) over the period 2002 to 2010. To make mobility rates representative of the population, the aggregate mobility rates in this graph are weighted averages using the statistical weight the LFS dataset provides for each individual.
1.00%
2.00%
3.00%
4.00%
5.00%
6.00%
2002 2003 2004 2005 2006 2007 2008 2009 2010
Mobility rate (NATBIRTH)
Accountants Legal pros All pros Biz people
before regulatory harmonization
after regulatory harmonization

55
FIGURE 2
Description of double matched difference-in-differences approach
Figure 2 illustrates the double-matched difference-in-differences approach. Within each country and year, we first match all accounting professionals and all control observations. We further match pre-treatment observations in year t to post-treatment observations in year t+6 (e.g., observations in 2004 to observations in 2010). Along both dimensions, we perform an exact match on gender, marital status, age, education level, and the presence of one or more children under the age of 15 living in the household (see Table 2 for details). This approach yields two sets of accounting professionals and two sets of control professionals (one pre- and one post-treatment), which share the exact same characteristics (illustrated by the four boxes above). We define these four sets as a quadruplet and compute the difference-in-differences (or treatment effect) within each quadruplet. The total treatment effect is the weighted average over all quadruplets, i.e., ΣwiTEi, where TEi is the treatment effect for quadruplet i and wi is the weight assigned to quadruplet i. We use the minimum sample in any of the four boxes in each quadruplet i as weight because the information in the quadruplet is ultimately constrained by the smallest sample size of the four boxes.
Example of quadruplet: Single males, in Germany, between 25-29 years old, without kids, with university degree
a.pre - c.pre a.post - c.post
a.post-a.pre
c.post-c.pre
(a.pre) Accounting professionals
(c.pre) Control professionals
(a.post) Accounting professionals
(c.post) Control professionals
Exact match
Exact match
Exac
t m
atch
Exac
t m
atch
Firs
t diff
eren
ce (a
-c)
Second difference (post - pre)
First difference:
Seconddifference:
Treatment effect for one quadruplet is
diff.-in-diff.(TEi)


