THE EFFECT OF DIVERSIFICATION ON PORTFOLIO RETURNS
OF MUTUAL FUNDS IN KENYA
BY
FERNANDES JUMA WAFULA
A RESEARCH PROJECT SUBMITTED IN PARTIAL FULFILMENT OF THE
REQUIREMENTS FOR THE AWARD OF THE DEGREE OF MASTER OF
BUSINESS ADMINISTRATION, SCHOOL OF BUSINESS, UNIVERSITY OF
NAIROBI
OCTOBER 2014

ii
DECLARATION
This research Project is my original work and has not been presented in any other
University.
Signed…………………………………………… Date …………………………………..
Fernandes Juma Wafula
D61/79222/2012
This research project has been submitted for presentation with my approval as University
Supervisor.
Signed………………………………………….. Date ……………………………………
Supervisor: Mr. Cyrus Iraya

iii
DEDICATION
I dedicate this paper to my loving wife Caroline Nyawira Fernandes for the
encouragement and support accorded to me throughout the research process, to my mum
Rosina Namalwa Wafula for reminding me of my potential, my late father who always
encouraged me to aspire for greatness and finally to my little daughter Neriah Namalwa
Fernandes for giving me the reason to push on.

iv
ACKNOWLEDGEMENT
Work on this project has been a challenging but valuable intellectual and personal
experience and there are many people I would like to acknowledge for their contributions
and support in the process. First and foremost, I would like to offer a sacrifice of thanks
giving to God for his faithfulness and sufficient grace. This is testimony that he will
always be found when we seek him and nothing is impossible if we always let him lead.
My deepest appreciation goes to my Supervisor Mr. Cyrus Iraya for his unwavering
support and mentorship with this project and the entire MBA course. Thank you Mr.
Iraya for your encouragement, insight, counsel, time, effort and for the constructive way
you challenged my thoughts on the topic of this thesis. I will forever feel highly honored
to have been mentored by a great scholar like you.
My appreciation also extends to the many scholars whose writings have enriched the
literature on the topics of diversification, risk and portfolio returns of mutual funds. They
are listed in the bibliography section, and those with multiple citations deserve my special
gratitude. I also benefited greatly from my fellow graduate business students at the
University of Nairobi, School of Business whose writings and discussions greatly
stimulated my thinking.
I would like to also register my appreciation for the moral support I got from my loving
wife Caroline Nyawira-Fernandes, may God reward you greatly sweetheart. Special
thanks to my Mother Rosina Namalwa Wafula for being a constant reminder on the need
to have this project completed and my late father Raphael Wafula Matepe for giving me
the hunger to always aspire for greatness. Finally, I owe special thanks to my Daughter
Neriah Namalwa Fernandes for giving me the reason to push on and for the patience and
understanding for the long hours I have spent on this research.
v
ABSTRACT
The objective of this study was to determine the effect of diversification on portfolio
return of mutual funds in Kenya.
The study took a descriptive research design approach. The study entailed a sample of 7
mutual funds that had balanced funds with complete records for the year 2013 for a
period of 52 weeks. The study used secondary data sources available at the NSE or
Capital Market Authority offices. The study used the multiple linear regression equation
and the method of estimation was Ordinary Least Squares (OLS) so as to establish the
effect of diversification on portfolio returns of mutual funds in Kenya.
The study revealed that diversification affects the portfolio returns of mutual funds in
Kenya. The study found that diversification positively influences the portfolio returns.
There is need for fund managers to actively craft there investment strategy and impress
diversification so that they can be able to improve the portfolio returns of the fund
holders.

TABLE OF CONTENTS
DECLARATION............................................................................................................... ii
DEDICATION.................................................................................................................. iii
ACKNOWLEDGEMENT ............................................................................................... iv
ABSTRACT ....................................................................................................................... v
LIST OF ABBREVIATIONS ............................................................................................ vi
LIST OF TABLES ............................................................................................................ vii
CHAPTER ONE ................................................................................................................. 1
INTRODUCTION .............................................................................................................. 1
1.1 Background of the Study ........................................................................................... 1
1.1.1 Diversification .................................................................................................... 2
1.1.2 Portfolio Returns ................................................................................................ 4
1.1.3 Effect of Diversification on Portfolio Returns ................................................... 4
1.1.4 Mutual Funds in Kenya ...................................................................................... 5
1.2 Research Problem ...................................................................................................... 9
1.3 Objectives of the study ............................................................................................ 12
1.4 Value of the study ................................................................................................... 12
CHAPTER TWO .............................................................................................................. 14
LITERATURE REVIEW ................................................................................................. 14
2.1 Introduction ............................................................................................................. 14
2.2 Theoretical Review ................................................................................................. 14
2.2.1 Modern Portfolio Theory .................................................................................. 14
2.2.2 Capital Asset Pricing Model ............................................................................. 16
2.2.3 Arbitrage Pricing Theory .................................................................................. 18
2.3 Determinants of Portfolio Returns. ......................................................................... 20
2.3.1 Diversification .................................................................................................. 20
2.3.2 Market Timing .................................................................................................. 21
2.3.3 Security Selection ............................................................................................. 21
2.4 Empirical Review .................................................................................................... 22
2.5 Conclusion on Literature Review ............................................................................ 28
CHAPTER THREE .......................................................................................................... 30
RESEARCH METHODOLOGY...................................................................................... 30
3.1 Introduction ............................................................................................................. 30
3.2 Research design ....................................................................................................... 30
3.3 Population of Study ................................................................................................. 31
3.4 Sample and Sampling Design ................................................................................. 31
3.5 Data Collection Technique ...................................................................................... 31
3.6 Data Analysis Technique......................................................................................... 32
CHAPTER FOUR ............................................................................................................. 34
DATA ANALYSIS AND RESULTS DISCUSSION ...................................................... 34

4.1Introduction .............................................................................................................. 34
4.2 Descriptive Statistics ............................................................................................... 34
4.3 Regression Analysis ................................................................................................ 35
4.3.1 Model Summary ................................................................................................... 35
4.3.2 Analysis of Variance ............................................................................................ 36
4.3.3 Model Coefficients ............................................................................................... 37
4.4 Discussion of Findings ............................................................................................ 37
CHAPTER FIVE .............................................................................................................. 39
SUMMARY, CONCLUSION AND RECOMMENDATIONS ....................................... 39
5.1 Introduction ............................................................................................................. 39
5.2 Summary of findings ............................................................................................... 39
5.3 Conclusion ............................................................................................................... 41
5.4 Policy Recommendations ........................................................................................ 41
5.5 Suggestions for Further Research ........................................................................... 41
5.6 Limitations of the Study .......................................................................................... 42
REFERENCES ................................................................................................................. 43
APPENDICES .................................................................................................................. 47
vi
LIST OF ABBREVIATIONS
ANOVA Analysis of Variance
APT Arbitrage Pricing Theory
CMA Capital Markets Authority
CAPM Capital Asset Pricing Model
GDP Gross Domestic Product
IMF International Monetary Fund
NSE Nairobi Security Exchange
PIMS Profit Impact of Market Strategies
SA South Africa
SBU Strategic Business Unit

vii
LIST OF TABLES
Table 4.2 Descriptive Statistics ......................................................................................... 34
Table 4.3.1 Model Summary ............................................................................................ 35
Table 4.3.2 ANOVA Statistics.......................................................................................... 36
Table 4.3.3 Coefficients ............................................................................................................. 37

1
CHAPTER ONE
INTRODUCTION
1.1 Background of the Study
Investors are generally risk averse and will do anything within their power to minimize
risk without affecting the level of return that they can receive from their investment.
One of the ways to achieve this is by diversifying the investment portfolio into many
assets class such as stocks, bonds and real estate. Diversification is the holding of a
combination of assets which are not positively correlated such that in the event of poor
fortunes of one asset, the investor can be compensated by the good fortunes of the
other assets. Markowitz (1952) observed that diversification helps in the reduction of
portfolio risk and cushions the portfolio from potentially catastrophic events such that
in the event of failure of one of the constituent investments the investor falls back to
the good fortunes that the other constituent investments would record hence ensuring
that the entire portfolio value and returns remains good.
Portfolio return on the other hand is the combination of the expected returns, or
averages of probability distributions of possible returns, of all the assets in an
investment portfolio. These Overall return usual gives a better reward to an investor
than when investments are held in isolation. Kamwaro (2013) contends that there is a
strong relationship between financial performance and the size of investment one
holds in a portfolio thereby contributing to the fact that diversification affects portfolio
returns.
2
This thinking has led to the development of many collective investment schemes or
mutual funds around the world. Mutual funds constitute a pool of funds that are
managed on behalf of investors by professional money managers. In Kenya the term
Unit trusts and collective investment schemes are interchangeably used to refer to
mutual funds. The Fund management industry is a key sector that invests funds under
their control for both the private and public sectors in Kenya. According to the CMA
website (www.cma.or.ke), there are 17 registered and operating collective investment
schemes in Kenya. The fund management industry in Kenya is relatively young having
taken off with the passage of the Capital Markets Amendment ACT (2000), which
promotes, regulates and facilitates the development of an of an orderly, fair and
efficient Capital Markets.
1.1.1 Diversification
Markowitz (1952) observes that diversification is a situation where investors invest in
two or more different assets. This term is also used to interchangeably refer to a
“portfolio”. Investors in financial securities will usually hold a portfolio of stocks,
while a large divisionalized company might hold a portfolio of business assets.
Diversification is an important investment technique that helps reduce risk by
allocating investments among various financial instruments, industries and other
categories. It aims to maximize return by investing in different areas that would each
react differently to the same event.
3
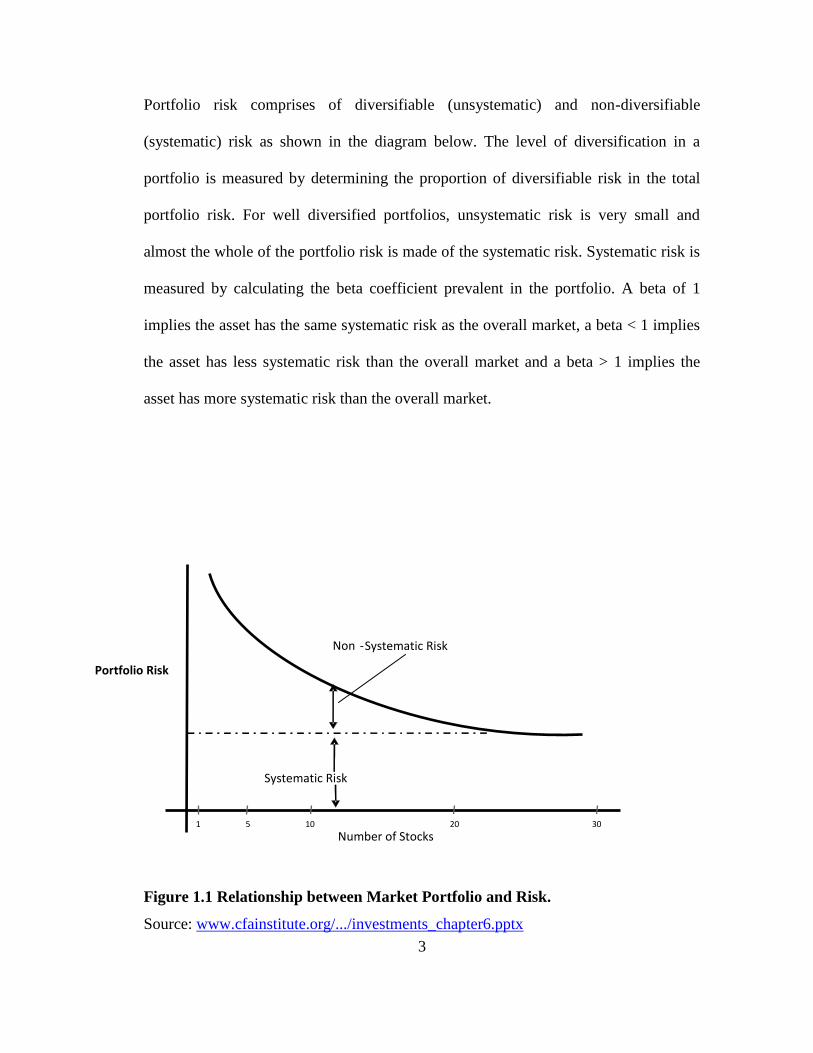
Portfolio risk comprises of diversifiable (unsystematic) and non-diversifiable
(systematic) risk as shown in the diagram below. The level of diversification in a
portfolio is measured by determining the proportion of diversifiable risk in the total
portfolio risk. For well diversified portfolios, unsystematic risk is very small and
almost the whole of the portfolio risk is made of the systematic risk. Systematic risk is
measured by calculating the beta coefficient prevalent in the portfolio. A beta of 1
implies the asset has the same systematic risk as the overall market, a beta < 1 implies
the asset has less systematic risk than the overall market and a beta > 1 implies the
asset has more systematic risk than the overall market.
Figure 1.1 Relationship between Market Portfolio and Risk.
Source: www.cfainstitute.org/.../investments_chapter6.pptx
5 1
Portfolio Risk
Number of Stocks
Systematic Risk
Non - Systematic Risk
10 20 30

4
1.1.2 Portfolio Returns
Portfolio return refers to the overall reward that an investor gets by investing in a
certain pool of assets or securities within a given environment or market risk. Because
a market portfolio is completely diversified, it is subject only to systematic risk and
not to unsystematic risk. Investors attempt to maximize their expected portfolio returns
with individually acceptable levels of portfolio risk (Modigliani and Pogue, 1974). An
optimal portfolio is one that provides the highest possible return for any specified
degree of risk or the lowest possible risk for a given return.
Jensen (1968) observes that the portfolio performance is measured by computing the
Jensen alpha or ratio. The ratio measures how much of the portfolio's rate of return is
attributable to the manager's ability to deliver above-average returns, adjusted for
market risk. The higher the ratio, the better the risk-adjusted returns. A portfolio with a
consistently positive excess return will have a positive alpha, while a portfolio with a
consistently negative excess return will have a negative alpha.
1.1.3 Effect of Diversification on Portfolio Returns
Markowitz (1952) observes that by investing in more than one stock, an investor can
reap the benefits of diversification by reducing the riskiness of portfolio. The risk in a
portfolio of diverse individual stocks will be less than the risk inherent in holding any
one of the individual stocks (provided the risks of the various stocks are not directly
5
related). This will in the long run ensure that the level of return an investor will earn in
a portfolio is more certain and higher than if they held their investments in isolation.
The ability to reduce firm-specific risk in a portfolio depends on the relative
correlation of the assets held in the portfolio. The lower the Correlation between assets
held in a portfolio by an investor, the higher the ability of an investor to reduce risk
and increase the expected returns.
Several studies have however recorded diverse conclusions. One argument is that
diversification has no significant impact on performance though it has an impact on
risk adjusted performance (Chang and Elyasiani, 2008). Another view is that
diversification has had significant effect on performance of financial institutions
especially during economic crisis (Kuppuswany and Villalonga, 2010). Among the
effects on performance is that it increases efficiency (Rotich, 2011). With those of the
argument that diversification is inefficient saying that additional product come with
additional cost hence they do not increase on performance. The extent to which
diversification increases or decreases shareholders value in profit oriented firms is still
unclear. This clings on performance (Goddard et al., 2008).
1.1.4 Mutual Funds in Kenya
Few mutual funds existed by the 1950s around the world. In fact mainstream
investment thinking at this time was: Analyze securities one-by-one and focus on
picking winners. Concentrate holdings to maximize returns. Broad diversification was
considered undesirable.
6
Loeb (1950) noted that once you attain competency, diversification is undesirable. One
or two, or at most, three or four securities should be bought. Competent investors will
never be satisfied beating the averages by a few small percentage points.”
Contrary to this assertion, mutual fund management has grown in leaps and bounds in
the recent past around the world and in Kenya included. Fund managers have put the
investors’ money in several investment vehicles also known as diversified portfolios
and this has greatly aroused the thirst for the need to establish whether this investment
strategy has had any benefits that accrues to the investor.
Mutual fund management are arrangements made or offered by any company under
which the individual investor contributions or payments are pooled and utilized with a
view to receive profits, income, produce or property and is managed on behalf of the
investors. These funds offer investors a competitive return at a lower risk and in turn
the fund managers charge a management fees for the service rendered on behalf of the
investors managing these funds. Fund managers use the money to buy stocks, bonds or
other securities according to specific investment objectives that have been established
for the scheme.
Collective Investment Schemes or Unit Trusts have emerged as an important
investment vehicle in Kenya in the recent past and have grown in popularity with even
retail investors from the lower segment of the economy who were traditionally locked
out of investment options now turning millionaires from the trusts. These schemes
generate high returns and minimize investment risk through diversification of the
7
investment portfolio range. They are popular among investors because they offer
simplicity, instant diversification and professional money management across a wide
range of asset classes. There are currently 17 companies that have been licensed by the
CMA in Kenya to offer unit trusts as a form of collective investment schemes.
In emerging markets like Kenya, funds management is a recent discipline and limited
research has been carried out on their performance. The phenomenal growth in the
fund management industry in emerging markets has resulted in a rapid increase in the
number of investment firms offering diversified portfolio of funds. This has
necessitated the need for prudent measurement models to determine portfolio risk and
returns in this sector.
There is no legal requirement for the licensed mutual funds in Kenya to diversify their
investments but almost all the firms have invested in either equity, money or balanced
funds. These firms have recorded impressive portfolio returns as a result of
diversifying their investments relative to the market. Buster (2012) in a study of the
relationship between asset allocation and financial performance of mutual funds in
Kenya contends that unit trusts performed well over the period of study and in most of
the instances, the market trailed behind the performance of unit trusts.
In finance there is a hypothesis which some authors have dubbed “the first
fundamental law in finance” (Ghysels et al., 2005), which states that the greater the
risk the greater the return.
8
Essentially investors are expected only to accept higher risk in their portfolio if this
risk is adequately matched by a commensurate return. It therefore follows that the
pricing of an asset is primarily determined by the level of risk associated with that
asset. It becomes imperative that the risk or volatility parameter in such an asset is
accurately modelled in order to definitively determine if investors are adequately
compensated for assuming greater risk.
This relationship between risk and return is of particular importance in asset
management, specifically in the area of portfolio diversification. Prior to selecting any
investment for a Portfolio, investors should decide upon the proportion of different
assets to be held. Diversification requires that asset managers select assets that are
negatively or lowly correlated. This selection of assets has no simple formula that can
find the right asset allocation for an individual investor: such allocations are usually
subject to the investor’s unique characteristics pertaining to risk appetite, age and
investment horizon (Nuttall et al, 2000). On account of this, it is imperative that the
relationship between risk and return be accurately modelled in order to aid the
investment decisions of investors and portfolio managers (Nuttall et al., 2000)
The past two decades have seen widespread deregulation and liberalization of financial
markets in Africa through the IMF sponsored structural adjustment programme. This
trend towards greater liberalization has been hailed as it assists investors to rapidly
adjust their investment portfolios in response to shocks, leading to less impact on
prices and thus volatility or risk (Montiel and Reinhart, 1999). However, there is a
body of empirical literature that has examined the behavior of liberalized stock
9
markets and found that liberalization has led to increased market volatility
(Borensztein and Gelos, 2000, Froot et al., 2001 and Kaminsky et al., 2000). Because
of these differing conclusions there is a lack of consensus on the impact of
liberalization on volatility which subsequently affects portfolio diversification. Apart
from the risk which is specific to an individual market such as equity markets, it is
prudent to fully understand risk that affects all markets (systemic risk), specifically in
the areas of banking and insurance for the purposes of risk management. This is
necessary for financial regulation as governments seek to impose risk-based capital
adequacy requirements that are commensurate with the amount of risk taken by
financial institutions (Christoffersen et al., 1998).These developments in literature
have led to a growing interest in studying diversification for the purpose of assessing
its impact on the volatility or risk and return in mutual funds. This study shall
investigate the nature of diversification as well as its impact on portfolio return in
mutual funds. The results of such a research can offer insights into asset and risk
management practices as well as financial regulation.
1.2 Research Problem
The investment environment within which the mutual funds operate are faced with a
number of challenges chief among them is the risk. Risk basically is the variability of
the portfolio return as a result of unforeseen circumstances. Diversification of the
investment assets forms a critical component of a fund manager’s strategy in their
endeavour to improve the portfolio returns. Generally, there is a positive relationship
between the number of assets held by a fund manager in an investment portfolio and
10
the portfolio return since as the number of assets increase, the portfolio risk reduces
which in the long-run improve the fortunes of an investor.
Fund management in Kenya is a relatively new investment frontier and limited
information has been published on their performance. Despite their late entry in the
market, mutual funds have grown in leaps and bounds in the recent past. There are
currently about seventeen companies registered by the CMA which further shows the
level of importance the mutual funds play in the Kenyan economy. The recent increase
in the number of players and type of funds that are available to individual investors
make a lot of theoretical and practical significance.
A lot of studies have been written on the relationship between risk and returns from
Scholars like Sharpe (1965) and Firth (1977). The main finding in most of these
studies above is that there is a positive relationship between risk and return. The risk
return trade off concept therefore means that investors get rewarded through a risk
premium for taking additional risk. However exceptions have been noted in this
conclusion .Bowman (1980) discovered that within most industries risk return was
negatively correlated. Fiegenbaum and Thomas (1998) also observed a negative
relationship between risk and return.
A number of studies have been done in Kenya on fund management firms. Muriithi
(2005) carried out an evaluation of risk and returns of equity mutual funds in Kenya
from the period 1st January to 30th June 2005 .He established that out of the mutual
11
funds studied the Old Mutual Equity Fund and the African Alliance Balanced Fund did
not exhibit a positive risk return relationship which is an indication that unit holders
are risk averse and expect to be compensated with high returns for any additional risk
undertaken.Thuo (2011) tested the risk return relationship of mutual fund market in
Kenya. He concluded that a negative beta which is statistically significant was
obtained for the GDP growth rate. This implied that a decrease in the economic growth
rate is an increase in the risk faced by investors hence they will demand a higher rate
of return.Ngene (2002) carried out an investigation into the portfolio performance
measures used by pension funds mangers and the challenges they face in portfolio
management in Kenya. He established that most investment managers are aware of the
portfolio performance measures yet only one of the nine respondents use the measures
in pension fund management.Maina (2003) researched on risk and return of
investments held by insurance Companies in Kenya from January 1997 to December
2001. From his findings, he established that there is very little correlation between
return and risk of investments held by Kenyan insurance companies. Only investments
in secured loans had a positive relationship between return and risk.
However, very limited information has been published on the effect of diversification
on portfolio return among registered mutual fund firms, what number of assets are
ideal to ensure a fully diversified portfolio that can eliminate all the risks and why
some mutual funds still make losses or record less returns despite being diversified and
whether there are other factors that can influence the portfolio return apart from
diversification.
12
Therefore, the research aims to determine the relationship between diversification and
portfolio return of investments held by registered mutual funds in Kenya. The basic
problem for this study is therefore an attempt to enquire into the existence or otherwise
of a diversification portfolio return structural relationship among registered fund
management firms in Kenya. Towards providing answers and filling any gaps to these
issues, the research will evaluate how the level of diversification affects portfolio
return held by registered fund Management firms in Kenya. This study will assist in
answering the research question; what is the relationship between diversification and
portfolio return among fund management firms in Kenya?
1.3 Objectives of the study
To determine the effect of diversification on portfolio returns of mutual funds in
Kenya.
1.4 Value of the study
The study will be of importance to fund managers since they will understand the
relationship between diversification and portfolio returns. This would probably help
them know the extend to which they can diversify their portfolio across industries so
as to reap maximum returns at any given level of risk and in the long-run achieve
efficient portfolios in the mutual funds they are managing on behalf of investors.
Research and Development play a key role in any given economy .This study will be a
source of reference material for future researchers and academicians who would study

13
on related topics hence it formulates a basis for further research. Financial analysts
carry out a research on market performance and on issues affecting the financial
market players. Findings from the study will help them give sound information that
will enable them to give informed decisions and offer appropriate advice to investors
to make sound investment decisions.
The study will also be of significant interest to the Capital Market Authority and the
Nairobi Stock Exchange. They will use the findings from this study to offer informed
advices to the relevant authorities and investors and come up with important policy
and regulatory framework to guide the mutual fund markets and create a level playing
ground to all the sector players.
14
CHAPTER TWO
LITERATURE REVIEW
2.1 Introduction
This chapter sets the theoretical framework as well as reviewing some of the relevant
empirical literature on the diversification-portfolio return relationship. The first part of
the chapter looks at the theoretical literature. Here we review the finance models that
outline the theoretical link between diversification and portfolio return. The second
part of the chapter focuses on the empirical literature on the diversification-portfolio
return relationship
2.2 Theoretical Review
Investor looks forward to getting good return for their investment as a compensation or
reward for taking a risk in an investment. The study will be guided by the modern
portfolio theory, capital asset pricing theory and the arbitrage pricing to demonstrate
the effect of diversification on portfolio return of mutual funds.
2.2.1 Modern Portfolio Theory
Markowitz (1952) developed the basic portfolio theory, he derived the expected rate of
return for a portfolio of assets and an expected risk measure. It emphasizes how risk-
averse investors can construct portfolios to optimize or maximize expected return
based on a given level of risk, emphasizing that risk is an inherent part of higher
reward. According to the theory, it’s possible to construct an efficient frontier of
15
optimal portfolios offering the maximum expected return for a given level of risk.
There are four basic steps involved in portfolio construction: security valuation, asset
allocation, portfolio optimization and performance measurement.
Portfolio theory is a mathematical formulation of the concept of diversification in
investing, with the aim of selecting a collection of investment assets that has
collectively lower risk than any individual assets. That this is possible can be seen
intuitively because different types of assets often change in value in opposite ways.
For example, when prices in stock market fall, prices in the bond market often
increase, and vice versa. A collection of both types of assets can therefore have lower
overall risk than either individually. But diversification lowers risk even if assets
returns are not negatively correlated indeed, even if they are positively correlated
(Markowitz, 1952).
There are several assumptions underlying this theory in regard to investors behavior,
investors consider each investment alternative as being represented by a probability
distribution of expected returns over some holding period, they estimate the risk of the
portfolio on the basis of variability of expected returns, they maximize one period
expected utility, they base their decisions solely on expected return and risk and for a
given level of risk, investors prefer higher to lower returns and similarly, for a given
level of expected return, investors prefer less risk to more risk (Brown & Reily, 2009)
. Many theoretical and practical criticisms have been leveled against this theory the
more fundamental being its measurement of risk in terms of total risk whereas relevant
16
risk in investment appraisal is non-diversifiable risk and the fact that financial returns
do not follow a Gaussian distribution or indeed any symmetric distribution, and the
correlations between asset classes (Micheal, 1998).
The implication of MPT is that a rational investor will not invest in a portfolio if a
second portfolio exists with a more favorable risk-expected return profile. The mutual
fund managers will therefore assemble assets in their portfolio that are likely to record
high portfolio return within any given level of risk.
2.2.2 Capital Asset Pricing Model
CAPM was developed independently by three scholars Sharpe 1964, Lintner 1965,
Treynor 1961. The model is based on portfolio theory and demonstrates how risk and
return could be linked together and also specifies the nature of risk/ return relationship.
In such a simple world, Tobin’s (1958) super-efficient portfolio must be the market
portfolio. All investors will hold the market portfolio, leveraging or de-leveraging it
with positions in the risk free asset in order to achieve a desired level of risk. For any
security or portfolio the CAPM decomposes and quantifies the total risk of a portfolio
or individual assets into 2 components: diversifiable (specific risk) and non-
diversifiable risk (systematic risk). Systematic risk is the risk of holding the market
portfolio. As the market moves, each individual asset is more or less affected. To the
extent that any asset participates in such general market moves, that asset entails

17
systematic risk. Specific risk is the risk which is unique to an individual asset. It
represents the component of an asset’s return which is uncorrelated with general
market moves (Lintner, 1965).
Unsystematic risk is the risk to an asset’s value caused by factors that are specific to
an organization, such as changes in senior management or product lines. In general,
unsystematic risk is present due to the fact that every company is endowed with a
unique collection of assets, ideas and personnel whose aggregate productivity may
vary. A fundamental principle of modern portfolio theory is that unsystematic risk can
be mitigated through diversification. That is by holding many different assets; random
fluctuations in the value of one will be offset by fluctuations in another (Markowitz,
1952). Systematic risk is risk that cannot be removed by diversification. This risk
represents the variation in an asset’s value caused by unpredictable economic
movements. This type of risk represents the necessary risk that owners of a firm must
accept when launching an enterprise. In the CAPM, the risk associated with an asset is
measured in relationship to the risk of the market as a whole (Sharpe, 1964). No matter
how we diversify our investment it’s impossible to get rid of all the risk. As investors,
we deserve a rate of return that compensates us for taking on risk. The CAPM helps us
to calculate investment risk and what return on investment we should expect.
The dependent variable or outcome of the CAPM equation, Rj is the return on the jth
portfolio. The independent variables consist of Rf which is the risk free rate, βj which
is the beta of the jth portfolio and Rm which is the return of the market portfolio. The
18
difference between the market portfolio and the risk free rate is then multiplied by the
beta. Beta which measures risk is the systematic component of a security’s volatility
relative to that of the market portfolio. The security market line graphically illustrates
the above formula and shows the relationship between risk and expected return is a
straight line with a positive slope. It provides investors with a tool for judging whether
securities are undervalued or overvalued given their level of systematic (beta) risk.
This theory has been subject to various criticisms key among them being that the
single market beta needs to be supplemented with additional dimensions of risk.
2.2.3 Arbitrage Pricing Theory
In search of an alternative to asset pricing theory to the CAPM that was reasonably
intuitive, required only limited assumptions and allowed for multiple dimensions of
investment risk Ross, (1976) developed the Arbitrage Pricing Theory (APT).
It describes the price where a mispriced asset is expected to be. Whereas the CAPM
formula requires the markets expected return, APT uses the risky asset’s expected
return and the risk premium of a number of macro-economic factors. Arbitrageurs use
the APT model to profit by taking advantage of mispriced securities. A mispriced
security will have a price that differs from the theoretical price predicted by the model.
By going short an overpriced security, while concurrently going long the portfolio the
APT calculations were based on, the arbitrageur is in a position to make a theoretically
risk free profit (Ross, 1976). The basis of APT is the idea that the price of a security is
driven by a number of factors. These can be divided into two groups: macro factors
19
and company specific factors. The APT is a substitute for the CAPM in that both
assert a linear relation between assets‟ expected returns and their covariance with
other random variables (Ross, 1976). The difference between CAPM and APT is that
CAPM has a single non-company factor and a single beta, whereas APT separates out
non-company factors into as many as proves necessary. Each of these requires a
separate beta. The beta of each factor is the sensitivity of the price of the security to
that factor.
The outcome of the APT equation, Ri , is the actual return on asset i during a specified
time period. The dependent variables consist of a constant factor, E(Ri) which is the
expected return for asset i if all the risk factors have zero changes. bik which is the
reaction in asset is returns to movements in a common risk factor k and δk which is a
set of common factors or indexes with zero mean that influences the returns on all
assets. The equation has an error term εi which is assumed to be zero as it is
completely diversified in large portfolios.
APT does not rely on measuring the performance of the market instead it directly
relates the price of the security to the fundamental factors driving it. The problem with
this is that the theory in itself provides no indication of what these factors are, so they
need to be empirically determined. The potentially large number of factors means
more beta’s to be calculated and there is also no guarantee that all the relevant factors
have been identified (Sharpe, 1992). As a result, the APT is difficult to put into
practice in a theoretically rigorous fashion. Multifactor models attempt to bridge this
gap and these factors will be discussed in details later.

20
2.3 Determinants of Portfolio Returns.
Brinson, Hood and Beebower (1986) and Brinson, Singer and Beebower (1991) in a
study of total return of investment portfolios composed of mutual funds analysed the
contributions of strategic asset allocation (investment policy), tactical timing (the
periodic over- or underweighting of asset classes relative to the strategic weightings)
and security selection (the selection of individual mutual funds to represent asset
classes).
They concluded that strategic asset allocation policy explains more than 90 per cent of
the variation in total portfolio return, and that tactical timing decisions and security
selection may also contribute significantly to the variation in total return.
2.3.1 Diversification
Diversification or asset allocation is the process of creating a portfolio by selecting
effective combinations of investments to meet the specific needs and goals of an
individual investor. The right balance between risk and reward will of course vary by
investor. The key is to find a portfolio that lies along the Efficient Frontier. The
frontier represents a combination of asset classes that can in theory, provide the
highest level of return for an individual investor’s specific risk tolerance.
Asset allocation strategies take advantage of the correlation of these relationships by
combining asset classes in a portfolio to help reduce risk and help maximize return.

21
2.3.2 Market Timing
Market timing is an investing strategy in which the investor tries to identify the best
times to be in the market and when to get out. Relying heavily on forecasts and market
analysis, market timing is often utilized by brokers, financial analysts, and mutual fund
portfolio managers to attempt to reap the greatest rewards for their clients.
Proponents of market timing say that successfully forecasting the ebbs and flows of
the market can result in higher returns than other strategies. Their specific tactics for
pursuing success can range from what some have termed "pure timers" to "dynamic
asset allocators."
Pure timing requires the investor to determine when to move 100% in or 100% out of
one of the three asset classes — stocks, bonds, and money markets.
2.3.3 Security Selection
Security selection is the construction of a portfolio of individual securities that are
perceived to have the potential to outperform the average security within an asset
class. It is, however, extremely difficult to consistently pick the best or worst securities
in an asset class. An investor may do so for one period, or even many periods, but
doing so consistently over a long time would require both uncommon luck and skill.
22
2.4 Empirical Review
Very few studies have been carried out on mutual funds but several studies have been
carried out on diversification, risk and return of portfolio.
The early studies compared the profitability of diversified firms to that of
undiversified firms. Rumelt (1974, 1982), Christensen and Montgomery (1981) and
Palepu (1985) investigated the relationship between corporate diversification and
performance. Their sample consisted of all firms reporting complete data on
COMPUSTAT’sPrimary, Secondary, Tertiary, Full, and Line-of-Business Segment
data tapes for the years 1988 and 1993. The hypotheses were tested using analysis of
covariance (ANOCOVA) showed that firms diversified into related businesses were
more profitable than other diversified firms.
Bettis and Mahajan (1985) selected a sample of 80 firms to examine the relationship
of risk/return performance in two categories of related and unrelated diversified firms
on the basis of accounting data. They found that, on an average, the related diversified
firms perform better than the unrelated diversified firms. However, no significant
difference in terms of risk measurement was explored. They emphasized the
importance of considering the trade off between risk and return in assessing the
effectiveness of diversification. Such a trade-off occurs when firms deliberately
choose to diversify into unrelated businesses with lower profitability if the risk is
thereby reduced.
23
Three studies (Bowman, 1980, 1982; Fiegenbaum and Thomas, 1986) in a study of the
relationship between risk and return examined a large sample of firms from 85
industries, found a negative relationship between risk and return among firms that
were performing well, as well as a negative return between risk and return for firms
performing poorly. Bowman’s (1980, 1982) interpretations of his findings were that
managers may be risk seekers under certain circumstances. Well-managed firms,
according to Bowman (1980, 1982), appeared to be able to increase their returns and
reduce risk simultaneously (suggesting an apparent paradox on account of the negative
relationship), and in contradiction with the positive risk-return relationship postulated
by the formal theorists, although the third study showed that the correlation is unstable
over time and hardly exists when market based measures of risk are employed.
Aaker and Jacobson (1987) empirically examined the role of both systematic or
relative and unsystematic or firm specific, market risk in explaining differences in firm
profitability. PIMS data base of SBU level containing time series information for a
longer period than the Line of Business data base that covers reports of over 2,000
SBUs that are components of the more than 200 participating corporations were
regressed. They found out that each component of risk have a substantial and
significant impact on the rate of return on investment.
Kinyua (2005) evaluated the relationship between risk and returns of equity mutual
funds in Kenya. In addition, the study also sought to compare the performance of
Kenyan equity mutual funds with the stock market as a whole using the NSE20 share
24
index as the benchmark. In order to achieve these objectives, secondary data was used
to generate each mutual fund's returns and risk. Regression analysis was used to derive
the beta. The coefficient of variation, Sharpe model, Treynor model and the Jensen
model were used to determine the relative performance of the sample mutual funds.
The results of the study indicated that there exists a positive risk-return. The risk
adjusted performance measures, showed that the Balanced Fund had the worst
performance when compared to the Equity Fund and the market. However, both the
coefficient of variation and the Sharpe Index indicated that the Equity Fund performed
worse than the market portfolio. While the Treynor index and the Jensen alpha ranked
the Equity Fund as having performed better than the market portfolio as represented by
the NSE20 Index. The findings indicate that the investment manager of the Equity
Fund, in an effort to select undervalued securities or to time the market, holds a
portfolio that is less than fully diversified, and as such contains some diversifiable risk.
Kagunga (2010) investigated whether unit trusts in Kenya have better performance
compared to that of market portfolio, given their systematic risk. The population of
study consisted of all the Unit Trusts in Kenya. The Nairobi 20 share index was used
in estimating the performance of a market portfolio. Data on net asset value and
dividend paid by unit trusts was collected from offices of respective unit trusts
schemes. Data on estimate of dividend received on the market portfolio, and the 20
share index was collected from the Nairobi Stock Exchange. Data on market interest
rates, interbank lending rates and free rates was collected from the Central Bank of
Kenya. By carrying out regression tests, he confirmed that there was a strong
relationship between unit trust return and that of the market.
25
Maina (2011) conducted a study to assess the relationship between Unit Trusts
performance and the asset allocation in Kenya for a selected sample of the companies
licensed by the Capital Markets Authority under the Collective Investment Schemes.
The sample consisted of 12 companies with which a questionnaire was administered.
The performance was regressed against asset allocation and empirically analyzed. He
found out a positive correlation between performance and equity asset allocation in the
management of Unit Trusts in Kenya where Fund managers employed diversification
in the investment of the client money.
Mutuku (2011) conducted a study to determine the relationship between portfolio
composition and risk and return among fund management firms in Kenya. The
research was studied through the use of a descriptive survey. The population of the
study was 18 registered fund managers operating in a Kenya at that time. Both
secondary data and primary data was used to carry out this study. The secondary data
was collected from the registered fund managers’ financial statements, other published
sources and annual returns to regulatory authorities like Capital Markets Authority and
Retirement Benefits Authority. Primary data was collected by a drop and pick
questionnaire. The study concludes that the fund management firms determine the
percentage return of the investment portfolio. The method used by the firms in
determining percentage rate of return was geometric or time weighted returns.
Buster (2012) studied the relationship between asset allocation and financial
performance of mutual funds in Kenya. The population of study consisted of all
approved Collective Investment Schemes in Kenya that deal with Mutual funds and
invest in equities. There were seven in number during the time of study that deal with
26
equity fund. The NSE 20 share index was used in estimating the performance of a
mutual fund’s performance. The index was calculated using equities of 20 companies;
this clearly indicated the need to restrict the study to mutual funds that invests only in
shares. The study found out that there was a difference between the performance of
unit trusts and the market. This was illustrated especially in the year 2011, where the
stock market slumped in its performance while that of the unit trusts improved in its
returns by 18% as compared to the previous years. However, in the year 2010 and
2011 both returns from the stock market and the unit trust recorded an upward trend
while in 2010, both were affected by external factors namely the post-election violence
to record a downward trend in performance.
The findings show that unit trusts performed well over the period of study. In most of
the instances, the market trailed behind the performance of unit trusts. The fact that
unit trust outperformed the market can be attributed to the fact that fund managers
could be in a position to predict stock prices based on several fundamental variables
such as initial dividend yields, market capitalization, price earnings ratios, and price to
book value ratios. This implied that fund managers may have access to enough private
information to offset their expenses. These results are consistent with the notion that
mutual funds are efficient.
Kamwaro (2013) sought to determine the impact of investment portfolio choice on
financial performance of investment companies. The study took a causal research
design approach and study entailed a census of all the investment companies operating
in Kenya and listed in the Nairobi Securities Exchange. There were four investment
companies listed in Nairobi Securities Exchange during the period of study between
27
the years 2007 to year 2011.Secondary data sources available at the companies’ books
of account and the NSE or Capital Market Authority offices was used. The study used
the multiple linear regression equation and the method of estimation was Ordinary
Least Squares (OLS) so as to establish the impact of investment portfolio choice on
profitability of investment companies.
The study revealed that investment portfolio choice affects the financial performance
of investment companies listed in the Nairobi Securities Exchange. The study found
that investment in bonds positively influences the financial performance of investment
companies listed in the NSE. The study also found that investment in real estate and
equity by investment companies positively impacted in the financial performance, it
was found that size of the company positively impacted in the financial performance
of investment companies. There is need for the management of investment companies
to have solid organization structure, organization structure will influence their
investment portfolio choice which impact on their financial performance.
Maina (2013) evaluated the effect of portfolio characteristics on financial performance
of unit trusts in Kenya. The study applied the multi-factor model envisioned by Fama
and French. The model provided a platform to investigate into the impact of certain
characteristics of a fund to performance in this case focusing on size, value versus
growth and momentum factors. The study utilized descriptive analysis and a multi-
factor model. The target population was 14 unit trusts that consisted of equity-based
funds in Kenya for the period 2008 to 2012 with complete set of data for 24 months.
From the findings, the study established that there is a strong relationship between all
the four factors under study and funds’ return hence all the factors had a significant
28
effect on performance. The study also found out that the beta values of the model
showed that the sampled funds were more exposed to small stocks, value rather than
growth stocks and consistent positive future performing funds. The study further
established that there was a strong positive relationship between portfolio
characteristics and unit trusts financial performance further supporting the robustness
of the multi-factor model.
2.5 Conclusion on Literature Review
From the above literature review both the theoretical and the empirical, it’s evident
that there is need for further research to be done on diversification, risk and return in
mutual fund management. This has been evident by the increased desire of both
mutual fund holders and individual investors desire to grow their level of return at the
same time managing the level of risk and hence a clear study needs to be conducted to
give guidance on ways and means of improving their portfolio returns. One of this
strategy is diversification.
There has been no study carried out on the effect of diversification on portfolio returns
of mutual funds in Kenya. Therefore a research gap exists that need to be filled by
doing a thorough study on this topic. Both in developed and developing economies
investors are faced with the dilemma of how to strike a balance between risk and
return and on choosing the most efficient investment vehicle they can put in place in
order to realize their financial freedom. There has not been a conclusive study that has
been carried out that advices investors on the ideal number of assets they need to hold
in a portfolio so as to reduce risk and earn the highest return and at the same time

29
guiding them on the requisite level of risk they should assume for a given investment
they venture into. This research will help address some of this pertinent concerns that
have faced investors at the market place.

30
CHAPTER THREE
RESEARCH METHODOLOGY
3.1 Introduction
Research methodology is a system of explicit rules and procedures upon which
research is based and against which claims for knowledge are evaluated (Nachmias,
1996).
This chapter was devoted to the methods, tools and sources of research data, target
population used for the study, the sampling techniques used and the sample size
utilized, the nature of data that was collected and finally the tools that were used for
purposes of data analysis.
3.2 Research design
This study took a descriptive research design approach. Descriptive research study is
typically concerned with determining the relationship between two variables.
Descriptive research portrays an accurate profile of persons, events, or situations
(Robson, 2002).Being that the study sought to find out the effect of diversification on
portfolio return, a descriptive research design was deemed appropriate. This study took
into consideration all mutual funds registered by the Capital Markets Authority, in
order to determine the effect of diversification on portfolio returns.
31
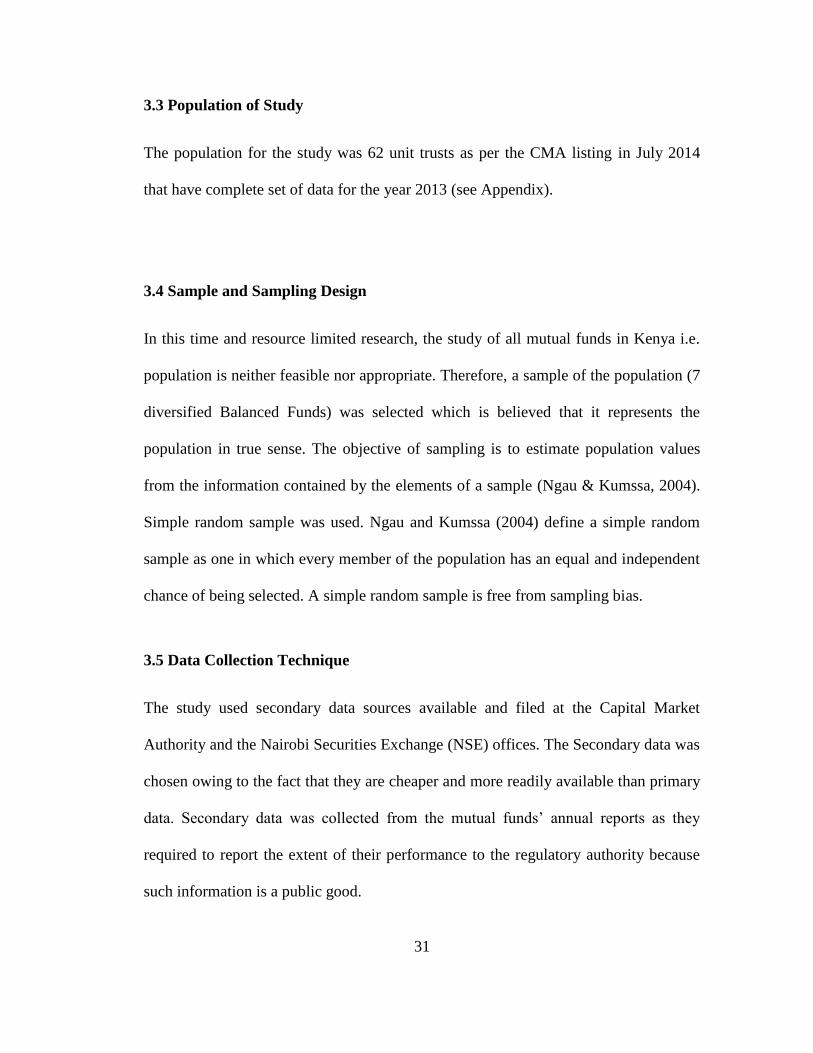
3.3 Population of Study
The population for the study was 62 unit trusts as per the CMA listing in July 2014
that have complete set of data for the year 2013 (see Appendix).
3.4 Sample and Sampling Design
In this time and resource limited research, the study of all mutual funds in Kenya i.e.
population is neither feasible nor appropriate. Therefore, a sample of the population (7
diversified Balanced Funds) was selected which is believed that it represents the
population in true sense. The objective of sampling is to estimate population values
from the information contained by the elements of a sample (Ngau & Kumssa, 2004).
Simple random sample was used. Ngau and Kumssa (2004) define a simple random
sample as one in which every member of the population has an equal and independent
chance of being selected. A simple random sample is free from sampling bias.
3.5 Data Collection Technique
The study used secondary data sources available and filed at the Capital Market
Authority and the Nairobi Securities Exchange (NSE) offices. The Secondary data was
chosen owing to the fact that they are cheaper and more readily available than primary
data. Secondary data was collected from the mutual funds’ annual reports as they
required to report the extent of their performance to the regulatory authority because
such information is a public good.

32
3.6 Data Analysis Technique
The study used the multiple linear regression equation to establish the effect of
diversification on portfolio returns of mutual funds. The regression equation estimated
the model with portfolio return as the dependent variable and unsystematic risk, size of
the fund and age of the fund as independent variables.
The economic model that was used in the study is given as:
Y=a + b1X1 + b2X2 + b3X3+e
Where
Y is Portfolio Return-Measured by Jensen ratio.
a is the Constant or intercept
b1 is the Slope (Beta coefficient) for X1
X1 is the Unsystematic Risk-Measured by Fama Net Selectivity Measure

33
b2 is the Slope (Beta coefficient) for X2
X2 is the size of the Mutual Fund (control variable) measured by LOG (Fund Assets)
b3 is the Slope (Beta coefficient) for X3
X3 is the Age of the Mutual Fund-Measured by number of years of the Fund
e is the Error term
34
CHAPTER FOUR
DATA ANALYSIS AND RESULTS DISCUSSION
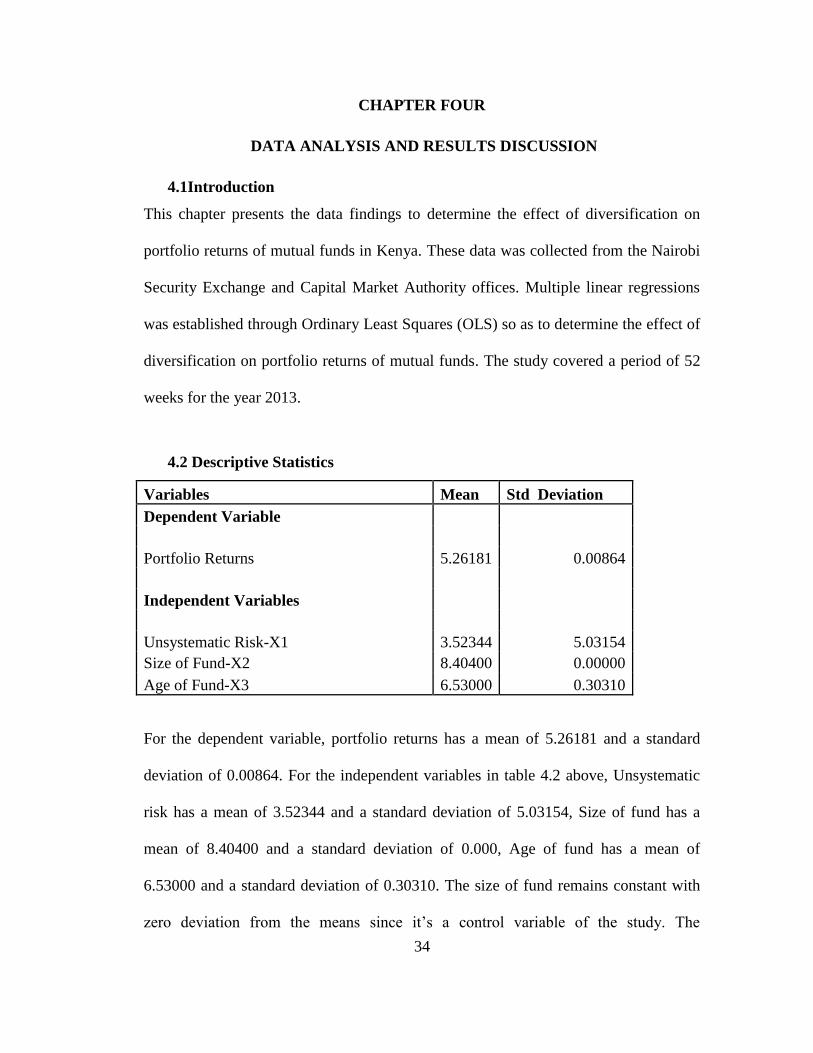
4.1Introduction
This chapter presents the data findings to determine the effect of diversification on
portfolio returns of mutual funds in Kenya. These data was collected from the Nairobi
Security Exchange and Capital Market Authority offices. Multiple linear regressions
was established through Ordinary Least Squares (OLS) so as to determine the effect of
diversification on portfolio returns of mutual funds. The study covered a period of 52
weeks for the year 2013.
4.2 Descriptive Statistics
Variables Mean Std Deviation
Dependent Variable
Portfolio Returns 5.26181 0.00864
Independent Variables
Unsystematic Risk-X1 3.52344 5.03154
Size of Fund-X2 8.40400 0.00000
Age of Fund-X3 6.53000 0.30310
For the dependent variable, portfolio returns has a mean of 5.26181 and a standard
deviation of 0.00864. For the independent variables in table 4.2 above, Unsystematic
risk has a mean of 3.52344 and a standard deviation of 5.03154, Size of fund has a
mean of 8.40400 and a standard deviation of 0.000, Age of fund has a mean of
6.53000 and a standard deviation of 0.30310. The size of fund remains constant with
zero deviation from the means since it’s a control variable of the study. The
35
unsystematic risk and age of fund shows some deviation from the mean with
unsystematic risk showing the greatest deviation since it has the highest effect on the
portfolio return.
4.3 Regression Analysis
In addition to descriptive analysis, the study conducted a cross-sectional OLS multiple
regression on several Mutual Funds’ characteristics for the year 2013. The analysis
was done on weekly basis.
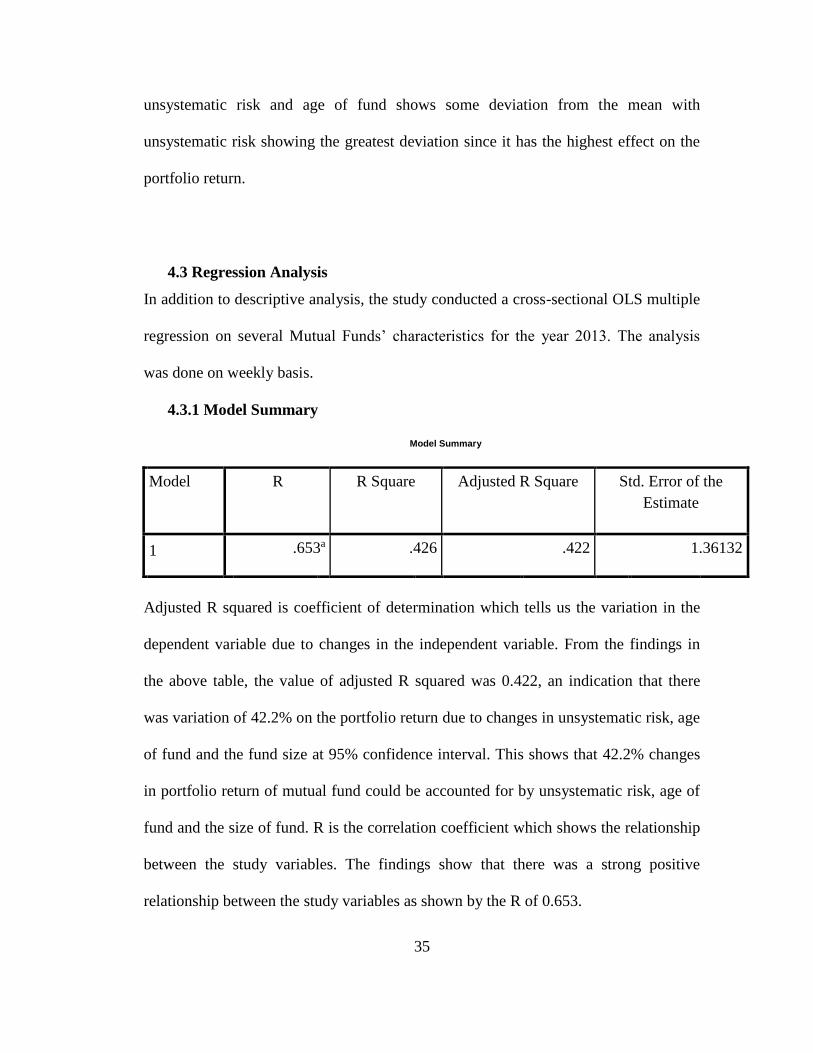
4.3.1 Model Summary
Model Summary
Model R R Square Adjusted R Square Std. Error of the
Estimate
1 .653a .426 .422 1.36132
Adjusted R squared is coefficient of determination which tells us the variation in the
dependent variable due to changes in the independent variable. From the findings in
the above table, the value of adjusted R squared was 0.422, an indication that there
was variation of 42.2% on the portfolio return due to changes in unsystematic risk, age
of fund and the fund size at 95% confidence interval. This shows that 42.2% changes
in portfolio return of mutual fund could be accounted for by unsystematic risk, age of
fund and the size of fund. R is the correlation coefficient which shows the relationship
between the study variables. The findings show that there was a strong positive
relationship between the study variables as shown by the R of 0.653.
36
4.3.2 Analysis of Variance
ANOVAa
Model Sum of Squares df Mean Square F Sig.
1
Regression 495.993 3 165.331 89.214 .000b
Residual 667.150 360 1.853
Total 1163.144 363
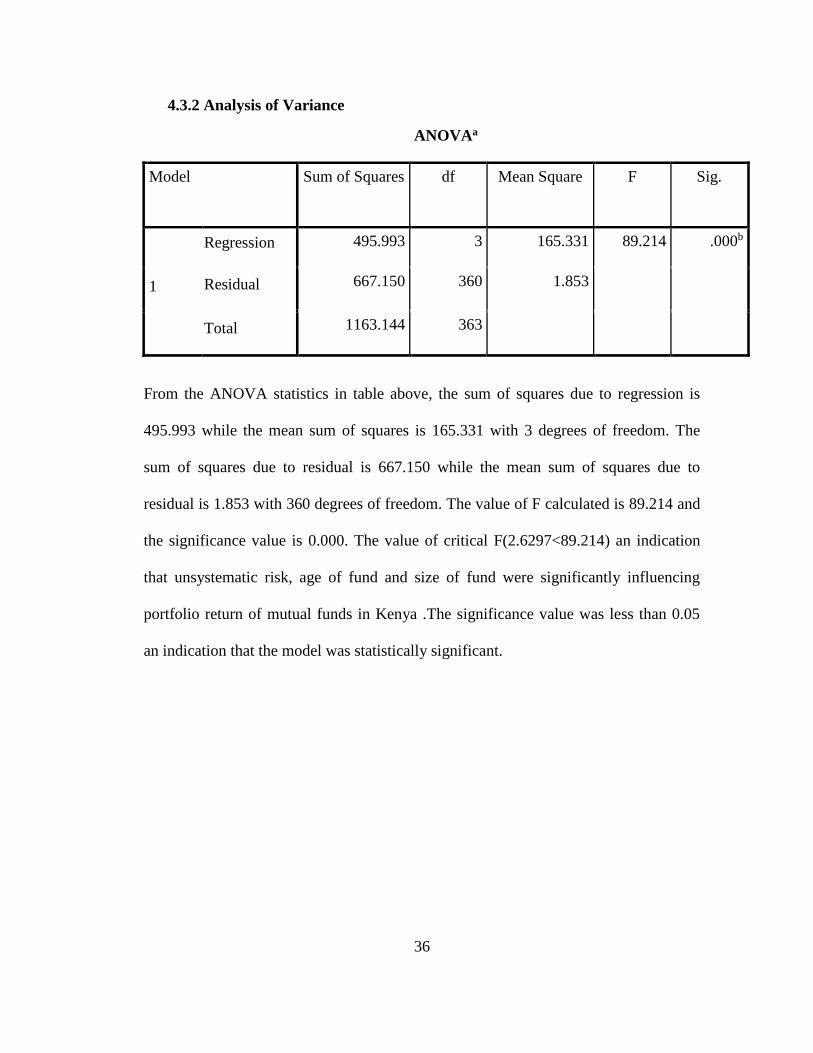
From the ANOVA statistics in table above, the sum of squares due to regression is
495.993 while the mean sum of squares is 165.331 with 3 degrees of freedom. The
sum of squares due to residual is 667.150 while the mean sum of squares due to
residual is 1.853 with 360 degrees of freedom. The value of F calculated is 89.214 and
the significance value is 0.000. The value of critical F(2.6297<89.214) an indication
that unsystematic risk, age of fund and size of fund were significantly influencing
portfolio return of mutual funds in Kenya .The significance value was less than 0.05
an indication that the model was statistically significant.
37
4.3.3 Model Coefficients
Coefficientsa
Model Unstandardized
Coefficients
Standardized
Coefficients
t Sig.
B Std. Error Beta
1
(Constant) -1.150 .825 -1.395 .164
Unsystematic
Risk
.069 .014 .204 4.971 .000
Size of Fund .899 .103 .358 8.738 .000
Age of Fund -.413 .033 -.526 -12.644 .000
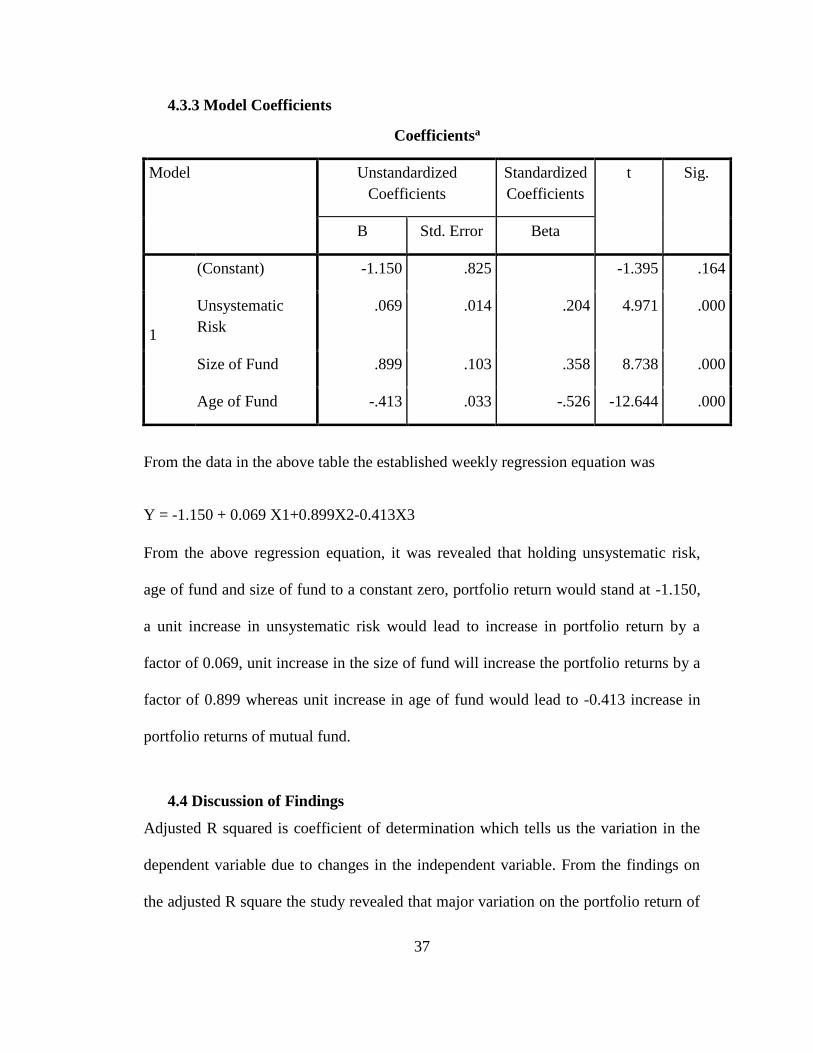
From the data in the above table the established weekly regression equation was
Y = -1.150 + 0.069 X1+0.899X2-0.413X3
From the above regression equation, it was revealed that holding unsystematic risk,
age of fund and size of fund to a constant zero, portfolio return would stand at -1.150,
a unit increase in unsystematic risk would lead to increase in portfolio return by a
factor of 0.069, unit increase in the size of fund will increase the portfolio returns by a
factor of 0.899 whereas unit increase in age of fund would lead to -0.413 increase in
portfolio returns of mutual fund.
4.4 Discussion of Findings
Adjusted R squared is coefficient of determination which tells us the variation in the
dependent variable due to changes in the independent variable. From the findings on
the adjusted R square the study revealed that major variation on the portfolio return of
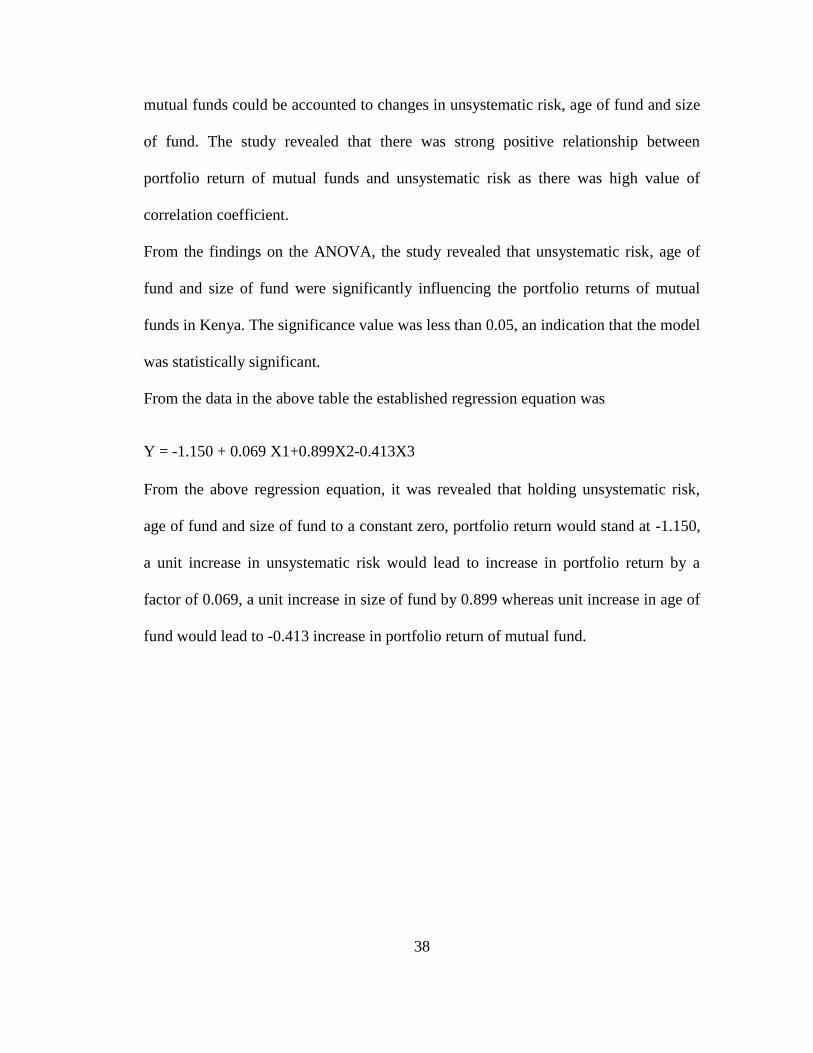
38
mutual funds could be accounted to changes in unsystematic risk, age of fund and size
of fund. The study revealed that there was strong positive relationship between
portfolio return of mutual funds and unsystematic risk as there was high value of
correlation coefficient.
From the findings on the ANOVA, the study revealed that unsystematic risk, age of
fund and size of fund were significantly influencing the portfolio returns of mutual
funds in Kenya. The significance value was less than 0.05, an indication that the model
was statistically significant.
From the data in the above table the established regression equation was
Y = -1.150 + 0.069 X1+0.899X2-0.413X3
From the above regression equation, it was revealed that holding unsystematic risk,
age of fund and size of fund to a constant zero, portfolio return would stand at -1.150,
a unit increase in unsystematic risk would lead to increase in portfolio return by a
factor of 0.069, a unit increase in size of fund by 0.899 whereas unit increase in age of
fund would lead to -0.413 increase in portfolio return of mutual fund.
39
CHAPTER FIVE
SUMMARY, CONCLUSION AND RECOMMENDATIONS
5.1 Introduction
From the analysis and data collected, the following discussions, conclusion and
recommendations were made. The responses were based on the objectives of the
study. The researcher had intended to determine the effect of diversification on
portfolio returns of mutual funds in Kenya.
5.2 Summary of findings
The objective of the study was to determine the effect of diversification on portfolio
returns of mutual funds in Kenya.
The study took a descriptive research design approach. The study entailed a sample of
7 mutual funds that had balanced funds with complete records for the year 2013 for a
period of 52 weeks. The study used secondary data sources available at the NSE and
Capital Market Authority offices. The study used the multiple linear regression
equation and the method of estimation was Ordinary Least Squares (OLS) so as to
establish the effect of diversification on portfolio returns of mutual funds in Kenya.
The study found out that there was a strong relationship between portfolio returns and
diversification. Portfolio returns had a mean of 5.26181 and a standard deviation of
0.00864. For the independent variables, Unsystematic risk had a mean of 3.52344 and
a standard deviation of 5.03154, Size of fund had a mean of 8.40400 and a standard
deviation of 0.000, Age of fund had a mean of 6.53000 and a standard deviation of
40
0.30310. The size of fund remained constant with zero deviation from the means since
it’s a control variable of the study. The unsystematic risk and age of fund showed
deviation from the mean with unsystematic risk showing the greatest deviation since it
has the highest effect on the portfolio return.
From the findings on the adjusted R square the study revealed that major variation on
the portfolio returns could be accounted to changes in unsystematic risk, age of fund
and size of fund. The study revealed that there was strong positive relationship
between portfolio returns of mutual funds and unsystematic risk, as there was high
value of correlation coefficient.
From findings of the regression equation, it was revealed that holding unsystematic
risk, age of fund and size of fund to a constant zero, portfolio return would stand at -
1.150, a unit increase in unsystematic risk would lead to increase in portfolio return by
a factor of 0.069, a unit increase in size of fund by 0.899 whereas unit increase in age
of fund would lead to -0.413 increase in portfolio return of mutual fund.
From the findings on the ANOVA, the study revealed that unsystematic risk, age of
fund and size of fund were significantly influencing the portfolio returns of mutual
funds in Kenya. The significance value was less than 0.05, an indication that the model
was statistically significant.
41
5.3 Conclusion
From the findings the study revealed that diversification affect the portfolio returns of
mutual funds.
The study revealed that diversification represented by the level of unsystematic risk
positively influences the portfolio returns of mutual funds.
5.4 Policy Recommendations
There is need for the fund managers to diversify their investment portfolio so that they
can be able to manage risk especially industry specific risks inherent in the avenues
they invest the fund holders money. This will in the long run create good fortunes to
the overall portfolio returns hence increasing the investor’s wealth.
5.5 Suggestions for Further Research
The current research focused on the mutual funds in Kenya. This excludes other
industries hence future studies should consider diversification and returns in other
industries such as media, insurance and even personal investment clubs (Chamas).
The research also investigated the effect of diversification on portfolio returns of
balanced mutual funds, excluding other mutual funds such as money, equity markets
among others. A research should be done on these other funds.
42
One may also be interested to know the kind of strategies used by fund managers to
select the efficient portfolio that will make them experience superior portfolio returns
compared to the market.
5.6 Limitations of the Study
In attaining its objective the study was limited to 7 mutual funds that managed
balanced funds and that had their financials filed at the Capital Market Authority
during the period of study.
Secondary data was collected from the firm financial reports. The study was also
limited to the degree of precision of the data obtained from the secondary source.
While the data was verifiable since it came from the Capital Market Authority and
Nairobi Securities Exchange publications, it nonetheless could still be prone to
accuracy shortcomings.
The study was based on a 52 week study period for the year 2013. A longer duration
of the study will have captured periods of various economic significances such as
booms and recessions. This may have probably given a longer time focus hence given
a broader dimension to the problem.
The research was rather broad and tedious given the time constraint of collecting the
data and developing the final report. The Fund management sector is also a relatively
new industry in Kenya, hence the availability of information was limited in scope.
43
REFERENCES
Bettis, R.A. & Hall, W.K. (1982).Diversification Strategy, Accounting Determined Risk,
and Accounting Determined Return. Academy of Management Journal, 25, 251-264.
Bowman, E.H. (1980). A Risk Return Paradox for Strategic Management. Sloan
Management Review 21, 17-31
Brinson, L. R. & Beebower, G. L. (1986). Determinants of Portfolio Performance.
Financial Analysts Journal, July/August, 42(3), 39-44
Buster, B.D. (2012). Relationship between asset allocation and financial performance of
Mutual funds in Kenya, Unpublished MBA Thesis, University of Nairobi.
Christensen, H.K. & Montgomery, C.A. (1981).Corporate Economic Performance:
Diversification Strategy versus Market Structure. Journal of Strategic Management, 2,
327-347.
Fiegbaum, A., & Thomas H. (1988). Altitudes towards Risk and Risk Return Paradox:
Prospect theory Explanation. Academy of Management Journal ,March.
Ghysels, E.; P. Santa-Clara; and R. Valkanov. 2005. There Is a Risk-Return Tradeoff After
All. Journal of Financial Economics, 76(3), 509–548.
Jacobson, R., (1987). The validity of ROI as a measure of business performance,
American
Economic Review, 77, 3, June, 470–478.
44
Fama E., (1972). Components of Investment Performance. Journal of Finance, 27 (3),
551-567.
Jensen, M.C. (1968).The Performance of Mutual Funds in the Period 1945-1964. Journal
of Finance, 23(2), 389-416.
Kagunga, P.K. (2010). Comparison of Performance between Unit Trusts and a Market
Portfolio of Shares at Nairobi Stock Exchange, Unpublished MBA Thesis, University
of Nairobi.
Kamwaro, E.K. (2013).The Impact of Investment Portfolio Choice on Financial
Performance of Investment Companies in Kenya, Unpublished MBA Thesis,
University of Nairobi.
Lintner, J. (1965). The Valuation of Risk Assets and the Selection of Risky Investments in
Stock Portfolios and Capital Budgets.” Review of Economics and Statistics. 47:1, 13-
37.
Loeb, G.M., 1950, The battle for investment survival, John Wiley & Sons.
Maina, P.K. (2003). Risk and Return of Investment held by Insurance Companies in
Kenya, Unpublished MBA Thesis, University of Nairobi.
Maina, R.W. (2011). Relationship between Unit Trusts Performance and the Asset
Allocation in Kenya, Unpublished MBA Thesis, University of Nairobi.
Markowitz, H. (1952). Portfolio Selection. Journal of Finance, 7, 77-91.
Modigliani, F.,& Pogue ,G. (1974). An introduction to risk and return concepts and
evidence’’ Part2, Financial Analysts Journal , May/June.
45
Monteil, P. and Reinhart, C. (1999). “Do capital controls and macroeconomic policies
influence the volume and composition of capital flows? Evidence from the 1990s.”
NBER Working Paper Series, March 1997.
Muriithi, D.K. (2005). An Evaluation of the Risk and Returns of Equity Mutual Funds in
Kenya, Unpublished MBA Thesis, University of Nairobi.
Mutuku, F.M. (2011). Relationship between Portfolio Composition and Risk and Return
among Fund Management Firms in Kenya, Unpublished MBA Thesis, University of
Nairobi.
Ngau and Kumssa (2004). Research design, data collection, and analysis: a training
manual
Ngene, G.M. (2002). Empirical Investigation into Portfolio Performance Measures by
Pension Fund Managers and The Challenges They Face In Portfolio Management In
Kenya, Unpublished MBA Thesis, University of Nairobi.
Nuttall et al., (2000).Does Asset Allocation Policy Explain?
Palepu, K., (1985). Diversification strategy, profit performance, and the entropy measure.
Strategic Management Journal, 6, (2), 239–255.
Robson, C. (2002). Real World Research, (2nd edition), Oxford, Blackwell .
Ross, Stephen (1976). The arbitrage theory of capital asset pricing. Journal of Economic
Theory, 13 (3), 341–360.
Rumelt, R.P., (1974). Strategy, Structure, and Economic Performance (Cambridge, Mass.,
Harvard University Press).
46
Sharpe, W. F. (1964). Capital Asset Prices: A Theory of Market Equilibrium under
Conditions of Risk. Journal of Finance. 19(3), 425-442
Thuo, K.T. (2011). Testing the Risk Return Relationship of Mutual Funds Market in
Kenya, Unpublished MBA Thesis, University of Nairobi.

47
APPENDICES
APPENDIX 1: List of licensed unit trust companies in Kenya
1. African Alliance Kenya Unit Trust Scheme, comprising:
African Alliance Kenya Shilling Fund.
African Alliance Kenya Fixed Income Fund.
African Alliance Kenya Managed Fund.
African Alliance Kenya Equity Fund.
2. British-American Unit Trust Scheme, comprising:
British-American Money Market Fund.
British-American Income Fund.
British-American Balanced Fund.
British-American Managed Retirement Fund.
British-American Equity Fund.
3. Stanbic Unit Trust Scheme, comprising:
Stanbic Money Market Fund.
Stanbic Fixed Income Fund.
Stanbic Managed Prudential Fund.
Stanbic Equity Fund
Stanbic Balanced Fund
4. Commercial Bank of Africa Unit Trust Scheme, comprising:
Commercial Bank of Africa Money Market Fund.
ii. Commercial Bank of Africa Equity Fund.
5. Zimele Unit Trust Scheme, comprising:
Zimele Balanced Fund
Zimele Money Market Fund
6. Suntra Unit Trust Scheme, comprising:
Suntra Money Market Fund
Suntra Equity Fund
Suntra Balanced Fund
7. ICEA Unit Trust Scheme, comprising:
ICEA Money Market Fund
ICEA Equity Fund
ICEA Growth Fund
ICEA Bond Fund
8. Standard Investment Trust Funds, comprising:
Standard Investment Equity Growth Fund
Standard Investment Fixed Income Fund
Standard Investment Balanced Fund
9. CIC Unit Trust Scheme, comprising:
CIC Money Market Fund
CIC Balanced Fund
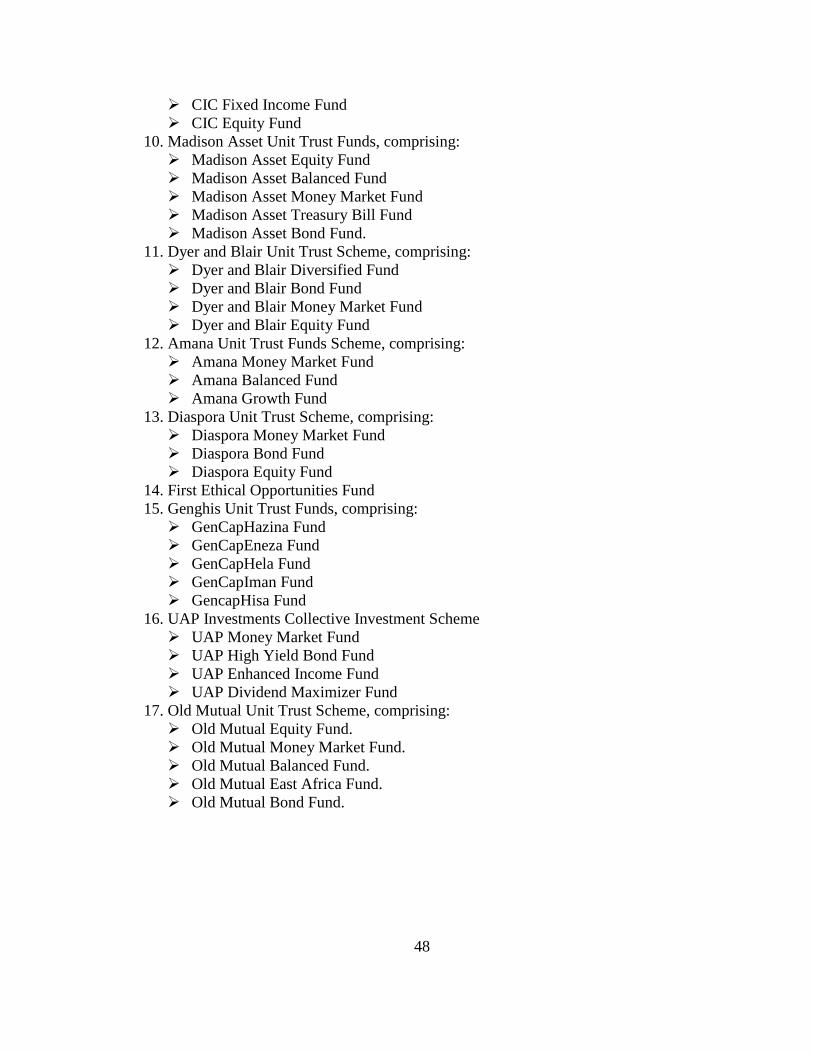
48
CIC Fixed Income Fund
CIC Equity Fund
10. Madison Asset Unit Trust Funds, comprising:
Madison Asset Equity Fund
Madison Asset Balanced Fund
Madison Asset Money Market Fund
Madison Asset Treasury Bill Fund
Madison Asset Bond Fund.
11. Dyer and Blair Unit Trust Scheme, comprising:
Dyer and Blair Diversified Fund
Dyer and Blair Bond Fund
Dyer and Blair Money Market Fund
Dyer and Blair Equity Fund
12. Amana Unit Trust Funds Scheme, comprising:
Amana Money Market Fund
Amana Balanced Fund
Amana Growth Fund
13. Diaspora Unit Trust Scheme, comprising:
Diaspora Money Market Fund
Diaspora Bond Fund
Diaspora Equity Fund
14. First Ethical Opportunities Fund
15. Genghis Unit Trust Funds, comprising:
GenCapHazina Fund
GenCapEneza Fund
GenCapHela Fund
GenCapIman Fund
GencapHisa Fund
16. UAP Investments Collective Investment Scheme
UAP Money Market Fund
UAP High Yield Bond Fund
UAP Enhanced Income Fund
UAP Dividend Maximizer Fund
17. Old Mutual Unit Trust Scheme, comprising:
Old Mutual Equity Fund.
Old Mutual Money Market Fund.
Old Mutual Balanced Fund.
Old Mutual East Africa Fund.
Old Mutual Bond Fund.
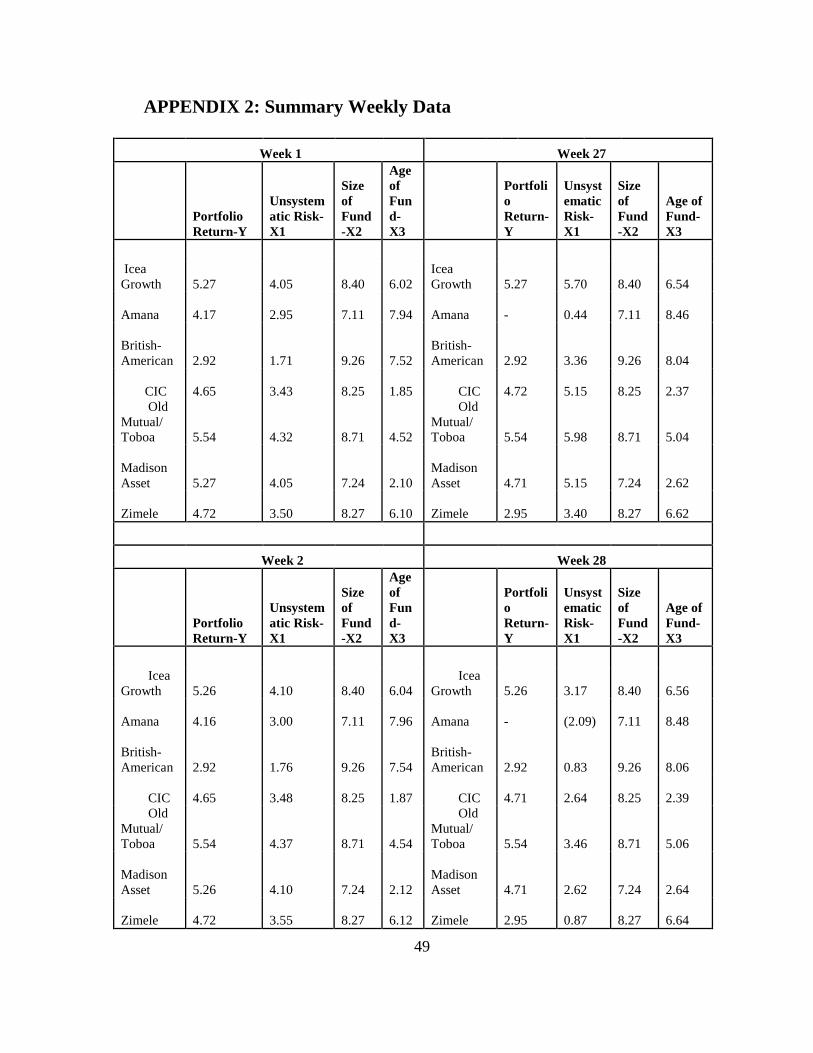
49
APPENDIX 2: Summary Weekly Data
Week 1 Week 27
Portfolio
Return-Y
Unsystem
atic Risk-
X1
Size
of
Fund
-X2
Age
of
Fun
d-
X3
Portfoli
o
Return-
Y
Unsyst
ematic
Risk-
X1
Size
of
Fund
-X2
Age of
Fund-
X3
Icea
Growth
5.27
4.05
8.40
6.02
Icea
Growth
5.27
5.70
8.40
6.54
Amana
4.17
2.95
7.11
7.94
Amana
-
0.44
7.11
8.46
British-
American
2.92
1.71
9.26
7.52
British-
American
2.92
3.36
9.26
8.04
CIC
4.65
3.43
8.25
1.85 CIC
4.72
5.15
8.25
2.37
Old
Mutual/
Toboa
5.54
4.32
8.71
4.52
Old
Mutual/
Toboa
5.54
5.98
8.71
5.04
Madison
Asset
5.27
4.05
7.24
2.10
Madison
Asset
4.71
5.15
7.24
2.62
Zimele
4.72
3.50
8.27
6.10
Zimele
2.95
3.40
8.27
6.62
Week 2 Week 28
Portfolio
Return-Y
Unsystem
atic Risk-
X1
Size
of
Fund
-X2
Age
of
Fun
d-
X3
Portfoli
o
Return-
Y
Unsyst
ematic
Risk-
X1
Size
of
Fund
-X2
Age of
Fund-
X3
Icea
Growth
5.26
4.10
8.40
6.04
Icea
Growth
5.26
3.17
8.40
6.56
Amana
4.16
3.00
7.11
7.96
Amana
-
(2.09)
7.11
8.48
British-
American
2.92
1.76
9.26
7.54
British-
American
2.92
0.83
9.26
8.06
CIC
4.65
3.48
8.25
1.87 CIC
4.71
2.64
8.25
2.39
Old
Mutual/
Toboa
5.54
4.37
8.71
4.54
Old
Mutual/
Toboa
5.54
3.46
8.71
5.06
Madison
Asset
5.26
4.10
7.24
2.12
Madison
Asset
4.71
2.62
7.24
2.64
Zimele
4.72
3.55
8.27
6.12
Zimele
2.95
0.87
8.27
6.64
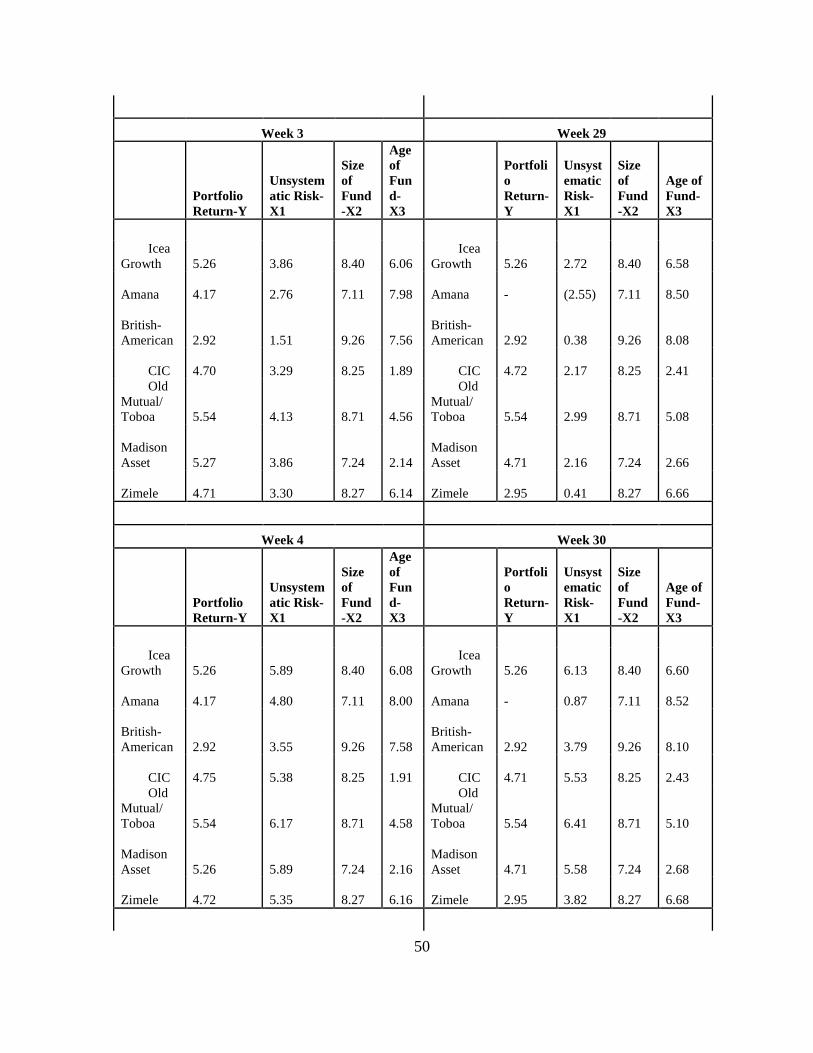
50
Week 3 Week 29
Portfolio
Return-Y
Unsystem
atic Risk-
X1
Size
of
Fund
-X2
Age
of
Fun
d-
X3
Portfoli
o
Return-
Y
Unsyst
ematic
Risk-
X1
Size
of
Fund
-X2
Age of
Fund-
X3
Icea
Growth
5.26
3.86
8.40
6.06
Icea
Growth
5.26
2.72
8.40
6.58
Amana
4.17
2.76
7.11
7.98
Amana
-
(2.55)
7.11
8.50
British-
American
2.92
1.51
9.26
7.56
British-
American
2.92
0.38
9.26
8.08
CIC
4.70
3.29
8.25
1.89 CIC
4.72
2.17
8.25
2.41
Old
Mutual/
Toboa
5.54
4.13
8.71
4.56
Old
Mutual/
Toboa
5.54
2.99
8.71
5.08
Madison
Asset
5.27
3.86
7.24
2.14
Madison
Asset
4.71
2.16
7.24
2.66
Zimele
4.71
3.30
8.27
6.14
Zimele
2.95
0.41
8.27
6.66
Week 4 Week 30
Portfolio
Return-Y
Unsystem
atic Risk-
X1
Size
of
Fund
-X2
Age
of
Fun
d-
X3
Portfoli
o
Return-
Y
Unsyst
ematic
Risk-
X1
Size
of
Fund
-X2
Age of
Fund-
X3
Icea
Growth
5.26
5.89
8.40
6.08
Icea
Growth
5.26
6.13
8.40
6.60
Amana
4.17
4.80
7.11
8.00
Amana
-
0.87
7.11
8.52
British-
American
2.92
3.55
9.26
7.58
British-
American
2.92
3.79
9.26
8.10
CIC
4.75
5.38
8.25
1.91 CIC
4.71
5.53
8.25
2.43
Old
Mutual/
Toboa
5.54
6.17
8.71
4.58
Old
Mutual/
Toboa
5.54
6.41
8.71
5.10
Madison
Asset
5.26
5.89
7.24
2.16
Madison
Asset
4.71
5.58
7.24
2.68
Zimele
4.72
5.35
8.27
6.16
Zimele
2.95
3.82
8.27
6.68
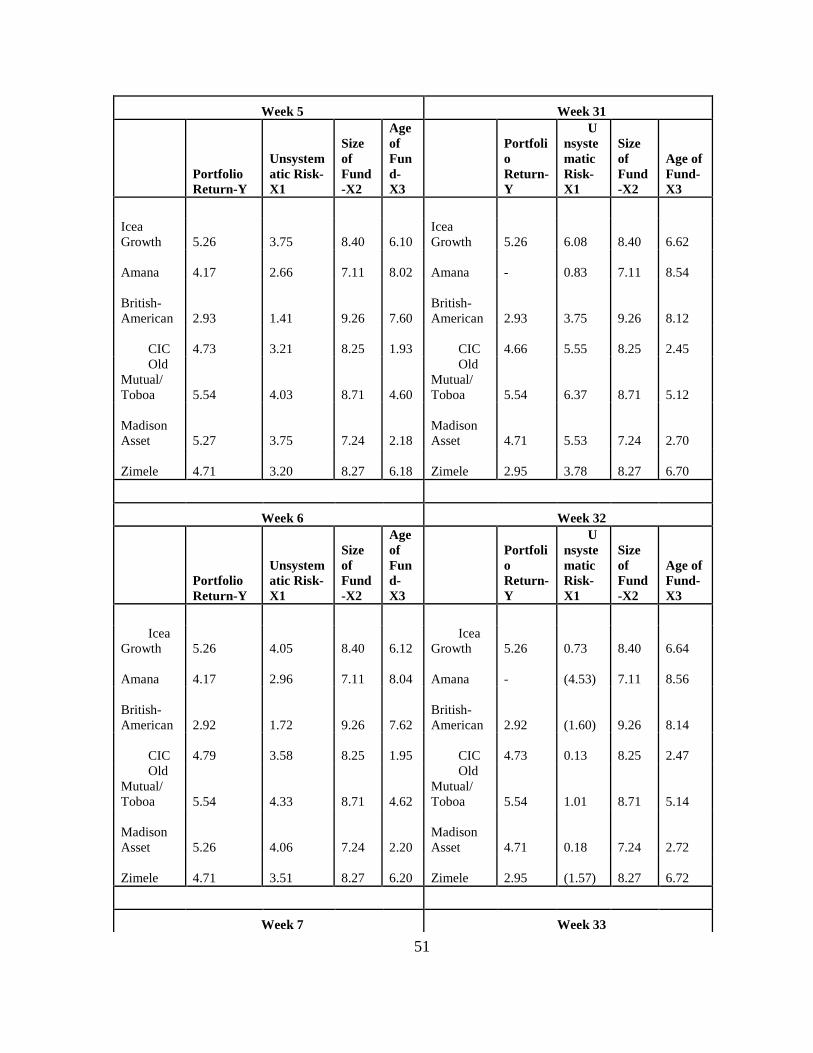
51
Week 5 Week 31
Portfolio
Return-Y
Unsystem
atic Risk-
X1
Size
of
Fund
-X2
Age
of
Fun
d-
X3
Portfoli
o
Return-
Y
U
nsyste
matic
Risk-
X1
Size
of
Fund
-X2
Age of
Fund-
X3
Icea
Growth
5.26
3.75
8.40
6.10
Icea
Growth
5.26
6.08
8.40
6.62
Amana
4.17
2.66
7.11
8.02
Amana
-
0.83
7.11
8.54
British-
American
2.93
1.41
9.26
7.60
British-
American
2.93
3.75
9.26
8.12
CIC
4.73
3.21
8.25
1.93 CIC
4.66
5.55
8.25
2.45
Old
Mutual/
Toboa
5.54
4.03
8.71
4.60
Old
Mutual/
Toboa
5.54
6.37
8.71
5.12
Madison
Asset
5.27
3.75
7.24
2.18
Madison
Asset
4.71
5.53
7.24
2.70
Zimele
4.71
3.20
8.27
6.18
Zimele
2.95
3.78
8.27
6.70
Week 6 Week 32
Portfolio
Return-Y
Unsystem
atic Risk-
X1
Size
of
Fund
-X2
Age
of
Fun
d-
X3
Portfoli
o
Return-
Y
U
nsyste
matic
Risk-
X1
Size
of
Fund
-X2
Age of
Fund-
X3
Icea
Growth
5.26
4.05
8.40
6.12
Icea
Growth
5.26
0.73
8.40
6.64
Amana
4.17
2.96
7.11
8.04
Amana
-
(4.53)
7.11
8.56
British-
American
2.92
1.72
9.26
7.62
British-
American
2.92
(1.60)
9.26
8.14
CIC
4.79
3.58
8.25
1.95 CIC
4.73
0.13
8.25
2.47
Old
Mutual/
Toboa
5.54
4.33
8.71
4.62
Old
Mutual/
Toboa
5.54
1.01
8.71
5.14
Madison
Asset
5.26
4.06
7.24
2.20
Madison
Asset
4.71
0.18
7.24
2.72
Zimele
4.71
3.51
8.27
6.20
Zimele
2.95
(1.57)
8.27
6.72
Week 7 Week 33

52
Portfolio
Return-Y
Unsystem
atic Risk-
X1
Size
of
Fund
-X2
Age
of
Fun
d-
X3
Portfoli
o
Return-
Y
Unsyst
ematic
Risk-
X1
Size
of
Fund
-X2
Age of
Fund-
X3
Icea
Growth
5.26
5.82
8.40
6.14
Icea
Growth
5.26
2.46
8.40
6.66
Amana
4.17
4.72
7.11
8.06
Amana
-
(2.80)
7.11
8.58
British-
American
2.92
3.47
9.26
7.64
British-
American
2.92
0.13
9.26
8.16
CIC
4.66
5.21
8.25
1.97 CIC
4.66
1.88
8.25
2.49
Old
Mutual/
Toboa
5.54
6.09
8.71
4.64
Old
Mutual/
Toboa
5.54
2.74
8.71
5.16
Madison
Asset
5.26
5.81
7.24
2.22
Madison
Asset
4.71
1.91
7.24
2.74
Zimele
4.72
5.27
8.27
6.22
Zimele
2.95
0.15
8.27
6.74
Week 8 Week 34
Portfolio
Return-Y
Unsystem
atic Risk-
X1
Size
of
Fund
-X2
Age
of
Fun
d-
X3
Portfoli
o
Return-
Y
Unsyst
ematic
Risk-
X1
Size
of
Fund
-X2
Age of
Fund-
X3
Icea
Growth
5.27
5.96
8.40
6.16
Icea
Growth
5.26
6.52
8.40
6.68
Amana
4.16
4.86
7.11
8.08
Amana
-
1.26
7.11
8.60
British-
American
2.92
3.62
9.26
7.66
British-
American
2.93
4.19
9.26
8.18
CIC
4.66
5.36
8.25
1.99 CIC
4.68
6.04
8.25
2.51
Old
Mutual/
Toboa
5.54
6.23
8.71
4.66
Old
Mutual/
Toboa
5.55
6.81
8.71
5.18
Madison
Asset
5.26
5.96
7.24
2.24
Madison
Asset
4.71
5.97
7.24
2.76
Zimele
4.73
5.42
8.27
6.24
Zimele
2.95
4.22
8.27
6.76
Week 9 Week 35

53
Portfolio
Return-Y
Unsystem
atic Risk-
X1
Size
of
Fund
-X2
Age
of
Fun
d-
X3
Portfoli
o
Return-
Y
Unsyst
ematic
Risk-
X1
Size
of
Fund
-X2
Age of
Fund-
X3
Icea
Growth
5.26
3.95
8.40
6.18
Icea
Growth
5.26
6.73
8.40
6.70
Amana
4.17
2.87
7.11
8.10
Amana
-
1.46
7.11
8.62
British-
American
2.92
1.62
9.26
7.68
British-
American
2.92
4.38
9.26
8.20
CIC
4.68
3.38
8.25
2.01 CIC
4.77
6.12
8.25
2.53
Old
Mutual/
Toboa
5.54
4.24
8.71
4.68
Old
Mutual/
Toboa
5.54
7.00
8.71
5.20
Madison
Asset
5.26
3.96
7.24
2.26
Madison
Asset
4.71
6.17
7.24
2.78
Zimele
4.72
3.42
8.27
6.26
Zimele
2.95
4.41
8.27
6.78
Week 10 Week 36
Portfolio
Return-Y
Unsystem
atic Risk-
X1
Size
of
Fund
-X2
Age
of
Fun
d-
X3
Portfoli
o
Return-
Y
Unsyst
ematic
Risk-
X1
Size
of
Fund
-X2
Age of
Fund-
X3
Icea
Growth
5.26
4.11
8.40
6.20
Icea
Growth
5.27
2.64
8.40
6.72
Amana
4.17
3.02
7.11
8.12
Amana
-
(2.62)
7.11
8.64
British-
American
2.92
1.78
9.26
7.70
British-
American
2.92
0.30
9.26
8.22
CIC
4.79
3.64
8.25
2.03 CIC
4.66
2.10
8.25
2.55
Old
Mutual/
Toboa
5.54
4.40
8.71
4.70
Old
Mutual/
Toboa
5.54
2.92
8.71
5.22
Madison
Asset
5.26
4.12
7.24
2.28
Madison
Asset
4.71
2.08
7.24
2.80
Zimele
4.73
3.58
8.27
6.28
Zimele
2.95
0.33
8.27
6.80
Week 11 Week 37
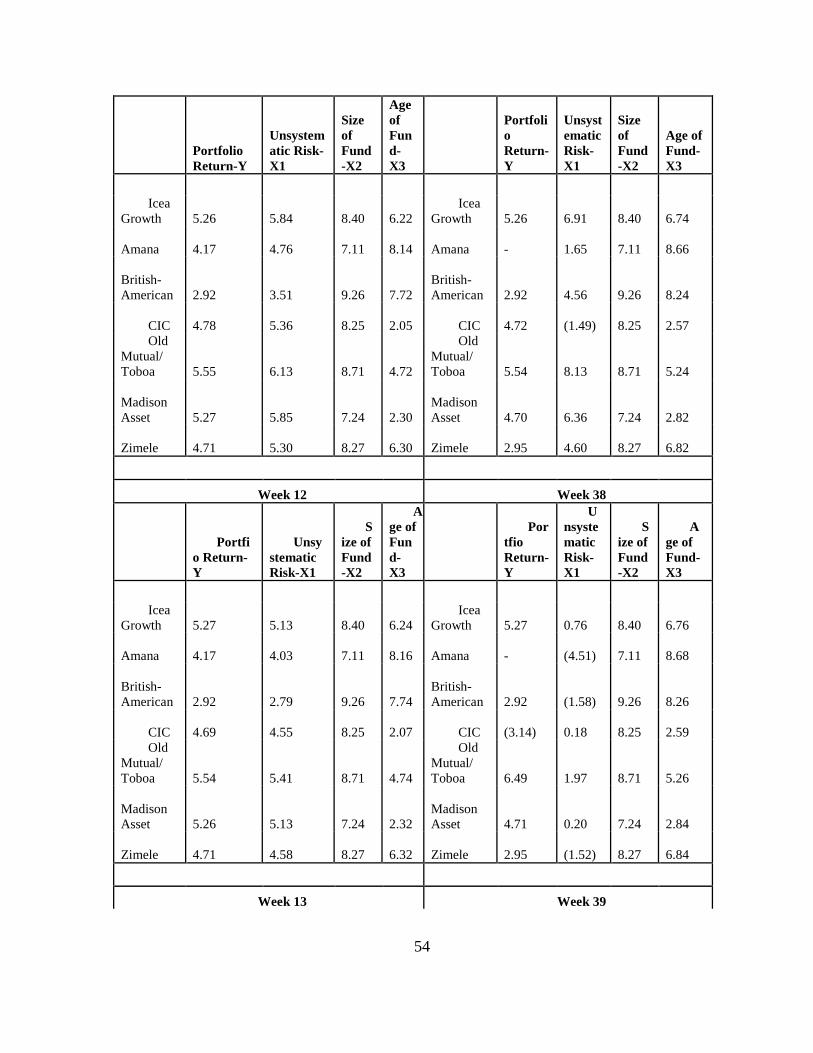
54
Portfolio
Return-Y
Unsystem
atic Risk-
X1
Size
of
Fund
-X2
Age
of
Fun
d-
X3
Portfoli
o
Return-
Y
Unsyst
ematic
Risk-
X1
Size
of
Fund
-X2
Age of
Fund-
X3
Icea
Growth
5.26
5.84
8.40
6.22
Icea
Growth
5.26
6.91
8.40
6.74
Amana
4.17
4.76
7.11
8.14
Amana
-
1.65
7.11
8.66
British-
American
2.92
3.51
9.26
7.72
British-
American
2.92
4.56
9.26
8.24
CIC
4.78
5.36
8.25
2.05 CIC
4.72
(1.49)
8.25
2.57
Old
Mutual/
Toboa
5.55
6.13
8.71
4.72
Old
Mutual/
Toboa
5.54
8.13
8.71
5.24
Madison
Asset
5.27
5.85
7.24
2.30
Madison
Asset
4.70
6.36
7.24
2.82
Zimele
4.71
5.30
8.27
6.30
Zimele
2.95
4.60
8.27
6.82
Week 12 Week 38
Portfi
o Return-
Y
Unsy
stematic
Risk-X1
S
ize of
Fund
-X2
A
ge of
Fun
d-
X3
Por
tfio
Return-
Y
U
nsyste
matic
Risk-
X1
S
ize of
Fund
-X2
A
ge of
Fund-
X3
Icea
Growth
5.27
5.13
8.40
6.24
Icea
Growth
5.27
0.76
8.40
6.76
Amana
4.17
4.03
7.11
8.16
Amana
-
(4.51)
7.11
8.68
British-
American
2.92
2.79
9.26
7.74
British-
American
2.92
(1.58)
9.26
8.26
CIC
4.69
4.55
8.25
2.07 CIC
(3.14)
0.18
8.25
2.59
Old
Mutual/
Toboa
5.54
5.41
8.71
4.74
Old
Mutual/
Toboa
6.49
1.97
8.71
5.26
Madison
Asset
5.26
5.13
7.24
2.32
Madison
Asset
4.71
0.20
7.24
2.84
Zimele
4.71
4.58
8.27
6.32
Zimele
2.95
(1.52)
8.27
6.84
Week 13 Week 39
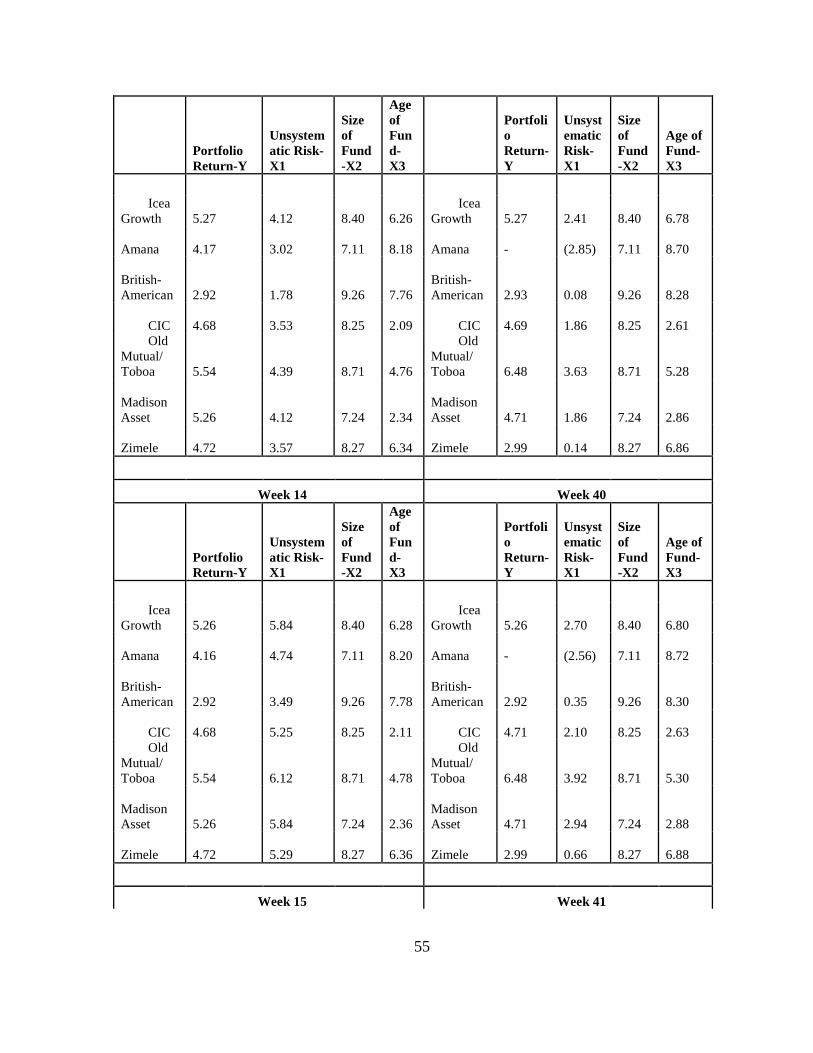
55
Portfolio
Return-Y
Unsystem
atic Risk-
X1
Size
of
Fund
-X2
Age
of
Fun
d-
X3
Portfoli
o
Return-
Y
Unsyst
ematic
Risk-
X1
Size
of
Fund
-X2
Age of
Fund-
X3
Icea
Growth
5.27
4.12
8.40
6.26
Icea
Growth
5.27
2.41
8.40
6.78
Amana
4.17
3.02
7.11
8.18
Amana
-
(2.85)
7.11
8.70
British-
American
2.92
1.78
9.26
7.76
British-
American
2.93
0.08
9.26
8.28
CIC
4.68
3.53
8.25
2.09 CIC
4.69
1.86
8.25
2.61
Old
Mutual/
Toboa
5.54
4.39
8.71
4.76
Old
Mutual/
Toboa
6.48
3.63
8.71
5.28
Madison
Asset
5.26
4.12
7.24
2.34
Madison
Asset
4.71
1.86
7.24
2.86
Zimele
4.72
3.57
8.27
6.34
Zimele
2.99
0.14
8.27
6.86
Week 14 Week 40
Portfolio
Return-Y
Unsystem
atic Risk-
X1
Size
of
Fund
-X2
Age
of
Fun
d-
X3
Portfoli
o
Return-
Y
Unsyst
ematic
Risk-
X1
Size
of
Fund
-X2
Age of
Fund-
X3
Icea
Growth
5.26
5.84
8.40
6.28
Icea
Growth
5.26
2.70
8.40
6.80
Amana
4.16
4.74
7.11
8.20
Amana
-
(2.56)
7.11
8.72
British-
American
2.92
3.49
9.26
7.78
British-
American
2.92
0.35
9.26
8.30
CIC
4.68
5.25
8.25
2.11 CIC
4.71
2.10
8.25
2.63
Old
Mutual/
Toboa
5.54
6.12
8.71
4.78
Old
Mutual/
Toboa
6.48
3.92
8.71
5.30
Madison
Asset
5.26
5.84
7.24
2.36
Madison
Asset
4.71
2.94
7.24
2.88
Zimele
4.72
5.29
8.27
6.36
Zimele
2.99
0.66
8.27
6.88
Week 15 Week 41

56
Portfolio
Return-Y
Unsystem
atic Risk-
X1
Size
of
Fund
-X2
Age
of
Fun
d-
X3
Portfoli
o
Return-
Y
Unsyst
ematic
Risk-
X1
Size
of
Fund
-X2
Age of
Fund-
X3
Icea
Growth
5.27
(0.44)
8.40
6.30
Icea
Growth
5.26
2.05
8.40
6.82
Amana
4.16
(1.54)
7.11
8.22
Amana
-
(3.21)
7.11
8.74
British-
American
2.92
(2.78)
9.26
7.80
British-
American
2.91
(0.29)
9.26
8.32
CIC
4.69
(1.01)
8.25
2.13 CIC
4.66
1.54
8.25
2.65
Old
Mutual/
Toboa
5.54
(0.17)
8.71
4.80
Old
Mutual/
Toboa
6.48
3.27
8.71
5.32
Madison
Asset
5.27
(0.44)
7.24
2.38
Madison
Asset
5.50
2.30
7.24
2.90
Zimele
4.71
(0.99)
8.27
6.38
Zimele
3.22
1.86
8.27
6.90
Week 16 Week 42
Portfolio
Return-Y
Unsystem
atic Risk-
X1
Size
of
Fund
-X2
Age
of
Fun
d-
X3
Portfoli
o
Return-
Y
Unsyst
ematic
Risk-
X1
Size
of
Fund
-X2
Age of
Fund-
X3
Icea
Growth
5.21
5.92
8.40
6.32
Icea
Growth
5.26
(10.31)
8.40
6.84
Amana
4.17
4.88
7.11
8.24
Amana
-
(15.57)
7.11
8.76
British-
American
2.92
3.63
9.26
7.82
British-
American
2.92
(12.65)
9.26
8.34
CIC
4.72
5.43
8.25
2.15 CIC
4.75
(10.83)
8.25
2.67
Old
Mutual/
Toboa
5.53
6.25
8.71
4.82
Old
Mutual/
Toboa
6.48
(9.09)
8.71
5.34
Madison
Asset
5.27
5.98
7.24
2.40
Madison
Asset
5.51
(10.06)
7.24
2.92
Zimele
4.71
5.42
8.27
6.40
Zimele
5.07
(12.68)
8.27
6.92
Week 17 Week 43
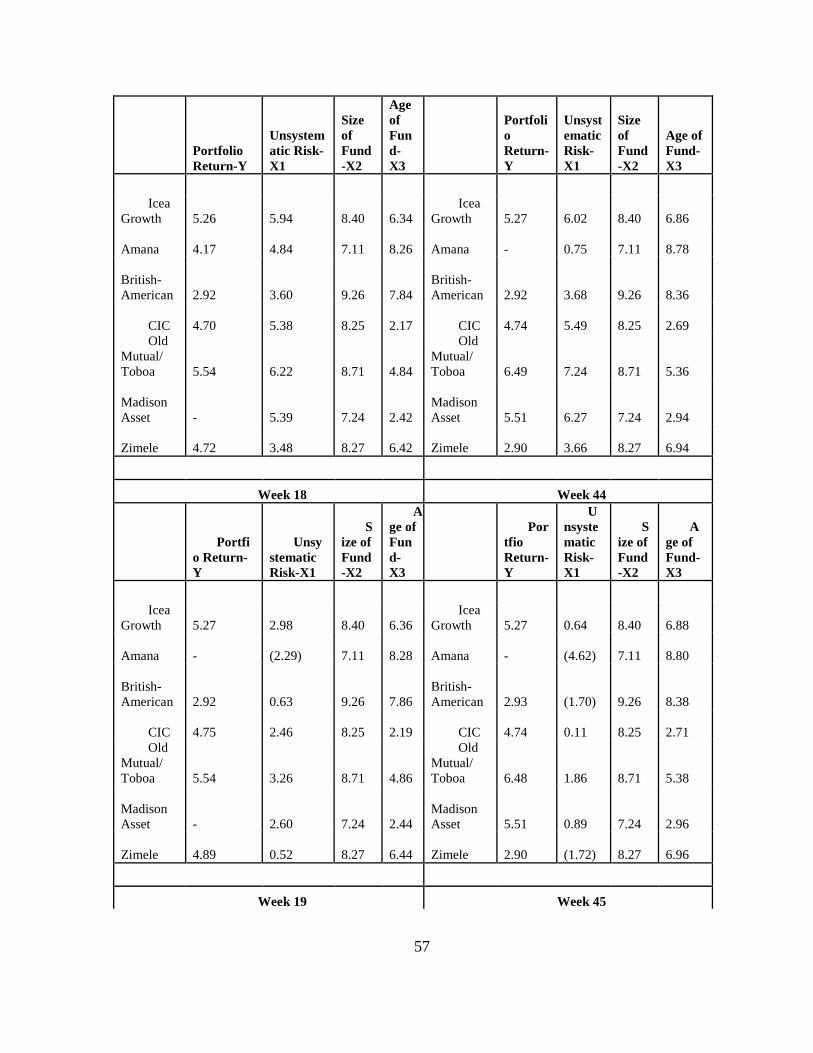
57
Portfolio
Return-Y
Unsystem
atic Risk-
X1
Size
of
Fund
-X2
Age
of
Fun
d-
X3
Portfoli
o
Return-
Y
Unsyst
ematic
Risk-
X1
Size
of
Fund
-X2
Age of
Fund-
X3
Icea
Growth
5.26
5.94
8.40
6.34
Icea
Growth
5.27
6.02
8.40
6.86
Amana
4.17
4.84
7.11
8.26
Amana
-
0.75
7.11
8.78
British-
American
2.92
3.60
9.26
7.84
British-
American
2.92
3.68
9.26
8.36
CIC
4.70
5.38
8.25
2.17 CIC
4.74
5.49
8.25
2.69
Old
Mutual/
Toboa
5.54
6.22
8.71
4.84
Old
Mutual/
Toboa
6.49
7.24
8.71
5.36
Madison
Asset
-
5.39
7.24
2.42
Madison
Asset
5.51
6.27
7.24
2.94
Zimele
4.72
3.48
8.27
6.42
Zimele
2.90
3.66
8.27
6.94
Week 18 Week 44
Portfi
o Return-
Y
Unsy
stematic
Risk-X1
S
ize of
Fund
-X2
A
ge of
Fun
d-
X3
Por
tfio
Return-
Y
U
nsyste
matic
Risk-
X1
S
ize of
Fund
-X2
A
ge of
Fund-
X3
Icea
Growth
5.27
2.98
8.40
6.36
Icea
Growth
5.27
0.64
8.40
6.88
Amana
-
(2.29)
7.11
8.28
Amana
-
(4.62)
7.11
8.80
British-
American
2.92
0.63
9.26
7.86
British-
American
2.93
(1.70)
9.26
8.38
CIC
4.75
2.46
8.25
2.19 CIC
4.74
0.11
8.25
2.71
Old
Mutual/
Toboa
5.54
3.26
8.71
4.86
Old
Mutual/
Toboa
6.48
1.86
8.71
5.38
Madison
Asset
-
2.60
7.24
2.44
Madison
Asset
5.51
0.89
7.24
2.96
Zimele
4.89
0.52
8.27
6.44
Zimele
2.90
(1.72)
8.27
6.96
Week 19 Week 45
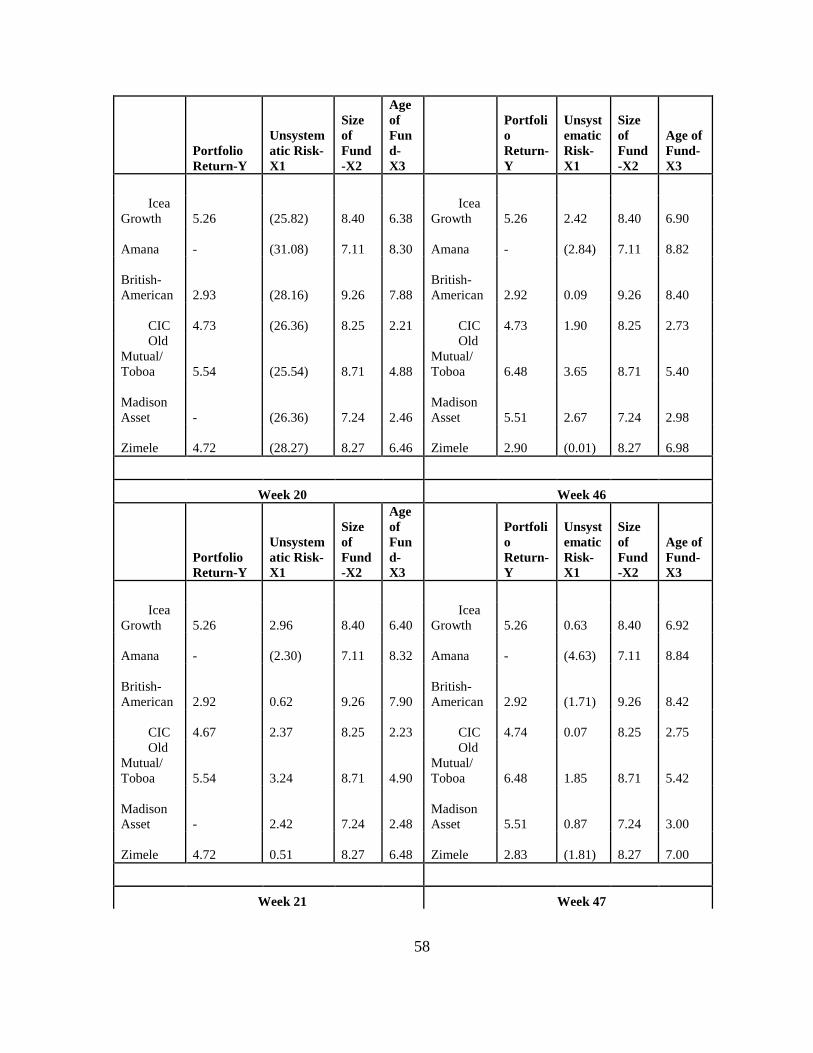
58
Portfolio
Return-Y
Unsystem
atic Risk-
X1
Size
of
Fund
-X2
Age
of
Fun
d-
X3
Portfoli
o
Return-
Y
Unsyst
ematic
Risk-
X1
Size
of
Fund
-X2
Age of
Fund-
X3
Icea
Growth
5.26
(25.82)
8.40
6.38
Icea
Growth
5.26
2.42
8.40
6.90
Amana
-
(31.08)
7.11
8.30
Amana
-
(2.84)
7.11
8.82
British-
American
2.93
(28.16)
9.26
7.88
British-
American
2.92
0.09
9.26
8.40
CIC
4.73
(26.36)
8.25
2.21 CIC
4.73
1.90
8.25
2.73
Old
Mutual/
Toboa
5.54
(25.54)
8.71
4.88
Old
Mutual/
Toboa
6.48
3.65
8.71
5.40
Madison
Asset
-
(26.36)
7.24
2.46
Madison
Asset
5.51
2.67
7.24
2.98
Zimele
4.72
(28.27)
8.27
6.46
Zimele
2.90
(0.01)
8.27
6.98
Week 20 Week 46
Portfolio
Return-Y
Unsystem
atic Risk-
X1
Size
of
Fund
-X2
Age
of
Fun
d-
X3
Portfoli
o
Return-
Y
Unsyst
ematic
Risk-
X1
Size
of
Fund
-X2
Age of
Fund-
X3
Icea
Growth
5.26
2.96
8.40
6.40
Icea
Growth
5.26
0.63
8.40
6.92
Amana
-
(2.30)
7.11
8.32
Amana
-
(4.63)
7.11
8.84
British-
American
2.92
0.62
9.26
7.90
British-
American
2.92
(1.71)
9.26
8.42
CIC
4.67
2.37
8.25
2.23 CIC
4.74
0.07
8.25
2.75
Old
Mutual/
Toboa
5.54
3.24
8.71
4.90
Old
Mutual/
Toboa
6.48
1.85
8.71
5.42
Madison
Asset
-
2.42
7.24
2.48
Madison
Asset
5.51
0.87
7.24
3.00
Zimele
4.72
0.51
8.27
6.48
Zimele
2.83
(1.81)
8.27
7.00
Week 21 Week 47
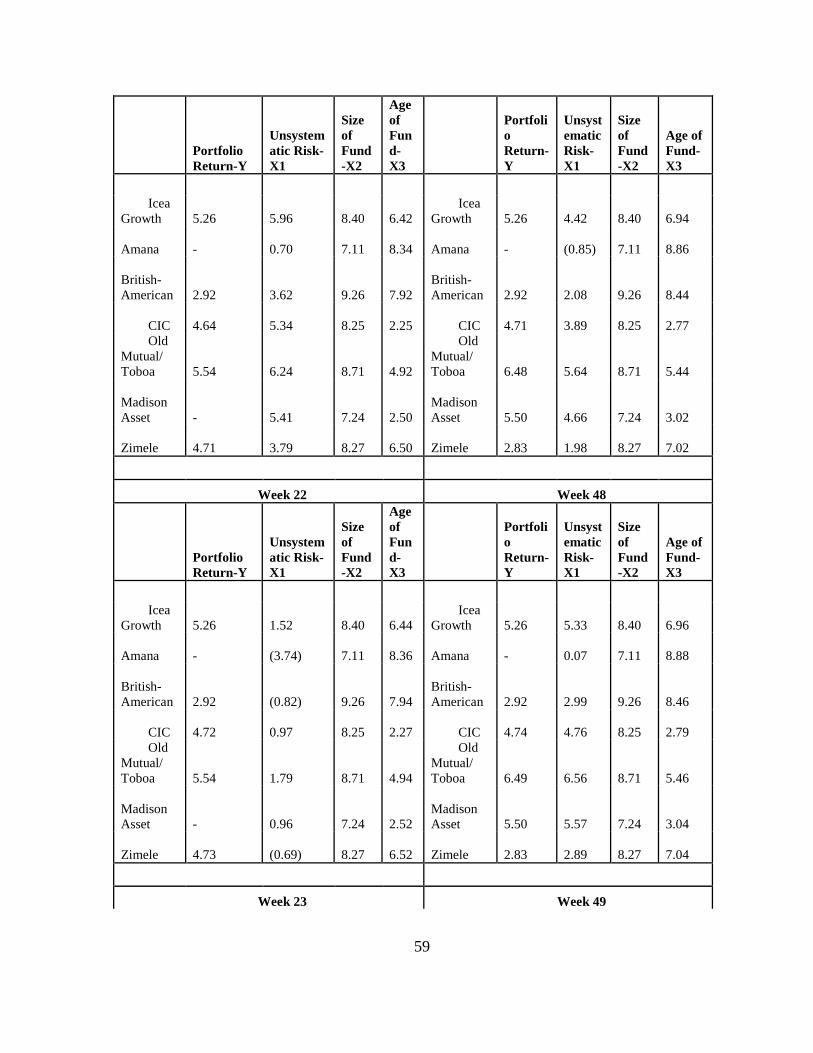
59
Portfolio
Return-Y
Unsystem
atic Risk-
X1
Size
of
Fund
-X2
Age
of
Fun
d-
X3
Portfoli
o
Return-
Y
Unsyst
ematic
Risk-
X1
Size
of
Fund
-X2
Age of
Fund-
X3
Icea
Growth
5.26
5.96
8.40
6.42
Icea
Growth
5.26
4.42
8.40
6.94
Amana
-
0.70
7.11
8.34
Amana
-
(0.85)
7.11
8.86
British-
American
2.92
3.62
9.26
7.92
British-
American
2.92
2.08
9.26
8.44
CIC
4.64
5.34
8.25
2.25 CIC
4.71
3.89
8.25
2.77
Old
Mutual/
Toboa
5.54
6.24
8.71
4.92
Old
Mutual/
Toboa
6.48
5.64
8.71
5.44
Madison
Asset
-
5.41
7.24
2.50
Madison
Asset
5.50
4.66
7.24
3.02
Zimele
4.71
3.79
8.27
6.50
Zimele
2.83
1.98
8.27
7.02
Week 22 Week 48
Portfolio
Return-Y
Unsystem
atic Risk-
X1
Size
of
Fund
-X2
Age
of
Fun
d-
X3
Portfoli
o
Return-
Y
Unsyst
ematic
Risk-
X1
Size
of
Fund
-X2
Age of
Fund-
X3
Icea
Growth
5.26
1.52
8.40
6.44
Icea
Growth
5.26
5.33
8.40
6.96
Amana
-
(3.74)
7.11
8.36
Amana
-
0.07
7.11
8.88
British-
American
2.92
(0.82)
9.26
7.94
British-
American
2.92
2.99
9.26
8.46
CIC
4.72
0.97
8.25
2.27 CIC
4.74
4.76
8.25
2.79
Old
Mutual/
Toboa
5.54
1.79
8.71
4.94
Old
Mutual/
Toboa
6.49
6.56
8.71
5.46
Madison
Asset
-
0.96
7.24
2.52
Madison
Asset
5.50
5.57
7.24
3.04
Zimele
4.73
(0.69)
8.27
6.52
Zimele
2.83
2.89
8.27
7.04
Week 23 Week 49

60
Portfolio
Return-Y
Unsystem
atic Risk-
X1
Size
of
Fund
-X2
Age
of
Fun
d-
X3
Portfoli
o
Return-
Y
Unsyst
ematic
Risk-
X1
Size
of
Fund
-X2
Age of
Fund-
X3
Icea
Growth
5.27
6.36
8.40
6.46
Icea
Growth
5.26
6.89
8.40
6.98
Amana
-
1.09
7.11
8.38
Amana
-
1.63
7.11
8.90
British-
American
2.92
4.02
9.26
7.96
British-
American
2.93
4.56
9.26
8.48
CIC
4.71
5.82
8.25
2.29 CIC
4.69
6.32
8.25
2.81
Old
Mutual/
Toboa
5.54
6.37
8.71
4.96
Old
Mutual/
Toboa
6.49
8.12
8.71
5.48
Madison
Asset
4.71
5.80
7.24
2.54
Madison
Asset
5.50
7.14
7.24
3.06
Zimele
3.06
4.21
8.27
6.54
Zimele
2.83
4.46
8.27
7.06
Week 24 Week 50
Portfolio
Return-Y
Unsystem
atic Risk-
X1
Size
of
Fund
-X2
Age
of
Fun
d-
X3
Portfoli
o
Return-
Y
Unsyst
ematic
Risk-
X1
Size
of
Fund
-X2
Age of
Fund-
X3
Icea
Growth
5.27
6.83
8.40
6.48
Icea
Growth
5.26
6.89
8.40
7.00
Amana
-
1.56
7.11
8.40
Amana
-
1.62
7.11
8.92
British-
American
2.92
4.48
9.26
7.98
British-
American
2.93
4.55
9.26
8.50
CIC
4.73
6.27
8.25
2.31 CIC
4.69
6.34
8.25
2.83
Old
Mutual/
Toboa
5.28
7.10
8.71
4.98
Old
Mutual/
Toboa
6.49
8.11
8.71
5.50
Madison
Asset
4.71
6.27
7.24
2.56
Madison
Asset
5.50
7.13
7.24
3.08
Zimele
3.12
4.68
8.27
6.56
Zimele
2.83
4.45
8.27
7.08
Week 25 Week 51
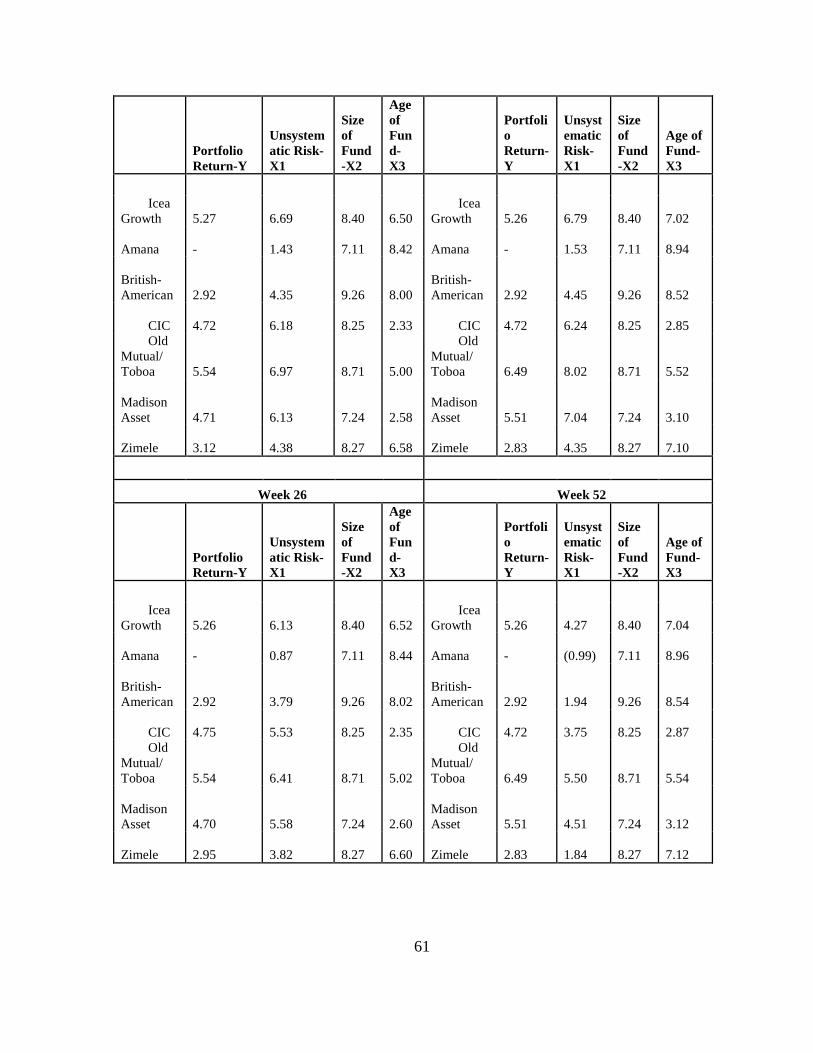
61
Portfolio
Return-Y
Unsystem
atic Risk-
X1
Size
of
Fund
-X2
Age
of
Fun
d-
X3
Portfoli
o
Return-
Y
Unsyst
ematic
Risk-
X1
Size
of
Fund
-X2
Age of
Fund-
X3
Icea
Growth
5.27
6.69
8.40
6.50
Icea
Growth
5.26
6.79
8.40
7.02
Amana
-
1.43
7.11
8.42
Amana
-
1.53
7.11
8.94
British-
American
2.92
4.35
9.26
8.00
British-
American
2.92
4.45
9.26
8.52
CIC
4.72
6.18
8.25
2.33 CIC
4.72
6.24
8.25
2.85
Old
Mutual/
Toboa
5.54
6.97
8.71
5.00
Old
Mutual/
Toboa
6.49
8.02
8.71
5.52
Madison
Asset
4.71
6.13
7.24
2.58
Madison
Asset
5.51
7.04
7.24
3.10
Zimele
3.12
4.38
8.27
6.58
Zimele
2.83
4.35
8.27
7.10
Week 26 Week 52
Portfolio
Return-Y
Unsystem
atic Risk-
X1
Size
of
Fund
-X2
Age
of
Fun
d-
X3
Portfoli
o
Return-
Y
Unsyst
ematic
Risk-
X1
Size
of
Fund
-X2
Age of
Fund-
X3
Icea
Growth
5.26
6.13
8.40
6.52
Icea
Growth
5.26
4.27
8.40
7.04
Amana
-
0.87
7.11
8.44
Amana
-
(0.99)
7.11
8.96
British-
American
2.92
3.79
9.26
8.02
British-
American
2.92
1.94
9.26
8.54
CIC
4.75
5.53
8.25
2.35 CIC
4.72
3.75
8.25
2.87
Old
Mutual/
Toboa
5.54
6.41
8.71
5.02
Old
Mutual/
Toboa
6.49
5.50
8.71
5.54
Madison
Asset
4.70
5.58
7.24
2.60
Madison
Asset
5.51
4.51
7.24
3.12
Zimele
2.95
3.82
8.27
6.60
Zimele
2.83
1.84
8.27
7.12

62


