
1
The Economics of COThe Economics of CO22 Capture Capture for Enhanced Oil Recovery and for Enhanced Oil Recovery and
Climate Change MitigationClimate Change Mitigation
Edward S. RubinDepartment of Engineering and Public Policy
Department of Mechanical EngineeringCarnegie Mellon University
Pittsburgh, Pennsylvania
Presentation to the
Atlantic CouncilWashington, DC
June 20, 2012E.S. Rubin, Carnegie Mellon
Outline of TalkOutline of Talk
• Status of CO2 capture technology• Opportunities for enhanced oil recovery• The costs of CO2 captured and avoided• The outlook for advanced capture systems• Challenges moving forward
Status of COStatus of CO22 capture technology capture technology
E.S. Rubin, Carnegie Mellon E.S. Rubin, Carnegie Mellon
Many Ways to Capture COMany Ways to Capture CO22
MEACausticOther
Chemical
SelexolRectisolOther
Physical
Absorption
AluminaZeoliteActivated C
Adsorber Beds
Pressure SwingTemperature SwingWashing
Regeneration Method
Adsorption Cryogenics
PolyphenyleneoxidePolydimethylsiloxane
Gas Separation
Polypropelene
Gas Absorption
Ceramic BasedSystems
Membranes Microbial/AlgalSystems
CO2 Separation and Capture
Choice of technology depends strongly on application

2
E.S. Rubin, Carnegie Mellon
Leading Candidates for CCUSLeading Candidates for CCUS
• Large industrial sources of CO2 such as: Gas processing, refineries, petrochemical plants Hydrogen and ammonia production plants Pulp and paper plants Cement plants
• Fossil fuel power plants Pulverized coal combustion (PC) Natural gas combined cycle (NGCC) Integrated coal gasification combined cycle (IGCC)
E.S. Rubin, Carnegie Mellon
For these applications, various For these applications, various stages of technology developmentstages of technology development
• Commercial use
• Full-scale demonstration plant
• Pilot plant scale
• Laboratory or bench scale
• Conceptual design
E.S. Rubin, Carnegie Mellon
Commercial Post-Combustion Systems for Industrial CO2 Capture
BP Natural Gas Processing Plant(In Salah, Algeria)
Source: IEA GHG, 2008
Post-Combustion CO2 Capture at Coal-Fired Power Plants
Warrior Run Power Plant(Cumberland, Maryland, USA)
(Sou
rce:
(IEA
GH
G)
Shady Point Power Plant(Panama, Oklahoma, USA)
(Sou
rce:
ABB
Lum
mus
)
E.S. Rubin, Carnegie Mellon
3
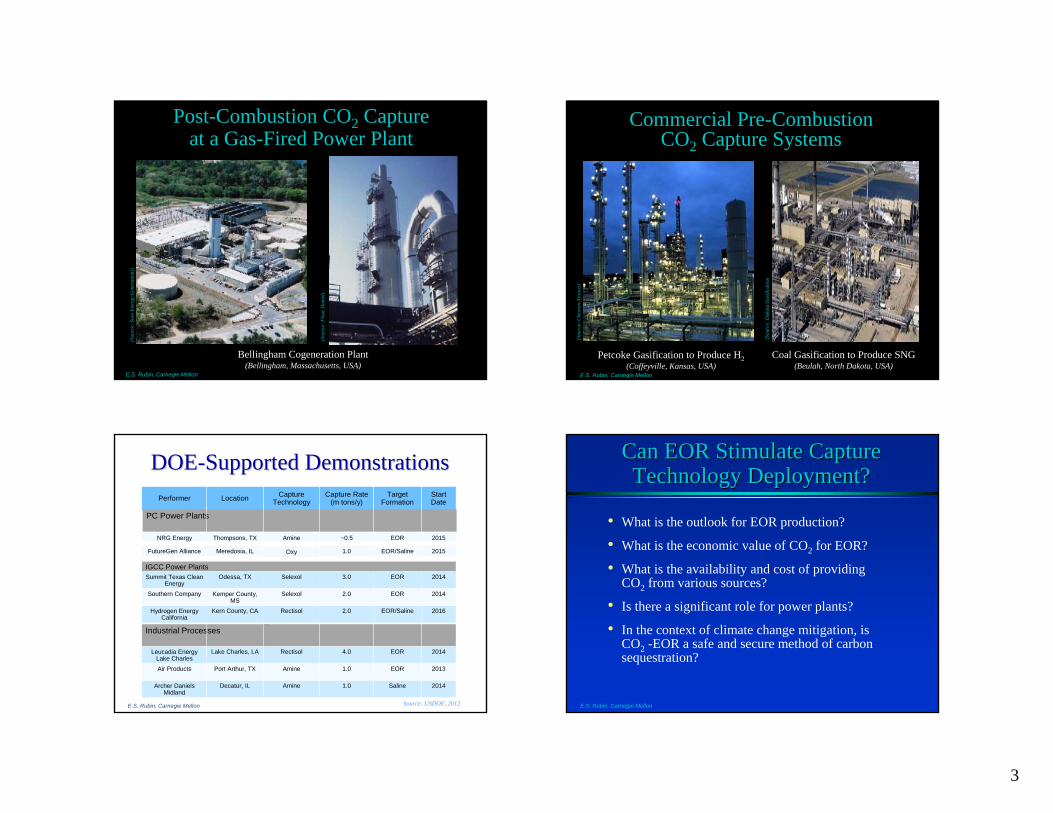
Post-Combustion CO2 Capture at a Gas-Fired Power Plant
E.S. Rubin, Carnegie Mellon
(Sou
rce:
Flo
ur D
anie
l)
Bellingham Cogeneration Plant(Bellingham, Massachusetts, USA)
(Sou
rce:
Sue
z Ene
rgy
Gen
erat
ion)
)
Coal Gasification to Produce SNG(Beulah, North Dakota, USA)
(Sou
rce:
Dak
ota
Gas
ifica
tion
Petcoke Gasification to Produce H2(Coffeyville, Kansas, USA)
(Sou
rce:
Che
vron
-Tex
aco)
Commercial Pre-CombustionCO2 Capture Systems
E.S. Rubin, Carnegie Mellon
E.S. Rubin, Carnegie Mellon
DOEDOE--Supported DemonstrationsSupported DemonstrationsPerformer Location Capture
TechnologyCapture Rate
(m tons/y)Target
FormationStart Date
NRG Energy Thompsons, TX Amine ~0.5 EOR 2015
FutureGen Alliance Meredosia, IL Oxy 1.0 EOR/Saline 2015
PC Power Plants
Industrial Processes
Leucadia Energy Lake Charles
Lake Charles, LA Rectisol 4.0 EOR 2014
Air Products Port Arthur, TX Amine 1.0 EOR 2013
Archer Daniels Midland
Decatur, IL Amine 1.0 Saline 2014
IGCC Power Plants\Summit Texas Clean
EnergyOdessa, TX Selexol 3.0 EOR 2014
Southern Company Kemper County, MS
Selexol 2.0 EOR 2014
Hydrogen Energy California
Kern County, CA Rectisol 2.0 EOR/Saline 2016
Source: USDOE, 2012 E.S. Rubin, Carnegie Mellon
Can EOR Stimulate Capture Can EOR Stimulate Capture Technology Deployment?Technology Deployment?
• What is the outlook for EOR production?
• What is the economic value of CO2 for EOR?
• What is the availability and cost of providing CO2 from various sources?
• Is there a significant role for power plants?
• In the context of climate change mitigation, is CO2 -EOR a safe and secure method of carbon sequestration?

4
E.S. Rubin, Carnegie Mellon
Growth of COGrowth of CO22--EOR Production EOR Production in the United Statesin the United States
0
50,000
100,000
150,000
200,000
250,000
300,000
1986 1988 1990 1992 1994 1996 1998 2000 2002 2004 2006 2008 2010
Year
GULF COAST/OTHERMID-CONTINENTROCKY MOUNTAINSPERMIAN BASIN
JAF2010_031.XLS
Source: Advanced Resources Int’l., 2011, based on Oil and Gas Journal, 2010.
Incr
emen
tal O
il R
ecov
ery
(bar
rels
/day
)
Significant further growth is constrained by lack of CO2 supplies
E.S. Rubin, Carnegie Mellon
Sources of COSources of CO22 Supply for Supply for EOR Operations in the U.S. EOR Operations in the U.S.
Source: P. DiPietro, NETL, 2012
E.S. Rubin, Carnegie Mellon
COCO22 Sources for EOR FloodsSources for EOR Floods
Source: P. DiPietro, NETL, 2012
E.S. Rubin, Carnegie MellonSource: P. DiPietro, NETL, 2012

5
E.S. Rubin, Carnegie Mellon
Future COFuture CO22 Supply Scenario Supply Scenario (Based on (Based on Best Current PracticesBest Current Practices for COfor CO22--EOR Technologies)EOR Technologies)
Source: P. DiPietro and C. Nichols, NETL, 2012
• 24 billion bbl of CO2-EOR resources • 9 B mt CO2 demand• 5.5 MMmt CO2/yr growth in CO2 demand• 46 MMmtCO2/yr from industrial vents• Peak dilute sources is 156 MMmtCO2/yr • 45% of CO2 from dilute sources
0
50
100
150
200
250
300
350
400
0
50
100
150
200
250
300
350
400
2010 2030 2050 2070 2090
E.S. Rubin, Carnegie Mellon
Future EOR Production ScenarioFuture EOR Production Scenario(Based on (Based on ““Next GenerationNext Generation”” COCO22--EOR Technologies)EOR Technologies)
Sources: V. Kuuskraa, ARI. 2011 and P. DiPietro, NETL, 2012;
Next Generation CO2-EORtechnologies:
• Significant improvements to today’s technology
• Application to residual oil zones (ROZs)
• Integration of CO2-EOR and CO2storage
• Advanced near-miscible/immiscible technology
• Deployment in offshore oil fields and Alaska
E.S. Rubin, Carnegie Mellon
Future COFuture CO22 Supply Scenario Supply Scenario (Based on (Based on ““Next GenerationNext Generation”” COCO22--EOR Technologies)EOR Technologies)
• 60 billion bbl of CO2-EOR resources • 17 B mt CO2 demand• 7 MMmt CO2 /yr growth in CO2 demand• 46 MMmtCO2/yr from industrial vents• Peak dilute sources is 214 MMmtCO2/yr • 63% of CO2 from dilute sources
Source: P. DiPietro and C. Nichols, NETL, 2012
Significant potential for power plants to contribute to EOR
CO2 supplies after ~2030
The costs of capturing and The costs of capturing and sequestering COsequestering CO22
E.S. Rubin, Carnegie Mellon

6
E.S. Rubin, Carnegie Mellon
Many Recent CCS Cost StudiesMany Recent CCS Cost Studies• 2005: IPCC Special Report on CCS• 2007: Rubin, et al., Energy Policy• 2007: EPRI Report No. 1014223• 2007: DOE/NETL Report 2007/1281• 2007: MIT Future of Coal Report• 2008: EPRI Report No. 1018329• 2009: Chen & Rubin, Energy Policy• 2009: ENCAP Report D.1.2.6• 2009: IEAGHG Report 2009/TR-3• 2009: EPRI Report No. 1017495• 2010: Carnegie Mellon IECM v. 6.4• 2010: UK DECC, Mott MacDonald Report• 2010: Kheshgi, et al., SPE 139716-PP• 2010: DOE/NETL Report 2010/1397• 2010: DOE EIA Cost Update Report• 2011: OECD/IEA Working Paper• 2011: Global CCS Institute Update
E.S. Rubin, Carnegie Mellon
My ObservationsMy Observations
• Despite many recent studies on the cost of CO2capture and storage (CCS) there remain significant differences in underlying costing methods (as well as key assumptions) that are often not readily apparent.
• Such differences contribute to significant confusion, misunderstanding and (in some cases) the mis-representation of CO2 abatement costs, especially among audiences unfamiliar with details of CCS costing.
E.S. Rubin, Carnegie Mellon
Audiences for (and Sources of) Audiences for (and Sources of) Cost EstimatesCost Estimates
GovernmentGovernment
• Policymakers
• Analysts
• Regulators
• R&D agencies
Source: Based on Herzog, 2011
Industryndustry
• Operators
• Vendors
• A&E firms
• Venture capital
• Tech developers
• R&D orgs
NGOsNGOs
• Environmental
• Media
• Academia
• Foundations
E.S. Rubin, Carnegie Mellon
A Hierarchy of Methods A Hierarchy of Methods to Estimate CCUS Coststo Estimate CCUS Costs
• Ask an expert
• Use published values
• Modify published values
• Derive new results from a model
• Commission a detailed engineering study

7
E.S. Rubin, Carnegie Mellon
Common Measures of CCS CostCommon Measures of CCS Cost
• Cost of CO2 avoided
• Cost of CO2 captured
• Increased capital cost
• Increased cost of electricity
E.S. Rubin, Carnegie Mellon
Dollars per Ton Dollars per Ton
• This is the metric most commonly used in technical and policy forums to quantify the cost of CCS (as well as other methods of reducing carbon emissions)
• Also the measure that is most easily misunderstood and misapplied
E.S. Rubin, Carnegie Mellon
Cost of COCost of CO2 2 AvoidedAvoided
• This widely used metric gives the cost of reducing a ton of CO2 emissions while still providing a unit of useful product (e.g., a MWh of delivered electricity)
• It should (but often does not) include the full chain of CCS processes, i.e., capture, transport and storage (emissions are not avoided until sequestered)
• It is a relative cost measure that is very sensitive to the choice of reference plant without CCS
($/MWh)ccs – ($/MWh)ref
(t CO2/MWh)ref – (t CO2/MWh)ccs
($/t CO2)=
E.S. Rubin, Carnegie Mellon
Cost of COCost of CO2 2 avoided is sensitive to avoided is sensitive to assumed reference plant w/o CCSassumed reference plant w/o CCS
20
40
60
80
100
120
Cos
t of E
lect
ricity
($ /
MW
h)
00 0.1 0.2 0.3 0.4 0.5 0.6 0.7 0.8 0.9 1.0
CO2 Emission Rate (tonnes / MWh)
PCNGCC
NGCC-CCS
20
40
60
80
100
120
Cos
t of E
lect
ricity
($ /
MW
h)20
40
60
80
100
120
Cos
t of E
lect
ricity
($ /
MW
h)
00 0.1 0.2 0.3 0.4 0.5 0.6 0.7 0.8 0.9 1.0
CO2 Emission Rate (tonnes / MWh)
PCNGCC
NGCC-CCS
Cost and emissions data from NETL, 2010
$106/t CO2avoided
$41/t CO2 avoided
∆COE ccs–ref = 34 $/MWh
Different questions require different reference plants

8
E.S. Rubin, Carnegie Mellon
Two Additional Measures Two Additional Measures —— Same Same Units, Different MeaningsUnits, Different Meanings
($/MWh)ccs – ($/MWh)reference
(t CO2/MWh)ref – (t CO2/MWh)ccs
• Cost of CO2 Avoided ($/t CO2)
=
($/MWh)ccs – ($/MWh)reference
(t CO2/MWh)ccs, produced – (t CO2/MWh)ccs
• Cost of CO2 Captured ($/t CO2)
=($/MWh)ccs – ($/MWh)reference
(t CO2/MWh)ccs, produced – (t CO2/MWh)ccs
• Cost of CO2 Captured ($/t CO2)($/MWh)ccs – ($/MWh)reference
(t CO2/MWh)ccs, produced – (t CO2/MWh)ccs
($/MWh)ccs – ($/MWh)reference
(t CO2/MWh)ccs, produced – (t CO2/MWh)ccs
• Cost of CO2 Captured ($/t CO2)
=
• Cost of CO2 Abated (Reduced) ($/t CO2)($ NPV)ccs – ($ NPV)reference
(t CO2)ref – (t CO2)ccs=
• Cost of CO2 Abated (Reduced) ($/t CO2)($ NPV)ccs – ($ NPV)reference
(t CO2)ref – (t CO2)ccs
• Cost of CO2 Abated (Reduced) ($/t CO2)($ NPV)ccs – ($ NPV)reference
(t CO2)ref – (t CO2)ccs
($ NPV)ccs – ($ NPV)reference
(t CO2)ref – (t CO2)ccs=
Use with caution!
E.S. Rubin, Carnegie Mellon
Cost of Electricity (COE)Cost of Electricity (COE)
COE ($/MWh) (TCC)(FCF) + FOM(CF)(8760)(MW)
+ VOM + (HR)(FC)=
TCC = Total capital cost ($)FCF = Fixed charge factor (fraction)FOM = Fixed operating & maintenance costs ($/yr)VOM = Variable O& M costs, excluding fuel cost ($/MWh)HR = Power plant heat rate (MJ/MWh)FC = Unit fuel cost ($/MJ)CF = Annual average capacity factor (fraction)MW = Net power plant capacity (MW)
E.S. Rubin, Carnegie Mellon
Increase in COEIncrease in COE
• A common metric for power plant CCS cost
• Typically reported on a “levelized” basis (LCOE) Implies that all parameters in the COE equation
(including FCF and CF) reflect their levelized value over the life of the plant
• Most studies report LCOE in constant dollars (no inflation effects); some report in current (nominal) dollars, which yield higher values O&M costs are multiplied by a “levelization factor”
calculated from specified rates of inflation and real cost escalations over the plant life.
E.S. Rubin, Carnegie Mellon
Many Factors Affect CCS CostsMany Factors Affect CCS Costs• Choice of Power Plant and CCS Technology• Process Design and Operating Variables• Economic and Financial Parameters• Choice of System Boundaries; e.g.,
One facility vs. multi-plant system (regional, national, global) GHG gases considered (CO2 only vs. all GHGs) Power plant only vs. partial or complete life cycle
• Time Frame of Interest First-of-a-kind plant vs. nth plant Current technology vs. future systems Consideration of technological “learning”
9
E.S. Rubin, Carnegie Mellon
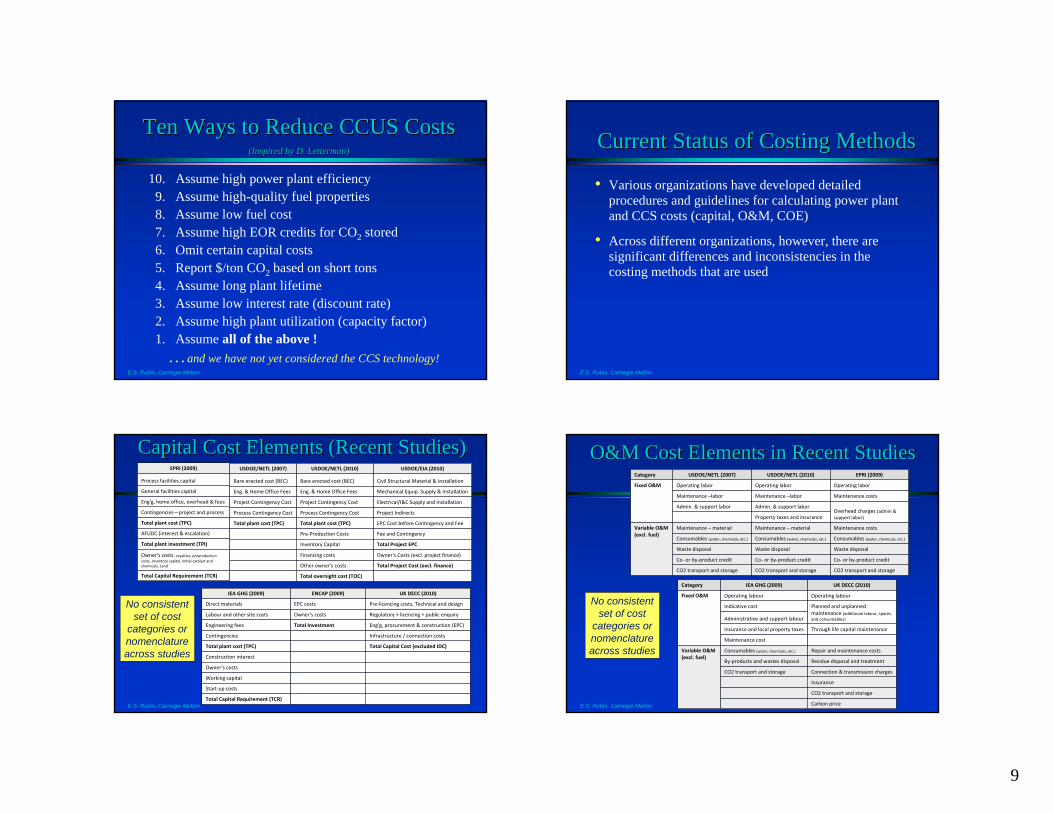
Ten Ways to Reduce CCUS Costs Ten Ways to Reduce CCUS Costs (Inspired by D. Letterman)(Inspired by D. Letterman)
10. Assume high power plant efficiency 9. Assume high-quality fuel properties8. Assume low fuel cost7. Assume high EOR credits for CO2 stored6. Omit certain capital costs5. Report $/ton CO2 based on short tons4. Assume long plant lifetime3. Assume low interest rate (discount rate)2. Assume high plant utilization (capacity factor)1. Assume all of the above !
. . . and we have not yet considered the CCS technology!E.S. Rubin, Carnegie Mellon
Current Status of Costing MethodsCurrent Status of Costing Methods
• Various organizations have developed detailed procedures and guidelines for calculating power plant and CCS costs (capital, O&M, COE)
• Across different organizations, however, there are significant differences and inconsistencies in the costing methods that are used
E.S. Rubin, Carnegie Mellon
Capital Cost Elements (Recent Studies)Capital Cost Elements (Recent Studies)
IEA GHG (2009) ENCAP (2009) UK DECC (2010)
Direct materials EPC costs Pre‐licencing costs, Technical and design
Labour and other site costs Owner's costs Regulatory + licencing + public enquiry
Engineering fees Total Investment Eng'g, procurement & construction (EPC)
Contingencies Infrastructure / connection costs
Total plant cost (TPC) Total Capital Cost (excluded IDC)
Construction interest
Owner's costs
Working capital
Start‐up costs
Total Capital Requirement (TCR)
USDOE/NETL (2007) USDOE/NETL (2010) USDOE/EIA (2010)
Bare erected cost (BEC) Bare erected cost (BEC) Civil Structural Material & Installation
Eng. & Home Office Fees Eng. & Home Office Fees Mechanical Equip. Supply & Installation
Project Contingency Cost Project Contingency Cost Electrical/I&C Supply and Installation
Process Contingency Cost Process Contingency Cost Project Indirects
Total plant cost (TPC) Total plant cost (TPC) EPC Cost before Contingency and Fee
Pre‐Production Costs Fee and Contingency
Inventory Capital Total Project EPC
Financing costs Owner's Costs (excl. project finance)
Other owner's costs Total Project Cost (excl. finance)
Total overnight cost (TOC)
EPRI (2009)
Process facilities capital
General facilities capital
Eng'g, home office, overhead & fees
Contingencies—project and process
Total plant cost (TPC)
AFUDC (interest & escalation)
Total plant investment (TPI)
Owner's costs: royalties, preproduction costs, Inventory capital, Initial catalyst and chemicals, Land
Total Capital Requirement (TCR)
No consistent set of cost
categories or nomenclature across studies
E.S. Rubin, Carnegie Mellon
Category USDOE/NETL (2007) USDOE/NETL (2010) EPRI (2009)
Fixed O&M Operating labor Operating labor Operating labor
Maintenance –labor Maintenance –labor Maintenance costs
Admin. & support labor Admin. & support laborOverhead charges (admin & support labor)Property taxes and insurance
Variable O&M (excl. fuel)
Maintenance – material Maintenance – material Maintenance costs
Consumables (water, chemicals, etc.) Consumables (water, chemicals, etc.) Consumables (water, chemicals, etc.)
Waste disposal Waste disposal Waste disposal
Co‐ or by‐product credit Co‐ or by‐product credit Co‐ or by‐product credit
CO2 transport and storage CO2 transport and storage CO2 transport and storage
Category IEA GHG (2009) UK DECC (2010)
Fixed O&M Operating labour Operating labour
Indicative cost Planned and unplanned maintenance (additional labour, spares and consumables)Administrative and support labour
Insurance and local property taxes Through life capital maintenance
Maintenance cost
Variable O&M (excl. fuel)
Consumables (water, chemicals, etc.) Repair and maintenance costs
By‐products and wastes disposal Residue disposal and treatment
CO2 transport and storage Connection & transmission charges
Insurance
CO2 transport and storage
Carbon price
O&M Cost Elements in Recent StudiesO&M Cost Elements in Recent Studies
No consistent set of cost
categories or nomenclature across studies

10
E.S. Rubin, Carnegie Mellon
Elements of Elements of ““OwnerOwner’’s Costss Costs””in Several Recent Studiesin Several Recent Studies
USDOE/NETL (2007)
USDOE/NETL (2010)
EPRI (2009)
IEA GHG (2009)
UK DECC (2010)
(None)Preproduction (Start‐Up) costs
Preproduction (Start‐Up) costs
Feasibility studies (None)
Working capital Prepaid royalties Obtaining permits
Inventory capital Inventory capitalArranging financing
Financing cost Initial catalyst/chem. Other misc. costs
Land Land Land purchase
Other
No consistent set of cost categories or nomenclature across studies
E.S. Rubin, Carnegie Mellon
Key Assumptions Also Vary Key Assumptions Also Vary Across StudiesAcross Studies
ParameterUSDOE/NETL USDOE/NETL EPRI IEA GHG UK DECC
2007 2010 2009 2009 2010
Plant Size (PC case) 550 MW (net) 550 MW (net) 750 MW (net) 800 MW (net) 1600 MW (gross)
Capacity Factor 85% 85% 85% 85% (yr 1= 60%) varies yearly
Constant/Current $ Current Current Constant Constant Constant
Discount Rate 10% 10% 7.09% 8% 10%
Plant Book Life (yrs) 20 30 30 25 32‐40 (FOAK)
35‐45 (NOAK)
Capital Charge Factor
no CCS 0.164 0.116 0.121 N/A N/A
w/ CCS 0.175 0.124 0.121 N/A N/A
Variable Cost Levelization Factor
no CCS1.2089 (coal) 1.1618 (other)
1.2676 1.00 1.00 N/A
‐ w/ CCS1.2022 (coal) 1.1568 (other)
1.2676 1.00 1.00 N/A
N/A: not available
Transparency is critical for understanding
E.S. Rubin, Carnegie Mellon
Uncertainty, Variability & Bias Uncertainty, Variability & Bias
• Variability and uncertainty can (in principle) be accounted for in costing methods, e.g., via parametric (sensitivity) analysis, choice of parameter values, and/or probabilistic analysis
• Bias can arise in project design specifications and choice of parameters and values for cost estimates Can be difficult to detect or prove Independent (3rd party) evaluations can be helpful
Especially important for evaluating new or emerging technologies
E.S. Rubin, Carnegie Mellon
The Devil is in the DetailsThe Devil is in the Details
• Need to improve the consistency, reporting and transparency of costing methods and assumptions to enhance the understanding of CCS costs

11
E.S. Rubin, Carnegie Mellon
A CCS Cost Task Force has A CCS Cost Task Force has recommended a path forwardrecommended a path forward
White Paper Contents:• Defining Project Scope and Design• Defining Nomenclature and Cost
Categories for CCS Cost Estimates• Quantifying Elements of CCS Cost• Defining Financial Structure and
Economic Assumptions • Calculating the Costs of Electricity
and CO2 Avoided• Guidelines for CCS Cost Reporting
Dakota Coal Gasification Plant, NDRegina
Bismarck
North Dakota
Saskatchewan CanadaUSA
WeyburnWeyburn
COCO22
Regina
Bismarck
North Dakota
Saskatchewan CanadaUSA
WeyburnWeyburn
COCO22Sources: IEAGHG; NRDC; USDOE
Weyburn Field, Canada
E.S. Rubin, Carnegie Mellon
Geological Storage of Captured CO2 with Enhanced Oil Recovery (EOR)
The cost of CCUS vs. CCS The cost of CCUS vs. CCS
E.S. Rubin, Carnegie Mellon E.S. Rubin, Carnegie Mellon
Illustrative Cases StudiesIllustrative Cases Studies
• Use the IECM to analyze effect on overall plant cost of varying the price of CO2 sold for EOR for three plant types: PC Plant NGCC Plant IGCC Plant

12
E.S. Rubin, Carnegie Mellon
The Integrated Environmental Control The Integrated Environmental Control Model (IECM) Model (IECM)
• A desktop/laptop computer simulation model developed for DOE/NETL
• Provides systematic estimates of performance, emissions, costs anduncertainties for preliminary design of:
PC, IGCC and NGCC plants All flue/fuel gas treatment systems CO2 capture and storage options
(pre- and post-combustion, oxy-combustion; transport, storage)
• Free and publicly available at: www.iecm-online.com
E.S. Rubin, Carnegie Mellon
Illustrative Cases Studies Illustrative Cases Studies (1)(1)
Illinois #6Coal Type
Supercritical PCPlant Type
0.113 / 0.147Fixed Charge Factor (const $ / current $)75%Capacity Factor (levelized)Econamine FG+CO2 Capture System550 MW / 550 MWNet Plant Capacity (Ref / CCS)
E.S. Rubin, Carnegie Mellon
LCOE vs. COLCOE vs. CO22 EOR Price EOR Price (SCPC Plant)(SCPC Plant)
0
20
40
60
80
100
120
0 10 20 30 40CO2 Price for EOR ($/tonne CO2)
LCO
E (
cons
tant
201
0 $/
MW
h)
CCS
CCUSRef. SCPC Plant
Ref. +35%
Transport cost = $2/tonne CO2
E.S. Rubin, Carnegie Mellon
Avoidance Cost vs. COAvoidance Cost vs. CO22 Price Price (SCPC Plant)(SCPC Plant)
-10
0
10
20
30
40
50
60
70
0 10 20 30 40 50
CO2 Price for EOR ($/tonne CO2)
Cos
t of C
O2
Avoi
ded
for S
C P
C P
lant
(c
onst
ant 2
010
$/to
nne)
CCS

13
E.S. Rubin, Carnegie Mellon
Illustrative Cases Studies Illustrative Cases Studies (2)(2)
GE 7FBGas Turbine Type
NGCCPlant Type
0.113 / 0.147Fixed Charge Factor (const $ / current $)75%Capacity Factor (levelized)Econamine FG+CO2 Capture System527 MW / 455 MWNet Plant Capacity (Ref / CCS)
E.S. Rubin, Carnegie Mellon
SCPC vs. NGCCSCPC vs. NGCC
0
20
40
60
80
100
120
0 10 20 30 40CO2 Price for EOR ($/tonne CO2)
LCO
E (
cons
tant
201
0 $/
MW
h)
0
20
40
60
80
100
120
0 10 20 30 40CO2 Price for EOR ($/tonne CO2)
LCO
E (c
onst
ant 2
010
$/M
Wh)
SCPC
NGCC
Transport cost = $2/tonne CO2
E.S. Rubin, Carnegie Mellon
Sensitivity CasesSensitivity Cases
5490154+discount rate = 30%
5184143+discount rate = 20%
4778134current $, 3% inflation
3659101Base CCS - constant $
Cost of Capture ($/t)
Avoidance Cost ($/t)
LCOE (SCPC-CCS)Case
Many other parameters can affect these results
What is the potential for What is the potential for advanced capture technology? advanced capture technology?
E.S. Rubin, Carnegie Mellon

14
53 OFFICE OF FOSSIL ENERGY
Better Capture Technologies Are Emerging
Time to Commercialization
Advanced physical solventsAdvanced chemical solventsAmmoniaCO2 com-pression
Amine solventsPhysical solventsCryogenic oxygen
Chemical loopingOTM boilerBiological processesCAR process
Ionic liquidsMetal organic frameworksEnzymatic membranes
Present
Cos
t Red
uctio
n B
enef
it
5+ years 10+ years 15+ years 20+ years
PBI membranes Solid sorbentsMembrane systemsITMsBiomass co-firing
Post-combustion (existing, new PC)
Pre-combustion (IGCC)
Oxycombustion (new PC)
CO2 compression (all)
E.S. Rubin, Carnegie Mellon
A New Paper Looks at DetailsA New Paper Looks at Details
E.S. Rubin, Carnegie Mellon
Two Approaches to Estimating Two Approaches to Estimating Potential Cost SavingsPotential Cost Savings
• Method 1: Engineering-Economic Analysis
A “bottom up” approach based on engineering process models, informed by judgments regarding potential improvement in key parameters
E.S. Rubin, Carnegie Mellon
Potential Cost Reductions Based on Potential Cost Reductions Based on EngineeringEngineering--Economic AnalysisEconomic Analysis
Source: DOE/NETL, 2006
19% -28% reductions in COE w/ CCS
3128
19
12 10
5 5
0
5
10
15
20
25
30
35
40
A B C D E F G
7.13(c/kWh)
7.01(c/kWh)
6.14(c/kWh) 6.03
(c/kWh)
5.75(c/kWh)
5.75(c/kWh)
6.52(c/kWh)
SelexolSelexolAdvanced
SelexolAdvanced
Selexol
AdvancedSelexol w/co-Sequestration
AdvancedSelexol w/co-Sequestration
AdvancedSelexol w/ITM
& co-Sequestration
AdvancedSelexol w/ITM
& co-Sequestration
WGS Membrane& Co-Sequestration
WGS Membrane& Co-Sequestration
WGS Membrane w/ITM & Co-
Sequestration
WGS Membrane w/ITM & Co-
Sequestration
Chemical Looping& Co-
Sequestration
Chemical Looping& Co-
Sequestration
Perc
ent I
ncre
ase
in C
OE
IGCCIGCC70 69
5550 52
45
22
01020304050607080
A B C D E F G
`
8.77(c/kWh)
8.72(c/kWh)
8.00(c/kWh)
7.74(c/kWh)
7.48(c/kWh)
7.84(c/kWh)
y
Perc
ent I
ncre
ase
in C
OE
SC w/AmineScrubbingSC w/AmineScrubbing
SC w/EconamineScrubbingSC w/EconamineScrubbing
SC w/AmmoniaCO2 ScrubbingSC w/AmmoniaCO2 Scrubbing
SC w/MultipollutantAmmonia Scrubbing(Byproduct Credit)
SC w/MultipollutantAmmonia Scrubbing(Byproduct Credit)
USC w/AmineScrubbingUSC w/AmineScrubbing USC w/Advanced
Amine ScrubbingUSC w/AdvancedAmine Scrubbing
6.30 (c/kWh)
RTI RegenerableSorbentRTI RegenerableSorbent
PCPC
50
3326
21
0
10
20
30
40
50
60
A B C D
`
6.97(c/kWh)
6.62(c/kWh)
6.35(c/kWh)
y y
Perc
ent I
ncre
ase
in C
OE Advanced
Subcritical Oxyfuel(Cryogenic ASU)
AdvancedSubcritical Oxyfuel(Cryogenic ASU)
AdvancedSupercritical Oxyfuel
(Cryogenic ASU)
AdvancedSupercritical Oxyfuel
(Cryogenic ASU)Advanced
Supercritical Oxyfuel(ITM O2)
Advanced Supercritical
Oxyfuel(ITM O2)
7.86(c/kWh)
Current StateSupercritical Oxyfuel
(Cryogenic ASU)
Current StateSupercritical Oxyfuel
(Cryogenic ASU) OxyfuelOxyfuel

15
E.S. Rubin, Carnegie Mellon
Source: DOE/ NETL, 2010
Potential Cost Reductions Based on Potential Cost Reductions Based on EngineeringEngineering--Economic AnalysisEconomic Analysis
-5
15
35
55
75
95
115
135
155
175
IGCC Today
IGCC w/ CCS Today
IGCC w/ CCS with R&D
Supercritical PC Today
Supercritical PC w/ CCS …
Adv Combustion w/ CCS …
$/M
Wh
($20
09)
CCSwith
NoR&D
NoCCS
CCSwith R&D
CCSwith
NoR&D
NoCCS
CCSwith R&D
Pulverized Coal TechnologiesIGCC Technologies
27% reduction31% reduction
7% below no CCS
29% above no CCS
E.S. Rubin, Carnegie Mellon
Two Approaches to Estimating Two Approaches to Estimating Future Technology CostsFuture Technology Costs
• Method 1: Engineering-Economic Analysis
A “bottom up” approach based on engineering process models, informed by judgments regarding potential improvements in key process parameters
• Method 2: Use of Historical Experience Curves
A “top down” approach based on applications of mathematical “learning curves” or “experience curves” that reflect historical trends for analogous technologies or systems
E.S. Rubin, Carnegie Mellon
Empirical Empirical ““Learning CurvesLearning Curves””
• Cost trends modeled as a log-linear relationship between unit cost and cumulative production or capacity: y = ax –b
• Case studies used for power plant components: Flue gas desulfurization systems (FGD) Selective catalytic reduction systems (SCR) Gas turbine combined cycle system (GTCC) Pulverized coal-fired boilers (PC) Liquefied natural gas plants (LNG) Oxygen production plants (ASU) Hydrogen production plants (SMR)
20000
10000
5000
1000
10010 100 1000 10000 100000
1982
1987
1963
1980
Windmills (USA)
RD&D Commercialization
USAJapan
Cumulative MW installed
19811983
500
Photovoltaics
Gas turbines (USA)
US(
1990
)$/k
W
19951992
200
2000
Source: IIASA, 1996
20000
10000
5000
1000
10010 100 1000 10000 100000
1982
1987
1963
1980
Windmills (USA)
RD&D Commercialization
USAJapan
Cumulative MW installed
19811983
500
Photovoltaics
Gas turbines (USA)
US(
1990
)$/k
W
19951992
200
2000
20000
10000
5000
1000
10010 100 1000 10000 100000
1982
1987
1963
1980
Windmills (USA)
RD&D Commercialization
USAJapan
Cumulative MW installed
19811983
500
Photovoltaics
Gas turbines (USA)
US(
1990
)$/k
W
19951992
200
2000
Source: IIASA, 1996
E.S. Rubin, Carnegie Mellon
Projected Cost Reductions for Projected Cost Reductions for Power Plants with COPower Plants with CO22 CaptureCapture
(after 100 GW of cumulative CCS capacity worldwide)(after 100 GW of cumulative CCS capacity worldwide)
0
5
10
15
20
25
30
Perc
ent R
educ
tion
in C
OE
NGCC PC IGCC Oxyfuel
% REDUCTION• Plant-level learning
curves developed from component-level analyses
• Upper bound of ranges are similar to estimates from “bottom-up”analyses

16
E.S. Rubin, Carnegie Mellon
ConclusionsConclusions
• Significant potential to reduce the cost of carbon capture via: New or improved CO2 capture technologies
Improved plant efficiency and utilization
Challenges for advanced Challenges for advanced CCS technology CCS technology
E.S. Rubin, Carnegie Mellon
E.S. Rubin, Carnegie Mellon
Most New Capture Concepts Are Most New Capture Concepts Are Far from Commercial Availability Far from Commercial Availability
Source: NASA, 2009
Technology Readiness Levels
Source: EPRI, 2009
Post-Combustion Capture
E.S. Rubin, Carnegie Mellon
Typical Cost Trend for a Typical Cost Trend for a New TechnologyNew Technology
Research Development Demonstration Deployment Mature TechnologyResearchResearch Development Development DemonstrationDemonstration DeploymentDeployment Mature TechnologyMature Technology
Time or Cumulative Capacity
Cap
ital C
ost p
er U
nit o
f Cap
acity
Research Development Demonstration Deployment Mature TechnologyResearchResearch Development Development DemonstrationDemonstration DeploymentDeployment Mature TechnologyMature Technology
Time or Cumulative Capacity
Cap
ital C
ost p
er U
nit o
f Cap
acity
Source: Based on EPRI, 2008

17
E.S. Rubin, Carnegie Mellon
Most new concepts take decades to Most new concepts take decades to commercializecommercialize……many never make itmany never make it
1965 1970 19801975 19901985 1995 20052000
1999: 10 MW pilot planned by DOE
1975: DOE conducts test of fluidized bed system
1961:Process described by Bureau of Mines
1973: Used in commercial refinery in Japan
1970: Results of testing published.
1971: Test conducted in Netherlands
1967: Pilot-Scale Testing begins.
1979: Pilot-scale testing conducted in Florida
1984: Continued pilot testing with 500 lb/hr feed
1992: DOE contracts design and modeling for 500MW plant
1996: DOE continues lifecycle testing
2002: Paper published at NETL symposium
2006: Most recent paper published
1983: Rockwell contracted to improve system
Copper Oxide Process
1965 1970 19801975 19901985 1995 20052000
1999: Process used at plant in Poland
1985: Pilots initiated in U.S. and Germany
1977: Ebara begins pilot-scale testing
1998: Process used in plant in Chengdu, China
1970: Ebara Corporation begins lab scale testing.
2005: Process used in plant in Hangzhou, China
2008: Paper on process presented at WEC forum in Romania
2002: Process used in plant in Beijing, China
Electron Beam Process
1965 1970 19801975 19901985 1995 20052000
1991: NoxsoCorporation receives DOE contract
1982: Pilot-scale tests carried out in Kentucky
1985: DOE conducts lifecycle testing.
1979: Development of process begins
1998: NoxsoCorporation liquidated. Project terminated.
1996: Construction of full scale test begins
2000: Noxsoprocess cited in ACS paper, Last NOXSO patent awarded
1997: NoxsoCorporation declares bankruptcy
1993: Pilot-scale testing complete
NOXSO Process
Development timelines for three novel processes for
combined SO2 –NOx capture
E.S. Rubin, Carnegie Mellon
Need to Need to Accelerate the Pace of InnovationAccelerate the Pace of Innovation
InventionAdoption
(limited use ofearly designs)
Diffusion(improvement & widespread use)
Innovation (new or better
product)
LearningBy Doing
LearningBy Using
R&D
E.S. Rubin, Carnegie Mellon
The CCSI Initiative to Accelerate The CCSI Initiative to Accelerate New Capture SystemsNew Capture Systems
Source: DOE/ NETL, 2011E.S. Rubin, Carnegie Mellon
The Critical Role of PolicyThe Critical Role of Policy
• The pace and direction of innovations in carbon capture technology will be strongly influenced by climate and energy policies—and their role in establishing markets for CCUS technologies


