
THE DEVELOPMENT AND DESIGN OF FLUORESCENT SENSORS FOR CONTINUOUS IN VIVO GLUCOSE MONITORING
A Dissertation Presented
by
Mary Katharine Balaconis
to
The Department of Bioengineering
in partial fulfillment of the requirements
for the degree of
Doctor of Philosophy
in the field of
Bioengineering
Northeastern University Boston, Massachusetts
December 4, 2013

Copyright 2013, Mary Katharine Balaconis
1

To my biggest cheerleaders: Mom, Dad, John, Pat and Liz …here’s to leaning in
2
ABSTRACT
Diabetes is an international health epidemic characterized by hypo and hyperglycemic levels. To
maintain glycemic control, diabetics test glucose levels several times a day. However, the
current glucose monitoring approaches suffer from invasiveness, intermittent measurements,
accuracy, and lifetime. This dissertation details the design of novel fluorescent glucose-sensitive
sensors for monitoring glucose levels non-invasively and continuously after initial implantation.
Sensing components were selected for appropriate response at physiological concentrations and
were fully characterized for dynamic range, sensitivity, and lifetime in vitro. In preclinical
testing, glucose-sensitive sensors tracked changes in glucose levels in mice, but sensor
monitoring was limited to one hour. Sensor design was further improved after these studies to
prolong in vivo lifetime, increase response at hypoglycemic levels, and enhance sensor
biocompatibility. These efforts resulted in in vivo lifetimes greater than one hour, incorporation
of more advance sensing moieties, and a biodegradable sensor platform. Future work with these
sensors will involve Clark Error Grid Analysis and biodistribution studies to address clinical
application requirements.
3
TABLE OF CONTENTS
ABSTRACT 3
LIST OF PUBLICATIONS AND PRESENTATIONS 5
ACKNOWLEDGEMENTS 7
CHAPTER 1 Dissertation Summary 8
CHAPTER 2 Design and Development of Fluorescent Glucose- 15 Sensitive Nanosensors
CHAPTER 3 In Vitro Characterization and In Vivo Demonstration of 39 Glucose-Sensitive Nanosensors CHAPTER 4 Gel Encapsulation of Glucose Nanosensors for Prolonged 60
In Vivo Monitoring
CHAPTER 5 Biodegradable Optode-Based Nanosensors for In Vivo 82 Monitoring CHAPTER 6 Optimization of Glucose Sensing Components 99
CHAPTER 7 Design and Development of Glucose-Sensitive Nanofibers 113
CHAPTER 8 Conclusions and Future Directions 121
CHAPTER 9 References 124
4

LIST OF PUBLICATIONS AND PRESENTATIONS
Publications
Balaconis, M.K., Clark H.A., Nanosensors for Biomedicine in Frontiers of Nanobiomedical Research (Contributed book chapter), 2013, in review.
Balaconis, M.K., Clark, H.A., Gel Encapsulation of Glucose Nanosensors for Prolonged In Vivo Monitoring. J Diabetes Sci Technol, 2013; 7 (1); 53-61.
Balaconis, M.K., Clark, H.A., Biodegradable Optode-Based Nanosensors for In Vivo Monitoring. Anal Chem, 2012; 84 (13); 5787-5793. Dubach, J.M., Balaconis, M.K., Clark, H.A., Fluorescent Nanoparticles for the Measurement of Ion Concentration in Biological Systems. J Vis Exp, 2011; 53. (Shared first author) Balaconis, M.K., Billingsley, K.L., Dubach, J.M., Cash, K.J., Clark, H.A., The Design and Development of Fluorescent Nano-Optodes for In Vivo Glucose Monitoring. J Diabetes Sci Technol, 2011; 5 (1); 1650-1657. Billingsley, K.L., Balaconis, M.K., Dubach, J.M., Zhang, N., Lim, E., Francis, K.P., and Clark, H.A., Fluorescent Nano-Optodes for Glucose Detection. Anal Chem, 2010; 82 (9); 3707-3713.
Presentations Balaconis M.K., Cash K.J., Dubach J.M., and Clark H.A. Biodegradation Enhances Biocompatibility in Optode-Based Nanosensors (Organized Contributed Session; Presentation). Pittsburgh Conference on Analytical Chemistry and Applied Spectroscopy. 2012. Orlando, FL. Balaconis M.K., Cash K.J., Dubach J.M., and Clark H.A. Biocompatible and biodegradable fluorescent sensors (Presentation). Pittsburgh Conference on Analytical Chemistry and Applied Spectroscopy. 2011. Atlanta, GA. Balaconis M.K., Cash K.J., Dubach J.M., and Clark H.A. Improving Biocompatibility of Fluorescent Nano-Optodes for In Vivo Glucose Monitoring (Poster). Materials Research Society Fall Meeting. 2010. Boston, MA. Balaconis, M.K., Billingsley, K.L., Dubach, J.M., and Clark, H.A. Fluorescent Nano-Optodes for Monitoring Glucose Levels In Vivo (Poster). Gordon Research Conference-Bioanalytical Sensors. 2010. New London, NH. Balaconis, M.K., Billingsley, K.L., Dubach, J.M., and Clark, H.A. Fluorescent Nano-Optodes for Monitoring Glucose Levels In Vivo (Poster). Gordon Research Seminar-Bioanalytical Sensors. 2010. New London, NH.
5

Balaconis, M.K., Billingsley, K.L., Dubach, J.M., and Clark, H.A. Fluorescent Nanosensor “Tattoos” for Monitoring Glucose Levels In Vivo (Presentation). Pittsburgh Conference on Analytical Chemistry and Applied Spectroscopy. 2010. Orlando, FL. Billingsley, K.L., Balaconis, M.K., Dubach, J.M., and Clark, H.A. In Vivo Glucose Monitoring with Fluorescent Nanoparticle Sensors (Presentation). Pittsburgh Conference on Analytical Chemistry and Applied Spectroscopy. 2009. Chicago, IL.
Patents “Chemical Sensing with Fibrous Material,” Ruckh, T.T., Balaconis, M.K., Clark, H.A., provisional filed 2013.
6

ACKNOWLEDGEMENTS
This dissertation could not have been completed without the technical help and guidance of
others. I thank my advisor, Professor Heather Clark, for not only her professional but also
personal mentorship. I could not have completed this dissertation without her constant
support. My committee members, Professor Lee Makowski and Mansoor Amiji, provided
valuable guidance and feedback on my project. Dr. Kelvin Billingsley, Dr. Matthew Dubach,
Dr. Kevin Cash, Dr. Christopher Skipwith and Yi Luo were instrumental with various parts
of this project acting as a sounding board, mentoring my scientific development, and
providing feedback on my writing. I would like to thank all members of the Clark Group,
both past and present, for creating a fun and creative work environment. I would like to
thank William Fowle for helping me obtain SEM images of my samples and the IGERT
Nanomedicince program at Northeastern for their support. I would like to thank my
colleagues and friends especially Ankita Shah Faulkner, Jaclyn Lautz, Christina Bourgeois,
Catherine Foley, and Theresa Leach for all of their encouragement throughout this
dissertation. Lastly, I would like to thank my entire family especially my parents, my
brothers, and my sister for their unconditional support.
7
Chapter 1: Dissertation Summary
1.1 Motivation: A Global Epidemic
Diabetes is a national and international epidemic. Currently, 26 million people in the
United States,1 92 million people in China,2 and 51 million people in India,3 are diabetic. An
estimated 439 million people, 7.7% of the world population, will be diagnosed with diabetes by
2030.4 Diabetes is a chronic disease caused by elevated glucose levels and is linked to long-term
effects such as heart disease, stroke, and blindness.1 Concurrently, diabetes’s prevalence,4 cost,5
and a battery of related health effects1 have spurred prevention programs, research into the
disease, and monitoring devices. Monitoring glucose levels minimizes large and potentially
deadly swings in glucose levels.6 The finger-prick method is the current gold standard for
diabetics to check their glucose levels; however, this method results in patient non-compliance
and intermittent measurements because of blood sampling requirements.6 Commercially
available glucose monitors such as DexCom™ STS™ Continuous Glucose Monitoring System
and Medtronic’s Guardian® REAL-Time Continuous Glucose Monitoring System were
developed as minimally-invasive and continuous monitoring systems that are FDA approved to
track trends in glucose levels, but still require blood measurements before therapeutic action is
taken.7,8 Therefore, ongoing research into novel approaches for glucose monitoring is still of
interest in order to prolong sensor lifetimes, improve accuracy, and minimize invasiveness of
measurements.
1.2 Objective: Monitoring an Epidemic
The Clark group is developing a nanoclinical analyzer (NCA) that will monitor important
physiological analytes such as glucose, sodium, and potassium. The NCA is a three-component
system consisting of a minimally-invasive injection device, fluorescent nanosensors, and a
8

handheld optical reader (Figure 1.1). The fluorescent nanosensors will be placed into the upper
layers of the skin with the injection device. As the concentration of the analyte of interest
fluctuates, the nanosensors undergo a change in their fluorescence intensity. The handheld
optical reader such as an iPhone interrogates these changes and provides the user with a
measurement. With the NCA, users will be able to monitor analytes continuously and non-
invasively after initial injection of nanosensors thus minimizing the need for painful blood
draws. The focus of this dissertation is nanosensor development specifically for glucose.
Fluorescent nanosensors are a novel approach for monitoring glucose levels in diabetes care.
Their size imparts several advantages such as rapid response times,9,10 easy in vivo implantation,
and sensing with nonbiological components making them ideal human use.
1.3 Dissertation Overview
This dissertation covers the main developments in glucose-sensitive nanosensor design.
Several key questions guided the design of glucose-sensitive sensors and are the framework for
this dissertation:
1) Can glucose be extracted into a hydrophobic sensor using only non-biological
components? Traditionally, optode-based sensors have only detected and monitored ions
because of difficulties extracting larger hydrophilic molecules into the lipophilic polymer
matrix. Other glucose sensors utilize biological components such as enzymes, which while
suitable for in vitro detection, pose problems for in vivo analysis. Chapter 2 covers the
synthesis, characterization, and application of sensor components for reversible fluorescent
responses to glucose extraction. Boronic acid compounds such as octylboronic acid were able
to extract glucose from solution into the polymer core and reversibly bind to glucose.
9

Figure 1.1. Proposed nanoclinical analyzer (NCA). The NCA is a three component
system containing (1) a minimally-invasive injection device, (2) fluorescent nanosensors,
and (3) a handheld imaging device.
10

2) Can glucose nanosensors respond to physiological glucose levels? After selection of
sensing components, glucose sensors were tailored to respond at physiological levels prior to
in vivo experiments. Chapter 3 details full in vitro analytical sensor characterization. These
nanosensors were the first demonstration of optode-based sensors for small molecules. With
a Kd of 38 mM and response time of minutes, the formulation of sensors, while not optimal
for physiological levels of glucose, are responsive enough in the physiological range for
application.
3) Can glucose nanosensors be visualized through the skin and track changes in glucose
levels in vivo? We performed initial animal testing in mice to determine if the sensors could
be visualized through the skin before further optimization. We were concerned that
excitation and emission wavelengths of our current fluorescent indicator (460nm and 570nm
respectively) would not allow us to visualize the nanosensors over the autofluorescence of
the skin. In addition to sensor characterization, Chapter 3 also demonstrates initial in vivo
testing of glucose-sensitive nanosensors in mice. With the current sensor design, the
nanosensors were visualized in the skin and additionally tracked changes in blood glucose
levels when the mice were orally administered a glucose gavage.
4) How can nanosensor migration and cellular uptake be limited in vivo? Though initial in
vivo testing of the glucose nanosensors was successful, our monitoring time was limited to an
hour because of rapid migration and cellular uptake of the nanosensors from the site of
injection. One straightforward approach that did not require dramatically changing the
sensor itself was to encapsulate the sensors in injectable gels. Chapter 4 details
encapsulation methods and gel retention of the nanosensors in vivo. In in vivo studies, the
11

gels significantly retained the nanosensors more than nanosensors without gels, but, there
was still rapid loss of intensity over the course of hours.
5) Will the sensors continue to function when fabricated with biocompatible materials?
Nanosensor migration and cellular uptake not only hindered sensor monitoring time, but also
raised toxicity concerns related to the ultimate fate of the sensors in vivo. Our current
nanosensor was built on a poly(vinyl) chloride (PVC)/sebacate platform based on our history
with ion-selective optodes,9,11 which have traditionally incorporated these materials. Though
medical grade products contain both of these components, plasticizer leaching and known
carcinogenic effects of vinyl chloride have caused rising safety concerns associated with
plasticized PVC in medical devices.12,13 Although we have not seen any gross indications of
biocompatibility issues, it was important to develop our nanosensors with known FDA
approved materials before further animal testing and long-term biocompatibility studies.
Chapter 5 details our design of the first optode-based biodegradable nanosensors using
polycaprolactone (PCL) and a citrate-based plasticizer. These studies were conducted with
sodium nanosensors because their sensing mechanism is robust, mathematically described,
and well characterized. The new PCL-based nanosensors yielded similar characteristics and
analytical response to PVC-based nanosensors.
6) Prior to further in vivo testing, can the dynamic range, sensitivity, and lifetime of the
sensors be improved? Previously developed glucose-sensitive nanosensors (Chapter 3,
question 2 above) have two key limitations independent of in vivo obstacles: leaching of
sensing components and a dynamic range insensitive to hypoglycemic events. Chapter 6
describes the testing of alternative sensing moieties and fluorescent dyes for the glucose
nanosensors. To prevent component leaching, alizarin derivatives were conjugated to the
12

polymer platform and tested for sensor response. Sensor response was also improved by
incorporating boronic acid derivatives with functional groups that enhance glucose binding at
physiological levels.
7) Can changing sensor geometry prevent sensor migration and cellular uptake in vivo?
Though the gels (Chapter 4, question 4 above) decreased in vivo sensor migration, they were
not a long-term solution to the problem of nanosensor migration because they only extended
in vivo experiments to several hours. Electrospinning creates nanofibrous scaffolds that
enlarge the overall sensing device to eliminate migration while retaining the high surface
area to volume ratio characteristics of nanoparticles which is essential for the rapid response
needed in vivo. As detailed in Chapter 7, electrospun nanofibers were fabricated using
traditional glucose sensing components and yielded a response to glucose. Future work will
involve testing this sensor platform in vivo to determine if it prolongs our in vivo monitoring
time.
Figure 1.2 summarizes the progress and key milestones in glucose-sensitive sensor development.
The dissertation concludes with future directions and recommendations for these sensors.
13
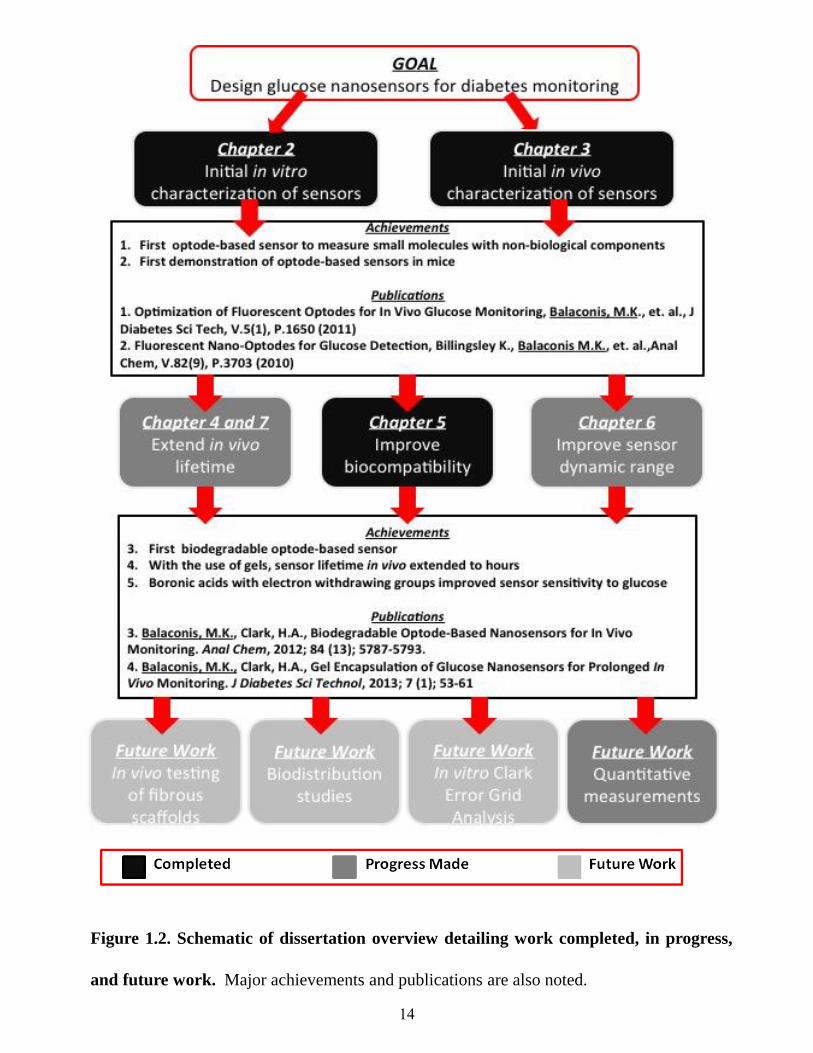
Figure 1.2. Schematic of dissertation overview detailing work completed, in progress,
and future work. Major achievements and publications are also noted.
14

Chapter 2: Design and Development of Fluorescent Glucose-Sensitive
Nanosensors
2.1 Chapter Overview
Background: The advent of fluorescent nanosensors has enabled intracellular monitoring of
several physiological analytes which was previously not possible with molecular dyes or other
invasive techniques. We have extended the capability of these sensors to include the detection of
small molecules with the development of glucose-sensitive nano-optodes. Herein, we discuss the
design and development of glucose-sensitive nano-optodes which have been proven functional
both in vitro and in vivo.
Methods: Throughout the design process, each of the sensor formulations was evaluated based
on their response to changes in glucose levels. The percent change in signal, sensor reversibility,
and the overall fluorescence intensity were the specific parameters used to assess each
formulation.
Results: A hydrophobic boronic acid was selected that yielded a fully reversible fluorescence
response to glucose in accordance with the sensor mechanism. The change in fluorescence
signal in response to glucose was approximately 11%. The use of different additives or
chromophores did not improve the response; however, modifications to the plasticized polymeric
membrane extended sensor lifetime.
Conclusions: Sensors were developed that yielded a dynamic response to glucose and through
further modification of the components, sensor lifetime was improved. By following specific
design criteria for the macrosensors, the sensors were miniaturized into nano-optodes that track
changes in glucose levels in vivo.
15

2.2 Introduction
Current continuous glucose monitoring systems primarily rely on electrochemical
biosensors using glucose oxidase and glucose dehydrogenase.14,15 These implantable sensors
monitor glucose levels in the blood or interstitial fluid by measuring the oxidation of glucose in
enzymatic reactions. Their long-term use, however, has been hampered by sensor degradation
due to, in part, by foreign body responses at the sight of implantation.6,16,17 In an effort to
improve sensor lifetime in vivo, murine models for testing implantable glucose sensors have been
developed to understand the mechanisms for sensor degradation.17,18 Though improvements
have been made, the dependence of the sensor mechanism on enzymatic reactions and
electrochemical readout still remains a limitation.
In response to the shortcomings of current techniques, researchers have developed
alternative methods such as optical approaches for continuously monitoring glucose levels. For
example, glucose sensing contact lenses that use photonic crystal sensors are being developed for
non-invasive glucose monitoring.19,20 These sensors swell in the presence of glucose causing a
shift in the diffraction wavelength of the sensor. Near-infrared spectroscopy can also be used to
measure glucose non-invasively and has been successful in extracting glucose measurement
information from transmission spectra across the human tongue.21 In other work, fluorescence
resonance energy transfer (FRET) can report changes in glucose concentrations using a
competitive binding assay encapsulated by a hydrogel particle.22,23 In our work, we present the
use of glucose nano-optodes based ion-selective optode technology as a non-invasive glucose
monitoring tool.
For the past four decades, ion-selective electrodes (ISEs) have been used to measure a
variety of important physiological analytes.24 More recently, bulk optodes have been developed
16

as an optical counterpart to electronic ISEs. These optodes are composed of a plasticized
polymeric membrane in which recognition elements, fluorescent indicators, and additives are
encapsulated.24,25 Mechanistically, optodes function through the bulk extraction of an analyte
into the membrane by the recognition element. This extraction causes a concentration change
within the membrane and alters the optical signal of the optode. For example, in the case of ion-
selective optodes, extraction of ions generates a shift in the pH within the membrane. In order to
maintain the charge balance of the membrane, the protonation state of the chromophore changes
resulting in a measurable change in the optical signal.24,25 Through the use of different
recognition elements and fluorescent molecules, bulk optodes have been developed for
measuring sodium, potassium, calcium, chloride, and a host of other analytes.24 Furthermore,
this technology has been miniaturized and developed into fluorescent nanosensors which have
enabled the intracellular measurements of several physiological analytes.9,26-32
Previously, we have reported on the development of glucose-sensitive nano-optodes that
extend ion-selective optode technology to the detection of small molecules.10 In our glucose
nano-optodes, dynamic changes in glucose concentrations are monitored using a competitive
binding scheme between a hydrophobic boronic acid recognition molecule, a chromophore, and
glucose.33,34 In the absence of glucose, the boronic acid is bound to the diol-containing alizarin,
generating a fluorescent complex (Figure 2.1). When glucose is introduced into the system,
glucose binds with the boronic acid, displacing the alizarin which renders it non-fluorescent.
Competitive binding of this sort has been used in the development of other saccharide
sensors33,35 and exploits the well-established affinity of boronic acids for diol moieties.36,37
Unlike other assays using this principle, our sensor components are encapsulated in a
hydrophobic polymeric membrane imparting such benefits as decreased interference from other
17

Figure 2.1. Representation of the sensor mechanism. At low glucose concentrations, the
boronic acid is bound to alizarin generating a highly fluorescent species. As the
concentration of glucose increases, glucose is extracted into the sensor displacing the alizarin
resulting in a non-fluorescent species.
18
biomolecules, 29 the use of non-biological components, and sensor reversibility.10 The sensors
are miniaturized to the nanoscale where the response time is on the order of seconds to minutes10
and it is possible to implant the sensors into the skin much like a tattoo. Thus far, we have
demonstrated the functionality of these sensors both in vitro and in vivo,10 and we discuss herein
the detailed development of the sensor formulation and optimization.
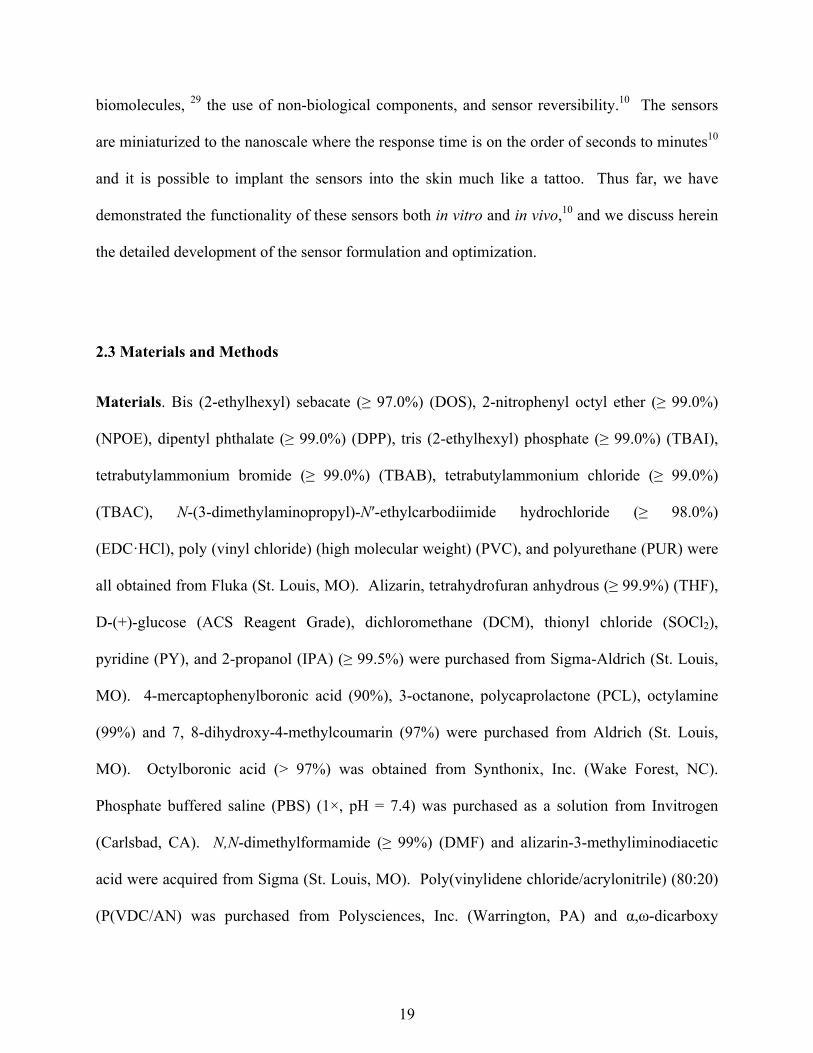
2.3 Materials and Methods
Materials. Bis (2-ethylhexyl) sebacate (≥ 97.0%) (DOS), 2-nitrophenyl octyl ether (≥ 99.0%)
(NPOE), dipentyl phthalate (≥ 99.0%) (DPP), tris (2-ethylhexyl) phosphate (≥ 99.0%) (TBAI),
tetrabutylammonium bromide (≥ 99.0%) (TBAB), tetrabutylammonium chloride (≥ 99.0%)
(TBAC), N-(3-dimethylaminopropyl)-N′-ethylcarbodiimide hydrochloride (≥ 98.0%)
(EDC·HCl), poly (vinyl chloride) (high molecular weight) (PVC), and polyurethane (PUR) were
all obtained from Fluka (St. Louis, MO). Alizarin, tetrahydrofuran anhydrous (≥ 99.9%) (THF),
D-(+)-glucose (ACS Reagent Grade), dichloromethane (DCM), thionyl chloride (SOCl2),
pyridine (PY), and 2-propanol (IPA) (≥ 99.5%) were purchased from Sigma-Aldrich (St. Louis,
MO). 4-mercaptophenylboronic acid (90%), 3-octanone, polycaprolactone (PCL), octylamine
(99%) and 7, 8-dihydroxy-4-methylcoumarin (97%) were purchased from Aldrich (St. Louis,
MO). Octylboronic acid (> 97%) was obtained from Synthonix, Inc. (Wake Forest, NC).
Phosphate buffered saline (PBS) (1×, pH = 7.4) was purchased as a solution from Invitrogen
(Carlsbad, CA). N,N-dimethylformamide (≥ 99%) (DMF) and alizarin-3-methyliminodiacetic
acid were acquired from Sigma (St. Louis, MO). Poly(vinylidene chloride/acrylonitrile) (80:20)
(P(VDC/AN) was purchased from Polysciences, Inc. (Warrington, PA) and α,ω-dicarboxy
19

terminated poly(methyl methacrylate) (PMMA(COOH)2) was obtained from Polymer Source
Inc. (Montreal, Canada). Commercially available materials were used without further
purification.
Polymer Composition of the Optode. The optode from which the glucose sensors are made
contains five main components: a polymer, plasticizer, boronic acid derivative, a chromophore,
and an additive. The design of the sensor was obtained by optimizing each component. In all
cases, the basic polymer optode was made from the following components: 30 mg of polymer,
60 µL of plasticizer, a boronic acid derivative, an additive, and a chromophore (see Tables 2.1-
2.5). These materials were charged into a glass vial and then dissolved in 500 µL of THF. All
formulations listed in Tables 2.1 through 2.5 formed optodes. Formulations that did not form
optodes such as those containing poly(methyl methacrylate) have been excluded from the tables.
Of note, composition is reported in mass as is standard in optode formulations.
Chromophore Synthesis. Compound A was prepared by initially treating ARS with SOCl2 at
40 °C (Figure 2.2). After 65 hours, the reaction was cooled and PY and IPA were added directly
to the mixture. The flask was then heated at 65 °C for an additional 18 hours. Upon cooling
and removal of all volatiles, a brown powder was yielded. The crude product was used directly
without further purification.
Compound B was prepared via reacting EDC·HCl with alizarin-3-methyliminodiacetic
acid followed by the addition of octylamine at room temperature (Figure 2.3). After 12 hours,
solvents were removed and the crude product was used without further purification.
Macrosensor Response to Glucose. The fluorescence data was acquired on a Spectramax
Gemini EM microplate fluorometer (Molecular Device, Sunnyvale, CA). The excitation and
emission wavelengths for the chromophores are listed in Table 2.5. Optode (2 µL) from each
20
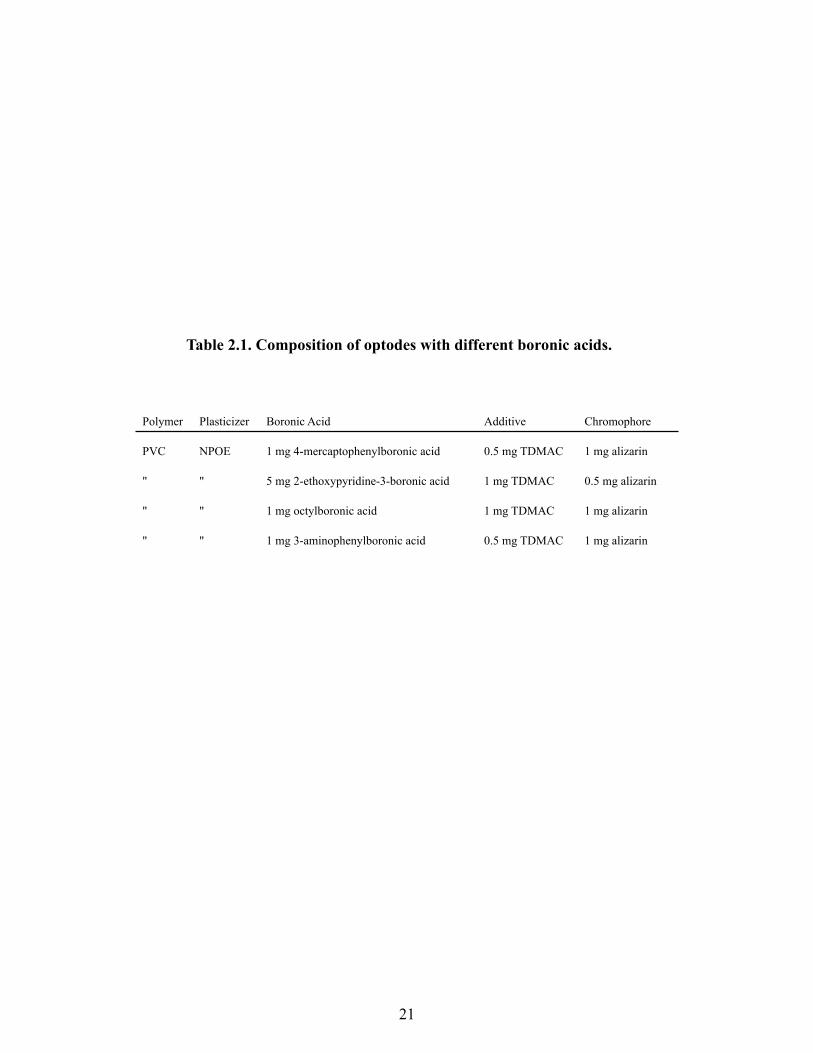
Table 2.1. Composition of optodes with different boronic acids.
Polymer Plasticizer Boronic Acid Additive Chromophore
PVC NPOE 1 mg 4-mercaptophenylboronic acid 0.5 mg TDMAC 1 mg alizarin
" " 5 mg 2-ethoxypyridine-3-boronic acid 1 mg TDMAC 0.5 mg alizarin
" " 1 mg octylboronic acid 1 mg TDMAC 1 mg alizarin
" " 1 mg 3-aminophenylboronic acid 0.5 mg TDMAC 1 mg alizarin
21

Polymer Plasticizer Boronic Acid Additive Chromophore
PVC NPOE 1 mg octylboronic acid 0.5 mg TBAC 1 mg alizarin
" " " 0.5 mg TBAB "
" " " 0.75 TBAI "
" " " 1 mg TDMAC "
Table 2.2. Composition of optodes with different additives.
22

Table 2.3. Composition of optodes with different polymers.
Polymer Plasticizer Boronic Acid Additive Chromophore
PVC-COOH DOS 3 mg octylboronic acid 4 mg TDMAC 1 mg alizarin
PVC " " " "
P(VDC/AN) " " " "
PMMA(COOH)2 " " " "
PCL " " " "
PUR " " " "
23

Table 2.4. Composition of optodes with different plasticizers.
Polymer Plasticizer Boronic Acid Additive Chromophore
PVC-COOH DOS 3 mg octylboronic acid 4 mg TDMAC 1 mg alizarin
" NPOE " " "
" DPP " " "
" 3-octanone " " "
" TEP " " "
24
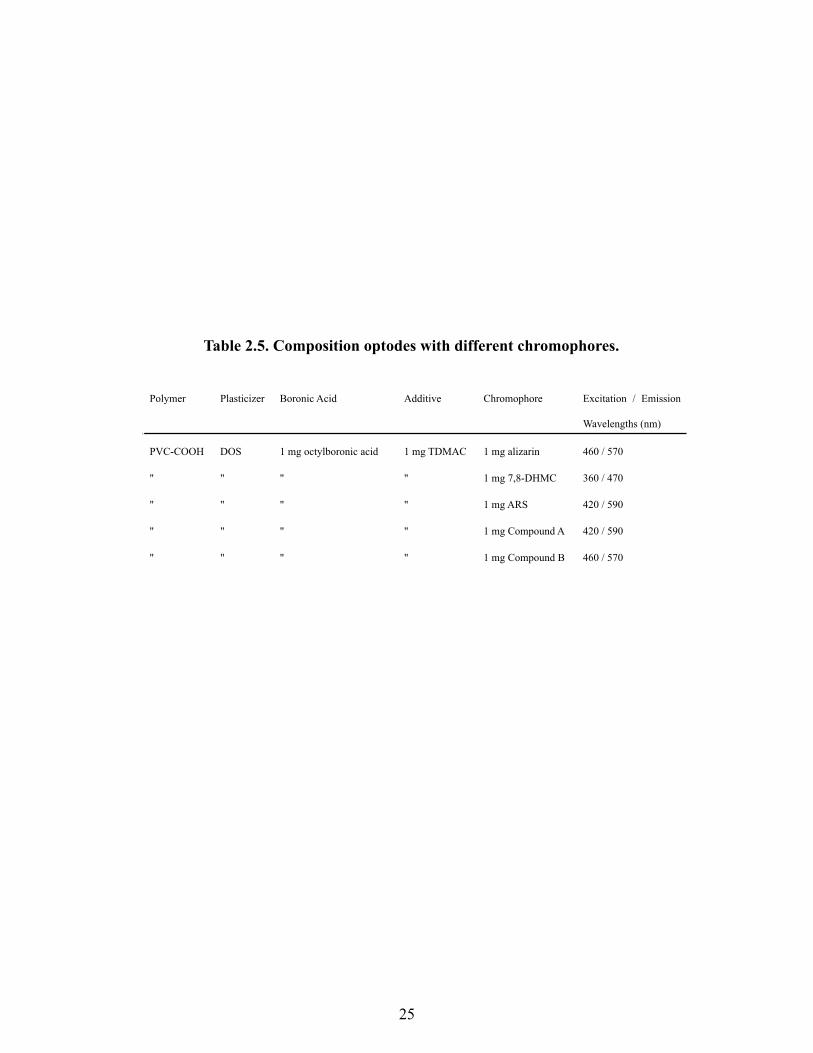
Table 2.5. Composition optodes with different chromophores.
Polymer Plasticizer Boronic Acid Additive Chromophore Excitation / Emission
Wavelengths (nm)
PVC-COOH DOS 1 mg octylboronic acid 1 mg TDMAC 1 mg alizarin 460 / 570
" " " " 1 mg 7,8-DHMC 360 / 470
" " " " 1 mg ARS 420 / 590
" " " " 1 mg Compound A 420 / 590
" " " " 1 mg Compound B 460 / 570
25

Figure 2.2. Synthesis of Compound A.
26
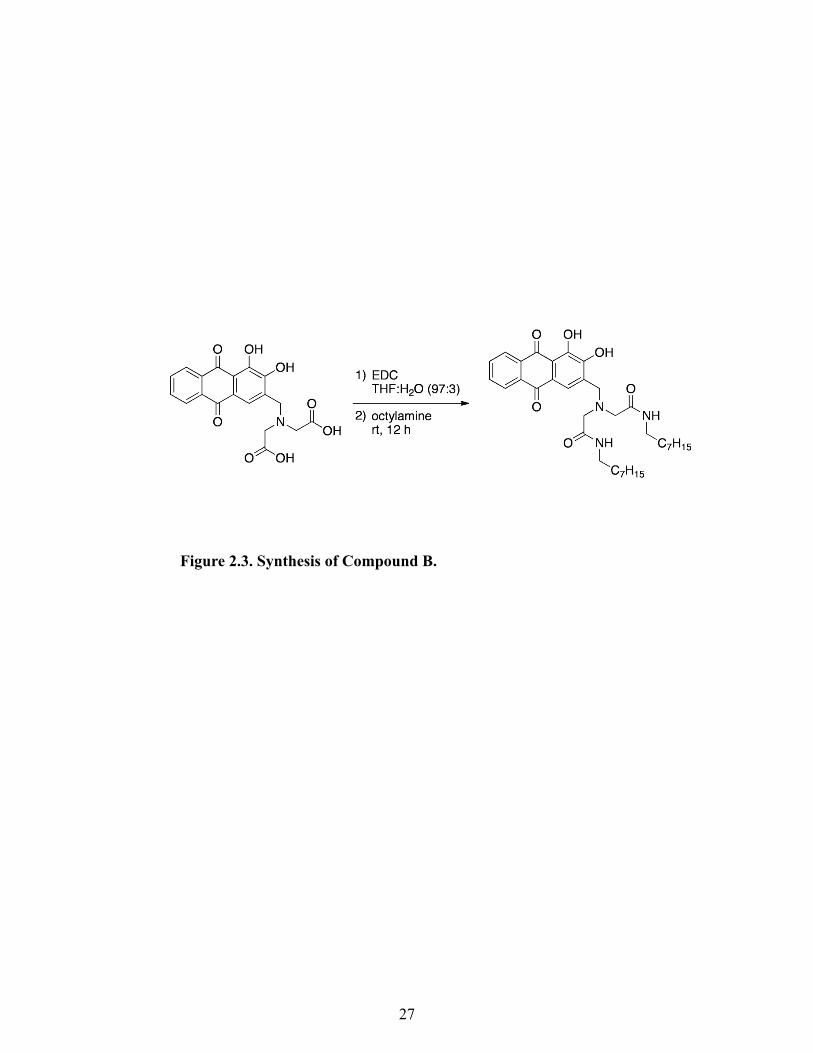
Figure 2.3. Synthesis of Compound B.
27

formulation listed above was pipetted onto a glass cover slip on the bottom of a 96-well optical
bottom well-plate. The optodes were allowed to dry for at least 15 minutes forming
macrosensors. After drying, each optode was hydrated in 200 µL of PBS (pH = 7.4) for at least 1
hour in order to equilibrate the sensors with the surrounding aqueous solution. After the optodes
were hydrated, the PBS solution was removed from all wells and 200 µL of 1 molar (M) (18,000
mg/dl) glucose in PBS (pH=7.4) was added to the experimental wells and 200 µL of fresh PBS
was added to the control wells. High glucose concentrations were used to obtain the maximum
fluorescence response from the sensors. Fluorescence measurements were taken with a 360 µs
acquisition time at a sampling rate of 13 acquisitions per hour. The fluorescence response of the
sensors was tracked for at least 60 minutes, at which time the fluorescence signal leveled off.10
At the end of this period, both the PBS and 1M glucose solution were removed and 200 µL of
fresh PBS was added to all wells. Fluorescence measurements were acquired again in 360 µs
acquisition times at a sampling rate of 13 acquisitions per hour. For each macrsosensor, an
average intensity was calculated from the final 2-3 intensity readings after the signal leveled off.
This average was normalized to the average intensity reading from the initial solution change.
By normalizing the intensities of each sensor, the responses between the control and
experimental wells and also between different sensor formulations can be compared. The
normalized values for each sensor were then averaged for both the control and glucose wells,
respectively. The percent change in fluorescence response was then determined as the difference
between the average normalized values. This value, which is typically negative, was inverted for
purposes of presenting a clear graphical representation of the data.
2.4 Results
28

Sensor Response and Reversibility. In our sensors, boronic acid derivatives are the main
recognition elements and are responsible for the dynamic fluorescence response to glucose. Due
to its importance, boronic acid selection was the starting point for the glucose sensor design.
Figure 2.4 shows the percent change in fluorescence response and reversibility for macrosensors
containing different boronic acids. Each sensor formulation showed a response to glucose. 2-
ethoxypyridine-3-boronic acid had the greatest percent change of 30.7 ± 0.6 %, but only sensors
with octylboronic acid demonstrated almost full fluorescence reversibility as their fluorescence
intensities recovered back to baseline after glucose was removed. Since octylboronic acid
yielded a response complying with the sensor mechanism, all further sensor formulations used
this boronic acid as the main sensing component.
Though octylboronic acid yielded a reversible fluorescence response to glucose, further
modifications to the design were necessary to increase the percent change in fluorescence upon
addition of glucose. We explored the use of several additives which could aid in the extraction
of glucose into the sensor. TBAC and TDMAC showed the two greatest responses to changes in
glucose concentrations with 10.8 ± 1.0 % and 11.3 ± 0.2 % decrease, respectively (Figure 2.5).
TDMAC with its extended carbon chains was selected as the additive because we speculated that
it would be less predisposed than TBAC to leach out of the sensor.
Fluorescence Intensity Optimization. Sensors composed of the traditional plasticized-PVC
based polymeric membrane yielded the desired response to glucose; however, these sensors
began to lose their fluorescence intensity immediately upon hydration (data not shown). Since
the octylboronic acid and alizarin combination followed the sensor mechanism, changing the
plasticized polymeric membrane was the initial method used to stabilize the fluorescence
intensity and improve sensor lifetime. Substituting PVC-COOH for PVC drastically improved
29

Figure 2.4. Reversibility of the glucose macosensors composed of different boronic
acids. Each cycle represents a time frame of at least 1 hour. The macrosensors
contained either 4-mercaptophenylboronic acid (n, ncontrol=7 and nglucose=7), 2-
ethoxypyridine-3-boronic acid (�, ncontrol=6 and nglucose=7), octylboronic acid (p,
ncontrol= 8 and nglucose=8), or 3-aminophenylboronic acid (t, ncontrol=8 and nglucose=8).
30
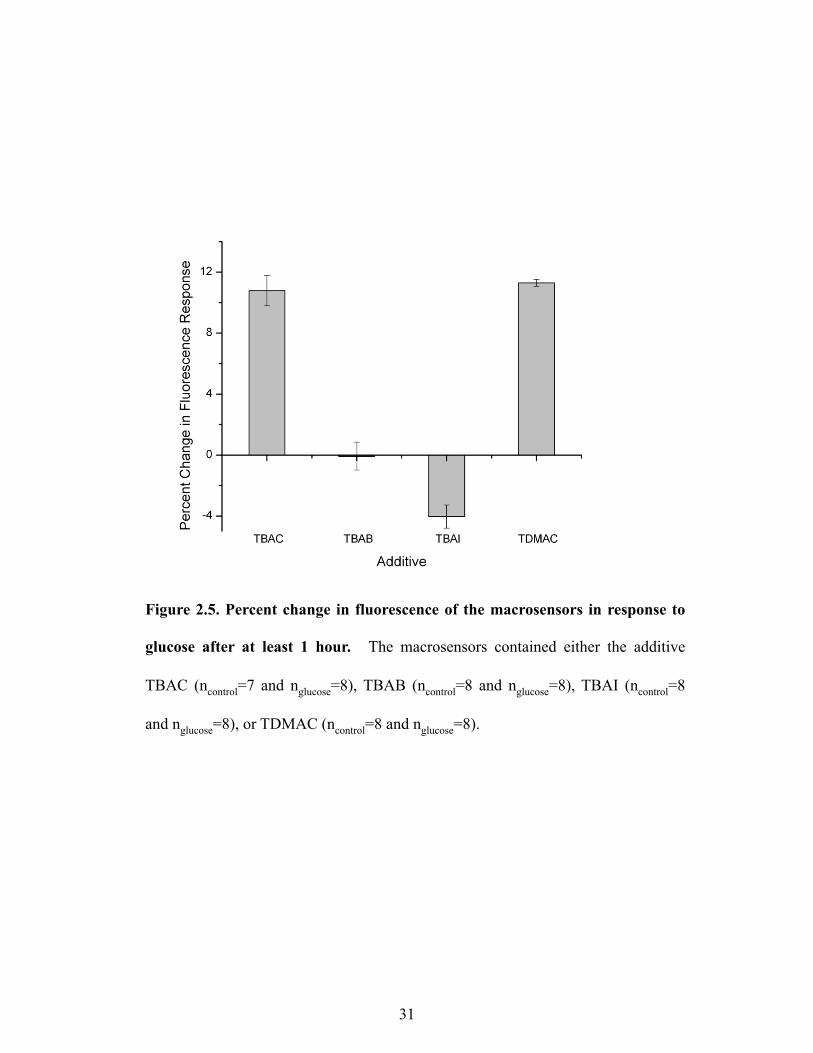
Figure 2.5. Percent change in fluorescence of the macrosensors in response to
glucose after at least 1 hour. The macrosensors contained either the additive
TBAC (ncontrol=7 and nglucose=8), TBAB (ncontrol=8 and nglucose=8), TBAI (ncontrol=8
and nglucose=8), or TDMAC (ncontrol=8 and nglucose=8).
31
sensor lifetime. These sensors not only maintained their fluorescence intensities for up to 18
hours (data not shown), but they also yielded the greatest response (10.8 ± 0.4 %) to glucose
after this time period (Figure 2.6). In contrast to changing the polymer, dramatic differences in
response were not seen with a variety of plasticizers (Figure 2.7); however, DOS was chosen as
the plasticizer because it yielded the greatest relative change.
Similar to the selection of the boronic acid, proper selection of the fluorescent indicator
or chromophore is important because of the role it plays in the sensing mechanism. Alizarin’s
fluorescence response was sufficient for the purpose of optimizing the other sensor components
on the macroscale, but significant loss of fluorescence intensity occurs during sensor
miniaturization. Therefore, hydrophobic high quantum yield fluorescent indicators are
ultimately desired for sensor miniaturization. Alizarin derivatives and other diol chromophores
were substituted for alizarin in the sensor formulation and were evaluated for maximum glucose
response and maximum fluorescence intensity (Figure 2.8). Macrosensors with alizarin still had
the greatest response to glucose with a percent change of 21.1 ± 0.6 %.
2.5 Discussion
For an effective in vivo glucose monitoring tool, the sensors must (1) be reversible in
order to measure dynamic changes in glucose concentration, (2) be sensitive to small changes in
glucose concentrations, (3) have a red shifted, high fluorescence intensity that can be measured
through the skin, and (4) have hydrophobic components that will not leach out of the sensor.
These four parameters were considered for each screened sensor formulation; however,
particular parameters were emphasized depending upon the sensor component being tested.
32
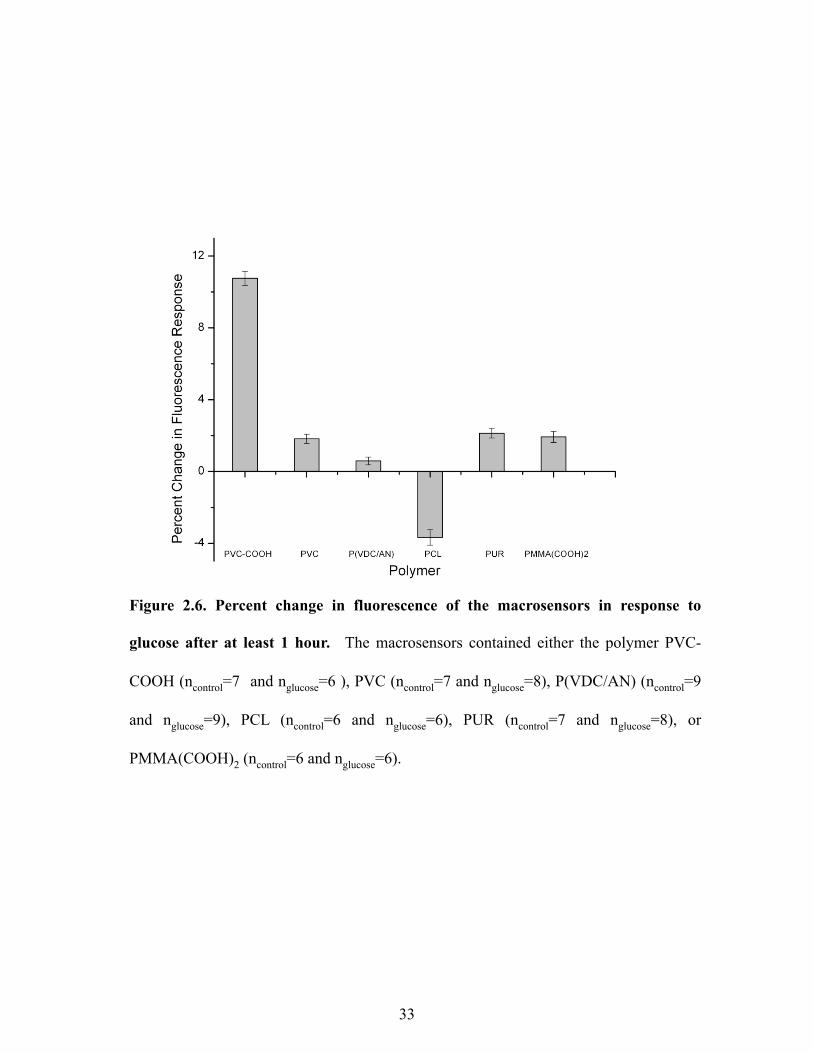
Figure 2.6. Percent change in fluorescence of the macrosensors in response to
glucose after at least 1 hour. The macrosensors contained either the polymer PVC-
COOH (ncontrol=7 and nglucose=6 ), PVC (ncontrol=7 and nglucose=8), P(VDC/AN) (ncontrol=9
and nglucose=9), PCL (ncontrol=6 and nglucose=6), PUR (ncontrol=7 and nglucose=8), or
PMMA(COOH)2 (ncontrol=6 and nglucose=6).
33

Figure 2.7. Percent change in fluorescence of the macrosensors in response to 1 M
Glucose in PBS after at least 1 hour. The macrosensors contained either the plasticizer
DOS (ncontrol=7 and nglucose=6), NPOE (ncontrol= 8 and nglucose=8), DPP (ncontrol=8 and
nglucose=8), 3-octanone (ncontrol=8 and nglucose=8), or TEP (ncontrol=8 and nglucose=8).
34

Figure 2.8. Percent change in fluorescence of the macrosensors in response to glucose
after at least 1 hour. The macrosensors contained either the chromophore alizarin
(ncontrol=4 and nglucose=3), ARS (ncontrol=8 and nglucose=8), 7, 8-DHMC (ncontrol=3 and
nglucose=3), Compound A (ncontrol=8 and nglucose=8), or Compound B (ncontrol=8 and nglucose=8).
35

As is shown in Figure 2.4, all the boronic acids bound glucose causing a decrease in
fluorescence intensity but only sensors with octylboronic acid recovered their fluorescence
intensity fully. The inability of these sensors to yield a reversible response may have been a
result of leaching of the sensor components, as was the case for the hydrophilic molecule, 2-
ethoxypyridine-3-boronic acid. This point emphasizes that hydrophobic components are
essential for proper sensor function.
The sensitivity of the sensors can be improved through effective extraction of glucose
into the sensor. In previous work on ion-selective optodes, the selectivity for specific analytes
relied on the proper choice of the sensing molecule and the additive was included only to
maintain electroneutrality.25 In the case of the glucose sensors, the additive was used to aid in
the phase transfer of glucose into the sensor. Additives based on tetraalkylammonium salts,
especially quaternary ammonium chloride salts, have been shown to be effective in extracting
saccharides from the aqueous phase into plasticized polymeric membranes.38,39 Our results
support these previous findings with sensors containing additives, TBAC or TDMAC, yielding
the greatest percentage change in fluorescence intensity.
The response and lifetime of the sensors was improved by exploring different polymers.
Substituting PVC-COOH for PVC stabilized the fluorescence signal while still generating a
response to glucose. We theorize that the carboxyl groups help to maintain alizarin within the
sensor and aid in the extraction of glucose. The mechanisms governing this and how the
plasticizer, DOS, caused a greater sensor response is currently under investigation.
The chromophore also plays a critical role in the sensor mechanism and response.
Previous research discussed above has shown that ARS can competitively bind with boronic
acids in the presence of sugars.33-35 We explored using ARS as well as hydrophobic analogs of
36
this chromophore that could be maintained within the sensor. Sensors containing alizarin
demonstrated the greatest percent change in fluorescence when in the presence of glucose and
their fluorescence intensity remained stable over time. Other important selection criteria for the
chromophore were that sensors had to have high fluorescence intensity and an emission spectrum
in the near-infrared for optimal imaging of the sensors efficiently above the auto-fluorescence of
the skin.40 For example, 7, 8-DHMC yielded significantly higher fluorescence intensities than
alizarin, but its spectrum is blue-shifted, making it difficult for in vivo imaging. Alizarin’s
emission spectrum is centered around 570 nm, and we have demonstrated previously that these
sensors can be imaged above the auto-fluorescence of mice skin.10
Proper selection of the sensor components not only determines the sensor functionality,
but also extends sensor lifetime and stability. In order to achieve these, a major theme
throughout the design process was the selection of hydrophobic sensing components which can
be maintained within the sensors. After PVC-COOH was incorporated into the sensor, leaching
was reduced in the macrosensors. However, miniaturization of the sensors into nano-optodes
accelerates component leaching because of the increase in the surface area to volume ratio of the
nano-optodes.9 This leaching results in decreased sensitivity and eventual loss of sensor
functionality.24 As can be seen from the selection of the sensor components, they all exhibit
some degree of hydrophobicity, but exploring more hydrophobic components would likely
improve sensor lifetime in vivo.
2.6 Conclusions
Glucose macrosensors based on ion-selective optode technology were designed that are
capable of monitoring dynamic changes in glucose levels. We have chosen the sensor
37

components primarily based on their ability to improve sensor response and fluorescence
reversibility. The sensor formulation containing octylboronic acid, alizarin, TDMAC, DOS, and
PVC-COOH fulfilled these design criteria and from this optode formulation, glucose nano-
optodes were developed and tailored to respond within the physiological range.10 Furthermore,
the nano-optodes from this formulation were able to track changes in glucose levels in vivo.10
These results are promising but further optimization of the sensors such as incorporating an
internal reference dye, improving sensor sensitivity, and enhancing sensor biocompatibility are
crucial developmental steps toward ultimate use in a clinical setting.
This chapter is adapted with permission from (M. K. Balaconis, K. Billingsley, J.M. Dubach, K.
J. Cash, H. A. Clark, The Design and Development of Fluorescent Nano-Optodes for in Vivo
Glucose Monitoring. Journal of Diabetes Science and Technology 5, 68 (2011)). Copyright
(2011) Journal of Diabetes Science and Technology.
2.7 Acknowledgements
This work has been supported by the National Institutes of Health under award number RO1
GM084366 and by the Internal Research and Development funding from the Charles Stark
Draper Laboratory. We would like to thank Kristi Shrestha and Michaela Meister for their
assistance during the screening process.
38

Chapter 3: In Vitro Characterization and In Vivo Demonstration of Glucose-
Sensitive Nanosensors
3.1 Chapter Overview
We have designed fluorescent nanosensors based on ion-selective optodes capable of
detecting small molecules. By localizing the sensor components in a hydrophobic core, these
nanosensors are able to monitor dynamic changes in concentration of the model analyte,
glucose. The nanosensors demonstrated this response in vitro and also when injected
subcutaneously into mice. The response of the nanosensors tracked changes in blood glucose
levels in vivo that were comparable to measurements taken using a glucometer. The
development of these nanosensors offers an alternative, minimally-invasive tool for
monitoring glucose levels in such fields as diabetes research. Furthermore, the extension of
the ion-selective optode sensor platform to small molecule detection will allow for enhanced
monitoring of physiological processes.
3.2 Introduction
The introduction of fluorescent nanosensors, or PEBBLEs, made possible the
intracellular analysis of a range of analytes which was previously impractical with molecular
indicators. Based on ion-selective optode technology, nanoscale PEBBLEs were produced that
could measure a large host of physiological parameters, including sodium, potassium and
chloride.26,27,29,30,41,42 Further refinements of the sensors led to better stability and biocompatibility
necessary for intracellular measurements.9
39

Extending this nanosensor approach beyond detection of ions to small molecules has
several limitations. Recognition elements for small molecules are traditionally based on
biological reagents, such as enzymes (e.g. glucose oxidase43,44 or urease45) or non-enzymatic
proteins (e.g. antibodies or Concanavalin A22). Although these sensors function adequately when
applied on large length scales, when the size of theses sensors is radically scaled down,
shortened lifetimes can occur due to regional depletion of resources, such as oxygen in the case
of glucose oxidase function.43,44 In addition, since a limited number of biological elements are
contained in the small sensor volume employed, any degradation greatly diminishes the function
of the sensor.
When encapsulating an enzyme, the choices of polymeric shells are limited to hydrophilic
components, such as hydrogels, in order to maintain function. As shown with ion-selective
optodes, though, there are several advantages to using a lipophilic system for nanosensor
development. First, it greatly expands the range of measurable analytes by enabling the use of a
wider variety of chemistries. Second, by separating all of the lipophilic molecular components in
the nanosensors from the bulk, aqueous solution, non-specific binding to proteins can be
reduced.29 Third, the lipophilic core maintains these components at the proper concentrations
leading to improved lifetime and stability of the nanosensors.9 Fourth, keeping the component in
close proximity allows a completely reversible response of the nanosensors to dynamic changes
in ion or small molecule concentration. Finally, the lipophilic environment makes possible an
easily functionalized and tunable system. By adjusting the concentration of molecular
components, the nanosensors can be tuned to respond within the ideal dynamic range and due to
the ease of adding biocompatible surface coatings, these nanosensors can be made compatible
with an intracellular environment and experience minimal aggregation.9,32
40

Building on this lipophilic nanoscale platform, we introduce the first example of this class
of optode-based nanosensor for small molecule recognition utilizing non-biological components.
As a model analyte we demonstrate the detection of glucose. The nanosensor responds to
glucose through the use of lipophilic boronic acid (BA) derivatives which have been extensively
characterized as glucose recognition molecules.36,46 Other researchers have exploited the affinity
of BA for glucose to design a variety of glucose sensors. Asher et al., for example, have
developed photonic crystals that swell in the presence of glucose.19,20,47 Through measuring the
light diffraction properties of the crystal, the glucose concentration can be inferred. Our
chemistry, however, relies on a competitive binding mechanism between a lipophilic BA and a
chromophore, alizarin.33,48 Glucose is reversibly extracted into the sensor by a BA in a similar
fashion as previously reported for ion-based sensors.9 As depicted in Figure 3.1, alizarin, a non-
fluorescent compound, reacts with a BA to produce a boronate ester, 1. Importantly, 1 is highly
fluorescent and favored in the chemical equilibrium; therefore, the dissociation of 1 can be
monitored by the loss of fluorescence intensity. When glucose is introduced into the
equilibrium, a shift from the fluorescent species, 1, to glucose-derived boronate ester, 2, and non-
fluorescent alizarin is observed. Therefore, the change in fluorescence intensity corresponds to
the glucose concentration. A similar scheme has been used by James and Fossey to detect
glucose using a solution phase assay and hydrogels, respectively.33,35 However, as previously
mentioned, our system entraps the sensor components within the lipophilic core maintaining
these components at the ideal sensing ratio.
Glucose plays a critical role in the body’s metabolism and dysfunction of glucose
handling from insulin deficiency or resistance can lead to diabetes. Thus, the detection and
monitoring of glucose has been the focus of diabetes-related research and technology. For this
41

Figure 3.1. Chemical equilibrium of boronate formation between a boronate ester, 1, and
glucose to form a glucose-derived boronate ester, 2.
42

reason, glucose was chosen as the model analyte for our nanosensor because of the applicability
of the nanosensors as both a research and diagnostic tool.
3.3 Materials and Methods
Materials. Poly(vinylchloride) carboxylated (>97% GC), bis-(2-ethylhexyl)sebacate,
tridodecylmethylammonium chloride and alizarin were purchased from Fluka (St Louis, MO,
USA). D-(+)-glucose (ACS reagent grade), uric acid (≥ 99%, crystalline), acetaminophen (≥
99%) and L-ascorbic acid (≥ 99%, crystalline) were obtained from Aldrich Chemical Co (St
Louis, MO, USA). Octylboronic acid(>97%)and1,2-distearoyl-sn-glycero-3-
phosphoethanolamine-N-[methoxy(polyethylene glycol)-550] (PEG lipid) in chloroform (10
mg/ml) were acquired from Synthonix (Wake Forest, NC, USA) and Avanti Polar Lipids, Inc.
(Alabaster, AL, USA), respectively. Phosphate Buffered Saline (PBS) (1x, pH = 7.4) was
purchased as a solution from Invitrogen (Carlsbad, CA, USA). Tetrahydrofuran (≥ 99%) (THF)
was acquired from Sigma (St Louis, MO, USA). Chloroform (HPLC grade) was purchased from
JT Baker (Phillipsburg, NJ, USA). Commercially available materials were used without further
purification. CD1 mice were obtained from Charles River Laboratories International, Inc
(Wilmington, MA, USA) and weighed 20-25 g.
Polymer Composition of the Optode. The polymer optode was made from the following
components: 30 mg high molecular weight carboxylated poly(vinylchloride), 60 μl bis-(2-
ethylhexyl)sebacate, 3.0 mg octylboronic acid, 4.0 mg tridodecylmethylammonium chloride, and
1.0 mg alizarin. These materials were charged into a glass vial and then dissolved in 500 μl THF.
The vial was vortexed and the resulting optode was an orange solution.
43

Calibration of the Macrosensor. Data was acquired in a Spectramax Gemini EM microplate
fluorometer (Molecular Devices, Sunnyvale, CA, USA). Optode (2 μl) from a bulk batch
containing four times each of the components listed above was pipetted into 33 wells of a 96-
well optical bottom plate each containing a glass cover slip. The optodes were then allowed to
dry at least 15 minutes forming macrosensors. Each optode was hydrated in 200 µL PBS
(pH=7.4) for at least 4 hours until the fluorescence signal stabilized. At the end of this period,
the PBS solution was removed and another 200 µL of fresh PBS was added to the wells. After
40 minutes, an endpoint measurement was collected via exciting at 460 nm and emitting at 570
nm with a cutoff of 515 nm. The PBS solution was then replaced with 200 μl of 1 mM glucose
in PBS (pH = 7.4). The optodes were allowed to equilibrate for 40 minutes, followed by an
endpoint measurement. The process was repeated for 2 mM, 3 mM, 5 mM, 8 mM, 10 mM, 25
mM, 50 mM, 100 mM, 500 mM, and 1 M glucose in PBS. Response was determined by
expressing the data as α = (Imax – I)/( Imax – Imin). I is the intensity at the given glucose
concentration, Imin is the intensity at the minimum signal, and Imax is the intensity at the maximum
signal. A sigmoidal curve was fitted to the plot of α vs. log [glucose concentration] Molar using
Origin software (Northampton, MA, USA). The Kd, center of the dynamic range, was
determined as the glucose concentration where α is equal to 0.5 on the calibration curve.
Furthermore, the sensitivity of the sensors was calculated from the slope of the linear region of
the sigmoidal curve.
Reversibility of the Macrosensor. Macrosensors of a single optode batch were prepared by the
procedure described above using 16 wells. After the optodes were hydrated, the PBS solution
was removed from all wells and 200 μl of 1 M glucose in PBS was pipetted into 8 wells. The
remaining 8 wells acted as controls and contained fresh glucose-free PBS. In order to track the
44
changes in the fluorescence response, measurements were acquired at a sampling rate of 5
minutes for 60 minutes. Then, all solutions (glucose and control) were removed and 200 μl of
fresh PBS was added to all wells. Again, measurements were obtained every 5 minutes for 60
minutes. An additional cycle was performed to yield a total experiment time of 4 hours.
Response was determined by the percent difference between the average intensity of the glucose
and control. Figure 3.1C was generated by averaging the fluorescence intensity of the individual
macrosensors for the three time points prior to a solution change. These values were then
standardized and the percent change was calculated as the difference between the average
standardized intensity of the glucose and control. The error was generated from the raw intensity
values using the laws of error propagation.
Effects of Interferents. Calibration of the macrosensors was performed as described above with
PBS and glucose solutions that contained either no interferent, uric acid (20 mg/dl), ascorbic acid
(3 mg/dl) or acetaminophen (20 mg/dl).49 The glucose concentrations used in the calibration
were 0 mM, 1 mM, 3 mM, 5 mM, 10 mM, 25 mM, 50 mM, 100 mM, and 1M. Response was
compared by fitting a sigmoidal curve to the plot of α vs. log [glucose concentration] Molar for
each interferent using Origin software.
Nanosensor Fabrication. The optode was allowed to dry on a glass surface for at least 4 hours.
The optode film was removed and transferred to a glass vial. The vial was then charged with 5
ml of PBS and 5 mg of surface modifier, 1,2-distearoyl-sn-Glycero-3-Phosphoethanolamine-N-
[Methoxy(Polyethyleneglycol)-550] (PEG lipid), in 0.5 ml chloroform. This solution was
sonicated with a probe-tip sonicator (Branson, Danbury, CT, USA) at 40% amplitude for 3
minutes. The residual polymer was discarded to yield the nanosensor solution.
45
Particle Sizing and Zeta Potential. Particle size and zeta potential of the nanosensors were
determined using a nanosizer (Nano Series ZS90, Malvern, Worcestershire, UK). Data was
acquired for nanosensors made on five different days. A minimum of five runs was performed
for each fabrication. The average and standard deviation of measurements were then calculated
(n = 31). The reported size is the Z-Average or the “cumulants mean” which is an intensity mean
of the nanosensors.50
Spectrum of Nanosensors. Data was acquired in a Spectramax Gemini EM microplate
fluorometer (Molecular Devices) by exciting at 460 nm and scanning the emission from 510-690
nm. 100 μl of nanosensors in PBS was pipetted into 8 wells of a 96-well optical bottom plate.
Glucose in PBS was added to each well to bring final concentrations to 0 mM, 0.5 mM, 5 mM,
15.8 mM, 50 mM, 158 mM, 0.5 M or 1 M. This process was repeated in quadruplicate for each
glucose concentration with each well having equivalent volume.
Calibration of Nanosensors. Data was acquired in a Spectramax Gemini EM microplate
fluorometer exciting at 460 nm and emitting at 570 nm with a cutoff of 515 nm. 60 μl of
nanosensors in PBS was pipetted into 12 wells of a 96-well optical bottom plate. Glucose in
PBS was added to each well to bring final concentrations to 0 mM, 0.5 mM, 1 mM, 1.5 mM, 2.5
mM, 4 mM, 5 mM, 12.5 mM, 25 mM, 50 mM, 250 mM, and 500 mM glucose. This process was
repeated in quadruplicate for four sets of glucose nanosensors at each glucose concentration with
each well having equivalent volume. This process was repeated at 4 and 8 hours after sensor
fabrication in order to determine the lifetime of the sensors. Response was determined by
expressing the data as α = (Imax – I)/( Imax – Imin). The error for α was calculated from the raw
fluorescence intensity values using the laws of error propagation. A sigmoidal curve was fitted to
the plot of α vs. log [glucose concentration] Molar using Origin software.
46

Leaching of Nanosensors. Data was acquired in a Spectramax M2 fluorometer (Molecular
Devices) exciting at 460 nm and emitting at 570 nm with a cutoff of 515 nm. 500 μl of
nanosensors in PBS mixed with an additional 500 µL of PBS was placed in a cuvette. The
intensity of the nanosensors was tracked every 10 minutes for approximately 17 hours. The
intensity was normalized to its initial value in order to get the percent change over time.
Photobleaching of Nanosensors. Optical data was collected on an IVIS® 200 (Caliper,
Hopkington, MA, USA) in vivo animal imager with both excitation and emission filters set to
GFP. Three 1 µl spots of nanosensors were placed on a glass microscope slide and imaged every
2 minutes for 94 minutes. The average efficiency for each spot was standardized to the time
after the spots had dried. The standardized average efficiency was tracked over time in order to
determine the effects of photobleaching.
In Vivo Studies. Optical data was collected with the IVIS® Spectrum (Caliper, Hopkington,
MA, USA) in vivo animal imager. Each mouse was shaved and then fasted for 18 hours. Four
mice (two glucose and two controls) were employed in each experimental run. Mice were
anesthetized with 3% isoflurane in oxygen. Blood glucose measurements from the tail of each
mouse were taken with a LifeScan OneTouch® Ultra® (Langhorne, PA, USA) glucose meter
and corresponding test strips prior to injection of the nanosensors. Then, 10 µl of the
nanosensors were injected into the subcutaneous region at four locations along each of their
backs. All four mice were simultaneously imaged every 2 minutes for 15 minutes. Excitation
and emission wavelengths were chosen as 500 and 600 nm, respectively, based on the available
filter sets on the IVIS® Spectrum. At this point, a second blood measurement was taken with
the glucometer prior to oral gavage. Then, the two control mice were administered an oral
gavage of 300 µl saline, and the two glucose mice were administered 300 µl of saline containing
47

glucose (3 g/kg). Glucose administration through oral gavage has been shown in previous mice
studies to produce a systemic rise in blood glucose levels51 and was covered under the approved
animal protocol. All four mice were simultaneously imaged every 2 minutes for 10 minutes.
Then, another blood measurement was taken with the glucometer. The same cycle of imaging
followed by blood glucose measurement was repeated until a total of 6 cycles had been
performed. This process was repeated to obtain an n = 4 for both the control and glucose.
At the point of oral gavage, the percent change of optical intensity was set to 0%. Any
loss of optical intensity detected in the control mice was determined to be diffusion of the
nanosensors away from the point of injection. The optical data collected from each glucose
mouse was normalized versus the control mice signal in order to accurately estimate the percent
change attributable to glucose and account for the effect of diffusion on signal loss. A plot of the
percent optical change and blood glucose measurements versus time for each mouse is shown in
Figure 3.6.
In order to correlate the percent optical change from the nanosensors with blood glucose
measurements, the average percent intensity change was determined for each blood glucose
reading by averaging the two optical intensities closest to the reading. The percent optical
change before and after blood readings was averaged for measurements obtained during the
experiment. The initial and end blood measurements were correlated to the two points after and
before blood readings, respectively. A line was fitted to the xy-scatter plot of percent optical
change data points vs. glucose concentration for each mouse using Origin software. The fitted
line provided a calibration between the optical response of the nanosensors and the blood glucose
concentration for each mouse. In order to compare the calibrations among the experiments, the
glucose concentration for each optical data point was determined from the equation of the fitted
48

line for each mouse. An xy-scatter plot of the glucose concentration from the optical data vs.
measured blood glucose readings for all mice is shown in Figure 3.3C. A line was fitted to this
plot using Origin software. The correlation coefficient from this plot describes the variability
among these data points and the four calibrations.
3.4 Results And Discussion
Macrosensor Development. The development of the glucose-sensitive nanosensors first begins
on the macro-scale so that the optimal sensor formulation is determined prior to nanosensor
fabrication. The sensor matrix consists of plasticized poly(vinylchloride) carboxylate,
octylboronic acid, alizarin and the ionic additive, tridodecylmethylammonium chloride. The
sensor components are dissolved in THF creating an optode. Through optimization of these
molecular components and their respective ratios, an optical macrosensor was developed to
respond to glucose in the physiological range (1-25 mM).52 As depicted in Figure 3.1A, the
fluorescence response of the macrosensor was measured from low (1 mM) to high (1 M) levels
of glucose. The dissociation constant (Kd) for the macrosensor was determined to be 19 mM by
sigmoidal curve fit analysis. The linear region of the curve encompasses the physiological range
where the sensors have a sensitivity of 0.2 mM per percent change of fluorescence intensity. We
also measured macrosensor response to glucose in the presence of common interferents of
electrochemical reactions that produce falsely high readings for numerous enzyme-based
sensors.49 These compounds, uric acid, ascorbic acid and acetaminophen did not result in
statistically significant differences in the response (Figure 3.1B). Boronic acids are known to
bind to diols such as nucleotides and saccharides,36,46,53 but the interference of other sugars such
as fructose and galactose was not measured because of their low concentration (<1 mM54) found
49

Figure 3.2. Response of optical macrosensor to glucose. (A) Calibration curve and (B)
effects of chemical interferents on the calibration. Mean ± SD (n = 24) for A and mean ±
SD (ncontrol = 9, nascorbic acid = 8, nuric acid= 9, nacetaminophen = 8) for B is shown. There was no
statistically significant difference in response to these common interferents with p > 0.01
when compared to the control at each concentration. (C) Reversibility of the response to
glucose. Percent change refers to the loss of fluorescence intensity exhibited by
macrosensor when exposed to 1M glucose in PBS versus control (PBS) (ncontrol=7 and
nglucose=6).
50

at physiological conditions which is below the dynamic range of our sensor formulation.
Furthermore, we assessed the macrosensor response from pH 6.8 to 7.8 due to its physiological
relevance (blood pH=7.455) and found no statistical difference in response within this range (p >
0.05, data not shown). The macrosensor response would be expected to shift at more acidic and
basic pHs due to alizarin’s pKas at 6.2 and 11.156; however, this pH range was not analyzed since
these values fall outside the relevant physiological range. In addition, the response of the
macrosensor to glucose proved to be reversible (Figure 3.1C). This cycle of response and
recovery could be repeated multiple times with only slight loss of response. Due to the size of
the macrosensor, the response was measured over one hour. This response time is approximately
3 times longer than sodium macrosensors (data not shown). Miniaturizing the sodium sensors to
the nanoscale reduces the estimated response time to microseconds.9 Thus miniaturizing the
glucose macrosensors to the nanoscale should result in a response time on the order of at least
seconds which would be acceptable for a monitoring device.
Nanosensor Development. Nanosensors were constructed through rigorous sonication of a
mixture containing dried optode, PBS, and PEG-lipid surface modifier dissolved in chloroform.
The modifier is an amphiphilic molecule that readily inserts into the hydrophobic sensor, leaving
the hydrophilic, biocompatible component on the outside of the nanosensor exposed to the
aqueous environment. This coating stabilizes the nanosensors in solution and imparts
biocompatibility.9 The average size of the nanosensors was 74.2 nm ± 39.8 nm, as measured
with a Nano Series ZS90 particle sizer (Malvern, Worcestershire, UK).
The response of the nanosensors to glucose was initially examined in a well plate, and a
wide dynamic range was observed (Figure 3.2). As can be seen, even at high concentrations of
glucose, saturation of the signal was not possible. The sensors had a measured Kd and sensitivity
51

of 38 mM and 2 mM, respectively. The nanosensors still responded within the physiological
range, but suffered some loss of sensitivity due to the miniaturization process. The response of
the nanosensors to glucose was also monitored over time. Minimum differences were observed
between the 0 hour and 4 hour calibrations, but a slight shift in nanosensor response was seen
after 8 hours (Figure 3.2). The slight shift in response could be due to the gradual leaching of
sensor components caused by the increased surface area to volume ratio of the sensors.
In Vivo Response of Nanosensors. The glucose-sensitive nanosensors were evaluated in vivo by
tracking the qualitative changes in blood glucose levels, measured with a glucometer, against the
optical response of the nanosensors. Mice were anesthetized then injected subcutaneously with
nanosensors in PBS along the back (Figure 3.3A). Images were taken for 15 minutes to establish
a baseline fluorescence intensity. During this time, a decrease in fluorescence intensity was
observed, which was attributed to the equilibration of the sensors with the resting glucose levels
of the mice and sensor diffusion away from the injection site. Though we could not quantifiably
monitor fluorescence staining due to the optical resolution of the instrument, we believe that the
sensors diffused into the blood stream. To account for sensor diffusion away from the point of
injection, all mice were paired with controls (no oral glucose). Blood glucose measurements
were taken from the tail vein and analyzed with a LifeScan OneTouch® Ultra® glucometer. The
LifeScan OneTouch® Ultra® glucometer has been FDA-approved for measuring glucose levels
in diabetic care.57 After baseline was established, mice were given an oral gavage of either saline
(control) or glucose solution. This method of administering glucose has been shown effective
for increasing blood glucose levels in mice.51 Optical measurements were subsequently taken
every 2 minutes for a 10 minute span followed by a blood glucose reading. This cycle of optical
and blood measurements was conducted for one hour after glucose gavage.
52

Figure 3.3. Response of optical nanosensors to glucose in PBS. Calibration curve of
the nanosensors at 0, 4, and 8 hours. Average of quadruplicate samples from four
independent samples.
53

Figure 3.4. In vivo response of nanosensors to glucose. (A) Image of mouse injected at four
locations with glucose-sensitive nanosensors. Image was obtained with an IVIS®-Spectrum
imaging system. Excitation and emission wavelengths were 500 nm and 600 nm, respectively.
Intensity bar displays the normalized fluorescence efficiency, which represents the fractional ratio
of fluorescent emitted photons per incident excitation photon. Residual background fluorescence
was attributed to remaining fur. (B) The representative response to oral gavage of the blood
glucose (red) and fluorescence of the glucose nanosensors (black). Mean ± SD for one mouse is
shown. (C) Correlation in vivo between optical response of nanosensors and blood measurements.
Glucose concentration from optical data vs. blood glucose is shown for all mice (n = 4). Error bars
are omitted for clarity. A line was fitted to the plot (slope = 1.0, R2 = 0.75).
54

Figure 3.3B displays the optical response and blood measurements for an individual
mouse over the course of an experiment. The sensor response correlated with blood glucose
readings, and this relationship was maintained over the course of analysis. Both monitoring
methods initially detected a significant increase in glycemic levels due to the glucose gavage.
The glucose levels eventually stabilized, presumably as the mouse produced an endogenous
insulin response to the elevated glucose levels. The nanosensors demonstrated a rapid response
to variations in glycemic levels, which is an inherent feature of the chemical equilibrium
established in our sensor design. This attribute of the nanosensors allowed for a more continuous
glucose analysis than the single-point measurements. The nanosensors tracked blood glucose
concentrations from 66 mg/dl, 3.7 mM, to 427 mg/dl, 23.7 mM. The large error bars for the
optical response could be due to the injection technique and biological variation such as the
metabolic rate for each mouse. No error bars are present for the blood glucose measurements as
only one blood sample was taken each sequence because of blood volume limitations in mice.58
The correlation between optical response and blood measurements was consistent for each
mouse examined in the study (Figure 3.6). Although the upper detection limit of the blood
glucose monitor is 600 mg/dl, higher glycemic levels are capable of being optically detected as
shown in Figure 3.2.
The in vivo measurements for all mice were correlated to confirm the relationship
between optical response and blood glucose concentration in each experiment. The average
percent intensity change was determined for each blood glucose reading. For each mouse, a
linear relationship between optical and blood glucose was obtained (data not shown). The
calibration for each mouse was then used to determine the calculated glucose concentration from
the optical data at the time of each blood measurement. Figure 3.3C displays the xy-scatter plot
55

Figure 3.5. (A) Emission spectrum of alizarin at various glucose concentrations (n=4 for each
concentration). (B) Leaching of the glucose-sensitive nanosensors over approximately 17 hours.
(C) Photobleaching of the glucose-sensitive nanosensors in the IVIS 200 Biophotonic Imager.
Mean ± SD (n=3) is shown.
56
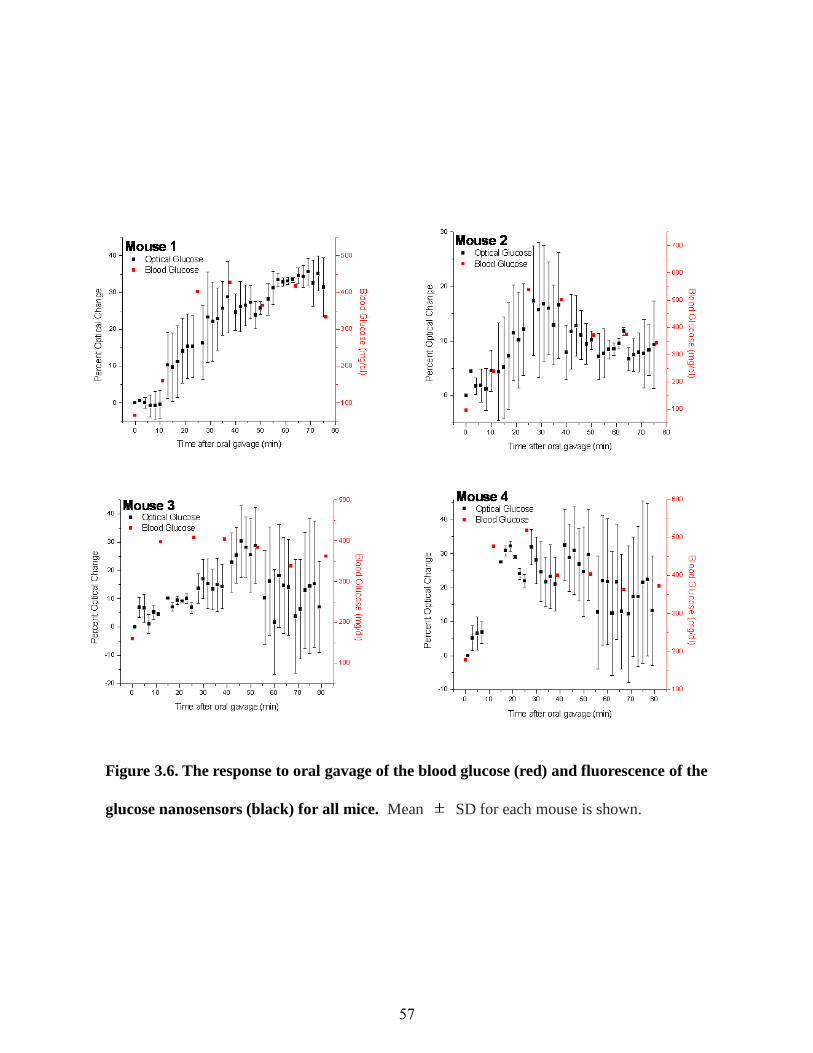
Figure 3.6. The response to oral gavage of the blood glucose (red) and fluorescence of the
glucose nanosensors (black) for all mice. Mean SD for each mouse is shown.
57
of these data points for all mice. The linear fit of the data indicates that optical measurements
correlated to blood glucose measurements over the entire range of glucose concentrations when
the data from all animals is combined. Throughout the in vivo experiments, glycemic levels
were found to vary between 66 mg/dl, 3.7 mM, and 537 mg/dl, 29.8 mM. The glucose
concentrations obtained from the optical response of the glucose-sensitive nanosensors were
consistent with the measurements acquired from the glucometer in this critical span. This
correlation demonstrates that subcutaneous injections can reflect blood glucose levels and that
nanosensor response is unaffected by the in vivo conditions. Literature is available regarding
regional differences and time lags in glucose levels throughout the body;59-62 however,
accounting for these differences will be the focus of future work. In addition, the change in
optical signal is not significantly attenuated by the skin of the mouse. Future work will include
optimizing the sensor response within the hypoglycemic range, performing in vivo sensor
calibration, and incorporating a reference dye into the sensors to minimize variation in sensor
response due to injection techniques and inherent biological variation.
3.5 Conclusion
In summary, we have designed glucose-sensitive nanosensors that exploit the competitive
binding properties of aryl and alkyl diols with boronic acids. This chemistry is maintained
within a hydrophobic core which limits effects of interferents and maintains, in close proximity,
the components required for reversibility of the competitive binding. The nanosensors have not
only demonstrated this reversible response to dynamic changes in glucose concentration, but
they also have a dynamic range encompassing physiologically relevant glucose levels.
Furthermore, the nanosensors tracked rapidly changing glucose concentrations in vivo which
58

corresponded to blood glucose levels measured with a glucometer. The ability of the nanosensor
system to monitor glucose dynamics in vivo could be applied to diabetes treatment as well as
applications in research, such as monitoring the effects of β-cell function or novel treatments for
the disease.
This chapter is adapted with permission from (K. Billingsley, M. K. Balaconis, J. M. Dubach, N.
Zhang, E. Lim, K. P. Francis and H. A. Clark, Fluorescent Nano-Optodes for Glucose Detection.
Analytical Chemistry 82, 3707 (2010)). Copyright (2010) American Chemical Society.
3.6 Acknowledgements
This work was supported by the National Institute of General Medicine of the National Institutes
of Health under award number R01 GM084366 and by Internal Research and Development
funding from The Charles Stark Draper Laboratory.
3.7 Supplementary Information
The Supplementary Information includes a calibration spectrum, leaching measurements, and
photobleaching measurements for the glucose-sensitive nanosensors. The optical response of the
glucose-sensitive nanosensors and blood glucose measurements over time for all mice in the in
vivo experiments are also included.
59

Chapter 4: Gel Encapsulation of Glucose Nanosensors for Prolonged In Vivo
Lifetime
4.1 Chapter Overview
Background: Fluorescent glucose-sensitive nanosensors have previously been used in vivo to
track glucose concentration changes in interstitial fluid. However, this technology was limited
because loss of fluorescence intensity due to particle diffusion from the site of injection. In this
study, we encapsulated the nanosensors into injectable gels to mitigate nanosensor migration in
vivo.
Methods: Glucose-sensitive nanosensors were encapsulated in two different commercially
available gelling agents: Gel 1 and Gel 2. Multiple formulations of each gel were assessed in
vitro for their nanosensor encapsulation efficiency, permeability to glucose, and nanosensor
retention over time. The optimal formulation for each gel, as determined from the in vitro
assessment, was then tested in mice and the lifetime of the encapsulated nanosensors was
compared to controls of nanosensors without gel.
Results: Five gel formulations had encapsulation efficiencies of the nanosensors greater than
90%. Additionally, they retained up to 20% and 40% of the nanosensors over 24 hours for Gel 1
and Gel 2, respectively. In vivo, both gels prevented diffusion of glucose nanosensors at least
three times greater than the controls.
Conclusions: Encapsulating glucose nanosensors in two injectable gels prolonged nanosensor
lifetime in vivo; however, the lifetime must still be increased further to be applicable for diabetes
monitoring.
60
4.2 Introduction
The worldwide prevalence of diabetes has spurred the interest in continuous glucose
monitoring systems as an alternative to the finger-prick method. Glucose monitors such as
DexCom™ STS™ Continuous Glucose Monitoring System and Medtronic’s Guardian® REAL-
Time Continuous Glucose Monitoring System are commercially available and FDA approved to
track trends in glucose levels.7,8 However, further research into novel approaches for glucose
monitoring is still of interest in order to prolong sensor lifetimes, improve accuracy, and
minimize invasiveness of measurements. Several reviews such as those written by Wang,14
Pickup,63 Steiner,64 and Cash65 cover the scope of these developments that include the extension
of nanotechnology to glucose sensing. For example, glucose micro and nanosensors provide the
benefits of rapid response times and ease of implantation due to their large surface area to
volume ratio and small size.65 McShane and colleagues are developing a “smart tattoo”
composed of dissolved-core alginate microspheres to be implanted into the skin and monitor
glucose levels in the interstitial fluid.66 These sensors use fluorescence resonance energy transfer
(FRET) and a competitive binding mechanism with a non-catalytic mutant of glucose oxidase67
to repeatably monitor reversible changes in glucose at physiological levels. In other work,
nanosensors using boronic acids as a non-biological recognition element for glucose have also
been investigated because of boronic acids’ affinity for 1,2 diols.64 A common sensing
mechanism involving boronic acids is the competitive binding between a fluorescent reporter and
glucose for the boronic acid binding site. The fluorescence of the reporter is different in the
bound and unbound states, yielding a change in measured signal as the reporter is displaced from
the boronic acid. Wang et al. developed glucose sensing vesicles using this mechanism with
phenylboronic acid, glucose and the fluorescent reporter, alizarin red S (ARS).68 ARS was
61

electrostatically coupled to cationic quaternary ammonium salts that self-assembled into vesicles
in solution. As glucose was added to the system, ARS was displaced by glucose which resulted
in a decrease in intensity because the unbound ARS is significantly less fluorescent. Our group
utilizes a similar competitive binding scheme as the basis for functional nanosensors, but the
sensing components are embedded in a lipophilic, highly-plasticized polymeric particle into
which glucose is extracted.10,69 The hydrophobic particle design has several advantages that
include isolation of the sensing components from biological fluid to prevent biofouling29 and
tunability of the system to adjust the dynamic range.9
Our glucose-sensitive nanosensors successfully tracked changes in glucose levels when
injected subcutaneously along the backs of mice.10 However, the monitoring time was limited to
1 hour due to loss of signal intensity at the injection site. Studies conducted by Gopee with
intradermally-injected quantum dots found that quantum dots migrated from the site of injection
with 60% of quantum dots remaining at the injection site after 24 hours.70 The nanosensors were
implanted similarly in the skin and migration was assumed to be the main cause of signal loss
over time. To mitigate sensor migration in our system, sensor geometry was altered into
microworms that limited sensor diffusion and prolonged their lifetime in the skin more than the
nanosensors alone.71 However, the yield of microworms was not sufficient for in vivo
monitoring. In this study, we encapsulated glucose nanosensors in injectable gels as another
approach to prevent nanosensor diffusion in vivo. Injectable gels have made an impact on fields
such as drug delivery and tissue engineering because they form under mild conditions, are easily
implantable, and biodegradable.72 These advantages make injectable gels ideal implantation
vehicles for the glucose nanosensors. The primary focus of this study was to investigate
injectable gels for limiting nanosensor migration in vivo. Important characteristics of the glucose
62

sensors such as dynamic range, sensitivity, reversibility, and lifetime have been previously
addressed10,69 and no work on sensor development is discussed here.
4.3 Materials and Methods
Materials. Matrigel™ basement membrane matrix (Gel 1) (growth factor reduced, phenol red-
free, LDEV-free) and 31 gauge insulin syringes were purchased from BD Biosciences (Franklin
Lakes, NJ). Extracel-X® hydrogel kit (Gel 2) was purchased from Glycosan Biosystems Inc.
(Alameda, CA). Bis(2-ethylhexyl) sebacate (DOS), tridodecylmethylammonium chloride
(TDMAC), alizarin (dye content 97%), tetrahydrofuran (anhydrous, ≥99.9%, inhibitor free)
(THF), and chloroform (Chromaslov®, ≥99.8%) were purchased from Sigma-Aldrich (St. Louis,
MO). Octylboronic acid was purchased from Synthonix, Inc. (Wake Forest, NC).
Gibco®Phosphate buffered saline (PBS) (1x, pH=7.4) was acquired from Life Technologies
(Grand Island, NY) and poly(vinyl chloride) carboxylated (PVC-COOH) was purchased from
Scientific Polymer Products, Inc. (Ontario, NY). Amicon Ultra centrifugal filters (molecular
weight cut-off, 100 kDa) were obtained from Millipore (Billerica, MA). 1,2-distearoyl-sn-
glycero-3-phosphoethanolamine-N-[methoxy(polyethylene glycol)-550] (ammonium salt) in
chloroform (PEG 550) was purchased from Avanti Polar Lipids, Inc. (Alabaster, AL). SKH1-E
mice were purchased from Charles River Laboratories International, Inc. (Wilmington, MA).
Optode cocktail. Macro and nanosensors were fabricated from an optode cocktail that
contained all sensing components: 30 mg of PVC-COOH, 60 µL of DOS, 3 mg of octylboronic
acid, 4 mg TDMAC, and 1 mg of alizarin all dissolved in 500 µL of THF. The selection,
optimization, and characterization of these components for glucose sensing are described
elsewhere.10,69
63

Nanosensor fabrication. Fabrication of glucose nanosensors have been described previously.10
Briefly, the optode cocktail was dried for at least 4 hours on a glass plate. It was then removed
from the plate and placed into a scintillation vial along with 5ml of PBS, 5mg of PEG-550, and
500 µL of chloroform. The mixture was sonicated using a Branson digital sonifier (Danbury,
CT) for 3 minutes at 40% amplitude. The nanosensors were concentrated using Amicon Ultra
centrifugal filters prior to encapsulation in the gelling agents.
Gel preparation. Two commercially available gels were selected for encapsulating the
nanosensors. Each gel has applications in cell encapsulation and tumor growth models.73,74 Gels
were prepared according to the manufacturer’s instructions and diluted with nanosensors and
PBS according to the ratios in Tables 4.1 and 4.2 to a total volume of 300 µL. The gelling agents
were allowed to gel in a 31 gauge insulin syringe for at least 20 minutes and 90 minutes for Gel 1
and Gel 2, respectively. All gels were formed prior to the beginning of experiments. Gel 1 is
formed by simply bringing the gel to room temperature. Gel 2 is formed by crosslinking a thiol-
modified hyaluronan and thiol-modified gelatin with a thiol-reactive crosslinker, polyethylene
glycol diacrylate. For all the gel formulations listed in Table 4.2, hyaluronan and gelatin were
used in equal parts and polyethylene glycol diacrylate was 20% of the total gel volume. In the
case of both gels, dilution of the gel components with the nanosensors and PBS decreases their
stiffness.74,75 To serve as a control for no gel, nanosensors were diluted with only PBS to a final
volume of 300 µL.
Nanosensor encapsulation efficiency. 100 µL of prepared gel with sensors or the no gel control
was injected into a 96-well optical bottom well plate. Fluorescence measurements were acquired
on a SpectraMax Gemini EM plate reader (Molecular Devices, Sunnyvale, CA) at 460 nm and
570 nm for excitation and emission wavelengths, respectively. After the initial reading, the gels
64

Gel 1: Nanosensors/PBS Nanosensors PBS Gel 1
Control 1 5 0
5:1 1 0 5
2:1 1 1 4
1:1 1 2 3
Table 4.1. Ratio of components for each Gel 1 formulation. All gels
were made with a total volume of 300 µL.
65
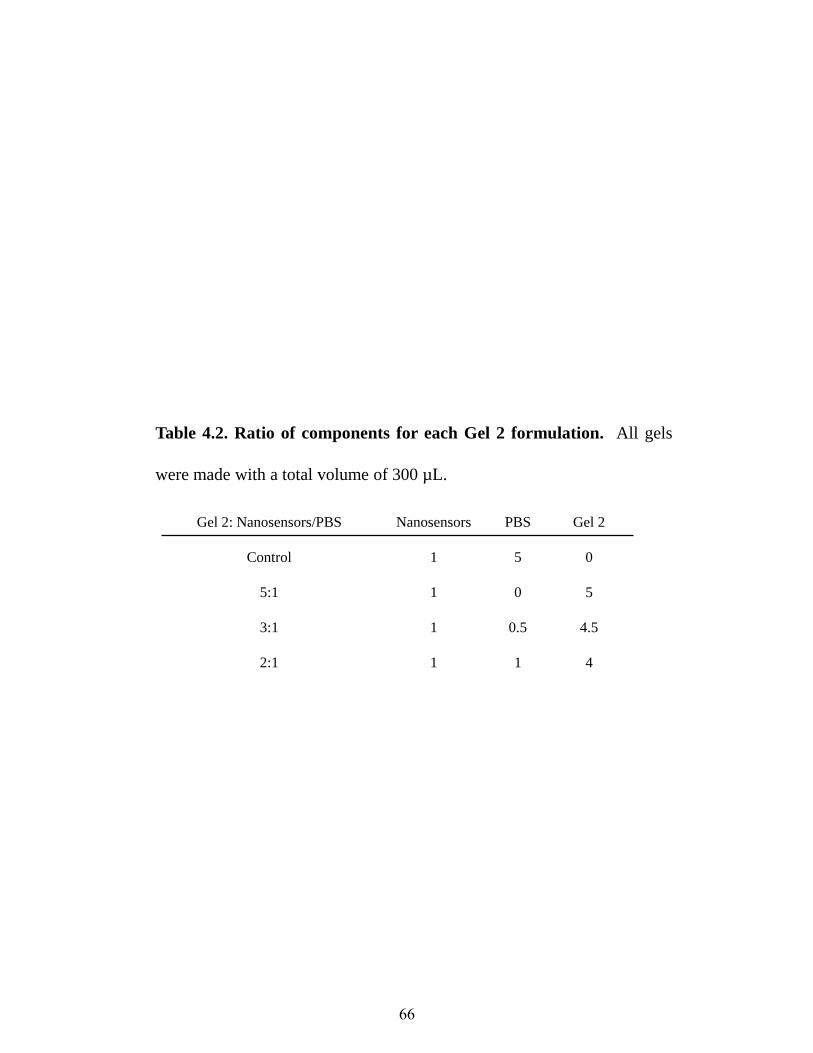
Gel 2: Nanosensors/PBS Nanosensors PBS Gel 2
Control 1 5 0
5:1 1 0 5
3:1 1 0.5 4.5
2:1 1 1 4
Table 4.2. Ratio of components for each Gel 2 formulation. All gels
were made with a total volume of 300 µL.
66

were washed with 100 µL of PBS, the PBS was removed, and then a second measurement was
acquired. The encapsulation efficiency was calculated as the fluorescence intensity of the after
wash measurement divided by the initial measurement for each sample. This ratio was then
expressed as a percentage.
Glucose permeability through gels. To test glucose permeability, glucose macrosensors were
used because they can be adhered to a surface eliminating the possibility of unencapsulated
nanosensors contributing to sensor response. The macrosensors are formed by pipetting the
optode cocktail (2 µL) onto glass discs adhered to the bottom of a 96-well optical bottom well
plate and then dried. 200 µL of PBS was added to each well and the sensors were hydrated in
PBS for at least 4 hours until their fluorescence intensity stabilized. All fluorescence
measurements were acquired at 460 nm and 570 nm for excitation and emission wavelengths,
respectively using a SpectraMax Gemini EM plate reader. After hydration, 100 µL of gels were
injected over the macrosensors and adjusted until they covered the entire bottom of the well
plate. Gels were prepared according to the ratios in Tables 4.1 and 4.2, but the nanosensors were
substituted with PBS. For a no gel control, 100 µL of PBS was substituted for the gels. The
concentration of glucose added was dependent upon the gel used and its ratio of dilution such
that for all cases the final glucose concentration in each well was equal to 9,000 mg/dl. The
macrosensors and nanosensors have a center of dynamic range of 342 mg/dl and 684 mg/dl,10
respectively, but high concentrations of glucose were used here in order to maximize sensor
response. Gel 1 is provided in 0.5 mg/dl of glucose Dulbecco’s Modified Eagle Medium and the
glucose concentration in each Gel 1 formulation was calculated. Gel 2, as provided by the
manufacturer, is reconstituted in PBS and we assumed that 100 µL of Gel 2 was equivalent to
100 µL of PBS. The fluorescence response of the macrosensors was monitored for 3 hours at 5
67

minute intervals. Fluorescence measurements were normalized to time 0 and then subtracted
from the control wells for each gel formulation. This difference was then expressed as a percent
change and the error bars were calculated using error propagation.
Gel retention of nanosensors. Glucose nanosensors were encapsulated in gels as described in
the gel preparation section. 40 µL of gel was injected onto a glass bottom petri dish that was
then filled with 4 ml of PBS. The gels were placed in an incubator at 37°C for ten minutes and
then imaged using an IVIS Lumina II small animal imager (Caliper Life Sciences, Hopkinton,
MA). Images were acquired with 465 nm excitation and 580 nm emission filters. They were
recorded approximately every half hour for the first two hours and then at 6.5 hours and
approximately 24 hours. Between measurements, the gels were stored in an incubator at 37°C.
The bulk degradation of the nanosensors (sensor degradation, component leaching,
photobleaching) over this time was also monitored to separate these effects from the loss of
intensity caused by diffusion. For the bulk degradation controls, 40 µL of glucose nanosensors
in PBS was placed in microcentrifuge tubes and imaged at the same time points as mentioned
above. In between measurements, the nanosensors were stored in an incubator at 37°C. For
analysis, the total radiant efficiency from a region of interest encompassing either the gel or the
nanosensors for the bulk degradation control was selected, normalized to the time 0
measurement, and plotted over time to determine the rate of nanosensor diffusion out of the gel.
In vivo testing. All animal procedures were approved by Northeastern University’s Institutional
Animal Care and Use Committee. Glucose nanosensors were encapsulated in gels according to
the protocol in the gel preparation section or diluted with PBS for the no gel control. SKH1-E
mice were anesthetized and 40 µL of each gel with nanosensors and a no gel control were
injected intradermally along their backs. Intradermal injections were achieved by pinching the
68

skin and then injecting nanosensors with or without gel while the syringe was inserted parallel to
the skin. Characteristic of intradermal injections, a bleb or small skin welt was visible after
injection.76 Mice were imaged with an IVIS Lumina II small animal imager with excitation and
emission filters at 465 nm and 580 nm, respectively. Images were acquired for the first 60
minutes at 10 minute intervals and an additional measurement was taken 3 hours post-injection.
Similar to the gel retention experiments, the total radiant efficiency from a region of interest
surrounding each injection spot was selected for analysis. An additional region of interest with
skin only was also selected to determine the background skin fluorescence. The background
fluorescence from the skin was subtracted from the region of interest and the data was
normalized to time point 0.
4.4 Results
In vitro characterization. Both gelling systems were assessed for three critical characteristics:
encapsulation efficiency, glucose permeability into the gel, and sensor retention over time. Gel
formulations were down selected based on these in vitro characteristics prior to in vivo testing.
First, nanosensors were mixed with Gel 1 and Gel 2 and diluted at different ratios to adjust gel
stiffness. Their encapsulation efficiency of nanosensors is shown in Figure 4.1. All gels
encapsulated the nanosensors better than the control and five out of six gels loss only 10%
percent of their intensity after washing. Gel 1 showed no correlation between stiffness and
encapsulation efficiency whereas the encapsulation efficiency of Gel 2 decreased with decreased
stiffness. The encapsulation efficiency of Gel 2, 2:1, was not down-selected in further
experiments due to its poor performance compared to the other formulations.
69

Figure 4.1. Encapsulation efficiency of gels. Glucose nanosensors were mixed
with gelling agents with variable stiffness and allowed to gel. Shown here is the
percent change in fluorescence intensity after the gels were washed with PBS from
their initial fluorescence. n is equal to 5 for the control, 2:1 Gel 1, and 2:1 Gel 2
and n is equal to 6 for 5:1 Gel 1, 1:1 Gel 1, 5:1 Gel 2, 3:1 Gel 2. Error bars
represent standard deviations.
70
Gel encapsulation of the nanosensors may affect their ability to monitor real-time
changes in glucose concentration because of limited to no glucose permeability into the gel and
potential delays in response. Therefore glucose permeability into the gels was tested. To
determine glucose permeability, glucose macrosensors were used rather than nanosensors to
eliminate unencapsulated nanosensors from contributing to the fluorescence response to glucose.
Additionally, glucose macrosensors respond over the course of 1 hour10 and thus added to the
overall monitoring time required. The percent change in signal of the glucose macrosensors as a
function of time are shown in Figure 4.2 for Gel 1 and Figure 4.3 for Gel 2. The gels were
permeable to glucose with the response kinetics linear as a function of time until maximum
response was achieved. The gel coating caused a delay in sensor response because glucose must
diffuse through the entire gel layer before being sensed by the glucose macrosensors. Previous
research on glucose diffusion through gels calculate these delays using lag-time analysis where
the delay is the x-intercept from a linear fit of total glucose diffusion through the gel membrane
over time.77-79 In the case of our sensors, fluorescence response is related to glucose
concentration and therefore the x-intercept of the linear fluorescence response was used for delay
calculations. For Gel 1, the gel coating caused a lag time for initiating sensor response by 0, 16,
and 19 minutes for the ratios 5:1, 2:1, and 1:1, respectively. Similarly, for Gel 2 the response
was delayed by 44 and 52 minutes for the ratios of 5:1 and 3:1, respectively. For both Gel 1 and
Gel 2, variability in sensor response increased with gel stiffness, but all gels in each grouping
had a similar percent change to glucose and therefore, no down selection was made after this
stage. Finally, the assessment of nanosensor-retention in the gels was performed. Figure 4.4A-C
shows the Gel 1 ratios with encapsulated nanosensors at 4 distinct time points. Over 24 hours,
the fluorescence intensity of the immobilized sensors decreased as the total number of sensors
71

Figure 4.2. Glucose permeability through Gel 1. Glucose macrosensors were
layered with different Gel 1 formulations of variable stiffness and then exposed to 0
g/dl and 9,000 g/dl of glucose for the control and experimental group, respectively.
The percent difference between the controls and experimental groups are plotted
against time for no gel (—■—), 5:1 (Gel 1: PBS, --○--), 2:1 (Gel 1: PBS, ···▲···), and
1:1 (Gel 1: PBS, -·▼·-). n is equal to 6 for the no gel control. n is equal to 5 for
formulation5:1 and formulation 2:1. n is equal to 5 and 4 for the 1:1 formulation
experimental and control groups, respectively. Error bars were calculated using error
propagation.
72

Figure 4.3. Glucose permeability through Gel 2. Glucose macrosensors were
layered with different Gel 2 formulations of variable stiffness and then exposed to 0
g/dl and 9,000 g/dl of glucose for the control and experimental group, respectively.
The percent difference between the controls and experimental groups are plotted
against time for no gel (—■—), 5:1 (Gel 2: PBS, --○--), and 3:1 (Gel 2: PBS, ···▲···).
n is equal to 6 and 4 for the no gel control and Gel 2, respectively. Error bars were
calculated using error propagation.
73
decreased. Sensors diffused away from the edges of the gel, but were still retained in the center,
as anticipated. Figure 4.4D plots the average total radiant efficiency for each gel ratio over time
along with the bulk degradation control. Since bulk degradation of the sensors encompasses
sensor degradation, component leaching, and photobleaching, the difference of intensities
between the bulk degradation control and gels is assumed to be diffusion of sensors out of the
gel. To determine differences in the rate of signal loss between the gels, the data between 0 and
6.5h was fitted to the exponential model:
where A is the initial value, R0 is the rate of decay, and t is time. The decay rates are displayed
in Table 4.3. All three ratios of Gel 1 had similar decay rates. Correspondingly, Figure 4.5
shows the fluorescence decay of Gel 2 ratios with encapsulated nanosensors over time. The total
change in fluorescence signal and decay rates are less than Gel 1 at the various ratios (Table 4.3).
In the case of both gels, each formulation performed similarly except for their delayed response
in the glucose permeability experiments. Therefore, 5:1 Gel 1 and 5:1 Gel 2 were selected for
the in vivo experiments because they had the shortest delays in responding to glucose.
In vivo demonstration. In vitro characterization of the gels demonstrated that gels can be used
as an encapsulation vehicle for the glucose nanosensors in vivo. Mice were intradermally
injected with 5:1 Gel 1, 5:1 Gel 2, and a no gel control in three separate spots along the back
(Figure 4.6A). Over the course of 1 hour, the average normalized total radiant efficiency for 3
mice decreased to 14%, 41%, and 55% of the initial value for no gel, Gel 1, and Gel 2,
respectively. For the first hour, the difference between the 2 gels and the control was significant
(p < 0.05); however, there was no significant difference between Gel 1 and Gel 2 (p > 0.05). By
74

Figure 4.4. Gel 1 retention of glucose nanosensors. Fluorescent images of Gel 1
with glucose nanosensors over time for the (A) 5:1 and (B) 2:1 and (C) 1:1 formulations
of Gel 1. (D) Normalized radiant efficiency of the gels over time for the bulk
degradation control (—■—), 5:1 (--○--), 2:1 (···▲···), and 1:1 (-·▼·-) formulations. n
is equal to 3 for all samples and error bars represent standard deviations.
75

Condition Decay Rate (hr-1)
Bulk Degradation Control -0.02±0.01
5:1 Gel 1 -0.14±0.03
2:1 Gel 1 -0.12±0.04
1:1 Gel 1 -0.14±0.02
5:1 Gel 2 -0.08±0.01
3:1 Gel 2 -0.08±0.01
Table 4.3. Decay rates of the average total radiant efficiency over 6.5
hours for the bulk degradation control and each formulation of Gel 1
and Gel 2.
76

Figure 4.5. Gel 2 retention of glucose nanosensors. Fluorescent images of Gel 2
with glucose nanosensors over time for the (A) 5:1 and (B) 3:1 formulations of Gel
2. (C) Normalized radiant efficiency of the gels over time for the bulk degradation
control (—■—), 5:1 (--○--), and 3:1 (···▲···) formulations. n is equal to 3 for all
samples and error bars represent standard deviations.
77

three hours, all three conditions had decreased to below 20% of the initial normalized efficiency
and there was no significant difference between all three conditions. The fluorescence of the
sensors was completely diminished by 24 hours (data not shown).
4.5 Discussion
Gel 1 and Gel 2 were selected for these studies because they can be easily modified for
stiffness through dilution74,75 and they are amenable to nanosensor incorporation during the
gelling process. Three parameters were used to assess and down select the optimal formulations
for in vivo testing: encapsulation efficiency of the nanosensors, glucose permeability through the
gel, and nanosensor retention within the gel over time.
The particles being suspended had the potential to inhibit gelation, as was noted with
other matrices (data not shown). At several different formulations for Gel 1 and Gel 2,
incorporating a sufficiently high concentration of nanosensors for in vivo detection into the pre-
gelled components did not inhibit gelation. Additionally, since it is critical that implanted
nanosensors can sense real-time changes in physiological concentration of glucose even while in
a gel, glucose permeability through the gel was assessed. Solute transport through hydrogels is
governed by polymer chain mobility, charge groups, and solute versus pore size of the gel.80 Gel
1 and Gel 2 were permeable to glucose and the shape of the kinetics of the fluorescence response
of all the gels were similar to those reported by other groups on the transport of glucose through
gels77-79 such as calcium alginate.77,78 This transport, as modeled using lag time analysis, has an
initial lag time followed by a linear increase in the amount of glucose that has passed through the
gel. In our case, the lag time for glucose diffusion through the entire gel can overshadow one of
78

Figure 4.6. In vivo testing of nanosensors encapsulated in Gel 1 and Gel 2. (A)
Fluorescent images of glucose nanosensors encapsulated in Gel 1 and Gel 2 along with a
no gel control over 3 hours. (B) Normalized radiant efficiency of the gels over time for the
no gel control (—■—), Gel 1 (--○--), and Gel 2 (···▲···). n is equal to 3 for all samples and
error bars represent standard deviations.
79

the main advantages of using nanosensors: their fast response. The delays in response may be
shortened by reducing the amount of gel to minimize the transport time to the center of the gel.
However, these transport delays may be a major disadvantage for the use of a nanosensor/gel
system to monitor real-time changes in glucose. Additionally, glucose gradients that may form
throughout the gel could affect sensor measurements. Therefore, we are currently investigating
the use of new sensing geometries that will increase the overall size of the sensors while
retaining fast sensor response times and glucose transport.
Lastly, the diffusion of the nanosensors out of the gels was investigated to determine
efficacy of sensor retention over time. The average size of the glucose nanosensors is 74 nm10
and gel pore sizes less than this would be desirable for greater retention. Reported values of pore
size for Gel 1 range from 26 nm to 2 µm for 1:1 dilution75,81 with pore size varying with Gel 1
concentration.75 Drastic changes in pore size of Gel 1 was not evident from our results since all
Gel 1 formulations performed similarly and we predict that the average pore size for these
matrices was greater than the size of the nanosensors. On the other hand, Gel 2 has been shown
to retain proteins as small as 70 kDa.74 The average pore size for Gel 2 may be smaller than Gel
1 and thus explains the greater retention of nanosensors over time.
Previous in vivo studies were limited to approximately an hour because of loss of signal
intensity at the injection site.10 The majority of the signal loss was attributed to sensor diffusion
from the point of injection. In our current work, immobilizing nanosensors in a gel matrix
improved the lifetime to over an hour in vivo; however, there was still a loss of signal over this
time frame. Other factors such as sensor performance, photobleaching, and gel degradation
contribute to loss of signal as well and inclusion of a reference dye or internal standard into the
sensors will help to normalize the loss of fluorescent signal to account for these effects on
80
glucose measurements. Ultimately, the goal is a sensor that performs for at least one week in
vivo and this will require further improvements to the nanosensors and the injection techniques,
in addition to the use of gels.
4.6 Conclusion
Two commercially-available injectable gels sufficiently encapsulated glucose
nanosensors while maintaining glucose permeability. Both gels prolonged sensor lifetime in vivo
longer than nanosensors alone. However, more work will have to be done to improve
nanosensor lifetime in order for them to be applicable for long-term diabetes monitoring.
This chapter is adapted with permission from (M. K. Balaconis and H. A. Clark, Gel
Encapsulation of Glucose Nanosensors for Prolonged In Vivo Lifetime. Journal of Diabetes
Science and Technology 7, 53 (2013)). Copyright (2013) Journal of Diabetes Science and
Technology.
4.7 Acknowledgements
This work was funded by the IGERT Nanomedicine Science and Technology program at
Northeastern University from National Cancer Institute and National Science Foundation grant
DGE-0504331 and National Institutes of Health Grant 5RO1GM084366. We thank Kevin J.
Cash and Ankita Shah for their technical guidance in preparing this article.
81

Chapter 5: Biodegradable Optode-Based Nanosensors for In Vivo Monitoring
5.1 Chapter Overview
Optode-based fluorescent nanosensors are being developed for monitoring important
diseased states such as hyponatremia and diabetes. However, traditional optode-based sensors
are composed of non-biodegradable polymers such as polyvinyl chloride (PVC) raising toxicity
concerns for long-term in vivo use. Here, we report the development of the first biodegradable
optode-based nanosensors that maintain sensing characteristics identical to traditional optode
sensors. The polymer matrix of these sensors is composed of polycaprolactone (PCL) and a
citric acid ester plasticizer. The PCL-based nanosensors yielded a dynamic and reversible
response to sodium, were tuned to respond to extracellular sodium concentrations, and had a
lifetime of at least 14 days at physiological temperature. When in the presence of lipase, the
nanosensors degraded within 4 hours at lipase concentrations found in the liver but were present
after 3 days at lipase concentrations found in serum. This development of biodegradable
nanosensors is not only necessary for future in vivo applications, but it has also created a new
sensor platform that can be extended to other sensing mechanisms such as for small molecules or
enzymes.
5.2 Introduction
Optode sensors, the optical counterpart to ion-selective electrodes, have been developed
to measure a range of ions such as sodium,82 potassium,83 and calcium84 and small molecules
such as glucose.69,85 Miniaturization of optode sensors into micro and nanosensors has further
improved their spatial resolution and response time to changes in analyte
82

concentrations.9,10,29,30,71,86-89 For example, nanosensors have measured the rate of calcium release
during the mitochondrial permeability transition29 and detected sodium sparks from ion channel
clusters in cardiac myocytes.11 Recently, applications for optode-based sensors have extended
from intracellular measurements to longitudinal in vivo monitoring for diseased states such as
hyponatremia and diabetes.10,90-92 For example, the Gratzl group has developed sliver sensors for
monitoring analytes such as glucose in the skin.91,92 The clinical monitoring system proposed by
our group involves injecting nanosensors into the upper layers of the skin, similar to a tattoo, and
then monitoring changes in the fluorescence of the sensors using a handheld optical reader. In
initial animal studies, subcutaneously-injected nanosensors tracked changes in extracellular
sodium and glucose concentrations;10,90 however, diffusion of the nanosensors away from the site
of injection raised concerns regarding their long-term safety.
Limited studies have been performed on intradermal exposure of nanoparticles70 and
toxicological effects of nanoparticles is dependent upon multiple parameters (i.e. size, material,
and surface coating).93-95 In previous nanosensor in vivo studies, all of the sensing components
were entrapped in a sebacate plasticizer and PVC-based particle.10,90 Though both of these
components have been used in medical grade products and exhibit low toxicity, plasticizer
leaching and known carcinogenic effects of vinyl chloride have caused rising safety concerns
associated with plasticized PVC in medical devices.12,13 Plasticizer-free ion-selective
electrodes96,97 and optode sensors98 have been developed to minimize the effect of plasticizer
leaching on sensor lifetime and adverse biological responses. In this work, we report the
development of the first biodegradable optode-based nanosensors. Therefore when applied in
vivo, the nanosensors will ultimately be degraded and cleared from the body regardless of their in
vivo fate minimizing long-term toxicity. Sodium sensors were selected for proof of concept for
83

two reasons. First, clinically, hyponatremia affects 30% of elderly patients in nursing homes99
and leads to gait disturbances and increased risk of falls in this population;100 however, unlike
glucose monitors, no at-home sodium monitoring system exists. Second, the sodium sensing
mechanism is well understood and mathematically described in the ion-selective optode field and
will provide a robust model system for investigation into new sensor designs.24,25,101 Briefly, the
mechanism involves three main components: a neutral ionophore, a neutral chromoionophore,
and a negatively charged additive. When no sodium is present within the system, the
chromoionophore is protonated while the negative additive provides charge neutrality within the
sensor. As sodium is introduced, the ionophore extracts sodium into the sensor and the
chromoionophore deprotonates resulting in a change of fluorescence signal. Based on the
changes in signal intensity, the sodium concentration can be determined and sensor response
tailored by changing the ratio of components. The biodegradable nanosensors developed here
are composed of polycaprolactone (PCL) and citric acid based plasticizer and retain
characteristics traditional to optode sensors.
5.3 Materials and Methods
Materials. Sodium ionophore X (NaIX), sodium tetrakis[3,5-bis(trifluoromethyl)phenyl] borate
(NaTFPB), and chromoionophore III (CHIII) were all purchased from Fluka (St. Louis, MO).
PCL (Mn~14,000) was acquired from Aldrich (St. Louis, MO) and sodium chloride (NaCl), 4-(2-
hydroxyethyl)piperazine-1-ethanesulfonic acid N-(2-hydroxyethyl)piperazine-N′-(2-
ethanesulfonic acid) (HEPES), and polyoxyethylene-polyoxyproplene block copolymer
(Pluronic® F-68) were purchased from Sigma (St. Louis, MO). Acetyltri-n-hexyl citrate
(Citroflex A-6) was acquired from Vertellus (Indianapolis, IN). 1,2-disteroyl-sn-glycero-3-
84
phosphoethanolamine-N-[methoxy(polyethylene glycol)-550] ammonium salt in chloroform
(PEG 550) was purchased from Avanti Polar Lipids (Alabaster, AL) and acetone (≥ 99.5%) was
acquired from Sigma-Aldrich (St. Louis, MO). Spectra/Por® In Vivo Microdialysis Hollow
Fibers (Inner diameter: 200 µm, Outer diameter: 280 µm, Molecular Weight Cut-Off: 13
kilodaltons) was purchased from Spectrum Laboratories, Inc. (Rancho Dominguez, CA) and
phosphate buffered saline (PBS, pH=7.4) was purchased from Life Technologies (Grand Island,
NY). As provided by the manufacturer, the composition of PBS was 1.06 mM potassium
phosphate monobasic, 155.17 mM sodium chloride, and 2.97 mM sodium phosphate dibasic.
Nanosensor Formulation and Fabrication. Prior to nanosensor fabrication, all sensor
components were combined into an optode cocktail: 60.1mg Citroflex A-6, 30mg PCL, 0.1mg
(1.11mmol kg-1) NaIX, 0.4mg (4.98mmol kg-1) NaTFPB, and 0.1mg (1.93mmol kg-1) CHIII
dissolved in 3mL of acetone. This ratio of sensing components was selected based on their
tailored response to sodium at physiological extracellular sodium concentrations (135-145
mM).102 Additional optode cocktails containing 90.3mg Citroflex A-6 or 90 mg PCL both with
the same ratio of sensing components were used as controls in the nanosensor degradation
experiments. Sodium nanosensors were fabricated using a solvent displacement method derived
from previously developed methods.103,104 3mg of PEG 550 was dried onto the bottom of a 2
dram glass vial and then dissolved in 600 µL deionized water. While stirring the PEG 550
/water mixture, 300 µL of optode cocktail was pipette injected into the mixture and then allowed
to stir for 10 minutes. After this time, the sensor solution was centrifuged at 12,600 g for 20
minutes (Micromax RF Refrigerated Microcentrifuge, Thermo Electron Corporation, Milford,
MA) and the supernatant was removed. The sensors were then washed two more times with
10mM HEPES (pH=7.4) and centrifuged at 12,600 g for 20 minutes. After the last wash, the
85
sensors were resuspended in 10mM HEPES for characterization. This fabrication method could
be scaled-up to generate more sensors depending upon the desired application without loss of
calibrated response (data not shown). For example, ten times the amount of sensors could be
made by using 30mg PEG 550, 6 ml deionized water, and 3 ml of optode cocktail.
Nanosensor Characterization
Nanosensor Reversibility. Reversibility was determined by entrapping the nanosensors in
Spectra/Por® In Vivo Microdialysis Hollow Fibers. These fibers have a specified inner diameter
of 200 µm and a molecular cut-off of 13 kD thus allowing the diffusion of sodium ions and
buffer into the fiber while maintaining the nanosensors. Fibers were pre-filled with 20 mg/ml of
Pluronic® F-68 in deionized water to prevent adhesion of nanosensors to the fiber walls and then
filled with nanosensors. Fiber ends were sealed with epoxy and then glued onto glass coverslips
attached to a microscope perfusion system. Images of the nanosensors while under perfusion
were acquired on a Zeiss Confocal Microscope (Thornwood, NY). CHIII has three excitation
and emission peaks (ex/em: 488 nm/570 nm, 488 nm/670 nm, 639 nm/680 nm). Sensors were
imaged using the 488 nm and 639 nm lasers simultaneously to collect the emission intensities at
the 570 nm and 680 nm peaks, respectively. The perfusion chamber was alternately filled with 0
mM and 500 mM of NaCl in 10 mM HEPES (pH=7.4) to measure fluorescence response and
recovery of the sodium nanosensors. While under perfusion, images were acquired
approximately every 11.6 seconds. Images were exported and analyzed using ImageJ software
and Matlab. For all samples, an equal size rectangular region of interest containing only
fluorescence was selected and all saturated and zero value pixels were removed prior to analysis.
The results were not altered by removing the saturated and zero value pixels. The average
fluorescence intensities for the 570 nm and 680 nm emission wavelengths were divided for each
86
sample to get a ratio of the two wavelengths and error was calculated using the laws of error
propagation.
Nanosensor Response. The response of the nanosensors to sodium was determined as follows.
In a optical bottom 96-well plate, 100 µL of nanosensors were placed in wells along with 100 µL
of the following solutions: 0 M, 0.020 M, 0.050 M, 0.1 M, 0.2 M, 0.240 M, 0.270 M, 0.290 M,
0.320 M, 0.380 M, 0.4 M, 0.5 M, 1 M, 2 M of NaCl in 10mM HEPES buffer solution (pH=7.4).
As a result of mixing these concentrations of NaCl with the sensors, the total sodium
concentration in each of the well is half as stated above. Each concentration was performed in
triplicate from three different sets of nanosensors. Fluorescence endpoint measurements were
only taken at the excitation and emission wavelengths of 640nm and 680nm, respectively, since
emission intensities at the other two wavelengths are not high enough to provide adequate signal
to noise. Fluorescence measurements were acquired on a Molecular Devices SpectraMax
Gemini EM (Sunnyvale, CA). To determine the response of the sensors, the log of the
concentration was plotted against α:87
where I[Na+] is the intensity of the sensors at a specific sodium concentration, I[Minimum] is the
intensity at 1M NaCl and I[Maximum] is the intensity at 0 M NaCl sodium concentration. The error
was determined from the raw fluorescence intensities according to the laws of error propagation.
The center of the dynamic range (KD) was determined as the sodium concentration where α=0.5
and the sensitivity was calculated as the change in sodium concentration for a 1% change in
normalized fluorescence signal. In addition, nanosensor response was measured while in the
presence of a high background solution of potassium chloride (KCl), a common sodium sensor
87

interferent. All NaCl solutions listed above were made in a 30 mM KCl in 10 mM HEPES
solution (pH=7.4). The total KCl concentration in each well was 15 mM which is three times
greater than extracellular KCl concentrations (3.5-5.0 mM).102 Each concentration was
performed in triplicate for three different sets of nanosensors. Response of the nanosensors was
determined similar to described above and a two-tailed student’s t-test was used to determine
significant changes in response while in the presence of potassium ions.
Nanosensor Lifetime and Stability. Three parameters were used to determine the lifetime and
stability of sodium nanosensors: calibrated response, size, and zeta potential. Each of these
parameters was measured on Day 0, 3, 7, 10, and 14. Between measurements, the sensors were
stored in an incubator at 37°C to mimic physiological conditions. At each time point, sensors
were calibrated using the same conditions, solutions, and methods as described above. The size
and zeta potential of the nanosensors was measured using a Brookhaven 90 Plus Particle Size
Analyzer (Holtsville, NY). Sensors were diluted in PBS for all size and zeta measurements. The
size was taken as the effective diameter that is derived from the measured intensity of the
particles.
Scanning Electron Micrographs (SEM). Nanosensors were diluted in deionized water and
dried under vacuum on aluminum specimen mounts. We acquired images on a Hitachi S4800
at low accelerating voltages and did not coat the samples to prevent heat damage to the particles.
Nanosensor Degradation. PCL nanoparticles have been shown to be stable in buffer solution
for over 140 days,103 but they are rapidly degraded in the presence of lipases.103,105-108
Nanosensor degradation was tested in the presence of Pseudonamas lipase at 30 U/L,103 190
U/L,103 and 6,000 U/L representing low serum, high serum, and liver levels of lipase109
respectively. Since our particle is a two component system, degradation of nanosensors
88

composed of 100% PCL and 100% Citroflex A-6 were also investigated along with our 2:1
Citroflex A-6: PCL nanosensors. Two independent parameters were used to evaluate
degradation: fluorescence intensity in 0 mM NaCl and particle count rate. For fluorescence
intensity, measurements were acquired on a Molecular Devices SpectraMax Gemini EM
(Sunnyvale, CA) at excitation and emission wavelengths of 640 nm and 680 nm, respectively. In
a 96-optical bottom well plate, 100 µL of nanosensors were mixed with 100 µL of 0 mM NaCl
solution. Count rate was measured on a Brookhaven 90 Plus Particle Size Analyzer. Count rate
is proportional to particle concentration and thus provides a relative change in particle
concentration over time.11 Nanosensors in the absence of lipase acted as a control and initial
measurements were acquired using a single control experiment (n=3). Further measurements
were acquired at 4 hours, 8 hours, 28 hours, and 74 hours for the control and different lipase
concentrations. In between measurements, nanosensors both in the presence and absence of
lipase were stored at 37°C. Average fluorescence intensities and count rates were normalized
and plotted over time to determine degradation of the nanosensors.
5.4 Results and Discussion
Nanosensor Response Characteristics. As a substitute for PVC, PCL was chosen because it is a
popular FDA-approved polymer with applications in sutures, scaffolds, and drug delivery
devices.110 PCL is a hydrophobic aliphatic polyester that undergoes hydrolytic degradation
either through bulk or surface erosion depending upon water penetration into the polymer.110
Furthermore, its rate of degradation is dependent upon molecular weight, pH, and shape.111,112
The plasticizer, Citroflex A-6, was selected as a replacement for DOS because citric acid esters
89

are biodegradable and are used in medical plastics as a replacement for phthalates.13 Typically,
response characteristics of the sensors such as the dynamic range and selectivity are primarily
dictated by the incorporated sensing components and the polymer matrix is considered inert.113
However, extraction of analytes, leaching, and loading efficiency of the sensors are influenced
by the polymer matrix which varies by hydrophobicity and charge depending upon the selection
of matrix components.113,114 Therefore, response characteristics had to be evaluated for the
biodegradable nanosensors even though their sensing mechanism is well-characterized.
The dynamic fluorescence response of the nanosensors was tested by encapsulating the
nanosensors in hollow fiber dialysis tubing and attaching the tubing to a perfusion system
(Figure 5.1). With increased sodium concentrations, the 570 nm emission peak increases in
intensity (Figure 5.1A, Video S-1) and the 680 nm emission decreases in intensity (Figure 5.1B,
Video S-2) as CHIII becomes deprotonated. Because of the dual emission response, the
fluorescence intensity at each wavelength can be ratioed, increasing sensor sensitivity and
minimizing the effects of photobleaching. Figure 5.1C shows the average ratioed fluorescence
response of three sets of sodium nanosensors and their rapid fluorescence response and recovery
to changes in sodium concentrations. From the response curve, the ratio changes by
approximately 0.5 or 70% and the average response time of the sensors, as measured as the time
it takes the sensors to reach 95% of their total response to sodium, is 48 seconds. This is the
response time of the entire system and takes into account the perfusion time of solutions into the
chamber, diffusion of sodium into the dialysis tubing, and response time of the sensors. Since
extracellular sodium dynamics are expected to change on a slower timescale than intracellular
dynamics, the measured response time is adequate for in vivo extracellular measurements.
90
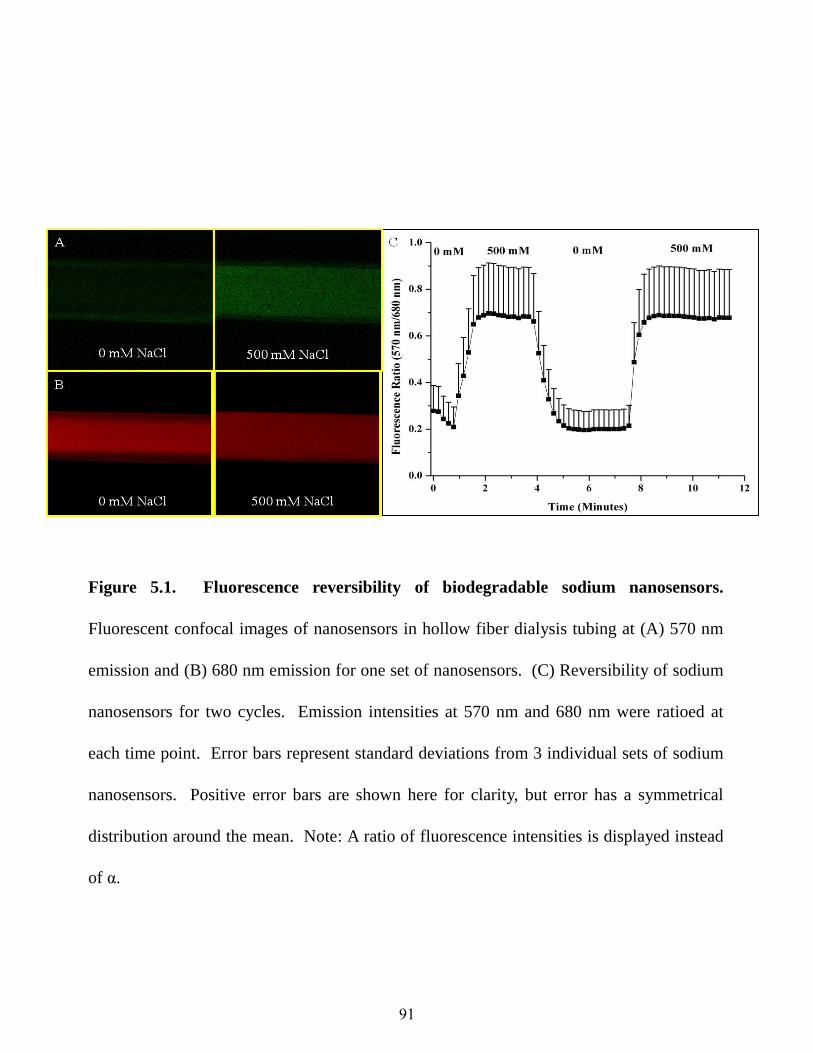
Figure 5.1. Fluorescence reversibility of biodegradable sodium nanosensors.
Fluorescent confocal images of nanosensors in hollow fiber dialysis tubing at (A) 570 nm
emission and (B) 680 nm emission for one set of nanosensors. (C) Reversibility of sodium
nanosensors for two cycles. Emission intensities at 570 nm and 680 nm were ratioed at
each time point. Error bars represent standard deviations from 3 individual sets of sodium
nanosensors. Positive error bars are shown here for clarity, but error has a symmetrical
distribution around the mean. Note: A ratio of fluorescence intensities is displayed instead
of α.
91

Figure 5.2 shows the tailored response of the sodium nanosensors with a measured KD of
141 mM NaCl and sensitivity of 4.6 mM for a 1% change in fluorescence intensity. These
values did not significantly shift (p >0.01 as determined from α values) when in the presence of
over three times the extracellular potassium levels (15 mM KCl), a common sodium sensor
interferent (Figure 5.2). Physiological concentrations of extracellular sodium are between 135
mM and 145 mM.102 Currently, the center of the dynamic range of our sensors falls within these
values, but the sensors are not yet sensitive to accurately monitor sodium concentrations in this
range. Future work will focus on improving the sensor sensitivity by tailoring the ratio of
components. Additionally, the sensor is inherently susceptible to changes in pH. Therefore,
monitoring pH independently or holding the pH constant is necessary for improved accuracy.87
For our particular application, measurement in the dermal space, pH is fairly constant, but our
results could be easily confounded if particles are endocytosed and exposed to an acidic
lysosomal environment. Figure 5.3 shows the lifetime and stability of the biodegradable
nanosensors while in buffer solution at 37°C. The calibrated sensor response, size, and zeta
potential remain stable over a 14 day time period. The average size of the nanosensors as
determined using dynamic light scattering was 260±2.2 nm with an average polydispersity index
(PdI) of 0.120±0.02. The presence of larger sensors was visible on SEM (Figure 5.4), but
filtering techniques can be used to narrow the size distribution if desired.9
Biodegradation of Sodium Nanosensors. Once in vivo, the expected lifetime and stability of
sodium nanosensors will decrease because of physiological and immune responses spurred by
their injection. PCL was selected instead of poly(lactic-co-glycolic acid) (PLGA) because its
degradation products do not alter the pH of the surrounding system and thus is not expected to
alter sensor response.110 Since our nanosensor particle is a two component system, we
92
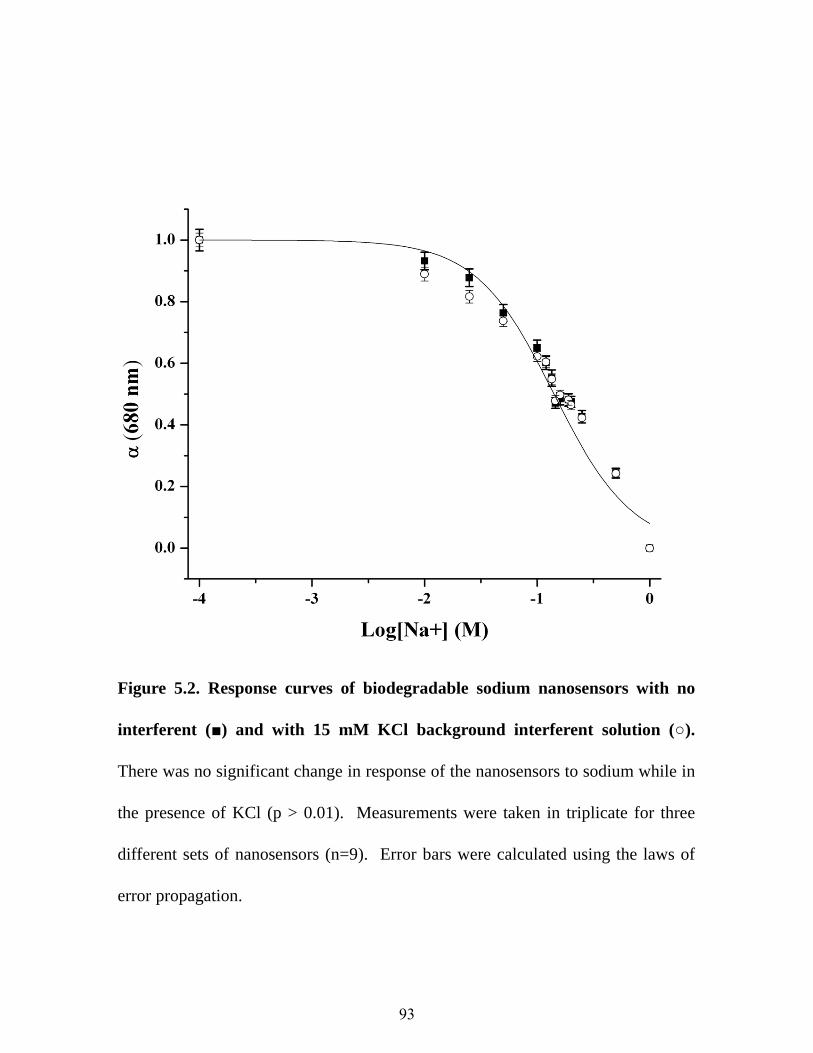
Figure 5.2. Response curves of biodegradable sodium nanosensors with no
interferent (■) and with 15 mM KCl background interferent solution (○).
There was no significant change in response of the nanosensors to sodium while in
the presence of KCl (p > 0.01). Measurements were taken in triplicate for three
different sets of nanosensors (n=9). Error bars were calculated using the laws of
error propagation.
93

Figure 5.3. Lifetime and stability of biodegradable sodium nanosensors. (A)
Response curves on Day 0 (—■—), Day 7 (--○--), and Day 14 (···▲···). Measurements
were taken in triplicate for three different sets of nanosensors (n=9) and error bars were
calculated using the laws of error propagation. (B) Average sizes (■) and zeta potentials
(○) measured intermittently over the course of two weeks. Three samples were run from
three individual sets of nanosensors. For each sample of nanosensors, 3 size
measurements were made and five zeta potential measurements were made. Therefore,
n=27 for size measurements and n=45 for zeta potential measurements. Error bars were
calculated using the laws of error propagation.
94

Figure 5.4. SEM micrograph of a biodegradable sodium nanosensor.
95
investigated the individual degradation response of PCL and Citroflex A-6 independently.
Nanosensors composed of only PCL showed both a decrease in fluorescence response and count
rate over time (Figure 5.5). On the contrary, sensors composed of only Citroflex A-6 did not
show a decrease in fluorescence intensity nor count rate (Figure 5.5). Figure 5.5 also shows the
degradation response curves of 2:1 Citroflex A-6: PCL system in the presence of lipase. For all
cases, the fluorescence intensity remained constant while the count rate decreased. Based on
these results, the sensors had degraded, but the remaining plasticizer sequestered the sensing
components resulting in no change in fluorescence intensity over time. Citrates are
biodegradable esters13 and we expect that Citroflex A-6 also experienced biodegradation by the
lipases, but this process could not be monitored using our current techniques. In the first 4 hours,
the rate of decrease in count rate was similar at both high serum and liver lipase concentrations
and slower at low serum levels. However, the degradation rate is expected to be faster in vivo
because of optimal enzyme operating conditions and the presence of other degradation
mechanisms.103
5.5 Conclusion
We have designed biocompatible and biodegradable sodium nanosensors composed of
PCL and Citroflex A-6. These sensors have favorable characteristics for in vivo applications
such as fast and dynamic fluorescence response tailored to sodium levels. The sensors degrade
in the presence of lipases with accelerated degradation rates at concentrations that would be
found in the liver, a primary bioaccumulation site for nanoparticles. Future work will investigate
the toxicity of the degraded nanosensor components including the active sensing components
96
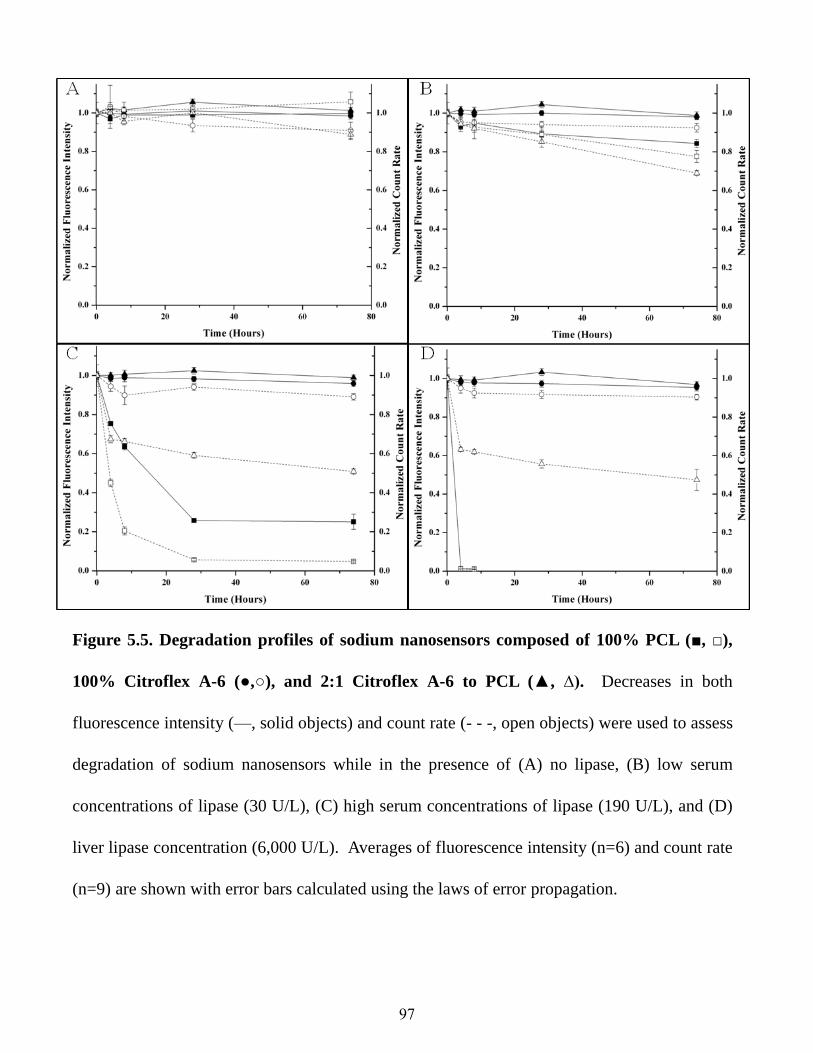
Figure 5.5. Degradation profiles of sodium nanosensors composed of 100% PCL (■, □),
100% Citroflex A-6 (●,○), and 2:1 Citroflex A-6 to PCL (▲, ∆). Decreases in both
fluorescence intensity (—, solid objects) and count rate (- - -, open objects) were used to assess
degradation of sodium nanosensors while in the presence of (A) no lipase, (B) low serum
concentrations of lipase (30 U/L), (C) high serum concentrations of lipase (190 U/L), and (D)
liver lipase concentration (6,000 U/L). Averages of fluorescence intensity (n=6) and count rate
(n=9) are shown with error bars calculated using the laws of error propagation.
97

that will be released upon degradation. Though this system has been developed for sodium, the
new sensor platform can be extended by exchanging the sensing components to monitor other
analytes such as potassium and chloride, small molecules such as glucose, or even larger
molecules such as enzymes.
This chapter is adapted with permission from (M. K. Balaconis and H. A. Clark, Biodegradable
Optode-Based Nanosensors for in Vivo Monitoring. Analytical Chemistry 84, 5787 (2012)).
Copyright (2012) American Chemical Society.
5.6 Acknowledgements
We thank the IGERT Nanomedicine Science and Technology program at Northeastern
University (funding from NCI and NSF grant DGE-0504331). Additional funding was also from
NIH grant 5RO1GM084366 and the CIMIT Prize for Primary Healthcare. We would also like to
thank Professor Mansoor Amiji, J. Matthew Dubach, Kevin J. Cash, and Timothy Ruckh for
their technical guidance in preparing this manuscript and William Fowle for his help in acquiring
the SEM micrographs.
98
Chapter 6: Optimization of Glucose Sensor Components
6.1 Chapter Overview
For clinical applications, the sensitivity and long term stability of glucose-sensitive
nanosensors must be improved. In this chapter, more advanced boronic acid sensing moieties
and alizarin-based fluorescent dyes were incorporated into the sensors. Boronic acids containing
electron withdrawing functional groups responded to glucose greater than our current
formulation; however, future work will still involve optimizing sensor response and
functionalizing fluorescent dyes for improved lifetime.
6.2 Introduction
Independent of in vivo obstacles, fluorescent glucose-sensitive nanosensors have two key
limitations to clinical applications: leaching of sensing components and a limited dynamic range
that is insensitive to hypoglycemic events. For example, alizarin is much more hydrophilic than
the ionophores and chromoionophores from standard optodes and it leaches quickly from the
hydrophobic polymer. As shown in Chapter 3, leaching of sensor components limited in vitro
nanosensor lifetime to less than 8 hours.10 Miniaturization of glucose sensors into nanosensors
accelerated leaching of sensor components because of the increased surface area to volume ratio
of nanoparticles. Thus, direct conjugation of the sensor components to the nanosensors may
prove to alleviate these concerns.
Changing the boronic acid sensing moiety can be used to adjust the sensor dynamic
range. The response of the sensors to glucose is governed by the formation of the boronic acid to
a boronate ester. Boronic acids have pKa values that limit boronate ester formation at neutral
99
pH. The addition of electron withdrawing groups has been shown to decrease the pKa value of
boronic acids and concurrently increase glucose binding capacity at neutral pHs.115 For example,
Asher and coworkers incorporated fluoro-containing boronic acids into photonic crystal glucose-
sensing material because fluorinated boronic acids have pKa values at physiological pH levels.116
Incorporation of boronic acids with electron withdrawing groups will improve sensor dynamic
range and sensitivity within physiological levels. However, addition of these groups typically
comes with increased hydrophilicity, a trait that leads to leaching from and incompatibility with
the hydrophobic sensor platform.
Derivitization of alizarin and boronic acids with hydrophobic chemistries or conjugation
to the polymeric sensor platform will mitigate component leaching while incorporating
functional groups that enhance glucose response at physiological conditions. In this chapter,
alizarin derivatives with carboxyl and amine functional groups were tested with sensor
components because of alizarin’s current use in the sensor design and carboxyl and amine groups
allow for attachment to the polymeric platform or hydrophobic chains. Boronic acids with
electron withdrawing groups and functional chemistries were tested as well because of their
known binding with glucose at physiological pH.
6.3 Materials and Methods
Materials. Poly(vinylchloride) carboxylated (>97% GC) (PVC-COOH), bis-(2-
ethylhexyl)sebacate (DOS), polycaprolactone (Mn 70,000-90,000)(PCL),
tridodecylmethylammonium chloride (TDMAC), alizarin, alizarine claret (mordant dye),
alizarin-3-methyliminodiacetic acid, 3-fluoro-4-methoxycarbonylphenylboronic acid, D-(+)-
glucose, tetrahydrofuran (≥ 99.9%) (THF), dicyclohexylcarbodiimide solution (60 weight
100
percent in xylenes) (DCC), and N-hydroxysuccinimide (NHS) were purchased from Sigma
Aldrich (St Louis, MO, USA). Octylboronic acid (>97%) and Citroflex A-6 were acquired from
Synthonix (Wake Forest, NC, USA) and Vertellus (Indianapolis, IN, USA), respectively.
Phosphate Buffered Saline (PBS) (1x, pH = 7.4) was purchased as a solution from Invitrogen
(Carlsbad, CA, USA).
Polymer Functionalization. Figure 6.1 shows the reaction mechanism for attaching alizarin-3-
methyliminodiacetic acid to polyvinyl chloride with amine groups. In 1 ml of THF, 6 mg of
alizarin-3-methyliminodiacetic acid and 3mg of NHS were dissolved. Under stirring, 10 μL of
DCC in xylene was added to the mixture and then reacted for 6 hours. After this time, 50 mg of
polyvinyl chloride amine in 2 ml THF was added to the alizarin-3-
methyliminodiacetic/NHS/DCC mixture and stirred overnight. The reaction mixture was then
centrifuged for 20 minutes at 12,600g to separate out the dicylcohexyl urea precipitate. THF was
removed from the polymer solution and the dried polymer was washed three times with methanol
to remove unreacted starting materials.
Fluorescent Dye Response to Boronic Acids. All samples were prepared in quartz cuvettes
with a total volume of 2.5 ml THF. For each dye, the components and details for fluorescence
measurements are in Table 6.1. For each titration, boronic acids were added at increasing
concentrations, the solution was mixed, and then fluorescence measurements were acquired.
Octylboronic acid was titrated with alizarin and alizarine claret and 4-amino-3-fluoro-
phenylboronic acid bound to PVC-COOH was titrated in with alizarin-3-methyliminodiacetic
acid. Controls for dilution effects of each dye involved titrating in an equal amount of volume
of the control solution.
101

Figure 6.1. Synthesis of alizarin-3-methyliminodiacetic acid (1)
conjugated to polyvinyl chloride containing amine functional groups
(2).
102
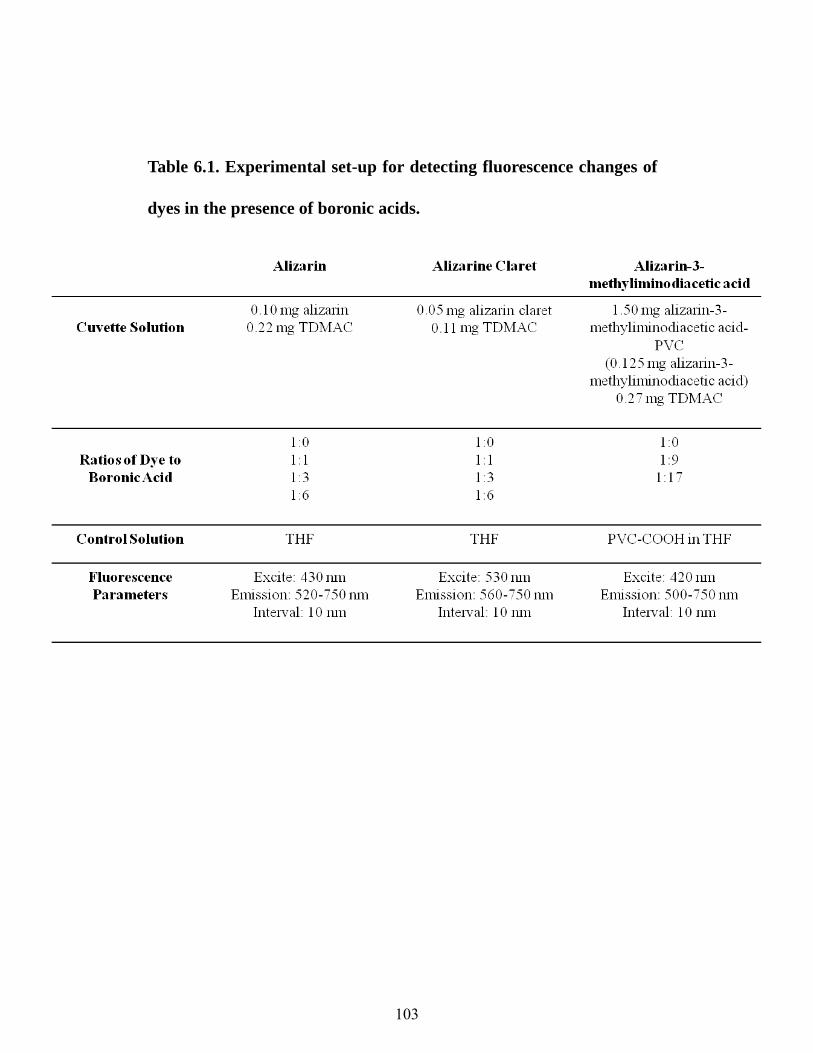
Table 6.1. Experimental set-up for detecting fluorescence changes of
dyes in the presence of boronic acids.
103

Polymer Composition of the Optode. Formulation 1 was made from the following components:
30 mg high molecular weight PVC-COOH, 60 μl DOS, 3.0 mg octylboronic acid, 4.0 mg
TDMAC, and 1.0 mg alizarin. These materials were charged into a glass vial and then dissolved
in 500 μl THF. Formulation 2 was made from the following components: 30 mg PCL, 60 μl
Citroflex A-6, 16.5 mg 3-fluoro-4-methoxycarbonylphenylboronic acid, 2.0 mg TDMAC, and
1.0 mg alizarin. These materials were charged into a glass vial and then dissolved in 500 μl
THF.
Reversibility of the Macrosensor. Reversibility was determined similar to Chapters 2 and 3.
Data was acquired in a Spectramax Gemini EM microplate fluorometer (Molecular Devices,
Sunnyvale, CA, USA) with excitation and emission set to 460 and 570 nm, respectively. Optode
(2 μl) of each formulation was pipetted onto the bottom of a 96-well optical bottom plate each
containing a glass cover slip. The optodes were then allowed to dry at least 15 minutes forming
macrosensors. Each optode was hydrated in 200 µL PBS (pH=7.4) overnight. After the optodes
were hydrated, the PBS solution was removed from all wells and 200 μl of 0.1 M glucose in PBS
was pipetted into half of the wells. The remaining wells acted as controls and contained fresh
glucose-free PBS. In order to track the changes in the fluorescence response, measurements
were acquired at a sampling rate of 5 minutes for 60 minutes. Then, all solutions (glucose and
control) were removed and 200 μl of fresh PBS was added to all wells. Again, measurements
were obtained every 5 minutes for 60 minutes. Response was determined by the percent change
difference between the average intensity of the glucose and control. The fluorescence intensity
of each sensor was normalized to time zero and then the average was taken for each experimental
group. The average of the experimental group was subtracted from the control group and
multiplied by 100 to obtain a percent change. The error was calculated using error propagation.
104

Calibration of the Macrosensor. Data was acquired in a Spectramax Gemini EM microplate
fluorometer (Molecular Devices, Sunnyvale, CA, USA). Macrosensors were fabricated using the
method above. Each macrosensor/optode was hydrated in 200 µL PBS (pH=7.4) overnight. At
the end of this period, the PBS solution was removed and another 200 µL of fresh PBS was
added to the wells. In order to track the changes in the fluorescence response, measurements
were acquired at a sampling rate of 5 minutes for 60 minutes. The PBS solution was then
replaced with 200 μl of 1 mM glucose in PBS (pH = 7.4) for the experimental wells and fresh
PBS for the control wells. The optodes were allowed to equilibrate again for 60 minutes. The
process was repeated for 5 mM, 10 mM, 30 mM, 50 mM, and 100 mM in PBS. The
fluorescence of each sensor was normalized to the first time point of 0 mM glucose. The
normalized response of all sensors within each group at the 60 minute time point was averaged.
The average of the experimental group was then subtracted from the control group. The
difference was multiplied by 100 to express the difference in response as a percent. The percent
difference was plotted against the log of the glucose concentration.
6.4 Results and Discussion
Fluorescent Dye Response to Boronic Acids. Several key criteria were used to assess new
fluorescent dyes for incorporation into glucose-sensitive nanosensors. First, the dye must
contain a 1,2-diol which experiences a change in fluorescence intensity upon binding to the
boronic acid sensing moiety. Figure 6.2A shows an increase in fluorescence intensity of alizarin,
the currently used dye, in the presence of increasing boronic acid concentration. This binding
must be reversible for dynamic glucose sensing. Second, the dye must be hydrophobic to
minimize leaching. Third, the dye must have red shifted fluorescence emission to be visualized
105
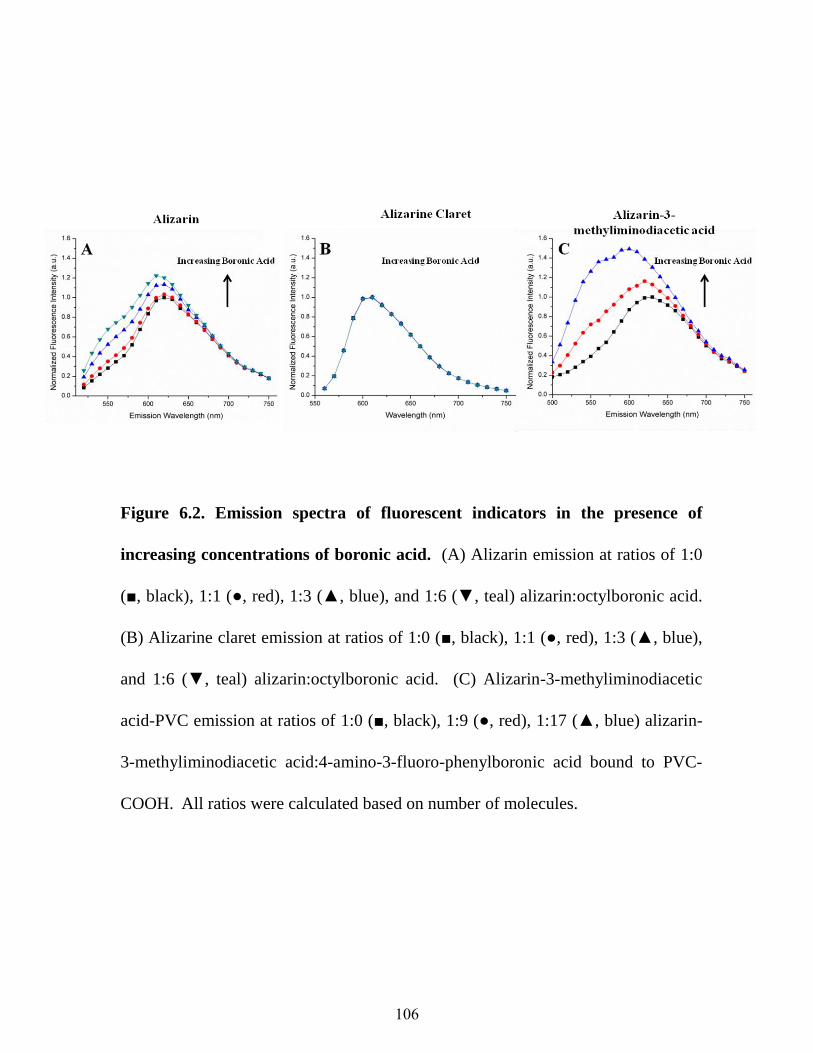
Figure 6.2. Emission spectra of fluorescent indicators in the presence of
increasing concentrations of boronic acid. (A) Alizarin emission at ratios of 1:0
(■, black), 1:1 (●, red), 1:3 (▲, blue), and 1:6 (▼, teal) alizarin:octylboronic acid.
(B) Alizarine claret emission at ratios of 1:0 (■, black), 1:1 (●, red), 1:3 (▲, blue),
and 1:6 (▼, teal) alizarin:octylboronic acid. (C) Alizarin-3-methyliminodiacetic
acid-PVC emission at ratios of 1:0 (■, black), 1:9 (●, red), 1:17 (▲, blue) alizarin-
3-methyliminodiacetic acid:4-amino-3-fluoro-phenylboronic acid bound to PVC-
COOH. All ratios were calculated based on number of molecules.
106

through the skin. To meet these requirements, two diol containing dyes were tested: alizarine
claret and alizarin-3-methyliminodiacetic acid. Alizarine claret has red shifted fluorescence
emission and amine groups for potential conjugation to the polymeric sensor platform. Direct
conjugation of the dye would prevent dye leaching over longer periods of time. However, Figure
6.2B shows that in the presence of increasing boronic acid concentration, alizarine claret does
not undergo a resulting change in fluorescence intensity. Additionally, several other boronic
acids were tested, but none were able to cause a change in alizarine claret fluorescence indicating
that either boronic acids cannot bind to the dye or no change occurs upon binding (data not
shown). Similar to the standard alizarin (Figure 6.2A), alizarin-3-methyliminodiacetic acid
demonstrated an increase in fluorescence intensity with increasing boronic acid concentration
(Figure 6.2C). Alizarin-3-methyliminodiacetic acid also contains two free carboxylic acid
groups that were further used for functionalization and conjugated to polyvinyl chloride amine.
However, when incorporated into sensors, the sensors did not respond to glucose. The absence
of response may be caused by insufficient concentrations of alizarin-3-methyliminodiacetic acid
conjugated to the polyvinyl chloride or inhibited dye mobility when the polymer is not in
solution. A summary of each dye is presented in Table 6.2. Since neither alizarin-3-
methyliminodiacetic acid or alizarine claret was an improvement over alizarin, alizarin was used
in all future studies.
Boronic Acid Selection. The presence of electron withdrawing groups on boronic acids has
been cited as a way to improve boronic acid binding to diols at physiological pH levels.115,116
Octylboronic acid is currently the sensing moiety incorporated in the glucose-sensitive
nanosensors. Though octylboronic acid can sense glucose at pH 7.4, its response to glucose
dramatically increases at pH 12 (data not shown). Octylboronic acid contains no electron
107
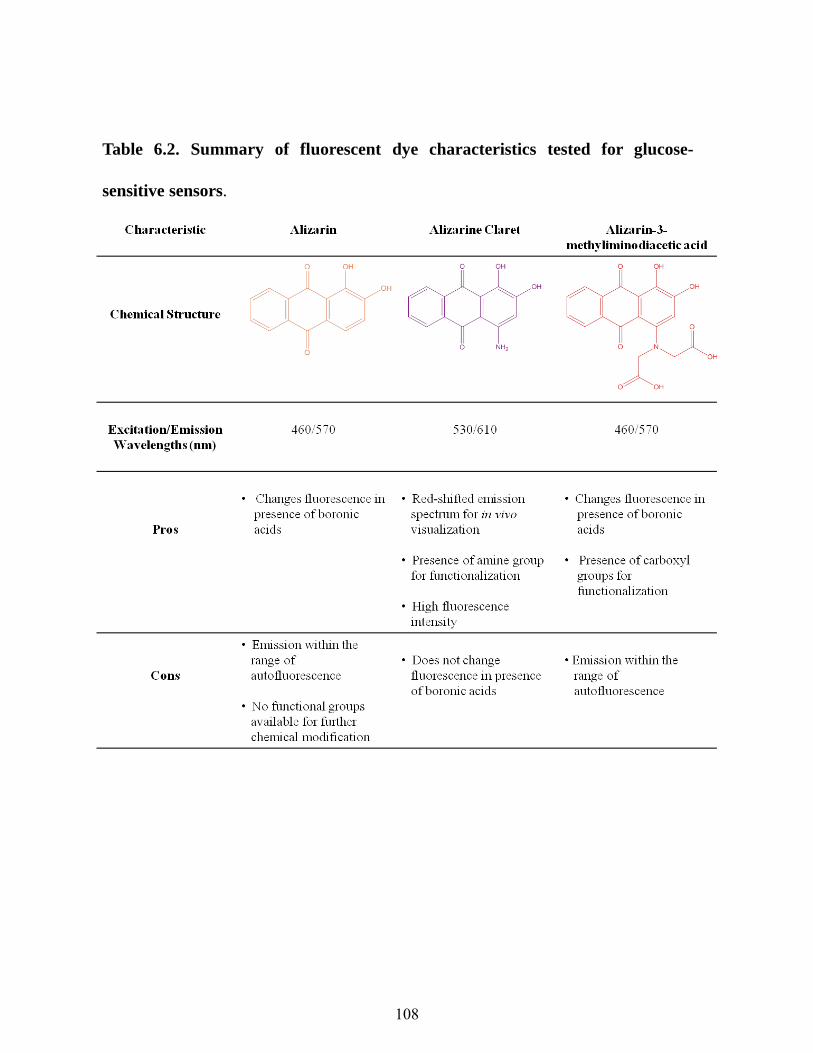
Table 6.2. Summary of fluorescent dye characteristics tested for glucose-
sensitive sensors.
108

withdrawing groups, but was selected because its hydrophobicity is compatible with our sensor
platform. However, at this point in sensor design, sensor dynamic range and sensitivity needs
improvement to meet clinical application criteria. Therefore, boronic acids with different
electron withdrawing groups (i.e. nitro, fluoro, carboxyl) and additional functional groups for
future chemical modifications were tested (data not shown). Of the compounds tested, phenyl
boronic acids with fluorinated groups attached to the phenyl ring showed the greatest fluorescent
response to glucose at pH 7.4. Figure 6.3 shows the response to glucose with sensors containing
3-fluoro-4-methoxycarbonylphenylboronic acid compared to our traditional glucose sensors.
Figure 6.3A shows fluorescence response of sensors to 100 mM glucose and then fluorescence
reversibility when glucose was removed. Figure 6.3B shows the fluorescence response of
glucose sensors to increasing glucose levels up to 100 mM glucose. The new sensors yielded a
5% response to 100 mM glucose with a calibrated response to glucose. In contrast, our
traditional glucose sensors with octylboronic acid showed approximately a 0.5% change in
fluorescence intensity to 100 mM glucose. The new sensor formulation with 3-fluoro-4-
methoxycarbonylphenylboronic acid can be improved by tailoring the ratio of components for
greater response in the physiological range. Table 6.3 compares the two sensor formulations
based on important sensor characteristics. In addition to a greater response, the updated
formulation includes the newly developed biodegradable sensor platform detailed in Chapter 6.
A drawback of the updated sensor formulation is that 3-fluoro-4-methoxycarbonylphenylboronic
acid does not have a fully reversible fluorescence response to glucose. Full recovery of the
signal may be prevented by the boronic acid binding tightly to glucose or leaching of boronic
acid from the sensor. Future work involves modification of the carboxyl functional group such
109
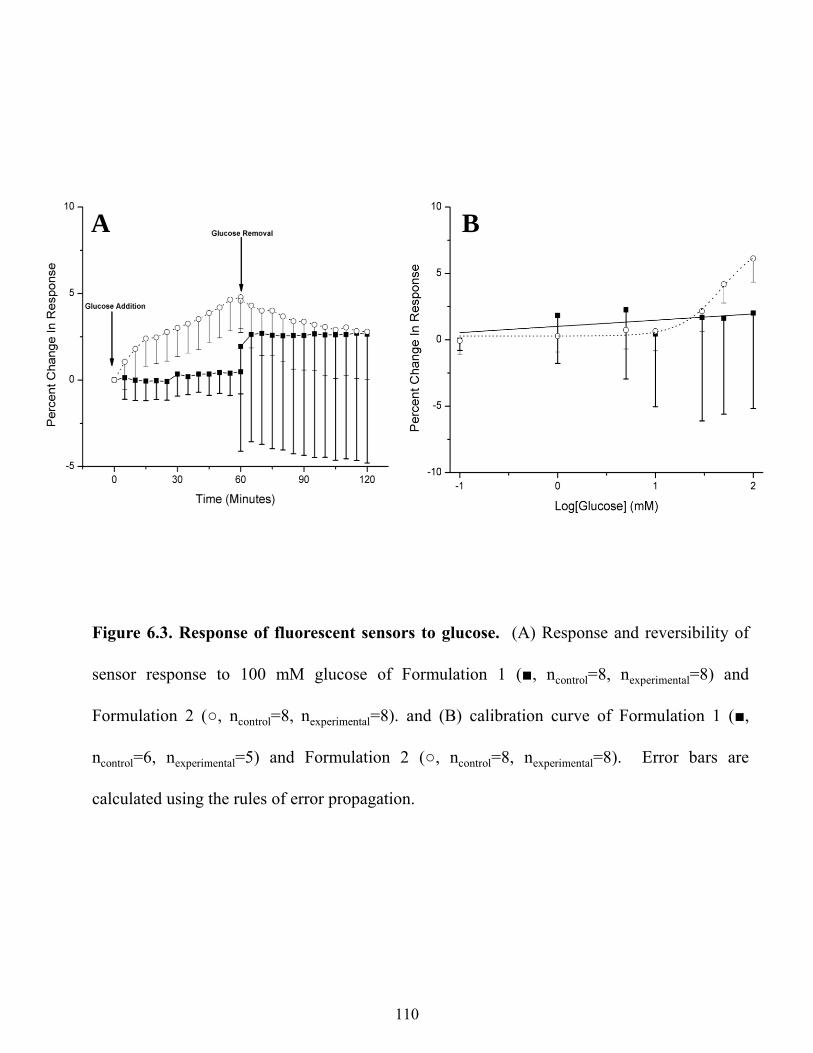
A B
Figure 6.3. Response of fluorescent sensors to glucose. (A) Response and reversibility of
sensor response to 100 mM glucose of Formulation 1 (■, ncontrol=8, nexperimental=8) and
Formulation 2 (○, ncontrol=8, nexperimental=8). and (B) calibration curve of Formulation 1 (■,
ncontrol=6, nexperimental=5) and Formulation 2 (○, ncontrol=8, nexperimental=8). Error bars are
calculated using the rules of error propagation.
110
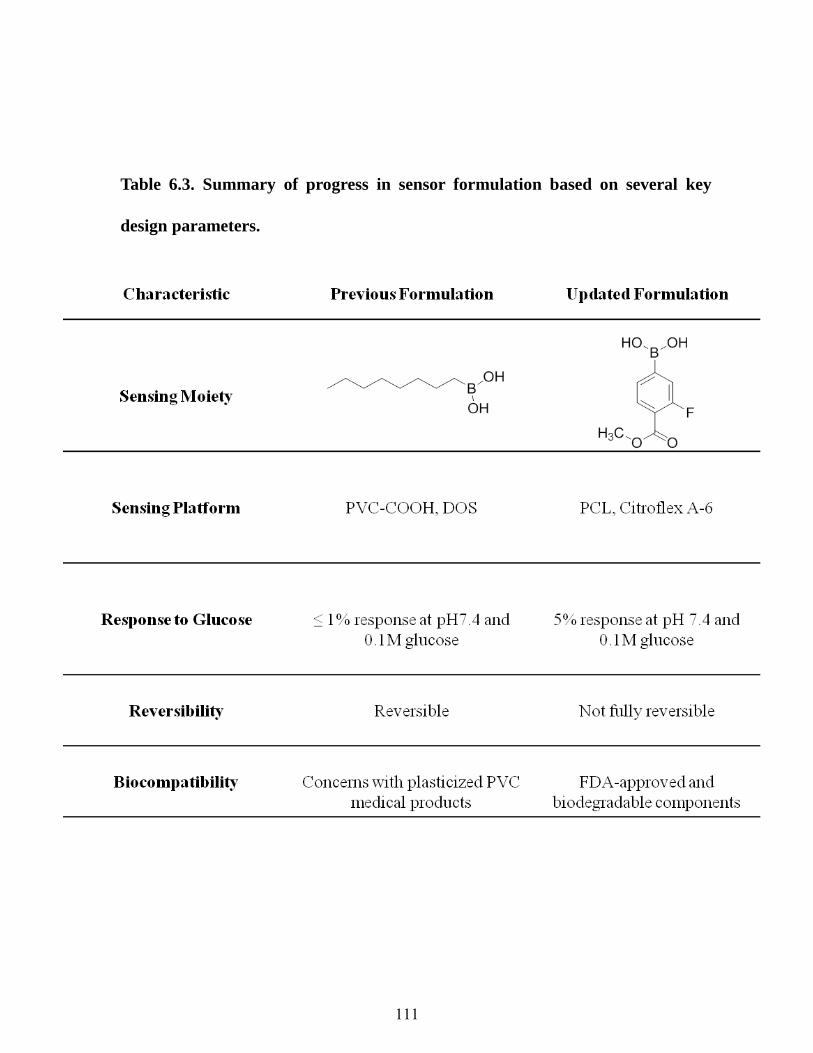
Table 6.3. Summary of progress in sensor formulation based on several key
design parameters.
111

as extension of the methyl group to longer alkane chains to improve boronic acid
hydrophobicity.
6.5 Conclusions
Glucose-sensitive nanosensors demonstrated a poor dynamic range of detection and
leaching of sensor components. Therefore, alternatives to the sensing moiety and fluorescent
dye were tested. The alizarin derivative, alizarin-3-methyliminodiacetic acid, demonstrated
strong changes in fluorescence in the presence of boronic acids and contained functional groups
for conjugation to the polymeric platform. However, when incorporated into sensors, the
conjugated dye did not yield a response to glucose. In contrast, selection of fluorinated boronic
acids improved the response of the sensors over the previous formulation, but chemical
modification of these boronic acids is still necessary to prevent leaching from the nanosensors.
6.6 Acknowledgements
I would like to thank Yi Luo for his help in boronic acid and fluorescent dye testing and
functionalizing these components to polymers. Funding for this project was provided by
Northeastern University’s internal Tier 1 grant.
112

Chapter 7: Electrospun Nanofibrous Sensors for Analyte Detection
7.1 Chapter Overview
In initial in vivo studies (Chapters 3 and 4),117,118 nanosensor migration away from the site
of injection limited their monitoring time. In this chapter, fibrous scaffolds composed of glucose
sensor components were fabricated with electrospinning in order to generate scaffolds which are
large enough to eliminate migration, but small enough to retain reasonable response time.
Scaffolds with fibers less than 5 μm in diameter were produced and yielded an optical response
to glucose. Future work will involve testing the scaffold lifetime in vivo.
7.2 Introduction
Preliminary in vivo experiments show the feasibility of fluorescent glucose-sensitive
nanosensors to track changes in glucose levels,119 but short in vivo lifetimes due to particle
migration away from and cellular uptake at the injection site have stagnated the progress of these
nanosensors as an in vivo monitoring tool. Various approaches have been used to overcome
these issues such as nanosensor immobilization into gels (Chapter 4)118 and altering sensor
geometry.71 Gel immobilization extended sensor lifetime at the injection site over the course of
hours, but did not provide a long-term solution to sensor migration.118 As an alternative to the
gels, Dubach et al. showed that changing sensor geometry from spherical to cylindrical
(microworms) prevented intensity loss at the injection site over the course of one hour.120
However, their fabrication was tedious and did not result in a high sensor yield for sufficient in
vivo signal or larger in vivo studies.
113

Electropsinning is a commonly used, high rate, and scalable manufacturing technique for
making nanofibrous scaffolds. This technique increases sensor size relative to nanosensors while
retaining the advantageous features of nanoparticle and microworm geometry such as fast
response times. Electrospinning uses high voltages to charge a polymer solution that produces
fibers accelerating towards ground.121 This process produces fibers that range in diameter from
several nanometers up to 5µm. The fiber diameter can be controlled by adjusting the polymer
concentration in the solution, solvent selection, solution conductivity, and solution flow rate.
Additionally, fiber alignment121 and scaffold porosity122 can also be changed for example by
using a rotating drum collector and ultrasonication post modification123, respectively.
Electrospun scaffolds have high surface area to volume ratios and porosities between 80 and
90% that will allow for sufficient diffusion of extracellular fluid and fast response times of the
fibers. Other groups have utilized electrospinning to fabricate sensors for the detection of
silver,124 mercury,125 nitroaromatics,126 and glucose.127 The sensors previously developed,
however, were only tested in vitro. This research sets the groundwork for eventual in vivo
application.
7.3 Materials and Methods
Materials. Polycaprolactone (Mn 70,000-90,000)(PCL), tridodecylmethylammonium chloride
(TDMAC), alizarin, 3-fluoro-4-methoxycarbonylphenylboronic acid (3F4MOCPBA), D-(+)-
glucose, tetrahydrofuran (≥ 99.9%) (THF) were purchased from Sigma Aldrich (St Louis, MO,
USA). Citroflex A-6 was acquired from Vertellus (Indianapolis, IN, USA). Phosphate Buffered
Saline (PBS) (1x, pH = 7.4) was purchased as a solution from Invitrogen (Carlsbad, CA, USA).
114

Optode Cocktail. For production of electrospun scaffolds, the general optode cocktail was made
with a solution of 12% (weight/volume) of PCL and Citroflex A-6. Of this weight percentage,
10% is Citroflex A-6. Specifically, the optode formulation was: 216 mg PCL, 24 µL Citroflex
A-6, 16.5 mg 3F4MOCPBA, 2 mg TDMAC, and 1 mg alizarin in 2 ml THF.
Fabrication of Fibrous Scaffolds. Electrospinning was performed on a Nanospinner NE 200
instrument equipped with a syringe pump (Inovenso). The optode solution was spun at a
distance of 10 cm from the collector with a rate of 3 ml/hr and at an acceleration voltage of 15
kV. The fibers were spun onto either aluminum foil or silanized glass discs attached to
aluminum foil for imaging and testing scaffold response.
Scaffold Response to Glucose. To determine scaffold response to glucose, scaffolds spun onto
glass discs were removed from the aluminum foil using a 6 mm biopsy punch (Miltex, Inc.) and
placed in a 96-well optical bottom well plate. 200 µL of PBS was added to each well and the
sensors were hydrated in PBS overnight. All fluorescence measurements were acquired at 460
nm and 570 nm for excitation and emission wavelengths, respectively using a SpectraMax
Gemini EM plate reader. After hydration, 200 µL of PBS (pH 7.4) as a control and 100 mM
glucose in PBS (pH 7.4) were used to replace the hydration solution. The fluorescent response
of the scaffolds was monitored for 2 hours at 5 minute intervals. To determine sensor
reversibility, the solutions were removed and PBS was placed into all wells (control wells and
experimental wells) after 2 hours. The fluorescence response was then monitored for 1 hour at 5
minute intervals. Fluorescence measurements were normalized to the first time point, averaged
for each experimental group, and then plotted over time.
Fluorescence Imaging. Images of scaffolds were acquired on a Zeiss Confocal Microscope
(Thornwood, NY).
115

SEM Acquisition. Images were acquired on a Hitachi S4800 with a 5kV accelerating voltage.
Samples were not sputter coated.
7.4 Results and Discussion
Electrospinning is a high rate manufacturing technique that produces scaffolds composed
of nano and microfibers. In this work, the benefit of the fibrous structure is two-fold: 1) scaffold
porosity and microstructure does not limit sensor response time and 2) increased surface of the
scaffold will prevent sensor migration and cellular uptake. Images of the scaffold taken using
confocal microscopy and SEM are shown in Figure 7.1A and 7.1B, respectively. Both images
show the scaffold structure and that a majority of fibers were below 5 µm. When the plasticizer
content was 10%, common fiber defects such as beading and wetting were not present
throughout the scaffold; however, as the plasticizer was increased to 30% continuous fibers were
not produced (data not shown).
Figure 7.2 shows the response of glucose-sensitive scaffolds composed with sensor
components optimized in Chapter 6. The scaffolds experienced a less than 10% change in
fluorescence compared to the control. Reversibility of sensor fluorescence was not achieved due
to the selection of boronic acid as mentioned in Chapter 6. Though the scaffolds responded to
glucose, their response time was over an hour. Fiber size of less than 5 µm should yield faster
response times. The slow response time may be due to mass transport effects of glucose
throughout the scaffold. Transport of glucose can be improved by altering the experimental set-
up from a static well-plate environment to a continuous flow chamber testing apparatus.
Response times of less than 5 minutes are necessary to match commercially-available glucose
116
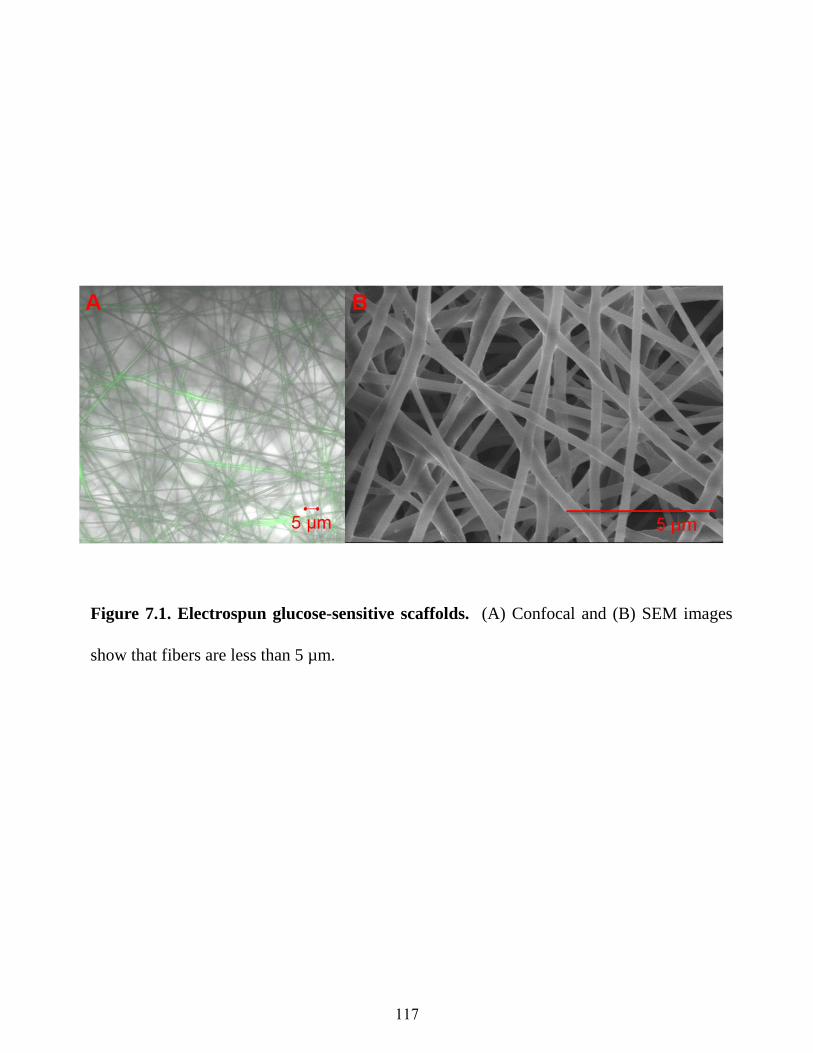
Figure 7.1. Electrospun glucose-sensitive scaffolds. (A) Confocal and (B) SEM images
show that fibers are less than 5 µm.
117

Figure 7.2. Response of glucose-sensitive scaffolds to glucose. Scaffolds were exposed to
either PBS only (■) or 100 mM glucose in PBS (○). After 2 hours, solutions were removed
and all scaffolds were exposed to PBS. Error bars represent standard deviation of normalized
values and only negative error bars are shown for clarity (ncontrol=6 and nglucose=8).
118

monitors. The low plasticizer content of the scaffold may have contributed to the slow response
time and increasing plasticizer content can improve response. However, PCL-based electrospun
scaffolds are rarely produced with plasticizers and even the effect of non-traditional plasticizers
such as water is known to affect fiber mechanical stability.128 Therefore a trade-off exists
between optimal sensor response and fiber integrity. If higher plasticizer contents are required,
then switching to a higher molecular weight PCL or changing to a different polymer may be
necessary. For example, electrospun nanofibers have been fabricated with ethyl cellulose with
up to 40% plasticizer demonstrating that high percentages of plasticizer can be used.124 The slow
response time of the fibers may be improved by fabricating thinner scaffolds that allow for faster
diffusion of glucose throughout the scaffold. Additionally, the current scaffold design contains
only 10% plasticizer content in contrast to 66% plasticizer in traditional optode-based sensors.
The highly plasticized matrix aids the diffusion of sensor components and analytes within the
sensor
7.5 Conclusions
In this chapter, electrospinning fabricated glucose-sensitive scaffolds less than 5 µm in diameter.
The scaffolds responded to glucose, but improvements to sensor design are still required to
decrease scaffold response time and scaffold reversibility. In addition to improving scaffold
response, future work will also include in vivo testing to determine if the new scaffold design
lengthens sensor lifetime.
7.6 Acknowledgements
119

I would like to thank Dr. Chris Skipwith for acquiring SEM images of the scaffolds. Funding for
this project was provided by Northeastern University’s internal Tier 1 grant.
120

Chapter 8: Conclusions and Future Directions
The global epidemic of diabetes spurred development of fluorescent sensors to monitor
glucose levels minimally invasively. The advantages of fluorescent glucose-sensitive
nanosensors designed in this dissertation include fast response times, easy in vivo implantation,
non-invasive and continuous measurements, and biodegradable and nonbiological components.
The sensor development process began with basic design principles such as glucose extraction
into a hydrophobic sensor platform and sensor response at physiologically relevant
concentrations (Chapters 2 and 3).69,117 After these basic requirements were achieved, the sensor
design evolved to meet stringent requirements for monitoring glucose levels in vivo: sensor
sensitivity (Chapter 6), lifetime (Chapter 6), immobilization (Chapters 4 and 7)118 and
biocompatibility (Chapter 5).129 To this end, the sensor was transformed into a biodegradable
platform composed of the FDA approved polymer, PCL (Chapter 5).129 The sensors degrade into
biologically safe components in the presence of degradative enzymes (Chapter 5).129 For
minimizing sensor diffusion in vivo, sensors were encapsulated in hydrogels (Chapter 4)118 and
new sensor geometries (Chapter 7) were explored. Gel encapsulation offered only minimal
extension to in vivo lifetime118 and thus, the sensor platform was transformed from nanoparticle
to nanofibrous scaffold (Chapter 7). Scaffold-based sensors were designed that responded to
glucose (Chapter 7) and further improvements to the sensing mechanism such as sensor
sensitivity were achieved (Chapter 6).
This dissertation highlights the progress and continual design of glucose-sensitive
nanosensors, but several obstacles still remain before they are applied to a clinical setting.
Currently, the sensors do not respond to changes in glucose levels in the hypoglycemic range.
121

Inclusion of electron withdrawing groups, such as fluoride, to the boronic acid sensing moiety
improved sensor response at physiological pH (Chapter 6), but these sensors were not fully
reversible. Hydrophilicity of the boronic acids may cause lack of reversibility and chemical
modification of the methyl group on 3-fluoro-4-methoxycarbonylphenylboronic acid into longer
alkane chains is being explored to improve lipophilicity while retaining glucose response. Future
work will also involve synthesis or chemical modification of diol-containing fluorescent dyes
that fluoresce in the near infrared red (NIR). Emission in the NIR is important for in vivo
monitoring in order to visualize the sensors above the autofluorescence of the skin.40 Lastly,
inclusion of a reference will occur after selection of a new diol-based fluorescent dye. Previous
work on including a reference dye was unsuccessful because the broad excitation and emission
spectrum of alizarin interfered with the fluorescence of several potential reference dyes (data not
included). Ratiometric readings with a reference dye and fluorescent changes of the diol-based
indicator will generate sensors capable of quantitative measurements.
In addition to optimizing sensor components, extensive characterization of the sensors
beyond what is presented here is necessary. An important criterion for the sensors will be their
performance in the Clarke Error Grid Analysis.130 The Clarke Error Grid is the gold standard for
measuring the accuracy of glucose meters. A response within 20% of the reference method is
within the clinically acceptable region.130 Generation of at least an in vitro Clarke Error Grid
with clinical samples will help to determine if further sensor development is necessary before
extensive in vivo characterization. Once sensor development has advanced in vitro, several key
in vivo studies should be performed that involve sensor response, sensor lifetime, and sensor
biodistribution. Initial in vivo studies of the sensors were limited to one hour because of sensor
migration away from the site of injection. This limitation prevented sensor tracking of multiple
122

cycles of hypo and hyperglycemic events in vivo. With nanofibrous scaffolds, sensing lifetime
should be extended and thus capture these events. The ultimate goal is for the scaffolds to
extend in vivo sensing to at least seven days. Lastly, from a regulatory perspective, the sensors
are biodegradable and conducting biodistribution studies will determine if sensor components are
accumulating in various organs or being excreted.
The fluorescent glucose sensors presented have applications in both clinical and research
settings. As presented in this thesis, the current state of the art for these sensors includes
fabrication with biocompatible polymers, a suite of potential dyes, attachment chemistries, and
multiple structures from nanoscale to macroscale. The sensors have a controllable response
range, lifetime, and response time. Additionally, gel encapsulation and alternative sensor
geometries are now available for controlling in vivo sensor migration. This thesis demonstrated
the progress in design of glucose-sensitive nanosensors with notable achievements in the optode
sensor field that include the first demonstration of sensors for small molecules using only non-
biological components and the demonstration of the first biodegradable sensors. With this
groundwork complete, future work will optimize sensor components and move preclinical testing
of the sensors forward.
Fin
123
Chapter 9: References
1. CDC. National diabetes fact sheet: national estimates and general information on diabetes and prediabetes in the United States. (2011).
2. Yang, W., Lu, J., Weng, J., Jia, W., Ji, L., Xiao, J., Shan, Z., Liu, J., Tian, H., Ji, Q., Zhu,
D., Ge, J., Lin, L., Chen, L., Guo, X., Zhao, Z., Li, Q., Zhou, Z., Shan, G. & He, J. Prevalence of Diabetes among Men and Women in China. N Engl J Med 362, 1090-1101, (2010).
3. International Diabetes Atlas. (International Diabetes Federation).
4. Shaw, J. E., Sicree, R. A. & Zimmet, P. Z. Global estimates of the prevalence of diabetes
for 2010 and 2030. Diabetes Res Clin Pract 87, 4-14, (2010).
5. Association, A. D. Economic costs of diabetes in the U.S. in 2012. Diabetes Care 36,
1033-1046, (2013).
6. Pickup, J. C., Hussain, F., Evans, N. D. & Sachedina, N. In vivo glucose monitoring: the
clinical reality and promise. Biosens Bioelectron 20, 1897-1902, (2005).
7. FDA. P050012/S001 STS-7 Continuous Glucose Monitoring System. (2007).
8. FDA. P980022/S015 Guardian REAL-Time and Paradigm REAL-Time Systems. (2007).
9. Dubach, J. M., Harjes, D. I. & Clark, H. A. Fluorescent Ion-Selective Nanosensors for
Intracellular Analysis with Improved Lifetime and Size. Nano Lett 7, 1827-1831, (2007).
10. Billingsley, K., Balaconis, M. K., Dubach, J. M., Zhang, N., Lim, E., Francis, K. P. &
Clark, H. A. Fluorescent Nano-Optodes for Glucose Detection. Anal Chem 82, 3707-3713, (2010).
11. Dubach, J. M., Das, S., Rosenzweig, A. & Clark, H. A. Visualizing sodium dynamics in
isolated cardiomyocytes using fluorescent nanosensors. Proc Natl Acad Sci 106, 16145-16150, (2009).
124

12. Tickner, J. A., Schettler, T., Guidotti, T., McCally, M. & Rossi, M. Health risks posed by use of Di-2-ethylhexyl phthalate (DEHP) in PVC medical devices: A critical review. Am J Ind Med 39, 100-111, (2001).
13. Rahman, M. & Brazel, C. S. The plasticizer market: an assessment of traditional
plasticizers and research trends to meet new challenges. Prog Polym Sci 29, 1223-1248, (2004).
14. Wang, J. Electrochemical glucose biosensors. Chem Rev 108, 814-825, (2008).
15. Heller, A. & Feldman, B. Electrochemical Glucose Sensors and Their Applications in
Diabetes Management. Chem Rev 108, 2482-2505, (2008).
16. McGarraugh, G. The chemistry of commercial continuous glucose monitors. Diabetes
Technol Ther 11 Suppl 1, S17-24, (2009).
17. Klueh, U., Liu, Z., Cho, B., Ouyang, T., Feldman, B., Henning, T. P., Kaur, M. &
Kreutzer, D. Continuous Glucose Monitoring in Normal Mice and Mice with Prediabetes and Diabetes. Diabetes Technol Ther 8, (2006).
18. Klueh, U. & Kreutzer, D. Murine Model of Implantable Glucose Sensors: A Novel
Model for Glucose Sensor Development. Diabetes Technol Ther 7, 727-737, (2005).
19. Asher, S. A., Alexeev, V. L., Goponenko, A. V., Sharma, A. C., Lednev, I. K., Wilcox,
C. S. & Finegold, D. N. Photonic crystal carbohydrate sensors: low ionic strength sugar sensing. J Am Chem Soc 125, 3322-3329, (2003).
20. Ben-Moshe, M., Alexeev, V. L. & Asher, S. A. Fast responsive crystalline colloidal array
photonic crystal glucose sensors. Anal Chem 78, 5149-5157, (2006).
21. Burmeister, J. J., Arnold, M. A. & Small, G. W. Noninvasive Blood Glucose
Measurements by Near-Infrared Transmission Spectroscopy Across Human Tongues. Diabetes Technol Ther 2, 5-16, (2000).
22. Russell, R. J., Pishko, M. V., Gefrides, C. C., McShane, M. J. & Cote, G. L. A
fluorescence-based glucose biosensor using concanavalin A and dextran encapsulated in a poly(ethylene glycol) hydrogel. Anal Chem 71, 3126-3132, (1999).
125
23. Rounds, R. M., Ibey, B. L., Beier, H. T., Pishko, M. V. & Cote, G. L. Microporated PEG spheres for fluorescent analyte detection. J Fluoresc 17, 57-63, (2007).
24. Bakker, E., Buhlmann, P. & Pretsch, E. Carrier-Based Ion-Selective Electrodes and Bulk
Optodes. 1. General Characteristics. Chem Rev 97, 3083-3132, (1997).
25. Johnson, R. D. & Bachas, L. G. Ionophore-based ion-selective potentiometric and optical
sensors. Anal Bioanal Chem 376, 328-341, (2003).
26. Brasuel, M. G., Miller, T. J., Kopelman, R. & Philbert, M. A. Liquid polymer nano-
PEBBLEs for Cl- analysis and biological applications. Analyst 128, 1262-1267, (2003).
27. Clark, H., Barker, S., Brasuel, M. G., Miller, M., Monson, E., Parus, S., Shi, Z., Song, A.,
Thorsrud, B., Kopelman, R., Ade, A., Meixner, W., Athey, B., Hoyer, M., Hill, D., Lightle, R. & Philbert, M. A. Subcellular optochemical nanobiosensors: probes encapsulated by biologically localised embedding (PEBBLEs). Sens Actuators B, 12 - 16, (1998).
28. Clark, H. A., Hoyer, M., Parus, S., Philbert, M. A. & Kopelman, M. Optochemical
nanosensors and subcellular applications in living cells. Mikrochim. Acta 131, 121-128, (1999).
29. Clark, H., Hoyer, M., Philbert, M. & Kopelman, R. Optical nanosensors for chemical
analysis inside single living cells. 1. Fabrication, characterization, and methods for intracellular delivery of PEBBLE sensors. Anal Chem 71, 4831-4836, (1999).
30. Clark, H., Kopelman, R., Tjalkens, R. & Philbert, M. Optical nanosensors for chemical
analysis inside single living cells. 2. Sensors for pH and calcium and the intracellular application of PEBBLE sensors. Anal Chem 71, 4837-4843, (1999).
31. Brasuel, M., Kopelman, R., Kasman, I., Miller, T. J. & Philbert, M. A. in Sensors, 2002.
Proceedings of IEEE. 288-292 vol.281.
32. Dubach, J. M., Harjes, D. I. & Clark, H. A. Ion-Selective Nano-optodes Incorporating
Quantum Dots. J Am Chem Soc, (2007).
33. Arimori, S., Ward, C. J. & James, T. D. A D-glucose selective fluorescent assay.
Tetrahedron Lett 43, 303-305, (2002).
126

34. Springsteen, G. & Wang, B. Alizarin Red S. As a General Optical Reporter for Studying
the Binding of Boronic Acids with Carbohydrates. Chem Commun (Camb), 1608-1609, (2001).
35. Ma, W. M., Pereira Morais, M. P., D'Hooge, F., van den Elsen, J. M., Cox, J. P., James,
T. D. & Fossey, J. S. Dye displacement assay for saccharide detection with boronate hydrogels. Chem Commun (Camb), 532-534, (2009).
36. James, T. D., Sandanayake, K. & Shinkai, S. Saccharide sensing with molecular receptors
based on boronic acid. Angew Chem Int Ed Engl 35, 1910-1922, (1996).
37. Hall, D. G. Boronic Acids: Preparation and Applications in Organic Synthesis and
Medicine. (2005).
38. Riggs, J. A. & Smith, B. D. Facilitated Transport of Small Carbohydrates through
Plasticized Cellulose Triacetate Membranes. Evidence for Fixed-Site Jumping Transport Mechanism. J Am Chem Soc 119, 2765-2766, (1997).
39. White, K. M., Smith, B. D., Duggan, P. J., Sheahan, S. L. & Tyndall, E. M. Mechanism
of facilitated saccharaide transport through plasticized cellulose triacetate membranes. J Memb Sci 194, 165-175, (2001).
40. Frangioni, J. V. In Vivo Near-Infrared Fluorescence Imaging. Curr Opin Chem Biol 7,
626-634, (2003).
41. Clark, H. A., Hoyer, M., Parus, S., Philbert, M. A. & Kopelman, R. Optochemical
Nanosensors and Subcellular Applications in Living Cells. Mikrochim. Acta 131, 121 - 128, (1999).
42. Brasuel, M., Kopelman, R., Kasman, I., Miller, T. J. & Philbert, M. A. Ion
Concentrations in Live Cells From Highly Selective Ion Correlation Fluorescent Nano-Sensors for Sodium. Proc IEEE 1, 288-292, (2002).
43. Xu, H., Aylott, J. & Kopelman, R. Fluorescent nano-PEBBLE sensors designed for
intracellular glucose imaging. Analyst 127, 1471-1477, (2002).
44. Rosenzweig, Z. & Kopelman, R. Analytical properties and sensor size effects of a
micrometer-sized optical fiber glucose biosensor. Anal Chem 68, 1408–1413, (1996).
127

45. Singh, M., Verma, N., Garg, A. K. & Redhu, N. Urea Biosensors. Sens Actuators B 134,
345-351, (2008).
46. Hall, D. G. Boronic Acids: Preparation and Applications in Organi Synthesis and
Medicine. (2005).
47. Alexeev, V. L., Sharma, A. C., Goponenko, A. V., Das, S., Lednev, I. K., Wilcox, C. S.,
Finegold, D. N. & Asher, S. A. High ionic strength glucose-sensing photonic crystal. Anal Chem 75, 2316-2323, (2003).
48. Springsteen, G. & Wang, B. A detailed examination of boronic acid-diol complexation.
Tetrahedron 58, 5291-5300, (2002).
49. McGarraugh, G. & Sharp, C. Performance diffrerences between off-finger glucose
monitors-freestyle blood glucose monitoring system and one touch ultra blood glucose monitoring system. (TheraSense, Inc, 2001).
50. Malvern, I. Zetasizer Nano Series User Manual. (2005).
51. Hrabe de Angelis, M., Chambon, P. & Brown, S. D. M. Standards of Mouse Model
Phenotyping. Illustrated edn, (Wiley-VCH, 2006).
52. Tuchin, V. V. Handbook of Optical Sensing of Glucose in Biological Fluids and Tissues.
Illustrated edn, 421 (CRC Press, 2008).
53. Patterson, S., Smith, B. D. & Taylor, R. E. Fluorescence Sensing of a Ribonucleoside 5'-
Triphosphate. Tetrahedron Lett 38, 6323-6326, (1997).
54. Gibney, M. J. Introduction to Human Nutrition. 2, Illustrated edn, Vol. 1 77 (Wiley-
Blackwell, 2009).
55. Flindt, R. Amazing Numbers in Biology. English edn, (Springer-Verlag, 2006).
56. Sabnis, R. W. Handbook of acid-base indicators. Illustrated edn, (CRC Press, 2007).
57. FDA. OneTouch Ultra Blood Glucose Monitoring System 510(k) Summary. 5, (2006).
128
58. Hoff, J. Methods of Blood Collection in the Mouse. Lab Anim 29, 7, (2000).
59. Glassberg, B. Y. The arteriovenous difference in blood sugar content. Arch Intern Med
46, 605-609, (1930).
60. Nielsen, J. K., Djurhuus, C. B., Gravholt, C. H., Carus, A. C., Granild-Jensen, J., Orskov,
H. & Christiansen, J. H. Continuous Glucose Monitoring in Interstitial Subcutaneous Adipose Tissue and Skeletal Muscle Reflects Excursions in Cerebral Cortex. Diabetes 54, 1635-1639, (2005).
61. Bolincier, J., Ungerstedt, U. & Arner, P. Microdialysis measurement of the absolute
glucose concentration in subcutaneous adipose tissue allowing glucose monitoring in diabetic patients. Diabetologia 35, 1177-1180, (1992).
62. Schaupp, L., Ellmerer, M., Brunner, G. A., Wutte, A., Sendlhofer, G., Trajanoski, Z.,
Skrabal, F., Pieber, T. R. & Wach, P. Direct access to interstitial fluid in adipose tissue in humans by use of open-flow microperfusion. Am J Physiol Endocrinol Metab 276, 401-408, (1999).
63. Pickup, J. C., Zhi, Z. L., Khan, F., Saxl, T. & Birch, D. J. S. Nanomedicine and its
potential in diabetes research and practice. Diabetes Metab Res Rev 24, 604-610, (2008).
64. Steiner, M. S., Duerkop, A. & Wolfbeis, O. S. Optical methods for sensing glucose.
Chem Soc Rev 40, 4805-4839, (2011).
65. Cash, K. J. & Clark, H. A. Nanosensors and nanomaterials for monitoring glucose in
diabetes. Trends Mol Med 16, 584-593, (2010).
66. Chaudhary, A., Harma, H., Hanninen, P., McShane, M. J. & Srivastava, R. Glucose
Response of Near-Infrared Alginate-Based Microsphere Sensors Under Dynamic Reversible Conditions. Diabetes Technol Ther 13, 827-835, (2011).
67. D'Auria, S., Herman, P., Rossi, M. & Lakowicz, J. R. The Fluorescence Emission of the
Apo-glucose Oxidase from Aspergillus niger as Probe to Estimate Glucose Concentrations. Biochem Biophys Res Commun 263, 550-553, (1999).
129

68. Wang, Q. S., Li, G. Q., Mao, W. Y., Qi, H. X. & Li, G. W. Glucose-responsive vesicular sensor based on boronic acid-glucose recognition in the ARS/PBA/DBBTAB covesicles. Sens Actuators B Chem 119, 695-700, (2006).
69. Balaconis, M. K., Billingsley, K., Dubach, M. J., Cash, K. J. & Clark, H. A. The design
and development of fluorescent nano-optodes for in vivo glucose monitoring. J Diabetes Sci Technol 5, 68-75, (2011).
70. Gopee, N. V., Roberts, D. W., Webb, P., Cozart, C. R., Siitonen, P. H., Warbritton, A. R.,
Yu, W. W., Colvin, V. L., Walker, N. J. & Howard, P. C. Migration of Intradermally Injected Quantum Dots to Sentinel Organs in Mice. Toxicol Sci 98, 249-257, (2007).
71. Ozaydin-Ince, G., Dubach, J. M., Gleason, K. K. & Clark, H. A. Microworm optode
sensors limit particle diffusion to enable in vivo measurements. Proc Natl Acad Sci, (2011).
72. Li, Y. L., Rodrigues, J. & Tomas, H. Injectable and biodegradable hydrogels: gelation,
biodegradation and biomedical applications. Chem Soc Rev 41, 2193-2221, (2012).
73. Kleinman, H. K. & Martin, G. R. Matrigel: Basement membrane matrix with biological
activity. Semin Cancer Biol 15, 378-386, (2005).
74. Serban, M. A., Scott, A. & Prestwich, G. D. in Current Protocols in Cell Biology (John
Wiley & Sons, Inc., 2001).
75. Zaman, M. H., Trapani, L. M., Siemeski, A., MacKellar, D., Gong, H. Y., Kamm, R. D.,
Wells, A., Lauffenburger, D. A. & Matsudaira, P. Migration of tumor cells in 3D matrices is governed by matrix stiffness along with cell-matrix adhesion and proteolysis. Proc Natl Acad Sci 103, 10889-10894, (2006).
76. Suckow, M. A., Danneman, P. & Brayton, C. The Laboratory Mouse. (CRC Press,
2000).
77. Hannoun, B. J. M. & Stephanopoulos, G. Diffusion coefficients of glucose and ethanol in
cell-free and cell-occupied calcium alginate membranes. Biotechnol Bioeng 28, 829-835, (1986).
130

78. Teixeira, J. A., Mota, M. & Venâncio, A. Model identification and diffusion coefficients determination of glucose and malic acid in calcium alginate membranes. Chem Eng J Biochem Eng J 56, B9-B14, (1994).
79. Wu, D. Q., Zhang, G. L., Shen, C., Zhao, Q., Li, H. & Meng, Q. Evaluation of diffusion
in gel entrapment cell culture within hollow fibers. World J Gastroenterol 11, 1599-1604, (2005).
80. Amsden, B. Solute Diffusion within Hydrogels. Mechanisms and Models.
Macromolecules 31, 8382-8395, (1998).
81. Abrams, G. A., Goodman, S. L., Nealey, P. F., Franco, M. & Murphy, C. J. Nanoscale
topography of the basement membrane underlying the corneal epithelium of the rhesus macaque. Cell Tissue Res 299, 39-46, (2000).
82. Seiler, K., Wang, K., Bakker, E., Morf, W., Rusterholz, B., Spichiger, U. & Simon, W.
Characterization of sodium-selective optode membranes based on neutral ionophores and assay of sodium in plasma. Clin Chem 37, 1350-1355, (1991).
83. Wang, K., Seiler, K., Morf, W. E., Spichiger, U. E., Simon, W., Lindner, E. & Pungor, E.
Characterization of Potassium-Selective Optode Membranes Based on Neutral Ionophores and Applications in Human Blood Plasma. Anal Sci 6, 715, (1990).
84. Morf, W. E., Seiler, K., Rusterholz, B. & Simon, W. Design of a novel calcium-selective
optode membrane based on neutral ionophores. Anal Chem 62, 738-742, (1990).
85. Trettnak, W. & Wolfbeis, O. S. Fully reversible fibre-optic glucose biosensor based on
the intrinsic fluorescence of glucose oxidase. Anal Chim Acta 221, 195-203, (1989).
86. Brasuel, M., Kopelman, R., Miller, T. J., Tjalkens, R. & Philbert, M. A. Fluorescent
Nanosensors for Intracellular Chemical Analysis: Decyl Methacrylate Liquid Polymer Matrix and Ion-Exchange-Based Potassium PEBBLE Sensors with Real-Time Application to Viable Rat C6 Glioma Cells. Anal Chem 73, 2221-2228, (2001).
87. Shortreed, M., Bakker, E. & Kopelman, R. Miniature Sodium-Selective Ion-Exchange
Optode with Fluorescent pH Chromoionophores and Tunable Dynamic Range. Anal Chem 68, 2656-2662, (1996).
131
88. Xu, H., Aylott, J. W. & Kopelman, R. Fluorescent nano-PEBBLE sensors designed for intracellular glucose imaging. Analyst 127, 1471-1477, (2002).
89. Tsagkatakis, I., Peper, S., Retter, R., Bell, M. & Bakker, E. Monodisperse Plasticized
Poly(vinyl chloride) Fluorescent Microspheres for Selective Ionophore-Based Sensing and Extraction. Anal Chem 73, 6083-6087, (2001).
90. Dubach, J. M., Lim, E., Zhang, N., Francis, K. P. & Clark, H. In vivo sodium
concentration continuously monitored with fluorescent sensors. Integr Biol (Camb) 3, 142-148, (2011).
91. Tohda, K. & Gratzl, M. A Microscopic, Continous, Optical Monitor for Interstitial
Electrolytes and Glucose. ChemPhysChem 4, 155-161, (2003).
92. Tohda, K. & Gratzl, M. Micro-miniature Autonomous Optical Sensor Array for
Monitoring Ions and Metabolites 1: Design, Fabrication, and Data Analysis. Anal Sci 22, 383-388, (2006).
93. Alexis, F., Pridgen, E., Molnar, L. K. & Farokhzad, O. C. Factors Affecting the
Clearance and Biodistribution of Polymeric Nanoparticles. Mol Pharm 5, 505-515, (2008).
94. Dobrovolskaia, M. A., Aggarwal, P., Hall, J. B. & McNeil, S. E. Preclinical Studies To
Understand Nanoparticle Interaction with the Immune System and Its Potential Effects on Nanoparticle Biodistribution. Mol Pharm 5, 487-495, (2008).
95. Li, M., Al-Jamal, K. T., Kostarelos, K. & Reineke, J. Physiologically Based
Pharmacokinetic Modeling of Nanoparticles. ACS Nano 4, 6303-6317, (2010).
96. Cha, G. S., Liu, D., Meyerhoff, M. E., Cantor, H. C., Midgley, A. R., Goldberg, H. D. &
Brown, R. B. Electrochemical performance, biocompatibility, and adhesion of new polymer matrices for solid-state ion sensors. Anal Chem 63, 1666-1672, (1991).
97. Heng, L. Y. & Hall, E. A. H. Producing “Self-Plasticizing” Ion-Selective Membranes.
Anal Chem 72, 42-51, (1999).
98. Peper, S., Tsagkatakis, I. & Bakker, E. Cross-linked dodecyl acrylate microspheres: novel
matrices for plasticizer-free optical ion sensing. Anal Chim Acta 442, 25-33, (2001).
132

99. Schrier, R. W. Does 'asymptomatic hyponatremia' exist? Nat Rev Nephrol 6, 185-185,
(2010).
100. Renneboog, B., Musch, W., Vandemergel, X., Manto, M. U. & Decaux, G. Mild Chronic
Hyponatremia Is Associated With Falls, Unsteadiness, and Attention Deficits. Am J Med 119, 71.e71-71.e78, (2006).
101. Bühlmann, P., Pretsch, E. & Bakker, E. Carrier-Based Ion-Selective Electrodes and Bulk
Optodes. 2. Ionophores for Potentiometric and Optical Sensors. Chem Rev 98, 1593-1688, (1998).
102. Kimizuka, T., Ozaki, Y. & Sumi, Y. Usefulness of201;Tl and99Tc MIBI scintigraphy in
a case of oncogenic osteomalacia. Ann Nucl Med 18, 63-67, (2004).
103. Chawla, J. S. & Amiji, M. M. Biodegradable poly(ε-caprolactone) nanoparticles for
tumor-targeted delivery of tamoxifen. Int J Pharm 249, 127-138, (2002).
104. Espuelas, M. S., Legrand, P., Irache, J. M., Gamazo, C., Orecchioni, A. M., Devissaguet,
J. P. & Ygartua, P. Poly(epsilon-caprolacton) nanospheres as an alternative way to reduce amphotericin B toxicity. Int J Pharm 158, 19-27, (1997).
105. Chen, D. R., Bei, J. Z. & Wang, S. G. Polycaprolactone microparticles and their
biodegradation. Polym Degrad Stab 67, 455-459, (2000).
106. Gan, Z., Fung, J. T., Jing, X., Wu, C. & Kuliche, W. K. A novel laser light-scattering
study of enzymatic biodegradation of poly(ε-caprolactone) nanoparticles. Polymer 40, 1961-1967, (1999).
107. Wu, C., Jim, T. F., Gan, Z., Zhao, Y. & Wang, S. A heterogeneous catalytic kinetics for
enzymatic biodegradation of poly(ϵ-caprolactone) nanoparticles in aqueous solution. Polymer 41, 3593-3597, (2000).
108. Liu, L., Li, S., Garreau, H. & Vert, M. Selective Enzymatic Degradations of Poly(l-
lactide) and Poly(ε-caprolactone) Blend Films. Biomacromolecules 1, 350-359, (2000).
109. Tietz, N. W. & Shuey, D. F. Lipase in serum--the elusive enzyme: an overview. Clin
Chem 39, 746-756, (1993).
133

110. Woodruff, M. & Hutmacher, D. W. The return of a forgotten polymer—Polycaprolactone
in the 21st century. Prog Polym Sci 35, 1217-1256, (2010).
111. Geng, Y. & Discher, D. E. Hydrolytic Degradation of Poly(ethylene oxide)-block-
Polycaprolactone Worm Micelles. J Am Chem Soc 127, 12780-12781, (2005).
112. Wu, C. & Gan, Z. A novel method of studying polymer biodegradation. Polymer 39,
4429-4431, (1998).
113. Koo, Y. E. L., Smith, R. & Kopelman, R. Nanoparticle PEBBLE Sensors in Live Cells
and In Vivo. Annu Rev Anal Chem 2, 57-76, (2009).
114. Koo, Y. E. L., Agayan, R., A., P. M., Rehemtulla, A., D., R. B. & Kopelman, R. in New
Approaches in Biomedical Spectroscopy Vol. 963 ACS Symposium Series Ch. 14, 200-218 (American Chemical Society, 2007).
115. Mulla, H. R., Agard, N. J. & Basu, A. 3-Methoxycarbonyl-5-nitrophenyl boronic acid:
high affinity diol recognition at neutral pH. Bioorg Med Chem Lett 14, 25-27, (2004).
116. Alexeev, V. L., Das, S., Finegold, D. N. & Asher, S. A. Photonic crystal glucose-sensing
material for noninvasive monitoring of glucose in tear fluid. Clin Chem 50, 2353-2360, (2004).
117. Billingsley, K. L., Balaconis, M. K., Dubach, J. M., Zhang, N., Lim, E., Francis, K. P. &
Clark, H. A. Fluorescent Nano-Optodes for Glucose Detection. Anal Chem 82, 3707-3713, (2010).
118. Balaconis, M. K. & Clark, H. A. Gel encapsulation of glucose nanosensors for prolonged
in vivo lifetime. J Diabetes Sci Technol 7, 53-61, (2013).
119. Billingsley, K., Balaconis, M. K., Dubach, J. M., Zhang, N., Lim, E., Francis, K. P. &
Clark, H. A. Fluorescent Nano-Optodes for Glucose Detection. Anal. Chem. 82, 3707-3713, (2010).
120. Ozaydin-Ince, G., Dubach, J. M., Gleason, K. K. & Clark, H. A. Microworm optode
sensors limit particle diffusion to enable in vivo measurements. Proc. Natl. Acad. Sci. U. S. A. 108, 2656-2661, (2011).
134

121. Baji, A., Mai, Y. W., Wong, S. C., Abtahi, M. & Chen, P. Electrospinning of polymer
nanofibers: Effects on oriented morphology, structures and tensile properties. Compos Sci Technol 70, 703-718, (2010).
122. Liang, D., Hsiao, B. S. & Chu, B. Functional electrospun nanofibrous scaffolds for
biomedical applications. Adv Drug Deliv Rev 59, 1392-1412, (2007).
123. Lee, J. B., Jeong, S. I., Bae, M. S., Yang, D. H., Heo, D. N., Kim, C. H., Alsberg, E. &
Kwon, I. K. Highly Porous Electrospun Nanofibers Enhanced by Ultrasonication for Improved Cellular Infiltration. Tissue Eng Part A 17, 2695-2702, (2011).
124. Kacmaz, S., Ertekin, K., Suslu, A., Ozdemir, M., Ergun, Y., Celik, E. & Cocen, U.
Emission based sub-nanomolar silver sensing with electrospun nanofibers. Sens Actuators B Chem 153, 205-213, (2011).
125. Kacmaz, S., Ertekin, K., Suslu, A., Ergun, Y., Celik, E. & Cocen, U. Sub-nanomolar
sensing of ionic mercury with polymeric electrospun nanofibers. Mater Chem Phys 133, 547-552, (2012).
126. Yang, Y. F., Wang, H. M., Su, K., Long, Y. Y., Peng, Z., Li, N. & Liu, F. A facile and
sensitive fluorescent sensor using electrospun nanofibrous film for nitroaromatic explosive detection. J Mater Chem 21, 11895-11900, (2011).
127. Manesh, K. M., Santhosh, P., Gopalan, A. & Lee, K.-P. Electrospun poly(vinylidene
fluoride)/poly(aminophenylboronic acid) composite nanofibrous membrane as a novel glucose sensor. Anal Biochem 360, 189-195, (2007).
128. Puppi, D., Detta, N., Piras, A. M., Chiellini, F., Clarke, D. A., Reilly, G. C. & Chiellini,
E. Development of Electrospun Three-arm Star Poly(ε-caprolactone) Meshes for Tissue Engineering Applications. Macromol Biosci 10, 887-897, (2010).
129. Balaconis, M. K. & Cark, H. A. Biodegradable Optode-Based Nanosensors for in Vivo
Monitoring. Anal Chem 84, 5787-5793, (2012).
130. Clarke, W. L., Cox, D., Gonder-Frederick, L. A., Carter, W. & Pohl, S. L. Evaluating
clinical accuracy of systems for self-monitoring of blood glucose. Diabetes Care 10, 622-628, (1987).
135


![Design and Development of Fluorescent … and Development of Fluorescent Vemurafenib Analogs for In Vivo Imaging ... [9] Given its ... X-tremeGENE HP transfection reagent](https://cdn.vdocuments.us/doc/165x107/5b2827607f8b9a026e8b4b5e/design-and-development-of-fluorescent-and-development-of-fluorescent-vemurafenib.jpg)


