THE DECISION-USEFULNESS OF CORPORATE ENVIRONMENTAL
REPORTS IN SOUTH AFRICA
BY
PETER NASIEMA KAMALA
submitted in accordance with the requirements
for the degree of
DOCTOR OF COMMERCE
IN THE SUBJECT
ACCOUNTING
at the
UNIVERSITY OF SOUTH AFRICA
SUPERVISOR: PROF H. C. WINGARD
CO-SUPERVISOR: PROF C. J. CRONJÉ
NOVEMBER 2014
ii
TABLE OF CONTENTS
DEDICATION ............................................................................................................................................................. XII
ACKNOWLEDGEMENTS ............................................................................................................................................ XIII
DECLARATION .......................................................................................................................................................... XIV
ABOUT THE ACCOMPANYING CD: KAMPHD-CD ........................................................................................................ XV
ABSTRACT ................................................................................................................................................................ XVI
CHAPTER 1 .................................................................................................................................................................. 1
INTRODUCTION AND PROBLEM STATEMENT .............................................................................................................. 1
1.1 BACKGROUND .......................................................................................................................................................... 1
1.2 PROBLEM STATEMENT ........................................................................................................................................... 10
1.3 ASSUMPTIONS ....................................................................................................................................................... 11
1.4 RESEARCH QUESTION AND SUB-QUESTIONS ......................................................................................................... 11
1.4.1 Research question ..................................................................................................................................... 11
1.4.2 Research sub-questions ............................................................................................................................. 11
1.5 OBJECTIVES OF THE STUDY .................................................................................................................................... 12
1.6 IMPORTANCE OF THE STUDY .................................................................................................................................. 13
1.7 SCOPE OF THE STUDY ............................................................................................................................................. 16
1.7.1 Scope of the content analysis phase of this study ..................................................................................... 17
1.7.2 Scope of the questionnaire survey phase of the study .............................................................................. 17
1.8 RESEARCH METHODOLOGY ................................................................................................................................... 18
1.8.1 Content analysis phase of the study .......................................................................................................... 18
1.8.2 Survey ........................................................................................................................................................ 20
1.9 LIST OF DEFINITIONS USED .................................................................................................................................... 23
1.9.1 Environmental reporting ........................................................................................................................... 23
1.9.2 Sustainability reporting ............................................................................................................................. 23
1.9.3 Social reporting ......................................................................................................................................... 24
1.9.4 Users.......................................................................................................................................................... 24
1.9.5 Preparers ................................................................................................................................................... 24
1.9.6 Decision-usefulness ................................................................................................................................... 24
1.9.7 Expectation gap ........................................................................................................................................ 25
1.10 LIST OF ABBREVIATIONS AND ACRONYMS USED .................................................................................................... 25
1.11 DEMARCATION OF CHAPTERS ................................................................................................................................ 29
CHAPTER 2 .................................................................................................................................................................31
THE EVOLUTION OF ENVIRONMENTAL REPORTING ...................................................................................................31
iii
2.1 INTRODUCTION ..................................................................................................................................................... 31
2.2 THE LINK BETWEEN ENVIRONMENTAL, SOCIAL AND SUSTAINABILITY REPORTING ....ERROR! BOOKMARK NOT DEFINED.
2.3 QUALITATIVE CHARACTERISTICS OF DECISION-USEFUL REPORTS .......................................................................... 32
2.3.1 Fundamental qualitative characteristics ................................................................................................... 32
2.3.2 Enhancing qualitative characteristics........................................................................................................ 34
2.4 SUSTAINABILITY REPORTING DEVELOPMENTS BETWEEN 1960 AND 1989 ............................................................ 36
2.4.1 Sustainability reporting between 1960 and 1969 ..................................................................................... 36
2.4.2 Sustainability reporting between 1970 and 1979 ..................................................................................... 37
2.4.3 Environmental reporting between 1980 and 1989 ................................................................................... 40
2.5 THE ENVIRONMENTAL REPORTING DEVELOPMENTS BETWEEN 1990 AND 1999 ................................................ 44
2.5.1 Overview ................................................................................................................................................... 44
2.5.2 Motivation for voluntary environmental reporting ................................................................................... 45
2.5.3 Drivers of environmental reporting ........................................................................................................... 45
2.5.4 Quantification of data, external verification of reports, organisational structures and systems ......... Error!
Bookmark not defined.
2.5.5 Frequency and medium of reporting ......................................................................................................... 50
2.5.6 Developments in the structure of the environmental reports ................................................................... 51
2.5.7 Topics in the environmental reports and their convergence with other reports ....................................... 52
2.5.8 The shortcomings of the environmental reporting practices of the 1990s ................................................ 53
2.6 THE SUSTAINABILITY REPORTING DEVELOPMENTS BETWEEN 2000 AND 2013 ..........ERROR! BOOKMARK NOT DEFINED.
2.6.1 Overview ................................................................................................................................................... 57
2.6.2 Motivation for voluntary sustainability reporting ..................................................................................... 58
2.6.3 Drivers of sustainability reporting ............................................................................................................. 59
2.6.4 Quantification of data, external verification, organisational structures and systems .............................. 66
2.6.5 Frequency and medium of reporting ......................................................................................................... 71
2.6.6 Developments in the structure of the sustainability reports ..................................................................... 74
2.6.7 Convergence and integration of environmental reports with other reports ............................................. 75
2.6.8 Stakeholder engagement .......................................................................................................................... 76
2.6.9 The shortcomings of the sustainability reporting practices of the years between 2000 and 2010 ...... Error!
Bookmark not defined.
2.7 CHAPTER SUMMARY AND CONCLUSION ............................................................................................................... 85
CHAPTER 3 .................................................................................................................................................................91
THEORETICAL FOUNDATION OF ENVIRONMENTAL REPORTING .................................................................................91
3.1 INTRODUCTION ..................................................................................................................................................... 91
3.2 OVERVIEW OF RELEVANT THEORIES ...................................................................................................................... 92
3.2.1 Inductive theories and Deductive theories ................................................................................................ 92
3.2.2 The theoretical perspectives employed in environmental reporting research .......................................... 93

iv
3.3 JUSTIFICATION OF THE THEORY ADOPTED FOR THIS RESEARCH ............................................................................ 98
3.4 THE DECISION-USEFULNESS THEORY ................................................................................................................... 104
3.4.1 A brief history of decision-usefulness theory ........................................................................................... 104
3.4.2 Non-financial users of accounting information ....................................................................................... 109
3.4.3 Justification for provision of accounting reports to non-financial stakeholders ...................................... 110
3.4.4 Shift in societal expectations ................................................................................................................... 110
3.4.5 Justification for the extension of decision-usefulness objective to non-financial decisions and non-
financial stakeholders ................................................................................................ Error! Bookmark not defined.
3.4.6 Application of decision-usefulness objective to non-financial decisions ................................................. 112
3.5 PARADIGMS OF DECISION-USEFULNESS THEORY ................................................................................................ 113
3.5.1 Decision-models paradigm ...................................................................................................................... 113
3.5.2 Decision-makers paradigm ...................................................................................................................... 114
3.6 A DETAILED DISCUSSION OF THE BAR APPROACH ................................................................................................ 118
3.6.1 Prior research that has employed the BAR approach ............................................................................. 118
3.6.2 Rationale for the selection of the BAR approach .................................................................................... 120
3.6.3 Criticisms of the BAR approach ............................................................................................................... 120
3.7 GENERAL CRITICISMS OF THE DECISION-USEFULNESS THEORY ........................................................................... 122
3.8 CHAPTER SUMMARY AND CONCLUSION ............................................................................................................. 124
CHAPTER 4 ............................................................................................................................................................... 130
PRIOR RESEARCH ON THE DECISION-USEFULNESS OF ENVIRONMENTAL REPORTS .................................................. 130
4.1 INTRODUCTION ................................................................................................................................................... 130
4.2 CONTENT ANALYSIS STUDIES THAT EVALUATE THE DECISION-USEFULNESS OF ..........ERROR! BOOKMARK NOT DEFINED.
ENVIRONMENTAL REPORTS ...................................................................................................ERROR! BOOKMARK NOT DEFINED.
4.2.1 Content analysis studies conducted in the 1990s .................................................................................... 131
4.2.2 Content analysis studies conducted after 2000 ....................................................................................... 136
4.2.3 Identified gaps in the prior literature of content analysis studies ........................................................... 155
4.3 USERS’ PERCEPTION OF DECISION-USEFULNESS OF ENVIRONMENTAL REPORTS .......ERROR! BOOKMARK NOT DEFINED.
4.3.1 Studies that elicited the views of pressure groups .................................................................................. 157
4.3.2 Studies that elicited the views of analysts ............................................................................................... 160
4.3.3 Studies that elicited the views of investors .............................................................................................. 162
4.3.4 Studies that elicited the views of multiple stakeholders ......................................................................... 167
4.3.5 Gaps in prior literature on users perception of decision-usefulness of environmental reports ............... 179
4.4 STUDIES ON THE EXPECTATION GAP BETWEEN PREPARERS AND USERS OF ENVIRONMENTAL REPORTS ....... ERROR!
BOOKMARK NOT DEFINED.
4.4.1 International studies ............................................................................................................................... 180
4.4.2 South African studies ............................................................................................................................... 182
4.4.3 Gaps in prior literature on the expectation gap between preparers and users of environmental reports.
v
…………………………………………………………………………………………………………………………………………………………..Err
or! Bookmark not defined.
4.5 RESEARCH QUESTIONS ........................................................................................................................................ 184
4.6 CHAPTER SUMMARY AND CONCLUSION ............................................................................................................. 185
CHAPTER 5 ............................................................................................................................................................... 188
RESEARCH DESIGN AND METHODOLOGY ................................................................................................................. 188
5.1 INTRODUCTION ................................................................................................................................................... 188
5.2 CONTENT ANALYSIS ............................................................................................................................................. 189
5.2.1 Definition of content analysis technique ................................................................................................. 189
5.2.2 Justification for the selection of content analysis technique ................................................................... 189
5.2.3 Research population and sample ............................................................................................................ 190
5.2.4 Framework for data collection ................................................................................................................ 192
5.2.5 Data collection ........................................................................................................................................ 201
5.2.6 Environmental disclosure sub-quality and quality indices ....................................................................... 203
5.2.7 Reliability of the content analysis study .................................................................................................. 208
5.2.8 Validity of disclosure measurement ........................................................................................................ 209
5.3 QUESTIONNAIRE SURVEY..................................................................................................................................... 214
5.3.1 Justification for questionnaire survey methodology ............................................................................... 214
5.3.2 Research population and sample ............................................................................................................ 215
5.3.3 Questionnaire design .............................................................................................................................. 216
5.3.4 Questionnaire distribution ...................................................................................................................... 228
5.3.5 Data analysis ........................................................................................................................................... 228
5.3.6 Reliability of the research instrument ..................................................................................................... 229
5.3.7 Validity .................................................................................................................................................... 230
5.3.8 Ethical considerations ............................................................................................................................. 234
5.4 CHAPTER SUMMARY AND CONCLUSION ............................................................................................................. 235
CHAPTER 6 ............................................................................................................................................................... 238
ANALYSIS OF RESULTS OF CONTENT ANALYSIS ......................................................................................................... 238
6.1 INTRODUCTION ................................................................................................................................................... 238
6.2 OBJECTIVE AND SUB-OBJECTIVES OF THE CONTENT ANALYSIS PHASE OF THE STUDY ERROR! BOOKMARK NOT DEFINED.
6.3 PROFILE OF THE TOP 100 COMPANIES ................................................................................................................. 239
6.4 ANALYSIS OF RELEVANCE OF CURRENT ENVIRONMENTAL REPORTING DISCLOSURES ERROR! BOOKMARK NOT DEFINED.
6.4.1 First sub-objective of the analysis ........................................................................................................... 240
6.4.2 Results on relevance of environmental reports ....................................................................................... 244
6.5 ANALYSIS OF THE RELIABILITY (VERIFIABILITY) OF CURRENT ENVIRONMENTAL REPORTING DISCLOSURES ........ 244
6.5.1 Second sub-objective of the analysis ....................................................................................................... 244
vi
6.5.2 Results on the reliability (verifiability) of environmental reports ............................................................ 245
6.6 COMPARABILITY OF CURRENT ENVIRONMENTAL REPORTING DISCLOSURES ...................................................... 249
6.6.1 Third sub-objective of the analysis .......................................................................................................... 249
6.6.2 Results on the comparability of environmental reports .......................................................................... 252
6.7 ANALYSIS OF UNDERSTANDABILITY OF CURRENT ENVIRONMENTAL REPORTING DISCLOSURES ......................... 254
6.7.1 Fourth sub-objective of the analysis ....................................................................................................... 254
6.7.2 Results on the understandability of environmental reports .................................................................... 254
6.7.4 Fifth sub-objective of the analysis ................................................................. Error! Bookmark not defined.
6.7.5 Results on timeliness of environmental reports ...................................................................................... 261
6.8 ANALYSIS OF OVERALL DECISION-USEFULNESS OF THE CURRENT ENVIRONMENTAL REPORTING DISCLOSURES
ERROR! BOOKMARK NOT DEFINED.
6.8.1 Overall objective of the content analysis phase of the study ........................ Error! Bookmark not defined.
6.8.2 Results on the decision-usefulness of environmental reports ................................................................. 265
6.8.3 Overall decision-usefulness of environmental reports analysed according to the sectors of the sampled
companies .................................................................................................................. Error! Bookmark not defined.
6.8.4 Overall decision-usefulness of environmental reports analysed according to the size of sampled
companies .................................................................................................................. Error! Bookmark not defined.
6.9 EXPLANATION OF CONTENT ANALYSIS RESULTS USING DECISION-USEFULNESS THEORY .................................... 269
6.9.1 Relationship between an accounting theory, an accounting conceptual framework and decision-
usefulness theory ....................................................................................................... Error! Bookmark not defined.
6.9.2 Accounting conceptual frameworks ........................................................................................................ 270
6.9.3 Explanation of the results of content analysis using trade-offs of qualitative characteristics ................ 273
6.9.4 Explanation of the results of content analysis using cost and materiality constraints ............................ 274
6.10 CHAPTER SUMMARY AND CONCLUSION ............................................................................................................. 279
CHAPTER 7 ............................................................................................................................................................... 281
ANALYSIS OF RESULTS OF QUESTIONNAIRE SURVEY ................................................................................................ 281
7.1 INTRODUCTION ................................................................................................................................................... 281
7.2 OBJECTIVES OF THE QUESTIONNAIRE SURVEY PHASE OF THE STUDY .................................................................. 281
7.3 SURVEY RESPONSE ............................................................................................................................................... 282
7.3.1 Survey response rate ............................................................................................................................... 282
7.3.2 Non-response bias ................................................................................................................................... 284
7.4 BACKGROUND INFORMATION OF THE RESPONDENTS ........................................................................................ 285
7.4.1 Background information of users ............................................................................................................ 285
7.4.2 Background information of preparers ..................................................................................................... 286
7.5 WHETHER ENVIRONMENTAL REPORTS WERE READ ............................................................................................ 287
7.5.1 Whether or not users read environmental reports ................................................................................. 287
7.5.2 Whether or not preparers had a way of determining if intended users read environmental reports .. Error!
vii
Bookmark not defined.
7.5.3 Users' (non-readers') ranking of reasons why they did not read any environmental report in the past 12
months
…………………………………………………………………………………………………………………………………………………………..Err
or! Bookmark not defined.
7.5.4 Measures undertaken by preparers' companies to convert non-readers of environmental reports to
readers
………………………………………………………………………………………………………………………………………………………….Erro
r! Bookmark not defined.
7.5.5 Comparison of non-readers' reasons for not reading environmental reports to measures undertaken by
preparers' to convert non-readers to readers ............................................................ Error! Bookmark not defined.
7.6 USERS' ENVIRONMENTAL INFORMATION NEEDS ................................................................................................. 295
7.6.1 Users perceptions on what a company's environmental report should do or should be ......................... 295
7.6.2 Comparison of users and preparers' perceptions on what a company's environmental report should do or
should be ................................................................................................................... Error! Bookmark not defined.
7.7 EXTENT TO WHICH ENVIRONMENTAL REPORTS ARE READ AND HOW THEY ARE USED ........... ERROR! BOOKMARK NOT
DEFINED.
7.7.1 How often various reading techniques are employed by users when reading environmental reports Error!
Bookmark not defined.
7.7.2 Comparison of users' and preparers’ perceptions on the frequency of usage of various reading
techniques by users when reading an environmental report ..................................... Error! Bookmark not defined.
7.8 USAGE OF DIFFERENT MEDIA AS A SOURCE OF ENVIRONMENTAL REPORTS ....................................................... 311
7.8.1 Users' frequency of reading environmental reports from different media .............................................. 311
7.8.2 Comparison of users' and preparers’ perceptions on how often users read environmental reports from
different media .......................................................................................................... Error! Bookmark not defined.
7.9 HOW ENVIRONMENTAL REPORTS WERE USED .................................................................................................... 316
7.9.1 Users' perceptions on how environmental reports were used ................................................................ 316
7.9.2 Comparison of users' and preparers’ perceptions on how environmental reports were used by the users
…………………………………………………………………………………………………………………………………………………………..Err
or! Bookmark not defined.
7.10 HOW USEFUL THE ENVIRONMENTAL REPORTS WERE ......................................................................................... 321
7.10.1 Users' perceptions on the usefulness of the environmental reports ....................................................... 321
7.10.2 Preparers’ perceptions on how useful environmental reports were for the purpose for which they are
used…………………….. ................................................................................................... Error! Bookmark not defined.
7.11 PERCEPTION OF THE QUALITY OF ENVIRONMENTAL REPORTS ............................................................................ 324
7.11.1 Users' perception of the quality of environmental reports read ............................................................. 324
7.11.2 Comparison of users' and preparers’ perceptions on the quality of environmental reports read by
viii
users……… .................................................................................................................. Error! Bookmark not defined.
7.12 SATISFACTION WITH THE QUALITATIVE ATTRIBUTES OF ENVIRONMENTAL REPORTS ........................................ 328
7.12.1 Users' satisfaction with the qualitative attributes of the environmental reports read ........................... 328
7.12.2 Comparison of users' and preparers’ perceptions regarding user's satisfaction with the qualitative
characteristics of the environmental reports read ..................................................... Error! Bookmark not defined.
7.13 SUGGESTIONS FOR IMPROVEMENT OF THE QUALITY (DECISION- USEFULNESS) OF ENVIRONMENTAL REPORTS
ERROR! BOOKMARK NOT DEFINED.
7.13.1 Users' suggestions for improvement of the quality (decision-usefulness) of environmental reports
read……………… ........................................................................................................... Error! Bookmark not defined.
7.13.2 Preparers' suggestions for improvement of the quality (decision-usefulness) of their companies' last
environmental report ................................................................................................. Error! Bookmark not defined.
7.13.3 Comparison of users' and preparers' suggestions for improvement of quality (decision-usefulness) of
environmental reports ............................................................................................... Error! Bookmark not defined.
7.14 RELATIVE IMPORTANCE OF ENVIRONMENTAL REPORTS/STATEMENTS ............................................................... 337
7.14.1 Users' perception of relative importance of different types of reports/statements ................................ 337
7.14.2 Comparison of users' and preparers’ perception of relative importance of different types of
reports/statements .................................................................................................... Error! Bookmark not defined.
7.15 CHAPTER SUMMARY AND CONCLUSION ............................................................................................................. 342
CHAPTER 8 ............................................................................................................................................................... 345
8.1 INTRODUCTION ................................................................................................................................................... 345
8.2 CHAPTER 1: RESEARCH PROBLEM AND OBJECTIVES ............................................................................................ 346
8.2.1 Research problem.................................................................................................................................... 346
8.2.2 Research objectives ................................................................................................................................. 346
8.3 CHAPTER 2: SUMMARY AND CONCLUSION OF EVOLUTION OF ENVIRONMENTAL REPORTING..... ERROR! BOOKMARK
NOT DEFINED.
8.4 CHAPTER 3: SUMMARY AND CONCLUSION OF THEORETICAL FOUNDATION OF ENVIRONMENTAL REPORTING
ERROR! BOOKMARK NOT DEFINED.
8.5 CHAPTER 4: SUMMARY AND CONCLUSION OF PRIOR RESEARCH ON DECISION-USEFULNESS OF ENVIRONMENTAL
REPORTS ................................................................................................................................ERROR! BOOKMARK NOT DEFINED.
8.5.1 Review of prior content analysis studies ................................................................................................. 349
8.5.2 Review of prior surveys ........................................................................................................................... 349
8.6 CHAPTER 5: SUMMARY AND CONCLUSION OF RESEARCH DESIGN AND METHODOLOGY ....... ERROR! BOOKMARK NOT
DEFINED.
8.6.1 Content analysis phase of the study ........................................................................................................ 351
8.6.2 Questionnaire survey phase of the study ................................................................................................ 352
8.7 CHAPTER 6: SUMMARY AND CONCLUSION OF KEY FINDINGS OF THE CONTENT ANALYSIS PHASE OF THE
STUDY…… ...............................................................................................................................ERROR! BOOKMARK NOT DEFINED.

ix
8.7.1 Objective and sub-objectives of the content analysis phase of the study ............................................... 352
8.7.2 First sub-objective: relevance of environmental reports ......................................................................... 353
8.7.3 Second sub-objective: reliability (verifiability) of environmental reports ................................................ 353
8.7.4 Third sub-objective: comparability of environmental reports ................................................................. 354
8.7.5 Fourth sub-objective: understandability of environmental reports ........................................................ 354
8.7.6 Fifth sub-objective: timeliness of environmental reports ........................................................................ 354
8.7.7 Results of analysis of overall decision-usefulness of environmental reports ........................................... 355
8.8 CHAPTER 7: SUMMARY OF KEY FINDINGS OF THE QUESTIONNAIRE SURVEY PHASE OF THE STUDY ............... ERROR!
BOOKMARK NOT DEFINED.
8.8.1 Population and response rate ................................................................................................................. 358
8.8.2 Results on information needs of users of environmental reports produced by South African
companies……. ........................................................................................................... Error! Bookmark not defined.
8.8.3 Results on the extent to which users read and employ environmental reports....................................... 359
8.8.4 Results on users’ satisfaction with decision-usefulness of environmental reports and suggestions for
improvement ............................................................................................................. Error! Bookmark not defined.
8.8.5 Results on how users rank environmental information relative to other types of information such as
financial and social responsibility information .......................................................... Error! Bookmark not defined.
8.8.6 Results on whether there is an expectation gap between preparers and users of environmental
reports……….. ............................................................................................................. Error! Bookmark not defined.
8.8.7 Overall conclusion of Chapter 7 ............................................................................................................... 364
8.9 CONTRIBUTIONS, SIGNIFICANCE AND RECOMMENDATIONS OF THE STUDY ....................................................... 365
8.9.1 Original contributions of the study ......................................................................................................... 365
8.9.2 Significance of the findings of the study ................................................................................................. 366
8.9.3 Recommendations of the study ............................................................................................................... 368
8.10 LIMITATIONS OF THE STUDY ................................................................................................................................. 370
8.10.1 Limitations of the content analysis phase of the study ........................................................................... 370
8.10.2 Limitations of the questionnaire survey phase of the study .................................................................... 371
8.11 SUGGESTIONS FOR FURTHER RESEARCH ............................................................................................................. 372
8.11.1 Suggestions emanating from limitations of content analysis phase of the study ................................... 372
8.11.2 Suggestions emanating from limitations of questionnaire survey phase of the study ............................ 374
8.11.3 Other suggestions for further research ................................................................................................... 376
8.12 FINAL CONCLUDING REMARKS ............................................................................................................................ 376
BIBLIOGRAPHY ........................................................................................................................................................ 377
APPENDIX A ............................................................................................................................................................. 441
APPENDIX B ............................................................................................................................................................. 444
APPENDIX C ............................................................................................................................................................. 447
x
APPENDIX D ............................................................................................................................................................. 450
APPENDIX E ............................................................................................................................................................. 451
APPENDIX F ............................................................................................................................................................. 458
APPENDIX G ............................................................................................................................................................. 459
APPENDIX H ............................................................................................................................................................. 469
APPENDIX I .............................................................................................................................................................. 479
APPENDIX J .............................................................................................................................................................. 482
APPENDIX K ............................................................................................................................................................. 484
APPENDIX L ............................................................................................................................................................. 484
xi
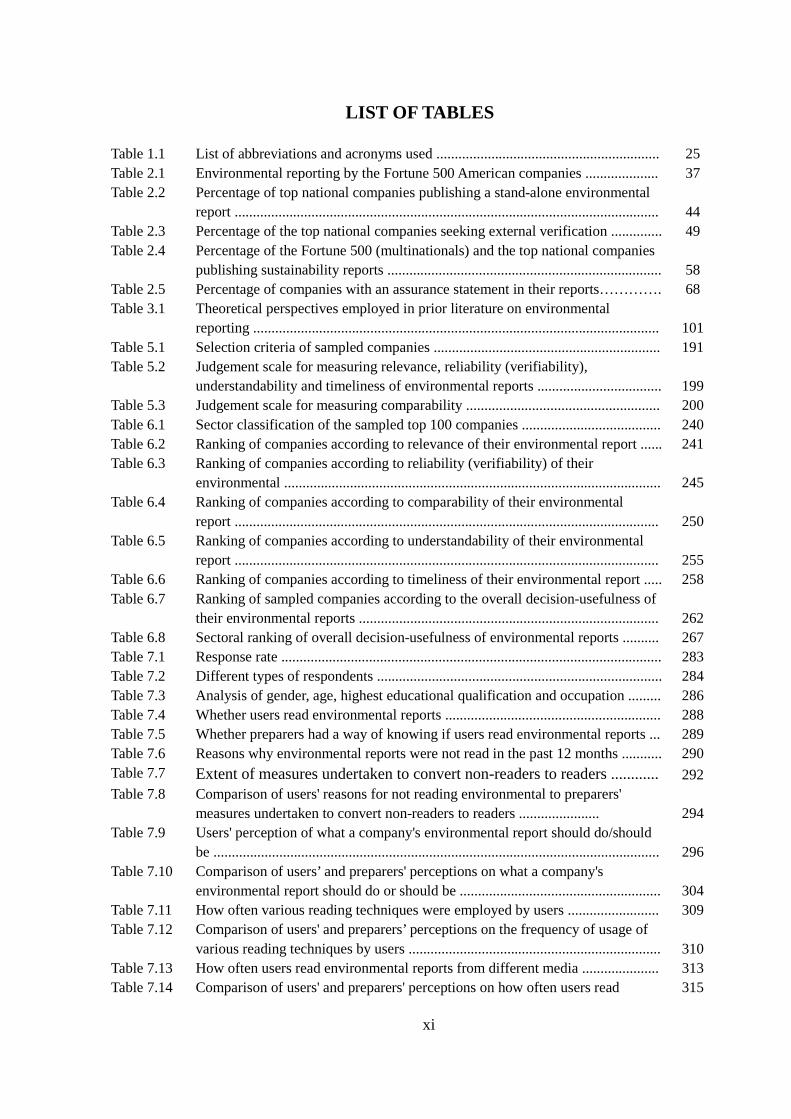
LIST OF TABLES
Table 1.1 List of abbreviations and acronyms used ............................................................. 25 Table 2.1 Environmental reporting by the Fortune 500 American companies .................... 37 Table 2.2 Percentage of top national companies publishing a stand-alone environmental
report .................................................................................................................... 44 Table 2.3 Percentage of the top national companies seeking external verification .............. 49 Table 2.4 Percentage of the Fortune 500 (multinationals) and the top national companies
publishing sustainability reports ........................................................................... 58 Table 2.5 Percentage of companies with an assurance statement in their reports…………. 68 Table 3.1 Theoretical perspectives employed in prior literature on environmental
reporting ............................................................................................................... 101 Table 5.1 Selection criteria of sampled companies .............................................................. 191 Table 5.2 Judgement scale for measuring relevance, reliability (verifiability),
understandability and timeliness of environmental reports .................................. 199 Table 5.3 Judgement scale for measuring comparability ..................................................... 200 Table 6.1 Sector classification of the sampled top 100 companies ...................................... 240 Table 6.2 Ranking of companies according to relevance of their environmental report ...... 241 Table 6.3 Ranking of companies according to reliability (verifiability) of their
environmental ....................................................................................................... 245 Table 6.4 Ranking of companies according to comparability of their environmental
report .................................................................................................................... 250 Table 6.5 Ranking of companies according to understandability of their environmental
report .................................................................................................................... 255 Table 6.6 Ranking of companies according to timeliness of their environmental report ..... 258 Table 6.7 Ranking of sampled companies according to the overall decision-usefulness of
their environmental reports .................................................................................. 262 Table 6.8 Sectoral ranking of overall decision-usefulness of environmental reports .......... 267 Table 7.1 Response rate ........................................................................................................ 283 Table 7.2 Different types of respondents .............................................................................. 284 Table 7.3 Analysis of gender, age, highest educational qualification and occupation ......... 286 Table 7.4 Whether users read environmental reports ........................................................... 288 Table 7.5 Whether preparers had a way of knowing if users read environmental reports ... 289 Table 7.6 Reasons why environmental reports were not read in the past 12 months ........... 290 Table 7.7 Extent of measures undertaken to convert non-readers to readers ............ 292 Table 7.8 Comparison of users' reasons for not reading environmental to preparers'
measures undertaken to convert non-readers to readers ...................... 294 Table 7.9 Users' perception of what a company's environmental report should do/should
be .......................................................................................................................... 296 Table 7.10 Comparison of users’ and preparers' perceptions on what a company's
environmental report should do or should be ....................................................... 304 Table 7.11 How often various reading techniques were employed by users ......................... 309 Table 7.12 Comparison of users' and preparers’ perceptions on the frequency of usage of
various reading techniques by users ..................................................................... 310 Table 7.13 How often users read environmental reports from different media ..................... 313 Table 7.14 Comparison of users' and preparers' perceptions on how often users read 315

xii
environmental reports from different media ......................................................... Table 7.15 How environmental reports are used .................................................................... 317 Table 7.16 Comparison of users' and preparers' perceptions on the use of environmental
reports ................................................................................................................... 320 Table 7.17 Users' perceptions on how useful the environmental reports are ......................... 321 Table 7.18 Comparison of users' and preparers' perceptions on the usefulness of
environmental reports ........................................................................................... 323 Table 7.19a Users' perception of the quality of environmental reports read ............................ 325 Table 7.19b Comparison of users' and preparers’ perceptions on the quality of
environmental reports read by users ........................................................... 327 Table 7.20 Users' satisfaction with the qualitative attributes of environmental
reports ........................................................................................................ 329 Table 7.21 Comparison of users' and preparers’ perceptions on users' satisfaction with the
qualitative attributes of environmental reports read ............................................. 330 Table 7.22 Users' suggestions for improvement of the quality (decision-usefulness) of
environmental reports read ................................................................................... 333 Table 7.23 Preparers' suggestions for improvement of the quality (decision-usefulness) of
their companies' last environmental report ........................................................... 335 Table 7.24 Comparison of users' and preparers' suggestions for improvement of the quality
(decision-usefulness) of environmental reports ................................................... 337 Table 7.25 Users' perception of relative importance of different types of reports/
statements ............................................................................................................. 338 Table 7.26 Comparison of users' and preparers’ perception of relative importance of
different types of reports/statements .................................................................... 340

xiii
DEDICATION
This thesis is dedicated to my departed father – MARTIN KAMALA NASIEMA (aka
Martin Payne) for his dedication to his craft and unmatchable work ethic.
xiv
ACKNOWLEDGEMENTS
I would like to express my sincere appreciation to the following for their insight,
guidance and motivation towards achieving this milestone in my life:
• To God − for giving me good health and intellectual ability to complete this thesis.
• my supervisor − Prof H. C. Wingard and Co-supervisor Prof C. J. Cronjé, for their
mentorship and guidance throughout the duration of this study. It has been a great
honour to work with such highly dedicated professionals. I look forward towards
working in close co-operation with you in the years ahead.
• my mother − Mary Nafula Kamala, thank you for the unwavering support and words
of encouragement.
• my Statistician − Ms Corrie Uys, for your patience and ever willingness to assist
when called upon.
• Dr Christopher Ouma for your assistance in editing the language of this thesis.
• Ms Elsabe Van Der Westhuzen for your assistance in the technical editing of this
thesis.

xv
DECLARATION
I, Peter Nasiema Kamala, declare that “THE DECISION-USEFULNESS OF
CORPORATE ENVIRONMENTAL REPORTS IN SOUTH AFRICA” is my own work
and that all the sources that I have used or quoted have been indicated and acknowledged by
means of a complete list of references.
_______________________
P. N. KAMALA November 2014
xvi
ABOUT THE ACCOMPANYING CD: KAMPHD-CD
The enclosed CD contains eight folders of about 1500 pages of the data generated in the
content analysis of the environmental reports via MS Excel software and quantitative
analysis of responses of users and preparers via Statistical Package for Social Sciences
(SPSS).
xvii
ABSTRACT
The broad aim of this research was to assess the decision-usefulness of environmental
reports produced by South African companies that are listed on the Johanessburg
Securities Exchange (JSE) to users of the reports. The study was motivated by a lack of
research on the decision-usefulness of environmental reports in South Africa. The study
was conducted in two phases. The first phase in form of a content analysis evaluated the
decision-usefulness of the environmental reports of top 100 JSE-listed South African
companies using a control list and a judgement scale.
The second phase in form of a questionnaire survey was aimed at determining, the
information needs of users of environmental reports produced by South African
companies (that are listed on the JSE), the extent to which they read and employ the
reports for making decisions. In addition, this phase was meant to ascertain the degree of
users' satisfaction with the decision-usefulness of the environmental reports as well as
elicit their suggestions on ways of improving the reports. Furthermore, the second phase
was aimed at determining the users’ perception of the relative importance of
environmental reports as well as ascertaining whether there was an expectation gap
between the users and the preparers of the reports with regard to their decision-
usefulness.
The results of the content analysis phase of the study indicate that the environmental
reports of the sampled companies were decision-useful, however their decision-
usefulness varied widely. Although decision-useful, the environmental reports of the
sampled companies were not comparable. In addition, the environmental reports of
companies from sectors with a significant impact on the environment, and those of large
companies were more decision-useful than the reports of companies from sectors with an
insignificant impact on the environment and those of smaller companies.
The results of the questionnaire survey phase of the study indicate that users prefer
balanced environmental reports that disclose both negative and positive aspects that
identify and describe key relevant issues, that are specific and contain accurate
information, and that provide future oriented information. In addition, users prefer

xviii
environmental reports that identify and address key stakeholders and their concerns,
demonstrate the integration of environmental issues into core business processes, and that
compare quantitative impacts against best practice. Furthermore, the results also indicate
that users do read environmental reports, mostly from companies’ websites Portable
Document Format (PDF) annual reports and that they mostly use the environmental
reports for research, their own knowledge, and to hold companies accountable. However,
users are not fully satisfied with the decision-usefulness of the environmental reports as
they feel that there is a need to improve the reports in order to make them more decision-
useful. The results also indicate that users perceive environmental reports to be more
important than any other type of reports, most notably the financial reports. Comparing
the responses of the users to those of preparers on various issues pertaining to the
decision-usefulness of environmental reports, significant differences were found between
the views of the two groups. These differences provide ample evidence that is consistent
with the existence of an environmental reporting expectation gap in South Africa.
This study makes several original contributions to environmental reporting literature,
most notable of which is that, it is the first study in the South African context to
empirically evaluate the quality (decision-usefulness) of environmental reports in line
with the accounting conceptual frameworks and the GRI guidelines combined. By so
doing, the study introduces to the academic literature an extensive five dimensional
qualitative characteristic framework for evaluating the quality (decision-usefulness) of
environmental reports. In addition, the study uniquely employs the decision-usefulness
theory to provide insights into the environmental reporting practices of South African
companies that are listed on the JSE. In so doing, it re-contextualises the theory that is
typically employed in explaining financial reporting, and demonstrates its applicability in
explaining the decision-usefulness of the environmental reporting practices of South
African companies that are listed on the JSE.
Key words
Decision-usefulness, environmental reports, environmental reporting, sustainability
reporting, users, preparers, relevance, reliability, verifiability, comparability,
understandability, timeliness, conceptual framework, non-financial reporting.
1
CHAPTER 1
INTRODUCTION AND PROBLEM STATEMENT
1.1 BACKGROUND
The main objective of accounting, regardless of whether it is financial, environmental or
integrated reporting, is to provide information that is useful to users ‒ those having a
reasonable right to information concerning the reporting entity ‒ for making decisions
(FASB 2010: 01; GRI 2013: 17; IASB 2010: 43; ICAEW 1975: 17). Such information
that is useful for making decisions is thus regarded as being decision-useful (GRI 2013:
17; Hooks & Van Staden 2004: 46). To be decision-useful, accounting information must
be relevant and reliable ( FASB 2008: 02; FASB 2010: 16; IASB 2008: 38; IASB 2010:
17). The decision-usefulness of accounting information can also be enhanced by making
the information more comparable, understandable, timely and verifiable (FASB 2010: 19;
IASB 2010: 19). Therefore the term decision-usefulness refers to the attributes
(qualitative characteristics) of accounting information that make it useful to users for
making decisions (FASB 2008: 02; FASB 2010: 16; IASB 2008: 38; IASB 2010: 17).
The recent collapses of companies, alongside a string of high profile companies'
environmental disasters such as unabated oil spills, over-exploitation and depletion of
non-renewable natural resources, noise pollution, contamination of air, water, land and
food, over-fishing, deforestation, evidence of climate change and loss of bio-diversity
have heightened the public sensitivity on environmental issues (Alrazi, De Villiers & Van
Staden, 2011:3; Bond, 2013:694; Hibbit, 2004:34; KPMG, 2008a). The latter has led
many stakeholders to question the relevance and reliability of accounting reporting
practices as a basis making decisions about a company (IRC, 2011:01).
In the wake of the above disasters, stakeholders have criticised financial reports for
failing to provide sufficient insight that provides a comprehensive picture of a company's
performance, its ability to create and sustain value especially in the context of growing
environmental challenges (IRC, 2011:01). As a result, companies have been pressurised

2
by stakeholders to not only adapt their strategies and their way of doing business, but also
to adapt their way of reporting, to provide additional information meant to address the
weaknesses of the financial reports (Deegan & Haque, 2009:14). Consequently,
companies have responded to the pressure by increasing the number and volume of their
environmental reports (Jira & Toffel, 2013:01; Marquis & Toffel, 2014:04; KPMG,
2008b:4). Not only has the scope of the environmental reports been increased but also the
number of companies disclosing their environmental performance has increased
significantly.
However, the increase in the quantity of environmental reports has occurred without a
commensurate improvement in quality (IRC, 2011:01). As a result, the decision-
usefulness of the environmental reports produced has been questioned (Delmas &
Burbano 2011: 64; Kim & Lyon 2012: 311; Marquis & Toffel 2014: 01; Laud & Schepers
2009: 369). Specifically, most companies appear to have increased the quantity of their
environmental reports without a meaningful stakeholder engagement exercise (Bromley
& Powell 2012: 485). As a result, the stakeholders have not influenced the content
presented in the reports as they have mostly been sidelined from the reporting process
(Marquis & Toffel 2014: 19; CorporateRegister.com & ACCA 2004: 15). To cater for a
diverse audience of stakeholders, most companies have simply produced generic and
overloaded reports that do not address the unique needs of the stakeholders (Laud &
Schepers 2009: 368; Owen 2003: 16). The foregoing have undermined the perceived
relevance of the environmental reports.
Apart from relevance, the reliability of environmental reports has also been questioned
(Laud & Schepers 2009: 365; McDonnell & King 2013: 01). Overwhelming criticism has
suggested that the environmental reports produced tend to be biased and/or, self-laudatory
with minimal negative information disclosure even when such information is known to
exist (Delmas & Burbano 2011: 64; KPMG 2013: 76; Laud & Schepers 2009: 368). In
addition, companies with the most obvious impact on the environment have tended to
report more comprehensively on their environmental activities than those with lesser
environmental impact in an attempt to legitimise their activities (KPMG 2011: 05; KPMG
2013: 07).

3
To improve the reliability of their environmental reports, an increasing number of
companies have undertaken external verification of their environmental reports
(Strandberg Consulting 2013: 05; KPMG 2013: 33). In addition, some companies have
increasingly included third party commentaries in their environmental reports to enhance
the integrity of those reports. However, the reliability of environmental reports has
remained questionable due to the low levels of reasonable assurance of the reports, and a
lack of well-established, standardised and institutionalised verifying methods, processes
and procedures (GRI 2014: 05; KPMG 2013: 33). Where companies have opted for third-
party commentary, such commentary has tended to be one-sided, typically portraying a
company's report in a favourable manner, and lacks resentful voices (Business & Society,
Morris & Chapman 2010: 21).
To promote comparability of sustainability reports (including environmental reports), the
Global Reporting Initiative (GRI) Sustainability Reporting Guidelines emerged as the de
facto guideline for environmental reporting (Fonseca, 2010:05; GRI, 2000: 05). These
guidelines which are widely recognised and used by companies across the world, guide
organisations in the preparation of sustainability reports, regardless of their size, sector or
location and offer an international reference for all those interested in the disclosure of
environmental, social, economic performance and impacts of organisations (Fonseca,
2010:05; GRI & ACCA 2009: 06; OECD 2009: 241).
Despite the emergence of the GRI guidelines as guidelines of choice for most companies,
the comparability of environmental reports has remained problematic (Fonseca, 2010:05).
More specifically, GRI’s ABC application level system of reporting—where a C level
report required disclosure on 10 indicators, a B report required 20 and an A report
required all 79 or an explanation for omission—though well-intended to distinguish
beginners from advanced reporters, has allowed a variation in sustainability reports as
companies can select favourable performance indicators uncommon to all reports and
change the indicators from one year to another at will (Business & Society, Morris &
Chapman, 2010:31; Fonseca, 2010:15). In addition, the Key Performance Indicators
(KPIs) available to companies have hardly been clear, specific, measurable, accurate,
reliable and are thus susceptible to inconsistent interpretation and application (Leavoy,
2010:01; SustainAbility, FBDS & UNEP 2008:16). Resultantly, environmental reports
4
have varied widely with regard to their scope, depth and content from high-quality and
concise stand-alone reports, to an addition of a few pages in the annual reports, to short
but glossy documents (KPMG, 2010:78; Kolk, 2005:38).
To cater for a growing number of stakeholder groups, companies have typically provided
over-aggregated environmental information without supporting detail, in a manner that
has impaired the users' ability to meaningfully assess and understand the performance of
the companies (Deloitte, 2011:05). Among multi-national companies, reporting of
environmental information has been disaggregated per country, product or line of
business, in a manner that has undermined the understandability of the overall
performance of a company (Mammatt, 2009:04). Besides, many companies have not
taken advantage of their on-line capabilities to enrich the content of their environmental
reports, in order to enhance understandability, but have instead opted for Portable
Document Format, a replica of printed reports (CDC & PwC, 2010:05; Bolivar,
2009:194; Lodhia, 2006:83).
Likewise, most companies have not leveraged their on-line capabilities to produce more
timely reports using HyperText Markup Language (HTML) format files, instead they
have increasingly relied on PDF files whose up-loading takes a longer period of time
(KPMG, 2011:22; Radley Yeldar & GRI, 2011:02). Where the HTML files are used, they
have either duplicated prior years' information and have not always included dates that
enable users to assess the currency (timeliness) of the reports. With most companies
aligning their environmental reporting cycle to their annual reports, they have failed to
take advantage of their on-line capabilities to report more frequently (FSC, SustainAbility
& KPMG, 2010:03; Radley Yeldar & GRI, 2011:02).
Apart from the concerns discussed above, other concerns that have been raised pertaining
to the current environmental reporting practices include:
• Irrelevance of environmental reports as a result of failure by most companies to
exploit their on-line capabilities to tailor environmental reports to address the unique
needs of different stakeholder groups (KPMG, 2011:22; Radley Yeldar & GRI
2011:02).

5
• Provision of dis-informative environmental reports with more scenic landscape
photographs (green glossies) than the actual information required by stakeholders
(Delmas & Burbano, 2011:64).
• Despite the emergence of assurance standards, the assurance statements in the
environmental reports tend to vary significantly with regard to their title, range of
objectives, scope of assignment, amount of description of the nature, timing and
extent of procedures employed, as well as the wording of conclusions offered
(Furmann, Ott, Looks & Gunther, 2013:02; Strandberg, 2013:12). In addition, most
assurance statements do not include any recommendations for improvement, either
from a content, accuracy or internal systems point of view, therefore they offer little
insight into how the assurance process is useful to a company's environmental
reports. These have undermined the reliability of the statements and the assured
reports.
• Many stakeholders are dismissive of the assurance practices of companies as they
have been sidelined from the assurance process (Furmann, et al., 2013:02).
Assurance engagements are determined by and undertaken for the companies'
management, a tendency which has undermined the perceived independence of the
assurance providers (ACCA, 2009:06; ACCA, 2009:08). In fact, many stakeholders
have questioned the assurance processes, statements, practical competencies of the
assurance providers and the overall institutional legitimacy of the non-financial
assurance industry (Fonseca, 2010:19; ACCA, 2009:05; Elkington & Thorpe,
2009:01).
• Most performance measurement systems are inept and error prone, as they rely on
manual or simple spreadsheet software that cannot guarantee accuracy of the reports
produced (Ernst & Young, & Greenbiz, 2013:30; Haywood, Brent, Trotter & Wise,
2010:342; Marx & Van Dyk, 2009:01). Worse still, some companies include
cautionary statements about the nature of the information contained in environmental
reports, which further undermine the credibility of the reports (IRC, 2011:01).
• An apparent disconnection between the environmental reporting practice and the
actual environmental performance (Leavoy, 2010:01). This has created an impression
that most of environmental reporting is done for the sake of it, without a credible
commitment to an improvement in environmental performance, as companies are not
required to substantiate their claims made in the reports (Marquis & Toffel, 2014:01;
6
SustainAbility et al., 2008:15). As a result, companies have retained their
international certification, or even won environmental reporting awards and rankings
despite a dismal sustainability performance (3 BL media, 2011:01). Besides,
environmental reports have typically appeared to be disconnected from financial
reports as the messages contained in companies' environmental reports have at times
conflicted with those contained in the financial reports, a scenario that undermines
the credibility of both sets of reports, alike (Mascha & Miller, 2014:02).
• The management of environmental issues appears to be disconnected from core
business strategy and activities (KPMG, 2013:28; IRC, 2011:01). As a result,
environmental reports are also disconnected from financial reports, generally provide
a backward-looking review of performance, and almost always failed to make the
link between environmental issues and companies' core strategies (IRC, 2011:01).
Accordingly, environmental issues are perceived as peripheral activities, which
neither merit inclusion into companies' Enterprise Resource Planning systems nor
require daily management and monitoring (SAPLIB, 2009:01). As a result,
environmental reports have failed to address the issues that cause a lingering trust
deficit between the general public and the intentions and practices of companies
(IRC, 2011:01).
• Despite the widespread uptake of the Internet as a medium of environmental
reporting, and the resulting proliferation of environmental information reported, no
efforts have been made to standardise the on-line reporting practice (Laud &
Schepers, 2009:369). Besides, only a few companies employ Extensible Business
Reporting Language (XBRL) for reporting (a software that makes inter-company
comparability almost immediate) (GRI, 2012:14; Ernst & Young, 2007:22). As a
result, the environmental reporting practice varies significantly such that it impairs
the comparability of the environmental reports of different companies (KPMG,
CFCGIA, GRI & UNEP, 2013:15). Similarly, the comparability of most companies'
annual environmental reports to those of their prior years' are impaired by the fact
information is not always presented in a consistent format, and that some
environmental indicators are immeasurable, incomplete and ambiguous (Boiral,
2010:01).
• Apart from the GRI reporting guidelines, several other environmental reporting
guidelines/frameworks have emerged that are not harmonised to GRI or to each other

7
(KPMG, CFCGIA, GRI & UNEP, 2013:15). Given that different companies are at
liberty to select different guidelines, and considering that the requirements of these
guidelines at times overlap, conflict and even compete, on key issues such as the
reporting format, the comparability of environmental reports has been impaired.
• Most companies have proliferated their environmental reports in different formats
and types, using a varying range of media such as paper and electronic which not
only lead to multiplication of data and but also it diminished the comparability of the
reports to the readers (Business & Society, Morris & Chapman, 2010:31; Laud &
Schepers, 2009:369).
• By purporting to cater for diverse stakeholder groups, many companies simply
expanded their reports by dumping of verbose, unprioritised and unintelligible
information with a limited attempt to explain their industry specific jargon or
technical indicators (Business & Society, Morris & Chapman, 2010:14).
Environmental reporting is aimed at providing information that is useful to a wide range
of users for making decisions (GRI, 2013:17). However, the concerns raised above cast
serious doubts on the ability of the current environmental reporting practices to meet
users’ needs. Consequently, debate is rife as to whether the environmental information
provided by companies is useful to users and whether the users actually employ the
information for making decisions (European Commission, 2011b:92; 93; Hwang, Khoo &
Wong, 2013:178; Said, Ahmad & Senik, 2013:440).
In many countries, most researchers have argued that companies do not provide
environmental information to aid users in making decisions, but rather as a means to
legitimise their operations in society and subsequently reap the rewards of such
legitimacy (De Villiers & Van Staden, 2009; De Villiers & Van Staden, 2006:763; De
Villiers & Lubbe, 2001:81; Deegan, 2002:302; Jollands, Akroyd & Sawabe, 2012:06;
O’Donovan, 2002:346). This argument is supported by the finding that most companies
seem to provide environmental information without enquiring what the users require (De
Villiers & Van Staden, 2008:1). In addition, firms experiencing an environmental crisis
often disclose more general and unimportant environmental information (green-wash) to
create the impression of being environmentally sensitive (Delmas & Burbano, 2011:64;
De Villiers & Van Staden, 2009:31). Other researchers have maintained that under the
8
voluntary environmental reporting regimes, environmental information disclosed is
inadequate even when relevant (Antonites & De Villiers, 2003:10; Danastas & Gadenne,
2004:02; Laud & Schepers, 2009:366; Solomon & Solomon, 2006:573).
Similarly, some researchers have found environmental information to be simply irrelevant
and unreliable (Campbell & Slack, 2008:5; Hunt & Grinnell, 2004:102; Delmas &
Burbano, 2011: 64). In addition, some have lamented that users distrust or are sceptical of
environmental information (IRC, 2011:01; Macalister, 2007:01). Likewise, some
companies have decried a lack of request for their environmental information or feedback
where such information is published, which indicates a lack of demand for environmental
information (European Commission, 2011b:91).
On the contrary, some researchers have contended that users do use environmental
information as evidenced by stock market reaction to disclosure of environmental
performance information (Came, 2011:01; Flammer, 2012:01; Moneva & Cuellar,
2009:441). Similarly, some researchers have opined that users do not only use
environmental information, but also they influence the environmental reporting practices
to suit their needs (Islam & Deegan, 2010:13; Deegan & Islam, 2009:1; Deegan
2002:282; Deegan & Blomquist, 2006:370).
Other researchers have documented mixed findings whereby users perceive
environmental information to be material, and yet they rank it below financial
information (Deegan & Rankin, 1997:580; Myburgh, 2001:211; Stainbank & Peebles,
2006:75). Conversely, some researchers have found that users rank environmental
information higher than certain types of information such as social information and
employee information (Epstein & Freedman, 1994:106; Stainbank & Peebles, 2006:75).
Yet other researchers have compared attitudes and expectations of preparers to those of
users and found considerable disparities, which indicate an environmental reporting
expectation gap (Deegan & Rankin, 1999:341; Haque, Deegan & Inglis, 2013:22;
Myburgh, 2001:211; Mitchell & Quin's, 2005:17).
Various researchers have investigated the usefulness of annual reports to specific user
groups, most notably the analysts, who are perceived to be sophisticated, most informed

9
and articulate user group of annual reports (Bartlett & Chandler, 1997:254; Beattie &
Pratt, 2002:01; Campbell & Slack, 2008:05; Johansson, 2007:30; Deegan & Rankin,
1999:326; Rowbottom & Lymer, 2007:1). The researchers have found that analysts do not
perceive environmental reports to be useful, as only financial statements are important to
this user group. Other researchers have argued that environmental information is useful to
some user groups and not to others (Deegan & Rankin, 1997:580; European Commission,
2011b:91). Deegan and Rankin, (1997:580) for example found that environmental
information was of importance to non-institutional investors but of little importance to
investment analysts. Likewise the European Commission (2011b:91) found that
environmental reports were useful to the civil society, media and consumers but not to
investors, analysts and employees.
Some researchers have lamented that users were asking for better environmental
information than they were receiving (Haque et al., 2013:21; Thomson & Cowton,
2004:214; Danastas & Gadenne, 2004:85). Haque et al. (2013:21) found an expectation
gap between the climate-change related corporate governance information reported by
companies and the information sought by stakeholders. Similarly, Danastas and Gadenne
(2004:85) found that non-governmental organisations (NGOs) in Australia used corporate
environmental reports, however, they perceived the reports to be insufficient even when
relevant. The researchers speculated that the provision of inadequate environmental
information may indicate a lack of commitment to accountability and transparency.
Consistent with the international trends, studies conducted on environmental reporting in
South Africa have revealed a growing interest in corporate environmental reports among
users (De Villiers & Vorster, 1995:57; De Villiers, 1998a:159; De Vries & De Villiers,
1997:3; De Villiers & Van Staden, 2010b:442; Mitchell & Quin's, 2005:26). More
specifically, the studies have indicated that users want more environmental information
than was being provided. In addition, the studies have revealed that users are in favour of
inclusion of environmental information in the annual reports. The studies have further
found that environmental reports provided were perceived to be insufficient, unsystematic
and incomparable among the reporting companies. Similarly, Mitchell and Quinn
(2005:17), and Myburgh (2001:211), have found that there is an expectation gap between
users and preparers on the environmental information that should be disclosed by South
10
African companies listed on the JSE.
Unlike in the developed countries such as the United States, United Kingdom and
Australia, there is a paucity of research which investigates the decision-usefulness of
environmental reports in South Africa. Moreover, the research conducted on decision-
usefulness of environmental reports is outdated in the contemporary dynamic reporting
arena and therefore there is a need for more recent research (De Villiers & Van Staden,
2010b:442; De Villiers & Vorster, 1995:57; De Villiers, 1998a:159; De Vries & De
Villiers, 1997:03; Mitchell & Quinn, 2005:17).
1.2 PROBLEM STATEMENT
The research problem investigated by this thesis is that the increase in the volume and
number of environmental reports produced by South African companies that are listed on
the JSE appears to have occurred without a commensurate improvement in quality
(KPMG, 2013:39). As a result, the decision-usefulness of the environmental reports
produced is doubtful (IRC, 2011:01). Notwithstanding the commendable effort by the
JSE-listed companies to increase the quantity of environmental reports produced, they
appear to be disconnected from the financial reports, generally provide backward looking
review of performance, and almost always fail to make a link between environmental
issues and the company's core strategy (IRC, 2011:01; KPMG, 2013: 23). Accordingly the
reports have failed to address the lingering distrust among stakeholders of the intentions
and practices of companies.
Given that limited environmental reporting research has been conducted in South Africa
on users' environmental information needs, the extent to which they read environmental
reports, whether they employ the reports to inform their decisions, their level of
satisfaction with the reports and perception of relative importance of the reports, little is
known about their perception of decision-usefulness of the reports. Considering that the
main objective of accounting, and environmental reporting is not an exception, is to
provide information that is useful to users for making decisions (FASB, 2010:01; GRI,
2013:17; IASB, 2010:43), it is imperative that users' perceptions on decision-usefulness
of environmental reporting be investigated if the above overarching objective is to be

11
met.
1.3 ASSUMPTIONS
This thesis assumes that the Integrated Annual reports (IARs), Stand-alone Sustainability
Reports (SSRs), and company websites are the only media used by South African JSE-
listed companies to disseminate environmental reports. The thesis also assumes that the
relevance, reliability (verifiability), comparability, understandability and timeliness can
be measured if an appropriate control list and judgement scale is used. The thesis further
assumes that the users themselves are in the best position to determine the type of
information that will influence their decision-making (decision-useful), and that the
information they say they want is the information they need. The needs and wants are
assumed to be in the context of users' decision making as it is in this context that
information is necessary to help reduce the inevitable uncertainty that surrounds every
action. The thesis further assumes that users are heterogeneous, and thus does not
distinguish the perceptions of different user groups. The thesis also assumes that the
questionnaire surveys, if properly used, will reveal the actual preferences of the users.
1.4 RESEARCH QUESTION AND SUB-QUESTIONS
1.4.1 Research question
In this study, the following is the main question that will be answered: Do the users of
South African companies' environmental reports perceive those reports to be decision-
useful?
This study only focusses on the JSE-listed companies as these are the only companies
that are mandatorily required to produce integrated reports in order to comply with the
JSE listing requirements.
1.4.2 Research sub-questions
From the above main question, the following sub-questions will be answered in this
study:

12
1. Are the current environmental reporting practices of South African companies
producing decision-useful environmental reports?
2. What are the information needs of users of environmental reports produced by South
African companies?
3. To what extent do users read the environmental reports produced by South African
companies? Do the users employ those reports when making decisions?
4. To what extent are users satisfied with the decision-usefulness of the environmental
reports produced by South African companies? What are users' suggestions for
improving the environmental reports?
5. How do users rank environmental information relative to other types of information
such as financial and social responsibility information?
6. Is there is an expectation gap between users and preparers of environmental reports
with regard to the decisions-usefulness of the reports?
1.5 OBJECTIVES OF THE STUDY
The broad aim of this study is to assess and determine the decision-usefulness of
environmental reports prepared by JSE-listed South African companies to users. The
study is motivated by a lack of recent research on the decision-usefulness of
environmental reports in South Africa. Moreover, some time has lapsed since this
problem was last investigated in South Africa (De Villiers & Vorster, 1995:57; De
Villiers, 1998a:159; De Vries & De Villiers, 1997:3; De Villiers & Van Staden,
2010b:442; Mitchell & Quinn, 2005:17). The environmental reporting arena has also
changed considerably since a similar research was last conducted. Towards achieving the
above broad aim, the following specific objectives were pursued:
• To evaluate the decision-usefulness of the environmental reports produced by South
African companies
• to determine the information needs of users of environmental reports produced by
South African companies
• to determine the extent to which users read the environmental reports and whether
13
they employ the reports when making decisions
• to determine the degree of satisfaction of users with regard to the decision-usefulness
of the environmental reports and suggest ways of improving those reports
• to investigate how users rank environmental information relative to other types of
information such as financial and social responsibility information
• to ascertain whether there is an expectation gap between preparers of environmental
reports and users of those reports with regard to the decisions-usefulness of the
reports
1.6 IMPORTANCE OF THE STUDY
This research which investigates users’ perceptions on decision-usefulness of
environmental reports is important for various reasons:
Firstly, it will provide valuable insights to preparers of environmental reports wishing to
enhance the decision-usefulness of their reports to users as they will be made aware of
users' needs, the extent to which they read the reports, how they employ the reports, the
attributes of the reports that satisfy their needs and how they rank environmental reports
relative to other types of reports. In addition, preparers will be made aware of reading
techniques employed by users when reading environmental reports, and the preferred
medium from which they read the reports. With this awareness, preparers will be able to
prepare reports that are perceived to be decision-useful by users. Decision-useful reports
can benefit South African companies to better appreciate the link between financial and
non-financial performance, streamline their processes, reduce costs and improve their
efficiency through driving innovation and process optimisation by fostering alignment,
synergy and capacities of employees. These should increase their productivity and result
in new market offerings, a higher sustainable economic return and increased firm value.
Therefore reporting of decision-useful environmental reports could actually improve the
financial performance of South African companies, and enable them to demonstrate their
long-term sustainable financial value.
Secondly, given the recent spate of corporate scandals, string of environmental disasters
and the resulting climate of stakeholders' distrust of South African companies, a holistic

14
approach to transparency is required. The latter can only be achieved if companies
prepare both decision-useful financial reports as well as non-financial reports. This study
informs the companies on the attributes of environmental information perceived by users
to be decision-useful, and thus aides them in achieving holistic transparency with which
they can regain trust and credibility in the eyes of the stakeholders and ultimately attract
consumers that value businesses with sound environmental practices. By regaining
stakeholder' trust, South African companies could benefit from a lower cost of capital,
brand loyalty, boosted brand image and reputation. The latter could further enable the
companies to differentiate themselves from the competition thus create a competitive
advantage in attracting and retaining capital and labour, as well as increasing market
share or even enable the companies to negotiate better contract terms.
Thirdly, given that many South African companies have already undertaken bold
initiatives to improve their environmental performance, manage their environmental
costs, respond to stakeholder demands for environmental information, prepare for future
environmental regulatory requirements, this study informs them on how to effectively
communicate these initiatives to users. By reporting decision-useful environmental
information to users, South African companies will not only improve their internal
awareness of environmental issues that face them, they will themselves be empowered to
reach better decisions as such information is equally useful for internal management. By
preparing decision-useful environmental information, the companies will be able to better
measure, interpret and understand their environmental performance and areas that need
improvement. In fact, decision-useful environmental information can induce a change in
the behaviour of companies in addressing environmental issues as companies tend to
improve their performance in the areas that they disclose as it highlights areas of
weaknesses, that can be focused on to bring about the desired improvement. This should
improve the environmental performance of South African companies thus mitigate their
environmental impact on the ecosystem.
Fourth, preparing decision-useful environmental reports will also enable managers of
South African companies to be in a better position to benchmark and assess their
companies' performance against the norms, codes, performance standards and the ever
changing regulations, and take corrective or anticipatory decisions deemed necessary.
15
This should enable them to be in a better position to respond to their competitors'
initiatives and cushion their companies against possible legal actions that could arise
from their companies' environmental activities. In addition, given that the preparation of
environmental reports takes a significant amount of managers' time and effort as well as
company resources, it is only worthwhile if the resulting environmental reports are
perceived to be decision-useful.
Fifth, this study encourages South African companies to prepare decision-useful
environmental reports, as such reports can help inform and shape their corporate
responsibility strategies by enabling them to demonstrate their commitment to
sustainability development. Given the intensive efforts of producing decision-useful
environmental reports, such reports can guide the implementation of environmental
programmes and ensure their continuity. In addition, decision-useful reports can enable
companies to identify and address business risks and opportunities. Understanding risks,
anticipating and mitigating with those risks appropriately saves companies time and
money. Furthermore, preparation of decision-useful environmental reports ensures
transparent communication and engagement with stakeholders in respect to the
company’s environmental performance and provides the users with vital information
required to make informed choices.
Sixth, this research encourages the expansion of the reporting model beyond financial
reporting model to provide holistic information required for corporate transparency and
accountability, through development of metrics for measuring decision-usefulness of
environmental reports. It does so by developing new ways of documenting disclosure
practices, identifying assumptions of disclosure quality and exploring possible
measurement proxies of the qualitative characteristics of environmental reports. This
study will inform the users of the need to pay attention to the quality of environmental
reports, and of the attributes of environmental reports that can enhance their decision-
usefulness. This should encourage stakeholders to compel companies to find better ways
of producing decision-useful information that address the ever changing and varied
concerns of stakeholders. Alternatively, the stakeholders will refrain from using
information that is deemed not to be decision-useful as such information may result in
erroneous decisions, which have increasingly become irreversible.

16
Seventh, conventional accounting systems, alongside international accounting standards,
fail to directly and systematically address environmental stakeholder' concerns, as they
typically focus on maximisation of financial gains but ignore the environmental costs of
those gains. Considering that stakeholders are increasingly concerned with the way
companies are responding to environmental issues, and that conventional accounting
systems have failed to promote the needs of non-financial stakeholders, a research that
speaks to the neglected needs of non-financial stakeholders is thus essential. This study
empowers users of environmental reports as it lends a voice to these users to indicate
their environmental information needs and preferences. Besides, the findings of this study
serve to redress the imbalance between preparers and users in lobbying regulators to
enforce preparation of decision-useful information. In fact, the regulators may draw
directly from this study’s findings, the input required for formulating measures for
improving the decision-usefulness of environmental reports produced by South African
companies.
Eighth, the findings of this study will be of significance to the government and
accounting standard setters/reporting guideline developers, given that these authoritative
bodies undertake the task of formulating new legislation and accounting
standards/guidelines respectively, and amending the existing ones. The findings provide
invaluable insights on specific attributes perceived by users to enhance decision-
usefulness of environmental reports, which could be used to inform future endeavours by
these regulatory bodies when guiding South African companies' environmental reporting
practices. The findings of this study will also be of significance to accounting academics
who may adapt the framework developed in the content analysis phase of this study to
evaluate the decision-usefulness of other non-financial reports, with a view to improve
the quality of these reports.
1.7 SCOPE OF THE STUDY
As already indicated, the broad aim of this study is to assess and determine the decision-
usefulness of environmental reports prepared by South African JSE-listed companies to
users of those reports. Accordingly the study is conducted in two phases – content
analysis phase and a questionnaire survey phase – which are critical in defining the scope
17
of the study.
1.7.1 Scope of the content analysis phase of this study
The content analysis phase of the study will only analyse and assess the decision-
usefulness of environmental reports of the top 100 JSE-listed operating South African
companies. In particular, the study will analyse and assess the relevance, reliability
(verifiability), comparability, understandability, timeliness and overall decision-
usefulness of environmental reports of the top 100 JSE-listed operating South African
companies. Accordingly the environmental reports of non-operating companies, unlisted
companies, or companies that fall below the top 100 will be excluded from this study.
Only the environmental reports contained in the IARs, SSRs and companies' websites
will be analysed based on the items contained in five checklists and two judgement
scales. Thus any environmental disclosures on other media such as advertisement,
promotional material, press releases, and packaging of company products are ignored. In
addition, only the environmental reports produced in the year ended 31st December 2013
will be analysed.
1.7.2 Scope of the questionnaire survey phase of the study
The questionnaire survey phase of the study will only focus on the environmental
information needs of users, the extent to which the users read environmental reports,
whether they employ the reports when making decisions, their degree of satisfaction with
the decision-usefulness of the reports, and their suggestions for improving the latter. In
addition, the study will only focus on how users rank environmental information relative
to other types of information, and whether there is an expectation gap between users and
preparers of environmental reports with regard to the decisions-usefulness of the reports.
Only the perceptions of three user groups will be elicited, namely; ethical investment
funds, environmental NGOs and environmental accounting researchers. In addition, only
the perceptions of preparers from top 100 JSE-listed companies will be elicited. The
views of the respondents will only be elicited during the period between 1st July 2013
and 31st December 2013.

18
1.8 RESEARCH METHODOLOGY
As already indicated, the research methodology will be divided into two phases. The first
phase aimed at evaluating the decision-usefulness of the current environmental reporting
practices by South African companies will be in form of a content analysis study. The
second phase aimed at eliciting the users' and preparers' perceptions on decision-
usefulness of environmental reports will be in form of a questionnaire survey.
1.8.1 Content analysis phase of the study
Content analysis; “a technique for making inferences by objectively and systematically
identifying specified characteristics of messages” (Holsti, 1969:142); will be employed to
achieve the first research objective which is to evaluate the decision-usefulness of the
environmental reports produced by South African companies. Given the scarcity of
theory on environmental reporting practices in South Africa, the current study will
explore, interpret, describe and explain the nature and type of information provided in
environmental reports. Therefore, the proposed research will contribute to theory-
building, rather than test the existing theory (Leedy & Ormrod, 2001:101), and is thus in
the realm of qualitative research.
The first research objective requires that the presence of certain words and concepts
within the texts of the environmental reports be investigated. This type of research lends
itself well to a content analysis Krippendorff, 1980:61). Besides, the methodology is
justified as a common practice as it has been widely used in similar prior research
(Borkowski, Welsh & Wentzel, 2010; CPA Australia & GRI, 2013; KPMG, 2008b;
Cowan, 2007; Jose & Lee, 2006; De Villiers & Van Staden, 2006; O’Donovan, 2002).
Content analysis methodology was also selected due to its various advantages
(Krippendorff, 1980:21); firstly, it is an unobtrusive technique therefore the subject
company is unaware of the study and thus acts naturally. Secondly, the problems of non-
response bias associated with questionnaires are avoided. Thirdly, the researcher can
accept data in a variety of forms such as annual reports, websites and corporate
responsibility reports.
19
1.8.1.1 The research population and sample
The population of the proposed research will comprise the top 100 operating companies
listed on the JSE (See Appendix I). The sample will consist of 66 top 100 JSE-listed
operating companies based on market capitalisation as quoted on the Sharenet website – a
reliable website that provides on-line information on companies listed on the JSE – on 1st
January 2013 (See Appendix J). The top 100 JSE-listed operating companies have been
selected due to their large sizes and obvious impact on the ecologies of the areas that they
operate from (Jose & Lee, 2006:311). In addition, information relating to these
companies is more readily available as compared to other forms of businesses.
1.8.1.2 Data collection
In principle, the data collection exercise will entail scanning of IARs, SSRs and websites
of companies to determine the presence of pre-listed items contained in the five control
lists and two judgement scales applied to determine the quality of the item disclosed
(refer to Appendix A; B; C; D and E). To measure relevance, reliability (verifiability),
timeliness and understandability of an item pre-listed in four control lists (See Appendix
A; B; C; D), a company’s IAR, SSR and website will be scanned to determine the
presence of the pre-listed. If the item is absent, a score of zero points will be assigned. If
present, the nature of disclosure of the item will then be assessed and a score of one point
assigned if it is narrative, two points if it is quantitative but non-monetary, and three
points if it is monetary in nature. One extra point will be awarded if the disclosure is
futuristic or specific.
To measure comparability, a unique control list (containing GRI environmental
performance indicators) and a judgement scale will be employed (See Appendix E). If a
performance indicator pre-listed in the control list is absent in the IAR, SSR and a
website of a company, a score of 0 points will be assigned. If present, the performance
indicator will be assigned scores according to how it is disclosed. If narrative, it will be
assigned one point, however if quantitative, it will be assigned two points. A performance
indicator will be awarded three points if disclosed relative to the prior periods, but four
points if disclosed relative to targets. A performance indicator will be assigned five points
if disclosed relative to that of other companies or industry averages.

20
1.8.1.3 Data analysis
A total score for each company will then be computed for each of the five qualitative
characteristics, namely, relevance, reliability (verifiability), comparability, timeliness and
understandability. The total score will then be expressed as a percentage of a maximum
possible score that a company can get, to arrive at sub-quality index for each of the five
qualitative characteristics. The sub-quality indices will then be used to rank the sampled
companies in a descending fashion (from highest scorer to the lowest scorer).
To determine the overall decision-usefulness score for each company, an arithmetic mean
of the five sub-quality indices will be computed. The arithmetic mean also in a
percentage form will provide the overall disclosure quality index for each company,
which will be used to rank companies in a descending fashion (from highest scorer to the
lowest scorer).
1.8.1.4 Validity and reliability
To ensure reliability of the content analysis instruments, measures will be undertaken to
achieve stability and reproducibility of the analysis. To achieve stability, the content
analysis of the environmental reports will be conducted twice at different dates, in a two-
week interval. The control lists filled in each round will be compared to determine any
discrepancies in the results. Any differences observed between both rounds will be noted
and promptly rectified. To achieve reproducibility, two coders will be used in the pilot
phase of the study and measures undertaken to minimise the discrepancies between the
two coders by providing training, clear instruction, clear coding rules as well as using
inter-coder comparison and reconciliation.
1.8.2 Survey
The second, third, fourth, fifth and sixth research objectives aim at determining the
perceptions of users and preparers regarding the decision-usefulness of environmental
reports produced by South African companies. This type of research lends itself well to a
questionnaire survey. Besides, the methodology is justified as a common practice widely
used in similar prior research (De Villiers & Van Staden, 2010a; De Villiers & Van

21
Staden, 2010b; Miller, 2012:01; Mitchell & Quinn, 2005:22; Wong, 2012:266). The
questionnaire survey methodology was also selected due to its various advantages
(Ambe, 2007:131); firstly, it is a quick, inexpensive and convenient way of obtaining
information from a large number of widely dispersed respondents, than using the personal
interviews method. Secondly, respondents can complete the questionnaire anonymously,
thus ensuring confidentiality. Thirdly, it facilitates comparison and analysis of views from
a wide range of respondents, particularly if closed-ended questions are used (Johnson &
Christensen, 2010:170). Fourthly, unlike the personal interviews, it allows the
respondents to answer the questions at their own convenience without the undue
influence of the researchers’ presence, which tends to introduce bias (Al-Mubarak,
1997:180).
1.8.2.1 Research population and sample
The population of users as defined in the accounting conceptual frameworks could
foreseeably consist of the entire South African population (GRI, 2008; IASB, 2008;
FASB, 2010; Mitchell & Quinn, 2005:22). This study will only focus on the user groups
actively involved in 1) ethical investments (ethical investment funds and their
representatives), 2) environmental protection (environmental NGOs and their
representatives), and 3) environmental reporting research (environmental reporting
researchers who have published journal articles on annual reporting in South Africa).
Given the lack of a comprehensive public listing of all ethical investment funds,
environmental NGOs and environmental reporting researchers in South Africa, a
compilation of a population frame list will be done with aid of the Internet. Consistent
with the prior studies, a census of the identified users will be conducted given that the
population of users is expected to be relatively small (Tilt, 1994; Danatas & Gadenne,
2006:08).
The population of preparers of environmental reports will comprise representatives of the
top 100 operating JSE-listed companies. This will include finance directors, accountants,
executives, managers and consultants. Again, a census of the preparers will be conducted,
as done in prior studies, given that the population is expected to be relatively small (Tilt,
1994; Danatas & Gadenne, 2006: 08).
22
1.8.2.2 Questionnaire design and data collection
Two similar questionnaires will be designed; the first one will elicit the views of users
regarding the decision-usefulness of environmental reports prepared by South African
companies (see Appendix G). Likewise, the second questionnaire will elicit the
perceptions of the preparers on the same (see Appendix H). The respondents will be sent
an e-mail, with a request to click on a Uniform Resource Locator (URL) link provided in
the e-mail message and to complete the web-based survey anonymously. This implies that
only respondents who have an e-mail address will be included in this survey.
1.8.2.3 Data analysis
The data from the returned questionnaires will be analysed using Statistical Package for
Social Sciences (SPSS) version 22. Descriptive statistics such as percentages, means, and
standard deviations as well as inferential statistics such as T-Tests, Binomial Tests, Chi-
square Tests, will be used to analyse the data collected from the questionnaires. The
views of users and preparers will then be compared to determine whether there are
significant differences that could suggest the existence of an expectation gap. Question 14
in both questionnaires is open-ended. Accordingly a qualitative data analysis method, in
the form of Creswell’s data analysis spiral will be employed to analyse the users and
preparers responses to this question. Again the views of users and preparers will then be
compared to determine whether there are significant differences that suggest the existence
of an expectation gap.
1.8.2.4 Reliability and validity
The reliability of the research instrument will be tested in a pilot test of the questionnaires
meant to ascertain whether the questions are clear, unambiguous and understandable. This
should ensure consistency in the results obtained. During the pilot test, the questionnaires
will be completed and critically evaluated by ten selected academics with vast experience
in questionnaire design. Any shortcomings in the questions will be promptly rectified. To
further test for reliability, Cronbach's Alpha, a coefficient that is commonly used to
measure the internal consistency of a questionnaire will be computed to test the internal
reliability of the two questionnaires (Trochim & Donnelly, 2008:130).
23
As suggested by Rowley (2002), construct validity of the questionnaires will be achieved
by reducing subjectivity of questions in a questionnaire through linking the questions
posed to the original research questions or research objectives. In addition, a pilot test of
the questionnaires will be conducted in which the questionnaires were completed and
critically evaluated by ten selected academics with vast experience in questionnaire
design. The input of the 10 academics will also be employed to ensure content validity.
To ensure external validity, measures such as the use of a census will be undertaken to
achieve an acceptable response rate and minimise non-response bias.
1.9 LIST OF DEFINITIONS USED
Prior literature provides definitions for various accounting terms deemed relevant for this
study. For the purpose of this study, the following definitions will be used, while some
will be provided within the context of the thesis.
1.9.1 Environmental reporting
Environmental reporting is defined as “the process of communicating…environmental
effects of organisations’ economic actions to particular interest groups within society and
to society at large” (Gray, Owen & Maunders, 1987:9). Environmental reports are the
outcome of environmental reporting that are communicated to the users. For the purpose
of this study, the terms environmental reporting refers both to the process of
communicating and the outcome that is communicated.
1.9.2 Sustainability reporting
Sustainability reporting is defined as the “process of communicating social and
environmental effects of a company's activities to particular interest groups within society
and to society at large” (Gray, Owen, & Maunders, 1987:ix). It involves extending the
accountability of a company beyond the traditional role of providing a financial account
to the shareholders.

24
1.9.3 Social reporting
Social reporting is defined as “the process of communicating the social ... effects of a
company's activities to particular interest groups within society and to society at large”
(Gray et al., 1987:ix). It entails reporting on issues such as workplace health and safety,
employee retention, labour rights, human rights, community engagement, product
responsibility and company philanthropy (GRI, 2000:01).
1.9.4 Users
The Institute of Chartered Accountants in England and Wales (ICAEW) (1975:17)
defines users as those “having a reasonable right to information concerning the reporting
entity. A reasonable right to information arises where the activities of an entity affect or
may affect the interest of a user group”. The users include; equity investors, creditors,
employees, analysts/advisers, business contact groups, government and the general
public. For the purpose of this research, users refer to ethical investment funds,
environmental NGOs and environmental reporting researchers or academics in South
Africa. The terms user, stakeholder and reader will be used interchangeably.
1.9.5 Preparers
The term preparers refers to companies’ directors, managers, accountants, and company
officials who are directly and or indirectly involved in the preparation of environmental
reports (Mitchell & Quinn, 2005:18). For the purpose of this study, the term preparers
refers to those who are involved in the preparation of environmental reports of top 100
companies listed on the (JSE).
1.9.6 Decision-usefulness
As alluded to in the first pragraph, environmental information, like any other accounting
information, is decision-useful if it assists users to make decisions (GRI, 2013:17; Hooks
& Van Staden, 2004:46). To be decision-useful, environmental information must be
relevant and reliable (FASB, 2008:02; FASB, 2010:16; IASB, 2008:38; IASB, 2010:17).
Decision-usefulness of environmental information is enhanced when such information is
comparable, understandable, timely and verifiable (FASB, 2010:19; IASB, 2010:19).
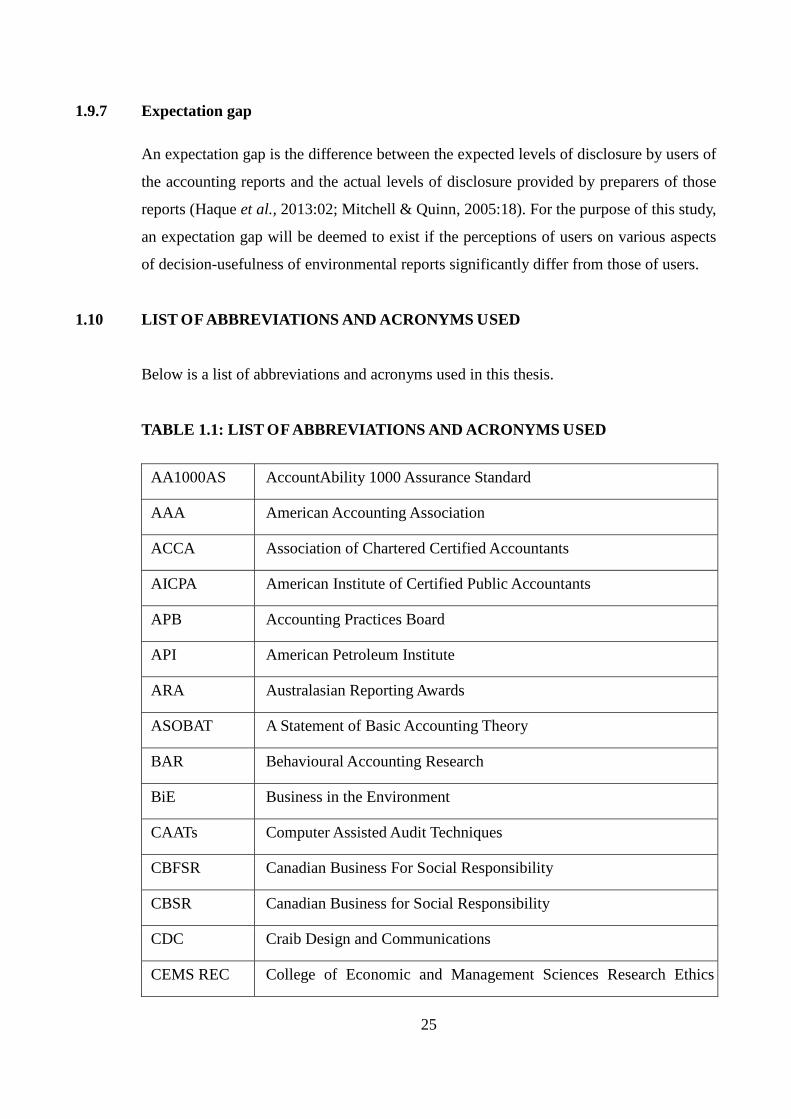
25
1.9.7 Expectation gap
An expectation gap is the difference between the expected levels of disclosure by users of
the accounting reports and the actual levels of disclosure provided by preparers of those
reports (Haque et al., 2013:02; Mitchell & Quinn, 2005:18). For the purpose of this study,
an expectation gap will be deemed to exist if the perceptions of users on various aspects
of decision-usefulness of environmental reports significantly differ from those of users.
1.10 LIST OF ABBREVIATIONS AND ACRONYMS USED
Below is a list of abbreviations and acronyms used in this thesis.
TABLE 1.1: LIST OF ABBREVIATIONS AND ACRONYMS USED
AA1000AS AccountAbility 1000 Assurance Standard
AAA American Accounting Association
ACCA Association of Chartered Certified Accountants
AICPA American Institute of Certified Public Accountants
APB Accounting Practices Board
API American Petroleum Institute
ARA Australasian Reporting Awards
ASOBAT A Statement of Basic Accounting Theory
BAR Behavioural Accounting Research
BiE Business in the Environment
CAATs Computer Assisted Audit Techniques
CBFSR Canadian Business For Social Responsibility
CBSR Canadian Business for Social Responsibility
CDC Craib Design and Communications
CEMS REC College of Economic and Management Sciences Research Ethics

26
Committee
CEO Chief Executive Officer
CERES Coalition for Environmentally Responsible Economies
CFCGIA Centre For Corporate Governance In Africa
CICA Canadian Institute of Chartered Accountants
CIMA Chartered Institute of Management Accountants
CRC Corporate Responsibility Coalition
CRS Congressional Research Service
CSD Corporate Social Disclosure
CSED Corporate Social and Environmental Disclosures
CSR Corporate Social Responsibility
CPA Certified Practising Accountants
DCCA Danish Commerce and Companies Agency
DTT Deloitte Touché Tohmatsu
EEA European Environment Agency
EIRS Ethical Investment Research Services
EIU Economist Intelligence Unit
EMI Environmental Mainstreaming Initiative
EMS Environmental Management System
ENS Environment News Service
EPA Environmental Protection Authorities
E-PRTR European Pollutant Release and Transfer Register
FASB Financial Accounting Standards Board
FBDS Fundação Brasileira para o Desenvolvimento Sustentável
FEE Fédération des Experts Comptables Européens

27
FSC Futtera Sustainability Communication
GEMI Global Environmental Management Initiative
GHG Greenhouse Gas
GMA Grocery Manufacturers Association
GRI Global Reporting Initiative
HBS Harvard Business School
HTML Hyper Text Markup Language
IARs Integrated Annual Reports
IASB International Accounting Standards Board
ICAEW Institute of Chartered Accountants in England and Wales
IFAC International Federation of Accountants
IMA Institute of Management Accountants
IODSA Institite of Directors in Southern Africa
IPIECA International Petroleum Industry Environmental Conservation
Association
IRC Integrated Reporting Committee
IRRC Investor Responsibility Research Center
ISAE International Standard on Assurance Engagements
JAS-ANZ Joint Accreditation System - Australia and New Zealand
JSE Johannesburg Securities Exchange
KPI Key Performance Indicators
KPMG Klijnveld Peat Marwick Goerdeler
MBA Masters in Business Administration
MPRA Munich Personal Repec Archive
NAOD National Audit Office of Denmark
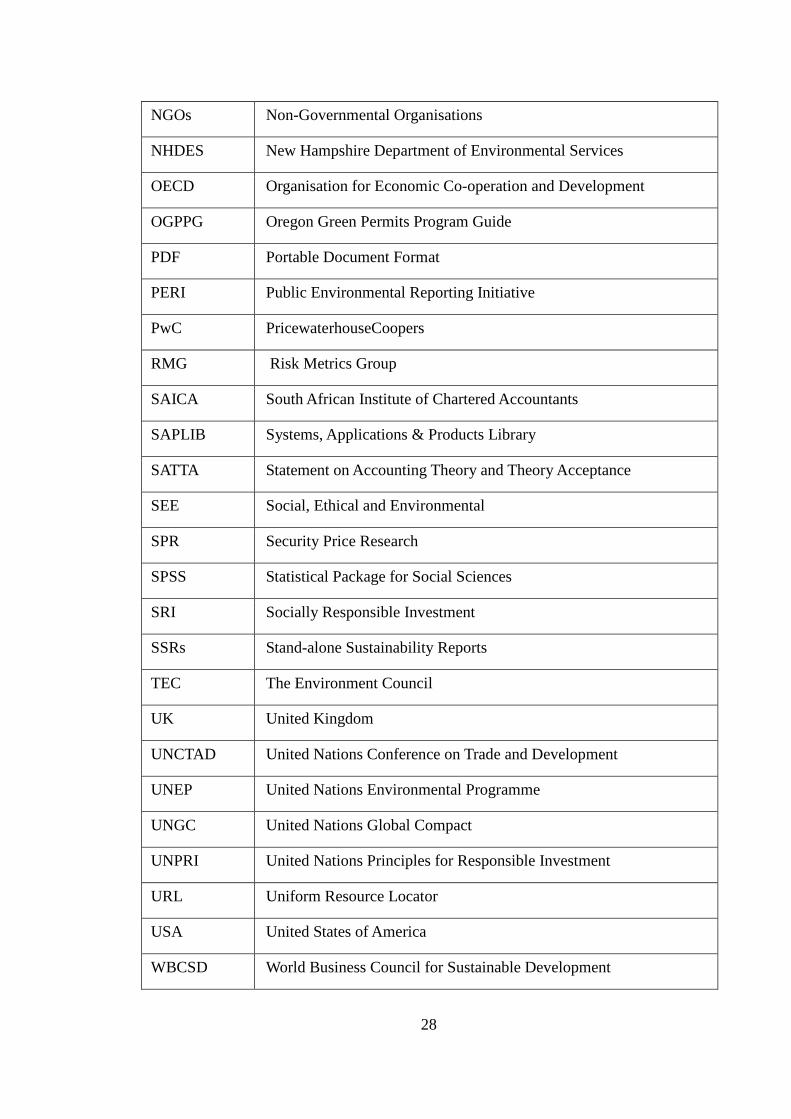
28
NGOs Non-Governmental Organisations
NHDES New Hampshire Department of Environmental Services
OECD Organisation for Economic Co-operation and Development
OGPPG Oregon Green Permits Program Guide
PDF Portable Document Format
PERI Public Environmental Reporting Initiative
PwC PricewaterhouseCoopers
RMG Risk Metrics Group
SAICA South African Institute of Chartered Accountants
SAPLIB Systems, Applications & Products Library
SATTA Statement on Accounting Theory and Theory Acceptance
SEE Social, Ethical and Environmental
SPR Security Price Research
SPSS Statistical Package for Social Sciences
SRI Socially Responsible Investment
SSRs Stand-alone Sustainability Reports
TEC The Environment Council
UK United Kingdom
UNCTAD United Nations Conference on Trade and Development
UNEP United Nations Environmental Programme
UNGC United Nations Global Compact
UNPRI United Nations Principles for Responsible Investment
URL Uniform Resource Locator
USA United States of America
WBCSD World Business Council for Sustainable Development

29
WFE World Federation of Exchanges
WRI World Resources Institute
XBRL eXtensible Business Reporting Language
1.11 DEMARCATION OF CHAPTERS
CHAPTER 1: INTRODUCTION
This chapter introduces the research topic, provides the background of the research and
outlines the research problem. In addition, the chapter provides the objectives and scope
of the research as well as the research methodology employed to solve the problem.
CHAPTER 2: THE EVOLUTION OF ENVIRONMENTAL REPORTING
This chapter provides a historical context to the environmental reporting practice by
tracing its origin and developments.
CHAPTER 3: THEORETICAL FOUNDATION OF ENVIRONMENTAL
REPORTING
This chapter examines various theoretical perspectives employed in the extant literature
in an attempt to describe, explain, and evaluate the environmental reporting practices and
to prescribe how the reporting should be practiced. In addition, the chapter provides a
detailed examination of the decision-usefulness theory, which is the theory adopted in this
study.
CHAPTER 4: PRIOR RESEARCH ON DECISION-USEFULNESS OF
ENVIRONMENTAL REPORTS
This chapter reviews the prior research on decision-usefulness of environmental reports.
By so doing, the chapter identifies the gaps in the literature and outlines the research
questions that have remained unanswered in the prior research.
30
CHAPTER 5: RESEARCH DESIGN AND METHODOLOGY
This chapter presents the two research methods employed in this study to address the
research objectives. The chapter discusses the content analysis and questionnaire survey
methods employed to collect and analyse the data required to address the objectives.
CHAPTER 6: RESEARCH RESULTS OF CONTENT ANALYSIS
This chapter presents, analyses and discusses the results of content analysis of
environmental reports of the sampled top 100 listed companies.
CHAPTER 7: RESEARCH RESULTS OF QUESTIONNAIRE SURVEY
This chapter presents, analyses and discusses the results of the questionnaire survey
administered to the sampled users and preparers of environmental reports of listed
companies.
CHAPTER 8: SUMMARY AND CONCLUSIONS
The summary and conclusions of the study, together with original contributions,
limitations and suggestions for future studies are presented in Chapter 8.
The next chapter provides the historical context to the environmental reporting practice
by tracing its origin and developments from 1960 to 2014.

31
CHAPTER 2
THE EVOLUTION OF ENVIRONMENTAL REPORTING 2
2.1 INTRODUCTION
The accounting reporting practice cannot be properly understood unless the historical
context in which it emerged is recognised (Hibbit, 2004:28). Understanding the historical
context of accounting also assists in predicting the trajectory of its future (Funnell,
1995:03; IMA, 2008:02). Given the increase in the number of sustainability and
environmental reports produced by companies over time, it is necessary to establish
whether such an increase has been accompanied by an enhancement of the decision-
usefulness of the reports to the intended audience (Owen, 2003:06). This chapter provides
a historical context to the environmental reporting practice as a component of
sustainability reporting by tracing its origin and developments in order to determine
whether such developments had resulted in decision-useful reports.
The rest of the chapter is structured as follows: Section 2.2 provides the link between
environmental, social and sustainability reporting. Section 2.3 discusses the qualitative
characteristics of decision-useful reports. This is followed by a discussion on the
environmental and social reporting developments and shortcomings of the period
between 1960 and 1989 in section 2.4. Section 2.5 examines the significant developments
in and shortcomings of environmental and social reporting during the 1990s. The second
last section discusses the reporting developments in and shortcomings of the years
between 2000 and 2013. Finally, section 2.7 provides the summary and conclusions to the
chapter.
2.2 THE LINK BETWEEN ENVIRONMENTAL, SOCIAL AND SUSTAINABILITY
REPORTING
Although this research focuses on environmental reporting, companies are increasingly
expected to demonstrate responsibility for their impact on the environment and on society
at large (D'Amato, Henderson & Florence, 2009:02). Consequently the environmental

32
reports have become inseparable from and interdependent on social reports hence a
common practice of convergence of the two in one report known as a sustainability report
has emerged (Emtairah, 2002:12). It follows therefore that in order to appreciate the
developments in environmental reporting, it is inevitable to examine the developments in
social reporting in particular and sustainability reporting in general.
Given the connected nature of environmental and social reports, it is not surprising that
the terms environmental, social and sustainability reports have been used interchangeably
in prior literature despite having different meanings (Ioannou & Serafeim 2011:02). To
avoid confusion, it is necessary to distinguish these terms. This was done in section 1.9 of
Cchapterhapter 1, where the definition of each term was provided.
2.3 QUALITATIVE CHARACTERISTICS OF DECISION-USEFUL REPORTS
It is widely acknowledged by the major accounting conceptual frameworks that the
primary purpose of corporate reporting, be it financial or non-financial, is to provide
information that is useful for decision-making (FASB, 2010:01; GRI, 2013:17; IASB,
2008:12). Information that is useful in decision-making is also useful in assessing how
management has fulfilled its stewardship responsibility (FASB, 2010:11). The
frameworks also identify the qualitative characteristics that useful information possess
(FASB, 2010:16; GRI, 2013:18; IASB, 2008:12). These include, but are not limited to:
relevance, faithful representation, reliability, understandability, comparability, timeliness
and verifiability.
The revised joint accounting conceptual framework further distinguishes between two
types of qualitative characteristics of useful information namely; fundamental qualitative
characteristics (relevance and faithful representation) and enhancing qualitative
characteristics (comparability, timeliness, verifiability and understandability) (FASB,
2010:16). These qualitative characteristics are expounded below.
2.3.1 Fundamental qualitative characteristics
For information to be useful, it must be both relevant and faithfully represented (FASB,

33
2010:19). Neither a faithful representation of an irrelevant phenomenon, nor an unfaithful
representation of a relevant phenomenon, helps users to make good decisions. The
revised framework also advises that a company must first identify the phenomenon that
has the potential to be useful to users of accounting information, and then identify the
type of information about that phenomenon that would be most relevant, and whether it is
available and can be faithfully represented.
2.3.1.1 Relevance
Relevance refers to the capacity of information to influence a decision by helping users to
form predictions about the outcome of past, present and future events, or confirm and
correct prior expectations (FASB, 2010:17). For accounting information to influence a
decision, it must enable users to make new predictions, confirm or correct prior
predictions (FASB, 2010:25). Such information must also suit the diverse expectations
and decision-making needs of the intended users by addressing their concerns (GRI,
2000:16). This requires that the stakeholders be engaged meaningfully in the reporting
process through dialogue to determine what is or is not important to them.
2.3.1.2 Faithful representation
The revised joint conceptual framework replaces reliability with faithful representation
(FASB 2010:26). Faithful representation requires an agreement between the information
presented and the actual phenomenon it purports to represent (IASB, 2008:37). To
faithfully represent, accounting information would have three characteristics namely;
completeness, neutrality and freedom from error (FASB, 2010:17). Completeness refers
to avoidance of partiality, selectivity or omission in reporting (FASB, 2010:18).
Neutrality means that the information presented is objective or unbiased and that it does
not unduly influence the user (FASB, 2010:18). Freedom from error requires factual
depiction of a phenomenon and avoidance of errors or omissions (FASB, 2010:18).
However, it does not require provision of perfectly accurate information in all respects.
For the purposes of this research and in accordance with the GRI guidelines, reliability is
retained as a fundamental qualitative characteristic (GRI, 2013:18). According to GRI,
(2013:18), to ensure reliability of information, a company should gather, record, compile,
34
analyse and disclose information and processes used in preparation of the report in a way
that they can subject it to examination and that establishes the quality and materiality of
the information. In addition, stakeholders should have confidence that a report can be
checked to establish the veracity of its contents and the extent to which it has
appropriately applied reporting principles.
2.3.2 Enhancing qualitative characteristics
Comparability, timeliness, verifiability and understandability are the qualitative
characteristics that enhance the usefulness of information that is relevant and faithfully
represented (FASB, 2010:19). Where a phenomenon can be depicted in two ways that are
equally relevant and faithfully represented, the enhancing qualitative characteristics may
help to determine the most appropriate way to depict a phenomenon (FASB, 2010:19).
The revised joint conceptual framework advocates for the maximisation of enhancing
qualitative characteristics to the extent possible (FASB, 2010:21). It however reiterates
that the enhancing qualitative characteristics, either individually or as a group, cannot
make information useful if that information is irrelevant or not faithfully represented.
2.3.2.1 Comparability
“Comparability is the qualitative characteristic that enables users to identify and
understand similarities in, and differences among, items” (FASB, 2010:19).
Comparability requires consistency in the recognition, measurement, and presentation of
information in both form and content of reporting over time within a reporting entity or in
a single period across entities (FASB, 2010:19). Accordingly, information should not be
presented for a single year only, but rather it should be juxtaposed with similar
information for the prior years to enable the user to compare the performance and assess
trends (GRI, 2013:18). In addition, it requires that similar situations be presented in a
similar manner, while contrasting situations should be presented differently across
companies by adopting industry norms for performance indicators (FASB, 2010:20; GRI,
2000:17).

35
2.3.2.2 Timeliness
This qualitative characteristic requires that information be provided within the time when
it is needed or before it loses its capacity to influence decisions (GRI, 2013:18; IASB,
2008:40). This requires that the reports be published at fixed intervals or following a
regular cycle although reporting on the Internet allows relevant information to be updated
more frequently (GRI, 2000:18). The sooner the information is received, the more useful
it is in influencing decisions (FASB, 2010:20). Timeliness requires that the reporting
period used be clearly indicated along with reasons for selection of a reporting period if
less frequent than annually (GRI, 2000:18).
2.3.2.3 Verifiability
Verifiability requires that reported data and information should be independently
attestable from an objective standpoint (FASB, 2010:20; IASB, 2008:39). This requires
the disclosure of the underlying assumptions, methods of compiling information as well
as other factors and circumstances that support the information. Verifiability is necessary
to assure users that the reported information faithfully represents the phenomena it
purports to represent (FASB, 2010:20).
2.3.2.4 Understandability
Understandability refers to the quality of information that enables users who have
reasonable education to comprehend its meaning and thus avoid misinterpretation of
information (GRI, 2013:18; IASB, 2008:52). Understandability in reporting requires
enhancement of readability of a report through avoiding technical and scientific terms,
provision of explanatory notes of the terms if used, use of simple unambiguous words,
use of a logical report structure, straightforward sentences and styles, use of suitable
graphics and pictures in addition to text, and provision of a glossary (Delloite Touché
Tohmatsu, 2002:05). It also requires classifying, characterising, and presenting
information clearly and concisely (FASB, 2010:21).

36
2.4 SUSTAINABILITY REPORTING DEVELOPMENTS BETWEEN 1960 AND 1989
2.4.1 Sustainability reporting between 1960 and 1969
Although companies and business enterprises had obligations towards the society from
way back in the past, modern sustainability reporting is thought to have emerged from the
realm of financial reporting in the 1960s to be an independent reporting practice (Kok,
2008:05). The economic prosperity, mass consumption and exponential population
growth of the 1960s culminated in a plethora of catastrophic environmental disasters
(Wyatt & Woodard, 2010:01). Consequently environmentalists raised concerns about the
environmental costs of the mass consumption that were neither reported nor
acknowledged in the financial reports (KPMG, 2010:06; Antal, Dierkes, MacMillan &
Marz, 2002:03). This marked the emergence of a new stakeholder group that was not
primarily interested in the financial performance of companies but rather in their
environmental performance (Kok, 2008:03).
As the environmental disasters continued unabated, they sparked debates among
academics who unanimously acknowledged that companies had responsibility to the
society extending beyond legal and economic obligations (Mahmoud, 2009:28).
Subsequently the need for environmental reporting emerged and spread into mainstream
thinking along with the development of most of its key concepts and definitions (Antal et
al., 2002:09; Kok, 2008:05; Mahmoud, 2009:27).
As the environmental movement gained momentum, it undermined the general public's
trust in companies and made them critical and vigilant over the negative externalities of
the companies (Hibbit, 2004:31). This culminated in mass demonstrations to pressurise
companies to show responsibility to societal concerns (Mahmoud, 2009:25). By contrast,
most companies viewed the environmental concerns as ambiguous ideas of voluntary
nature that had unjustifiable costs (Vrabic, 2010:06). Accordingly they launched a series
of deceptive ‘greened’ advertisements containing outrageous assertions meant to
manipulate the perception of the already hostile audience (Vrabic, 2010:16). Although
such advertisements were highly dis-informative, they marked the initial
acknowledgement by companies that they were not only expected to be accountable to

37
the shareholders but also to other stakeholders and the general public (Hibbit, 2004:32;
Marlin & Marlin, 2003:01).
2.4.2 Sustainability reporting between 1970 and 1979
The energy crisis of the 1970s which resulted in gasoline shortages and rising fuel costs
further enraged the general public as it increasingly questioned the role of governments
and companies, and their order of priorities in the wake of depletion of non-renewable
resources (Kok, 2008:06). Consequently, sustainability reporting experiments started in
the United States with a focus on environmental issues (Kolk, 2005:35; KPMG, 2010:06).
To advance environmental reporting and performance, the Council on Economic
Priorities (CEP) in the country and others began to rate companies publicly on their
environmental performance and reporting (Katsoulakos, Koutsodimou, Matraga &
Williams, 2004:08). Concomitantly, the American accountancy journals started to publish
articles suggesting how to measure and report on environmental pollution (Marlin &
Marlin, 2003:01). A series of surveys conducted by Ernst and Young in the United States
revealed a dramatic increase in the percentage of multi-national companies (Fortune 500
companies) that reported on their sustainability performance with an overriding emphasis
on environmental issues in their annual reports (Kolk, 2005:35). The surveys conducted
between 1972 and 1978 (see Table 2.1 below) revealed a general increase in reporting
trend from 48% in 1971 to 90% in 1978 (Roser, 1979:22).
TABLE 2.1: ENVIRONMENTAL REPORTING BY THE FORTUNE 500
AMERICAN COMPANIES
Year 1971 1972 1973 1974 1975 1976 1977 1978
Percentages 48% 57% 60% 69% 85% 91% 89% 90%
Source: Roser (1979:22)
By contrast, it is social reporting that emerged as the predominant form of sustainability
reporting in Europe (Kolk, 2005:35). The rapid uptake of social reporting was attributed
to the debate on the status of labour and its position in the enterprise at a time when
societal expectations of accountability from companies were rising (Owen, 2003:02). The
more perceptive companies speedily grasped the public relations benefits of producing at
38
least a rudimentary social report aimed at portraying a favourable image of a company's
responsiveness to key societal, mostly employee related, concerns (Owen, 2003:02).
Hence the reporting initiatives of the time inevitably focused on reporting to employees
(employee reporting) and reporting about employment (employment reporting) (Gray,
Kouhy & Lavers, 1995:56).
Another reason for the increase in social reporting was that human resource reporting had
become a mandatory requirement in some countries such as France (Bilan Social)
(Hibbitt, 2004:79). By early 1977, French enterprises with three hundred or more
employees were required by law to produce social reports (Bilan Social) with numerical
data needed to assess the work and employment situation within the enterprise (Antal &
Sobczak, 2004:26). To enhance the relevance, accuracy, timeliness, comparability,
transparency and completeness of the reports, the law stipulated that enterprises had to
report annually on a comprehensive list of quantitative indicators, record activities and
evaluate changes over the past year and the two preceding years. The reports were then to
be submitted to a committee of workers and management for approval before distribution
to the trade union delegates and shareholders. Only after the approval were the reports to
be submitted to the labour inspectorate (Urminsky, 2004:08).
Elsewhere in Europe, social reporting was mainly voluntary and occurred most frequently
in countries such as Germany (sozialbilanz) and the Netherlands (Kolk, 2005:35). The
European companies' experimentation with social reporting in the 1970’s was certainly
innovative, especially among the larger German companies operating in the chemical and
oil industries (Owen, 2003:02). These companies attempted to present their performance
and results as they affected the total societal environment. Most notable amongst these
companies was Deutsche Shell which employed goal-oriented reporting that had specific,
reliable, relevant and comparable quantitative indicators to describe the attainment of a
wide range of social objectives (Steiner, 1979:04). Arguably, the company's approach to
integrate social data into the traditional financial reporting meant to provide a more
holistic picture of its performance, has been unwittingly reinvented in the new wave of
integrated reporting initiatives of the recent years (Owen, 2003:03).
The 1970s also marked the emergence of assurance on sustainability reports with

39
pioneering initiatives of companies such as Social Audit Limited, a United Kingdom
based independent research and lobbying company that conducted audits on social and
environmental performance of major companies and published its findings in a journal
(Katsoulakos et al., 2004:08). Through performing such audits, the company innovated
auditing techniques that did not only improve the credibility of the reports produced but
also provided ideas and tools to the modern sustainability reporting assurance providers
that continue to serve as a yardstick against which the success of similar initiatives of the
recent years can be gauged (Owen, 2003:03).
2.4.2.1 The shortcomings of the sustainability reporting practices of the 1970s
Despite the increment in the percentage of companies that produced sustainability reports
in the United States, reporting was still at an experimental phase as guidelines were yet to
be developed. Inevitably, there were many inconsistencies in the reporting practice,
especially with regard to the quantification of monetary and non-monetary issues
(MPRA, 2007:08). Resultantly, a company's sustainability report was incomparable to
those of its prior years and to those of peer companies. Furthermore, the amount of
environmental information published was rather limited, frequently less than a quarter of
a page (Kolk, 2005:35). The reporting practice was also unsystematic as it lacked a
strategy, organisational structural support, a reliable management system, a stakeholder
engagement mechanism, reliable quantitative performance indicators and an independent
assurance process (Epstein & Roy, 2001:17). As a result, the sustainability reports were
biased, irrelevant, unverifiable, incomparable and unreliable as they had been published
for public relations purposes and thus did not reflect the actual sustainability performance
(Marlin & Marlin, 2003:01).
Likewise, the European social reporting practice of the 1970s produced public relations
driven reports that were irrelevant, unreliable, biased and dis-informative as they were
meant to portray companies' images favourably without regard to their actual social
performance (Marlin & Marlin, 2003:01; Owen, 2003:03). The general climate of
voluntarism had resulted in a lack of standardisation of what the format, terminology and
content of a social report should be (MPRA, 2007:11). Consequently social reporting was
neither practiced consistently nor able to claim universality with regard to recognition or

40
definition of key concepts (Gray et al., 1995:47). Resultantly, the social reports produced
were incomparable as they varied significantly in style and subjects from one company to
another, and from one period to another (MPRA, 2007:11). In France where social
reporting was mandatory, such problems were avoided as a uniform structure of the
reports was prescribed (Antal & Sobczak, 2004:26).
Nevertheless, the French approach was criticised for being too detailed with a narrow
focus on employee matters thus stifled experimentation and innovation that could provide
a complete picture of a company's impact on the society (Antal & Sobczak, 2004:26;
Owen, 2003:03). The reports also were incomprehensible as they lacked qualitative
information to provide context and had obsolete indicators that were hardly updated
(Urminsky, 2004:08). As a result, the reports were unclear and irrelevant.
Elsewhere in Europe, companies produced social reports without quantitative
performance indicators given the immeasurable nature of some social issues that were
neither monetary nor quantitative (Antal et al., 2002 :09). This led to production of vague
social reports that were neither comparable nor understandable. In some cases, companies
were deliberately reluctant to quantify and divulge negative sensitive information such as
cases of child labour (Mahmoud, 2009:25). Such companies provided incomplete
information that impaired the reliability of their reports.
2.4.3 Environmental reporting between 1980 and 1989
The dawning of the 1980’s ended the widespread experimentation and debate concerning
social and environmental reporting in the western world (Owen, 2003:03; Kolk,
2005:35). As a result of a recession, inflation and unemployment in most countries,
priorities had shifted from social and environmental issues, to more urgent economic
issues. Similarly, the collapse of the former socialist economies and the advancement of
neo-liberal economic policies in the previously socialist governments, along with the
globalisation of business strategies, led to an ideological climate in which the very topic
of social responsibility was shunned and at times even met with hostility (Antal et al.,
2002:05).
41
In the late 1980s, environmental reporting re-emerged following several high profile
companies' environmental disasters that rekindled the general publics' distrust of
companies and heightened its scrutiny for companies' environmental transgressions
(IMA, 2008:05). The disasters which included, but not limited to, the Union Carbide's
Bhopal accident in 1984; the 1989 Chernobyl nuclear meltdown; and the Exxon-Valdez
oil spill in 1989, were widely reported in the media (Hibbit, 2004:34). Accordingly they
significantly damaged companies' reputation, increased their operating costs or in worst
case scenario destroyed companies entirely (CIMA, 2008:05). Resultantly, the
environmental agenda was elevated to the board level of most companies (Hibbit,
2004:35).
In response to the public pressure that followed the disasters, the United States
government enacted the Emergency Planning and Community Right-to-Know Act
(EPCRA) of 1986 which required annual mandatory disclosure of emissions of certain
toxic chemicals, and the submission of raw data and summarised information into the
Toxics Release Inventory, a publicly-accessible computerised data bank (CRS, 2010: 03).
It further required certain businesses to report releases of extremely hazardous chemicals
to state and local authorities, and to disclose to those same authorities the quantities and
types of toxic chemicals stored on site (CRS, 2010:01). To ensure that companies adhered
to the reporting requirements, the Act imposed civil, criminal, and administrative
penalties on companies for non-disclosure violations and entitled the citizens with a right
of action to pursue the enforcement against a violating company (CRS, 2010:05). The
citizens were also entitled to specific information about any particular facility on
prescribed forms (CRS, 2010:03). The Act improved the reporting rates as well as the
relevance, reliability, timeliness, comparability and clarity of the environmental
information (Saka & Burritt, 2004).
In an attempt to demonstrate their renewed commitment to their environmental
responsibility and win back the lost public trust, companies began to report on their
environmental performance by producing stand-alone environmental reports and
including environmental information in their annual reports (EIRS, 2007:02; Kolk,
2005:35). As the rates of environmental reporting rose in the late 1980s, so did the
stakeholders expectations of such reports (Kucbel-Saumier, 2007:01). The increasingly
42
sophisticated stakeholders who consisted of professionals could no longer accept vague
statements about a company's environmental performance but rather expected numeric
data to reinforce claims made in the environmental reports, and enable them to compare
the numbers against data from past years and data from peer companies (Kucbel-Saumier,
2007:01).
This led to a realisation that guidance was needed to assist companies in reporting as
most grappled with the challenges of reporting (Kucbel-Saumier, 2007:02). To provide
guidance, some proactive stakeholders most notably, the Coalition for Environmentally
Responsible Economies (CERES), took initiative and developed the Valdez Principles, a
ten-point environmental code of conduct meant to guide companies to establish sound
environmental reporting practices (Kucbel-Saumier, 2007:12).
2.4.3.1 The shortcomings of the environmental reporting practices of the 1980s
Although the environmental reporting initiatives in the 1980s were certainly laudable,
most of the reports produced were a mere public relations tool, employed by companies
from sectors with a tainted public image such as the chemical, oil and gas sectors, to
deflect criticism for dismal performance while working behind the scenes to undermine
any legislation that required such reporting (Skillius & Wennberg, 1998:31). As such, the
reports did not reflect a commitment by companies to take responsibility for their impacts
on the environment (Owen, 2003:04). Most of the reports were dis-informative with more
scenic landscape photographs (green glossies), than actual quantitative or qualitative
information on the environmental performance of companies (Skillius & Wennberg,
1998:31). Not only were such reports irrelevant and unreliable, they angered the very
audiences that they intended to communicate to, as a result, some stakeholders took the
initiative to develop guidelines meant to improve the reporting practice (MacLean &
Gottfrid, 2000:246).
By contrast, some environmental reports were overloaded with data that made them
unreadable, incomprehensible and irrelevant (MacLean & Gottfrid, 2000:246). The wide
disparity in the quality of reports from green glossies to overloaded reports rendered them
incomparable from one company to another. Similarly, given the infancy of the

43
environmental reporting practice in the 1980s, the performance metrics, content, format
and structure employed in reports varied widely from one company to another and from
one period to another as they were still evolving (MacLean & Gottfrid, 2000:247).
Despite the introduction of the EPCRA in the United States, the Toxic Release Inventory
programme did not identify or recommend any specific estimation methods and gave
companies complete flexibility when selecting a method to use (Saka & Burritt, 2004:26).
The above variations and inconsistencies rendered the reports incomparable (MacLean &
Gottfrid, 2000:246).
Despite the emerging developments in environmental reporting in the 1980s, no
international accounting standard had been introduced that required companies to report
on their environmental performance in the annual reports (Hibbit, 2004:38). Accordingly,
there was no harmonised system for comparability between country-by-country reports
for multinational companies that operated in various jurisdictions (Saka & Burritt,
2004:16). Typically, the accounting profession had reacted to the reporting developments
initiated by other organisations in an ad hoc manner and therefore did not fundamentally
challenge the existing financial reporting framework to accommodate the emerging
environmental issues, but rather used it as a basis for expansion into the environmental
reporting arena (Hibbit, 2004:35; MacLean & Gottfrid, 2000:246). By so doing, the
profession shied away from a more holistic form of integrated reporting (Hibbit,
2004:35).
Given that the reporting was still evolving, it generally was unsystematic without a
strategy, an effective Environmental Management System (EMS), an effective
stakeholder engagement mechanism, and an independent assurance statement as
assurance standards were yet to be developed and neither was verification required
(MacLean & Gottfrid, 2000:248). These contributed to the irrelevance, unreliability, and
unverifiability of most environmental reports (MacLean & Gottfrid, 2000:246).

44
2.5 THE ENVIRONMENTAL REPORTING DEVELOPMENTS BETWEEN 1990
AND 1999
2.5.1 Overview
During the 1990s decade, environmental reporting grew at an unprecedented pace
(CorporateRegister.com & ACCA, 2004:08). Not only did the number of companies
producing environmental reports increase dramatically (see Table 2.2 below), but also the
depth and breadth of the reports produced increased significantly (CorporateRegister.com
& ACCA, 2004:08:48). Although the reporting rates varied from one country to another,
one time frame to another, and from one sector to another, the main trend in most of the
countries was clear, an increasing number of companies were publishing environmental
reports (Emtairah, 2002:08; KPMG, 1999:14). A notable exception to this general
reporting pattern was witnessed in the United States where the rate of environmental
reporting declined during the decade (Kolk, 2005:36).
TABLE 2.2: TOP NATIONAL COMPANIES PUBLISHING A STAND-ALONE
ENVIRONMENTAL REPORT
Year 1993 1996 1999
Percentage of top national companies that published an
environmental report
13% 15% 24%
Source: KPMG (1999:14)
Although environmental reporting had initially occurred most frequently in sectors with a
high environmental impact such as mining and, oil and gas, it had gradually spread to
other sectors with a lesser impact such as the banking and insurance sector (KPMG,
1999:04). Nevertheless, the reporting practice was more prevalent among the sensitive
sectors with a higher impact on the environment (Owen, 2003:01; Pramanik, Shil & Das,
2008:150). The reporting practice was also more prevalent among the European countries
such as Germany, Sweden and the United Kingdom than among the developing countries
such as South Africa (CorporateRegister.com & ACCA, 2004:08; Douglas, Doris,
Johnson, 2004:389).
45
2.5.2 Motivation for voluntary environmental reporting
A majority of companies that produced environmental reports in the 1990s did so to
mitigate their growing environmental risks (Owen, 2003:9; KPMG, 1999:07; Skillius &
Wennberg, 1998:09). Given the looming environmental legislation, proactive stakeholder
actions, emerging risk assessment policies by banks and creditors, an increasing number
of companies recognised the need for a proactive approach to environmental risk
management and reported to demonstrate this to their increasingly environmentally
conscious stakeholder groups (CorporateRegister.com & ACCA, 2004:15; Skillius &
Wennberg, 1998:09). An increasing number of companies also reported as a response to
the reporting initiatives of their peers (KPMG, 1999:07; Morrow & Rondinelli,
2002:162).
2.5.3 Drivers of environmental reporting
2.5.3.1 Legislation
An increasing number of companies had reported on their environmental performance in
compliance to new legislation introduced in countries such as Denmark, the Netherlands,
Norway, Sweden, Canada, Australia and the United States, as well as to regional laws
such as those imposed by the European Union (Kolk, 2005:36). Among the first countries
to legislate on environmental reporting was Denmark whose Green Accounts scheme
obliged companies with significant environmental impact to publish quantified statements
in laypersons language on the raw materials, energy and water consumed in production
and the pollutants emitted (CorporateRegister.com & ACCA, 2004:50). The accounts
improved the reporting rates, timeliness, understandability, and the accuracy of the
reports (NAOD, 2002:08).
2.5.3.2 Supra-national bodies
Apart from governments, an increasing number of supra-national organisations
participated in developing environmental reporting guidelines (Hibbit, 2004:49). Key
among these was the United Nations which through its United Nations Environmental
Programme (UNEP) developed a technical report that identified 50 reporting ingredients
that would make the environmental reports relevant to the stakeholders if reported on
46
(Törnroos, 2005:17). To enhance comparability, the UNEP technical report advised
industry associations to develop templates for presentation of environmental statistics in
order to facilitate external benchmarking (OGPPG, 2000:03). The report further indicated
that the credibility of their environmental reports could be enhanced if they employed
third party verifiers (OGPPG, 2000:04). The report also advised companies to clarify their
approach and quantify their performance using well-defined performance indicators
(OGPPG, 2000:03). To enhance verifiability and transparency, the report described a set
of minimum conditions for verification and advised companies to disclose their
assumptions as well as methods employed when reporting (OGPPG, 2000:04).
In the European context, sustainability reporting practice was driven by the initiatives of
the European Union which through its administrative arm, the European Commission,
developed the widely endorsed Eco-Management and Audit Scheme (EMAS), an
environmental management scheme that required companies to adopt a systematic
approach to reporting (Morrow, 2002:170). The scheme also required companies to
comply with all the legislation applicable to them, implement sound environmental
policies, procedures, and structured environmental management systems with
quantifiable targets meant to continuously improve their environmental performance
(European Commission, 2008:01).
It further required companies to publish an environmental statement triennially and
subject it to an independent external verification (European Commission, 2008:02). With
regard to the latter, it required companies to provide a written audit report that contained
the scope of the audit, the extent of compliance with the environmental policy, and an
evaluation on the effectiveness and reliability of a company's environmental monitoring
and control systems (Mathews & Reynolds, 2000:06). Its wide-spread adoption enhanced
the reliability of the environmental reports in Europe, more so in Germany (European
Commission, 2008:01; Mathews & Reynolds, 2000:14).
2.5.3.3 Business associations and the stakeholders
Dozens of guidelines were developed by business organisations and the civil society to
improve the reporting rates and quality of reporting (Emtairah, 2002:10). Notable among
47
these was the Public Environmental Reporting Initiative (PERI) guidelines and the World
Business Council for Sustainable Development (WBCSD) Eco-efficiency indicators
(KPMG, 1999:29). Although the guidelines raised the reporting rates, with their
profusion, there was little consensus and consistency in the environmental reporting
practice (Emtairah, 2002:11). It is in response to this shortcoming that the Global
Reporting Initiative (GRI) guidelines were launched to promote rigour, comparability,
timelessness, verifiability and reliability in environmental reporting (GRI, 2000:05).
Along with the guidelines, a number of environmental reporting award and ranking
schemes were launched in the 1990s in countries such as the United Kingdom, Denmark,
Norway and the Netherlands to reward innovation and promote the best reporting
practices (Hibbit, 2004:45; Emtairah 2002:16). The judgment criteria of most of the
schemes was centered on relevance, reliability, timeliness, understandability,
comparability and verifiability as perceived by a panel of judges (Hibbit, 2004:44; Owen,
2003:22; Skillius & Wennberg, 1998:55). The schemes, which were seen as an indicator
of the best reporting practice, attracted a widespread media attention which enhanced the
images of the companies that won the awards (Emtairah, 2002:30). Resultantly, they had
a significant effect by improving the decision-usefulness of the environmental reports as
well as the reporting rates (Skillius & Wennberg, 1998:32).
2.5.3.4 The accountancy bodies
Surprisingly, the accountancy professional bodies did not drive the environmental
reporting practice except for the Association of Chartered Certified Accountants (ACCA)
which had set up an environmental reporting award scheme in Europe (Hibbit, 2004:44).
Instead, they engaged themselves in protracted debates on issues of recognition,
classification and quantification of environmentally induced costs, risks and liabilities
(Emtairah, 2002:12). More often than not, they made contradictory recommendations
which remained unresolved and thus left the decisions related to environmental reporting
to discretion of the companies (Hibbit, 2004:44). As a result, none of the accountancy
professional bodies were involved in setting standards to guide environmental reporting
practice despite the high profile of environmental issues in the 1990s and the rapid uptake
of the practice (Adams, 2008:01; Pramanik et al., 2008:150).

48
2.5.3.5 The King Report on corporate governance
In the South African context, sustainability reporting was driven by the King I Report, a
code of conduct whose purpose was to promote the highest standards of corporate
governance in South Africa (IODSA, 1994). The code advocated for an integrated
approach to good governance in the interests of a wide range of stakeholders by having
regard to the fundamental principles of good financial, social, ethical and environmental
practice (IODSA, 2002:08). The report formalised the need for companies to recognise
that they could no longer act independently from the societies and the environment in
which they operate (IODSA, 1994).
To enhance the reliability of reporting, the King I Report advised directors to ensure that
the necessary skills are in place for them to discharge their responsibility for internal
controls, to deploy an effective internal audit function and to use technology to enhance
sustainability reporting and transparency (IODSA, 2002;10). It further recommended that
it was the board’s duty to present an objective, balanced and understandable assessment
of the company’s position when reporting to stakeholders (IODSA, 1994). The report also
recommended that the quality of information presented should be based on principles of
openness and substance over form, and that sustainability reports should be timely, clear
and succinct and include all the relevant information that may be useful to the
stakeholders. Although the King I Report drove the sustainability reporting rates, it did
not enhance the usefulness of the reports as it was largely irrelevant to most of the
businesses (Wyngaard & Hendricks, 2010:02).
2.5.4 Quantification of data, external verification of reports, organisational structures
and systems
2.5.4.1 The use of metrics and performance indicators
To enhance the clarity and accuracy of their reports, an increasing number of companies
quantified their data, presented it in a comparable manner to the past years, provided set
targets to enable the readers to independently assess the progress made in relation to the
targets and adhered to sector-specific codes of conduct (KPMG, 1999:04; Owen, 2003:07;
Saka & Burritt, 2004:06; Tornroos, 2005:16).

49
2.5.4.2 External verification of the environmental reports
To enhance the credibility of their reports, an increasing number of companies undertook
independent assurance on the reports using major accountancy and environmental
consultancy firms (see Table 2.3 below) (Emtairah, 2002:14; Owen, 2003:06; Saka &
Burritt, 2004:27; Skillius & Wennberg, 1997:217; Tornroos, 2005:02). Although initially
the verification practice had been more focused on systems compliance, as the decade
progressed, the practice addressed more complex issues such as completeness of
reporting and acceptability of performance, while providing recommendations for
improvement in systems, performance and disclosure practice (Owen, 2003:08). It is with
regard to the latter that the major accountancy firms emerged as the assurance provider of
choice given their thorough understanding of management systems and traditional
auditing principles (KPMG, 1999:28; Owen, 2003:06). To further enhance the reliability
of the reports, the firms employed multi-disciplinary verification teams that comprised of
both audit and environmental expertise which resulted in a number of jointly signed
verification statements (signed by an Accountant and an environmental expert) (KPMG,
1999:24).
TABLE 2.3: PERCENTAGE OF THE TOP NATIONAL COMPANIES SEEKING
EXTERNAL VERIFICATION
Year 1993 1996 1999
Percentage of the top national companies that published an
environmental report
13% 15% 24%
Percentage of top national companies with externally
verified report out of those that published an environmental
report
- 15% 18%
Source: KPMG (1999:14,22)
2.5.4.3 Organisational structures, processes and management systems
To enhance the reliability and verifiability of their reports, an increasing number of
companies provided well-documented organisation structures of the personnel
responsible for managing various aspects of environmental performance, the board
50
involvement in environmental issues, as well as a foreword in the environmental reports
from senior personnel such as a Chief Executive Officer (CEO), broadly outlining the
environmental management strategy that was being pursued (Hibbit, 2004:35; KPMG,
1999:18). Coming from the top, such forewords increased the predictability of a
company's future behaviour thus enhancing the relevance and reliability of the reports
(DTT, 2002:20).
Similarly, an increasing number of companies disclosed their internal environmental audit
procedures and their progress towards internationally recognised certification standards
for their EMS (Owen, 2003:08). To this end, a growing number of companies had
obtained certification such as the ISO 14001 and the EMAS which further bolstered the
credibility of their reports as it indicated that their reporting process was systematic,
based on sound policies, well-defined objectives and targets, and employed a sound EMS
that not only complied with laws and regulations, but also that was regularly audited
(CorporateRegister.com & ACCA, 2004:48; Emtairah, 2002:40).
To achieve an effective EMS, an increasing number of companies had started to converge
their administrative and EMS by combining the framework and methodology of the
financial controllers with the knowledge and expertise of environmental staff (KPMG,
1999:05). The rapid uptake of the ISO 14001 certification in particular had enhanced the
comparability of the environmental impacts of companies as this certification had
standardised the procedures for gathering, interpreting and communicating
environmentally relevant information by replacing various national EMS thus bridging
the diversity of EMS in and between companies (Morrow, 2002:161; GEMI, 2000:01).
2.5.5 Frequency and medium of reporting
To enhance the accessibility of the reports to a growing mass of stakeholders, the Internet
emerged as an alternative medium of choice for environmental reporting (Emtairah,
2002:12; KPMG, 1999:14). The adoption of the web-based reporting was a systematic
process, first as a supplement to the hard copies and eventually as a replacement to the
hard copies (Scott & Jackson, 2002:195). More specifically, the medium of
environmental reporting evolved dramatically from an exclusive use of hard copy format

51
in the early nineties, to the use of on-line formats such as Portable Document Format
(PDF) as in the mid-1990s, and the Hyper Text Markup Language (HTML) format in the
late nineties (ACCA & CorporateRegister.com, 2001:02).
For most companies, the PDF was the on-line format of choice as it produced a replica of
the hard copy report (ACCA & CorporateRegister.com, 2001:09). However, it is the
adoption of the HTML format that revolutionised on-line reporting by enabling
companies to provide more detailed and relevant information tailored to specific needs of
different user groups (ACCA & CorporateRegister.com, 2001:12). With regard to the
latter, the HTML format enabled the users themselves to tailor the reports according to
their unique needs, an attribute that was particularly useful to the professional stakeholder
groups such as financial analysts and environmental activist groups (Scott & Jackson,
2002:196). In addition, it made the reports more user-friendly and readable as it availed
them in a multiple of languages, with enhanced interactivity and navigation, this
increased the feedback rate from the users thus enabling companies to improve the
usefulness of the subsequent reports (Scott & Jackson, 2002:197). The format also
enhanced the timeliness of the reports produced as up-loading a HTML file took a shorter
time than updating a hard copy or a PDF file (ACCA & CorporateRegister.com,
2001:12). Therefore environmental information became more current and relevant as it
was updated on the websites as soon as it became available (Scott & Jackson, 2002:196).
2.5.6 Developments in the structure of the environmental reports
With regard to structure of their environmental reports, most companies subscribed to the
structures recommended by the various reporting guidelines that had been developed by
the end of the decade (Brown, Jong & Lessidrenska, 2007:19; Owen, 2003:13).
Generally, the guidelines tended to be in the form of checklists for the relevant content of
environmental reports, and required qualitative, quantitative, monetary and physical data
(Skillius & Wennberg, 1998:29). Though varied, most guidelines addressed the following
areas: organisational profile; environmental policy statement; environmental
management; legislative compliance; emissions; resource efficiency; life cycle
perspective of product impacts; environmental liabilities and costs; and stakeholder
relations (Emtairah, 2002:40). The adoption of the guidelines enhanced the comparability

52
of environmental reports of different companies especially where companies from the
same sector adopted the same guidelines (Brown et al., 2007:12).
Given the comprehensiveness of the guidelines and the high profile of the organisations
that had developed them, their adoption by a growing number of companies also
enhanced the relevance and reliability of the environmental reports (Brown et al.,
2007:12). Furthermore, most of the guidelines recommended a logical flow of topics in
the structure of the reports to enhance the readability of the reports (Tornroos, 2005:35).
2.5.7 Topics in the environmental reports and their convergence with other reports
In a bid to provide relevant information to a growing list of stakeholders with differing
and often competing information needs, companies started to adopt a stakeholder
inclusiveness approach by widening the scope of their environmental reports to cover
social and legislative compliance issues (KPMG, 1999:19). Subsequently, the taxonomy
of the reports changed from environmental reports to corporate responsibility reports or
sustainability reports (Emtairah, 2002:12).
To further provide a complete all-rounded picture of their performance, a few progressive
companies started experimenting by converging their environmental, social and financial
performance reports within the confines of one report (Owen, 2003:13). Resultantly,
phrases such as triple-bottom-line reporting, and reporting on people, profit and planet,
emerged to refer to the need for companies to measure their success not only by their
financial performance, but also by their social and environmental performance (Emtairah,
2002:12; KPMG, 1999:05). To reinforce the emerging trend, some countries such as
Denmark, the Netherlands, Norway, Sweden, Australia and Canada introduced legislation
that required companies to disclose relevant, verified and standardised sustainability
performance information in their annual reports and to elaborate on how such
performance had impacted on their financial performance (KPMG, 1999:08). These
initiatives improved the reliability, comparability, relevance and understandability of the
reports by establishing a causal link between the sustainability performance and the
financial performance (CorporateRegister.com & ACCA, 2004:15; Epstein & Roy,
2001:587; Saka & Burritt, 2004:27).

53
2.5.8 The shortcomings of the environmental reporting practices of the 1990s
2.5.8.1 Weaknesses in the EMSs
Despite the laudable improvement in the environmental reporting rates and the general
quality of the reports produced, the reporting practice was still at an infancy stage and
therefore grappled with a plethora of problems (Owen, 2003:09). To start with, the EMSs
of most companies were weak and only covered companies partially given that
implementing and maintaining them was a costly exercise affordable only by the large
companies (Hibiki & Akimura, 2004:18; NHDES, 2002:03; Skillius & Wennberg,
1998:21). Accordingly, most companies lacked a stakeholder engagement mechanism, a
reliable performance measurement system, consistent and understandable performance
indicators, well-documented processes, internal control procedures and organisation
structures (Skillius & Wennberg, 1998:32).
Despite the efforts by companies to establish and document their EMSs’ internal
processes, performance measurement systems and methodology, performance indicators,
control procedures and organisation structures, the costs of developing and maintaining
such a system were prohibitive to small-sized companies (Hibiki & Akimura, 2004:18).
Therefore, a majority of the companies outside the top 100 (second tier) could not afford
an elaborate well-documented EMS. A lack of proper documentation of the EMSs
impaired the verifiability of the claims made in their reports (EEA, 1998:130). This partly
explains the low levels of external verification of environmental reports in the 1990s
(KPMG, 1999:25). Even more discouraging was the low quality of verification which was
attributed to a lack of an internationally accepted standard for verification of
environmental reports (Burrowes, Sparkes & Adams, 2001:16; CorporateRegister.com &
ACCA, 2004:54; IRRC, 1996:18; KPMG, 1999:25). For this reason, good attestation
seemed to be beyond the competence of the auditors (IRRC, 1996:21). For most
companies that verified their report, the verification process was fundamentally flawed
due to a lack of independence of the verifiers as they were often appointed by the
companies' management and performed consultancy work in addition to external
verification work (Owen, 2003:09).
Furthermore, the verification statements varied significantly in terms of their scope,

54
methodology and conclusions, a fact that undermined the readers' reliance on the
statements (IRRC, 1996:21; KPMG, 1999:26). Worse still was the fact that some of the
verification statements contained caveats to protect auditors from potential liability
arising thereafter, or even had opinions, recommendations and critical remarks that
appeared to be outside the scope of the verification assignment agreed upon (KPMG,
1999:25). Resultantly, the reliability of the assurance process was undermined as the
readers had to apply their own judgement to interpret the reports and the verification
statements (IRRC, 1996:16; Skillius & Wennberg, 1998:42).
Not surprisingly, only a few companies had obtained international certification such as
ISO 14001 for their EMS (KPMG, 1999:19). Those that did had self-certified their reports
by claiming compliance with the ISO 14001 (NHDES, 2002:02). Besides, some
certification did not require external reporting (NHDES, 2002:17). The lack of
international certification of the EMSs undermined the reliability of the environmental
reports (CorporateRegister.com & ACCA, 2004:54).
2.5.8.2 Lack of stakeholder engagement
Despite a commendable effort by many companies to engage their stakeholders, the
engagement process for most was largely confined to managing stakeholder expectations
and balancing competing interests, while leaving the discretion of what to report and how
to report to companies' management (Owen, 2003:16). Put simply, most companies did
not engage their stakeholders directly in the environmental reporting process and neither
did they consult them when setting key performance indicators (CorporateRegister.com &
ACCA, 2004:15; Yosie & Herbst, 1998:01). Accordingly, the stakeholders did not
influence the content presented in the reports as they were mostly sidelined from the
reporting process (Owen, 2003:12). To cater for a diverse audience of stakeholders, most
companies produced generic and overloaded reports that were unreadable, unclear and
largely irrelevant as they did not address the unique needs of the stakeholders (Owen,
2003:16). In protest to the irrelevance of the environmental reports produced by certain
companies, some NGO's went ahead and published their own versions of environmental
reports for those companies (ACCA, 2004:15).

55
2.5.8.3 Inadequate performance measurement methodologies and performance indicators
Although many companies had attempted to measure their environmental performance,
consistent performance measurement methodologies and performance indicators were yet
to be developed and neither had a consistent basis for selecting performance indicators
emerged (CorporateRegister.com & ACCA, 2004:53; Gee, 2001:31; Skillius &
Wennberg, 1998:19). In many cases, what was measurable theoretically was often
immeasurable practically given that rigorous measurement instruments were yet to be
developed (Skillius & Wennberg, 1998:22). Besides, most of the environmental
performance indicators themselves were neither standardised nor normalised as they were
still evolving (Gee, 2001:31; Skillius & Wennberg, 1998:39). More often than not, the
indicators were presented in the reports in their scientific form that did not accurately and
completely describe complex realities of an actual environmental impact of a company's
actions (Gee, 2001:22; Skillius & Wennberg, 1998:20). The foregoing issues rendered the
reports incomprehensible, unreliable, unverifiable and incomparable.
2.5.8.4 Proliferation of environmental reporting guidelines
Notwithstanding the efforts made by several reputable organisations to develop reporting
guidelines, the resulting proliferation of the guidelines was counter-productive as there
was little consensus about and consistency in what environmental reporting should
include and how or when it should be presented (CorporateRegister.com & ACCA,
2004:15; Emtairah, 2002:11). Besides there was no clear definitive reporting standard to
guide the emerging voluntary reporting practice (Brown et al., 2007:13). This created a
diversity in the reporting practice as companies were at liberty to report as they wished
and select the performance indicators that favoured them (Brown et al., 2007:27; Hibbit,
2004:46; MPRA, 2007:17). The resulting variation in the structure of the reports,
methodology of reporting and content of the reports further rendered them incomparable
(Skillius & Wennberg, 1998:65).
2.5.8.5 Fragmentary and ad hoc environmental reporting
Whereas the introduction of mandatory reporting requirements in some of the
jurisdictions was commendable, the requirements almost entirely focused on site or local

56
level reporting with little regard for company-wide reporting (Hibbit, 2004:59).
Consequently, the reporting practice tended to be on a fragmentary and ad hoc basis,
limited only to some divisions of companies thus not extended company-wide (Adams,
Hill & Roberts, 1998:02; Hardy, 2008:200; Brown et al., 2007:12). As such, the practice
failed to provide a proper context within which stakeholders could assess the overall
environmental impacts of a company and its efforts to ameliorate those impacts (Brown
et al., 2007:23). To exacerbate the situation, most companies presented values and
intentions without providing supporting details (MPRA, 2007:17). As a result, most of
the reports tended to be incomplete and unreliable.
2.5.8.6 Public-relations driven environmental reporting
Elsewhere, voluntary reporting regimes had produced inaccurate, selective, descriptive,
biased, self-laudatory, unverifiable and public-relations driven reporting (FEE, 1996:19).
In most cases, the reports lacked depth, rigour or quantification, and had virtually a
universal reluctance to disclose negative or sensitive information even when such
information was known to exist (Hibbit, 2004:59; Environmental Agency, 2004:06).
Surprisingly, some of the companies went ahead to win environmental reporting awards
as the judgement criteria of most award schemes were flawed with a primary focus on the
presence of certain elements within text (KPMG, 1999:09; Skillius & Wennberg,
1998:66). As a result, the disclosure of unreliable information became a common practice
during the decade.
2.5.8.7 Failure to realise the full potential of the Internet
Although the rapid uptake of the Internet as a medium of environmental reporting was
certainly innovative, the full potential of on-line reporting was not realised for various
reasons (Scott & Jackson, 2002:198) : to start with, only a small percentage of companies'
stakeholders had access to the Internet (Noci & Citterio, 2003:06). Those that did seemed
oblivious to the availability of such information as it had neither been well-marketed nor
publicised (Scott & Jackson, 2002:196). Furthermore, accessing reports on the Internet
was costly and user-unfriendly to the stakeholders as they had to spend a lengthy period
of time either downloading a PDF file or navigating the HTML based companies'
websites to access hidden reports (Scott & Jackson, 2002:200). With regard to the latter,
57
each report was presented in several pages, and each page was a separate file, therefore
accessing and printing the entire report was a time consuming process as most pages did
not have a link from the home page (ACCA & CorporateRegister.com, 2001:10).
For the users who accessed the reports on the Internet, they found those reports to be
highly irrelevant as they were mostly not tailored to address the unique needs of any
group of stakeholders, neither did they encourage an interactive dialogue (Noci &
Citterio, 2003:06). In most cases, the Internet, especially the PDF files did not enrich the
content of the reports to make them more appealing to the readers as most on-line reports
were an exact replica of the hard copies (Scott & Jackson, 2002:197).
Despite the widespread uptake of the Internet as an alternative medium of reporting, no
efforts were made to starndardise the on-line reporting practice (Brown et al., 2007:12).
As a result, the practice varied significantly and impaired the comparability of the
environmental reports of different companies (United Nations, 1998:18). Similarly, the
comparability of most companies' annual environmental reports to those of prior years'
was impaired by the fact that most overwrote their prior years' reports with their
subsequent ones and therefore corresponding information for prior years was hardly
provided (ACCA & CorporateRegister.com, 2001:30). Where prior years' information
was provided, it was not consistent in format with the information provided in the
subsequent years (Noci & Citterio, 2003:06). Besides, most on-line reports did not
include dates, therefore the users could not assess the timeliness of the reports (Scott &
Jackson, 2002:201).
2.6 THE SUSTAINABILITY REPORTING DEVELOPMENTS BETWEEN 2000 AND
2013
2.6.1 Overview
The plethora of collapses of companies over the years between 2000 and 2013 led many
stakeholders to question the relevance and reliability of annual financial reports as a basis
for making decisions about a company (IRC, 2011:01). Many questioned the sufficiency
of financial information in providing a comprehensive picture of a company's

58
performance in the wake of growing environmental, social and economic challenges. As a
result, companies responded by increasing reporting on sustainability issues (EIU,
2010:03; KPMG, 2013:22; Strandberg, 2013:02). Not only did the number of reporting
companies increase, but also the depth and width of the reports increased dramatically
(Environmental Agency, 2009:05; KPMG, 2008:13; Larsson, 2009:02; PwC, 2008:02)
(see Table 2.4 below). Although sustainability reporting remained varied for different
sectors, reporting practices were no longer restricted to sensitive sectors in Western
countries, but had rapidly spread to non-sensitive sectors and to other parts of the world
including the developing countries, an indication of an universal acceptance of the
reporting practice (KPMG, 2013:16; Spada, 2008:03). To reflect the widespread extension
of environmental reports to include social, economic and governance issues, the terms
sustainability reports are employed in the next section as opposed to environmental
reports (Ernst & Young, 2010:08).
TABLE 2.4: PERCENTAGE OF FORTUNE 500 AND TOP NATIONAL
COMPANIES THAT PUBLISHED SUSTAINABILITY REPORTS
Year 1993 1996 1999 2002 2005 2008 2011 2013
Percentage of the Fortune 500
companies that published a
sustainability report
-
-
35%
45%
64%
79%
95%
93%
Percentage of the top national
companies that published a
sustainability report
13% 15% 24% 28% 41% 45% 64% 71%
Sources: KPMG (2013:22); KPMG (2011:07); KPMG (2008:13); (2005:38).
2.6.2 Motivation for voluntary sustainability reporting
Unlike the 1990s when motivation for voluntary reporting was centred on risk mitigation,
most companies that reported in the years between 2000 and 2010 did so to obtain and
maintain a competitive advantage or for other strategic reasons (EIU, 2010:06; GMA &
Deloitte, 2007:18; KPMG, 2008:20; Wensen, Wijnand, Johanna & Jutta, 2011:73). In this
regard, an increasing number of companies cited a business case for sustainability
reporting (Kolk, 2005:38; Kraus, 2010:02). Accordingly, a growing number of companies
59
produced sustainability reports to enhance their brands, to learn and innovate green
products, to derive economic benefits such us an improved market share and cost savings,
to motivate employees and strengthen supplier relationships (EIU, 2010:06; GMA &
Deloitte, 2007:19; KPMG, 2008:20; Kraus, 2010:03).
2.6.3 Drivers of sustainability reporting
2.6.3.1 Legislation
To reinforce sustainability reporting practice and improve the quality of the sustainability
reports produced, various governments issued new or revised legislation that required
companies to measure and report their impact on the environment and the society (Ernst
& Young, 2007:06; KPMG, 2013:24; PwC, 2007a:04). The revision of the legislation
entailed amendments from rigid and overlapping rules to simplified, streamlined,
innovative and smart regulation that required seamless integration of mandatory and
voluntary reporting approaches in appreciation that the two were complementary and not
mutually exclusive ( CRC, 2011:05; EIU, 2010:06). Accordingly, an increasing number
of governments formally endorsed and even referenced the GRI guidelines in their
legislation (OECD, 2009:241). In addition, they developed new legislation that
individually focused on specific topical themes such as climate change but collectively
covered a wide range of issues (GRI & ACCA, 2009:23; ICAEW & Environmental
Agency, 2009:12).
To ensure that the sustainability information included in the reports was balanced,
complete, clear, comparable, relevant, and timely, most of the reporting legislation
prescribed minimum standardised information to be disclosed in the reports along with a
common set of key performance indicators for the companies to report against (Cowan,
2007:174; Environmental Agency, 2010:11; KPMG, 2010:08; Overland, 2007:19). In
addition, companies were required to use standardised formats and methodology of
reporting, to report periodically on a monthly, quarterly, annually or biannual basis, and
to provide past, current and future oriented information on their sustainability
performance (RMG, 2009:68). Furthermore, the mandatory reporting requirements in a
country such as Denmark were universally applicable as it had adopted a comply-or-
explain approach (DCCA, 2010:01). To enhance reliability of sustainability reports, many

60
of the reporting legislation had monitoring checks with punitive consequences for
inaccuracies in the reports (RMG, 2009:60). As a result of the introduction or revision of
reporting legislation in various countries, the quality and the rate of sustainability
reporting improved significantly (Ramdhony, Padachi & Giroffle, 2010:08).
2.6.3.2 Securities Exchanges
Sustainability reporting in the years between 2000 and 2010 was also driven by securities
exchanges which issued pre-listing requirements that demanded a better transparency and
quality of disclosure of sustainability issues (Krechowicz & Fernando, 2009:20; WFE,
2010:52). Notable among the exchanges was Shengzhen and Shanghai Stock Exchanges
in China, Sao Paolo Stock Exchange in Brazil and the JSE in South Africa (HBS,
2010:243; Maguire, 2011:06). The exchanges either developed their own reporting
guidelines or subscribed to internationally recognised guidelines such as the GRI
principles that required balanced, relevant, reliable, timely, clear, verifiable and
comparable sustainability reports (Environmental Leader, 2009:01).
To further encourage the sustainability reporting practice, various securities exchanges
established sustainability indices that ranked companies according to the quality of their
sustainability reports, as well as the extent of their disclosure (KPMG, 2010:14; Maguire,
2011:06). A few innovative exchanges went further and created specialised markets for
trading of sustainability instruments such as carbon credits and accordingly required that
decision-useful sustainability information be availed to the parties involved in such
transactions (ENS, 2005:01; KPMG, 2010:14). These initiatives improved the
sustainability reporting rates and enhanced the quality of the reports produced.
2.6.3.3 Supra-national bodies
At the international level, the United Nations developed the United Nations Principles for
Responsible Investment (UNPRI), a set of voluntary best practice principles to assist
investors in integrating sustainability issues into investment decisions (OECD, 2009:239;
UNPRI, 2007:02). The principles provided a framework for integrating sustainability
issues in reporting and required the beneficiary companies to adopt GRI guidelines in
order to qualify for the investor's capital (UNPRI, 2007:04). Another notable international

61
body that drove sustainability reporting in the years between 2000 and 2010 was the
Organisation for Economic Co-operation and Development (OECD) which revised its
Guidelines for multinational enterprises to encourage timely, regular, reliable and relevant
disclosure on sustainability issues (KPMG, 2010:20).
In the European context, the European Union issued a modernisation directive that
required European companies to include sustainability information in their annual and
consolidated reports if such information was necessary for the understanding of a
company’s development, performance or position (ICAEW & Environmental Agency,
2009:08). The directive explicitly stated that comparability of companies’ annual reports
was the main criterion, and therefore reporting should be done in a way that allows
drawing parallels or noting differences between various companies (Germanwatch,
2008:08).
The European Union also established the Electronic European Pollutant Release and
Transfer Register (E-PRTR), a publicly accessible database that describes the releases
and/or transfers of substances to the environment, which enhanced the transparency,
consistency and comparability of environmental information (Environment Agency,
2011:01). To enhance the reliability and verifiability of the environmental reports
produced in Europe, the European Union's administrative arm, the European
Commission, revised the EMAS to strengthen the scheme, by requiring companies to
thoroughly document their environmental performance on prescribed key performance
indicators, and facilitate a seamless integration with the ISO14001 (European
Commission, 2011a:01; KPMG, 2010:23).
Other notable international bodies that enhanced the quality and the reporting rates of
companies on environmental issues included the International Organisation for
Standardisation (ISO), the World Resources Institute (WRI) in collaboration with the
World Business Council for Sustainable Development (WBCSD) (KPMG, 2010:16). The
former (ISO) promoted their series of international environmental management standards,
most notably the ISO14001, a standard that gained wide acceptance in the years between
2000 and 2010 by requiring a thorough documentation of an EMS to facilitate
verification and certification by a third party (GMA & Deloitte, 2007:18). The latter two

62
(WRI & WBCSD) jointly developed and promoted the adoption of the internationally
accepted Greenhouse Gas (GHG) protocol, the most widely used international accounting
tool for understanding, quantifying and managing greenhouse gas emissions (Greenhouse
Gas Protocol, 2011:01). The wide adoption of these standards enhanced the credibility,
accuracy and comparability of the environmental disclosures (GRI & ACCA, 2009:06).
2.6.3.4 National business and industry associations
At the national level, an increasing number of business and industry associations
continued to shape environmental reporting among their constituent members by issuing
sector-specific guidelines or reporting requirements tailored to their unique characteristics
(ResponsibleGold.org 2011:01; Schiavi, 2005:04). Among the most notable associations
were the National Association of Pension Funds and Association of British Insurers
which issued guidelines that encouraged their members to ensure consistency,
comparability, relevance and reliability, and an integration of environmental information
within annual reports, when producing environmental reports (ICAEW & Environmental
Agency, 2009:ix).
2.6.3.5 Awards/Ranking schemes
To reward the best reporting practice and provide guidance on the same, new
sustainability reporting awards and ranking schemes emerged which scored the
sustainability reports of companies on the basis of user-friendliness, completeness,
reliability, credibility, readability, verifiability and comparability among other criteria
(ARA, 2011:01; Carbon Disclosure Project, 2010:05; GMA & Deloitte, 2007:49). Most
notable among the awards schemes was the innovative GRI Readers Choice award which
was designed to empower the users to influence the sustainability reporting practice
(GRI, KPMG & SustainAbility, 2008:02). In a clear departure from the past where
professional judges had selected the best reports, the users themselves were involved in
the selection of the best sustainability reports according to the attributes that they
perceived as important to them (GRI, KPMG & SustainAbility, 2008:04).
Unlike in the 1990s when the reporting awards and ranking schemes were only found in
the European countries, by the year 2010 most schemes had been rolled out globally to
63
Africa, North America and the Asia-Pacific region (ACCA & CERES, 2010:03; ACCA,
2010:01). Similarly, the reporting awards schemes had been expanded into various
categories such as best integrated report, best online report, best use of new media, most
relevant report, most credible report, most open and best stakeholder engagement to
mention but a few (Corporate Register.com, 2010:08). The taxonomy of the schemes had
also shifted from environmental reporting awards or ranking to sustainability reporting
awards or ranking to reflect the changes in reporting practices that had gradually
embraced social and governance issues (ACCA, 2010:03). Given the benefits of
enhanced image that accrued to the winning companies, most companies competed to be
perceived as having the best reporting practices and thus improved the quality of their
reports (Emtairah, 2002:17).
2.6.3.6 Accountancy bodies
Unlike in the 1990s, the accountancy professional bodies played a more significant role
in shaping sustainability reporting in the years between 2000 and 2010 (ACCA &
AccountAbility, 2004:38). Most notable among the bodies was the International
Federation of Accountants (IFAC) which developed the widely accepted International
Standard on Assurance Engagements (ISAE) 3000 other than audits or reviews of
historical financial information (IFAC, 2005:293). ISAE 3000 required the verifier to
check and form an opinion on the balance, accuracy, completeness, reliability,
comparability, comprehensibility, timeliness and relevance of sustainability information
provided (IFAC, 2005:301,305). The companies that met these criteria received a
verification certificate that enhanced the credibility of their reports (IFAC, 2005:308).
The major trans-national accountancy firms also continued to provide leadership in the
provision of assurance on sustainability reports through development and application of
the verification methodologies necessary to enhance the credibility of sustainability
reporting initiatives (ACCA, 2009:08; ACCA, 2002:09; ACCA & AccountAbility,
2004:74). In addition, they conducted surveys meant to improve the usefulness of the
sustainability reports (KPMG, 2008:03). In addition, other national and regional
accountancy bodies, apart from the ACCA, also establish their own sustainability
reporting award schemes that enhanced the quality of sustainability reporting by

64
establishing consistent reporting benchmarks against which a company's sustainability
report could be compared (ACCA, 2002:08).
2.6.3.7 The King Reports on corporate governance
In the South African context, sustainability reporting during the years between 2000 and
2010 was driven by the King II Report, a recommended code of conduct that advocated
for triple-bottom-line reporting (IODSA, 2002:20). As an updated version of the King I
Report, the King II Report advocated for annual reporting on social, economic and
environmental performance, and adopted a comply-or-explain approach (IODSA,
2002:35). It further recommended that reporting should be done by selecting options with
the least impact on the environment which was perhaps a deliberate call for an on-line
reporting practice (IODSA, 2002:35). The report which became a pre-listing requirement
for the public companies that sought to list on the JSE, explicitly recommended that
GRI's principles such as relevance, reliability, clarity, comparability, timeliness and
verifiability should govern a company’s public disclosure of sustainability information
(IODSA, 2002:36).
In determining what is relevant for disclosure, the report recommended that company
directors should take into account the environment in which the company operates
(IODSA, 2002:35).It further recommended that information should address material
matters of significant interest and concern to all stakeholders. The report further
highlighted some issues that it considered as relevant in the South African context
(IODSA, 2002:36).
With regard to reliability, the report highlighted that it was the board’s duty to present a
comprehensive and balanced assessment of a company’s position when reporting to
stakeholders so that they can obtain a full, fair and honest account of its performance
(IODSA, 2002:40). And that the board should regularly review processes and procedures
to ensure the effectiveness of the company’s internal systems of control, so that its
decision-making capability and the accuracy of its reporting are maintained at a high
level at all times (IODSA, 2002:48). It also highlighted that reports disseminated via
internet should ensure that the security and integrity of the information is intact (IODSA,

65
2002:39).
To enhance clarity, the report recommended that it was a board’s duty to present an
understandable assessment of the company’s position when reporting to its stakeholders
(IODSA, 2002:40). It further highlighted that the quality of the information provided in
the reports must be based on the principles of openness and substance over form. The
report also recommended that companies should make every effort to ensure that
information is distributed via a broad range of communication channels, including the
Internet to ensure it reaches all stakeholders simultaneously (IODSA, 2002:39).
To enhance consistency and comparability of sustainability reports, the King II Report
recommended the use of the GRI framework to guide sustainability reporting, as it was
the most internationally accepted reporting framework (IODSA, 2002:35). To further
enhance comparability, the report recommended that criteria and guidelines for
materiality should be developed by each company for consistency, having regard to
international models and guidelines, as well as national statutory definitions (IODSA,
2002:35).
To enhance verifiability, the report recommended that the board should make use of
generally recognised internal control models and frameworks in order to maintain a
sound system of internal control to provide a reasonable assurance regarding the
achievement of organisational objectives (IODSA, 2002:23).The system should
incorporate mechanisms to deliver a documented system of internal control and risk
management (IODSA, 2002:31). The report also recommended a detailed disclosure in
the annual report of subjection of non-financial aspects to external validation (IODSA,
2002:39).
The King II report did not only improve the decision-usefulness of sustainability reports
in South Africa but also it positioned the country among the pioneers of modern day
reporting (KPMG, 2010:11; Moloi, 2008:50). Consequently, South Africa emerged as one
of a few developing economies and the only African country with significant
sustainability reporting activities (CorporateRegister.com, 2010:06).
66
At the end of the decade, the King II Report was replaced by the King III Report which
explicitly required that statutory financial information and sustainability information be
integrated in one annual report (IODSA, 2009:11). In this regard, the report required
more than just an add-on of sustainability reports, but rather that sustainability initiatives
be integrated with other aspects of the business process, managed throughout the year,
and reported on in an embedded fashion with financial information in the annual reports
(PwC, 2009bc:02). Like the King II report, the King III report endorsed the GRI G3
principles of sustainability reporting (IODSA, 2009:52; SAICA, 2009:32).
Unlike the King II Report, the King III Report recommended that the general oversight
and reporting of sustainability should be delegated to the audit committee which should
review the disclosure of sustainability issues to ensure that the information provided is
reliable, and does not contradict the financial information (IODSA, 2009:49). The audit
committee should also oversee the provision of internal and external assurance over
sustainability issues (IODSA, 2009:33). With regard to the former, it should assess the
effectiveness of internal audit together with the internal report on the adequacy of internal
controls on at least an annual basis and provide the board with a written assessment of the
effectiveness of the system of internal control, performance and risk management
(IODSA, 2009:45). With regard to the latter, it should establish a formal process of
assurance of the integrated report and advise the board on engagement of an external
assurance provider to provide assurance over material elements of the integrated report
(IODSA, 2009:33). The report which adopted an apply-or-explain approach was
applicable to all types of businesses and was expected to change the landscape of
sustainability reporting significantly (IODSA, 2009:06).
2.6.4 Quantification of data, external verification, organisational structures and systems
2.6.4.1 The use of metrics and performance indicators
By the year 2010, the quality of sustainability reports had improved significantly (CDC &
PwC, 2010:04:27; Ernst & Young, 2007:02; KPMG, 2008:57). Not only did the
companies increasingly quantify their data, they also contexualised it in a comparable
manner to the past years and provided specific, measurable and comparable targets to
enable the readers to independently assess the progress made towards those targets

67
(Environmental Agency, 2009:04; Handford, 2010:01; PwC, 2008:02). In addition, many
companies had developed a sustainability strategy with clearly stated objectives and had
started to use standardised and reliable metric performance indicators to measure their
progress towards the set objectives (AICPA, CICA & CIMA 2010:01; EIU 2010:03).
To enhance the credibility of their sustainability reports and facilitate inter-company
comparison, a majority of companies had adopted the internationally recognised GRI
performance indicators, which were considered as relevant, specific, effective, reliable
and meaningful metrics (EIU, 2010:03; KPMG, 2008:04; Ernst & Young, 2007:16). This
ensured consistency in the recognition, measurement, and presentation of information in
both the form and content over time. In addition, the companies increasingly employed
ratio indicators to facilitate benchmarking against their competitors, industry averages
and the best practice (Ernst & Young, 2007:16). To facilitate comparability of companies'
performance across time, companies reported consistently on the values and ratios, and
juxtaposed the material items of their most recent reports with similar items for prior
periods to show the emerging trends (FSC, SustainAbility & KPMG, 2010:14; HBS,
2010:243).
To further enhance the comparability and relevance of the information provided to the
stakeholders, the GRI had also developed sector specific and even country specific
indicators to cater for the unique needs of the stakeholders of some sectors such as the
finance and insurance sectors (Ernst & Young, 2010:11; GRI, 2008:08). As a result, the
reports became more focused, concise, with less prolix and increasingly included GRI
Index tables to substantiate the assertions made (IODSA, 2007:02; Marx & Van Dyk,
2009:01).
The GRI guidelines themselves had evolved over time through a process of simplification
from G1, G2, to G3 version to provide a comprehensive list of performance indicators
meant to capture all significant aspects of environmental and social impact of a company
thus ensure completeness of the resulting reports (GRI, 2008:5; Brown et al., 2007:43).
The widely accepted G3 version was applicable to organisations of any size, type, sector
or geographic region and enabled the benchmarking of sustainability performance
amongst organisations through the use of common indicators meant to enhance relevance,
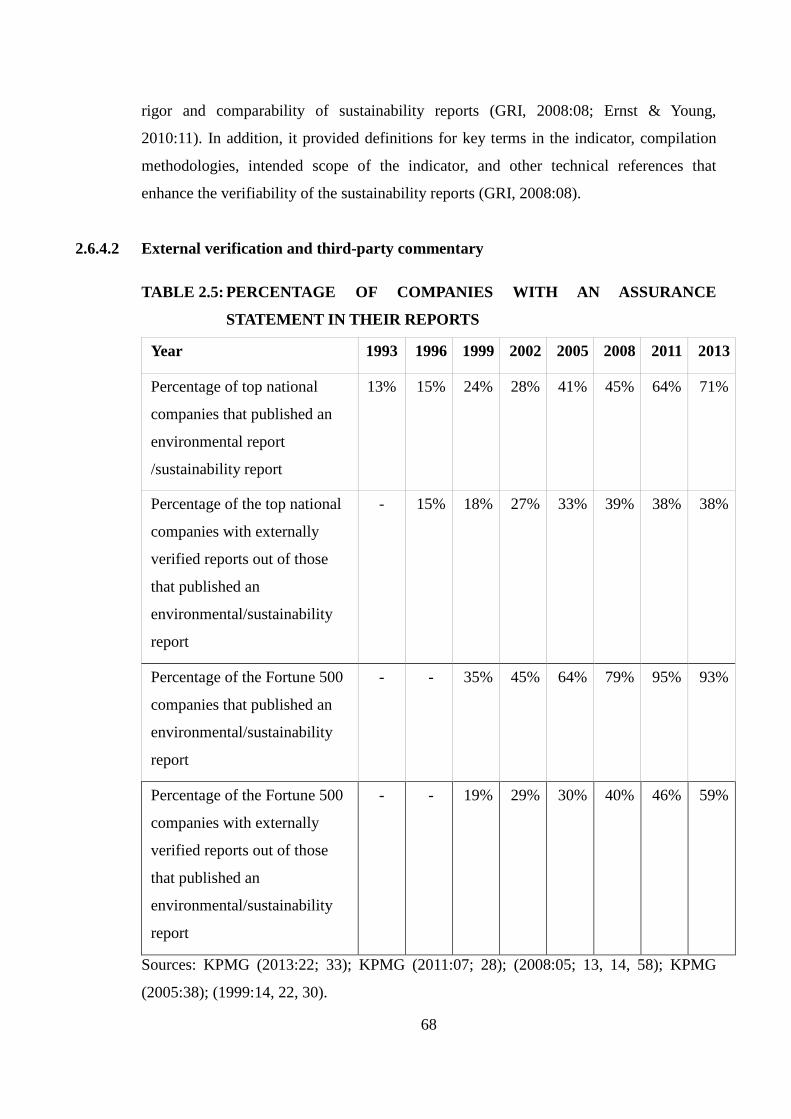
68
rigor and comparability of sustainability reports (GRI, 2008:08; Ernst & Young,
2010:11). In addition, it provided definitions for key terms in the indicator, compilation
methodologies, intended scope of the indicator, and other technical references that
enhance the verifiability of the sustainability reports (GRI, 2008:08).
2.6.4.2 External verification and third-party commentary
TABLE 2.5: PERCENTAGE OF COMPANIES WITH AN ASSURANCE
STATEMENT IN THEIR REPORTS
Year 1993 1996 1999 2002 2005 2008 2011 2013
Percentage of top national
companies that published an
environmental report
/sustainability report
13% 15% 24% 28% 41% 45% 64% 71%
Percentage of the top national
companies with externally
verified reports out of those
that published an
environmental/sustainability
report
- 15% 18% 27% 33% 39% 38% 38%
Percentage of the Fortune 500
companies that published an
environmental/sustainability
report
- - 35% 45% 64% 79% 95% 93%
Percentage of the Fortune 500
companies with externally
verified reports out of those
that published an
environmental/sustainability
report
- - 19% 29% 30% 40% 46% 59%
Sources: KPMG (2013:22; 33); KPMG (2011:07; 28); (2008:05; 13, 14, 58); KPMG
(2005:38); (1999:14, 22, 30).

69
Indeed an increasing number of companies undertook external verification to increase the
reliability of their reports (see Table 2.5 above) (ACCA, 2009:05; KPMG, 2008:59). Such
verification processes entailed a gap analysis to determine whether the requirements of
major reporting frameworks such as the GRI framework had been met and were
increasingly conducted within the confines of internationally recognised verification
standards such as the ISAE 3000 and the AA1000 (ACCA, 2009:07; EIU, 2010:04;
KPMG, 2008:67; AccountAbility, 2008:20). Accordingly, such standards enhanced the
relevance, completeness, reliability, neutrality, inclusivity, responsiveness and
understandability of the audited information (ACCA, 2009:08; AccountAbility, 2008:20).
In addition, the quality of the assurance process and comparability of the assurance
statements was enhanced as the assurance providers employed consistent, systematic,
evidence-based rigorous tests that enabled them to draw objective and standardised
conclusions (IFAC, 2011:04; IFAC, 2011:28; AccountAbility, 2008:20).
Major accountancy firms emerged as the assurance providers of choice, followed by
certification bodies and technical expert firms (ACCA, 2009:08; KPMG, 2008:67;
Perego, 2009:413; PwC, 2007a:11). The preference for the major accountancy firms
improved the credibility of the sustainability reports given their well-known brands in the
provision of assurance services (Environmental Leader, 2011:01; PwC, 2007a:12).
Furthermore, the accountancy firms advised their clients on how to improve their
sustainability information systems, given their well-established expertise in auditing of
information systems and internal controls (Kolk & Perego, 2010:04; Perego, 2009:413;
PwC, 2007a:13).
By contrast, some companies opted to include the views or commentary of external
parties in their reports to enhance their credibility (KPMG, 2008:57). The commentary,
mainly from influential stakeholder groups, reputable subject matter experts, and
academics was meant to demonstrate that the stakeholders had been engaged in the
reporting process (CBSR & CDC, 2008:34). It was also meant to reassure users that the
reports had addressed all the relevant or material issues, and that they were objective,
complete and transparent (CorporateRegister.com, 2008:05). Besides, commentary from
some readers also offered suggestions on how to improve the readability and the general

70
quality of the reports produced (CBSR & CDC, 2008:25). The commentary bolstered the
credibility of the sustainability reports especially when combined with a formal assurance
statement (KPMG, 2008:05).
2.6.4.3 Organisational structures, processes and management systems
To further enhance the credibility of the reports produced, an increasing number of
companies had put organisational structures, processes and controls in place to enable
them to present accurate information on its environmental impacts and demonstrate
commitment to sustainability issues (Environmental Agency, 2010:06; KPMG, 2008:04;
PwC & CDC, 2010:18). These included having dedicated executives whose
compensation was directly linked with corporate sustainability performance, a
sustainability strategy and policy linked to the overall business strategy, adherence to
internationally recognised codes of conduct, having a social and an EMS (CBSR & CDC,
2008:20; EIU, 2010:18).
With regard to the latter, an increasing number of companies had sought international
certification for their EMS such as the ISO 14001, an independent demonstration that the
management system of the organisation conformed to specified requirements, and was
capable of consistently achieving its stated policy and objectives, and had been
effectively implemented (EMI, 2007:05; JAS-ANZ, 2009:05; KPMG, 2008:31). In
addition, an increasing number of companies had extended the internal auditing coverage
to systems and procedures for measuring, recording, and reporting sustainability data to
ensure that the systems were adequate and in compliance with the international practice,
and that the data was accurate and complete (PwC, 2011:14).
To demonstrate their commitment to sustainability performance, an increasing number of
companies disclosed how oversight for sustainability issues was managed at the board
and senior executive levels including the membership and principal functions of
sustainability committees and personnel or departments responsible for corporate
responsibility (EIU, 2010:04; Tonello, 2010:03). Evident from the disclosure, was a
departure from the past, where corporate responsibility was in the domain of
communications or public relations department, towards specialised corporate

71
responsibility departments. In addition, the chief corporate responsibility officer in many
companies reported directly to the board, an indication that sustainability issues were no
longer peripheral activities but rather were increasingly integrated into the core business
activities and managed strategically (Accenture & UNGC, 2011:04; KPMG, 2008:47).
Therefore the resulting reports were likely to be a reflection of the actual performance
and not merely a public relations tool (FSC et al., 2010:17).
Indeed an increasing number of companies received top management support with regard
to sustainability reporting as demonstrated by the increase in the inclusion of statements
from senior executives such as the Chief Executive Officer (CEO) in the sustainability
reports (CDC & PwC, 2009a:23; FSC et al., 2010:03). The statements which clearly
outlined the vision, mission, strategic sustainability plans and objectives in pursuit
increased the predictability of companies' future actions and enhanced the relevance of
the reports to the stakeholders by demonstrating that the top management was addressing
the key concerns of the stakeholders (CDC & PwC, 2010:16; CorporateRegister.com,
2007:06). Coming from top executives, the statements also affirmed the companies'
commitment to an improved environmental performance, and improved the credibility of
the report (DTT, 2002:20).
An increasing number of statements also summarised the key elements of the reports such
as current and future sustainability challenges, successes and failures, performance
against benchmarks, and the integration of sustainability performance with the financial
performance along with the implications of this on future business strategy (CDC &
PwC, 2009:22; GRI & KPMG, 2007:06; SustainAbility et al., 2008:20). These were
meant to improve the understandability of the reports by setting a tone for the rest of the
report as well as demonstrate transparency and accountability in order to enhance the
credibility of the reports to the readers (DTT, 2002:20).
2.6.5 Frequency and medium of reporting
To ensure that the sustainability reports reached the readers before they lost their value to
influence their decisions, an increasing number of companies had integrated their
sustainability reporting cycle into their mainstream annual reporting cycle (FSC et al.,
72
2010:03). Given that most stakeholders were interested in receiving sustainability
information more frequently, some companies moved from reporting annually to
quarterly on-line reporting (CSR Europe, 2010:12). The use of on-line reporting had also
shortened the reporting cycle by providing companies with direct feedback from the
stakeholders in a timely manner thus enabling them to make relevant adjustments to the
reports and to report promptly (CERES & ACCA, 2010:13; Herzig, 2010:11). Indeed
many companies offered their web visitors an opportunity to stay informed on the latest
reports content on the site by receiving regular updates or update alerts via e-mail, Short
Message Service (SMS) or subscribing to a Rich Site Summary (RSS) feed (CSR Europe,
2010:12; Herzig 2010:12; Radley Yeldar & GRI, 2011:03).
Indeed the proliferation of information technology during the decade had made on-line
publishing, arguably the quickest, easiest and most cost-effective method to keep
numerous, worldwide and even anonymous stakeholders informed about a company's
sustainability performance (Mlarvizhi & Yadav, 2008:03). Resultantly, an increasing
number of companies embraced the Internet as a medium of choice for reporting on their
sustainability issues to the masses (CERES & ACCA, 2010:16).
To enhance the relevance of their reports, companies had employed web technologies
such as interactive surveys, discussion forums, web chats, wikis, blogs and social media
such as Twitter and Facebook to engage the stakeholders on an ongoing basis so as to
identify their issues of concern and address them in their reports (CSR Europe, 2010:15;
McKinsey Quarterly, 2009:03; McKinsey Quarterly, 2010:02; Radley Yeldar & GRI,
2011:05). In addition, the web technologies enabled companies to document the amount
and sequence of use of data by different types of users thus facilitating the provision of
relevant information in the reports through better targeting of the audience (HBS,
2010:viii; KPMG Huazhen, 2008:24).
Some companies also employed the flexibility of the web technologies to allow users to
tailor the content of the online report to their specific information needs and preferences
by enabling them to generate their own report according to their topics of interest
(CERES & ACCA, 2010:16). The customisable formats were particularly useful for the
professional user groups as they provided them with sustainability performance

73
information, raw data and analytical tools to enable them to analyse data themselves thus
further enhancing the reliability of the reports (CSR Europe, 2010:23). Similarly, some
companies enabled the readers to participate in the writing process by enabling them to
add their views to the reports and sharing the unedited content with their friends via the
social media (Baue & Murninghan, 2010:15).
To enhance the clarity, understandability and readability of the sustainability reports, an
increasing number of companies enriched their on-line sustainability reports with visually
attractive and easily digestible multimedia content, such as videos, pod casts, slide shows,
animations, dynamic graphs and charts (CSR Europe, 2010:15; Radley Yeldar & GRI,
2011:03). The rich media content also enhanced the usability and user experience of the
websites by providing alternative ways of accessing the information such as reading,
watching, listening, and touching (via Braille) (CSR Europe, 2010:07). In addition,
multimedia content was employed to convey the messages in a more engaging,
personalised form than simple texts (CSR Europe, 2010:15). These enabled companies to
present complex issues and provide a vast amount of data in a user-friendly format (CSR
Europe, 2010:16).
To further enhance readability, companies employed a number of formats by adopting
combinations of hard copy sustainability reports, interactive online reports and PDF files
in a manner that varied with the type of stakeholder groups targeted (KPMG Huazhen,
2008:04). Increasingly, companies employed clear and concise hard copies of the reports
often supported by more comprehensive online versions to cater for the stakeholders that
sought additional detailed information (KPMG Huazhen, 2008:24). Besides, they
increasingly employed user-friendly web toolkits to ease the user navigation and enable
the users to create PDF files, email, give feedback, create charts, enlarge existing charts,
download tables in Excel, quick search information using a list of popular searches,
obtain detailed view of data using infinite drill-down capability (CSR Europe, 2010:15;
HBS, 2010:174). Moreover, companies increasingly availed their reports in multiple
languages to reach their diverse audience (CERES & ACCA, 2010:16).
To enhance the verifiability of their sustainability reports, an increasing number of
companies employed on-line technologies with embedded auditing capabilities that

74
facilitated and accelerated a continuous monitoring and assurance process (Blundell,
2007:11; Kuhn & Sutton, 2010:91). The technologies also left a seamless audit trail and
supported thorough documentation of systems, processes and controls, as well as tracked
the related changes (Blundell 2007:40; Kuhn & Sutton, 2010:107 ). In addition, on-line
reporting facilitated the use of automated and standardised Computer Assisted Audit
Techniques (CAAT) that tested entire data populations with ease thus effectively reducing
the detection and audit risk (Blundell, 2007:25; Stephenson, 2003:01). The CAATs also
resulted in consistent working-paper documentation leading to accurate assertions about
the effectiveness of the internal controls (Blundell, 2007:89; 95; Stephenson, 2003:03;
Chironna & Zwikker, 2010:08).
Other on-line developments included the creation and wide acceptance of a global
registry and electronic information exchanges for sustainability reports (Corporate
Register.com, 2009:36). Most notable among these was CorporateRegister.com, an on-
line database that provided users with free accounts that enabled them to search non-
financial reports using specific parameters such as sector, year and country (Corporate
Register.com, 2010:30). This enhanced the accesibility of relevant and regularly updated
information to the users and enabled them to cross compare the reports of several
companies simultaneously (Corporate Register.com, 2009:06).
2.6.6 Developments in the structure of the sustainability reports
To enhance the readability, completeness and comparability of the sustainability reports, a
majority of companies adopted the reporting structure recommended by the GRI
framework (CERES & ACCA, 2010:14; Corporate Register.com, 2009:05; DTT, 2007:5;
GRI, 2008:05; GRI, 2000:23; KPMG, 2008:04). The framework encouraged companies
to consistently structure the sections of their reports as follows (GRI, 2000:07): Chief
Executive Officers' statement; profile of reporting organisation; executive summary and
key indicators; vision and strategy; policies, organisation, and management systems; and
performance. This was meant to enable the report users to track performance over time
and compare different companies' reports at the same time (GRI, 2000:23). The structure
was also meant to ensure logical sequence of chapters to guide a reader through complex
matters in a manner that facilitated reading and understanding (DTT, 2002:42; GRI,
75
2000:07).
2.6.7 Convergence and integration of environmental reports with other reports
2.6.7.1 Convergence of environmental, social and financial reports
In order to provide relevant and complete information to a growing number of
stakeholder groups, an increasing number of companies converged their social,
environmental and ethical reports into one sustainability report (CERES & ACCA,
2010:03; Corporate Register.com, 2010:05). Accordingly, the sustainability reports
covered a wide range of topics including, general environmental issues, climate-change
issues, supply chain management, corporate governance issues, social and socio-
economic issues (Tonello, 2010:06). The topics reported on varied widely from one
country to another according to their perceived relevance (Kolk, 2005:39). A majority of
companies referred to the GRI guidelines and principles when selecting the content to
report on (KPMG, 2008:40). Given that the framework prescribed a comprehensive list of
standardised quantitative performance indicators, its selection as a point of reference
enhanced the comparability, credibility and completeness of the resulting reports (Brink
& Woerd, 2003:09; GRI, 2000:07). As compared to environmental issues, coverage of
social, governance and socio-economic issues was far more superficial and sketchy due to
a lack of performance indicators (KPMG, 2005:09).
A few progressive companies had gone a step further and converged these reports with
the financial reports in the annual reports in a bid to provide a more holistic picture of
their performance (CERES & ACCA, 2010:03; EIU, 2010:16). Interestingly, it is the
companies in developing countries such as South Africa and Brazil that led their
counterparts in most of the developed countries in this emerging reporting pattern
(KPMG, 2008:16).
2.6.7.2 Integration of environmental, social and financial reports
To further enhance the stakeholders trust and confidence, a few perceptive companies
started to prepare fully integrated reports by the year 2010 (CERES & ACCA, 2010:03).
Such reports were meant to demonstrate how a company's sustainability strategy was

76
integrated into its business strategy, thus provide a complete picture of its performance,
risks and opportunities by placing the financial performance within the context of
sustainability performance (Ernst & Young, 2010:02; HBS, 2010:V). The integrated
reports were expected to provide clarity about the causal link between the sustainability
performance and financial performance of a company, which would enable the
stakeholders to better understand and predict the impact of its actions on the society
(HBS, 2010:37; IODSA, 2009:12). The integrated reports were also expected to provide
the users with a one-stop shop for all the information required thus increase the
accessibility of relevant information by reducing the time required to search for
information (Corporate Register.com, 2010:05). Given that integrated reporting required
deeper engagement with the stakeholders, it was expected that emerging reports will be
attuned and therefore relevant to the stakeholders information needs (HBS, 2010:37; IRC,
2011:02).
To implement integrated reporting, companies required robust information management
systems in order to capture, measure, analyse and disseminate accurate sustainability data
on a more timely and more frequent basis (HBS, 2010:09; IRC, 2011:21; KPMG,
2010:09). This in turn improved the integrity and reliability of the data, and the timeliness
of the resulting reports (HBS, 2010:140; IRC, 2011:17; KPMG, 2010:08). The integration
also subjected the sustainability data to the same internal controls and rigorous auditing
procedures as those subjected to the financial information, which would further enhance
the reliability and rigor of the sustainability information to the same level as the financial
information (HBS, 2010:141; IRC, 2011:17; KPMG, 2010:08). The integrated reports
also required a universal level of standardisation of key environmental and social
performance metrics which should further enhance the consistency, conciseness and
comparability of the reports across time, and to those of other companies in similar
industries (Corporate Register.com, 2010:05; HBS, 2010:142; KPMG, 2010:08).
2.6.8 Stakeholder engagement
With passage of time, top companies did not only seem to grasp the importance of
communication with their stakeholders, they also seemed to have understood that it had
to evolve in pace with their strategies, involve and reflect the needs of the stakeholders
77
(KPMG, 2008:16). Accordingly, stakeholder engagement became the norm as an
increasing number of reporting companies started to meaningfully engage their
stakeholders, by using systematic techniques such as stakeholder mapping to identify and
prioritise their target audiences and their respective information needs and expectations
(ACCA & TEC, 2005:05; CBSR & CDC, 2008:04). These enhanced the relevance of the
reports as the companies increasingly relied on the stakeholders themselves to raise their
relevant concerns which were then addressed in the reports (CSR Europe, 2010:05).
To demonstrate to the stakeholders that their key concerns had been addressed, a growing
number of companies explicitly singled out their key stakeholders and structured their
reports accordingly, with separate sections tailored for different stakeholders (ACCA &
TEC, 2005:05; CDC & PwC, 2009:27). To achieve this, they employed online polls to
ask the users to indicate their preferred reporting format, media, language and so on, to
enable the companies to adjust their subsequent reports to the common preferences of the
stakeholders (CSR Europe, 2010:12).
Increasingly, companies actively consulted and involved their stakeholders when
selecting key performance indicators and the content to report on (KPMG, 2008:40).
Accordingly they employed a variety of instruments which included opinion polls, staff
surveys, community forums, advisory panels, feedback forms and on-line techniques such
as interactive surveys, web chats, wikis, blogs and social media to reach new audiences in
new ways (CSR Europe, 2010:18; KPMG, 2008:34; SustainAbility et al., 2008:25). The
latter techniques also simplified the feedback process and made it quicker for users to
submit feedback in an uncensored and real-time manner. This did not only increase the
feedback rate but also it enabled the companies to update information and news feeds
faster and more frequently thus further improving the timeliness of the reports (CSR
Europe, 2010:18).
To enhance the reliability of the reports, an increasing number of companies included and
responded to stakeholder voices thus creating a balanced and engaging content that
instigated further stakeholder dialogue and enquiry (SustainAbility et al., 2008:03). The
companies increasingly invited the users to become part of the reporting process by
including their independent and unedited comments in order for their reports to provide
78
genuine stakeholders' voices meant to enhance the credibility of those reports (CSR
Europe, 2010:18). Some companies' reports also provided detailed information on the
opinion polls and surveys of their stakeholders' perception, as well as case studies (ACCA
& TEC, 2005:05; CSR Europe, 2010:19; KPMG, 2008:34).
To further enhance reliability, companies increasingly included in the CEO's statements, a
declaration from the CEO of a commitment to addressing the key concerns raised by the
stakeholders and invited their feedback (ACCA & TEC, 2005:11; CDC & PwC,
2010:22). Similarly, an increasing number of companies demonstrated an alignment of
stakeholders’ concerns with their business priorities (ACCA & TEC, 2005:05). Some
companies also demonstrated how they had incorporated stakeholder feedback into their
reporting process and employed the feedback to test the clarity of their reports
(SustainAbility et al., 2008:23). Other companies employed case studies to demonstrate a
connection to the reality faced by the stakeholders and the outcome of specific dialogue
initiatives (ACCA & TEC, 2005:05). Some innovative companies also started to quantify
their engagement initiatives using a consistent metric for measuring the effectiveness of
their stakeholder engagement processes (ACCA & TEC, 2005:06).
To enhance the review and verifiability of the effectiveness of the stakeholder
engagement process, an increasing number of companies, described in detail their
methodology and process for assessing material issues raised in stakeholders' feedback
(CBSR & CDC, 2008:22; CDC & PwC, 2009:27). This included the documentation of
the materiality matrix used with summaries of new issues raised and key changes from
the previous years (AccountAbility, 2006:21). In addition they documented evidence that
controls, action plans and reviews, quantified targets, and milestones were in place,
including the structures and procedures of conducting the stakeholder engagement
process and use of metrics to track the engagement impacts and outcomes (ACCA &
TEC, 2005:06; CBSR & CDC, 2008:22). Furthermore, they documented the evidence
that stakeholder viewpoints were employed to inform business practices and decisions
(AccountAbility, 2006:16).
Whereas the improvement in the quality of sustainability reports among the leading edge
reporters was certainly commendable, the same cannot be said about the quality of
79
sustainability reports of most companies in general (SustainAbility et al., 2008:05). The
next section discusses the main shortcomings of the sustainability reporting practices of
the years between 2000 and 2010.
2.6.9 The shortcomings of the sustainability reporting practices of the years between 2000
and 2010
2.6.9.1 Lack of a meaningful stakeholder dialogue
Although a majority of companies published a section on stakeholders and defined their
approach to stakeholder engagement, still too few entered into a meaningful dialogue
with their stakeholders to define the issues that should be reported or even asked for
specific feedback (Bromley & Powell, 2012:485; Business & Society, Morris &
Chapman, 2010:06). Accordingly, the stakeholder dialogue was limited, typically
unilateral, and almost always employed the lesser effective channels of communication
such as round tables, questionnaires, and unrepresentative stakeholders' panels (ACCA,
2009:06; KPMG, 2008:34; Marquis & Toffel, 2014:19). As a result, most of the reports
did not reflect the needs of their targeted audience, lacked credible and/or resentful
stakeholder voices, as most companies seemed to have pre-determined the relevant issues
to report on without involving the stakeholders (Business & Society, Morris & Chapman,
2010:21; Ernst & Young, 2007:10; SustainAbility et al., 2008:19).
2.6.9.2 Information-overload or over-aggregation of information
By purporting to cater for diverse stakeholder groups, companies simply expanded their
reports through the dumping of verbose, unprioritised and unintelligible information with
a limited attempt to explain their industry specific jargon or technical indicators
(Business & Society, Morris & Chapman, 2010:14; Laud & Schepers, 2009:368;
SustainAbility et al., 2008:16). This widespread non-strategic approach to sustainability
reporting proliferated the reports in different formats and types, using a varying range of
media such as paper and electronic which not only lead to multiplication of data and
information-overload, but also it diminished the relevance, readability and comparability
of the reports to the readers (Business & Society, Morris & Chapman, 2010:31; CSR
Europe, 2009:7; KPMG, CFCGIA, GRI & UNEP, 2013:15; Laud & Schepers, 2009:368;
SustainAbility et al., 2008:17).
80
In theory, the voluntary reporting guidelines and mandatory reporting requirements in
most countries were meant to be complementary, however, this was hardly the case in
reality as the two were neither integrated nor synchronised (Fonseca, 2010:14). As such,
their requirements tended to duplicate the reporting efforts of companies thus resulting in
information overload that limited the clarity of the reports (Fonseca, 2010:15). To
exacerbate the situation, the mandatory reporting requirements themselves were
fragmented with different arms of governments requiring different sets of information as
they were widely dispersed throughout the national legislation without integration (UNEP
& GRI, 2005:03). These resulted in overlapping, competing and even conflicting
reporting requirements (Menselsohn, Hjartarson & Pearce, 2010:04). Among multi-
national companies, sustainability reporting was disaggregated per country, product or
line of business, therefore the overall performance of a company could not be understood
(Mammatt, 2009:04).
By contrast, the companies that attempted to narrow the scope of their sustainability
reports in order to avoid information-overload risked alienating some of the stakeholders
(KPMG, 2008:16). Typically, they provided over-aggregated information without
supporting detail which impaired the readers’ ability to meaningfully assess and
understand the performance of the companies, and merely raised questions regarding a
company's commitment to sustainability reporting (Deloitte, 2011:05). Therefore, the
balancing act of getting the right information, to the right stakeholders, at the right time
and in the right form posed a challenge to many of the companies that produced
sustainability reports (KPMG, 2008:16).
2.6.9.3 Incomparability of the sustainability reports
Notwithstanding the emergence of the GRI guidelines as the de facto standard in
sustainability reporting, the comparability of sustainability reports remained problematic
(Fonseca, 2010:05). More specifically, GRI’s ABC application level system of reporting –
where a C level report required disclosure on 10 indicators, a B report required 20 and an
A report required all 79 or an explanation for omission – though well-intended to
distinguish beginners from advanced reporters, allowed a variation in sustainability
reports as companies could select favourable performance indicators uncommon to all

81
reports and change the indicators from one year to another at will (Business & Society,
Morris & Chapman, 2010:31; Fonseca, 2010:15; Henriques, 2007:89; Norman &
MacDonald, 2003:13). Accordingly, there was a lack of a systematic and comprehensive
approach to the selection of key performance indicators which impaired the comparability
of the sustainability reports (Business & Society, Morris & Chapman, 2010:03).
The indicators themselves were hardly clear, specific, measurable, accurate, and reliable
thus were susceptible to inconsistent interpretation and application (Leavoy, 2010:01;
SustainAbility et al., 2008:16). The inconsistency allowed cynical companies to appear to
be committed to sustainability reporting whereas hardly disclosing their true
sustainability impacts (Norman & MacDonald, 2003:13). Resultantly, the sustainability
reports varied widely with regard to their scope, depth and content from high-quality and
concise stand-alone reports, to an addition of a few pages in the annual reports, to short
but glossy documents (KPMG, 2010:78; Kolk, 2005:38).
2.6.9.4 Inadequacy of reporting guidelines
Given that most guidelines including the GRI's ones covered only a section of
disclosures, there was a proliferation of multiple metric reporting frameworks with little
coherence and convergence that inevitably recommended dissimilar terminology,
reporting structures, approaches as well as methods to measure, normalise and report on
specific performance indicators (Fonseca, 2010:07). This dissimilated the reporting
practice especially when companies employed metrics from several frameworks in their
reports (PwC & CDP, 2007:11). Besides, the metrics employed were also still evolving
and had hardly matured or stabilised (Deloitte, 2009:02; IPIECA & API, 2005:11).
Therefore, they further inhibited the comparison of a company's performance across time
as they varied in definition from one period to another (IPIECA & API, 2005:07).
Most guidelines also lacked embedded benchmarks that would enable the reader to gauge
the progress made towards the set targets (Leavoy, 2010:01). As a result, they did not
require companies to provide the context within which their sustainability performance
was reported nor the assumptions underpinning the assertions made (Business & Society,
Morris & Chapman, 2010:14; SustainAbility et al., 2008:14; Tornroos, 2005:105).

82
Accordingly, most companies reported in a context free fashion without positioning
themselves against a benchmark or even comparing themselves with their peers. This
inhibited the understandability of their sustainability reports (Business & Society, Morris
& Chapman, 2010:14).
2.6.9.5 Poor quality of assurance statements and processes
Although the need for reliability of sustainability reports had accelerated the development
of relevant assurance frameworks, the adoption of assurance standards did not enhance
the quality of the assurance statements as they varied significantly with regard to their
title, range of objectives, scope of assignment, amount of description of the nature, timing
and extent of procedures employed, as well as the wording of conclusions offered, given
the diversity of the assurance providers (ACCA, 2009:10; Fonseca, 2010:19; Furmann,
Ott, Looks & Gunther, 2013:02; Strandberg, 2013:12). The variation undermined the
readers' understandability of the assurance process as well as the meaning of the
conclusions reached (Deegan, Cooper & Shelly, 2006:329). Besides, many assurance
statements did not include, or refer to, any recommendations for improvement, either
from a content, accuracy or internal systems point of view, therefore they offered little
insight into how the assurance process was useful to a company's reporting and
performance (Business & Society, Morris & Chapman, 2010:28; ACCA, 2009:19).
Furthermore, only a few companies had undertaken assurance of their reports (AICPA et
al., 2010:14; Business & Society, Morris & Chapman, 2010:27). Even fewer had
undertaken a reasonable assurance given that it required a detailed examination of
evidence used to support the assertions made in the reports and thus was costly (ACCA,
2009:05; Ernst & Young, 2007:23). Instead, companies opted for the less costly, limited
form of assurance that did not require a detailed examination of evidence (ACCA,
2009:09). This limited the stakeholders' reliability on the reports, especially given that
they were sidelined from the assurance process, as the assurance engagement was
determined by and undertaken for the companies' management, a tendency which
undermined the perceived independence of the assurance providers (ACCA, 2009:06;
ACCA, 2009:08). Accordingly, the resulting assurance statements did not enhance the
reliability of the sustainability reports but instead led to a credibility gap as most

83
stakeholders appeared dismissive of the assurance process, statements, practical
competencies of the assurance providers and the overall institutional legitimacy of the
sustainability assurance industry (ACCA, 2009:05; Fonseca, 2010:19; Elkington &
Thorpe, 2009:01). Where companies had opted for third-party commentary, such
commentary tended to be one-sided, typically portraying a company's report in a
favourable manner that lacked credibility (Business & Society, Morris & Chapman,
2010:21).
As a result of the above weaknesses in the assurance process, and the general climate of
voluntarism in sustainability reporting, the reports produced by most companies tended to
be declarative and biased with a primary focus on good news even when bad news was
known to exist (SustainAbility et al., 2008:14). In addition, most of the performance
measurement systems were inept and error prone, as they relied on manual or simple
spreadsheet software that could not guarantee the accuracy of the reports produced (Ernst
& Young, & Greenbiz, 2013:30; Haywood, Brent, Trotter & Wise, 2010:342; Marx & Van
Dyk, 2009:01; SAPLIB, 2009:01). Worse still, some companies undermined the
credibility of their reports by providing cautionary statements about the nature of the
information contained in those reports (Kolk, 2005:40). Resultantly, many stakeholders
perceived the sustainability reporting practice as lacking in commitment to transparency
and accountability, and thus dismissed it as irrelevant in the context of their own
decision-making needs (IRC, 2011:01).
2.6.9.6 Lack of commitment to sustainability reporting
The reliability of sustainability reports was also impaired by the apparent disconnect
between the sustainability reporting practice and the actual sustainability performance
(Leavoy, 2010:01). This created an impression that most had reported for the sake of it,
without a credible commitment to an improvement in their sustainability performance,
given that most of the reporting guidelines did not require companies to prove the claims
made in the reports (SustainAbility et al., 2008:15). As a result, companies could retain
their international certification, or even win sustainability reporting awards and rankings
despite a dismal sustainability performance (3 BL media, 2011:01).
84
A lack of commitment to sustainability reporting was also evidenced by the low reporting
rates among the companies outside the top 100, the infrequency of reporting, as well as
the limited convergence of social, economic and environmental reports into annual
reports among all types of companies (AICPA et al., 2010:14; CDC & PwC, 2009:22).
Typically, social and environmental information was presented in a competing or
reciprocal manner that mirrored the influence of interested parties (Brown et al.,
2007:25). Furthermore, the social and governance issues included in the sustainability
reports were hardly rigorously quantified as the metrics of measuring these issues were
not as well-developed as measures of environmental performance, thus were presented in
a vague manner that hindered accuracy, comparability and understandability (Norman &
MacDonald, 2003:09; SustainAbility et al., 2008:19).
For most, their sustainability reports appeared disconnected from their financial reports,
generally provided a backward-looking review of performance, and almost always failed
to make the link between sustainability issues and companies' core strategies (IRC,
2011:01). In spite of the widespread debate on the need for integrated reporting to enable
the users to assess the performance of companies in an all rounded and complete manner,
only a few companies integrated their sustainability reports with their financial reports
(KPMG, 2008:16). Accordingly, sustainability issues were perceived as peripheral
activities, that neither merited inclusion into companies' Enterprise Resource Planning
systems nor required daily management and monitoring (SAPLIB, 2009:01). As a result,
sustainability reports did not provide a holistic picture of companies' performance as they
failed to address the issues that had caused a lingering trust deficit between the general
public and the intentions and practices of companies (IRC 2011:01).
2.6.9.7 Failure to optimise on the on-line capabilities
Much as the progresses made in on-line reporting were indisputably laudable, most
companies did not fully exploit their on-line capabilities as most reports had limited
interactivity and did not employ the latest available technology such as the Extensible
Business Reporting Language (XBRL) and Web 2.0 technologies (Ernst & Young,
2007:22; GRI, 2012:14). Instead, many companies simply uploaded the duplicate of their
printed report as a PDF file and missed the opportunity to provide more attractive and

85
timely information (Business & Society, Morris & Chapman, 2010:39; Radley Yeldar &
GRI, 2011:02). Besides, downloading large PDF files was time-consuming and rendered
the computers unusable during the download time and did not allow prompt feedback
(CSR Europe, 2009:10).
With regard to the HTML format, the on-line reporting practice varied significantly as no
standard had been developed to assist the companies to present their sustainability
information in a comparable manner (Tornroos, 2005:1I5). In addition, the search for the
electronic reports was a frustrating experience for most readers as the reports lacked
visibility on the home page (Business & Society, Morris & Chapman, 2010:45). In the
developing countries such as South Africa, perhaps due to a low level of computer
literacy, sustainability reporting on the Internet had not yet reached the stage where users
could download information and mould it into different forms for useful decision-making
(Morolo 2007:ix; Nevondo, 2005:2).
2.7 CHAPTER SUMMARY AND CONCLUSION
This chapter traced the environmental, social and sustainability reporting practices from
the 1960s to 2010 to determine whether the reporting developments had enhanced the
relevance, reliability, clarity, comparability, timeliness and verifiability of the reports.
The environmental movement of the 1960s drove the general public to pressurise
companies to demonstrate their environmental responsibility. As a response, companies
launched dis-informative greened advertisements meant to manipulate the general public.
In response to the energy crisis of the 1970s, the larger American companies increasingly
reported on their environmental performance in their annual reports. However, the reports
were irrelevant, unreliable, incomparable, inadequate, biased and unverifiable.
By contrast, the European companies focused on employee-related social reporting.
Whereas the French law required companies to produce comprehensive and comparable
employee reports, social reporting in most European countries was voluntary. The most
innovative reporting experimentation was practiced by the large German companies,

86
especially Deutsche Shell, which employed specific, reliable, relevant and comparable
quantitative indicators and innovated integrated reporting.
Despite the laudable developments in social reporting in Europe, most reports were
public relations driven and therefore were irrelevant, unreliable, biased and dis-
informative. Except in France where a uniform report structure was prescribed, most
European reports were incomparable as they lacked a uniform format, terminology and
content structure. However, the French practice failed to provide a holistic impact of
companies on the society as it narrowly focused on employee issues and provided
unnecessary details. Elsewhere in Europe, social reports were vague and
incomprehensible as they lacked quantitative performance indicators. In addition, many
companies produced incomplete and inaccurate reports to avoid the legal consequences of
disclosing sensitive information, a situation made possible due to a lack of independent
verification.
The recession of the early eighties ended the widespread experimentation and debate
concerning social reporting. In the late eighties, a series of high profile companies'
environmental disasters led to re-emergence of non-financial reporting with a primary
focus on environmental issues. In response to the resulting public pressure, some
governments such as that of the United States introduced regulations that required
mandatory disclosure of some environmental information in the annual reports. As the
rates of environmental reporting rose, so did the societal expectations. Dissatisfied with
the quality of reporting, some stakeholders developed the Valdez Principles to enhance
the timeliness, relevance, reliability and verifiability of environmental reports.
Despite the reporting developments in the eighties, most of the reports were unverified,
deceptive, dis-informative, irrelevant, unreliable, and incomplete as they contained more
scenic photographs than actual information. In addition, the reports were incomparable
and incomprehensible as quantitative environmental performance indicators were yet to
be developed, neither had definitive reporting guidelines emerged. The reporting
approach was also generally unsystematic as it lacked a strategy, an effective EMS, an
effective stakeholder engagement mechanism, and an independent assurance statement,
given assurance standards were yet to be developed.
87
Driven by the compliance motive, the uptake of environmental reporting accelerated at an
unprecedented rate in the 1990s in most of the developed countries except in the United
States. To improve the usefulness of the reports, a plethora of reporting guidelines,
awards and ranking schemes, standards and internationally accredited certification had
emerged with an objective of enhancing the relevance, reliability, clarity, comparability
and timeliness, of the reports.
To enhance the clarity, accuracy and comparability of the sustainability reports produced,
an increasing number of companies did not only quantify their data, they also provided
targets and data from preceding years to facilitate comparison. In addition, an increasing
number of companies undertook independent verification to enhance the credibility of
their reports and improve their EMSs. In addition, an increasing number of companies
obtained internationally recognised certification such as the ISO 14001 and the EMAS
for their EMSs to enhance the reliability and verifiability of their reports.
The advent of the Internet eased the accessibility of the reports to the stakeholders. The
HTML format of on-line reporting enabled companies to provide more detailed, timely,
interactive, user-friendly and relevant information tailored to specific needs of different
user groups.
Most companies subscribed to reporting guidelines developed by high-profile
organisations which recommended standardised report structures and required a
comprehensive disclosure of information as well as a logical flow of topics. These
enhanced the comparability, relevance, reliability and readability of the environmental
reports.
An increasing number of companies widened their environmental reports to cover social
issues in order to provide relevant information to a growing list of stakeholder groups. A
few companies converged their environmental, social, socio-economic and financial
performance reports in one annual report to provide a complete all-rounded picture of
their performance. This enhanced the reliability and understandability of the reports by
enabling users to assess the impact of sustainability performance on financial
performance of a company. To reinforce the emerging trend, some countries enacted laws

88
that prescribed disclosure of certain standardised sustainability performance information
in the annual reports which further enhanced the completeness and comparability of the
reports.
Notwithstanding the above developments, environmental reporting practices in the 1990s
had numerous shortcomings. These included: a) a lack of a meaningful stakeholder
engagement mechanism that resulted to generic, overloaded, unreadable, unclear and
mostly irrelevant reports; b) unreliable, incomplete and inaccurate reporting due to an
extensive use of manual and error-prone methodologies as well as a tendency to report in
a selective, fragmentary, biased, self-laudatory and unverifiable manner; c) low levels of
external verification and a poor quality of the verification processes; d) incomparability
of the reports due to proliferation of non-uniform reporting guidelines; and e) failure by
most companies to fully exploit their on-line resources.
The years between 2000 and 2010 witnessed a dramatic increment in the number of
companies that produced sustainability reports. The increment that was mainly driven by
competitive motives had spread to all sectors and to the developing countries. The growth
in the reporting practice during the period was partly driven by smart legislation by
governments which also endorsed GRI guidelines, securities exchanges, supra-national
bodies, and business and industry associations reporting awards and ranking schemes.
Unlike in the 1990s, the accountancy professional bodies played a more significant role
by developing assurance standards. In addition, major accountancy firms spearheaded the
provision of assurance on sustainability reports, and conducted surveys meant to enhance
the usefulness of the sustainability reports. In the South African context, the improvement
in the quantity and quality of sustainability reports was driven by the King II Report
which explicitly advocated for triple-bottom-line reporting. The report was updated into
the King III Report, which recommended integrated sustainability reporting.
The years between 2000 and 2010 witnessed a significant improvement in the usefulness
of sustainability reports as an increasing number of companies quantified their data,
contextualised it in a comparable manner to the past years and provided metric
performance indicators against targets. To facilitate inter-company comparison, a
89
majority of companies adopted the GRI performance indicators. In addition, companies
increasingly benchmarked their performance against that of their competitors, industry
averages and the best practice, and provided trends of their performance. The adoption of
the GRI sector and country-specific indicators also enhanced the relevance of the reports
and made the reports more concise, effective and readable. An increasing number of
companies also reported on a comprehensive list of indicators and provided an elaborate
description of reporting systems meant to enhance completeness and verifiability of the
resulting reports. Accordingly, there was a dramatic increase in the number of companies
that undertook external verification to enhance the credibility of their reports.
To further enhance the credibility of their reports, some companies included third-party
commentary in the reports. In addition, a growing number of companies adopted a
systematic approach to reporting that entailed developing a sustainability strategy and
policy, putting in place an organisational structure with well-documented processes and
controls. Furthermore, many companies adhered to internationally recognised codes of
conduct and had an effective and internationally accredited EMS. To further demonstrate
their commitment to sustainability reporting, and enhance the relevance, reliability, and
understandability of their reports, an increasing number of companies included CEO
statements in their sustainability reports that outlined their sustainability plans.
To improve the timeliness of their sustainability reports, many companies aligned their
sustainability reporting cycle to their financial reporting cycle. With the aid of the
Internet, some went further and reported on a quarterly basis as opposed to an annual
basis. The wide adoption of the Internet for sustainability reporting enhanced the
relevance of the reports as it availed new stakeholder engagement tools. The use of
advanced computer software also improved the accuracy, consistency, and credibility of
the data as well as enriched the on-line content which enhanced the understandability of
the reports. Not only did the reports become more verifiable, they also became more
comparable at an instant speed and low cost.
To enhance the relevance of their reports, an increasing number of companies started to
meaningfully engage their stakeholders, when selecting the content to report on and their
key performance indicators. Furthermore, using stakeholders’ feedback, companies
90
increasingly adjusted their subsequent reports to the preferences indicated by the
stakeholders to enhance the usefulness of their reports.
Despite the general improvement in the quality of sustainability reports in the years
between 2000 and 2010, the reporting shortcomings of the 1990s continued during this
period. These included: 1) superficial stakeholder engagement initiatives that ultimately
resulted in irrelevant reports; 2) unreliable reports due to the use of inaccurate and
questionable performance indicators, biased reporting, and low levels of external
verification of the reports; 3) incomparable reports due to a lack of standardised specific
and measurable performance indicators and benchmarks; 4) incomprehensible reports due
to either information-overload or over-aggregation of data without supporting detail; and
5) failure by most companies to exploit the full potential of the Internet capabilities.
Whereas the above developments in the sustainability reporting practice have certainly
enhanced the usefulness of the sustainability reports produced by many companies,
evidently, there are numerous serious concerns regarding the relevance, reliability,
comparability, timeliness, clarity and verifiability of the reports produced by most
companies. Therefore the final conclusion regarding the decision-usefulness of the
sustainability reports produced still seems evasive.
Having reviewed the historical development of environmental and sustainability reporting
practice in this chapter, the next chapter will present the theoretical foundation
underpinning this research. Chapter 3 proceeds with a general overview of various
approaches to formulation of accounting theories as well as a discussion of some of the
theories that have commonly been used by researchers in the area of social and
environmental reporting. This discussion will be followed by a detailed examination of
the decision-usefulness theory as well as justification for the selection of this theory.

91
CHAPTER 3
THEORETICAL FOUNDATION OF ENVIRONMENTAL
REPORTING
3.1 INTRODUCTION
Environmental reporting, as previously defined, is the “process of communicating …
environmental effects of organisations’ economic actions to particular interest groups
within society and to the society at large” (Gray et al., 1987:9). Whereas, accounting is
the “process of...communicating economic information to permit informed judgements
and decisions by users of the information” (AAA, 1966:01). Therefore, environmental
reporting falls within the ambit of accounting (De Villiers, 1996:08). Accordingly, it is
appropriate to examine accounting theory in order to understand and evaluate the
suitability of the current environmental reporting practices in informing judgements and
decisions of users, and to prescribe how such reporting practices should be done (Deegan,
2006:04). The theory is also examined because no discipline can develop without a strong
theoretical base (Porwal, 2001:07). Therefore as a relatively newly emerging practice,
environmental reporting should be founded on sound accounting theory.
Although several definitions of accounting theory have been provided (Deegan, 2006:04),
the most commonly cited definition is that provided by Hendriksen (1970:01) when he
defines an accounting theory as “a coherent set of hypothetical, conceptual and pragmatic
principles forming the general framework of reference for a field of inquiry”. He later
reiterates that an accounting theory is “a set of broad principles that, firstly provide a
general frame of reference by which accounting practice can be evaluated and secondly
guide the development of new practices and procedures” (Hendriksen, 1982:01).
Admittedly, there is no single accounting theory that has met Hendriksen's definitions
with a universal approval (AAA, 1977:02; Porwal, 2001:26). Instead, like in any other
social science, there are a multitude of different theories employed in accounting that
sometimes corroborate each other but at other times compete with each other (De Villiers,

92
1996:11). It is therefore not surprising that several theoretical perspectives have been
employed in the prior literature on environmental reporting, given that it is a sub-
discipline of accounting (Cowan, 2007:60).
The purpose of this chapter is to examine various theoretical perspectives employed in
the existing literature in an attempt to describe, explain, and evaluate the current
environmental reporting practices and to prescribe how the reporting should be practiced.
This chapter proceeds with a brief overview of the various theoretical perspectives
employed in social and environmental reporting research in section 3.2. The justification
for the theoretical perspective adopted in this study will be provided in section 3.3. This
will be followed by a detailed examination of the decision-usefulness theory in section
3.4. The paradigms of the decision-usefulness theory will be discussed in section 3.5.
This will be followed by a detailed discussion of the approach adopted in this study in
section 3.6. Thereafter, the general criticisms of the decision-usefulness theory are
discussed in section 3.7, followed by the summary and conclusion of the chapter in
section 3.8.
3.2 OVERVIEW OF RELEVANT THEORIES
3.2.1 Inductive theories and Deductive theories
Attempts to formulate generally accepted accounting theories have not succeeded so far
because of different assumptions, intended functions and methodologies employed in
formulating the theories (Porwal, 2001:26). With regard to the methodologies, some
accounting theories have been formulated using an inductive approach, on the basis of
past observations, whereby theories are not viewed in isolation but are rather tested to
determine the extent to which actual practices conform to the theories. Simply put, on the
basis of observations and measurements, generalised conclusions are drawn. According to
Belkaoui (1992:61), this involves four stages:
i. recording observations
ii. analysing and classifying observations to detect recurring relationships
iii. deriving generalisations and principles of accounting from recurring relationships

93
iv. testing generalisations
The theories developed this way are deemed to be empirical or scientific, of which some
are further developed to make predictions about likely occurrences, and sometimes offer
explanations about why certain events occur (Deegan, 2006:04). Such theories have
however been criticised for justifying the existing practice and for being unable to
suggest improvements or new techniques (De Villiers, 1996:17).
By contrast, other accounting theories are developed unscientifically, not based on
observation or empirical evidence, but rather developed through a deductive process
(Porwal, 2001:28). The deductive process follows the following sequence (Belkaoui,
1992:60):
i. Value-based objectives are specified
ii. from the objectives, accounting premises are selected
iii. from the premises, accounting principles are derived
iv. based on accounting principles, techniques of accounting are formulated
These theories which are usually based on the norms or value judgements held by those
proposing them, are regarded as normative, as they are not concerned with how
accounting is practiced, but rather how it ought to be practiced (Deegan, 2006:11). Such
theories therefore are prescriptive as they set out goal assumptions of what accounting
principles should be based on (Deegan, 2006:04). Notwithstanding the variety of theories
employed in accounting, selecting an appropriate accounting theory should not be a
daunting task as different theories are formulated to perform different functions (Deegan,
2006:02). Therefore, the theories should be selected in accordance with their suitability
for the intended function.
3.2.2 The theoretical perspectives employed in environmental reporting research
As a result of a considerable disagreement amongst accounting researchers regarding the
theoretical underpinning of environmental reporting, a variety of theoretical perspectives
have been employed in the early literature on environmental reporting (Cowan, 2007:60;

94
De Villiers, 1998b:01). In order to facilitate a meaningful discussion of the theoretical
perspectives, some researchers have proposed a variety of categorisation criteria that
could be employed (Gray, Kouhy & Lavers, 1995:50; Parker, 2005:01). One useful
categorisation criteria that is commonly cited is provided by Gray et al. (1995:50) who
classify the theoretical perspectives into three categories namely; decision-usefulness
theories, economics-based theories such as the agency theory and political economy
theories such as the legitimacy theory and the stakeholder theory.
Another commonly cited categorisation criteria of the theories employed in
environmental reporting research is provided by Parker (2005:842), who places the
theoretical perspectives into two main categories namely; augmentation theories and
heartland theories. The heartland theories are considered to be deeply philosophical and
less practical, and thus have not been extensively employed in the prior research on
environmental reporting (Alin, Victor, & Dumitru, 2011:124). By contrast, the
augmentation theories which consist of decision-usefulness theory, agency theory,
accountability theory, stakeholder theory and legitimacy theory are considered to be
practical and have been extensively used in environmental reporting research (Alin et al.,
2011:124). These theories overlap with those classified by Gray et al (1995:50), and are
expounded below.
Accounting conceptual frameworks assert that the primary objective of accounting is to
provide information that is useful for decision-making (FASB, 2010:01; GRI, 2000:16;
IASB, 2008:12). Based on the primary objective, accounting researchers have proposed a
theory, namely; the decision-usefulness theory (Inanga & Schneider, 2005:246). The
decision-usefulness theory therefore is premised on the view that the primary purpose of
accounting and environmental reporting is to provide information to permit informed
judgements and decisions by users of the information (AAA, 1966:01). The theory
assumes that users do evaluate and choose to use environmental information according to
its perceived usefulness (Rikhardson & Holm, 2005:05). It further assumes that for
accounting information to be useful, it must be relevant and faithfully represent the
phenomena it purports to represent (FASB, 2010:16). In addition, the theory makes the
assumption that certain characteristics of information such as understandability,
timeliness, comparability and verifiability can enhance its decision-usefulness (FASB,

95
2010:19). As a normative theory, the decision-usefulness theory prescribes the type of
accounting information and manner of disclosure that is useful to the users when making
decisions (Deegan, 2006:05).
By contrast, the agency theory is based on the agency relationship which exists where a
principal (shareholder) delegates some decision making authority to an agent (manager)
(Denis, Denis, & Sarin, 1999:1072; ICAEW, 2005:06). The principal (shareholder) and
the agent (manager) enter into a formal contract that creates a fiduciary relationship that
legally entitles the shareholders (principals) to information held by managers (agents)
(Wilson, 2003:05). In this relationship, the agent will have more or better information
than the principal (information asymmetry) and will act in his or her own interest which
could be to the detriment of the principal's interest (Denis et al., 1999:1072).
The agency theory thus posits that as a result of information asymmetries and self-
interest, principals lack reasons to trust their agents (ICAEW, 2005:04). Therefore, the
principals will seek to resolve the trust concerns by putting in place mechanisms such as
requiring that environmental reports be audited to reinforce trust and reduce opportunistic
behaviour by managers. For this reason, the theory has been extensively employed in
accounting literature to explain and predict the shareholders demand’ for the appointment
of external and internal auditors, and in determining their respective roles in protecting
the shareholders' interests (Adams, 1994:08). The theory has also been used to explain
why managers, acting in their self-interest, will select particular accounting methods and
prescribe the accounting information to be disclosed to the shareholders (Porwal,
2001:52).
Based on the view that an alternative purpose of accounting is for managers to account to
all stakeholders for the management of resources under their control, accountability
theory posits that managers have an ethical responsibility to provide an account, or a
reckoning of their actions to all stakeholders and not just the shareholders (De Villiers,
1996:12; Gray, 1994:28; Gray et al., 1996:38; Ijiri, 1975:32; Islam, 2009:45). According
to the theory, managers have two responsibilities, namely; responsibility to take actions,
and responsibility to account for those actions (Kisenyi, 1999:06). The theory extends the
right to information held by managers to all stakeholders based on the assumption that a

96
social contract exists between a company and the society in which it operates, which
entitles the stakeholders to a moral right to information (Gray, 1994:28; Kisenyi,
1999:07).
Based on an expressed or implied social contract, a company, like any other social
institution, operates in society where its survival and growth depend on the delivery of
some desirable ends to society in general, as well as the distribution of economic, social
and political benefits to the society from which it derives its powers (Shocker & Sethi,
1973:67). It follows therefore that the social contract stipulates the responsibilities and
the right to information and hence defines the nature of the relationship between company
managers and the rest of society (Mathew, 1993:26) – a relationship in which the
managers owe a duty of accountability to the society at large. It is based on this
relationship that the accountability theory sets out arguments for disclosure of accounting
information by companies to all stakeholders and not just the shareholders (Gray
1994:28).
Also based on the assumption that a social contract exists between a company and the
society, the stakeholder theory posits that a company's continued existence requires the
support of the stakeholders and that their approval must be sought, and the activities of
the cmpany adjusted to gain that approval (Hibbitt, 2004:206; Ullman, 1985:540). The
theory is divided into two branches namely the ethical (normative) branch and the
managerial (positive) branch (Deegan, 2002:294).
The ethical branch, being a normative branch, prescribes how the company management
should address stakeholder concerns and interest, and therefore is not based on what
actually takes place in practice (Hibbitt, 2004:206). Simply put, this branch argues that a
company should be managed for the benefit of all stakeholders regardless of their powers
and also prescribes that all stakeholders should be treated fairly and equally (Deegan,
2002:294). A company therefore has a moral obligation to uphold the rights of all
stakeholders simply because they exist (Hibbitt, 2004:207). This includes the right to be
informed about a company's environmental performance. As a prescriptive branch, the
ethical branch does not predict managerial behaviour (Deegan, 2002:294).

97
By contrast, the managerial branch reiterates the need to manage and supply
environmental information to powerful stakeholder groups because of their ability to
control resources that are necessary for a company's survival (Ullman, 1985:540). The
more important the resource controlled by the stakeholders for the future survival of a
company, the more effort will be exerted in managing the relationship with the
stakeholders and the greater the expectation that these stakeholders' demands will be
addressed (Deegan, 2002:294). Thus this branch is used to directly predict management
behaviour. According to this branch, the relative power of a stakeholder group will
determine the level and quality of environmental information that it receives from a
company, and therefore influence the disclosure policies of the company (Wallen &
Wasserfaller, 2008:21). Therefore, environmental reporting is seen as one of the means to
manage or manipulate powerful stakeholders in order to gain their support and approval
or to distract their opposition and disapproval (Gray et al., 1996:45).
Likewise, the legitimacy theory also assumes that a social contract exists between a
company and the society within which it operates (Patten, 1991:297). The theory posits
that a company must appear to consider the rights of the public at large, and not merely
those of its investors (Deegan & Ranking, 1996:567). If the company does not appear to
operate within the bounds of behaviour which is considered appropriate by society, then
the society may act to remove the company's rights to continued operations (De Villiers
& Antonites, 2003:01).Therefore, a company cannot continue to thrive if its aims and
operations are perceived to be in conflict with those of the society within which it
operates. This implies that companies with a poor environmental performance record may
find it difficult to obtain the necessary resources and support to continue their operations
within a society that values a clean environment (Deegan & Ranking, 1996:567).
To ensure its survival, a company will adopt particular strategies, including reporting
strategies, in a bid to assure the society that the company is complying with the society's
values and norms (Deegan, 2006:294). Lindblom (1994:01) identifies four reporting
strategies that a company could employ in environmental reporting to legitimise itself.
These are as follows:
i. Reporting to educate and inform its relevant audience about actual changes in the
98
company's performance and activities
ii. reporting to change perceptions of its audience but not change its actual behaviour
iii. reporting to manipulate perceptions of its audience by deflecting attention from
issues of concern to other issues
iv. reporting to change external expectations where they are deemed unrealistic or
unfair
3.3 JUSTIFICATION OF THE THEORY ADOPTED FOR THIS RESEARCH
As a result of many approaches to the study of environmental reporting, research in this
area is neither structured nor representative of any particular theory (Deegan, 2002:288;
Porwal, 2001:26). As such, environmental reporting research has yet to experience a
theoretical closure and remains open to different theories (ACCA, 2007:29; Hibbitt,
2004:144). However, where several different accounting theories belonging to different
world views are adopted, complications can arise due to the conflicting nature of the
assumptions underlying different theories (Deegan, 2002:294; Hibbitt, 2004:111). Hence
some form of closure is a practical necessity within individual pieces of research (Hibbitt,
2004:144).
Different theories are suitable for different functions (Deegan, 2006:02). Some theories
are suitable for describing accounting practices in general, whereas others are appropriate
in prescribing particular accounting practices (Deegan, 2006:04; Islam, 2009:45). Some
theories are suitable in predicting likely occurrences, whereas others are appropriate in
explaining the occurrences after they have occurred (Hibbitt, 2004:112; Porwal,
2001:07). Accordingly, in selecting a particular theory to inform a study, a researcher has
to evaluate its suitability for the intended purpose (Deegan, 2006:18). Simply put, a
theory should be critically evaluated or questioned in order to determine its suitability for
an intended function before it is accepted (Deegan, 2006:02). This should be done by
examining whether the arguments supporting a theory are logical and plausible in terms
of the assumptions made. Therefore, a theory and its associated hypothesis should only be
accepted if the logic of its supporting arguments, underlying assumptions and supporting
evidence provided are accepted (Deegan, 2006:18 ). Furthermore, the researcher has to
consider the fact that accounting as a discipline, is not a natural science, but rather an

99
abstract phenomenon, the existence of which is solely dependent on human construction
(Hibbitt, 2004:112). As such, accounting theories are developed as a result of value
judgement. Therefore the acceptance of one theory, in preference over others, will in part
depend on one's own value judgement (Deegan, 2006:15; Porwal, 2001:10).
Undeniably, the use of agency theory has benefited research on environmental reporting
by enabling methodological pluralism, however, the theory's assumptions are highly
contestable in the context of environmental reporting (Gray et al., 1995:51). To begin
with, its economic assumptions of free markets which have resulted in information
asymmetries and externalities, contradict the principal concerns of environmental
reporting (Parker, 2005:846). Most importantly, the theory's overriding assumption that
all actions are motivated by self-interest is considered to be not only empirically
implausible but also highly offensive (Gray et al., 1995:51). Also, considering that the
theory is concerned only with the fiduciary relationship and information needs of the
shareholders, it ignores the other stakeholders (De Villiers, 1996:12; Hibbitt, 2004:191).
Besides, the agency theory being a positive theory is not primarily concerned with what
environmental reporting should be, thus it fails to suggest improvement to the reporting
practice (Deegan, 2006:08). For these reasons, the theory is unsuitable to inform this
study.
Although the stakeholder theory and legitimacy theory have been perceived as the more
insightful theoretical perspectives that have informed the more penetrating analyses of
environmental reporting studies in recent years (Gray et al.,1995:52 ), these theories are
focussed on explaining why companies/management make environmental disclosures (De
Villiers & Van Staden, 2010a:07). Accordingly, these theories adopt a company's
management perspective and are concerned with the motivating factors behind a
company's environmental disclosure decisions (Cowan, 2007:60). Considering that this
research focuses on the users’ perception of the decision-usefulness of environmental
information and not why companies or management disclose this information, the
stakeholder and legitimacy theories are not useful to this study (De Villiers & Van Staden,
2010a:07). Furthermore, because this study is primarily interested in the perceptions of
the powerless users of environmental reports, the management branch of stakeholder
theory is inappropriate as it takes the perspective of powerful users (Wallen &

100
Wasserfaller, 2008:21). The legitimacy theory is also rejected as it accepts that the use of
environmental reports to manipulate the public is one of the strategies that a company
could employ to legitimise itself (Lindblom, 1994:01).
Likewise, the accountability theory is rejected as it adopts a company's management
perspective by setting out arguments for disclosure of environmental information by
companies to all stakeholders and not just the shareholders (De Villiers, 1996:12). The
theory is also rejected as research evidence has indicated that the non-financial
stakeholders' needs have moved from the accountability paradigm to the decision-
usefulness paradigm, in which their needs for decision-making are eminent (Cronje,
2010:231). Besides, it has been argued that the decision-usefulness theory has
encapsulated the accountability theory as information that is decision-useful is also able
to discharge accountability (Gouws, 1997:66; Schoonraad, 2004:65).
Suitably, the decision-usefulness theory was selected to inform this study as it is
congruent with the primary objective of accounting which is to provide information
useful for decision-making (FASB, 2010:01; GRI, 2000:16; IASB, 2008:12; Inanga &
Schneider, 2005:246:12) (See Table 3.1). The theory also renders itself well to the
qualitative research methodologies that are employed in this research, namely content
analysis and questionnaire survey (Deegan, 2006:12; Deegan & Gordon, 1996; Deegan &
Rankin, 1996; Ernst & Young, 2007; Guthrie & Parker, 1990). Furthermore, the theory is
normative and thus focuses on how environmental reporting should be, and not how it is
(Deegan, 2006:12; Gray et al., 1987:66). It therefore does not support the status quo but
rather is proactive in nature and provides a basis upon which the current practice may be
evaluated or from which future improvements of environmental reports and reporting
systems may be deduced (Deegan, 2006:08).
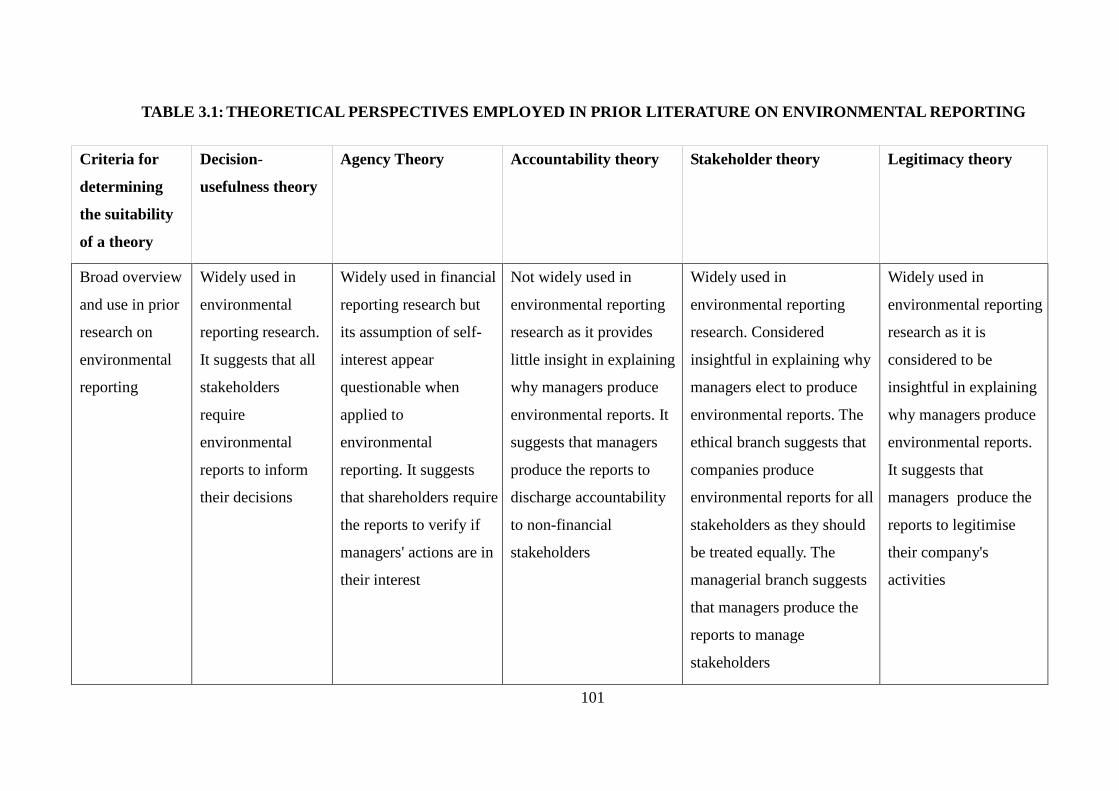
101
TABLE 3.1: THEORETICAL PERSPECTIVES EMPLOYED IN PRIOR LITERATURE ON ENVIRONMENTAL REPORTING
Criteria for
determining
the suitability
of a theory
Decision-
usefulness theory
Agency Theory Accountability theory Stakeholder theory Legitimacy theory
Broad overview
and use in prior
research on
environmental
reporting
Widely used in
environmental
reporting research.
It suggests that all
stakeholders
require
environmental
reports to inform
their decisions
Widely used in financial
reporting research but
its assumption of self-
interest appear
questionable when
applied to
environmental
reporting. It suggests
that shareholders require
the reports to verify if
managers' actions are in
their interest
Not widely used in
environmental reporting
research as it provides
little insight in explaining
why managers produce
environmental reports. It
suggests that managers
produce the reports to
discharge accountability
to non-financial
stakeholders
Widely used in
environmental reporting
research. Considered
insightful in explaining why
managers elect to produce
environmental reports. The
ethical branch suggests that
companies produce
environmental reports for all
stakeholders as they should
be treated equally. The
managerial branch suggests
that managers produce the
reports to manage
stakeholders
Widely used in
environmental reporting
research as it is
considered to be
insightful in explaining
why managers produce
environmental reports.
It suggests that
managers produce the
reports to legitimise
their company's
activities

102
TABLE 3.1: THEORETICAL PERSPECTIVES EMPLOYED IN PRIOR LITERATURE ON ENVIRONMENTAL REPORTING
(CONT…)
Criteria for
determining the
suitability of a
theory
Decision-usefulness
theory
Agency Theory Accountability theory Stakeholder theory Legitimacy theory
Research
methods used
Typically content
analysis, surveys,
interviews, experimental
studies, correlation and
regression analysis
Typically correlation
and regression
analysis, surveys
Typically review, surveys,
interviews, case studies
Typically content analysis,
surveys, interviews, case
studies
Typically content
analysis, surveys,
interviews, case
studies
Prior empirical
test
Not developed for
empirical testing as it is
premised on a view of
how environmental
reporting should be done
Widely empirically
tested in financial
reporting but not in
environmental
reporting
Not developed for
empirical testing as it is
premised on a view of
how environmental
reporting should be done
The managerial approach has
been widely empirically
tested in environmental
reporting. The ethical
approach is not developed to
be empirically tested
Widely empirically
tested in
environmental
reporting

103
TABLE 3.1: THEORETICAL PERSPECTIVES EMPLOYED IN PRIOR LITERATURE ON ENVIRONMENTAL REPORTING
(CONT…)
Criteria for
determining the
suitability of a
theory
Decision-
usefulness theory
Agency Theory Accountability theory Stakeholder theory Legitimacy theory
Perspective from
which the theory
is applied
Can take the
perspective of all
stakeholders
Takes the perspective of
shareholders only
Takes the perspective of
other stakeholders only
and not the shareholders
Takes the perspective of
managers and companies
Takes the perspective of
managers and companies
Relevance to the
objectives of this
study
Relevant
Explains why all the
stakeholders require
environmental
reports
Not relevant
Explains why
shareholders require
verified environmental
reports not why all
stakeholders require the
reports
Not relevant
Explains why managers
produce environmental
reports, not why the
stakeholders require the
reports
Not relevant
Explains why managers
produce environmental
reports, not why the
stakeholders require the
reports
Not relevant
Explains why managers
produce environmental
reports, not why the
stakeholders require the
reports
Source: adapted from Islam (2009:48)
104
Besides, this theory has been employed in the prior research to determine the users' perceptions of
decision-usefulness of environmental and social reports (Danatas & Gadenne, 2006; Deegan &
Gordon, 1996; Deegan & Rankin, 1997; Deegan & Rankin, 1996; Dierkes & Antal, 1985; Ernst &
Young, 2007; Guthrie & Parker, 1990; Mitchell & Hill, 2010; Rikhardsson & Holm, 2005; Tilt,
1994). Although most of the prior research was conducted in the developed countries,
theoretically, there is no reason why this theory should be more appropriate in one national
context and not in another (Islam, 2009:75). This study extends the applicability of the theory to a
developing country's context. Additional justification for the selection of this theory is included in
section 3.6, which discusses the approach adopted in this study.
3.4 THE DECISION-USEFULNESS THEORY
According to Deegan (2006:12), the decision-usefulness theory ascribes a particular type of
information for particular classes of users on the basis of assumed decision-making needs. The
theory is based on the premise that the primary purpose of accounting information is to satisfy the
information needs or wants of users situated in the substantial environment of any focal
organisation (Bebbington, Gray, & Laughlin, 2001:418). The needs and wants are assumed to be
in the context of users' decision making as it is in this context that information is necessary to help
reduce the inevitable uncertainty that surrounds every action (Laughlin & Gray, 1988:333).
However, the information needs or wants are not assumed to be of a certain type as they are only
determined after they have been discovered through research conducted on the stakeholders
(Bebbington et al., 2001:418). The theory has been well documented but its formulation has not
been primarily based on scientific research, instead it has emerged through a consultative process
over time (Coetsee, 2010:10). A historical trail of the theory's existence has been created with
passage of time and is discussed in the next section to enhance its appreciation (Buys, 2010:111;
Coetsee, 2010:10; Koornhof, 1998:34; Zeff 1999:89).
3.4.1 A brief history of decision-usefulness theory
A decade after the Wall Street Stock market crash of 1929, accounting researchers such as
Sanders, Hatfield and Moore (1938) began to recognise the users of accounting information and
their information needs. Their research and that of others that followed had an implicit assumption
that the purpose of accounting is to provide information, particularly for the providers of equity, to

105
assist in decision-making (May, 1943; Staubus, 1961; Chambers, 1966). Notwithstanding the
efforts of earlier researchers, it is Chambers (1966, 1957, 1955) who is generally credited with
formulating the decision-usefulness theory based on the needs of the users (Henderson & Scherer,
1986:05). With passage of time, the theory was further advanced by the issuance of monographs,
authoritative committee reports and conceptual frameworks by accounting bodies (Buys,
2010:111; Coetsee, 2010:10; Koornhof, 1998:34; Zeff, 1999:89).
3.4.1.1 A Statement of Basic Accounting Theory (ASOBAT)
Among the most notable accounting bodies that promoted the decision-usefulness theory was the
American Accounting Association (AAA), which through its committee of accounting academics
published a monograph entitled A Statement of Basic Accounting Theory (ASOBAT) (AAA,
1966). In this monograph, the AAA committee defined accounting as “the process of identifying,
measuring, and communicating economic information to permit informed judgements and
decisions by users of information” (AAA ,1966:01). It also emphasised futurity by suggesting that
accounting information for external users should reflect their needs by reporting measurements
and formulations thought to be relevant in the making of forecasts (AAA, 1966:23–24).
The AAA committee further identified and elaborated on four basic criteria that could be used to
evaluate the decision-usefulness of accounting information as relevance, verifiability, freedom
from bias and quantifiability (AAA, 1966:27–36). However, it reiterated that relevance and
verifiability should be the primary criteria when choosing between accounting alternatives (AAA,
1966:30). The committee also added additional objectives of accounting among which one took a
social welfare orientation by stating that the purpose of accounting is also to provide information
to facilitate social functions and controls (AAA, 1966:04). It concluded that the purpose of
accounting is to facilitate the operations of organised society for the welfare of all (AAA,
1966:05).
3.4.1.2 The Trueblood Committee Report
The decision-usefulness theory was further reinforced by the Trueblood Committee established by
the AICPA when it asserted in its report that the objective of financial statements, and by
implication accounting reports, is to provide information useful to investors and creditors for
making economic decisions (AICPA, 1973:20). Although the committee devoted primary attention

106
to investors and creditors, it explicitly acknowledged the existence of a variety of users, including
employees, by asserting that “while users differ, economic decisions are similar” (AICPA,
1973:18). It also suggested that financial statements, and by implication, accounting reports
should serve those users who have limited authority, ability, or resources to obtain information,
and who rely on accounting reports as their principal source of information about a company's
economic activities (AICPA, 1973:17).
In a radical departure from the previous schools of thought, the Trueblood Committee Report
stated that the societal goals of an enterprise were as equally important as the economic goals
(AICPA, 1973:54). It further stated that the objective of accounting reports is to disclose those
activities of the enterprise affecting the society that can be determined, described or measured and
that are important to the role of the enterprise in its social environment (AICPA, 1973:55). By
citing pollution as an example of enterprise activities that required sacrifices from those who do
not benefit from the enterprise, the report stated that enterprises should provide decision-useful
information to all the stakeholders, and not just the investors or creditors (AICPA, 1973:54). Like
the ASOBAT, the report also identified the qualitative characteristics of accounting information
that would make it useful to the stakeholders (AICPA, 1973:57–60). These included relevance and
materiality, form and substance, reliability, freedom from bias, comparability, consistency and
understandability. The report became the blueprint for the conceptual framework of the FASB,
which had been newly established at the time (Coetsee, 2010:09; Zeff, 1999:101).
3.4.1.3 The Corporate Report
Elsewhere, in the United Kingdom, the Corporate Report asserted that corporate reports should
seek to satisfy, as far as possible, the information needs of users (ICAEW, 1975:15). The report
which defined users as those having a reasonable right to information concerning the reporting
entity further elaborated that such rights arise from the public accountability of the entity whether
or not supported by legally enforceable powers to demand information (ICAEW, 1975:17). Thus,
based on this report, a reasonable right to information exists, provided the activities of a company
impinge or may impinge on the interest of a user (ICAEW, 1975:17). Accordingly, the Report
advocated for a more socially responsible accounting by calling for the provision of additional
social information in form of value added statements, employee reports and a statement of
monetary exchanges with government (Koornhof, 1998:35).

107
The report further explicitly identified the following as the users of accounting reports:
employees, government and the general public (taxpayers, ratepayers, consumers, political parties,
and environmental lobby groups) (ICAEW, 1975:17). The report concluded that the fundamental
objective of corporate reports is to communicate useful information about the economic
performance of an entity to those having a reasonable right to such information (ICAEW,
1975:31). Like the Trueblood report, the Corporate Report also identified the characteristics of
decision-useful accounting information as: relevance, understandability, reliability, completeness,
objectivity, timeliness and comparability (ICAEW, 1975:28).
3.4.1.4 The Stamp Report of 1980
In the Canadian context, the Canadian Institute of Chartered Accountants (CICA) commissioned a
research that culminated in the publication of the Stamp Report in 1980 (CICA, 1980:01;
Koornhof, 1998:36). Like the earlier reports (the ASOBAT, the Trueblood and the Corporate
Report), the Stamp Report reaffirmed the primacy of the decision-usefulness objective by stating
that, the objective of corporate financial reporting is “ to provide adequate information about the
real economic position and performance of an enterprise to all potential users who need such
information to make decisions” (CICA, 1980:04). Accordingly, the research set out to identify the
various different types of user groups to whom a public company is accountable to (CICA,
1980:07). These groups included the shareholders, financial analysts, creditors, government
departments, labour unions, consumers, academics, accounting bodies, regulatory agencies,
industry groups, journalists and the society at large (CICA, 1980:44). Furthermore, the study
examined the kinds of decisions that the various user groups were likely to make as a result of
reading financial reports, and the kind of information that they sought in order to make their
decisions (CICA, 1980:07).
With regard to the kinds of decisions that the various user groups were likely to make and the kind
of information that they sought, the Stamp Report indicated that some users needed information to
enable them to assess the performance of a company in comparison to its past performance and its
peers (CICA, 1980:50). Whereas other users needed information to assess the quality of a
company's management, estimate future prospects of a company, and assess the financial strength,
solvency, liquidity and risk (CICA, 1980:50), some users needed information to make resource
allocation decisions, valuation decisions, and assess the adaptability of a company (CICA,
108
1980:51). Yet, other users needed information to determine a company's compliance with law and
regulation, as well as assess the contribution of a company to the society (CICA, 1980:51).
The Stamp Report also set criteria for assessing the utility of published company reports to the
users as relevance, comparability, timeliness, clarity, completeness, objectivity, verifiability,
precision, isomorphism, freedom from bias, rationality, non-arbitrariness and uniformity (CICA,
1980:55). It demonstrated that selecting one qualitative characteristic of accounting information
may require a compromise in another (CICA, 1980:53). With regard to the latter, the report
illustrated that an increase in relevance may require a decrease in objectivity. Similarly, an
improvement in comparability may require a decline in verifiability. An increase in clarity may be
at the expense of completeness. Nevertheless, the report observed that some qualitative
characteristics such as relevance were more important than the others, and that different user
groups will assign varying degrees of importance to the various criteria (CICA, 1980:54; 57).
3.4.1.5 The Conceptual Frameworks
The above reports resulted in the adoption of the decision-usefulness objective by both the FASB
and the IASB conceptual frameworks, as well as the conceptual frameworks of other national
accountancy bodies in various countries (Coetse,e 2010:09; FASB, 1978; 05; IASB, 1989:par. 12).
In accepting the decision-usefulness objective, the FASB (1978:05), explicitly stated that
“financial reporting should provide information that is useful to present and potential investors
and creditors and other users in making rational investment, credit, and similar decisions”.
Similarly, the IASB (1989:par. 12) accepted the decision-usefulness objective when it stated that
“the objective of financial statements is to provide information about the financial position,
performance and changes in financial position of an enterprise that is useful to a wide range of
users in making economic decisions”. The Accounting Practices Board (APB) of South Africa
fully adopted the IASB's conceptual framework, and decision-usefulness objective when it issued
its conceptual framework, AC 000 (SAICA, 1990 par. 12).
In recognition of the desirability of a single universally accepted accounting theory, to which all
the accounting rules, principles and practices should conform to, the FASB and IASB, have
embarked on a joint conceptual framework meant to improve and converge their conceptual
frameworks (FASB, 2010). Like its predecessors, the joint framework reiterates the decision-

109
usefulness objective by stating that “the objective of general purpose financial reporting is to
provide financial information about the reporting entity that is useful to existing and potential
investors, lenders, and other creditors in making decisions about providing resources to the entity”
(FASB, 2010:par OB2). The framework clearly prioritises investors, lenders and other creditors as
the primary users to whom accounting information should be decision-useful to (FASB, 2010:par.
OB10).
Like the Stamp Report, the joint conceptual framework observes that some qualitative
characteristics of decision-useful information are more important than the others (FASB, 2010:par
QC4). In this regard, it reiterates that relevance and faithful representation are fundamental
qualitative characteristics that decision-useful information must have (FASB, 2010:par QC5). It
further adds that understandability, timeliness, comparability, and verifiability are the additional
qualitative characteristics that enhance the decision-usefulness of information that is relevant and
faithfully represented (FASB, 2010:par QC19). Therefore, the enhancing qualitative
characteristics either individually or collectively, cannot make information useful if the
information is irrelevant or not faithfully represented (FASB, 2010:par QC33).
3.4.2 Non-financial users of accounting information
Although the jointly developed accounting conceptual framework prioritises the financial
stakeholders, it acknowledges the existence of other users of accounting information by asserting
that “other parties, such as regulators and members of the public... also may find general purpose
financial reports useful” (FASB, 2010:par OB10). Similarly, by the IASB framework (IASB,
1989:par 09) stating that accounting information should be useful to a wide range of users, it does
not prioritise or identify the primary users of accounting information, instead it includes the
employees, customers, governments and their agencies, and general public as users. By adopting
the IASB conceptual framework, the South African conceptual framework also accepts the above
mentioned non-financial stakeholders as users of accounting information (SAICA, 1990:par 09).
Furthermore, the King III Report also recognises other non-financial stakeholders by explicitly
stating that companies should adopt a stakeholder inclusive approach, based on which, the
shareholder does not have a predetermined place of precedence over other stakeholders (IODSA,
2009:12).

110
As discussed earlier, various authoritative committee reports also recognised other stakeholders,
other than the financial stakeholders as users of accounting information (AICPA, 1973:54;
ICAEW, 1975:17; CICA, 1980:44). The Statement on Accounting Theory and Theory Acceptance
(SATTA) by the AAA (1977:02) adds that the entire community and even future generations may
be regarded as stakeholders. The existence of non-financial stakeholders who use accounting
information has also been supported by overwhelming empirical evidence (Bailey, 1990:193; Batt,
2000:01; Jones, 1990:272; Coopers & Lybrand, 1993:03; Danatas & Gadenne, 2006:01; Deegan
& Blomquist, 2001:03; Deegan & Gordon, 1996:195; Deegan & Rankin, 1999:326; Deegan &
Rankin, 1997:573; GRI 2008:09; Kam 1990:50; O'Rourke, 2003:227; Tilt 1997:01; Tilt, 1994:50).
In fact, the empirical evidence has indicated that corporate social reporting, the realm in which
environmental reporting falls, is not motivated predominantly by a concern with the needs, wants
and whims of financial stakeholders (Booth, Moores & McNamara, 1987:31; Mathews, 1987:161;
Owen et al., 1987:169).
3.4.3 Justification for provision of accounting reports to non-financial stakeholders
According to Mathews (1993:26), “society (as a collection of individuals) provides corporations
with their legal standing and attributes and the authority to own and use natural resources and to
hire employees. Organisations draw on community resources and outputs both goods and services
and waste products to the general environment. The organisation has no inherent rights to these
benefits, and in order to allow their existence, the society would expect benefits to exceed the
costs to society”. Therefore, an implicit social contract exists between companies and individual
members of society in which it operates (Shocker & Sethi, 1973:67). It is the social contract that
entitles the society to accounting information, as it needs such information to assess whether a
company's benefits outweighs its costs to the society (Gray, 1992:402). Depending on whether the
company's benefits outweighs its costs to the society or not, the society will decide whether to
renew or revoke the social contract (Deegan, 2006; 277), hence the information that is provided
has to be decision-useful.
3.4.4 Shift in societal expectations
For many decades, the society has relied on financial performance as the sole gauge of the
benefits expected from a company (Abbott & Monsen, 1979:511; Friedman, 1962:133; Patten,
1991:298). However, recent decades have witnessed changes to societal values, as the society no
111
longer confines its expectations to a good financial performance (Heard & Bolce, 1981:248;
Tinker & Niemark, 1987:84). Over and above a good financial performance, the society now
expects a company to respond to various social issues that are considered to be consequences of a
company's activities (Tinker & Niemark, 1987:85). With regard to the latter, the society expects a
company “to make outlays to repair or prevent damage to the physical environment, to ensure
health and safety of consumers, employees, and those who reside in the communities where
products are manufactured and wastes dumped, and to be responsible for the consequences of
technological employment and plant closings” (Tinker & Niemark, 1987:84).
3.4.5 Justification for the extension of decision-usefulness objective to non-financial decisions and
non-financial stakeholders
In consideration of the above-mentioned shift in expectations, the decision-usefulness objective,
which has in the past almost entirely focused on financial reporting for financial stakeholders,
cannot remain static (Koornhof, 1998:37). It has to evolve and change over time to reflect the new
societal expectations (Glautier & Underdown, 1986:03; UNCTAD, 1999:01). This requires that
accounting information and its objectives be flexible so as to adapt to the changing demands of its
users (Koornhof, 1998:37). Simply put, the accounting profession has to accept that non-financial
stakeholders too are entitled to accounting information to inform their decisions (De Villiers,
1998b:02) – only then will the decision-usefulness objective remain valid.
According to Dierkes and Antal (1985:30), the ultimate test for the usefulness of environmental
information is its impact on decision making. It is doubtful that the non-financial stakeholders
need environmental information from companies in order to make direct financial decisions (De
Villiers, 1998b:02). Environmental lobby groups for instance may need such information to
decide whether to launch a campaign against an “ungreen” company, institute a legal action or
even intervene in cases of gross environmental violation (De Villiers, 1998b:02; GRI, 2008:08).
Alternatively, such groups could need environmental information to decide whether to partner
with a company (GRI, 2008:09). Similarly, the ever growing environmentally conscious
employees may need environmental information when deciding the company to which they will
supply their labour (Charter, Peattie, Ottman & Polonsky, 2002:07; Deegan & Rankin, 1999:314;
Greening & Turban, 2011:456).
112
The growing number of green consumers may need environmental information to decide whether
to boycott a company's products or not (Charter et al., 2002:11; Deegan & Rankin, 1999:314;
Strandberg Consulting, 2009:08). Likewise, the media may need environmental information to
determine whether to name and shame a “ungreen” company or not (Charter et al., 2002:07;
Peiyuan, 2005:01). The government may need information to decide whether to withdraw an
operating licence or not, or even whether to enact new legislation or not (Charter et al., 2002:11;
Peiyuan, 2005:03). Equally, regulatory agencies may need environmental reports to decide
whether to institute a regulatory intervention (Peiyuan, 2005:16). The members of the local
community may also need accounting information to assess whether their personal and or group
rights and privileges have been reasonably well protected, and to decide whether to complain if
they are dissatisfied (Charter et al., 2002:11; Strandberg, 2008:03). They may also need
environmental information to decide whether they will support the continued operation of a
company within their local neighbourhood (Deegan & Rankin, 1999:314). The foregoing
demonstrates that the non-financial stakeholders also make decisions, and therefore they also need
decision-useful environmental information (De Villiers, 1998b:02).
Another argument that supports the extension of the decision-usefulness objective to non-financial
stakeholders is articulated by Cronje (2010:224), who argues that the usefulness of information
disclosed in the annual reports would be improved if it could benefit all users. He elaborates that
statutory disclosures primarily possess attributes of the accountability paradigm whereas the
discretionary disclosures generally possess attributes of the decision-usefulness paradigm (Cronje,
2010:231). In most countries, environmental reports are discretionary in nature (KPMG, 2010:08).
Therefore, according to Cronje (2010:231), the environmental reports do possess the attributes of
decision-usefulness paradigm and should be produced to inform the decisions of all users.
3.4.6 Application of decision-usefulness objective to non-financial decisions
Although the accounting conceptual frameworks have attempted to acknowledge the growing
number of stakeholder groups, their continued emphasis on financial decision-making is
inconsistent with the needs of the non-financial stakeholders (De Villiers, 1998b:02). The only
way therefore to restore the consistency without rejecting the decision-usefulness objective
entirely would be to expand the objective to all decisions, be they financial or non-financial (De
Villiers, 1998b:02). Considering that economic measures are in any case not always useful for the

113
purpose of environmental decision-making (Sagoff, 1990:26), it is the contention of this research
that the purpose of environmental reporting is to provide information that is useful to a wide range
of users in making decisions.
3.5 PARADIGMS OF DECISION-USEFULNESS THEORY
According to Kuhn (1962:162), a paradigm is an approach to knowledge advancement that adopts
particular theoretical assumptions, research goals and research methods. It assumes, defines and
interrelates the exemplars, theories, methods, and instruments that advance knowledge in a
particular discipline (Belkaoui, 1992:161). Simply put, a paradigm dictates the kind of research
that should be conducted, how such research should be conducted and delimits the kinds of
theories that are permitted (Kuhn, 1970: viii). Given the varying world views in accounting
research, a paradigm is important because it serves to define what should be studied, what
questions should be asked, how they should be asked, and what rules should be followed in
interpreting the answers obtained (Ritzer, 1975:15). Accordingly, this section discusses the two
paradigms that have been proposed to advance decision-usefulness accounting research – the
decision-models paradigm and the decision-makers paradigm (AAA, 1977:10–21; Bebbington et
al., 2001:418; Belkaoui,, 2004:343; Laughlin & Gray, 1988:334; Wolk et al., 2001:189).
3.5.1 Decision-models paradigm
The decision-models paradigm maintains that accountants (preparers) know what the decision-
makers really need and that it is these needs that should guide the content of the accounting
reports (Bebbington et al., 2001:418; Laughlin & Gray, 1988:334). This paradigm is a top-down
approach, where the company accountant decides upfront the decisions that users need to take and
the information needed to inform these decisions (Wolk et al., 2001:41). In recognition of the
practical and economic (cost/benefit) constraints involved in trying to provide all of the
information that all decision-makers might want, the paradigm adopts a one-size-fits-all approach
by assuming that the various classes of stakeholders have identical information needs (Deegan,
2006:13; Sterling, 1972:198). Accordingly, it does not require the decision-makers to be asked to
indicate the information that they want, but rather, it focuses on the types of information needed
for making particular decisions as perceived by the preparers (Kam, 1990:48). In this regard, its
proponents argue that the concern for assessing the information wants of users is of lesser

114
importance than the concern of ascertaining the users’ needs (Bebbington et al., 2001:422).
The premise that underlies this paradigm is that the users are not always adequately qualified to
determine their own needs, thus the information reported is based largely on accountants
normative determination of the users’ needs (Wolk & Tearney, 1997:39). The proponents of this
approach develop appropriate models that are based on a set of normative assumptions about the
goals, decisions and information needs of the users (Schoonraad, 2004:50). The models have well
specified information requirements that form their input data (Belkaoui & Jones, 1996:610). It is
this input data that is then prescribed for disclosure as it is deemed to be the accounting
information that meets the users’ needs (Kam, 1990:48).
Considering that accounting reporting aims at communicating information to users to enable them
to make decisions, a lack of consideration of their views on what information they need is
unacceptable and unforgivable (Alexander, Britton & Jorissen, 2007:147; Devine, 1960).
Accordingly, this paradigm is rejected as it counters the objective of this research which is to elicit
the views of the users regarding the decision-usefulness of environmental reports. The decision-
model paradigm is also rejected as its assumption that all users have identical information needs
negates the need to provide tailored information to suit specific user groups' needs (Deegan,
2006:13; Sterling, 1972:198). Hence this paradigm does not inform this study.
3.5.2 Decision-makers paradigm
In stark contrast to the decision-model paradigm, the decision-makers paradigm maintains that the
decision-makers themselves know best what information they want and that accounting should
provide the wanted information (AAA, 1977:10–21; Bebbington et al., 2001:418; Laughlin &
Gray, 1988:334). The main contention of the paradigm is that if information is desired, it must be
provided (Belkaoui & Jones, 1996:614; Wolk et al., 2001:44). The paradigm is therefore seen as a
bottom-up approach that incorporates the views of the users that are ignored by the decision-
model paradigm (Schoonraad 2004:50). Research that adopts this paradigm endeavours to
discover the accounting information that decision-makers want in order to prescribe it
(Bebbington et al., 2001:418; Deegan, 2006:12). The proponents of this paradigm employ two
approaches to discover the information that the decision-makers want namely; Security Price
Research (SPR) approach and Behavioural Accounting Research approach (BAR) (Laughlin &

115
Gray, 1988:335). The former entails drawing insights from the information effects on share price
behaviour on the capital market on which a company's shares are traded (Bebbington et al.,
2001:422). The latter, on the other hand, entails directly asking the users to indicate the
information that they want (Bebbington et al., 2001:418).
3.5.2.1 Security Price Research (SPR) approach
The SPR approach (aggregate market behaviour approach), largely based on the works of
Gonedes (1972:17) and Gonedes and Dopuch (1974:105–106), explores the aggregate information
wants of participants of the stock markets on which a company's shares are traded (Bebbington et
al., 2001:422; Laughlin & Gray, 1988:335). According to the approach, a stock market reaction,
evidenced by a movement in the share price as a result of release of public information indicates
that the information released is decision-useful and able to satisfy the information wants of the
users (Deegan 2006:12; Laughlin & Gray, 1988:338). On the basis of a stock market's reaction,
subsequent prescriptions can be made of the type of accounting information that should be
reported to the users (Deegan, 2006:13).
The SPR approach which has been extensively employed to investigate the stock market reaction
to disclosure of environmental information (Bettenhausen, Byrd & Cooperman, 2010; Blacconiere
& Patten, 1994; Freedman & Jaggi, 1986; Freedman & Patten, 2004; Htun, 2008; Jacobs, Singhal
& Subramanian, 2008; Lorraine, Collison, & Power 2004; Nagayama & Takeda 2006; Nuzula &
Kato, 2011; Ullmann, 1985), makes several assumptions regarding a stock market's reaction to the
disclosure of the information. Firstly, the approach assumes that the price changes that occur as a
result of release of environmental information indicate that the information released is decision-
useful (Deegan, 2006:12; Laughlin & Gray, 1988:338). This is based on a further assumption that
environmental disclosures have informational content, the value of which, can be measured
according to a stock market's reaction to the release of the information (Gonedes, 1972:12;
Laughlin & Gray, 1988:338).
Secondly, the approach assumes that the participants of the stock markets are the only decision-
makers, and that environmental information is only decision-useful if it evokes a market reaction
from the stock market participants (Deegan, 2006:13). Such a reaction is assumed to be an
indication that the investors are utilising the information when deciding whether to buy or sell a

116
company's shares, therefore it must be decision-useful (Deegan & Rankin, 1997:565). Thirdly, the
approach also assumes that a good environmental performance and disclosure thereof is rewarded
by the financial participants, whereas a bad performance and disclosure thereof is punished
(Blacconiere & Patten, 1994:357). Fourthly, the approach further assumes capital markets react
efficiently (efficient market hypothesis) and in unbiased manner to publicly available information,
therefore they can be used to evaluate the decision-usefulness of published information
(Bebbington et al., 2001:422; Deegan & Unerman, 2006:210; Laughlin & Gray, 1988:338).
Lastly, the approach assumes that human nature is rational, and that the stock markets are perfect
(meaning they have perfect competition and perfect information) (Deegan, 2006:10).
Notwithstanding the extensive research that has employed the SPR approach, this approach is
rejected in this study for the following reasons:
• Research that evaluates accounting information on the basis of whether it evokes a market
reaction ignores the possibility that there could be better information than the information
released (Deegan, 2006:13).
• Market reaction studies on environmental disclosure can be invalid and unreliable as other
disclosures such as those on profitability and earnings do also evoke market reaction of share
prices (Moneva & Ceullar, 2009:02). In fact many other contextual factors such as changes in
management structure, and the political climate also do affect share prices (Somoye, Akintoye
& Oseni, 2009:178). Therefore it may not be possible to isolate the market reaction to
environmental disclosure, from a reaction to other disclosures or changes in contextual factors
(Htun, 2008:13).
• Based on the SPR approach, the preparers cannot predict the decision-usefulness of
environmental information as the decision-usefulness or desirability of the same is only
assessable after the information has been disclosed and its effect on movement of share prices
observed (Laughlin & Gray, 1988:338).
• Research evidence has countered some of the assumptions of the SPR approach by indicating
that environmental reporting is not predominantly motivated by the wants of stock market
participants, rather it is motivated by the wants of the other stakeholders (Booth et al.,
1987:31; Mathews, 1987:161; Owen et al., 1987:169; Parker, 2005:846). Ironically, the SPR
approach ignores the needs of non-financial stakeholders as they are not market participants
(Parker, 2005:846). Similarly, the neo-classical economics assumptions such as efficient
117
market hypothesis, rational human behaviour (self-interest), perfect competition and perfect
information have been criticised for countering the principal concerns of environmental
reporting, which is motivated by market failure and desire to change the current practice
(Gray et al.,1995:51). Accordingly, these assumptions are not only seen as empirically
implausible, but also as highly offensive (Gray et al., 1995:52).
• The SPR approach is not suitable for this study as it investigates aggregate information wants
of all market participants, whereas this study, in recognition that the perception of decision-
usefulness is individualistic, investigates the environmental information wants for individuals
(Chan & Milne, 1999:265; Yekinni, 2008:20). Lastly, although some studies have revealed
that social and environmental information does influence financial behaviour (Epstein,
1991:01; Perks, Rawlinson & Ingram, 1992:43), other studies have contradicted this finding
(Cooper, 1988:179; Owen, 1992:139). Therefore the results of the studies that employ the
SPR approach tend to be inconsistent and/ or inconclusive (Owolabi, 2009:154; Parker,
2005:846; Rikhardsson & Holm, 2005:06). The approach is therefore under-theorised as it
begs too many important questions (Gray et al., 1995:51). For these reasons, this approach is
deemed unsuitable for this study.
3.5.2.2 Behavioural Accounting Research (BAR) approach
The BAR approach, largely based on the works of Bruns (1968:469–480), emphasises the
relevance to decision making of the information being communicated and the individual or group
behaviour caused by the communication of the information (Belkaoui, 2004:368). The approach
which recognises that accounting is not natural science, investigates how accounting as a human
science influences human behaviour (Belkaoui 2004:335). Therefore, accounting information is
assumed to be action oriented as its purpose is to influence action (behaviour) directly through the
informational content of the message conveyed (Belkaoui 2004:368 ).
Unlike the SPR approach which explores the aggregate information wants of participants of the
stock markets, the BAR approach investigates the information wants of individual users, or user
groups directly from the users themselves (Laughlin & Gray 1988:335). In stark contrast to the
decision-models approach, the BAR approach assumes that the users themselves are in the best
position to determine the type of information that will influence their decision-making actions or
behaviour (Bebbington et al., 2001:418; AAA 1977:10–21). Accordingly, the approach maintains

118
that the only way to discover information wants of users is to go and ask them directly to indicate
the information that they want (Bebbington et al., 2001:419). The observations made from the
users’ responses are then employed to provide insights that inform the prescription of what the
content of accounting reports should be (Deegan 2006:12).
3.6 A DETAILED DISCUSSION OF THE BAR APPROACH
According to this approach, if information is wanted by the users, then it must be provided
(Belkaoui & Jones 1996:614; Wolk et al., 2001:44). To discover the information wants of users,
the BAR approach typically employs questionnaire based surveys that request users to indicate the
type of accounting information that they want (Deegan 2006:12). Such surveys enable researchers
to assess the users' perceptions on the adequacy, usefulness, materiality and decision effects of the
information provided, among other aspects (Alexander et al., 2007:119). Alternatively, users can
be asked to rank various types of accounting information in order of perceived importance
(decision-usefulness) (Gray et al., 1995:50; Deegan & Rankin 1997:577). The resulting
intelligence from the questionnaire surveys and ranking studies is then used to prescribe the
information that should be reported to the users (Deegan 2006:12). Accordingly, the approach
seeks to improve the decision-usefulness of accounting information by relying on users' input
(Bebbington et al., 2001:419).
3.6.1 Prior research that has employed the BAR approach
Some researchers have extended the BAR approach and employed it in their capacity as users, to
gauge the decision-usefulness of the environmental reports produced (Ernst & Young 2007; Ernst
& Young, & Greenbiz 2013; KPMG 2013; KPMG 2011). Using the qualitative characteristics of
decision-useful information contained in the conceptual frameworks, the researchers have
employed content analysis to determine whether the environmental reports produced by the
sampled companies are relevant, reliable, comparable, understandable, timely and verifiable.
By contrast, other researchers have based their research on the view that content analysis studies
do not interrogate the users' perceptions (Campbell & Slack 2008:10; Day 1986:295).
Accordingly, they have employed questionnaire surveys to determine whether investors and other
financial stakeholders do require environmental information when making investment decisions,

119
and the type of information they require (Campbell & Slack 2008:10; Deegan & Rankin 1997;
Epstein & Freedman 1994; European Commission 2011b; Said et al., 2013). Yet, other researchers
have based their research on the view that non-financial stakeholders do have decisions to make,
and that their information needs are largely ignored (Deegan & Rankin 1997:566). Accordingly,
they have employed questionnaire surveys to determine whether the non-financial stakeholders do
employ environmental reports when making decisions and the type of information that is required
(Danastas & Gadenne 2006; European Commission 2011b; Hwang et al., 2013:178).
In an attempt to improve the decision-usefulness of environmental reports, some researchers have
employed the BAR approach using questionnaire surveys to determine the degree of satisfaction
of users regarding the quality of the environmental reports read (Barker 1998:12; Ho & Wong
2004:62; GRI et al., 2008:04). Some have taken this further by asking the users to propose
improvements that would enhance the decision-usefulness of the reports (Craig & Bailey 1987:54;
GRI et al., 2008:11).
Undoubtedly, most environmental reporting studies that have adopted the BAR approach have
been in the form of ranking studies in which different user groups are asked to rank various
accounting information in order of perceived importance in making decisions (Gray et al.,
1995:50). By so doing, the studies have compared the relative importance of environmental
information to that of other types of information such as social, social-economic, governance,
ethical and financial information (Belkaoui 1984; Benjamin & Stanga 1977; Chenall & Juchau
1977; Day 1986; Rowbottom & Lymer 2007; Stainbank 2006).
Yet other environmental reporting studies, having determined that environmental reporting was
deficient and unable to satisfy the users' needs, have employed the BAR approach to investigate
whether there is an expectation gap between users and preparers regarding the decision-usefulness
of the reports (Deegan & Rankin 1999; Macfarquar & Tooley 2009; Mitchell & Quinn 2005).
Specifically, these studies have compared the users' and preparers' perceptions to establish
whether there is a disparity in perceptions between the two groups regarding the relative
importance of various items contained in the environmental reports (Deegan & Rankin 1999;
Macfarquar & Tooley 2009; Mitchell & Quinn 2005).
120
3.6.2 Rationale for the selection of the BAR approach
In view of the similarity between the above studies, that have successfully employed the BAR
approach, and this study, the BAR approach has been adopted to inform this research. The
approach is also adopted because its central assumption that users themselves are in the best
position to determine the information that will influence them when making decisions seems
logical and lends a voice to non-financial stakeholder groups that have for long been ignored by
accounting research (Arrington 1990; Cooper & Shearer 1984; Grey et al., 1987; Mathews 1985;
Owen 1992). Besides, the approach has been selected as it renders itself well to the content
analysis and questionnaire survey methodologies that are employed in this study (Arnold &
Clinton 2008:20; Bebbington et al., 2001:419; Deegan 2006:12; Hibbitt 2004:306).
3.6.3 Criticisms of the BAR approach
The BAR approach proponents position that if information is desired, then it must be provided,
has been criticised for ignoring the practical and economic (cost/benefit) constraints involved in
providing all the information that may be desired by the numerous and diverse user groups
(Schoonraad 2004:50). In this regard, some critics have questioned whether the information that
the users might want is actually what they need (Laughlin & Gray 1988:338). Given the diversity
of the user groups of environmental information, the diverse decisions that they need to make,
their different and often competing wants of environmental information, meeting all their wants is
not only seen as a costly exercise, but also as a redundant one (Schoonraad 2004:50). Regarding
this criticism, the researcher contends that the proliferation of information technology has lowered
the cost of providing information and availed new tools that can enable a company to provide
multiple sets of information, tailored to the specific needs of each user group (ACCA &
CorporateRegister.com 2001:12; CERES & ACCA 2010:16; Scott & Jackson 2002:196).Therefore
the above-mentioned cost/benefit criticism is invalid in the modern business arena.
Also criticised is the assumption that the users themselves are in the best position to determine the
information that they want (Schoonraad 2004:49). Specifically, the critics argue that considering
the diversity of user groups of environmental reports, the users are not only not always adequately
qualified to determine their own needs, but also that their needs may be difficult to define (FEE
2000:10). This criticism is set aside by the researcher because users of environmental reports do
not require advanced knowledge of the rules of accounting reporting in order to suggest the
121
information that they want as these reports are explained freely, using ratios, graphs, common
words, narratives, average laypersons language and in a multilingual manner (Cronje 2010:229).
Furthermore, the users that are included in this study are knowledgeable and educated
representatives of the various stakeholder groups. Furthermore, as suggested by Cronje
(2010:232), the respondents will be facilitated in articulating their environmental information
wants.
Other critics of the BAR approach have lamented that asking the decision-makers to indicate their
preferred environmental information may not always reveal their true preferences, as there is a
discrepancy between the information that decision-makers say they want, and the actual
information that they want (Rikhardson & Holm 2005:02). Indeed, some decision-makers have
down-played the value of environmental information in questionnaire surveys, but have
nevertheless employed the information when making decisions as revealed in survey-based
decision experiments (Rikhardson & Holm 2005:03). Accordingly some critics have advocated for
the use of survey-based decision experiments, as opposed to questionnaire surveys, as they are
seen as objective and systematic (Rikhardson & Holm 2005:08; Yekinni 2008:16). Given that the
use of experiments to study human behaviour is considered as unethical as it necessitates the use
of control groups which may require imposition of some constraints on the human subjects (Black
1999:68), it is the contention of the researcher that experiments are unsuitable for this study.
Therefore the research assumes that the questionnaire surveys, if properly used, will reveal the
actual preferences of the users.
Having emerged recently, the BAR approach has also been criticised for being under-theorised,
mis-specified, and leaving many important questions unanswered ( Bebbington et al., 2001:422;
Gray et al., 1995:51; Porwal 2001:37). Critics claim that the BAR approach research is disjointed
as it consists of different studies that address different types of information, with limited linkages
between them, an indication of inability of researchers to build on each other’s insights (Deegan
2006:12). Furthermore, the BAR approach studies are unable to predict the desirability of certain
types of accounting information to the users, as they focus on users judgement and decision-
making needs, but ignore the mental process that produces the judgement and decisions
(Bebbington et al., 2001:422; Laughlin & Gray 1988:338; Winter 1986:431).
In response to these criticisms, it is the contention of the researcher that the BAR approach, as

122
rightly pointed out by the critics, is at an early stage of development and therefore more research
is required to advance the approach (Bebbington et al., 2001:422). As a qualitative research, this
study advances the BAR approach and contributes to the building of the theory behind the
approach, by providing answers to some of the questions that were previously unanswered and
providing some missing linkages that build on prior researchers' insights. It is also the contention
of the researcher that human behaviour is unpredictable, hence to expect a theory of human
behaviour to have perfect predictive ability would be naïve as no theory can fully explain or
predict human behaviour (Deegan 2006:22). Besides, the informational wants of users are
destined to change over time thus making the maturity of the BAR approach evasive (Alexander
et al., 2007:119; Bebbington et al., 2001:422; Deegan 2006:294; Koornhof 1998:37; Porwal
2001:51). In addition, failure of a particular study to successfully employ the BAR approach may
not itself provide a concrete basis for rejecting the approach as such a failure may be due to flaws
in the methodology employed in the particular study (Deegan 2006:23). For these reasons, the
BAR approach, may not always provide consistent and conclusive results at all times.
With respect to the criticism that the BAR approach ignores the mental process that produces
judgements and decisions, the researcher contends that other theories in behavioural science, most
especially in the field of psychology, are better placed to address such processes (Belkaoui
2004:373). Accordingly, the complexities of the mental process are beyond the scope of decision-
usefulness theory as applied to this study.
3.7 GENERAL CRITICISMS OF THE DECISION-USEFULNESS THEORY
Notwithstanding the general acceptance of the decision-usefulness objective as the primary
objective for accounting by all accounting conceptual frameworks, the decision-usefulness theory
as a whole has been widely criticised (Abu-Baker & Karim 1997; Buys 2010; Staubus 2000). One
such criticism relates to the normative nature of the theory that neither clarifies a logical
accounting foundation nor describes the current accounting practices (Deegan 2006:23; Staubus
2000:337). Simply put, the theory is conceived as a poor description of the current accounting
practice as it does not logically explain the selection of particular accounting techniques (Abu-
Baker & Karim 1997:416). The critics argue that such a selection is not made to provide the
stakeholders with decision-useful information, but rather on the basis of its economic
consequences to managers and stakeholders (Deegan 2006:11). Accordingly, the theory ignores
123
the agency relationship that legally exists between shareholders and managers, but that does not
exist between the other stakeholders and the managers (Hibbitt 2004:124). Therefore, it fails to
explain management's reluctance to disclose more than is perceived as good for the enterprise or
the reluctance by managers to provide information to non-financial stakeholders, who they see as
not having contributed to the cost of producing the reports (Abu-Baker & Karim 1997:416).
The critics further argue that the theory fails to recognise the varying stakeholder powers and the
tactics employed by companies to legitimise their activities, which include reporting to manipulate
the users (Gray et al., 1995:53; Lindblom 1994:02). In fact, the critics argue that this theory is
subjective as it is based on personal opinion on how accounting reporting should be practiced
(Alexander et al., 2007:119; Deegan 2006:12).
In relation to these criticisms, it is the contention of the researcher that decision-usefulness theory
is a normative theory, divorced, as it rightfully should, from practical application in the real world,
as it focuses on how accounting should be and not on how it is. Accordingly, like any other
normative theory, it cannot be validated by empirical observation to determine whether it reflects
the actual accounting practice as it is not intended for this purpose (Deegan 2006:12; Islam
2009:48). Besides, studying the extant practice concentrates on the status quo, which is
reactionary in attitude and thus does not provide a basis on which the current practice can be
evaluated and future improvements made (Gray et al., 1987:66). Therefore a normative approach,
embraced by the decision-usefulness theory, is required to bring about radical changes to the
current practice, which has for a long time ignored the decision-making needs of non-financial
stakeholders (Deegan 2006:12).
With regard to the criticism related to the agency relationship, it is the contention of the researcher
that a social contract exists between managers and the other stakeholders which entitles those
stakeholders to environmental reports (Deegan & Rankin 1997:567; Gray et al., 1988:09; Mathew
1993:26). Accordingly, the managers should not be reluctant to provide information to the non-
financial stakeholders as these stakeholders also incur costs in the form of externalities such as air
pollution and noise pollution, which entitles them to environmental information (Cespa & Cestone
2007:04; Kisenyi 1999:08). Therefore all stakeholders whether they are shareholders or not,
should be treated equally and provided with decision-useful information (De Villiers 1996:18).
Besides, the researcher concurs with Gray et al.,'s (1995:52) assertion that the notion of self-

124
interest of managers when reporting on environmental issues is not only empirically implausible,
but it is also highly offensive.
Another criticism of the decision-usefulness theory is that it ignores the accountability objective
of environmental reports (Kisenyi 1999:04). Simply put, it fails to address the issue of rights to
information by all stakeholders as only certain recipients of accounting information are assumed
to have rights to information, namely, those who make decisions directly on the basis of
information reported (Abu-Baker & Karim 1997:416). Accordingly, the theory ignores the
importance of environmental reports as a means of accountability in a democratic society in which
all stakeholders have an equal right to information (Kisenyi 1999:05). Thus, it totally ignores the
stakeholders that do not use environmental reports but nonetheless are affected by the actions of
those who do use them (Abu-Baker & Karim 1998:416). In so doing, the theory disregards the
accountability needs of the non-financial stakeholders.
With regard to the above-mentioned criticism, it is the contention of the researcher that the
decision-usefulness objective has encapsulated, rather than replaced, the accountability objective
(FASB 2010:12; Schoonraad 2004:65). Thus the theory does not conflict with the accountability
theory as information that is useful in making decisions is also useful in assessing whether a
company has discharged accountability to stakeholders (FASB 2010:12; IASB 2008:29).
Accordingly, information that is irrelevant, unreliable, incomparable, unclear, untimely and
unverifiable is unlikely to discharge accountability (IBDO Kendalls & Orion 2002:01; TBCS
1991:01). Besides, the decision-usefulness theory has raised the visibility of non-financial issues
such as environmental concerns which has improved accountability by giving a voice to non-
financial stakeholders who are typically underprivileged in accounting research (Grey et al.,
1995:51). In sum, bearing the above discussion in mind, and factoring in the objectives of this
research, the decision-usefulness theory is deemed to be the most appropriate theory for this study.
3.8 CHAPTER SUMMARY AND CONCLUSION
This chapter provided an overview of the theoretical perspectives that have been commonly used
in the voluntary environmental disclosure research, and introduced the theoretical perspective
utilised in this research – the decision-usefulness theory.
125
Accounting theory is important in order to understand and evaluate the environmental reporting
practice, and to prescribe what it should be. No single accounting theory has been universally
accepted. Instead numerous theories, both positive and normative have been employed in
environmental reporting research. These include the decision-usefulness theory, agency theory,
accountability theory, stakeholder theory and legitimacy theory. Considering that different theories
are suitable for performing different functions, an appropriate theory should be selected by
critically evaluating its suitability for the intended function, its underlying logic, assumptions and
research evidence that support it. The selection will also be partly influenced by a researcher's
value judgement.
For this study, the agency theory was rejected due to its assumptions that contradict the key
concerns of environmental reporting and disregard for non-shareholder stakeholders. Although
considered insightful, the stakeholder theory and legitimacy theory were rejected as they focus
mainly on justifying why companies disclose environmental information, from a company's
perspective, and not on, as is the main aim of this research, determining the users' perception of
decision-usefulness of environmental reports. For the same reason, and partly due to the fact that
the information needs of non-financial stakeholders have evolved from accountability needs to
decision-making needs, the accountability theory was also rejected. This theory was also rejected
based on the argument that decision-usefulness theory has encapsulated the accountability theory.
Appropriately, the decision-usefulness theory was selected to inform this study as it is in line with
the primary objective of this research which is to determine the decision-usefulness of
environmental information to the users of environmental reports. The theory, which is based on
the premise that the primary purpose of accounting information is to satisfy the decision-making
information needs or wants of users, posits that environmental reports are prepared because
different stakeholders require information to support their decisions. Therefore it ascribes
particular types of information to particular classes of users on the basis of their assumed
decision-making needs.
The decision-usefulness theory was also selected as it renders itself well to the content analysis
and questionnaire survey methodologies adopted in this study and because of its normative nature
that questions the status quo and prescribes how environmental reporting should be practiced. The
theory was also selected because its assumption that users know the information that they want

126
and that the information wanted by users should be provided appears logical. Furthermore, prior
evidence seems to support the notion that non-financial stakeholders also need environmental
reports to inform their decisions.
Although the accounting conceptual frameworks and other authoritative pronouncements almost
always prioritise the financial stakeholders, the pronouncements acknowledge the existence of
other users such as employees, customers, governments, environmental lobby groups, as well as
the general public. Similarly, empirical evidence has also identified non-financial stakeholders as
users of accounting information. Given that the society no longer relies only on financial
performance to gauge the performance of a company, but rather on financial, social and
environmental performance as well, the decision-usefulness objective can no longer focus only on
financial reporting to financial stakeholders. It has to evolve and change over time to reflect the
new societal values. This requires an acceptance that non-financial stakeholders too require
accounting information to make decisions.
However, non-financial stakeholders do not need environmental information from companies to
make financial decisions, instead they need it to make non-financial decisions such as whether to
supply their labour or not, whether to launch a campaign or a complaint against a company or not,
whether to boycott a company's products or not among other decisions. Therefore the only way to
ensure validity of the decision-usefulness objective in the changed business arena is by expanding
it to all decisions. Therefore, this thesis contends that the purpose of environmental reporting is to
provide information that is useful to a wide range of users in making decisions.
Decision-usefulness studies have been conducted in two paradigms, namely; the decision-models
paradigm and the decision-makers paradigm. The studies that adopt the decision-models paradigm
assume that the accountants (the preparers) know best what the decision-makers really need, and
that the information needs are identical for all users. This approach is rejected as it ignores the
users input and the diversity in information needs among different users. By contrast, the
decision-makers paradigm assumes that the decision-makers themselves know best the type of
information that they want and that such information should be provided. Research that adopts
this paradigm endeavours to discover the accounting information that decision-makers want in
order to prescribe it. To discover the information that the decision-makers want, this paradigm
employs two approaches namely; the SPR approach and the BAR approach.
127
The SPR approach draws insights from the information effects on share price behaviour on the
capital market. The approach assumes that if the security market responds to information through
price changes that occur around the time of the release of particular information, then that
information must be decision-useful and therefore is wanted. Therefore, according to this
approach, accounting information is only decision-useful if it evokes a market reaction on share
prices.
Given that the SPR approach ignores the possibility that there could be better information than
that which evokes a market reaction, it is rejected for the purposes of this research. The approach
is also rejected as it can result in invalid, inconsistent, inconclusive and unreliable conclusions as
other types of disclosures too do evoke market reaction. Hence it is not possible to isolate the
market reaction caused by environmental information from that caused by other types of
disclosures. The approach is also rejected as it cannot predict the decision-usefulness of
information before such information is disclosed. Furthermore, the approach only caters for the
aggregate needs of financial participants, whereas the perception of decision-usefulness of
environmental reports is individualistic and mostly motivated by the needs of non-financial
participants. Besides, its economic assumptions in the context of environmental reporting are not
only seen as empirically implausible, but also as highly offensive.
By contrast, the BAR approach assumes that the user, and not the preparer is in the best position
to determine the information that will influence their decision-making actions or behaviour.
Therefore the only way to discover information wants of users is to ask them to directly disclose
the type of information that they want. Insights from such disclosures are then employed to inform
the choice of the content of accounting reports. To discover the information wants of users, the
BAR approach typically employs questionnaire based surveys or ranking studies where users are
asked to rank various types of accounting information in order of perceived importance. The
resulting intelligence is then used to prescribe the information that should be reported to the users.
In view of the objectives of this research, and bearing in mind that prior research with similar
objectives had successfully employed the BAR approach, this approach was adopted for this
research. The approach was also adopted because it’s central assumption that users themselves are
in the best position to determine the information that will influence their decision-making actions
or behaviour seems logical and provides a voice to all stakeholders, and not just the financial
128
stakeholders. Besides, the approach renders itself well to the content analysis and questionnaire
survey methodologies that are employed in this study.
Despite the many favourable aspects of the BAR approach, it has been criticised for ignoring the
constraints involved in providing all the information wanted by diverse decision-makers. In the
wake of advancement in information technology, this criticism is dismissed. Secondly, the
assumption that the users themselves are in the best position to determine the information that
they want has also been criticised. This criticism is however dismissed as environmental
information is explained freely and the users can be facilitated. Therefore they do not require
advanced accounting knowledge to be able to suggest the information that they want. Also, the
critics’ suggestion that survey experiments should be used to determine the true preferences of
users was dismissed due to the unethical nature of experiments if conducted on human beings.
Instead, this study employs closed-ended questionnaires and selects educated and knowledgeable
respondents to avoid the criticism about subjectivity of users. In response to the criticism that the
BAR approach research is under-theorised and disjointed, this research will help bridge the gap in
literature and contribute in building the theory behind the BAR approach by providing some
missing linkages that build on prior researchers' insights.
With regard to the criticism that the BAR approach research ignores the mental processes that
produce judgement and decisions, the researcher contends that other theories in behavioural
science, in the field of psychology are better placed to address such processes. Accordingly, the
complexities of the mental processes are beyond the scope of decision-usefulness theory and the
BAR approach in particular, as applied to this study.
The criticism of decision-usefulness theory has not been limited to the specific approaches, but
has also been extended to the theory in general. Given its normative nature, the theory has been
conceived by some critics as a poor description of the current accounting practice. This criticism
is dismissed because a normative theory should be divorced from practical application, given its
focus on how accounting should be and not on how it is. Besides, a normative approach is
required to change the status quo and provide a basis on which the current practice can be
evaluated and future improvements made. The criticism that decision-usefulness theory ignores
the agency relationship and reluctance by managers to disclose information not in their interest is
dismissed on the basis that a social contract exists between companies and other stakeholders.

129
Therefore the managers should not be reluctant to provide information to all the stakeholders as
they are all equally entitled to information.
Regarding the criticism that the decision-usefulness objective ignores the accountability objective
of environmental reporting, it is the contention of the researcher that the decision-usefulness
objective has encapsulated, rather than replaced the accountability objective. Therefore
information which is decision-useful will also discharge accountability.
In conclusion, although the decision-usefulness theory was selected to inform this study, the
theory, like any other theory in social sciences, is an abstraction of reality. Considering that the
choice of one theory in preference to another is based on particular value judgements of a
researcher, it would be naïve to expect that this theory, or any other theory on human behaviour,
will assess perfectly the types of information that the users actually need. This is because the
perceptions of one researcher regarding information needs will most probably vary from another
researcher's views about information needs. Nevertheless, this theory provides a framework which
can assist a researcher to make sense of the current reporting practices, evaluate those reporting
practices and enable a researcher to suggest improvements to the reporting practice – to what it
should be.
The following chapter will present a review of the prior literature relevant to this research.
Chapter 4 proceeds with a review of content analysis studies conducted to determine the decision-
usefulness of the environmental reporting practices. This will be followed by a review of studies
conducted to determine the informational needs of users of environmental reports as well as those
conducted to determine the extent to which users read the reports and whether they employ the
reports when making decisions. Next, a review of the studies conducted to determine the degree of
satisfaction of users with regard to the decision-usefulness of the environmental reports will
follow, including those studies that elicit suggestions from users on how the reporting practice
could be improved. The section that follows will then review the ranking studies conducted to
compare the relative importance of environmental information to that of other types of
information. This will be followed by a review of studies conducted to determine whether there is
an expectation gap between preparers and users of environmental reports with regard to the
decisions-usefulness of the reports.
130
CHAPTER 4
PRIOR RESEARCH ON THE DECISION-USEFULNESS OF
ENVIRONMENTAL REPORTS
4.1 INTRODUCTION
The central aim of this chapter is to provide an overview of the prior research conducted on
decision-usefulness of environmental reports. In so doing, this chapter identifies some significant
gaps in the literature on the decision-usefulness of environmental reports within the context of
both the developed and developing countries.
This chapter proceeds with a review of the key content analysis studies conducted to evaluate the
decision-usefulness of environmental reports in section 4.2. The prior studies on users' perception
of their information needs, the extent to which they read and employ environmental/sustainability
reports in decision-making, their level of satisfaction with the quality of the reports, and the
perceived relative importance of the reports when compared to other reports are reviewed in
section 4.3. This is followed by the key studies conducted to determine whether there is an
expectation gap between preparers and users with regard to the decision-usefulness of
environmental/sustainability reports in section 4.4. Section 4.5 then provides the research
questions that have remained unanswered in the prior literature. The summary and conclusion are
provided in section 4.6.
4.2 CONTENT ANALYSIS STUDIES THAT EVALUATE THE DECISION-USEFULNESS OF
ENVIRONMENTAL REPORTS
Using content analysis methodology, researchers have, in their capacity as users of
environmental/sustainability reports, analysed and evaluated the decision-usefulness of the reports
produced by companies in various countries. This section reviews their studies, conveniently
grouped into two; those conducted in the 1990s and those conducted after 2000. These have
further been classified according to whether they were conducted in a single country or multiple
countries.

131
4.2.1 Content analysis studies conducted in the 1990s
4.2.1.1 Single country studies
In a study designed to evaluate the environmental information contained in the annual reports of
30 companies in the UK, Harte and Owen (1991:51) found that little information was divulged in
the reports, as most contained information on the general philosophy of environmental issues
rather than a detailed account of the environmental impact of companies. Instead of providing
audited comparative information with details about compliance with legal requirements, most
reports focused only on positive disclosures, omitting the negative ones (Harte & Owen, 1991:51).
Accordingly, most reports had increased coverage of environmental issues in the unaudited
sections of the annual report. Resultantly, the environmental information disclosed in annual
reports was unreliable and unverifiable, as it did not reflect a serious and genuine commitment to
tackle green issues, instead it was merely a public relations exercise (Harte & Owen, 1991:51).
The limited sample of 30 annual reports analysed renders the generalisability of its findings to all
companies in the UK weak. Besides, the study covered a short period of one year, ending June
1990.
Subsequently, in a similar study, Niskala and Pretes (1995) analysed the changes in environmental
information contained in the annual reports published in 1992 and 1997, of 75 of the largest
Finnish companies from environmentally sensitive industries. Consistent with Harte and Owen
(1991) findings, they found a significant increase in the amount of qualitative information
provided, but the quantitative information remained static, and relatively less (Niskala & Pretes,
1995:457). Again, most disclosures were general in nature and primarily remained focused on
positive information with a limited disclosure of negative information. However, the study only
focussed on 75 of the largest corporations from the most environmentally sensitive industries, and
ignored smaller companies and companies from lesser environmentally sensitive industries.
Furthermore, it only evaluated the environmental content of the annual reports of two years, 1992
and 1997. Thus, the generalisability of its findings to all Finnish firms and to other years is
doubtful.
In a related study designed to overcome the generalisability problem, Gamble, Hsu, Kite and
Radtke (1995) investigated the quality of environmental disclosures in 10-K reports and annual
reports for 234 companies from 12 environmentally sensitive industries from 1986 to 1991.
132
Gamble et al., (1995:293) found a significant increase in environmental disclosures, especially in
the 10-K reports. They also noted that companies from the most sensitive industries provided the
highest quality of disclosures. Notwithstanding the increase in disclosures, their overall quality
remained disappointingly low (Gamble et al., 1995:293). However, most reports analysed in this
study were produced in the 1980s, a period when environmental reporting was still at an
embryonic stage. In addition, the study only focused on the environmentally sensitive sectors and
did not specify the aspects of report quality that it examined.
In Australia, Deegan and Gordon (1996) reviewed the environmental disclosures of 197
companies from 50 different industries, in the annual reports produced in 1991. Consistent with
other studies (Harte & Owen 1991; Niskala & Pretes, 1995), Deegan and Gordon (1996:187)
found that the disclosures made were generally limited to qualitative disclosures with a majority
of companies reporting positive, self-laudatory information, with little or no negative information.
Unlike Gamble et al., (1995), they found that companies from environmentally sensitive
industries provided more positive environmental disclosures than their counterparts in the lesser
sensitive industries, and that the lack of objectivity seemed to increase with the degree of
environmental sensitivity of an industry (Deegan & Gordon, 1996:187). Deegan and Gordon
(1996:187) further noted that the environmental disclosures in Australia were typically low with
an average of 186 words for the sampled companies. They concluded that, voluntary
environmental disclosures in the annual reports in Australia, did not provide reliable informative
information, and predicted that in an unregulated environment, the Australian companies will not
be objective in their environmental reporting (Deegan & Gordon, 1996:187). However, this study
focused on the annual reports of only the year 1991.
In all the above cited studies, it is possible, though not probable, that all the companies studied
had only positive environmental information to disclose. With this in mind, Deegan and Rankin
(1996), examined the annual reports of 20 Australian companies, known ex ante to have negative
information to disclose, given that these companies had been successfully prosecuted for violation
of environmental laws. Deegan and Rankin (1996:52) found a significant increase in reporting of
favourable environmental information in the year in which the companies were proved guilty.
To further confirm their findings, Deegan and Rankin (1996:52) also analysed the environmental
disclosures in annual reports of a matched sample of 20 companies not prosecuted. They found

133
that those prosecuted provided a significantly greater amount of positive disclosures than their
counterparts not prosecuted (Deegan & Rankin, 1996:52). Still, both the prosecuted and non-
prosecuted companies provided significantly greater amounts of positive environmental
information than negative information (Deegan & Rankin, 1996:52), which concurs with the
findings of other researchers (see Harte & Owen, 1991; Deegan & Gordon, 1996; Niskala &
Pretes, 1995). Disappointingly, only two of the prosecuted companies reported on the existence of
a proven environmental offence (Deegan & Rankin, 1996:52). Ironically, some of the companies
that had not disclosed their prosecutions, provided details of the environmental awards they had
received for particular sites of their business (Deegan & Rankin, 1996:52). However, this study
analysed a limited sample of annual reports (40), thus its findings are not generalisable to all
Australian companies.
4.2.1.2 Studies conducted in multiple countries
One shortcoming of the above-mentioned studies is that they were limited to the context of a
single country, despite the fact that environmental reporting was by then a global phenomenon. In
a clear departure from the single country studies, Guthrie and Parker (1990) compared the social
disclosures (environmental, energy, human resources, products, and community involvement) of
50 of the largest companies in the USA, the UK and Australia, contained in the annual reports
published in 1983. The mean corporate social disclosures in Australia (0.7 pages) were found to
be relatively low when compared to the USA (1.26 pages), and the UK (0.89 pages) (Guthrie &
Parker, 1990:59).
Furthermore, Guthrie and Parker (1990:59) found that the highest level of negative environmental
disclosures were reported by companies from the USA (22%), followed by the companies from
the UK (2%), and then the Australian (1%). As expected, most of the negative news was found in
the audited sections of the annual reports whereas the positive news was mostly reported in the
voluntary sections of the annual reports (Guthrie & Parker, 1990:59). However, this study
examined social disclosures of one year only (1983), as such it does not offer insights on the
reporting trends. Besides, annual reports on which the study was based are dated and remotely
reflect the current environmental reporting practices.
One common observation that can be made from all the afore-mentioned studies is that they all

134
focused on annual reports. Given the emergence of alternative media of disclosure of
environmental information such as stand-alone sustainability and environmental reports, it is
probable that a different picture could have emerged, had the above cited studies taken into
account the environmental disclosures reported via the alternative media. In a series of studies
designed to provide an unprecedented insight into the national, global and industrial
environmental reporting trends, KPMG (1999, 1996, 1993) analysed on a triennial basis, the
contents of environmental reports, health safety and environmental reports, as well as the annual
reports of the top 100 national companies in several countries. The latter study (KPMG, 1999),
was expanded to include the largest 250 multinational companies. KPMG (1999, 1996, 1993)
found a dramatic increase in the number and volume of the annual environmental reports
published, with a few companies publishing the reports bi-annually, to enhance the timeliness of
their reports.
To enhance the relevance of their environmental reports, companies increasingly invited
stakeholders to participate in their reporting initiatives to better their understanding of the
stakeholders' concerns (KPMG, 1999, 1996, 1993). Similarly, companies increasingly adopted an
inclusiveness approach by widening the scope of their reports to cover social issues in order to
increase the relevance of their reports to a wider audience (KPMG, 1999:19). Moreover, a few
companies combined their environmental, social and financial reports to provide a complete all-
rounded picture of their performance (KPMG, 1999:11). Such a combination required them to
converge their administrative and environmental registration systems, by combining financial
expertise with their environmental expertise, in a manner that also enhanced the reliability of their
reports (KPMG, 1999:05).
Increasingly, most companies were quantifying their environmental disclosures, and had reported
on their progress on prior years' targets, and prior years' reports in a manner that enhanced
comparability and clarity of their reports (1999, 1996, 1993). To further enhance the reliability of
their reports, companies increasingly reported their negative information, certified their EMS or
had plans to do so, and had progressively adhered to their sector-specific codes of conduct
(KPMG, 1999:19). Most importantly, an increasing percentage of companies undertook
independent assurance of their environmental reports using large reputable advisory and
consulting firms (KPMG, 1999, 1996, 1993).

135
Notwithstanding the afore-mentioned developments, KPMG (1999, 1996, 1993) also found
several weaknesses that undermined the decision-usefulness of the reports produced. In particular,
the assurance levels remained relatively low over the research period (15% in 1996 and 18% in
1999) (KPMG, 1999:22). Worse still, the verification statements were of poor quality and varied
significantly in their scope of assurance, the criteria employed and levels of assurance provided
(KPMG, 1999:26). As such they could not be relied upon by readers to guarantee the reliability of
the reported data and information. In addition, verification statements often contained caveats to
protect the verifiers against potential liability, and had opinions or recommendations that appeared
to be outside the scope of the terms of engagement of the assurer (KPMG, 1999:25). The
reliability of the reports was further undermined by the low quantification of contentious
disclosures such as costs, accidents and incidents when compared to the positive disclosures
(KPMG, 1999, 1996, 1993). In addition, the comparability of the reports was impaired by
significant variation in the levels of environmental disclosure and assurance rates across different
sectors and countries (KPMG, 1999, 1996, 1993).
Though informative, the KPMG, (1999, 1996, 1993) studies did not employ any theory to
conceptualise the environmental reporting practices observed. Therefore, they could not
comprehensively and persuasively describe, evaluate, or even prescribe suitable environmental
reporting practices, as they lacked depth. In addition, they were conducted by a leading advisory
firm with vested interests in environmental consultancy and verification, and thus they can be
perceived as a mere marketing tool because they lacked academic impartiality. Furthermore, they
covered a wide-range of issues with a primary emphasis on trends in the quantity of
environmental disclosures, as opposed to entirely focusing on the decision-usefulness of such
disclosures.
One common aspect in all the above-mentioned studies is that they were conducted during the
1990s, more than 12 years ago. Accordingly, these studies are outdated and were conducted before
the emergence of most reporting guidelines and assurance standards. This means that the reports
analysed remotely reflect contemporary reports, and this could render the above findings invalid
at present.

136
4.2.2 Content analysis studies conducted after 2000
4.2.2.1 Studies conducted in a single country
In a Japanese study, Institute for Global Environmental Strategies (IGES) (2002) analysed the
comparability of environmental reports of 11 Japanese companies from three industry sectors
(automobile, beer brewery and chemicals), published in 2000 and 2001. IGES (2002) found
differences in the comparability of environmental disclosures of companies in the three industry
sectors studied. Specifically, the environmental disclosures of the automobile sector were found to
be incomparable as they varied widely in content, and were inconsistent from one company to
another (IGES, 2002:06). This was because companies from the sector employed dissimilar units
of KPIs and hardly maintained numerical data for their entire production process. In addition, they
did not track changes of their numerical data across time, and had unstandardised flow charts of
waste processing and material flow, which rendered the charts incomparable (IGES, 2002:08).
Besides, there were differences in production processes, terminologies used, and the companies in
the sector did not always identify all their business sites and affiliates covered by the
environmental disclosures (IGES, 2002:09).
Similarly, the environmental reports of companies from the chemical sector were found to be
incomparable as these companies handled a wide range of chemicals and manufactured dissimilar
types of products (IGES, 2002:13). In addition, most companies in the sector did not disclose
critical numerical KPIs, and when they did, the data was too aggregated and dissimilar to be
meaningfully comparable (IGES, 2002:14). Furthermore, most companies in the sector did not
clarify the extent of coverage of factories and sites in their reports and neither did they use charts
to disclose their environmental impact per unit produced (IGES, 2002:13). Where charts were
provided, they lacked vital information to enable interpretation. Nevertheless, the most chemical
sector companies tracked their emissions across time, and had a few comparable company-wide
disclosures (IGES, 2002:16). In general however, most of their parameters were incomparable.
In stark contrast to the two sectors discussed above, the reports of companies from the beer
brewery sector were comparable (IGES, 2002:10). This is because all the companies had virtually
identical material flow charts with data on environmental impact for various parameters, except
on the degradation of the quality of water (IGES, 2002:11). In addition, they used similar
performance indicators (IGES, 2002:11). Notwithstanding the above findings, IGES (2002)
137
observed a general improvement in the comparability of the reports prepared which they attributed
to reporting guidelines that had been introduced in 2001. A major draw-back of this study was the
ad hoc and limited nature of the sample size of eleven companies, from three sectors it employed.
Accordingly, the findings of the study cannot be generalised to all Japanese companies in all
sectors. Besides, the study did not evaluate the other aspects of decision-useful environmental
information such as relevance, reliability, verifiability, timeliness and clarity.
To avoid the generalisability problem such as the one noted in the above studies, Nik Ahmad and
Sulaiman (2002) analysed the amount and type of environmental disclosures for the year 2000, in
the annual reports of the largest and listed top 200 companies from eight industries in Malaysia.
Consistent with prior studies (Deegan & Gordon, 1996; Deegan & Rankin, 1996; Harte & Owen,
1991; Niskala & Pretes, 1995), Nik Ahmad and Sulaiman (2002:13) found that the environmental
disclosures in the annual reports were qualitative, general, public-relations driven and mostly self-
laudatory in nature.
Nik Ahmad and Sulaiman (2002:13) also found that the environmental disclosures varied widely,
with no uniformity in the format and presentation, and that they were limited in volume, ad hoc in
nature and scattered all over the report, in a manner that undermined their comparability. A key
limitation of this study was its focus on the annual reports of a single year (2000). Furthermore,
the study is dated as it was conducted more than 10 years ago. Accordingly, the applicability of its
findings at present is doubtful.
One common aspect in all the above-cited studies is their universal focus on annual reports. In
recognition that only a few studies had investigated the use of the Internet for environmental
reporting, Chatterjee and Mir (2008), explored the status of environmental reporting on websites
by Indian companies. Using a sample of the largest 39 Indian companies, Chatterjee and Mir
(2008) initially examined the accessibility and the extent of environmental information disclosures
on the companies' websites. They then investigated the extent of environmental information
disclosure in the annual reports of the same companies for 2003 to 2004, as availed on the
companies' websites.
Chatterjee and Mir (2008:01) found that most companies had provided more environmental
information on their websites than in their annual reports, but the information provided on the

138
websites was incomplete and incomparable. In concurrence with Nik Ahmad and Sulaiman's
(2002) findings, most disclosures in the annual reports analysed by Chatterjee and Mir (2008:25)
were narrative in nature, incomparable, unreliable and unclear. In agreement with the findings of
other studies (Deegan & Gordon, 1996; Deegan & Rankin, 1996; Harte & Owen, 1991; Niskala &
Pretes, 1995), none of the companies in Chatterjee and Mir's (2008:26) study divulged any
negative information and only a few companies discussed compliance with external standards, or
the results of their environmental audits. Nonetheless, Chatterjee and Mir (2008:20) found that the
information disclosed by most companies was easily accessible, just two clicks away from the
home page (at level 2). Chatterjee and Mir (2008:20; 26) concluded that the environmental
disclosures in the annual reports were mainly for public relations purposes, hence confined to the
unaudited sections of the annual reports. However, their findings were not generalisable to all
companies in India due to the limited sample size they employed.
In another Internet based study conducted in Australia, Lodhia (2006) employed media richness
theory to investigate the use of the websites for environmental information communication by 14
mining companies (eight multinationals and six national) in Australia. Lodhia (2006) analysed the
websites of the companies for two time periods, July and November 2003. Unlike the findings of
Nik Ahmad and Sulaiman (2002), all the companies investigated in Lodhia's (2006:81) study had
a separate section for environmental issues on their websites. For the eight multinational
companies included in the study, the environmental information communicated was on their
global operations (aggregated), thus specific information on Australia was not always accessible
(Lodhia, 2006:81). The Lodhia (2006:82) further found that the information disclosed was hardly
updated, hence undermining the timeliness of the information. Similarly, the use of animated and
multimedia tools was rather limited (Lodhia, 2006:82). By contrast, most companies used internal
hyperlinks and menus quite extensively to distinguish between summarised and detailed
information, as well as to integrate different types of information, in order to make it more
accessible to different stakeholders (Lodhia, 2006:83). Almost all companies employed the PDF
format which was hardly interactive, whereas only a few companies provided a sustainability
report portal, even fewer reported in more than one language (Lodhia, 2006:83).
Furthermore the information was not tailored for the needs of different stakeholders, neither did
the websites have software to trace and manage the stakeholders' usage of the web (Lodhia,
2006:84). Although almost all companies provided search facilities via search engines, menu-

139
based contents and sitemaps to ease the accessibility of desired information, analytical tools were
not utilised by any of the companies and this denied the users an option to manipulate the
environmental information to suit their needs (Lodhia, 2006:85).
Despite the provision of automatic feedback forms by some companies, most sought feedback on
the website or corporate issues rather than specifically on the environmental issues (Lodhia,
2006:86). In addition, the use of electronic surveys on environmental issues was not evident on
the websites. Nevertheless, two way communication was made possible via email provisions
made available by most companies, but the emails were not necessarily in the context of
environmental information (Lodhia, 2006:86). Moreover, none of the companies utilised
discussion forums, bulletin boards or chat rooms for stakeholder engagement even though the
website technology was well suited for this role (Lodhia, 2006:86). In general, companies did not
utilise the full potential of their websites (Lodhia, 2006:84). However, Lodhia’s (2006) study is
fairly dated, given that it is based on data obtained in 2003. Furthermore, the ad hoc limited
sample size of 14 companies it used limits the generalisability of the findings.
The above Internet studies were all conducted in Australasia, over a limited period of time, and
employed a limited sample. In a clear departure from these studies, Trucost and Environmental
Agency (2009, 2006, 2004), conducted a series of content analysis studies in the UK in 2004,
2006 and 2009 based mostly on an electronic word search. To this end, Trucost and
Environmental Agency (2009, 2006, 2004) identified references made to specific pre-defined
environmental topics in the annual reports and accounts of all the listed companies in the
Financial Times Stock Exchange (FTSE) all share index.
Consistent with those of KPMG (1999, 1996, 1993), the findings of Trucost and Environmental
Agency (2009, 2006, 2004) revealed a dramatic increase in the percentage of companies reporting
on quantitative KPIs on relevant core issues, however, these were not in accordance with
government guidelines. Still, Trucost and Environmental Agency (2009, 2006, 2004) observed a
dramatic improvement in the robustness, depth, and rigour of environmental disclosures of most
companies. In stark contrast to the findings of other studies (Guthrie & Parker, 1990; Harte &
Owen, 1991), the findings of Trucost and Environmental Agency (2004, 2006, 2009) revealed that
reporting was increasingly done in the audited sections of the annual reports or in the sections
reviewed for consistency with the audited financial reports, an indication of improvement on
140
verifiability of the environmental information divulged. The verifiability of environmental
information was also improved by the dramatic increase in discussion of EMS by the companies
(Trucost & Environmental Agency, 2009, 2006, 2004), which further supports the findings of
KPMG (1999, 1996, 1993).
Notwithstanding the above-mentioned improvements, like the KPMG (1999, 1996, 1993)
findings, Trucost and Environmental Agency's (2009, 2006, 2004) findings revealed that the
quantification of negative aspects remained rather dismal. Furthermore, the disclosure levels and
quality of disclosures varied significantly, even within sectors, which undermined their
comparability (Trucost & Environmental Agency, 2009, 2006, 2004). Although the Trucost and
Environmental Agency's (2009, 2006, 2004) series of studies were insightful given their
longitudinal approach, they were mainly focused on environmental disclosures in annual reports
for the benefit of the shareholders. Thus they hardly mentioned any other stakeholder groups and
largely ignored other forms of environmental reports other than the annual reports. Besides, the
Trucost and Environmental Agency's (2009, 2006, 2004) studies were not enriched with any
theoretical perspective.
In a related study conducted in Spain, Bolivar (2009) analysed the extent to which companies
from environmentally sensitive sectors (utility and resource industry) legitimised their activities
by reporting on their environmental performance via the Internet. Using a scoring system, Bolivar
(2009) evaluated the environmental disclosures contained in a variety of on-line reports (corporate
management reports, stand-alone environmental reports, sustainability reports and financial
statements) of nine listed companies, for the year 2003.
Bolivar (2009:189) found that the utility sector companies' reports were of higher quality than
those of resource industry, as most companies from the sector (utility) reported their
environmental information on their websites and identified the targeted stakeholder groups as well
as the key attributes of each group. In addition, their environmental reports had a content index
table to locate each environmental element, which facilitated user navigation (Bolivar, 2009:191).
Furthermore unlike the resource companies, the utilities companies disclosed their codes of
conduct, against which their actual environmental behaviour and impact could be evaluated, an
aspect likely to enhance the credibility of the reports (Bolivar, 2009:191). Similarly, the utilities
companies' reports were more understandable to a wider audience as most (75%) reported in other

141
languages other than Spanish, whereas only a minority (40%) of the resources companies did the
same (Bolivar, 2009:194). Besides, unlike resources companies, the utilities companies provided
an e-mail address for stakeholder feedback, to enhance the relevance of the reports produced
(Bolivar, 2009:194).
Despite the above-mentioned positive developments, Bolivar (2009) observed several weaknesses
in the environmental reports of both sectors. Most notable of the weaknesses was the finding that
none of the sampled companies (utilities or resource) divulged their main environmental
performance failures (Bolivar, 2009:194), which is consistent with the findings of most studies
(Deegan and Gordon, 1996; Deegan & Rankin, 1996; Guthrie & Parker, 1990; Harte & Owen,
1991; Niskala & Pretes, 1995). In addition, the inter-sectoral comparability was impaired as the
utilities companies only disclosed their environmental expenses in the profit and loss account
whereas the resource companies only disclosed their environmental revenues (Bolivar, 2009:191).
Furthermore, Bolivar (2009:194) found that most companies from both sectors used dissimilar
terms to refer to their environmental disclosures, which also undermined the comparability of the
environmental reports. Nevertheless, in concurrence with Lodhia's (2006) findings, but in contrast
to Nik Ahmad and Sulaiman's (2002) findings, Bolivar (2009:194) found that all companies from
both sectors had a specific section in the notes to financial statements to disclose their financial
environmental information, and had adopted the GRI guidelines, to ease the comparability of their
environmental information.
Another common weakness in both sectors that was observed by Bolivar (2009:194) and that
concurred with Lodhia's (2006) findings, was that none of the companies offered a link between
non-financial environmental disclosures and financial disclosures or used eXtensible Business
Reporting Language (XBRL) formats. Instead, most companies preferred the PDF and HTML
formats to process their environmental disclosures (Bolivar 2009:194). This undermined the
reliability and accessibility of the information, given that reports on the two formats were hardly
interactive, or customisable. However, Bolivar's (2009) study was limited to only nine of the
largest Spanish companies, from two sectors and was conducted over a period of one year only.
Accordingly its findings may not be generalisable to all Spanish companies, particularly those
from other sectors.

142
In a more recent study conducted over a period of three years, Alin, Victor and Dumitru (2011)
analysed the quality of the environmental disclosures contained in annual reports, financial
statements, websites and administrators' reports of 46 listed companies, from 22 sectors in
Romania. Like most of the earlier studies (Deegan and Gordon, 1996; Deegan & Rankin, 1996;
Guthrie & Parker, 1990; Harte & Owen, 1991; Niskala & Pretes, 1995), Alin et al., (2011:123)
found that the environmental information reported by Romanian companies was incomplete and
unreliable. Not only was the level of disclosure very low, but also the disclosures were confined to
generic information without supporting details, and at times did not reflect companies' policies
(Alin et al., 2011:127). Furthermore, the information deemed most relevant in the Romanian
context was hardly disclosed (Alin et al., 2011:126). In fact, Alin et al., (2011:126) noted a
deliberate effort by the Romanian companies to neglect or conceal the relevant information.
In support of the findings of other studies (Deegan and Gordon, 1996; Deegan & Rankin, 1996;
Guthrie & Parker, 1990; Harte & Owen, 1991; Niskala & Pretes, 1995), Alin et al., (2011:126)
found that very few companies divulged any negative information even when such information
had been reported by the press. Worse still, like Lodhia (2006), Alin et al., (2011:125) found that
some companies provided the same information over several accounting periods, an aspect likely
to undermine the timeliness of the information. Alin et al., (2011:127) concluded that
environmental reporting in Romania could be explained by the legitimacy theory, and
recommended the introduction of reporting standards to improve the quality of environmental
reports. However, the small sample employed in their study limited the generalisation of its
findings.
All the above-cited studies were conducted in other continents, and thus may not reflect the
environmental reporting practices in South Africa. In response to the dearth of content analysis
studies that evaluate the quality of environmental disclosures in South Africa, Mammatt, Marx
and Van Dyk (2010) analysed the sustainability information in the annual reports of 60 JSE SRI
listed companies and top five state-owned entities, published in 2009 in print, electronic or on
companies' websites. Mammatt et al., (2010:01) found that, although most companies reported on
their stakeholder engagement initiatives, this however ranged from comprehensive reporting on
stakeholder communication and the results thereof, to merely listing the names of stakeholders.
They also found that the challenges faced by the companies were generally candidly well reported
in the foreword statement by the top management, and that the statement was also used to

143
demonstrate a strong commitment to sustainability issues, an aspect likely to enhance the
credibility of the reports (Mammatt et al., 2010:01).
To further enhance the credibility of their reports, many companies had incorporated sustainability
statements in their mission, vision and objective statements to demonstrate the importance of
sustainability issues to their business (Mammatt et al., 2010:01). Likewise, many companies had
established board committees to take responsibility for and oversee sustainability activities on the
board's behalf. This together with the fact that most companies complied with the GRI principles
and disclosed adequately their adherence to these principles enhanced the reliability of the reports
(Mammatt et al., 2010:01). However, only a third of the companies had an external assurance
statement, and even fewer (13) were assured by a reputable audit firm (Mammatt et al., 2010:01).
Specifically, four had used boutique sustainability consultants, whereas three companies had
assured the reports themselves. Worse still, only one of the state owned enterprises had an external
assurance statement, and none but one company had obtained an external assurance on the
sustainability information published on their website (Mammatt et al., 2010:01). Accordingly, the
reliability and verifiability of sustainability reports was questionable (Mammatt et al., 2010:01),
which supports the findings of prior studies (see KPMG, 1993, 1996, 1999).
Mammatt et al., (2010:01) further noted that the general clarity of the sustainability reports was
good and that the reports were effective as a communication tool, as most were concise with less
prolix. In particular, a number of companies had provided summarised sustainability reports in
printed form as well as more comprehensive reports on their websites or in electronic disk
formats. However, some companies continued to report large volumes of unreadable data, whereas
others reported little information that merely raised questions regarding their commitment to
sustainability, transparency and honesty (Mammatt et al., 2010:01). Consistent with the findings
of earlier studies (KPMG, 1999, 1996, 1993), Mammatt et al., (2010:01) observed that the format
of reporting among the companies remained varied, with some reporting their sustainability
performance in separate sustainability reports, whereas others reported in a section of the annual
report in an integrated format. Similarly, the sustainability reporting practices of the state-owned
enterprises varied widely from good to sub-standard reporting (Mammatt et al., 2010:01). The
variation in the reporting practices undermined the comparability of the sustainability reports.
Although informative, Mammatt et al's., (2010) study employed a limited sample size that

144
undermined the generalisability of its findings to all South African companies, particularly the
smaller ones. Furthermore, the study was conducted before the King III report took effect, and
was not informed and enriched by any particular theory. Therefore the findings of this study may
not be valid at present, given the far reaching effects of the King III Report on the sustainability
reporting practices of South African companies.
4.2.2.2 Studies conducted in multiple countries
In cognisance that environmental reporting had gone global with the emergence of multinationals
operating in various countries, some researchers undertook content analysis studies to analyse the
decision-usefulness of environmental (sustainability) reports produced by multi-nationals in
multiple countries as opposed to just a single country (Ernst & Young, 2007; Jose & Lee, 2006;
KPMG, 2013; KPMG, 2011; KPMG, 2008; KPMG, 2005). In one such study, Jose and Lee, (2006)
analysed the content of environmental reports published in 2002 on the websites of the 140 largest
companies in the world (Fortune's Global 200 companies).
Jose and Lee (2006:312; 315; 317) found that although about 60% of the companies had
environmental policies, only 29% provided specifics of their EMS, and even fewer (24%) had
externally certified EMS, which undermined the verifiability of their disclosures. In contrast to
Mammatt et al's., (2010) findings, only 27% of the companies' reports had a foreword statement
from top management, or had a top level executive (reporting either to the CEO or the board) in
charge of environmental affairs (Jose & Lee, 2006:314; 318). Likewise, only 30% of the
companies had housed their environmental function in a separate department (Jose & Lee,
2006:314). The foregoing suggests that environmental issues were not taken seriously by the
companies, a situation likely to undermine the credibility of the reports.
Jose and Lee (2006:316) also found that although most companies disclosed their progress
towards achievement of environmental goals and compliance with regulations, only a few
companies (21%) explained variances between actual performance and targets, and even fewer
(16%) disclosed the corrective actions undertaken to address their variances. Consistent with the
findings of other studies (Chatterjee & Mir, 2008; KPMG, 1999, 1996, 1993; Mammatt et al.,
2010), Jose and Lee (2006:317) further found that only 37% of the companies had internal
controls and internal environmental audits, and even fewer had independent external audits (24%)

145
for their environmental reports. For those that did, they did not provide details of their audits or
even provide an audit statement (Jose & Lee, 2006:317). Accordingly, the verifiability and
reliability of the reports of most companies was questionable.
In concurrence with other studies (Lodhia, 2006; Alin et al., 2011), Jose and Lee (2006:318)
found that there was little information on stakeholder involvement in the environmental reporting
process, which suggests limited relevance of the reports. Also, the timeliness of the reports
remained problematic as only 32% of the companies had reported annually whereas the remainder
of the companies reported less frequently (Jose & Lee, 2006:317). Like in most similar studies
(KPMG, 1999, 1996, 1993; Mammatt et al., 2010), the disclosures varied widely among
companies in a way that impaired their comparability (Jose & Lee, 2006:319). Besides, most
reports were incomplete and unclear as only a third of the companies disclosed how their various
offices and sites in different countries had adopted and adapted the environmental practices of
their headquarters (Jose & Lee, 2006:315). An obvious limitation of Jose and Lee's (2006) study is
that it only focused on environmental disclosures published on companies' websites and reports
for one year (2002). Thus, the study ignored the other environmental reporting media employed
by the companies and did not provide reporting trends of the companies included in the study.
In a continuation to the triennial series of studies of the prior decade, KPMG (2013; 2011; 2008;
2005; 2002), analysed the sustainability disclosures in the sustainability reports, websites and
annual reports to obtain an insight into national and global reporting trends of two sets of
companies – the top 250 multinational companies (G250), and the largest 100 national companies.
Consistent with earlier studies (KPMG, 1999, 1996, 1993), the findings of KPMG (2013; 2011;
2008; 2005; 2002), revealed a dramatic increase in the frequency of reporting, and percentage of
companies with a clear reporting strategy, that identified and prioritised the targeted audience,
which led to a decline in over-generalised, lengthy and irrelevant reports. To cater for a wider
audience, companies increasingly widened the scope of the topics but employed a search
functionality on their websites to enable readers to customise the reports to their unique needs,
and consulted with their stakeholders when selecting the appropriate content and KPIs to report on
(KPMG, 2013; 2011; 2008; 2005; 2002).
Unlike earlier studies (KPMG, 1999, 1996, 1993), most companies in the KPMG (2013; 2011;
2008; 2005; 2002) studies employed the GRI guidelines to determine the content of their reports.
146
This, together with sector-specific supplements also enhanced the comparability and verifiability
of the reports, particularly the G3 version of the GRI guidelines, which laid a greater emphasis on
the reporting process and required an elaboration of methods employed in calculating the KPI
(KPMG, 2008:38; KPMG, 2011:20). To further enhance reliability of the reports, most adopted a
systematic approach to sustainability issues that included a strategy, an EMS, a stakeholder
engagement mechanism, publication of sustainability reports and the assurance of the same
(KPMG, 2008:02; KPMG 2011:04).
In concurrence with the findings of the earlier studies (KPMG, 1999, 1996, 1993), many
companies in the KPMG (2013; 2011; 2008; 2005; 2002) studies had started to quantify the value
of their commitment to sustainability issues and had adopted strategies with well-defined and
quantified objectives, as well as KPIs. Indeed a growing number of companies had started
reporting on progress against their objectives, with a few quantifying the financial opportunities
availed to them as a result of their sustainability initiatives (KPMG, 2008:04; KPMG, 2011:02). In
a further consistence with the earlier studies (KPMG, 1999, 1996, 1993), KPMG (2013; 2011;
2008; 2005; 2002) studies revealed that a growing percentage of companies had developed and
implemented internal systems, controls, compliance mechanisms, processes and data collection
methodologies to enhance the verifiability of their information and minimise restatements of the
reports. Similarly, an increasing percentage of companies had certified their EMS to enhance their
credibility (KPMG, 2013; 2011; 2008; 2005; 2002). Increasingly, many companies had delegated
the over-sight of sustainability initiatives to higher level personnel in charge of separate
specialised corporate responsibility departments (KPMG, 2008:47), which concurs with the
findings of Mammatt et al., (2010).
In contrast to the findings of earlier studies (KPMG, 1999, 1996, 1993), KPMG (2013; 2011;
2008; 2005; 2002) studies found that a growing percentage of companies included third party
commentary in their reports and undertook external assurance to enhance the reliability of their
reports. Not only did the companies increase the breadth and the scope of their assurance
assignments, they also increased the rigour of assurance from a negative assurance to a positive
one and employed reputable accountancy firms, known for their expertise in internal controls to
strengthen the reporting systems (KPMG, 2011:28; KPMG, 2008:57). The rigour, consistency and
quality of assurance approaches also improved dramatically as a result of the use of verification
standards such as ISAE3000 and AA1000AS (KPMG, 2008:67). A few progressive companies had

147
begun to combine both assurance and third-party commentary to further enhance the credibility of
their reports (KPMG, 2011:30; KPMG, 2008:57).
Also in contrast with the earlier studies (KPMG, 1999, 1996, 1993), KPMG (2013; 2011; 2008;
2005; 2002) studies revealed that a majority of companies had increasingly leveraged multiple
media channels such as the Internet, print stand-alone sustainability reports as well as annual
reports to effectively disseminate their sustainability information to their target audiences as well
as to enhance the clarity and understandability of the information. Similarly, a growing percentage
of companies also had started to integrate their sustainability KPIs into their annual reports to
enhance the understandability of the impact of sustainability performance on their financial
performance (KPMG, 2011:22; KPMG, 2008:29).
Increasingly, companies had incorporated special-purpose sustainability websites into their
communications to enhance the accessibility of their reports to various audiences and enable
readers to view data through different perspectives (KPMG, 2011:22; KPMG, 2008:41). In
addition, a small but growing number of companies had developed mobile applications to provide
the stakeholders with greater access to their reports. Even more interesting was the emerging use
of web technologies to actively encourage readers to examine and segment sustainability reports
to suit their unique needs (KPMG, 2011:22). Furthermore, an increasing percentage of companies
had referred to their own codes of conduct which made the stakeholders aware of what to expect
from the companies when reading the reports, an aspect which positioned them to better
understand the performance of the companies (KPMG, 2008:43; KPMG, 2005:18).
Notwithstanding these developments, most companies did not engage their key stakeholders
systematically or meaningfully as they employed ineffective ways of engaging and
communicating to the stakeholders (KPMG, 2008:34; KPMG, 2005:20). Besides, the engagement
was mostly used to discuss broad company policies on sustainability issues rather than specific
items in the reports (KPMG, 2005:21). In addition, only a few companies identified their
stakeholders, incorporated stakeholder feedback in their reports or responded to stakeholder
concerns in the public domain (KPMG, 2008:02). These, together with the fact that many reports
were issued without any environmental information, and did not indicate the use of
AccountAbility's AA1000AS in deciding materiality and when selecting issues to report on,
undermined the relevance of the sustainability reports (KPMG, 2008:32; KPMG, 2005:20).

148
Despite having a sustainability strategy in place, fewer companies had an actual management and
measurement system in place, which created room for “green wash” (KPMG, 2011:05; KPMG,
2008:32). In addition, the effort to integrate sustainability issues in the annual reports remained
dismally low and of poor quality as the KPIs used lacked depth (KPMG, 2011:05; KPMG,
2008:19). Thus most of the integration effort was a mere combination of environmental, financial
and social reports without real integration, which undermined the credibility of the reports as
sustainability issues appeared not to be truly integrated into the business strategy (KPMG,
2011:23).
The reliability of the reports was further undermined by use of poor quality data that warranted
significant restatement of prior reports due to errors or omission, and a preponderance of
disclosing only positive information, which undermined the balance of the reports (KPMG,
2013:18; 34; KPMG, 2011:26). Besides, reasonable assurance was only undertaken by a minority
of the companies and on selected items (KPMG, 2013:33; KPMG, 2011:28). Even for those that
opted for limited assurance, the assurance did not always cover the entire report, but rather
focused on selected indicators, and varied widely in manner that resulted to divergent assurance
statements (KPMG, 2013:34; KPMG, 2008:66; KPMG, 2005:30). Furthermore, only a small
percentage of companies combined third-party commentaries with the assurance (KPMG,
2013:69; KPMG, 2011:30). Besides the third party commentary lacked dissenting voices (KPMG,
2013:69).
The widely adopted GRI guidelines allowed companies to report at several different levels of
detail which caused variation in the reports and undermined their comparability (KPMG, 2011:20;
KPMG, 2008:38). Similarly, companies employed varying multiple media for reporting purposes
which resulted in inconsistency in the format and accessibility of the sustainability reports across
companies and industries (KPMG, 2011:24). As in earlier studies (KPMG, 1999, 1996, 1993), the
comparability of the reports in the KPMG, (2011, 2008, 2005, 2002) was also undermined by the
variation in sustainability reporting rates, the use of largely unregulated and varying metrics, the
use of different terminologies and guidelines. In addition, most companies only used portions of
the GRI guidelines and ignored some portions particularly on principles, completeness and
inclusiveness (KPMG, 2008:38). Furthermore, very few companies communicated their reports in
an accessible, comprehensive and professional manner using XBRL or other ways of transferring
data in real-time to the stakeholders (KPMG, 2008:19). This meant that the full potential of the on-
149
line capability was not tapped into, a finding that is consistent with that of Lodhia (2006:84).
However KPMG's (2013; 2011; 2008; 2005; 2002) studies covered a wide-range of sustainability
issues, with an emphasis on the trends in the volume of sustainability information disclosed in
different countries. As such they did not entirely focus on the quality or decision-usefulness of
such disclosures. Indeed the studies lacked depth as they were not informed by any theory when
conceptualising the sustainability reporting practices observed. Hence they failed to
comprehensively and persuasively describe, evaluate, or even prescribe suitable sustainability
reporting practices. Besides, these studies lacked an academic impartiality, as they were used by
the researcher as a marketing tool for sustainability consultancy and assurance services.
In a similar series of annual studies conducted between 2007 and 2010, Craib Design and
Communications (CDC), partnered with Canadian Business for Social Responsibility (CBSR) and
PricewaterhouseCoopers (PwC) (CBSR & CDC, 2008; CDC, 2007; CDC & PwC, 2010, 2009) to
evaluate the effectiveness of communication of sustainability information in 75 reports published
by companies from the USA (25), Canada (25), and outside North America (Europe, Japan and
Australia) (25). Consistent with the other studies (KPMG, 2013, 2011, 2008, 2005, 2002), the
CDC (2007); CBSR and CDC (2008); CDC and PwC (2009, 2010) studies revealed a dramatic
improvement in the quality of the reports produced with an overwhelming majority having a
dedicated section on environmental issues. However, the North American companies generally
trailed their counterparts from outside North America (CBSR & CDC, 2008:04; CDC & PwC,
2010:04; CDC & PwC, 2009:04).
To enhance the relevance and understandability of their reports, companies increasingly published
a separate report scope that identified their stakeholders, explained the reporting parameters, such
as the information contained or excluded from the reports, defined their key areas of performance,
and provided the date of the preceding report and the reporting cycle (CBSR & CDC, 2008:12;
CDC & PwC, 2010:14; CDC & PwC, 2009:17). The latter was also meant to enable the readers to
gauge the timeliness of the reports. In addition, they increasingly employed the GRI G3 guidelines
to identify the key issues to be addressed in their reports and adopted the logical reporting
structure advocated for by the GRI guidelines to improve the readability of their reports (CBSR &
CDC, 2008:32; CDC & PwC, 2010:15; CDC & PwC, 2009:15).

150
Furthermore, they progressively engaged their stakeholders, in many ways to determine and
respond to their needs by providing an on-line survey for feedback on their sustainability reports,
and publicly responding to the feedback via reporting (CBSR & CDC, 2008:22; CDC & PwC,
2010:20; CDC & PwC, 2010:27). Moreover, in concurrence with the findings of Mammatt et al.,
(2010), but in contrast with those of Jose and Lee (2006), companies increasingly published
forewords from senior executives to convince the stakeholders that their concerns were heard,
understood and in the process of being addressed (CBSR & CDC, 2008:15; CDC & PwC,
2010:16; CDC & PwC, 2010:23).
In tandem with the findings of KPMG (2013; 2011; 2008; 2005; 2002), an increasing percentage
of companies undertook third-party assurance, which was mostly conducted by accounting firms
(CBSR & CDC, 2008:24; CDC & PwC, 2010:22; CDC & PwC, 2009:29). Similarly, an increasing
number of companies incorporated expert commentary, stakeholder reviews, testimonials and case
studies in their sustainability reports (CBSR & CDC, 2008:34; CDC & PwC, 2010:30; CDC &
PwC, 2009:41). These, together with the growing use of internal audits enhanced the reliability
and verifiability of the reports. To further enhance the reliability of their reports, companies
increasingly quantified their performance using comparable internationally recognised KPI
metrics mostly based on the GRI guidelines (CBSR & CDC, 2008:32; CDC & PwC, 2010; 15;
CDC & PwC, 2009:15).
Likewise, an increasing number of companies had set specific, measurable, achievable, realistic
and time-bound targets, and had started to explain the progress made towards achieving those
targets, reasons for shortfalls, and how their performance was measured and monitored (CBSR &
CDC, 2008:40; CDC & PwC, 2010:36; CDC & PwC, 2009:49). In addition, companies
increasingly disclosed the governance structures, policies and procedures of dealing with
sustainability issues, and identified the external charters or standards that they adhered to, to
demonstrate the extent to which sustainability issues were entrenched within their organisations
(CBSR & CDC, 2008:20; CDC & PwC, 2009:25; CDC & PwC, 2010:18).
Furthermore, an increasing percentage of the reports provided quantitative data supported by
graphs, KPI summary tables and specific commentary to give objective and understandable
information to the readers (CBSR & CDC, 2008:42; CDC & PwC, 2010:38; CDC & PwC,
2010:51). Similarly, an increasing percentage of the reports also had a GRI content index table to
151
provide users with a quick overview of the report content and to enhance accessibility of
information (CBSR & CDC, 2008:42; CDC & PwC, 2010:38; CDC & PwC, 2009:51).The use of
the GRI guidelines and provision of GRI metrics on KPI summary tables also enhanced the
consistency and comparability of the sustainability reports.
Many companies also employed performance scorecards and other devices to guide the readers
through the density of numbers and to highlight the most material information (CBSR & CDC,
2008:04; CDC & PwC, 2010:48; CDC & PwC, 2009:05). In addition, most companies provided
schematic diagrams, organisational charts, activities maps and photographs to clarify text, capture
readers' attention and arouse their curiosity (CBSR & CDC, 2008:36; CDC & PwC, 2010:32;
CDC & PwC, 2009:05). To accommodate the varying needs of users, companies increasingly
experimented on various reporting formats, with some publishing a summary of their full report to
provide readers with a snapshot of their sustainability strategy, performance and objectives (CBSR
& CDC, 2008:45; CDC & PwC, 2010:36; CDC & PwC, 2009:61). Yet others provided a fact
sheet, with a one or two-page summary of a company's quarterly performance, which enhanced
the accessibility, readability, and timeliness of the reports for the readers (CBSR & CDC, 2008:43;
CDC & PwC, 2010:36; CDC & PwC, 2009:06).
Consistent with the findings of KPMG (2013; 2011; 2008; 2005; 2002), many companies had a
dedicated sustainability report web-site that offered substantially more information than the
printed reports (CBSR & CDC, 2008:48; CDC & PwC, 2010:05; CDC & PwC, 2009:26). This
ultimately led to a decline in the volume of printed reports as more information was migrated to
the web-sites. In line with the findings of Chatterjee and Mir (2008), most companies' websites
had a link to sustainability reports on their corporate homepage or sustainability tab in their main
navigation menu to enhance the accessibility of their sustainability reports (CBSR & CDC,
2008:48; CDC & PwC, 2009:04; CDC & PwC, 2010:05).
In contrast to the findings of other studies (KPMG, 2013; 2011; 2008; 2005; 2002; Lodhia,
2006:84), the researchers (CBSR & CDC, 2008; CDC 2007; CDC & PwC, 2010, 2009) found that
many companies took a full advantage of their web tools capabilities on their websites. In
particular, they employed interactive features like maps, blogs, fun and thought-provoking games,
live links, videos (CBSR & CDC, 2008:51; CDC & PwC, 2010:05; CDC & PwC, 2009:57). These
reports also contained features such as visual navigation and pop-ups that could create interactive
152
documents that are easy to distribute, comment on and print (CBSR & CDC, 2008:48; CDC &
PwC, 2010:42; CDC & PwC, 2009:61).
To further engage and entice their potential readers, most companies published an image on their
front cover with a design and message meant to reflect their priorities and to set the tone for their
entire reports (CBSR & CDC, 2008:10; CDC & PwC, 2010:48; CDC & PwC, 2009:13). In
addition, most companies employed the same design and theme for both their sustainability
reports and annual reports to emphasise the link between their sustainability issues, and their core
business function. Furthermore, most companies published their organisational profile to enable
their readers to understand the breadth of their activities, geographical foot print, operating
structure and performance, as well as corporate goals (CBSR & CDC, 2008:14; CDC & PwC,
2010:12; CDC & PwC, 2009:19).
Notwithstanding the above-mentioned positive developments, the CDC (2007); CBSR and CDC
(2008); CDC and PwC (2009, 2010) studies also found various reporting inadequacies that
undermined the decision-usefulness of the reports. Firstly, in line with the findings of other studies
(KPMG, 2002, 2005, 2008, 2011), only a minority of companies explained the process used to
determine the significant issues reported on, the breadth and depth of such issues, an aspect likely
to undermine the relevance of the information reported (CBSR & CDC, 2008:05; CDC & PwC,
2010:10; CDC & PwC, 2009:05). Secondly, as found in most studies (Chatterjee & Mir, 2008;
KPMG, 2013; 2011; 2008; 2005; 2002; Jose & Lee, 2006; Mammatt et al., 2010), only a small
percentage of reports had an assurance statement, testimonials and case studies – this undermined
the credibility of the sustainability reports (CBSR & CDC, 2008:24; CDC & PwC, 2010:22; CDC
& PwC, 2009:29).
Thirdly, most companies, particularly the North American companies lumped large quantities of
performance data in the last few pages of their reports without commentary, and this, undermined
their readability (CBSR & CDC, 2008:04; CDC & PwC, 2010:38; CDC & PwC, 2009:05). By
contrast, some companies typically expressed their goals in terms that defied measurement or
failed to report progress against established goals (CBSR & CDC, 2008:40; CDC & PwC,
2010:36; CDC & PwC, 2009:49). Fourthly, many small companies did not provide an organisation
profile, hence they failed to provide context for their sustainability strategies and
accomplishments (CDC & PwC, 2010:12).

153
To exacerbate the situation, the reports skipped from one topic to the other without a sense of
continuity or structure, further undermining their readability (CDC & PwC, 2009:06). Fifthly,
many reports were untimely, particularly in North America where companies did not produce a
sustainability report every year, nor provide their prior years' reports (CDC & PwC, 2009:04). The
latter also undermined the comparability of the reports, which was exacerbated by diversity in
approach in treatment of issues, reporting media used and terminology employed by different
companies (CBSR & CDC, 2008:04; CDC & PwC, 2009:04). This finding concurred with those
of other studies (Bolivar 2009; Chatterjee & Mir, 2008; KPMG, 2013; 2011; 2008; 2005; 2002;
Mammatt et al., 2010).
Although informative, the CDC (2007); CBSR and CDC (2008); CDC and PwC (2009, 2010)
studies lacked depth as they were not enriched by any theory. In addition, they lacked academic
impartiality, given that the researchers had a vested interest in sustainability assurance or
consultancy services. Therefore these studies can be perceived as a marketing tool for the services.
In a study that is particularly relevant to this research, Ernst and Young (2007) assessed the quality
of 100 sustainability reports selected from those published by the top 500 European companies. In
tandem with the findings of other studies (CBSR & CDC, 2008; CDC, 2007; CDC & PwC, 2010,
2009; KPMG, 2013; 2011; 2008; 2005; 2002), Ernst and Young (2007:08) found that most reports
presented an overview of relevant stakeholders, but did not disclose the criteria for selecting those
stakeholders. Typically, most companies discussed the stakeholder dialogue in a general sense and
did not break down such a dialogue by stakeholder groups (Ernst & Young, 2007:09). As a result,
it was unclear how the dialogue had actually been integrated into the management system, and
implied that everyone was a stakeholder, a situation likely to produce over-generalised reports that
do not address specific stakeholder concerns.
In addition, stakeholder criticisms and particularly actions taken in response to the criticisms were
only reported on by a minority of companies (Ernst & Young, 2007:10). These, together with the
fact that most companies did not always use their sustainability reports to address important
sustainability news, particularly when such news attracted negative media attention, undermined
the relevance of the reports (Ernst & Young, 2007:12).
Contrary to the findings of most studies ( Jose & Lee, 2006; KPMG, 2013; 2011; 2008; 2005;

154
2002; CBSR & CDC, 2008; CDC, 2007; CDC & PwC, 2010, 2009; Chatterjee & Mir, 2008;
Mammatt et al., 2010), 69% of the reports in Ernst and Young's (2007:22) study included an
assurance statement to enhance the reliability of their reports. However, only 11% of the assurance
statements provided a reasonable assurance (Ernst & Young, 2007:23). In addition, despite the
major differences in the scope of the assurance procedures performed in different companies, the
procedures yielded similar conclusions (Ernst & Young, 2007:24).
In further contrast with the findings of the other studies (KPMG, 2013; 2011; 2008; 2005; 2002;
Mammatt et al., 2010), but in line with those of Jose and Lee (2006), Ernst and Young (2007:25;
26) found that most companies did not provide a clear description of the governance structure and
the related planning and control for sustainability issues, and did not disclose the relationship
between their companies' sustainability performance and executive compensation. Furthermore, in
agreement with other studies (KPMG, 2002, 2005, 2008, 2011; Bolivar, 2009), only one company
used the XBRL, an electronic communication language known to reduce the risk of manual error
entries (Ernst & Young, 2007:23). All these together with the fact that most disclosures tended to
be positive and thus did not provide a balanced view of the companies' performance, undermined
the reliability of the sustainability reports as they appeared to be glossy public relations
documents (Ernst & Young, 2007:03; 23).
In congruence with the findings of other studies (KPMG, 2013; 2011; 2008; 2005; 2002; CBSR &
CDC, 2008; CDC 2007; CDC & PwC, 2010, 2009), Ernst and Young (2007) found that most
companies endeavoured to enhance the comparability of their reports. To this end, 85% of the
companies outlined their sustainability vision, strategy and targets to enable their readers to
analyse the progress made to achieve the targets over time (Ernst & Young, 2007:15). In
particular, 88% of the companies had translated their sustainability targets into measurable KPIs
that could be compared over time (Ernst & Young, 2007:16). To further facilitate the
comparability of the KPIs with the prior years, 67% of companies supported their KPIs with
diagrams and words, a situation likely to also enhance the understandability of their performance
(Ernst & Young, 2007:16).
To enhance the inter-company comparability, a majority of the reports (56%) referred to general
benchmark results (Ernst & Young, 2007:17). In addition, 89% of all the reports analysed were
prepared using guidelines, with about 81% having used GRI guidelines. Despite these efforts,

155
only a limited number of companies included the results of sector-specific benchmarks, or
supplemented the GRI guidelines with sector-specific guidelines (Ernst & Young, 2007:04).
Furthermore, there was a diversity in KPIs, definitions and measuring methods which undermined
the comparability of the reports (Ernst & Young, 2007:16), a finding which concurred with the
findings of other similar studies (Bolivar 2009; Chatterjee & Mir, 2008; KPMG, 2013; 2011;
2008; 2005; 2002; Mammatt et al., 2010; Trucost and Environmental Agency, 2010, 2006, 2004).
To enhance the readability of the reports, 89% of the reports were well-structured, with 94%
having sufficiently explained tables and diagrams in an attempt to enhance their clarity (Ernst &
Young, 2007:21), a finding which concurred with the findings of other studies (CBSR & CDC,
2008; CDC 2007; CDC & PwC, 2010, 2009). However, the core message in most reports
remained fragmented and difficult to extrapolate from the text, as the reports were not
summarised. Specifically, most reports (72%) had more than 50 pages, with one having as many
as 267 pages, an aspect that undermined the readability of the report (Ernst & Young, 2007:20).
Although insightful, the Ernst and Young's (2007) study was limited to the top 500 European
companies, thus its findings might not be generalisable to the other parts of the world particularly
in Africa. Like the other studies conducted by the audit advisory firms, the study also lacked depth
as it was not enriched by any theory, and academic impartiality as Ernst and Young used the study
as a marketing tool for consultancy and verification services.
4.2.3 Identified gaps in the prior literature of content analysis studies
From the literature review in this section, the following research gaps have been identified:
• Most studies focused on the nature and frequency of environmental disclosures in the
developed countries. Relatively few studies have been done on the environmental reporting
practices in the developing countries in general and African countries in particular.
• Most of the prior studies had almost exclusively focused on the environmental disclosures in
the statutory annual reports. Only a few studies focused on environmental disclosures in
alternative media. Accordingly, most studies did not provide an all-round view of the
environmental reporting practices.
• Most studies cited did not employ any theory to describe, evaluate, or even prescribe
156
decision-useful environmental reporting practices. As a result, many lack richness and depth,
as well as academic impartiality. Indeed some of these studies were conducted by
organisations as a marketing tool for environmental consultancy and assurance services.
• Many of the studies were undertaken for a period of one year or less, and used limited and
unrepresentative samples, typically of large listed companies from environmentally sensitive
industries. As such their findings were not generalisable to all companies.
• Some studies were conducted more than ten years ago, before the emergence of major
reporting guidelines or assurance standards. Given the changes that have taken place in
environmental reporting, their findings are not valid at present.
• Other studies covered wide-ranging sustainability issues with a particular emphasis on the
trends in the quantity of information disclosed, in different countries, as opposed to entirely
focusing on the quality or decision-usefulness of the information.
• Most studies did not utilise coding instruments or detailed checklists, to reduce the ambiguity
involved in identifying and coding the environmental disclosures. This may have contributed
to the contradictory and even inconclusive results.
Given the gaps identified above, the studies reviewed in this section failed to fill the void in
relation to the decision-usefulness of environmental reports. This has led to the need for this study
which attempts to fill the gaps by adding to the existing body of knowledge some evidence or lack
of, on the decision-usefulness of environmental reports produced by companies operating in South
Africa.
One key limitation of the content analysis studies is that they do not interrogate the users to
determine their needs, the extent to which they read the environmental reports and employ them in
decision-making, their level of satisfaction with the reports, as well as their ranking of
environmental information relative to other types of information. As such the studies may not
reveal the users' perceptions on the decision-usefulness of environmental reports. Surveys may
answer these questions. The next section reviews those surveys that elicited the users' perceptions
on the decision-usefulness of environmental (sustainability) reports.
157
4.3 USERS’ PERCEPTION OF DECISION-USEFULNESS OF ENVIRONMENTAL
REPORTS
Although environmental reporting is aimed at informing or influencing the decisions of users,
very little is known about the users' views, experiences and information needs as only a few prior
studies have focused on users (Momin, 2009:02). This section reviews the studies that
investigated the users' views on their information needs, the extent to which they read and employ
environmental reports in decision-making, their level of satisfaction with the quality of the
reports, and the relative importance that they place on environmental reports as compared to other
types of reports.
4.3.1 Studies that elicited the views of pressure groups
In a landmark questionnaire survey of the Corporate Social Disclosure (CSD) preferences of 59
representatives of community pressure groups (mostly environmental groups), Tilt (1994:63)
found that the pressure groups needed CSD that is sufficient, credible, useful and understandable.
Having analysed the pressure groups' views, she proposed a model report that could meet their
needs. She proposed that the report be contained in the annual report, be supplemented with other
policy statements, and that a copy of the report be kept in an outside agency for perusal by any
interested parties. She also proposed that the report should be audited by an independent third
party and that it should contain both descriptive and quantified data (Tilt, 1994:64).
Tilt (1994:55) further found that pressure groups were users of CSD, as 82% of the respondents
had read some kind of CSD, 71% had received some CSD, whereas 52% actively sought such
information. In addition, a majority of the groups (54%) took indirect actions against companies
that did not disclose their CSD to influence their reporting practices, whereas a further 39% took a
more direct action. The indirect actions included writing of letters, negative publicity campaigns
and lobbying government to introduce standards (Tilt, 1994:58). The direct actions were in form
of letters addressed to company management, but not outright confrontation as one would have
expected (Tilt, 1994:59). The pressure groups also used the reports to decide how to support
companies with good CSD reporting practices by purchasing a company's products, working with
or co-operating with those companies (Tilt, 1994:58).

158
Furthermore, Tilt (1994:59) found that the pressure groups were generally dissatisfied with the
CSD as they generally perceived it to be insufficient and of low credibility, even though some
forms of disclosure media were perceived to be easier to understand than others (Tilt, 1994:61). It
is for this reason that the pressure groups called for legislation or standards that require minimum
levels of disclosure and the use of external audits to enforce such legislation and standards (Tilt,
1994:63).
However, Tilt's (1994) study did not ask the users about their use of CSD on the websites, or
separate environmental reports, neither did it ask them to rank the relative importance of CSD
compared to other types of information. In addition, the study only surveyed the views of pressure
groups, who because of vested interests answer questions in a particular way to support their pre-
existing prejudices (Deegan & Rankin, 1997:571). Besides, the study was conducted more than 18
years ago in Australia, hence its findings may not be valid in the current dynamic reporting arena,
particularly in a developing country like South Africa.
In a replica study meant to validate Tilt's (1994) earlier findings, Danatas and Gadenne (2004)
surveyed the views of 59 representatives of social and environmental groups in Australia, to
ascertain if the groups were users of CSD and whether they perceived such disclosures to be
sufficient, understandable, credible and relevant. In contrast to Tilt's (1994) findings, Danatas and
Gadenne (2004:13) found that the groups' preferred stand-alone environmental reports and web-
site reports in addition to annual reports, which they attributed to the emerging overriding
emphasis on accessibility to information. In tandem with Tilt's (1994) findings, Danatas and
Gadenne (2004:09) found that most respondents (86.4%) had read some type of CSD, and that
74.6% had actively sought this information as only 54.2% received it voluntarily from companies.
They further found that the most sought after CSD was environmental (62.7%), followed by
resource conservation (49.1%), then community involvement (42.3%), followed by disclosures on
products (27.2%) and human resources (11.9%) – this provided some sort of ranking of the
groups' preferences of different types of CSD (Danatas & Gadenne, 2004:09).
Like Tilt's (1994) findings, Danatas and Gadenne (2004:02; 11) also found that the pressure
groups were dissatisfied with the CSD, as they perceived the disclosures to be of low credibility,
given the “green-wash” tendency across a variety of media that stressed positive information but
omitted negative information. Similarly, the pressure groups perceived the CSD disclosures to be
159
insufficient as a greater percentage of the groups actively sought CSD information than they
received voluntarily from the companies (Danatas & Gadenne, 2004:13). By contrast, the pressure
groups perceived the CSD to be relevant to their needs even when insufficient. However, the
results on the groups' perception on the understandability of the CSD were inconclusive (Danatas
& Gadenne, 2004:11).
Though insightful, Danatas and Gadenne's (2004) study did not investigate whether the pressure
groups employed the CSD to make decisions, and the kinds of decisions that may have been
informed by the disclosures. In addition, the study's findings may not be valid at present as it was
conducted more than six years ago. Furthermore, the study only surveyed the views of pressure
groups, which as stated earlier have vested interests in answering questions in a particular way to
support their pre-existing prejudices.
In a similar study, O’Dwyer, Unerman and Hession (2004) analysed the CSD needs of 28 Irish
NGOs using a questionnaire survey. Consistent with Tilt's (1994) findings, O’Dwyer et al.,
(2004:01) found a strong demand among the NGOs for more extensive levels of disclosure that
are mandatory, externally verified and reported in either annual reports or separate stand-alone
reports. They also found that the NGOs used the reports to gain knowledge about a company's
commitment to responsible business practices, check a company's compliance to laws and
regulations, as well as, to investigate whether a company was reporting its actual social and
environmental impacts (O’Dwyer et al., 2004:09).
In agreement with the findings of Tilt (1994), O’Dwyer et al., (2004:11) found that the CSD were
used to inform decisions on whether to pressurise a company to improve its social or
environmental performance. In addition, they found a widespread dissatisfaction with the CSD
practices which were perceived to be lacking in stakeholder engagement, feedback mechanism,
sufficiency and credibility (O’Dwyer et al., 2004:09). Accordingly, the CSD practices were
perceived as not decision-useful to the NGOs.
However, O’Dwyer et al's., (2004) study only sampled 28 NGOs, of which, only 13 were
environmental. Accordingly, the findings of the study cannot be generalised to all the NGOs in
Ireland. In addition, the study did not ask the users to indicate the extent to which they read the
CSD, nor did it ask them to rank various types of disclosures in accordance with perceived

160
importance. The study also did not focus on environmental issues as it also covered social issues
as well. Besides the study was conducted more than six years ago, which could render its findings
invalid at present.
All the three studies cited above on pressure groups were conducted in the developed countries,
and hence their findings may not represent the perceptions of users in a developing country. In
view of scarcity of research on users' needs in developing countries, Taib (2005) investigated the
perception of 50 NGOs with regard to Corporate Social and Environmental Disclosures (CSED)
in Malaysia using a questionnaire and interview survey. Consistent with the prior studies (Tilt
1994; O’Dwyer et al., 2004), Taib (2005) found a strong NGO demand for legislation and
standards that require minimal levels of disclosures. She further found that the annual reports were
the most preferred medium for seeking CSED.
In agreement with the prior studies (Tilt, 1994; O’Dwyer et al., 2004), Taib (2005) also found that
the NGOs were users of CSED, and employed indirect approaches such as lobbying activities,
promotional and education programs against the companies that did not provide the disclosures.
However, their influence was weaker than that of their counterparts in the developed countries due
to various constraints. With regards to the users' satisfaction with the understandability, credibility
and sufficiency of the CSED, her findings were inconclusive given the limited size of the sample
employed in the study. Another limitation of her study is that it is outdated given that it was
conducted more than seven years ago. Besides, her study did not ask the respondents to rank the
various types of information read in accordance with perceived importance. Moreover, the study
was conducted in Asia, hence its findings may not be applicable in the South African context.
4.3.2 Studies that elicited the views of analysts
Thus far, all the studies in this section only explored the views of pressure groups. Considering
that different stakeholders have different perceptions on environmental (sustainability) related
disclosures, it is important that the studies on the views of other stakeholders be also examined.
This section reviews the studies that elicited the views of analysts who according to Day
(1986:295) are perhaps the most informed and articulate user group of environmental
(sustainability) related disclosures, and whose reports influence many investment decisions.

161
In a questionnaire survey study conducted to investigate the attitudes of 85 British investment
analysts on environment issues, Business in the Environment (BiE) (1994:107) found that the
issues ranked very lowly in the analysts' priorities when they undertook their investment analysis.
BiE (1994:107) further found that analysts' assessments were made on rational, financial criteria
and that moral or emotive issues such as environmental issues were not seen as part of an analysts'
remit, unless such issues had a traceable financial consequence. For this reason, most analysts
perceived environmental information not to be relevant to them, and did not use it. The main
limitation of the BiE study is that it was conducted more than 17 years ago, hence though its
findings were valid then, they are doubtful at present given the many changes that have taken
place in the environmental reporting practice.
In a similar subsequent study conducted in the UK, Campbell and Slack (2008), explored the
perceptions of 19 sell-side analysts on the usefulness and materiality of narrative disclosures in
the annual reports using interviews. Campbell and Slack (2008:17) found that the analysts
preferred a more timely release of the final annual reports to avoid the time lag between the
release of preliminary accounts and final annual reports, which rendered the latter useless as most
of the required information would have been obtained from preliminary accounts. In addition, the
analysts preferred narrative disclosures on the future outlook, management or targets which were
critical and yet missing from the reports (Campbell & Slack, 2008:20). Furthermore, they
preferred disclosures with directly value-relevant numerical data, presented in a concise manner
(Campbell & Slack, 2008:27).
Consistent with the BiE (1994) findings, Campbell and Slack (2008:05) found that analysts
unanimously perceived the narrative reports not to be immediately useful in their primary tasks of
constructing forecast models, which required value-relevant numerical data that can influence a
financial forecast. Thus, social and environmental reports, which were typically narrative, were
perceived to be irrelevant, lengthy, useless or worse as they were deemed incapable of influencing
a financial forecast (Campbell & Slack, 2008:28). Accordingly, such reports were rarely sought or
read by analysts, and were dismissed out-rightly. In short, social and environmental disclosures
were perceived as the least relevant, least material part of the annual reports and were thus the
least read part (Campbell & Slack, 2008:23).
The main limitation of Campbell and Slack's (2008) study is that it employed a limited sample of

162
19 sell-side analysts, therefore limited generalisation of its findings can be made to all sell-side
analysts in the UK. In addition, the study was conducted more than four years ago when most
social and environmental disclosures were narrative, and before the widespread emergence of
ethical investors. Furthermore, the study is based on the analysts in a developed country, the UK.
Therefore the findings may not be applicable to a developing country such as South Africa.
4.3.3 Studies that elicited the views of investors
Although analysts play an important role in preparing research reports whose findings influence
many investment decisions, they do not themselves make those investment decisions. It is the
investors (shareholders) who make such decisions, and they may decide whether or not to rely on
the analysts’ reports. Accordingly, it is necessary that the studies that investigated the perceptions
of investors (shareholders) be reviewed.
In one such study conducted in the UK, Solomon and Solomon (2006) interviewed 21 buy-side
institutional investors to determine the extent to which Social, Ethical and Environmental (SEE)
disclosures were integrated into institutional investment decisions and whether the disclosures
were decision-useful. Solomon and Solomon (2006:574) found that investors preferred
standardised SEE disclosures that are concise, to avoid information overload but detailed enough
to provide adequate information. Contrary to the findings of other studies (BiE 1994; Campbell &
Slack 2008), Solomon and Solomon (2006:575) found that the investors preferred narrative SEE
disclosures as opposed to quantitative disclosures. In contrast to the findings of other studies (BiE
1994; Campbell & Slack 2008), Solomon and Solomon (2006:585) found strong evidence that
SEE disclosures were perceived as decision-useful. In addition, unlike the other studies (BiE
1994; Campbell & Slack 2008), Solomon and Solomon's (2006:586) study revealed a strong
demand for SEE disclosures, and that institutional investors used the SEE disclosures to develop
rating reports on SEE issues within investee companies (Solomon & Solomon, 2006:578). In
addition, the SEE disclosures were used to inform meetings with investee companies, and in
writing reports on the companies' SEE behaviour (Solomon & Solomon, 2006:578; 584).
However, consistent with the findings of the other studies (BiE 1994; Campbell & Slack, 2008),
the investors were dissatisfied with the quantity and quality of public SEE disclosures (Solomon
& Solomon, 2006:585). Specifically, they perceived the public SEE disclosures in the annual
163
reports to be inadequate, incomparable, and either too limited, or too lengthy (Solomon &
Solomon, 2006:585). These shortcomings had led the investors to supplement the public SEE
disclosures with private disclosures from sophisticated SEE disclosure channels which they
developed.
Among the limitations of Solomon and Solomon's (2006) study was the limited size of the sample
it employed, which weakened the generalisability of its findings to all the institutional investors in
the UK. The study is also outdated, having been conducted more than six years ago. In addition,
its findings may not represent the views of the investors in a lesser developed country such as
South Africa. Besides, the study did not ask the investors to rank the relative importance of SEE
disclosures as compared to other disclosures.
Although Solomon and Solomon's (2006) study revealed the investors’ views on SEE disclosures,
such views were based on what the users said, which at times may differ with their actual
perceptions (Rikhardsson & Holm, 2005:02). In recognition of the possible discrepancy between
what the users say are their perceptions and their actual perceptions, Rikhardsson and Holm
(2005) conducted an experimental study in Denmark to investigate the use of environmental
information in investment decision-making. Specifically, Rikhardsson and Holm (2005:03; 18)
prompted 94 graduate business students (proxies for investors), to assess the relative importance
of different sources of information based on the materiality of such information to long-term
investment decisions.
By order of importance, the findings revealed that the most valuable information was that on
management expectations for future periods, followed by income information (Rikhardsson &
Holm, 2005:15). By contrast, the least valued information was that on health and safety, followed
by currency information, then environmental information. The study further revealed that among
the different types of sustainability information, the value statements were considered to be the
most important, followed by environmental information, then social information, followed by
health and safety information, and finally ethical information (Rikhardsson & Holm, 2005:16). In
general, financial information was perceived to be more important for investment decision making
than any of the sustainability information (Rikhardsson & Holm, 2005:21). Among the limitations
of Rikhardsson and Holm's (2005) study were that it employed graduate business students as
proxies for investors, as their perceptions may not represent those of actual investors. In addition,
164
the study was conducted more than seven years ago in a developed country, Denmark. As such the
findings may not represent the perceptions of investors in developing countries such as South
Africa.
One common weakness on all the above cited studies that elicited the views of analysts and
investors is that none explored the views of the respondents on the reliability of sustainability and
related disclosures. In a unique study, Hodge, Subramaniam and Stewart (2009) examined
whether assurance, level of assurance and the type of assurance provider, affected the users'
perceptions of reliability of sustainability reports in Australia. Based on an experimental survey
administered to 126 MBA students (proxies for users), Hodge et al., (2009:02) found that
provision of assurance improved perceived reliability of sustainability reports.
In addition, Hodge et al., (2009:02) found that report users placed more confidence in the
sustainability reports when the level of assurance provided was reasonable (high), and when such
assurance was provided by a top tier accountancy firm, rather than when the assurance is provided
by a specialist consultant. By contrast, no such difference was found when the level of assurance
provided was limited (low) for either type of assurance provider group. These findings suggested
users' need for an improved assurance on sustainability reports, with proper wording to enable
them to differentiate between the levels of assurance, if these reports were to be perceived as
reliable (Hodge et al., 2009:02). However, Hodge et al's., (2009) study used MBA students whose
perceptions may not represent those of actual investors. In addition, it only tested limited aspects
of assurance and left out other key aspects such as users’ perceptions on the materiality, scope and
completeness of the assurance engagement. Furthermore, as an Australian study, its findings may
not be applicable to South Africa.
A common weakness that is unique to the two experimental studies cited above (Rikhardsson &
Holm, 2005:02; Hodge et al., 2009) is the very nature of their experimental methodology that only
required the users to make simulated investment decisions. Accordingly, these studies did not
explore whether the respondents would seek sustainability information if not provided, other
reasons why they would want the information, and whether or not they were satisfied with the
information provided.
All the above cited studies on the views of analysts and investors focused on a single country. As
165
such their findings may not be generalisable to other countries. To provide an international
perspective, De Villiers and Van Staden (2010a) conducted an on-line questionnaire survey meant
to investigate the sustainability information needs of individual shareholders in Australia (305),
the UK (105) and the USA (64). Their findings revealed that the individual shareholders required
a description of a company's major environmental risks and impacts, disclosure of a company's
environmental policy, and disclosure of performance against measurable targets (monetary and/or
quantities) based on environmental policy (De Villiers & Van Staden, 2010a). In addition, they
required information on environmental costs grouped into categories, and that all environmental
disclosures be audited (De Villiers & Van Staden, 2010a).
The findings further revealed that most shareholders used (or would use) at least one type of
environmental information and that different types of environmental information were used (or
would be) used for different purposes (De Villiers & Van Staden, 2010a). Specifically, on one
hand information on environmental risks and impacts, environmental policy, evaluation of
sustainability/ecological footprint was (or would be) used mostly to inform investment decisions
such as whether to buy, hold or sell a company's shares (De Villiers & Van Staden, 2010a). On the
other hand, information on environmental targets, actual environmental performance against
targets, and independent environmental audit was (or would be) used mostly to hold companies
accountable. However, packaging and reduced life-cycle information was (or would be) used
mostly for shareholders' own interest. In general, environmental disclosures were (would be)
mainly used for investment decision-making (De Villiers & Van Staden, 2010a). This finding
contrasts with those of other researchers (BiE, 1994; Rikhardsson & Holm, 2005; Campbell &
Slack, 2008) but is consistent with that of Solomon and Solomon (2006).
Though commendable, De Villiers and Van Staden's (2010a) study did not investigate the
shareholders' satisfaction with the environmental disclosures, and neither did it attempt to
determine the shareholders' perceived relative importance of environmental disclosures as
compared to other types of disclosures. Besides, the study only focused on the needs of
shareholders in the developed countries and thus the findings may not represent the views of the
shareholders in developing countries such as South Africa. In view of the scarcity of studies in the
South African context that explored the environmental information needs of shareholders, De
Villiers and Van Staden (2010b) replicated their earlier international electronic questionnaire
survey in South Africa to determine the environmental information needs of individual

166
shareholders. In concurrence with their earlier findings (De Villiers & Van Staden, 2010a), De
Villiers and Van Staden (2010b:442) found that individual shareholders required companies to
disclose the following specific environmental information:environmental risks and impacts,
environmental policy, measurable environmental targets, performance against targets,
environmental costs by category, and an independent environmental audit report. In addition, the
shareholders preferred that this information be presented in a separate section of the annual report
and on company websites and that the disclosure of such information be prescribed by law, and/or
security exchange rules (De Villiers & Van Staden, 2010b:443).
In addition, the study revealed that most (94%) individual shareholders wanted environmental
information to hold companies accountable for their environmental stewardship, to address their
concern about climate change (84%), and allow companies to defend their environmental
management (79%) (De Villiers and Van Staden 2010b:443). Ironically, although most of the
respondents were classified as active investors, investment decision-making was perceived as the
least popular reason for requiring environmental disclosure (61%) (De Villiers and Van Staden,
2010b:443). Accordingly, unlike in the earlier study (De Villiers & Van Staden, 2010a) where
environmental information was (would be) mainly used for investment decisions, accountability
was perceived the most important reason why the individual shareholders wanted environmental
information in the latter study (De Villiers and Van Staden, 2010b:444). Nonetheless, this finding
concurs with De Villiers & Van Staden's (2010a) earlier finding on the use of information on
environmental targets, actual environmental performance against targets, and independent
environmental audit.
Like in their earlier findings (De Villiers & Van Staden, 2010a), De Villiers and Van Staden
(2010b:445) found that the individual shareholders used (would use) different types of
environmental information for different purposes. In particular, information on environmental
risks, policy, sustainability, and liability was (would be used) to inform investment decisions (De
Villiers and Van Staden, 2010b:445). Information on recycling, energy use and carbon neutrality
was (would be) used for own interest, whereas information on environmental audit was (would
be) used for purposes of accountability. However, some types of information (would be) were
used for more than one purpose (De Villiers and Van Staden, 2010b:443). Specifically,
information on performance against targets, rehabilitation and environmental targets was (would
be) used for investment decisions, accountability and for shareholder' own interest, whereas

167
information on waste handling was (would be) used for accountability and for shareholders' own
interest.
Although informative, De Villiers and Van Staden' (2010b) study neither investigated the
shareholders' satisfaction with the environmental disclosures nor did it attempt to determine their
perceived relative importance of environmental disclosures when compared to other types of
disclosures. In addition, it did not interrogate the extent to which the shareholders read the
environmental disclosures, and whether they sought the disclosures if not provided. Besides, the
study was conducted before the King III Report took effect.
4.3.4 Studies that elicited the views of multiple stakeholders
One limitation that is common to all the studies cited above on users' perceptions is that they all
elicited the views of a single user group. Accordingly they do not provide balanced views of
multiple user groups, which make them susceptible to the prejudices of the user group they
surveyed. To avoid a single user group's prejudices, some studies have been conducted to elicit the
perceptions of multiple users with regard to environmental and related disclosures. One such
study was conducted by the Investor Responsibility Research Center (IRRC) (1995), which
examined the perceptions of key stakeholders in the USA regarding whether published third party
attestation statements had enhanced the credibility of voluntary environmental reports produced in
1994. To this end, the researcher employed five focus groups that comprised environmental
groups, institutional investors, regulators, the media, and corporate environmental staff. The study
found that the third party statements did not enhance the credibility of the environmental reports
(IRRC, 1995:17).
In fact the credibility of environmental reports was perceived to be hinged mostly on features such
as the balance of tone and disclosure of numerous performance indicators (IRRC, 1995:22). The
description of selected company policies and presentation elements such as CEO statements and
graphics were perceived to be moderately important (IRRC, 1995:14). However, the third party
attestation statements were perceived to be among the lowest three items, out of 42 factors whose
impact on the credibility of the environmental reports was assessed by the focus groups (IRRC,
1995:16). Although insightful, IRRC's (1995) study was conducted more than 16 years ago before
sustainability auditing standards were developed. In addition, the study did not ask the
168
respondents what their other information needs were, whether they read or used the reports to
inform their decisions, their perception on the relative importance of environmental information
and whether they were satisfied by the environmental reports.
In a related questionnaire survey, Deegan and Rankin (2004) sought to establish whether users of
annual reports considered environmental information to be material for various decisions they
made and whether they searched for such information within the annual reports, among other
objectives. To this end, Deegan and Rankin (2004) surveyed 118 Australian respondents who
comprised shareholders, stockbrokers and research analysts, accounting academics,
representatives of financial institutions, and representatives of oversight organisations.
In tandem with Tilt's (1994) study, the findings of Deegan and Rankin (2004:576) revealed that
users required environmental information to be disclosed in the annual reports, and that the
reporting guidelines be mandated by the government as opposed to the accounting profession. In
further agreement with the earlier findings (Solomon and Solomon, 2006), 67% of all the
respondents in Deegan and Rankin's (2004:572) study believed that environmental issues were
material to their decisions. In particular, 83% of the reviewers indicated that environmental issues
were material to their decisions, followed by 72.4% of the shareholders, then 66.7% of the
representatives of financial institutions and 59.1 % of the academics (Deegan & Rankin,
2004:573). By contrast, only 43.8% of the stockbrokers and analysts believed environmental
issues to be material to their decisions (Deegan & Rankin, 2004:573), which concurs with the
findings of other similar studies (BiE 1994; Campbell & Slack, 2008).
The findings of Deegan and Rankin's (2004:573) study further revealed that 67.8% of all the
respondents sought the disclosure of environmental information in the annual reports. Specifically,
83% of the reviewers sought the disclosure of environmental information in the annual reports,
followed by 75% of the academics, 73.3% of the shareholders, then 50% of the representatives of
the financial institutions. By contrast, only 31.3% of the stockbrokers and analysts sought the
disclosure of environmental information in the annual reports (Deegan & Rankin, 2004:573),
which also concurs with the findings of other similar studies (BiE, 1994; Campbell & Slack,
2008). From the foregoing, it can be inferred that environmental information in the annual reports
was not material to the stockbrokers and analysts, hence they did not seek for this type of
information (Deegan & Rankin, 2004:573).
169
In agreement with the other studies (BiE 1994; Rikhardsson and Holm, 2005), Deegan and
Rankin's (2004:579) study also revealed that although environmental information was perceived
by most users to be important, it was not considered to be as important as financial information.
However, information on community involvement was perceived to be significantly less important
than all other items of information in the annual reports (Deegan & Rankin, 2004:573). Although
informative, Deegan and Rankin's (2004) study did not ask the users why they wanted or needed
environmental information, or if they had used, or even read the information. In addition, it only
elicited their views on annual reports, and ignored the other reporting media such as company
websites. Furthermore, the study was conducted in Australia, a developed country, therefore its
findings may not be generalisable to the South African reader groups. Besides, the study as dated
was conducted more than eight years ago, thus its findings may thus not be valid at present.
As already mentioned, at times, what users say differs with their actual perceptions (Rikhardsson
& Holm, 2005:02). In recognition of this discrepancy, Rowbottom and Lymer (2010) investigated
website usage to measure the download frequency of major annual reports items on the websites
of 15 listed companies in the UK in the year 2003 and 2004. Consistent with the prior findings
(BiE, 1994; Deegan & Rankin, 2004; Rikhardsson & Holm, 2005), Rowbottom and Lymer (2010)
found that the most frequently downloaded items were the compulsory financial statements, and
that the environmental reports were among the least down loaded items, thus they were not
deemed as relatively important. However, the data used in Rowbottom and Lymer's (2010) study
was collected more than seven years ago, and only focused on the websites of 15 companies,
which limits the generalisability of its findings. Furthermore, the study focused on companies in
the UK, a country where the Internet is readily accessible to the readers. Accordingly, the findings
may not be applicable to reader groups in countries with lower accessibility of the Internet, such
as most African countries. Besides, the study did not identify the reader groups that downloaded
the various items of the annual reports, and their unique needs.
In a unique global questionnaire survey designed to uncover the unique information needs of
users, KPMG and SustainAbility (2008) surveyed 1827 readers of sustainability reports, grouped
into three categories namely:business readers, civil society (NGOs and labour organisation
leaders), and others (investors, consultants, academics, individuals, public agency). In addition,
the researchers surveyed 452 non-readers to determine why they did not read the sustainability
reports. The findings of KPMG and SustainAbility (2008:02) revealed that most readers preferred
170
a stronger role for stakeholders in reporting, particularly in selection of the content to be reported
on. In particular, most readers (90%) expected the reporters to describe how and with whom they
had engaged and some evidence of a connection between the results from such an engagement and
the issues reported (KPMG & SustainAbility, 2008:15). In addition, the readers preferred that
their feedback be incorporated demonstrably into companies' strategies and targets, and that
reports be based on a continuous stakeholder dialogue, linked to the core business agenda (KPMG
& SustainAbility, 2008:15).
To highlight their need for credible information, most readers in the KPMG and SustainAbility
(2008:15) preferred a demonstration of commitment to sustainability via disclosure of dissenting
stakeholders' comments as well as a balanced disclosure of positive and negative information. In
addition, they wanted stronger and more relevant assurance processes on sustainability reports
based on globally accepted standards (KPMG & SustainAbility, 2008:39). Accordingly, the
groups expected information on what the assurance provider had done to reach conclusions, and
advocated for the use of an assurance provider with a reliable reputation (KPMG &
SustainAbility, 2008:25). The readers regarded the following disclosures as important attributes of
a good report: a link between sustainability strategy and overall business strategy; a full
integration of sustainability reports into annual reports and other corporate communications; and
commitment to sustainability (KPMG & SustainAbility, 2008:39). In addition, disclosure of
information on specific sustainability impact of a company's activities; actions taken to address
sustainability issues; a demonstration of how product and process innovation have been used to
respond to sustainability challenges and establishment of a business case for sustainability were
perceived as the other important attributes of a good report (KPMG & SustainAbility, 2008:39).
To highlight their need for comparable information, most readers expected the companies to use
well-regarded, globally-applicable reporting guidelines, particularly the GRI guidelines as well as
other sector-specific guidelines (KPMG & SustainAbility, 2008:12). The readers further wanted a
seamless accessibility to sustainability reports on both global and country level operations through
a variety of media (KPMG & SustainAbility, 2008:39), a finding which concurs with those of Tilt
(1994) and Danatas and Gadenne (2006).
Despite the above agreements among all reader groups, there were some minor differences among
them (KPMG & SustainAbility, 2008:11; 12; 16; 25; 27). In particular, the business reader groups

171
preferred professional assurance providers to provide assurance on sustainability performance,
whereas the civil society readers preferred stakeholder representatives for the same role (KPMG
& SustainAbility, 2008:12). This suggested a need for different types of assurance for different
user groups (KPMG & SustainAbility, 2008:25). Similarly, the civil society reader groups
prioritised reporting tailored to the needs of specific stakeholder groups, whereas the business
reader groups saw this as one of the least appealing needs (KPMG & SustainAbility, 2008:27).
Without mentioning the specific reader groups, the study further revealed that some reader groups
preferred narrative reports, whereas others were keen on numerical data (KPMG & SustainAbility,
2008:11). Likewise, some readers preferred a limited coverage of the key relevant sustainability
issues, whereas others preferred a wide coverage to allow them to determine what to read
themselves (KPMG & SustainAbility, 2008:16).
The KPMG and SustainAbility (2008:09) study further revealed that the 1827 respondents that
read the sustainability reports generally used the reports for different purposes. The business
reader groups, particularly the investors and consultants used the sustainability reports to make
investment decisions (KPMG & SustainAbility, 2008:27). By contrast, the civil society readers
used the reports to decide on whether to open a dialogue (70%), to enter into a partnership with
the reporting entity (55%), or launch a public campaign against a reporting entity (50%) (KPMG
& SustainAbility, 2008:27). The other readers used the reports to make decisions on whether to
buy products or services from the reporting entities, or supply their labour to the reporting entity
(KPMG & SustainAbility, 2008:09).
Apart from making decisions, the sustainability reports were also used for other purposes (KPMG
& SustainAbility, 2008:09). In particular, the business reader groups read the sustainability reports
to improve their understanding of specific sustainability issues, to get informed of better practices,
and for benchmarking purposes (KPMG & SustainAbility, 2008:08). By contrast the academics
and consultants read the reports for research and education purposes (50%) (KPMG &
SustainAbility, 2008:09). Yet, the NGOs read the reports to monitor the accountability of the
reporting entities to the society (KPMG & SustainAbility, 2008:09).
The study further revealed that a vast majority of users perceived the sustainability reports to be
relevant, detailed and easily accessible (KPMG & SustainAbility, 2008:11). However, 25% of the
respondents believed that the most significant issues particularly related to companies' failures
172
were omitted from the reports (KPMG & SustainAbility, 2008:12). Other pieces of vital
information perceived to be missing or incomplete included the overall sustainability impact of
the companies, and a description of risks and opportunities (KPMG & SustainAbility, 2008:12).
Although most readers (70%) were satisfied with the annual frequency of reporting, 30% wanted
more frequent reports (KPMG & SustainAbility, 2008:17). For the 452 respondents who did not
read the sustainability reports, they indicated that the main reason why they did not read the
reports was that the reports were too lengthy, or websites too difficult to navigate, which is an
indication of information over-load that rendered the reports unreadable. Other reasons provided
by non-readers in KPMG and SustainAbility's (2008:29) study included, a perception of no value
in the reports, a lack of knowledge of how to use the reports for decision making, the use of
alternative sources of sustainability information that are perceived to be more efficient and
understandable.
However, the KPMG and SustainAbility's (2008) study was conducted by organisations with
vested interest in sustainability consultancy and assurance services. As such it can be perceived as
a mere marketing tool for those services that lacks academic impartiality. In addition, the
respondents were mostly from Europe and Latin America with only 1% from Africa and Middle
East. Accordingly the findings of this survey may not be representative of the views of African
readers of sustainability reports. Furthermore, the study did not provide a thorough insight into the
varying needs of the various stakeholders as it only focused on two broad reader groups namely,
the business and the civil society reader group. As such it did not explore the unique needs of the
individual stakeholder groups within the broader groups. Besides, the study did not ask the readers
to rank the relative importance of the sustainability reports to their decisions.
In a follow-up survey that focused on the views of readers from developing countries, KPMG,
SustainAbility and Futtera (2010), elicited the expectations of 5227 readers across four continents.
Among the readers surveyed, 73% were from Brazil, 10% from India, 5% from the USA, and
12% from the rest of the world. The findings revealed that most readers wanted to see a genuine
account of performance, with robust data indicating progress over time on specific issues that
provides a proven track record of actions to achieve set goals (KPMG et al., 2010:12). They
further expected to see a clear link between sustainability and the business strategy adopted as
well as and external input in form of third-party assurance, and stakeholder comments (KPMG et

173
al., 2010:12).
The KPMG et al. (2010:06) study further found that most readers used the reports to inform
decisions on what products to use and in which companies to invest. In addition, the sustainability
reports were used to inform employment or fund seeking decisions (KPMG et al., 2010:23; 25).
Other ways in which the readers used the reports included, to share views with others, to inform
future dialogue with the reporting entities, for research purposes and to provide feedback to the
reporting entities (KPMG et al., 2010:23; 24). Interestingly, the reports were used for different
purposes in different countries (KPMG et al., 2010:23). Specifically, the Chinese used the reports
mainly to decide which products to use, whereas the Indians used the reports mainly to inform
their investment decisions (KPMG et al., 2010:25). By contrast, the Americans used the reports
mainly for research purposes (KPMG et al., 2010:23).
The findings also revealed that a majority of readers (90%) trusted the sustainability reports, and
did not consider it to be “green-wash” (KPMG et al., 2010:17). However, only 10% of the readers
believed that the sustainability reports provided a complete picture (KPMG et al., 2010:17). This
finding concurred with the earlier findings of KPMG and SustainAbility (2008), an indication of a
lack of improvement in the period between the two studies (2008 and 2010).
However, KPMG et al's., (2010) study, like all the studies conducted by advisory firms, was
conducted by organisations with vested interest in sustainability consultancy and assurance
services. As such it can be perceived as a mere marketing tool for those services that lacks
academic impartiality. In addition, the respondents were mostly from Latin America and Asia.
Accordingly the findings of the survey may not be representative of the views of African readers
of sustainability reports. Furthermore, the report failed to provide a thorough insight into the
unique needs of the different stakeholder groups, the extent to which they read the reports, the
types of decisions that would be made by different reader groups, their level of satisfaction and
ranking of relative importance of sustainability reports.
In an attempt to further obtain an in-depth insight into the unique needs of various reader groups,
the European Commission (2011b) explored the needs and expectations of various European
readers of sustainability reports using 24 in-depth telephonic interviews and five workshop
discussions. To this end, the readers were categorised into three main groups, namely; investors

174
and analysts, civil society (NGOs and charity organisations, media and journalists, consumers,
affected communities), and trade unions (employees). The European Commission (2011b:104)
found that the reader groups agreed to a large extent on what a good quality report should look
like. However, they differed to a lesser extent as each group expressed its preferences according to
its interests, relationship with the reporting company, and the purpose for which it intended to use
the report (European Commission 2011b:89).
Specifically, the investors and analysts required relevant, reliable, comparable, understandable,
and verifiable information linked to financial performance, risks and company strategy (European
Commission, 2011b:92; 93). Accordingly, they preferred certified facts and figures presented in
concise tables using a standardised set of parameters, as opposed to narrative statements of good
intent (European Commission, 2011b:92). In addition, they preferred mandatory sustainability
KPIs geared towards investment decisions that are aligned to financial reports (European
Commission, 2011b:93). Moreover, they wanted the KPIs to be reported in the annual reports and
be subjected to an appropriate level of mandatory assurance (European Commission, 2011b:93).
Accordingly, they called for the integration of sustainability reports into financial reports to place
sustainability information at the same level as financial information. These findings were
consistent with those of BiE (1994) and, Campbell and Slack (2008), but contradicted those of
Solomon and Solomon (2006).
The civil society reader groups, on the other hand, prioritised balanced and detailed sustainability
reports of companies' impacts, that provide a comprehensive and systematic analysis, and that use
standardised KPIs to ensure comparability of company reports to those of their peers (European
Commission, 2011b:94). In addition, they preferred timely, transparent, reports that are tailored to
cater for the diversified needs of different stakeholder groups. The civil society reader groups also
advocated for mandatory reporting and assurance requirement for companies' own impacts and
those of their entire supply chain (European Commission, 2011b:98). And that such assurance be
provided by an independent external expert, with additional verification via public multi-
stakeholder processes. Like the analysts, the civil society reader groups also championed for the
integration of sustainability information into the annual reports and expected the information to be
accorded the same status as financial information (European Commission, 2011b:98).
Within the ambit of the civil society, various reader groups had their own unique needs depending
175
on their relationship with the reporting entities (European Commission, 2011b:93). The media
preferred continuously updated sustainability news on the web, a candid disclosure of tough or
bad news, an explanation linking sustainability issues to a company's strategy, financial
performance, risk and new technologies (European Commission, 2011b:95). On the other hand,
the NGOs preferred information relevant to their own specific mission (European Commission,
2011b:95). By contrast, the consumers preferred product related information, to inform their
choices of products and were accordingly interested in clear information on products'
sustainability performance such as that contained on labels of product containers (European
Commission, 2011b:97). Yet the affected communities preferred adequate, detailed, forward-
looking, location-specific reports on the actual impacts and pollution produced, presented in the
right way, in an appropriate language and in a timely manner (European Commission, 2011b:97).
But the trade unions and employees needed relevant disclosures on worker related issues reported
in an adequate, reliable, consistent, comparable and complete manner (European Commission,
2011b:100). In addition, they expected the sustainability information to be anticipatory, verified,
and disaggregated on a country-by-country basis for multi-nationals, and that they be allocated a
greater role in the reporting process (European Commission, 2011b:101).
The European Commission (2011b:91) further found that investors and analysts hardly read or
used the reports to inform their investment or divestment decisions as they preferred to read
questionnaires from analysts valuation models, which concurred with the findings of some earlier
studies (BiE 1994; Deegan & Rankin, 2004; Campbell & Slack, 2008), but contrasted with the
findings of Solomon and Solomon (2006). In line with prior studies (Tilt 1994; Taib, 2005;
O’Dwyer et al., 2004), the European Commission (2011b:94) also found that the civil society
groups used the sustainability information when deciding whether to enter into partnerships with
the reporting entities or whether to confront companies with a poor sustainability performance.
Not only did they read the reports extensively, they also adopted a proactive approach by actively
participating in co-writing of sustainability reports with the reporting entities (European
Commission, 2011:102).
As expected, the media sought and read specific sustainability news which it used to inform the
members of the public and to hold companies accountable for their performance (European
Commission, 2011:89). Accordingly it employed the information when deciding which company
to name and shame (European Commission, 2011b:95). By contrast, the consumers used the

176
sustainability information conveniently availed on container labels, when deciding which product
to purchase (European Commission, 2011b:97). On the other hand, the affected communities
employed information on impacts and pollution contained in sustainability reports to make
decisions on whether to take action against companies perceived to have polluted the local
environment, either directly or by partnering with the NGOs to confront such companies
(European Commission, 2011b:97).
The employees and trade unions read sustainability reports to a very limited extent (European
Commission, 2011b:99). For those that did, the information was used to inform decisions such as
whether to pressurise companies to take a greater account of sustainability factors (European
Commission, 2011b:99). The lack of interest in sustainability information by this group was partly
attributed to the fact that it was directly related to the reporting entities and had a direct access to
sustainability information, and thus did not need the publicly available sustainability reports
(European Commission, 2011b:99). Equally, the readers in the group had focused on basic issues
such as remuneration and working conditions, but not on wider issues such as the environmental
issues (European Commission, 2011b:99). Besides, many respondents in this group lacked
experience and training to deal with sustainability issues (European Commission, 2011b:99).
The European Commission's (2011b:91) study further revealed that the investors and analysts
were dissatisfied with the quality of the reports which they perceived to be irrelevant, given that
they contained backward looking information, whereas they required forward-looking
information. In addition, they were mostly in the form of narrative statements of good intent,
whereas these readers required numbers and figures (European Commission, 2011b:91). This
finding concurred with some earlier studies (BiE 1994; Deegan & Rankin 2004; Campbell &
Slack 2008), but it contrasted with the findings of Solomon and Solomon (2006).
Similarly, the civil society reader groups were in general dissatisfied with the sustainability
reports, which they also perceived as increasingly irrelevant to their needs (European
Commission, 2011b:94). In particular, the reports were perceived to focus more on positive news
and topics that are easy to cover, with little detail on contentious issues (European Commission,
2011b:94). In addition, the reports dealt with isolated issues, whereas the readers preferred a
comprehensive systematic analysis. The reports also lacked standardised KPIs which rendered
them incomparable, were too untimely to be useful in addressing specific problems, and were

177
mistrusted, given that “green-wash” was perceived to be rife and on the rise (European
Commission, 2011b:94).
In particular the NGOs mistrusted the sustainability reports as they perceived the reports to be
irrelevant, self-advocacy tools that lacked complete information, particularly the negative
information (European Commission, 2011b:95). Equally, the media perceived the reports as
lacking in information on sensitive negative issues as well as an explanation on the link between
sustainability issues, business strategy and financial performance (European Commission,
2011b:95). On the other hand, the consumers were dissatisfied with the sustainability reports
which they perceived to contain lengthy raw sustainability data, whereas they required
conveniently framed and precise sustainability information to allow quick decision-making
(European Commission, 2011b:97). Where such information was availed on products' containers,
it was unclear or lacked key information. For the affected community groups, the annual
sustainability reports did not often reach them in the right way, at the right time and language, and
typically lacked adequate location-specific information to enable them to take an appropriate
action (European Commission, 2011b:97).
The trade unions and employees found the sustainability reports to vary widely in terms of
availability, quality and relevance between and within sectors and countries (European
Commission, 2011b:100). Accordingly, they perceived the reports to be irrelevant. Specifically,
the reports were perceived to contain more disclosures about policies and objectives than on how
those policies were actually implemented (European Commission, 2011b:100). Similarly, the
reports were perceived to provide more information on governance than on social and
environmental issues, and employed targets and KPIs that were often not relevant to business
strategies (European Commission, 2011b:100). Most importantly, the reports were perceived as
unreliable and incomplete especially regarding sensitive contentious issues (European
Commission, 2011b:100).
The main drawback of the European Commission's (2011b) study is that its findings cannot be
generalised given the ad hoc small sample it employed. Furthermore, the study did not elicit the
perceptions of the various reader groups with regard to relative importance of sustainability
reports to decision making when compared to other types of reports. Besides, the study was based
on the views of European readers, and as such may not be applicable in the context of a

178
developing country such as South Africa.
In a similar study, Mitchell and Hill (2010) investigated the expectations of a variety of South
African stakeholder groups with regard to Corporate Social Responsibility (CSR) disclosure, and
whether those expectations had been met. To this end they surveyed 121 representatives of key
stakeholder groups using questionnaires, and a further eight using interviews. Mitchell and Hill
(2010:49) found that all stakeholders universally believed that the CSR disclosures should be
included in the annual reports, be prepared to the same standard as the financial disclosures and be
externally verified.
However, Mitchell and Hill (2010:51) also noted some differences in preferences among different
stakeholder groups. In particular, trade unions felt strongly about the need for external
verification, whereas financial analysts were less enthusiastic about the same (Mitchell & Hill,
2010:68). Similarly, trade unions and environmental groups considered CSR disclosures to be
more important than did bankers, accountants and financial analysts (Mitchell & Hill, 2010:65).
Although all stakeholder groups generally wanted the CSR reports to be tailored to their needs,
the trade unions felt more strongly about this than the others (Mitchell & Hill, 2010:68). Likewise,
most groups considered reporting of impacts such as environmental pollution to be important, or
very important, but the environmental groups considered reporting on such impacts to be
extremely important (Mitchell & Hill, 2010:65).
Mitchell and Hill (2010:49) further found that the stakeholder groups were generally dissatisfied
with the CSR disclosures as issues perceived to be important, such as impact on the society,
employees, consumers, the biotic and environment were inadequately reported on. To the groups,
key issues were either poorly reported on or omitted from the reports all together (Mitchell & Hill,
2010:65; 66). Probed further, the groups provided varying reasons for inadequate disclosure
(Mitchell & Hill 2010:69). Environmental groups felt that companies considered the CSR
information to be too sensitive to release, whereas trade unions attributed the inadequacy to a lack
of legislation to compel companies to disclose the information (Mitchell & Hill, 2010:69).
Chartered accountants and financial analysts thought that the costs of CSR disclosure exceeded
the benefits, but the bankers opined that the CSR data was just not available (Mitchell & Hill,
2010:69). However, Mitchell and Hill's (2010) study was conducted prior to the King III Report
taking effect, thus its findings may not be valid at present. In addition, the study did not ask the
179
readers the extent to which they read the CSR reports, whether they employed the reports to
inform their decisions, and how they perceived the relative importance of the CSR reports when
compared to other types of reports.
4.3.5 Gaps in prior literature on users perception of decision-usefulness of environmental reports
The following research gaps have been identified from the review of the prior literature in this
section.
• Most studies elicited the views of respondents from other countries, particularly the
developed countries. Only a few studies elicited the perception of South African respondents.
Between 1998 and 2010 no survey of South African users could be traced.
• None of the reviewed prior studies employed a theory to describe, evaluate, or even prescribe
decision-useful environmental reporting practices. Therefore the reviewed studies lack
richness and depth, which could explain their lack of substantive conclusions.
• The most comprehensive of the prior studies were conducted by organisations with vested
interests in environmental reporting as a marketing tool for environmental consultancy and
assurance services – such studies lacked academic impartiality.
• Many studies were undertaken more than ten years ago, thus their findings are dated and may
not be valid in the current times.
• Some of the studies only surveyed the views of a single user group, some of who have vested
interest in answering questions in a particular way to support their pre-existing prejudices.
Accordingly, such studies failed to provide balanced views of different stakeholder groups.
On the other hand, those that surveyed the views of multiple users typically presented those
views in general, and thus failed to provide specific views of each reader group.
• Some studies did not elicit the views of actual readers of environmental and related reports,
instead they relied on the views of proxies such as students, which may not reflect the views
of actual readers of those reports.
• Other studies only elicited users' perceptions on limited aspects of sustainability and
environmental reports like the assurance of the reports. For those that focused on assurance,
they did not elicit users' perceptions on key aspects of assurance such as materiality, scope
and completeness of the assurance engagement.
• All the South African studies were conducted prior to the King III Report taking effect, thus
180
their findings may not be valid in the post King III Report era.
• Many studies employed small sample sizes which limited the generalisability of their findings
to their entire population of users or led to inconclusive results.
• Only a few studies focused on the preferences and decision behaviour of users of
environmental reports, instead most covered a wide-range of issues contained in sustainability
reports. For those that focused on environmental reports, they were often restricted to a
specific target group, typically the environmental groups.
A more recent study is therefore required to address the afore-mentioned gaps, particularly in the
context of South Africa where there is a dearth of research on environmental report users'
perceptions. This study will address the identified gaps by exploring South African users'
perceived needs, usage, satisfaction and relative ranking of environmental reports.
4.4 STUDIES ON THE EXPECTATION GAP BETWEEN PREPARERS AND USERS OF
ENVIRONMENTAL REPORTS
An expectation gap occurs when there is a difference in expectations between a group with
expertise on a particular subject (preparers) and a group which relies upon that expertise (users)
(Deegan and Rankin, 1999:315). This section reviews the prior literature that attempted to
determine whether there was a difference between the expectations of users and preparers in
relation to environmental reports. Such a review is necessitated by the dissatisfaction of users with
the environmental reports as found in section 4.3.
4.4.1 International studies
A few studies have been conducted to determine whether there is an expectation gap between
users and preparers of environmental reports. One such study was conducted by Deegan and
Rankin (1999), who investigated whether there was an expectation gap in the perceived decision-
usefulness of environmental information contained in annual reports of Australian companies.
Using a questionnaire survey, they compared the perceptions of 116 preparers (business
executives) to those of 118 users (shareholders, brokers and analysts, accounting academics,
representatives of financial institutions and review organisations) of annual reports. Deegan and
Rankin (1999:313) found significant differences in perceptions between users and preparers on

181
various environmental issues.
In particular, a majority of users (67.8%) sought the environmental information in the annual
reports, whereas only 24.1% of the preparers disclosed this information in their annual reports,
and fewer had plans of doing so in the future (Deegan & Rankin, 1999:329). Similarly, the
preparers preferred scattering the information in various sections of the annual reports whereas the
users preferred that such information be confined to a separate section of the annual reports
(Deegan & Rankin, 1999:331). The study further revealed that the users perceived the
environmental reports to be significantly more important to them than the preparers did (Deegan
& Rankin, 1999:336). Similarly, users preferred that guidelines on disclosure of environmental
information be provided by accounting professional bodies and governments, whereas the
preparers were either neutral or did not want any guidelines to be provided (Deegan & Rankin,
1999:337).
An expectation gap was also apparent on the perceived influence of investors and lobby groups as
well as on the importance of due diligence requirements (Deegan & Rankin, 1999:340). Whilst the
preparers perceived investors to have a greater degree of influence on the environmental
disclosure policies of entities, the user groups did not (Deegan & Rankin, 1999:340). Similarly,
the preparers perceived the lobby groups to have lesser influence than perceived by the user
groups. Likewise, the preparers perceived due diligence requirements to be more important than
the users did (Deegan & Rankin, 1999:340). Deegan and Rankin (1999:336) also found some
differences in perceptions within the preparer and user groups. With regard to whether
environmental disclosure in the annual report should be voluntary or regulated, most preparers,
except those from the mining sector, were neutral in this regard, whereas most users except
brokers and analysts, were in favour of some form of regulation (Deegan & Rankin, 1999:337). In
other words, the preparers from the mining sector supported the regulation of environmental
disclosures in the annual reports, whereas the brokers and analysts were neutral on this issue. The
researchers concluded therefore that there was an expectation gap between the preparer and the
user groups, hence the need for improved environmental reporting in Australia (Deegan & Rankin,
1999:341).
Although enlightening, Deegan and Rankin's (1999) study was conducted more than 12 years ago,
at a time when the quality of environmental disclosures was fairly low. For this reason, the

182
findings of the study may not be applicable in the current times. Furthermore, the study did not
investigate whether there was an expectation gap with regard to the perceived attributes of a
decision-useful environmental report. Besides the study was conducted in Australia, therefore the
views of the respondents may not reflect those of users and preparers in the context of a
developing country such as South Africa.
4.4.2 South African studies
In a South African study, Myburgh (2001) compared the perceptions of 129 preparers (financial
directors or chief accounting officers) of annual reports and interim reports to those of 102 users
(stockbrokers, shareholders, accounting academics, accounting conference delegates, members of
professional accounting bodies, individual investors) of those reports. To determine if there were
significant differences between the perceptions of the two, Myburgh (2001) required the
respondents to rank 49 voluntary disclosure items, in terms of perceived importance, based on the
effect of those disclosures on the market price of a company's shares. Myburgh (2001:211) found
significant differences between the perceptions of preparers and those of users. In order of
importance, the users ranked the environmental disclosures at 41.5 out of 49 items, whereas the
preparers ranked the same at 48 out of 49 items (Myburgh, 2001:211). Thus, the users perceived
the environmental disclosures to be relatively more important than the preparers did. Therefore
there was evidence of existence of an expectation gap between the preparer and the user groups,
with regard to the importance of environmental information hence the need for improved
environmental reporting in South Africa (Myburgh, 2001:213).
Among the drawbacks of Myburgh's (2001) study was the fact that it was conducted more than 11
years ago, before King II and King III Reports took effect, thus its findings may not be valid
presently. Additionally, the study failed to provide an in-depth comparison of the perceptions of
preparers and users, on the decision-usefulness of environmental reports but rather compared their
perceptions on the importance of 49 voluntary disclosures in the annual reports. Besides, the
perceived importance was based on the effect of the information on the share price of a company,
thus effectively excluding the non-financial stakeholders who are generally not interested in share-
price information.
In another South African questionnaire survey, Mitchell and Quin (2005) compared the

183
expectations of preparers (company employees and environmental consultants) and users
(environmental pressure groups) of environmental reports, with regard to the perceived
importance of environmental reports, important areas that should be reported on and the expected
levels of disclosure. Mitchell and Quin's (2005:17) study found significant differences between
the expectations of users and preparers.
Predictably, the users expected higher levels of disclosure than the preparers in general (Mitchell
& Quin's, 2005:26). Similarly, significant differences were found between the perceptions of users
and preparers with regard to the importance of specific areas of environmental disclosure
(Mitchell & Quin's, 2005:28). In this regard, some preparers (company representatives) rated
many disclosures to be of lesser importance than the users (pressure groups). Such disclosures
included information on recycling, energy efficiency, emergency management, research, effluent,
noise, by-products, energy sources, raw materials, life cycle analysis, awards and media coverage
(Mitchell & Quin's, 2005:27). Similarly, other preparers (environmental consultants) considered
air emissions to be more important than did some users (pressure groups) (Mitchell & Quin's,
2005:28). By contrast, some users (pressure groups) considered disclosures on packaging,
contributions and membership to be more important than both preparers, perhaps due to the fact
that the latter two aspects represented significant sources of funding and support base for them
(pressure groups) (Mitchell & Quin's, 2005:28).
The users and preparers also disagreed significantly on whether stakeholders' should access
environmental reports, and on whether such reports should be included in the companies' annual
reports (Mitchell & Quin's, 2005:25). Specifically, some preparers (the environmental consultants)
felt more strongly that stakeholders should have more access to environmental reports, which
should be included in annual reports, than the users. All told, there was evidence of the existence
of an expectation gap between preparer and user groups, hence the need for improved
environmental reporting in South Africa (Mitchell & Quin's, 2005:31). Although Mitchell and
Quin's (2005) study was unique in the South African context, it only surveyed the views of one
category of users (environmental pressure groups), who are known to provide prejudiced answers
to further their own ulterior objectives. In addition, the study is outdated as it was conducted more
than seven years ago. Besides, the study did not investigate whether there was an expectation gap
with regard to the perceived attributes of a decision-useful environmental report.

184
4.4.3 Gaps in prior literature on the expectation gap between preparers and users of environmental
reports
From the review of the prior literature in this section, the following gaps have been identified:
• Only a few studies examined the existence of an expectation gap between preparers and users
of environmental reports, globally and even in South Africa.
• The three studies were conducted at least seven years ago. Given the dynamic nature of
environmental reporting, the findings of these studies may not be not applicable at present.
The South African studies were conducted before King III Report took effect, thus their
findings may not be valid, as the report is expected to change the reporting landscape.
• None of the studies addressed the expectations of preparers and users with regard to the
decision-usefulness of environmental disclosures, but rather compared their views on wide-
ranging issues of disclosures in the annual reports.
• One of the studies compared the perceptions of preparers’ and users’ on the effect of
information on the share price of a company, thus it effectively excluded non-financial
stakeholders. Yet another compared the expectations of preparers to those of environmental
pressure groups known to provide prejudiced answers to further their own ulterior objectives.
Thus, it failed to compare preparers' expectations to all-rounded expectations of a variety of
users.
The cited gaps suggest a need for a more recent study, such as this one, to compare and contrast
the expectations of preparers to those of users with regard to decision-usefulness of environmental
reports in the South African context, with a view to confirm if indeed an expectation gap exists. If
the gap is found to exist, this study will suggest an appropriate intervention to reduce it, which
should in turn increase the decision-usefulness of environmental reports.
4.5 RESEARCH QUESTIONS
Considering the gaps in prior studies, the following questions have remained unanswered:
• Do the stakeholders of South African companies find the environmental reports prepared by
the companies to be decision-useful?

185
• What is the nature and type of the current environmental reporting practices by South African
companies? Do the South African environmental reports have decision-useful attributes?
• What are the information needs of users of environmental reports produced by South African
companies?
• To what extent do the users read the environmental reports and employ the environmental
reports when making decisions?
• To what extent are the users of environmental reports satisfied with the decision-usefulness of
the reports?
• How do users rank environmental information relative to other types of information such as
financial and social responsibility information?
• Is there an expectation gap between preparers and users of environmental reports with regard
to the need for, and the decision-usefulness of the reports?
4.6 CHAPTER SUMMARY AND CONCLUSION
This chapter sought to describe and summarise the prior literature on decision-usefulness of
sustainability reports in general and environmental reports in particular. The key content analysis
studies that evaluated the decision-usefulness of environmental reports were discussed followed
by those conducted to determine the environmental information needs of users and whether or not
they read and employed the information to inform their decisions. The chapter then reviewed the
studies meant to ascertain the level of satisfaction of users with the decision-usefulness of the
environmental reports, followed by those meant to determine the relative importance of
environmental information to that of other types of information. Next, the chapter reviewed
studies meant to ascertain whether there was an expectation gap between preparers and users of
environmental reports. In doing so, gaps in the prior literature were highlighted.
The content analysis studies, revealed that the quality of sustainability disclosures in general, and
environmental disclosures in particular were questionable, as most disclosures were irrelevant,
unreliable, incomparable, untimely, incomprehensible, and unverifiable. Nevertheless, the
industries with a higher impact on the environment appeared to have a better quality of disclosures
than those with a lower impact, and the volume of those disclosures appeared to have increased
over time.
186
The review of studies on users’ needs revealed the attributes of environmental (sustainability)
information that the users preferred namely; relevance, reliability, understandability,
comparability, verifiability and timeliness. Nevertheless there were some differences as some
preferences seemed to vary from one reader group to another, based on a group's unique needs and
the country in which the group is located.
With regard to the extent to which the users read and employed the information to inform their
decisions, the literature review revealed that various user groups read and employed
environmental information to inform various decisions such as whether to take action against
companies that did not disclose environmental information, whether to partner with companies
that reported satisfactorily, and whether or not to buy products or seek employment in a company.
The prior literature also revealed different patterns of usage of environmental reports in different
countries. However, some stakeholders notably the investors, stockbrokers and analysts employed
environmental information to a very limited extent as they perceived it to be immaterial to their
decisions.
With regard to the level of satisfaction of users with the decision-usefulness of the environmental
reports, all studies indicated some level of dissatisfaction, albeit not to the same extent. Some
studies, particularly the early ones found that the users were generally dissatisfied with the
environmental disclosures which they perceived to be unreliable, irrelevant, untimely,
incomparable, unclear, unverifiable, incomplete and insufficient. Other studies revealed that some
media of disclosure were deemed more reliable than others, and that some were more
understandable than others. Yet other studies revealed that environmental information was viewed
by users as insufficient even when deemed relevant. By contrast, a few studies, particularly the
more recent ones, found the reports to be satisfactory to some users and not others.
With respect to the perceived relative importance of environmental information, most studies
indicated that users perceived financial disclosures to be the most important items in the annual
reports and that environmental and social information were among the least important items, with
all the other items falling in between. However, for those other items, their perceived importance
seemed to vary from one reader group to another.
Some studies found significant differences between the expectations of users and preparers in
187
relation to various issues related to environmental reporting such as disclosure levels, reasons for
and importance of topics disclosed, the medium of disclosure, frequency, location and regulation
of disclosures. By contrast, some studies revealed some convergence in the views of the users and
some preparers on certain issues.
This chapter also identified gaps in prior literature ranging from relatively limited research on the
users of environmental reports of companies operating within the developing countries, to failure
of the prior studies in acknowledging the emergence of alternative media of reporting, apart from
the annual reports. In addition, none of the studies applied any theoretical perspectives to describe
or evaluate current environmental reporting practices, or even prescribe future decision-useful
environmental reporting practices of companies operating in developing countries. Furthermore,
most studies lacked academic impartiality given that the researchers employed them as marketing
tools for their services, and were undertaken in a short period, are out-dated and employed ad hoc
samples which do not allow for generalisability of the research findings.
Most studies also covered a wide-range of sustainability issues besides the decision-usefulness of
environmental reports. By contrast, some studies only surveyed the views of a single user group,
and thus failed to provide balanced views of all key reader groups. Yet even those that surveyed
the views of multiple user groups did not provide the views of each reader group but instead
addressed the aggregated views of all reader groups surveyed. Worse still, some studies did not
elicit the views of actual readers about sustainability, or environmental reports, instead they relied
on the views of proxies, which could differ with those of the actual users. Besides, most studies
focused on limited aspects of sustainability or environmental reports, and produced inconsistent
results.
Given the above-mentioned gaps in the prior studies, the studies have raised as many questions as
they have answered. Accordingly there are many unresolved issues on the decision-usefulness of
environmental reports, over which the empirical evidence is either inconclusive or contradictory.
Based on the studies performed since 1990 to 2012, the final conclusion regarding the decision-
usefulness of environmental reports produced by South African companies still seems evasive.
The following chapter discusses the research methods employed to achieve the objectives of this
thesis. Chapter 5 discusses the content analysis method and the questionnaire survey method.
188
CHAPTER 5
RESEARCH DESIGN AND METHODOLOGY
5.1 INTRODUCTION
The purpose of this chapter is to outline the research methods employed in this study to address
the following research objectives:
• To evaluate the decision-usefulness of the current environmental reporting practices by South
African companies
• to determine the informational needs of users of environmental reports produced by South
African companies
• to determine the extent to which users read the environmental reports and whether they
employ the environmental reports when making decisions
• to determine the degree of satisfaction of users with regard to the decision-usefulness of the
environmental reports and suggest ways of improving those reports
• to investigate how users rank environmental information, relative to other types of
information such as financial and social responsibility information
• to ascertain whether there is an expectation gap between preparers of environmental reports
and users of those reports with regard to the decisions-usefulness of the reports
To address the research objectives, two methods were found to be appropriate and relevant, and
thus, were made use of; content analysis and questionnaire survey methods. Accordingly, this
study was conducted in two phases. The first phase, a content analysis study aimed at addressing
the first research objective is discussed in section 5.2. The second phase was a questionnaire
survey aimed at achieving the second, third, fourth, fifth and sixth objective, and is discussed in
section 5.3. Lastly, the chapter summary and conclusion is presented in section 5.4.

189
5.2 CONTENT ANALYSIS
5.2.1 Definition of content analysis technique
Content analysis has been defined in various ways. It has been defined as “any technique for
making inferences by objectively and systematically identifying specified characteristics of
messages” (Holsti 1969:14). It has also been defined as “coding words or other units of text
against a particular schema of interest, thus reducing the text to more structured and concise units
of information, so that inferences can be drawn from the text or its source” (Wolfe, 1991:282).
Additionally, Abbot and Monsen (1979:504) say it is “a technique for gathering data that consists
of codifying qualitative information, in anecdotal and literary form, into categories in order to
derive quantitative scales of varying levels of complexity”. Kripperndorf (1980:21) defined it as
“a research technique for making replicable and valid inferences from data to their context”. It has
also been described as a study that analyses the content of texts or documents, such as letters,
speeches and annual reports, and that such an analysis is not restricted to texts, but can be
extended to pictures, symbols, themes or any message that can be communicated (Mouton,
2005:165). In short, content analysis technique is essentially an analytical tool used to investigate
the content of communication (Hibbit, 2004:306).
5.2.2 Justification for the selection of content analysis technique
The first research objective, meant to evaluate the decision-usefulness of environmental reports
produced by South African companies required that the reports be analysed to determine their
relevance, reliability, comparability, understandability, timeliness and verifiability. Accordingly,
content analysis was deemed to be most appropriate as it has been widely and successfully used in
prior studies with a similar objective (Cowan, 2007:109; De Villiers & Lubbe, 2001:81; De
Villiers & Van Staden, 2006:763; Jose & Lee, 2006:311; O’Donovan, 2002:346).
Content analysis as a methodology was also selected because of its various advantages. First, it is
a non-reactive or unobtrusive technique as neither the reporting entity nor the intended reader of
the reports is aware that the reports will be analysed (Wolfe, 1991:282). Instead, the reporting
entity will act “naturally”, which leaves the researcher with documents to analyse. As a non-
reactive research technique, content analysis avoids the effects of non-response, interviewer and
190
social desirability bias that may occur when using questionnaires or conducting interviews
(Macnamara, 2005:06).
Secondly, content analysis technique, unlike questionnaires, structured and semi-structured
interviews, accepts unstructured data in a variety of forms, which is useful where the information
sought by the researcher may exist in a variety of forms, particularly when reported in a variety of
media (Kripperndorf, 1980; Wolfe, 1991:282). Besides, by accepting unstructured data in a variety
of forms, content analysis facilitates comparison of a variety of disclosure of environmental
information across different media such as IARs, SSRs and companies websites (Neuman,
1997:272).
Thirdly, the technique is highly flexible and allows a researcher to use it to varying degrees: from
simply identifying the presence or absence of the mention of a particular phenomenon in a
communication medium, to determining the decision-usefulness of such communication, to
assessing general compliance to guidelines such as the GRI guidelines (Wolfe, 1991:282).
Fourthly, by using content analysis technique, large quantities of data can be analysed across a
variety of media. This is because if the technique is properly applied, it has inbuilt replicability –
more than one person can be used to analyse documents (Kripperndorf, 1980:21).
5.2.3 Research population and sample
The population for the content analysis study comprised all operating large-cap (Top 40) and mid-
cap (Top 41-100) companies listed on the JSE (See Appendix I). The large-cap companies are
defined as the Top-40 listed companies on the JSE as measured by market capitalisation, whereas
the mid-cap companies refer to the next Top-60 companies as measured by market capitalisation
(Greyvenstein, 2010:43). These companies jointly form the top 100 listed companies on the JSE
by market capitalisation (Sharenet, 2013:01). An important justification for choosing these
companies is that they cover a broad range of business activities and account for a large
percentage of all of the South African economic output (Greyvenstein, 2010:35). In fact, the top
100 JSE listed companies represent over 95% of the entire JSE market capitalisation
(Greyvenstein, 2010:35).
The top 100 JSE listed operating companies were selected because of their significant
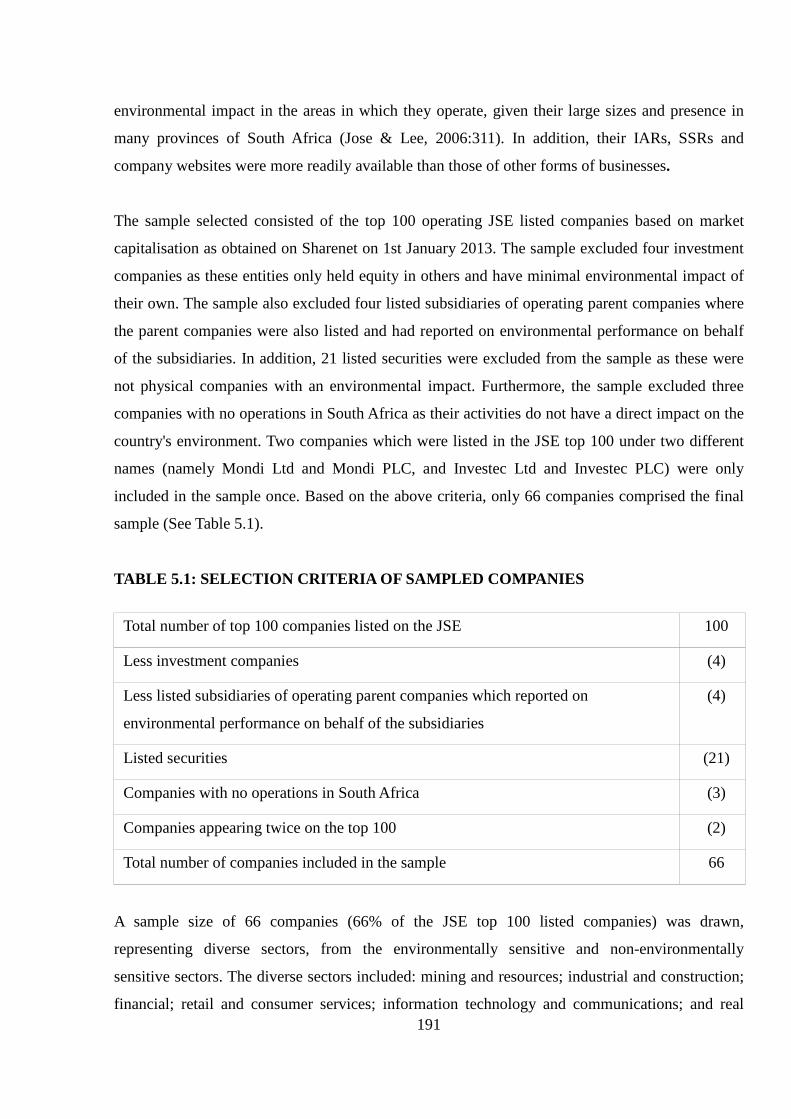
191
environmental impact in the areas in which they operate, given their large sizes and presence in
many provinces of South Africa (Jose & Lee, 2006:311). In addition, their IARs, SSRs and
company websites were more readily available than those of other forms of businesses.
The sample selected consisted of the top 100 operating JSE listed companies based on market
capitalisation as obtained on Sharenet on 1st January 2013. The sample excluded four investment
companies as these entities only held equity in others and have minimal environmental impact of
their own. The sample also excluded four listed subsidiaries of operating parent companies where
the parent companies were also listed and had reported on environmental performance on behalf
of the subsidiaries. In addition, 21 listed securities were excluded from the sample as these were
not physical companies with an environmental impact. Furthermore, the sample excluded three
companies with no operations in South Africa as their activities do not have a direct impact on the
country's environment. Two companies which were listed in the JSE top 100 under two different
names (namely Mondi Ltd and Mondi PLC, and Investec Ltd and Investec PLC) were only
included in the sample once. Based on the above criteria, only 66 companies comprised the final
sample (See Table 5.1).
TABLE 5.1: SELECTION CRITERIA OF SAMPLED COMPANIES
Total number of top 100 companies listed on the JSE 100
Less investment companies (4)
Less listed subsidiaries of operating parent companies which reported on
environmental performance on behalf of the subsidiaries
(4)
Listed securities (21)
Companies with no operations in South Africa (3)
Companies appearing twice on the top 100 (2)
Total number of companies included in the sample 66
A sample size of 66 companies (66% of the JSE top 100 listed companies) was drawn,
representing diverse sectors, from the environmentally sensitive and non-environmentally
sensitive sectors. The diverse sectors included: mining and resources; industrial and construction;
financial; retail and consumer services; information technology and communications; and real
192
estate (See Appendix J). Such an inclusion of sectors with varying degrees of environmental
sensitivity in the sample could permit an exploration of the impact of environmental sensitivity of
companies, if any, on the quality of environmental disclosures.
5.2.4 Framework for data collection
Before conducting any content analysis research, some questions need to be addressed, these
include where to analyse? (Determining the communication channels to be analysed also referred
to as the sampling units), what to analyse? (Defining the environmental disclosure, including any
categories to be included in a control list (checklist); and how to analyse? (Hanafi, 2006:162) –
(Codifying the data and calculating scores using a disclosure index). The following section
addresses each of these questions in detail.
5.2.4.1 Where? IARs, SSRs and companies' websites
The first decision that needs to be taken in a content analysis study is the choice of the
communication channel (sampling units) to be analysed (Hanafi, 2006:162; Kripperndorf,
1980:57). Whereas it is acknowledged that South African companies, frequently disclose their
environmental information through many channels (IARs, SSRs, company websites, brochures,
product packaging and labelling, advertisements and so on), it is practically impossible to identify,
let alone analyse the content of all communication channels (Hibbit, 2004:311). Faced with this
dilemma, the majority of researchers have elected a pragmatic approach of limiting the
communication channels that they analysed in their studies (Cowan, 2007; CPA Australia & GRI,
2013; Ernst & Young, & Greenbiz, 2013; Furmann et al., 2013; Kamal, 2012; KPMG, 2013).
Although several environmental information disclosure channels may be available, a limit must be
put on the range of documents to be examined in any particular study (Hibbit, 2004:311). An
attempt to analyse the content of all environmental disclosure channels available is bound to be
pragmatically, financially and technically infeasible (Hanafi, 2006:166). Besides, any researcher
who makes such an attempt is more likely to be overwhelmed by the sheer number of documents
to be analysed and still will not be able to analyse all environmental disclosures of a company
(Unerman, 2000).
Nevertheless, the sampling units selected should at least cover the bulk of environmental
193
disclosures, and the selection of the appropriate sampling unit should ultimately depend on the
research objectives, the environmental issues analysed as well as the population to which
inferences are to be made (Hibbit, 2004:312). Accordingly, the channels selected for this study are
the IARs, SSRs and companies' corporate websites. The justifications for the selection of these
channels are provided in the subsection that follows.
5.2.4.1.1 Justification for IARs (annual reports)
Various justifications have been put forward in the prior literature for selection of annual reports
as sampling units in content analysis studies. Firstly, annual reports are widely regarded as the
single most important and popular source of information on a company's activities, which any
general enquirer would tend to consult first (Hanafi, 2006:164; Hibbit, 2004:312; Milne & Alder,
1999). Secondly, annual reports are seen as a particularly effective legitimating medium by virtue
of their widespread use, acceptance and recognition by a variety of stakeholders, who rely on
them to inform their decisions (Bay & Petit, 1998; Deegan & Rankin, 1997; O'Dwyer, 2000). For
this reason, companies employ annual reports for construction of their own social imagery and
exert intellectual commitment, effort and care (Neimark, 1992; Hines, 1988). So much so that the
reports reflect companies' best effort to respond to their stakeholders, which does not only
influence how they are perceived but also indicates their attitudes towards societal concerns
(Halme & Huse, 1997).
Thirdly, the environmental priorities of the society tend to be in conflict with the financial
ambitions of companies (Gray, Kouhy & Lavers, 1995). Therefore the presentation, within the
same document, of environmental information alongside the financial information is an important
demonstration of how companies reconcile possible conflict between their financial objectives and
environmental priorities of the society, and presents an arguably all rounded performance of a
company (Gray et al., 1995; Hackston & Milne, 1996).
Fourthly, company annual reports have been analysed extensively in the majority of the prior
studies, therefore, the selection of the annual reports facilitates a comparison of the findings of
this study to those of prior studies (Deegan & Gordon, 1996; Deegan & Rankin, 1996; Gamble,
Hsu, Kite & Radtke, 1995; Harte & Owen, 1991; Niskala & Pretes, 1995). Fifthly, annual reports
are regarded as highly credible given that they are a formal or official statutory requirement with
sections that are audited mandatorily, readily available and widely accessible as they are regularly
194
produced on an annual basis (Tilt, 1994; Unerman, 2000; Wilmshurst & Frost, 2000;).
Accordingly, they are perceived as a reliable source of information by many stakeholder groups
(Buhr, 1998; Deegan & Rankin, 1997). For these reasons, the contents of IARs were analysed in
this study.
Although annual reports are an important medium of disseminating environmental information, a
content analysis study that entirely focuses on annual reports risks underestimating the volume
and quality of environmental information reported by companies, which makes such an analysis
incomplete (Robert, 1991). This is because annual reports are constrained in terms of space, and
have a variety of divergent reports that need to be included (Unerman, 2000:674). By contrast, an
analysis of environmental information disclosed in different media recognises the complimentary
roles of varied media, and presents a more complete picture of the reporting practice (Clarkson,
Li, Richardson & Vasvari, 2008; De Villiers & Van Staden, 2011). Indeed, some researchers have
observed that companies were using different media for different types of environmental
information, as the annual reports were no longer perceived to be the most appropriate medium
for the provision of all environmental information (Tilt, 2008). Therefore, studies that focus
exclusively on annual reports may not produce complete results (Hibbi,t 2004:313; O'Dwyer
2000; Lindblom, 1994).
Consequently, a number of more recent environmental content analysis studies have increasingly
employed other media in addition to annual reports as sampling units (Alin, Victor & Dumitru,
2011; Bolivar, 2009; Hibbit, 2004). Quite frequently, the SSRs have been employed (Laine, 2005;
Jones 2006; Bebbington & Larrinaga, 2007), as well as the environmental disclosures on
companies' websites (Lodhia 2006; Chatterjee & Mir 2008; Bolivar, 2009).
5.2.4.1.2 Justification for SSRs
The growing tendency by companies to supplement environmental reports in the annual reports
with other media, such as SSRs, are an indication that annual reports are no longer a sufficient
medium for disseminating the environmental reports (KPMG, 2005; 2008:Lodhia, 2006;
Bebbington & Gray, 2001). Indeed, some researchers have noted that SSRs by their very nature
are more comprehensive and informative in their disclosure of environmental information than
annual reports (Frost, Jones, Loftus & Van der Laan, 2005), and that some groups of users rely
more on SSRs than on annual reports in evaluating companies' environmental performance
195
(Danatas & Gadenne, 2006 ; O'Dwyer, Unerman & Hession, 2005). For these reasons, the current
study also analysed the SSRs.
5.2.4.1.3 Justification of companies' corporate websites
The recent decade has witnessed an unprecedented growth of Internet usage, with a corresponding
growth in disclosure of environmental information on company websites (Emtairah, 2002:12;
Bebbington & Gray, 2001; Patten & Crampton, 2004; Chatterjee & Mir, 2008:01). The Internet
has not only allowed a greater access to environmental information by the public, but it has also
enabled companies to provide such information in a timely and cost effective manner (Mlarvizhi
& Yadav, 2008:03). In addition, the internet has availed new web tools that can enhance the
relevance, reliability, comparability, verifiability, and understandability of environmental
information, in a manner that was previously not possible with annual reports (CSR Europe,
2010:15; HBS, 2010:viii; KPMG Huazhen, 2008:24; McKinsey Quarterly, 2009:03; McKinsey
Quarterly, 2010:02; Radley Yeldar & GRI, 2011:05).
Furthermore, research evidence from prior studies that compared environmental disclosures made
in the annual reports to those made on the corporate websites have suggested that, companies
were increasingly replacing annual reports as the main media of environmental reporting with
their websites (KPMG Huazhen, 2008:24). Given the growth in the use of the Internet as a
medium for disseminating environmental information, a content analysis study of environmental
reports that ignores the environmental disclosure on companies' corporate websites would be
incomplete (Unerman, 2000). Informed by the above arguments, this study also analysed
environmental disclosure on the sampled companies' corporate websites.
5.2.4.2 What? Control list and categories
Conducting content analysis research necessitates an accurate and exclusive definition of what is
to be studied (Hanafi, 2006:166; Kamal, 2012:221). This requires precise identification of the
mutually exclusive categories of environmental information disclosure, along with an extensive
list of relevant questions within each of the categories, all which are incorporated in a control list
(check list). The control list is then used to interrogate equally and capture the presence or absence
of specific disclosures in all the sampled environmental reports (Hanafi, 2006:167).

196
The definition of environmental disclosure, though arbitrary in nature, is afforded some degree of
precision and uniqueness through the use of decision rules which determine how environmental
disclosures are categorised (Kripperndorf, 1980). According to Holsti (1969), well established
decision rules do not only enhance the objectivity and reliability of the research instrument used,
but also facilitate replication by other researchers.
To determine whether pre-selected items of environmental information had been disclosed in the
various environmental reports, 200 questions divided into 44 categories were compiled in five
control lists (See A, B, C, D, and E). The control lists were based on prior studies (Wiseman,
1982; Borgiages & Vorster, 1993; Wingard, 2001), a well-known environmental quality scorecard
(Delloite Touche Tohmatsu, 2002), and the GRI Guidelines (GRI, 2008). To capture the quality of
environmental information disclosed by the sampled companies, the control lists were designed to
be consistent with the qualitative characteristics of decision-useful information, namely;
relevance, reliability (combined with verifiability to ease data collection and avoid duplication),
comparability, timeliness and understandability. The control lists were also meant to serve as a
permanent record of the content analysis work performed on the environmental reports of the
sampled companies, with one set of five being compiled for each company's environmental
reports.
5.2.4.3 How? Measurement, judgement scale and development of disclosure indices
5.2.4.3.1 Measurement of environmental disclosures in the prior literature
Some researchers have measured environmental information disclosure based on whether a
company's report contains any environmental information at all (See Ahmad, Hassan &
Mohammad, 2003; Brammer & Pavelin, 2006; Buniamin, Alrazi, Johari & Rahman, 2008).
However, this measure does not capture the depth and richness of the information (Alrazi, De
Villiers & Van Staden, 2011:234).
Other researchers have measured environmental information disclosure by counting the number of
words, sentences, number or proportions of pages (see Hackston & Milne 1996; Hooks & Van
Staden 2011; Milner & Alder 1999; Unerman 2000), line counts (Choi, 1999; Pattern, 2002;
Wiseman, 1982) or number of theme occurrence (Walden & Stagliano, 2004). However, merely
counting words, sentences, pages and so on, only focuses on the quantity of information disclosed

197
and not on the quality of disclosure. This approach does not suit the objective of this study.
Besides, such counting only focuses on the information itself rather than the format in which it is
presented, and does not capture non-narrative disclosures such as pictures, photographs, charts
and graphical representations, which are effective communication tools that enhance the quality of
information disclosed (McMurtrie, 2005; Unerman, 2000).
Yet other researchers have employed a disclosure index in the form of a binary/dichotomous
scoring system, to search for the presence or absence of pre-determined items/concepts in chosen
texts, which then quantify and tallies the presence of the items found (Guthrie & Abeysekara,
2006). A score of one (1) is awarded if an item is present in the reports, and a score of zero (0), if
absent (Kamal, 2012:227). However, the binary coding system adopts an un-weighted approach
and thus can only assess the quantity of the environmental information disclosed, given that it
treats all items of disclosure equally (Guthrie & Abeysekara, 2006; Kamal, 2012:228).
According to Hasseldine, Salama and Toms (2005), the overall quality of environmental
disclosure, has a greater impact on the environmental reputation of a company, than the quantity
of the disclosure. This suggests that the quality measure is relatively more important than the
quantity measure (Alrazi et al., 2011:08). Consistent with this perspective, some researchers have
gone beyond just counting the number of disclosures, and have attempted to capture the quality of
such disclosures, by not only focusing on just what environmental information is reported, but
also on how such information is reported (Aerts & Cormier, 2009; Alrazi et al. 2011; Kamal,
2012; Wiseman, 1982; Wingard, 2001). To this end, they have employed ordinal
scaled/polychotomous disclosure indices to assess, rate, rank and benchmark the quality of
environmental reports of different companies (Jones & Alabaster, 1999).
Using ordinal scale indices, the researchers have assigned scores for disclosure of environmental
information depending on type and nature of data communicated, including the evidence
(monetary, quantitative, and declarative), the types of news (positive, negative and neutral), and
the time frame (Past, present, and future) (Wiseman, 1982; Wingard, 2001; Aerts & Cormier,
2009; Alrazi et al., 2011; Kamal, 2012). A typical ordinal scale would for instance be used to
assign scores for a disclosure item along a scale, from 0 for non-disclosure, 1 for narrative
disclosure, 2 for quantitative but non-monetary disclosure, and 3 for monetary disclosure (Alrazi
et al., 2011:08; Kamal, 2012 :73).

198
The use of an ordinal scale disclosure index has increasingly become more prominent in
environmental reporting research for various reasons. Firstly, ordinal indices are a more objective
measurement of quality than other qualitative assessments that do not assign scores or rankings to
the disclosed information (Wiseman, 1982). Secondly, the index mitigates some issues inherent in
the measurement of pages (such as treatment of blank pages, differences in font and size, and the
size of page margins), sentences (such as measurement for graphs, charts, pictures and visual
images), and words (considered to be meaningless without a sentence to put them in context)
(Alrazi et al., 2011:08). Thirdly, the index enhances the understanding of what is currently being
reported as much as what remains unreported, which uncovers the weaknesses in the current
reporting practices for future improvement.
Fourthly, when carefully constructed, an ordinal scale index is capable of assessing qualitative
attributes of information, including relevance, reliability, comparability, understandability,
verifiability and timeliness, simultaneously (Hooks & Van Staden, 2011). Given the first objective
of this research, which is to evaluate the decision-usefulness of environmental information
disclosures, the foregoing merits of an ordinal scale index are persuasive, therefore it is adopted in
this study.
5.2.4.3.2 Development of a Judgement scale
To measure the quality of environmental information that was gathered, a judgement scale was
designed that incorporated an adjusted ordinal scaled disclosure index/polychotomous scoring
system. The judgement scales were juxtaposed to each of the five control lists. Two scoring
systems were employed in the study, the first one with a score range of 0 to 3 (with an option of
two additional points) was employed to measure the relevance, reliability (including verifiability),
timeliness, and understandability of environmental information disclosures (See Appendix A, B,
C, D) (Kamal, 2012:73). The second one with a score range of 0 to 5 was employed to measure
the comparability of the environmental information disclosures (See Appendix E) (Alrazi et al.,
2011:19).
According to the first scoring system (with a score range of 0 to 3), a score of 0 was assigned for
non-disclosure, 1 for narrative disclosure, 2 for quantitative but non-monetary disclosure, and 3
for monetary disclosure (See Table 5.2) (Kamal, 2012:73). As with the prior studies, monetary
quantitative and non-monetary quantitative disclosures were accorded greater weight (3 and 2

199
respectively) in the judgement scale compared to narrative disclosures (1) because quantified
information is more precise, comparable and has higher potential value in decision-making by
various stakeholders (Kamal, 2012:73; Wingard, 2001:85). However, monetary quantitative
disclosures were weighted higher than non-monetary ones because they assist stakeholders in
assessing the financial implications of environmental decisions or actions on the overall
performance of a company (Kamal, 2012:233).
Moreover, presentation of monetary quantitative disclosures facilitates the integration of
environmental performance information with financial performance information (Howes,
1999:32). Such integration of both environmental and financial performance demonstrates how
the company reconciles possible conflict between its financial objectives and environmental
priorities of diverse stakeholder groups (Grey et al., 1995).
TABLE 5.2: JUDGEMENT SCALE FOR MEASURING RELEVANCE, RELIABILITY
(VERIFIABILITY), UNDERSTANDABILITY AND TIMELINESS OF
ENVIRONMENTAL REPORTS
Extent of disclosure Score
1 Not disclosed 0
2 Disclosed in narrative form 1
3 Disclosed in quantitative but non-monetary form 2
4 Disclosed in monetary form 3
5 Futuristic/forward-looking disclosures 1 additional point
6 Specificity 1 additional point
The judgement scale was adjusted to make a provision for one extra point over and above the
basic weight for environmental information disclosures that are futuristic/forward-looking
(Kamal, 2012:231). This is because futuristic information can influence future decisions, unlike
information about the past or present (Wingard, 2001:85). In addition, futuristic information, if
based on well-founded expectations increases predictability by reducing information asymmetries
and uncertainty (PricewaterhouseCoopers, 2006:05).

200
Another provision of one extra point was made over and above the basic weight, for specific
environmental information disclosures (Wingard, 2001:85). This is because specific disclosures
inform specific decisions and are more likely to be verifiable, thus accurate than general
disclosures which are typically made to legitimise companies' activities (De Villiers & Van
Staden, 2006:767).
The second scoring system (with a score range of 0 to 5) was used for measuring the
comparability of the GRI environmental performance indicators (Alrazi et al., 2011:19). The
scoring system assigned a score of 0 points for non-disclosure of a performance indicator; 1 point
for disclosure in a narrative form; 2 points for disclosure of a quantitative performance indicator
for the current period. 3 points for disclosure of a quantitative indicator relative to that of the prior
period. 4 points for disclosure of a quantitative indicator relative to targets; and 5 points for
disclosure of a quantitative indicator relative to peers or industry averages (Clarkson et al.,
2007:11).
TABLE 5.3 JUDGEMENT SCALE FOR MEASURING COMPARABILITY
Extent of disclosure Score
1 Not disclosed 0
2 Disclosed in a narrative form 1
3 Disclosed for the current period in quantitative form 2
4 Disclosed relative to prior periods 3
5 Disclosed relative to targets 4
6 Disclosed relative to peers or industry averages 5
Consistent with the prior studies, performance indicators disclosed relative to peers, targets and
prior periods were accorded greater weight (5, 4 and 3 respectively) in the judgement scale than
those disclosed for the current period only (1), because they provide a context that enables a
reader to judge how well or badly a company performed (Clarkson et al., 2007:08; Delloite
Touche Tohmatsu, 2002:35). However, performance indicators disclosed relative to peers were
assigned higher points than those disclosed relative to targets, because targets are set internally,
and therefore are less objective (OECD, 1997:03) (See Table 5.3).
201
On the other hand, the performance indicators disclosed relative to targets were assigned higher
points than those disclosed relative to prior periods because prior periods are historical, backward
looking, whereas targets are forward looking and reflect a company's seriousness in achieving its
future objectives (PricewaterhouseCoopers, 2007b:08). By contrast, the performance indicators
disclosed relative to prior periods were assigned higher points than those disclosed for the current
period only because they provide the trend, or trajectory of a company's past performance
(Clarkson et al., 2007:11).
5.2.4.3.3 Pilot study
Having developed five control lists and two judgement scales, a pilot study was conducted on
IARs, SSRs and corporate websites of ten randomly selected top 100 JSE listed operating
companies from different sectors. During the pilot study, the categories and questions in the five
control lists were refined, processes altered, and data sheets revised in preparation for the actual
coding and recording process. The pilot stage was also used for checking the reliability of the five
control lists and two judgement scales.
5.2.5 Data collection
5.2.5.1 Collection of environmental reports
The IARs and SSRs for the fiscal year ended 31 December 2013 were downloaded from
companies' websites in PDF format. For each of the companies included in the sample, the
researcher also searched for and saved the environmental disclosures found on a company's
website using a sitemap tool and homepage menu, during the period between 1st January 2013 and
31st December 2013. In addition, a check was conducted on company profiles and corporate
governance sections as these sections were expected to contain among other things, a message
from the chief executive officer/chairman, company vision, mission, policies, organisation
structure and awards. Other reports (apart from the IAR and SSR) such as mandatory reports,
environmental news releases, company bulletins, and periodic publications on the websites were
also considered, provided they contained environmental information and were related to the fiscal
year ended 31 December 2013. Also included in the content analysis was multimedia-based
environmental information such as audios and videos available on companies' websites.
However, since accessibility is an important aspect of web disclosures (Alrazi et al., 2011:12), the

202
content analysis was limited to two levels from the homepage/sitemap, unless further links
indicated disclosure of environmental information beyond the second level. Such a limitation was
necessary because it is unlikely that the stakeholders would spend much time seeking for and
evaluating environmental information in hidden sections of the websites (De Villiers & Van
Staden, 2011; Lodhia, 2006). Similarly, links to external websites, including those of subsidiaries
were excluded, as they were considered to be beyond the editorial control of companies (Tilt,
2008).
5.2.5.2 The actual coding and recording process
Essentially, the coding and recording process entailed tracing each item in the five control lists to
the IAR, SSR and website of each company, a company at a time. If a control list item was
missing in any of the three media, a score of 0 was assigned, and recorded in the control list, next
to the item. If a control list item was present, it was assessed and assigned an appropriate score
according to the applicable judgement scale and recorded against the item.
5.2.5.2.1 Measuring relevance, reliability (including verifiability), timeliness and understandability
A set of four control lists (check-list) in a spread sheet form, one for each qualitative characteristic
(relevance, reliability (including verifiability), timeliness and understandability) were used for
capturing data from every IAR, SSR and website of a company. One set was used for each
company. The presence or absence in the reports of each item on the control list was established
first. If absent, a score of 0 points was assigned. However, where a disclosure in the control list
was present, the quality of such a disclosure was assessed, then assigned points according to the
judgement scale discussed in table 5.2 above.
For instance, for quantitative disclosures other than the GRI environmental performance
indicators, a score of 3 points was assigned if the disclosure was monetary, but 2 points if the
disclosure was quantitative but non-monetary, and 1 point if the disclosure was narrative. Such a
disclosure was then examined for its time frame and specificity. If it was futuristic, an additional
point was awarded. Similarly if it was specific, an additional point was awarded. The above-
mentioned procedure was repeated for each item in the four control lists, for all sampled
companies.

203
5.2.5.2.2 Measuring comparability
With regard to GRI environmental performance indicators, a control list (check-list) for measuring
comparability in a spread sheet form was used for recording data from every IAR, SSR and
website of a company. A single control list was used for each company. The presence or absence,
in the reports, of each item on the control list was first established. If absent, a score of 0 points
was assigned. However, where a disclosure in the control list was present, the quality of such a
disclosure was assessed, and then assigned points according to the judgement scale discussed in
table 5.3 above.
For instance, if a company disclosed a performance indicator relative to those of its peer
companies or industry averages, a score of 5 points was assigned to that company for that
particular indicator. For disclosure of a performance indicator relative to targets, a score of 4
points was assigned, yet for disclosure of a performance indicator relative to prior periods, a score
of 3 points was assigned. For quantitative disclosure of a performance indicator for the current
period only, a score of 2 points was awarded whereas for a narrative disclosure of a performance
indicator, a score of 1 point was awarded. The above-mentioned procedure was repeated for each
item in the comparability control list, for each of the sampled companies.
5.2.5.2.3 The use of electronic data spread sheets
The contents of the five control lists in a spread sheet form were then used to generate a sub-
quality index for each qualitative characteristic for each company. From the sub-quality indices,
the total environmental disclosure quality index was computed for each company.
5.2.6 Environmental disclosure sub-quality and quality indices
As above, control lists in form of spread sheets were used to derive the quality disclosure indices
for each company. Quality disclosure indices are often applied in accounting research, particularly
in studies that examine annual reports, where they provide a single-figure summary indicator
either of the entire contents of corporate annual reports or of particular aspects of interest such as
environmental disclosures (Ahmed & Courtis, 1999; Coy & Dixon, 2004; Kamal, 2012:237).
Such a single-figure summary index, can be used to rate, rank and benchmark corporate reports
(Jones & Alabaster, 1999), and is computed as a percentage of the actual disclosure score awarded
to a company over the maximum possible disclosure expected (Cooke, 1989).

204
A disclosure sub-quality index was computed for each of the five qualitative characteristics,
namely; relevance, reliability (including verifiability), comparability, timeliness and
understandability. The sub-quality indices were used because they provide a deeper understanding
of and richer insights into the disclosure quality, which could help to comprehensively profile the
disclosure quality strategies adopted by a company (Beretta & Bozzolan, 2004). The overall
quality index was then computed as a simple arithmetic mean of the sub-quality indices, an
approach that also eliminated the scale effect of the sub-quality indices. In so doing, the overall
quality index collapsed the different sub-qualities into a single value, which provided a composite
summary measure that was used to rank the overall quality of environmental disclosures across
companies.
5.2.6.1 Environmental disclosure sub-quality indices
To compute a sub-quality index for each of the five qualitative characteristics, an aggregate score
for each characteristic was computed for each company from the respective company's control
list. The aggregate score was then divided by the maximum applicable total sub-quality score
which the sampled company could earn for the highest quality disclosure. The quotient was then
expressed as a percentage. The maximum applicable total sub-quality scores were 70 points for
relevance, 115 points for reliability (including verifiability), 200 points for comparability, 100
points for understandability and 15 points for timeliness. Each company's environmental
disclosure sub-quality index was computed according to the following formula (Kamal,
2012:241):
n
Σ Sub-Qualityi
i = 1
CED Sub-Quality = ________________________
MAX Sub-Quality
Where:
CED Sub-Quality = Company's Environmental Disclosure Sub-Quality Index,
Sub-Qualityi = Scoring scale for each sub-quality is applied to item i,
MAX Sub-Quality = Maximum applicable disclosure sub-quality score,
n = number of items disclosed.

205
Using the above formula, the environmental disclosure index for each of the five sub-qualities of
relevance, reliability (including verifiability), comparability, understandability and timeliness are
computed for each company. Specifically, the sub-quality indices for each of these qualitative
characteristic is computed as follows:
5.2.6.2 Environmental disclosure relevance index
Each company's environmental disclosure relevance index was computed according to the
following formula (Kamal 2012:241):
n
Σ Relevancei
i = 1
CED Relevance = ________________________
MAX Relevance
Where:
CED Relevance = Company's Environmental Disclosure Relevance Index,
Relevancei = 3 if item i is monetary quantitative; 2 if item i is non-monetary quantitative; 1 if
item i is narrative; 1 additional point if item i is specific; 1 additional point if item i is foreword
looking,
MAX Relevance = Maximum applicable disclosure relevance score,
n = number of items disclosed.
5.2.6.3 Environmental disclosure reliability index
Each company's environmental disclosure reliability index was computed according to the
following formula (Kamal 2012:243):
n
Σ Reliabilityi
i = 1
CED Reliability = ________________________
MAX Reliability
Where:
CED Reliability = Company's Environmental Disclosure Reliability Index,
206
Reliabilityi = 3 if item i is monetary quantitative; 2 if item i is non-monetary quantitative; 1 if
item i is narrative; 1 additional point if item i is specific; 1 additional point if item i is foreword
looking,
MAX Reliability = Maximum applicable disclosure Reliability score,
n = number of items disclosed.
5.2.6.4 Environmental disclosure comparability index
Each company's environmental disclosure comparability index was computed according to the
following formula ((Kamal 2012:241):
n
Σ Comparabilityi
i = 1
CED Comparability = ________________________
MAX Comparability
Where:
CED Comparability = Company's Environmental Disclosure Comparability Index,
Comparabilityi = 4 if item i is disclosed relative to peers or industry averages; 3 if item i is
disclosed relative to targets; 2 if item i is disclosed relative to prior periods; 1 if item i is disclosed
for the the current period only,
MAX Comparability = Maximum applicable disclosure Comparability score,
n = number of items disclosed.
5.2.6.5 Environmental disclosure understandability index
Each company's environmental disclosure understandability index was computed according to the
following formula (Kamal 2012:241):
n
Σ Understandabilityi
i = 1
CED Understandability = ________________________
MAX Understandability
Where:
CED Understandability = Company's Environmental Disclosure Understandability Index,

207
Understandabilityi = 3 if item i is monetary quantitative; 2 if item i is non-monetary quantitative;
1 if item i is narrative; 1 additional point if item i is specific; 1 additional point if item i is
foreword looking,
MAX Understandability = Maximum applicable disclosure Understandability score,
n = number of items disclosed.
5.2.6.6 Environmental disclosure timeliness index
Each company's environmental disclosure timeliness index was computed according to the
following formula (Kamal 2012:241):
n
Σ Timelinessi
i = 1
CED Timeliness = ________________________
MAX Timeliness
Where:
CED Timeliness = Company's Environmental Disclosure Timeliness Index,
Timelinessi = 3 if item i is monetary quantitative; 2 if item i is non-monetary quantitative; 1 if
item i is narrative; 1 additional point if item i is specific; 1 additional point if item i is foreword
looking,
MAX Timeliness = Maximum applicable disclosure Timeliness score,
n = number of items disclosed.
5.2.6.7 Overall disclosure quality index
After the five sub-quality indices were computed, the overall disclosure quality index for each
company was then computed as an arithmetic mean of the five sub-quality indices and expressed
as a percentage. The sampled listed companies were then ranked from high to low according to
the overall disclosure quality index. Each company's overall environmental disclosure quality
index (CED Quality) was computed according to the following formula (Kamal 2012:244):
CED Quality =
[CED Relevance + CED Reliability + CED Comparability CED Understndability + CED Timeliness]
5
208
Where:
CED Quality = Company's Environmental Disclosure Quality Index,
CED Relevance = Company’s Environmental Disclosure Relevance Index,
CED Reliability = Company’s Environmental Disclosure Reliability Index,
CED Comparability = Company's Environmental Disclosure Comparability Index,
CED Understandability = Company's Environmental Disclosure Understandability Index,
CED Timeliness = Company's Environmental Disclosure Timeliness Index.
5.2.7 Reliability of the content analysis study
Reliability is the degree to which a research instrument produces stable, replicable and consistent
results (Krippendorf, 1980:130; Leedy & Ormrod, 2005:31). To test for reliability in a content
analysis study, Krippendorf (1980:130-132) advocates for three types of tests; stability,
reproducibility and accuracy. The stability test (or test-retest design) involves repeating the
content analysis procedure, usually after a certain period of time, to detect any discrepancies in the
results (Krippendorf, 1980:130; Alrazi et al., 2011:08). A lack of discrepancies in the results of the
two rounds would suggest that the results are reliable.
To test for stability, the content analysis of the environmental reports was conducted twice at
different dates, in a two-week interval. The control lists filled in each round were compared to
determine any discrepancies in the results. Although slight differences were observed between
both rounds, they were noted and promptly rectified. This ensured that there were no deviations
between the respective end results, an indication that stability had been achieved. However, even
where there is a high level of intra-coder agreement, a stability test is considered to be the weakest
form of reliability testing because it only establishes that a coder is consistent with the use and
interpretation of a control list and decision rules (coding instructions) (Guthrie & Mathews, 1985;
Neuman 2000; Alrazi et al., 2011:08).
Reproducibility refers to the ability of different coders to produce the same results on the same
data set (Krippendorf, 1980:130). This can be achieved using Krippendorf's (1980:130) test-test
approach where two or more independent coders complete a content analysis of a sample of
reports in different locations with minimum contact. A high level of agreement among multiple
coders in relation to the way coding and measurement instructions are interpreted and applied

209
would suggest that the results are reliable (Hibbit, 2004:320). Reproducibility provides a higher
level of reliability than stability.
In the present study, the coding process was tested using inter-coder reliability at the pilot stage,
where, another coder other than the researcher independently analysed the content of the
environmental reports in the IARs, SSRs and on companies' websites. More specifically, the other
coder was provided with the objectives of the study, an introduction and training on content
analysis, five control lists, and decision rules. The coder was then required to analyse ten of the
reports that had been analysed by the researcher. The perspectives of both coders (the researcher
and the independent coder), were captured and on comparison, minor variations and
disagreements were noted. These variations were addressed by reconciling the inconsistencies to
reach a consensus. The reconciliation minimised ambiguities and overlaps of meanings or
interpretations of the control lists thus ensuring that reproducibility is achieved.
Accuracy, regarded as a superior test of reliability, seeks to assess coder performance against a
pre-determined standard, known as a test-standard set by a panel of experts, or based on prior
studies (Guthrie & Mathews, 1985). However, at present there are no universal minimum
standards that could be adopted to test accuracy of content analysis of environmental reports
(Hibbit, 2004:320). Thus it was not possible to employ this reliability test in the current study. But
as Unerman (2000) observed, there is no single test that can provide adequate reliability within
any of the tests of reliability. Therefore researchers must select the tests that they consider to be
most appropriate to their study. In concurrence with Unerman (2000), the researcher has selected
stability and reproducibility as adequate tests of reliability.
5.2.8 Validity of disclosure measurement
“Validity is concerned with whether the instrument (in this case the control list and the judgement
scale) measures what it is supposed to measure” (Leedy & Ormrod, 2005:31), and whether it will
lead to valid conclusions (Creswell, 2005:600). Validity raises questions such as (Leedy, 1989:40;
Creswell, 2005:600): What does an instrument measure? Does it in fact measure what it is
supposed to measure? How well, how comprehensive, how accurately does the instrument
measure what it is intended to measure? Can valid conclusions drawn from the sample be
generalised to the entire population? The internal and external validity determines the overall
210
validity of the research (Leedy, 1989:41).
5.2.8.1 Internal validity
Internal validity requires evidence that the instrument, technique, or process used to measure a
concept does indeed measure the intended concept (Sekaran, 2003:425). Although a self-
constructed disclosure index is a useful research tool in capturing environmental disclosure
practices, it requires subjective assessments by the researcher in its development and application
(Botosan, 1997: Kamal, 2012:244). Therefore, various tests are essential to assessing the internal
validity of the disclosure index. In this study, the validity of the disclosure indices are assessed
using construct validity and content validity (Kamal, 2012:244).
5.2.8.1.1 Construct validity
Construct validity refers to the degree to which, data collected from a research instrument can be
interpreted as representing the intended underlying construct (Straub, 1989:150). It is concerned
with the soundness or effectiveness of the measuring instrument (Leedy, 1997:32). Given that the
self-constructed judgement scale and control lists employed in this study required subjective
assessments in their development and application, various measures were undertaken to enhance
the construct validity of the instruments, to ensure that they indeed measured the quality of the
environmental disclosures (Kamal, 2012:244). First, as suggested by Rowley (2002), the 200
questions in the control lists were directly linked to the first research objective. Second, the
control lists and judgement scales were constructed after a thorough review of well-established
control lists and disclosure indices in the prior literature, as well as world re-known environmental
quality disclosure scorecards (Wiseman, 1982; Borgiages & Vorster, 1993; Wingard, 2001;
Cormier & Magnan, 2003; Delloite Touche Tohmatsu, 2002). In addition, the coding process was
conducted according to well-established decision rules and procedures, an approach that
eliminated any uncertainty when coding the data (See Appendix K) (Kamal, 2012:459).
Third, the control lists were informed by the GRI guidelines, which are developed after extensive
consultations with the users (GRI, 2008; Alrazi et al., 2011:08). Fourth, the control lists and
judgement scales were reviewed and refined by a panel of three experts with extensive experience
in content analysis studies (Kamal, 2012:222). Fifth, the ranking of companies according to the
current study's ordinal scores in the judgement scale was compared to that of an alternative

211
(binary/dichotomous) scoring system and found to be consistent (Alrazi et al., 2011:25). Taken
together, the above measures were deemed adequate in ensuring the construct validity of the
research instruments.
5.2.8.1.2 Content validity
Content validity refers to the extent to which a research instrument represents all facets of a given
social construct (Boudreau, Gefen & Straub, 2001:05). It requires research instruments to include
an adequate and representative set of items that cover the concept (environmental disclosure
quality) being measured (Straub, 1989:150; Sekaran, 2003). To this end, five control lists, made
up of a comprehensive set of 200 questions that interrogated the six qualitative characteristics of
decision-useful information (relevance, reliability, comparability, timeliness, verifiability and
understandability) were developed.
To ensure that no questions were omitted, the design of the questions was informed by a thorough
literature review of prior studies, well established environmental quality disclosure scorecards, as
well as the GRI index (G3.1 check-list) (Borgiages & Vorster, 1993; Cormier & Magnan, 2003;
Delloite Touche Tohmatsu, 2002; GRI, 2008; Wingard, 2001; Wiseman, 1982). The latter, which
provides an extensive check-list of standard environmental disclosures was developed through an
extensive consensus seeking process that involved numerous user groups of environmental reports
(GRI 2008). In addition, the control lists were also adjusted to reflect the recommendations of the
King III Report, compliance to which is a listing requirement by the JSE (IODSA, 2013:02).
Furthermore, the content validity of the questions was also attested to by a panel of three experts
with extensive experience in content analysis studies, who reviewed and refined the questions
(Kamal, 2012:222).
Furthermore, before finalising the 44 categories and 200 questions in the five control lists, a pilot
study designed to test the content validity of the control lists was conducted by checking their
applicability in the South African context (Kamal, 2012:222). This was done to capture items not
yet included in the list as well as eliminate those not disclosed by any of the sampled companies.
The pilot study revealed that the control lists developed were applicable in the South African
context as almost all the disclosure in the environmental reports fell within pre-determined
categories. However, there were a few items included in the preliminary control lists that are
recommended by the GRI guidelines but were rarely, if ever, disclosed by South African

212
companies. These items were regarded as inapplicable items, and were deleted from the control
lists, in order to avoid penalising companies for disclosure of non-standard items. Taken together,
the above measures were deemed adequate in ensuring the content validity of the research
instruments.
5.2.8.2 External validity
External validity refers to the extent to which the conclusions drawn from the selected sample can
be generalised to the entire population (Leedy & Ormrod, 2005:105). This requires the use of a
random and representative sample. To enhance external validity, a sample of 66 companies was
drawn from a population of top 100 JSE listed operating companies. Although not randomly
selected, this sample represented 66% of the entire population of the study. In addition, the sample
included both environmentally sensitive and non-environmentally sensitive sectors, with different
degrees of environmental sensitivity. Accordingly, external validity was achieved as the sample
was representative of the population.
5.2.8.3 Limitations of the content analysis study
The content analysis phase of this study however, is subject to the usual limitations of this
methodology which should be considered in the interpretation of the findings. Firstly, the
construction of disclosure indices is not free from subjectivity or bias as the same document may
be interpreted differently by different researchers (Kamal, 2012:400). To minimise the
subjectivity, the control list and judgement scale (research instruments) were pre-tested by another
coder other than the researcher who independently analysed the content of 10 environmental
reports that had been analysed by the researcher during the pilot stage of the study. The results of
the coding process of the independent coder and those of the researcher were then compared, and
found to have only minor variations. The variations which had arisen due to ambiguities and
overlaps of meanings or interpretations of the control lists were promptly corrected by re-
examining the control list items, reconciling the differences by rewording the items to minimise
the effects of subjectivity.
Secondly, the use of sub-quality disclosure indices of environmental disclosure quality to arrive at
an overall disclosure quality score involves attaching an equal weighting to various quality
dimensions (Kamal, 2012:400). However, each dimension cannot be equally important to all

213
stakeholders. Nevertheless, this approach was deemed appropriate in the current study as no
specific user group is of particular interest to the research, but rather all diverse stakeholder
groups (Kamal, 2012:22).
The third limitation pertains to the fact that a content analysis study does not provide data that is
exact or precise and therefore may not be suitable for statistical analysis (Campbell, 2001).
Accordingly such data is merely indicative and not absolute (Hibbit, 2004:479). This view is
supported by Deegan and Gordon (1996:189) who conceded that content analysis can be used as
an indication of the current quality of environmental disclosures. The current study was not aimed
at ascertaining the absolute quality of the environmental reports, but rather to get an indication of
the same, therefore the content analysis method used was deemed to be sufficient for this aim.
The fourth limitation is that the study provides a snap shot of the quality of environmental reports
produced by listed companies, as only one year's environmental reports were analysed (Alrazi et
al., 2011:25). Accordingly, the results reported here may neither be representative of the quality of
disclosures in other years, nor reflect the emerging trends in the quality of environmental reports
analysed. However, it is the researcher's contention that analysing environmental reports in three
media (IAR, SSR and on the companies' websites), mitigates for failure to analyse the trends in
the quality of environmental reports, as it is better than most prior studies that only focus on the
annual report or do not distinguish between the various reporting media (Alrazi et al., 2011:04;
Deegan & Gordon, 1996; Deegan & Rankin, 1996; Harte & Owen, 1991; Nik Ahmad &
Sulaiman, 2002; Niskala & Pretes, 1995).
The fifth limitation is that this study only focused on three media types of reporting environmental
information, namely, IARs, SSRs and company websites whereas there are various other
alternative channels for environmental reporting that a company could use, such as advertising,
promotional leaflets, press releases and so on (Kamal, 2012:20). Therefore, focus on only three
media creates the possibility that some environmental disclosures could be missed. However, the
selection of the three media is justified as they are perceived to be the most important media for
environmental reporting in prior research (Hibbit, 2004:312; Danatas & Gadenne, 2006; KPMG
Huazhen, 2008:24). Besides, it is practically impossible to identify, let alone analyse the content
of all communication channels (Hibbit, 2004:311).

214
The sixth limitation of this study is that the sample selected for the study comprised only the JSE
top 100 listed operating companies. Thus it is neither random nor representative of all listed
companies operating in South Africa. Therefore, the quality of the environmental reports of these
companies may not reflect the general quality of environmental reports produced by all the listed
companies operating in South Africa. Nevertheless, the selection of these companies is justified on
the basis that they represent over 95% of the market capitalisation of the JSE (Greyvenstein,
2010:35). Besides, the JSE top 100 listed operating companies include both environmentally
sensitive and non-environmentally sensitive sectors, with different degrees of environmental
sensitivity, which is arguably representative of all the listed companies (Greyvenstein, 2010:35).
Lastly, this study did not examine the volume (number of sentences, words and pages), of
information disclosed in the environmental reports, even though prior studies have provided
evidence that the quality measure is highly correlated with the quantity measure (Hooks & Van
Staden, 2011; Warsame, Neu & Simmons, 2002). The researcher contends that it would be
pragmatically and technically infeasible to determine the volume of environmental disclosures
across three diverse and unstandardised reporting media (Hanafi, 2006:166). Besides, the
objective of the study was to evaluate the quality of the environmental reports and not the
quantity.
5.2.8.4 Ethical considerations of the content analysis study
Content analysis method is an unobtrusive technique that does not require interaction with human
beings (Wolfe, 1991:282). Accordingly the ethical risks associated with the methodology are
virtually negligible, given that the environmental reports in IARs, SSRs and companies' websites
analysed in this study were publicly available documents, access to which was neither restricted
nor required permission.
5.3 QUESTIONNAIRE SURVEY
5.3.1 Justification for questionnaire survey methodology
The second, third, fourth, fifth and sixth research objectives aimed at determining the perceptions
of users and preparers regarding the decision-usefulness of environmental reports produced by
South African companies. Achieving these objectives required that a survey be conducted via
215
either conducting interviews with the respondents or using a questionnaire survey (Al-Mubarak,
1997:172). In deciding the suitable method for this survey, the researcher compared the strengths
and weaknesses of the two methods in the context of characteristics of the targeted respondents
(Al-Mubarak, 1997:183). The characteristics included: 1) A relatively large sample size of 100
users and 100 preparers targeted, as well as their widely dispersed distribution all over South
Africa. 2) A limited access to these respondents as well as limited time and resources at the
researcher’s disposal. 3) The need to maintain confidentiality and anonymity, which was
considered vital to secure the cooperation of respondents. 4) The fact that users and preparers of
environmental reports are generally considered to be a well-educated segment of the society.
In view of the above-mentioned characteristics of respondents, a questionnaire survey was the
most appropriate method for various reasons. First, it is a faster, less expensive and more
convenient way of obtaining data from a large number of widely dispersed respondents, than the
personal interviews method (Al-Mubarak, 1997:178). Secondly, unlike in personal interviews,
respondents can complete the questionnaire anonymously, ensuring confidentiality (Al-Mubarak,
1997:179). Thirdly, it does not require the researcher to nurture interviewing skills (Sekaran,
1992:201). Fourthly, unlike the personal interviews, it allows the respondents to answer the
questions at their own convenience without the undue influence of the researcher’s presence,
which tends to introduce bias (Al-Mubarak, 1997:180). Besides, if closed-ended questions are
used, a questionnaire survey facilitates comparison and analysis of differences in the perceptions
of different groups of respondents (Johnson & Christensen, 2010:170).
5.3.2 Research population and sample
The population comprised both users and preparers of environmental reports produced by JSE
listed companies. The population of users as defined in the accounting conceptual frameworks
could foreseeably consist of the entire South African population (GRI, 2008; IASB, 2008; FASB,
2010; Mitchell & Quinn, 2005:22). This study focused on the user groups actively involved in 1)
ethical investment (ethical investment funds and their representatives), 2) environmental
protection (environmental NGOs and their representatives), and 3) environmental reporting
research (environmental reporting researchers published journal articles on environmental
reporting in South Africa).

216
Given that there appears to be no comprehensive public listing of all ethical investment funds,
environmental NGOs and environmental reporting researchers in South Africa, a compilation of a
population frame list was done with aid of the Internet. A thorough Internet search was conducted,
which yielded 100 users that comprised 30 ethical investment funds, 30 environmental NGOs and
40 accounting researchers. Consistent with the prior studies, a census of the identified users was
conducted given that the population was relatively small (Tilt, 1994, Danatas & Gadenne,
2004:08).
The population of preparers of environmental reports included the top 100 operating listed
companies and their representatives. The latter included financial directors, accountants,
executives, managers and other environmental officers involved in the preparation of
environmental reports. Although the questionnaires were directed at financial directors,
demographic data was collected to determine the extent to which questionnaires were completed
by other qualified personnel to whom the task of replying to the questionnaire was delegated
(Mitchell & Quinn, 2005:22). Again, a census of the preparers was conducted, given that the
population was relatively small (Tilt, 1994:Danatas & Gadenne, 2004:08).
5.3.3 Questionnaire design
Two sets of questionnaires were designed, the first one for users of environmental reports and the
second for preparers of environmental reports (See Appendix G and H). Both questionnaires
consisted of seven pages excluding the cover page (cover letter), which was used to briefly state
the objective of the questionnaire and to assure the respondents that the information divulged
would be used for the purpose of the study only and would be kept confidential (See Appendix F).
Given that a cover letter is the first document examined by the respondent before completing the
questionnaire, the cover letters in this study were also used to encourage the respondents to
complete the questionnaire and return it expeditiously.
In order to maximise the response rate, both questionnaires comprised of 15 simple questions,
designed to be completed in 10 minutes. To further encourage the respondents to complete the
questionnaires, no question asked the respondents to directly identify themselves or their
organisation, which guaranteed respondents' anonymity.
217
As similarly used by Deegan and Rankin (1999:322), the 15 questions in the users' questionnaire
were almost identical to the 15 questions in the preparers' questionnaire to maximise the
comparability of responses of the users to those of preparers. Furthermore, both questionnaires,
with the exception of question 14, comprised of closed-ended questions, with responses requested
on either a five-point likert scale, yes/no answers, multiple-choice questions, or numerical
answers.
As can be seen below, both questionnaires were designed to suit the study objectives and the
nature of respondents. The questionnaires were also designed to be easy to answer and easy to
analyse as the questions were mostly closed-ended. The two sets of questionnaires are now
discussed in the section that follows.
5.3.3.1 The questionnaire for users
The questionnaire for users was divided into five sections; A, B, C, D and E (see Appendix G).
The first section (A) dealt with the background of the respondent, whereas the second section (B)
dealt with the information needs of the users of environmental reports. The third section (C) dealt
with the extent to which the users read the environmental reports and whether they employed the
reports to make decisions, whereas the fourth section (D) ascertained whether users were satisfied
with the decision-usefulness of the environmental reports and elicited suggestions on how to
improve the reports in this regard. The last section (E) aimed at determining how the users ranked
environmental information relative to other types of information. Each section and the questions
contained therein are now discussed in more detail below.
5.3.3.1.1 Section A of the users' questionnaire
This section of the questionnaire dealt with the background of the respondents. It included
questions on their gender, age, highest educational qualification as well as the occupation of the
respondent (Question one to four). The respondents were required to respond by crossing (x) the
appropriate box or “clicking” on the appropriate answer.
The aim of this section was to obtain a profile of the respondents who participated in this survey.
The background information would also be used in the analysis of data obtained from the other
sections of the questionnaire, to determine if the information had any effect on the respondents'
218
answers (De Villiers & Van Staden, 2010a:238). Besides, the information provided evidence that a
range of different respondents had responded to the questionnaire.
5.3.3.1.2 Section B of the users' questionnaire
This section of the questionnaire was meant to determine whether users had read an
environmental report in the past 12 months, reasons for not reading the reports as well as your
perception on how an environmental report should be. The section comprised of questions five to
seven.
Question five: Did you read at least one environmental report in the past 12 months?
The aim of this question was to identify those respondents that had read an environmental report
from those that had not. The respondents were required to respond with a yes or no by crossing (x)
the appropriate box or “clicking” on the appropriate answer. Those who had read the report were
then requested to proceed with the entire questionnaire from question seven, whereas those who
had not were referred to question six.
Question six: Which of the following explains why you did not read any environmental report in
the past 12 months?
The objective of this question was to establish why some respondents (non-readers) had not read
environmental reports. The respondents were given six statements that could explain why they
had not read the environmental reports, with an option of adding one statement of their own. They
were then required to rank the six statements according to how important they perceived the
statements in explaining why they had not read the reports. A rank of one was to be allocated to
the most important reason for not reading any environmental report, a rank of two to the second
most important reason and so on. To each statement, the respondents were also required to
allocate a rank only once, which meant that the least important reason for not reading the
environmental reports would be ranked seventh. Upon completion of this question, the non-
readers were requested to submit their questionnaire.
Question seven: To what extent do you agree with each of the following statements about how
environmental reports should be?
219
The question was asked to elicit suggestions on how the environmental reports should be, from
those who had read the reports. The respondents were required to indicate their degree of
disagreement or agreement with 28 statements on a scale of one to five, by crossing (x) the
appropriate box or “clicking” on the appropriate answer [1=strongly disagree, 2=disagree,
3=neutral, 4=agree, 5=strongly agree].
5.3.3.1.3 Section C of the users' questionnaire
This section of the questionnaire was meant to determine the extent to which the users read the
environmental reports, whether they employed the environmental reports to make decisions, and
how useful they perceived the reports to be. The section comprised of questions eight, nine, 10
and 11.
Question eight: Which of the following best describes how thoroughly you read environmental
reports?
This question was asked to determine the depth to which the users had read the environmental
reports. The respondents were required to indicate how thoroughly they had read the reports by
crossing (x) in the appropriate box or “clicking” on one of five multiple choices provided:
scanning; skimming; exploratory reading; study reading and critical reading.
Question nine: How often do you read environmental reports in the following media?
The purpose of asking this question was to determine how frequently the users had read the
environmental reports as well as their most preferred media. The respondents were required to
indicate how often they had read the reports in various media, by crossing (x) the appropriate box
or “clicking” on the appropriate answer [1=never, 2=rarely, 3=sometimes, 4=often, 5=almost
always].
Question 10: To what extent do you agree with each of the following statements about how you
use environmental reports?
This question was asked to determine whether users had employed the environmental reports to
inform decisions and also to determine the types of decisions made on the basis of the
220
environmental reports. The respondents were required to indicate their degree of disagreement or
agreement with seven statements on a scale of one to five, by crossing (x) the appropriate box or
“clicking” on the appropriate answer [1=strongly disagree, 2=disagree, 3=neutral, 4=agree,
5=strongly agree].
Question 11: How useful were the environmental report(s) that you read?
This question was asked to determine the users' perception of the usefulness of the environmental
reports that they had read. The users were required to indicate their perception of the usefulness of
the reports by crossing (x) in the appropriate box or “clicking” on one of five multiple choices
provided: not useful at all; not very useful; neutral; useful; very useful.
5.3.3.1.4 Section D of the users' questionnaire
This section of the questionnaire aimed at determining whether users were satisfied with the
decision-usefulness of the environmental reports and to elicit their suggestions on how to improve
the decision-usefulness of the reports. The section had questions 12, 13 and 14.
Question 12: To what extent do you agree with each of the following statements about the quality
of the environmental reports that you read?
This question was asked to determine whether the users perceived the environmental reports read
to be relevant, reliable, comparable, understandable, timely and verifiable. The respondents were
required to indicate their degree of disagreement or agreement with six statements on a scale of
one to five, by crossing (x) the appropriate box or “clicking” on the appropriate answer
[1=strongly disagree, 2=disagree, 3=neutral, 4=agree, 5=strongly agree].
Question 13: How satisfied are you with the quality (decision-usefulness) of the environmental
report that you read?
This question was meant to gauge the level of satisfaction of the readers with the decision-
usefulness of the environmental report that they had read. The respondents were required to
indicate their degree of dissatisfaction or satisfaction with the quality (decision-usefulness) of the
environmental report they had read by crossing (x) in the appropriate box or “clicking” on one of

221
five multiple choices provided: not at all satisfied; slightly satisfied; moderately satisfied; very
satisfied; extremely satisfied.
Question 14: Can you suggest how the quality (decision usefulness) of the environmental reports
should be improved?
This question was meant to provide the users who had read the environmental reports, particularly
those dissatisfied, with an opportunity to suggest how the decision-usefulness of the reports
should be improved. Given the numerous possible suggestions that the respondents could provide,
the question was open-ended to elicit as many suggestions as possible.
5.3.3.1.5 Section E of the users' questionnaire
This section of the questionnaire aimed at determining how the users ranked environmental
information relative to other types of information. The section comprised of question 15.
Question 15: How important are the following types of information to you?
This question was meant to determine the users’ perception of the relative importance of
environmental reports compared to other types of information. The respondents were required to
rate the importance of eight types of information that are regularly published in the annual reports
(integrated annual reports) by crossing (x) the appropriate box or “clicking” on the appropriate
answer [1=not at all important, 2=slightly important, 3=fairly important, 4=very important,
5=extremely important].
5.3.3.2 The questionnaire for preparers
To ascertain whether there is an expectation gap between users and preparers of environmental
reports with regard to the decision-usefulness of the reports, a separate questionnaire was
designed for the preparers (See Appendix H). Like the users' questionnaire, the preparers'
questionnaire with the exception of question 14 mostly consisted of closed-ended questions, with
responses requested on either a five-point likert scale, yes/no answers or multiple-choice
questions.
222
5.3.3.2.1 Section A of the preparers' questionnaire
Section A of the preparers' questionnaire dealt with the background of the respondents, which
included their gender, age, highest educational qualification as well as the occupation of the
respondents (Question one to four). The respondents were required to respond by crossing (x) the
appropriate box or “clicking” on the appropriate answer. Like in the users' questionnaire, the aim
of this section was to obtain a profile of the respondents who participated in this survey. The
background information would also be used in the analysis of data obtained from the other
sections of the questionnaire to determine if the information had any effect on the respondents'
answers (De Villiers & Van Staden, 2010a: 238). The information also provided evidence that a
range of different respondents had responded to the questionnaire.
5.3.3.2.2 Section B of the preparers' questionnaire
This section was meant to determine whether preparers had a way of determining if their
environmental reports had indeed been read, measures undertaken by preparers to encourage
readership of the reports as well as the preparers' perception of the information needs of the users
of environmental reports. The section comprised questions five to seven.
Question five: Do you have a way of determining whether or not your intended users actually read
your last environmental report?
The aim of this question was to determine if the preparers had a way of knowing whether their last
report had actually been read. The responses obtained in this question would then be compared to
those of question five of the users (did you read at least one environmental report in the past 12
months?) with a view to ascertain if there were any differences in the perceptions of the two
groups. If the preparers do not have a way of determining whether their reports are being read or
not, then it probably would not matter to them whether the reports are perceived as decision-
useful by the readers (Deegan & Ranking, 1997:568).
Question six: Which of the following best explains why some of your intended readers may not
have read your last environmental report?
The objective of this question was to establish the preparers' perceptions on why some
respondents (non-readers) had not read the preparers' environmental reports. Like in the users'
223
questionnaire, the preparers were given six statements that could explain why their readers had not
read the environmental reports, with an option of adding one statement of their own. They were
then required to rank the six statements, according to how important they felt the statements
explained why the readers had not read the reports. A rank of one was to be allocated to the most
important perceived reason why the readers had not read any environmental report, a rank of two
to the second most important reason and so on.
To each statement, the preparers were also required to allocate a rank only once, which meant that
the least important reason would be ranked seventh. The responses obtained from the preparers
were then compared to those of question six of the users (which of the following explains why
you did not read any environmental report in the past 12 months?), with a view to ascertain if
there were any differences in the perceptions of the two groups.
Question seven: To what extent do you agree with each of the following statements about how
environmental reports should be?
The question was asked to elicit the preparers' views on how the environmental reports should be
to be decision-useful. The preparers were required to indicate their degree of disagreement or
agreement with 21 statements on a scale of one to five, by crossing (x) the appropriate box or
“clicking” on the appropriate answer [1=strongly disagree, 2=disagree, 3=neutral, 4=agree,
5=strongly agree]. Those views would then be compared to those of the users who were asked
exactly the same question in question seven of their questionnaire, with a view to ascertain if there
were any differences in the perceptions of the two groups.
5.3.3.2.3 Section C of the preparers' questionnaire
This section of the questionnaire was meant to determine the preparers’ perceptions on the extent
to which the users read the environmental reports, whether the users employed the environmental
reports to make decisions and how useful the reports were perceived to be by the users. The
section comprised of questions eight, nine, 10 and 11.
Question eight: In your view, which of the following best describes how thoroughly your readers
read your environmental reports?
224
This question was asked to determine the preparers' perceptions of the depth to which their
readers do read the environmental reports. The preparers were required to indicate their perception
on how thoroughly their readers had read the reports, by crossing (x) in the appropriate box or
“clicking” on one of five multiple choices provided: scanning; skimming; exploratory reading;
study reading and critical reading. The responses obtained were compared to those of users in
question eight (which of the following best describes how thoroughly you read environmental
reports?), with a view to ascertain if there were any differences in the perceptions of the two
groups.
Question nine: In your opinion, how often do your intended readers read your environmental
reports in the following media?
The purpose of asking this question was to determine the preparers' perception on how frequently
the users had read the environmental reports as well as their most preferred media. The preparers
were required to indicate their views on how often the readers had read their reports in various
media, by crossing (x) the appropriate box or “clicking” on the appropriate answer [1=never,
2=rarely, 3=sometimes, 4=often, 5=almost always]. The responses obtained were compared to
those of users in question nine (how often do you read environmental reports in the following
media?) with a view to ascertain if there were any differences in the perceptions of the two
groups.
Question 10: To what extent do you agree with the following statements regarding the purpose for
which your readers use environmental reports?
This question was asked to determine whether the preparers were cognisant of the use to which
the users employed the environmental reports. The preparers were required to indicate their degree
of disagreement or agreement with seven statements on a scale of one to five, by crossing (x) the
appropriate box or “clicking” on the appropriate answer [1=strongly disagree, 2=disagree,
3=neutral, 4=agree, 5=strongly agree]. The responses obtained were compared to those of users in
question 10 (to what extent do you agree with each of the following statements about how you use
environmental reports?) with a view to ascertain if there were any differences in the perceptions of
the two groups.
225
Question 11: In your opinion, how useful are your environmental reports to the users?
This question was asked to determine the preparers' perception of the usefulness of the
environmental reports to the users. The preparers were required to indicate their perception of the
usefulness of the reports by crossing (x) in the appropriate box or “clicking” on one of five
multiple choices provided: not useful at all; not very useful; neutral; useful; very useful. The
responses obtained were compared to those of users in question 11 (How useful were the
environmental report(s) that you read?) with a view to ascertain if there were any differences in
the perceptions of the two groups.
5.3.3.2.4 Section D of the preparers' questionnaire
This section of the questionnaire aimed at determining the preparers' perception on the users'
satisfaction with the decision-usefulness of the environmental reports. The section also aimed at
eliciting suggestions from preparers on how to improve the decision-usefulness of the reports.
Section D consisted of questions 12, 13 and 14.
Question 12: To what extent do you agree with each of the following statements about your
readers’ perception of the quality of your environmental reports?
This question was asked to determine the opinion of the preparers on whether the users perceived
the environmental reports read to be relevant, reliable, comparable, understandable, timely and
verifiable. The respondents were required to indicate their degree of disagreement or agreement
with six statements on a scale of one to five, by crossing (x) the appropriate box or “clicking” on
the appropriate answer [1=strongly disagree, 2=disagree, 3=neutral, 4=agree, 5=strongly agree].
The responses obtained were compared to those of users in question 12 (to what extent do you
agree with each of the following statements about the general quality of the environmental reports
that you read in the past 12 months?) with a view to ascertain if there were any differences in the
perceptions of the two groups.
Question 13: In your opinion, how satisfied were your readers with the following quality attributes
of the last environmental report that your company published?
This question was meant to gauge the preparers' perception of the level of satisfaction of their
226
readers with the decision-usefulness of the environmental reports. Such perceptions are important
because they would indicate whether the preparers are cognisant of the need for improvement.
The preparers were required to indicate their perception on the degree of dissatisfaction or
satisfaction of their readers with regard to the quality (decision-usefulness) of the environmental
report read. They were to do so by crossing (x) in the appropriate box or “clicking” on one of five
multiple choices provided: not at all satisfied; slightly satisfied; moderately satisfied; very
satisfied; extremely satisfied. The responses obtained were compared to those of users in question
13 (in general, how satisfied are you with the following quality attributes of the environmental
reports that you read in the past 12 months?) with a view to ascertain if there were any differences
in the perceptions of the two groups.
Question 14: Can you suggest how the quality (decision-usefulness) of your environmental reports
should be improved?
This question was meant to elicit suggestions from preparers on how to improve the decision-
usefulness of their reports. Given the numerous possible suggestions that the respondents could
provide, the question was open-ended to elicit as many suggestions as possible. Those views were
then compared to those of the users who were asked exactly the same question in question 14 of
their questionnaire, to ascertain if there were any differences in the perceptions of the two groups.
5.3.3.2.5 Section E of the preparers' questionnaire
This section of the questionnaire aimed at determining whether the preparers were cognisant of
the users' perception of the relative importance of environmental reports when compared to other
types of information. The section had only question 15.
Question 15: In your opinion, how important are the following types of information to the readers
of your environmental reports?
The preparers were required to indicate their perception of the importance of eight types of
regularly published information to the readers of environmental reports by crossing (x) the
appropriate box or “clicking” on the appropriate answer [1=not at all important, 2=slightly
important, 3=fairly important, 4=very important, 5=extremely important]. The responses obtained
were compared to those of users in question 14 (how important are the following types of
227
information to you?) with a view to ascertain if there were any differences in the perceptions of
the two groups.
5.3.3.3 Pilot testing
Prior to disseminating the questionnaires, a pilot test was undertaken to ensure that the questions
were clear, unambiguous and understandable by the respondents. To this end, the questionnaires
were completed and critically evaluated by ten selected academics with vast experience in
questionnaire design. The academics were asked to complete the questionnaires, discuss any
problems they encountered and suggest any modifications they felt would make the questionnaires
more user-friendly. In order to take note of any instruction or question that was unclear as well as
the respondents' general reaction to the questionnaires, the researcher was present in person as the
selected participants completed and critiqued the questionnaires. The researcher also noted the
length of time it took the participants to complete the questionnaires.
Among the shortcomings revealed in the pilot test of the preliminary questionnaires were:
misinterpretations by the respondents, lack of continuity, poor skip patterns and fewer alternatives
for closed-ended questions. After the pilot testing, some changes were made to the questionnaires
to clarify their instructions, enhance continuity, reduce skip patterns and increase the alternatives
for closed-ended questions. In addition, the questionnaires were adjusted to rectify errors,
structure answers, minimise the time taken to complete them and to make the responses suitable
for statistical analysis. The questionnaires were also adjusted to reflect the recommendations made
by the academics with regard to wording, ordering, layout, filtering, and length. Besides, some
changes were made in the questions to ensure that the questionnaires were adequate in meeting the
research objectives.
After the adjustments, the questionnaires were then resubmitted to the selected academics, who
approved the corrections made. Upon approval, the questionnaires were then retested on 10 full-
time senior students (fourth year accounting students) who acted as surrogates for users, and 10
part-time students (fourth year accounting students working as junior accountants) who acted as
surrogates for preparers, and were found to be clear, concise and understandable.
228
5.3.4 Questionnaire distribution
Upon completion of the pilot test, the two sets of questionnaires were sent to respondents via an e-
mail to which a cover letter and an ethics clearance letter were attached. The e-mail which briefly
explained the purpose of the study invited the respondents to participate in the survey by clicking
on the URL link provided, which redirected them to a web-based survey that they were to
complete anonymously. This implies that only respondents who had an e-mail address were
included in this survey. The survey was designed to be short and would have taken an average of
fifteen minutes to complete, a strategy deployed to increase the response rate. The questionnaires
were sent out on the 1st of July 2013 with a deadline of the 31st of August 2013 for the return of
the questionnaire. To enhance the response rate, a telephonic follow-up was made one week
before the deadline of submission. The respondents who failed to return the questionnaire before
the deadline were contacted telephonically once more after the deadline date had passed.
5.3.5 Data analysis
The data from the returned questionnaires was imported from the web-based survey form to the
Statistical Package for Social Sciences (SPSS) version 22, which was then used for analysing the
quantitative data. The SPSS was selected because of its user-friendly nature and because it readily
allows data to be imported from web-based surveys. The quantitative data was analysed using
both descriptive statistics and inferential statistics, except for questions 14 in both sets of
questionnaires, which were open-ended (qualitative in nature) and thus were analysed using
Creswell’s data analysis spiral.
5.3.5.1 Descriptive statistics
Descriptive statistics provide simple summaries about the sample and about the observations that
have been made. Some measures that are commonly used to describe a sample are measures of
central tendency (which measure central position of a group of data) such as arithmetic mean, and
measures of variability (which measure how spread or dispersed from central position the data is)
such as standard deviation. In this study, the arithmetic mean was used to provide a single figure
that could summarise and rank the responses of users and preparers, and thus serve as a basis for
comparing the perceptions of the two groups of respondents (Al-Mubarak, 1997:204). To measure
variability or dispersion of the responses from the mean, standard deviation was used as it is the

229
most commonly used and the most important measure of variability (Al-Mubarak, 1997:205). In
addition, percentages were used to summarise the responses of respondents, and to rank the
responses.
5.3.5.2 Inferential statistics
Inferential statistics enable a researcher to make inferences about a population from observations
and analyses of a sample. They allow a researcher to determine how variables in a population
relate to each other, and whether there are any significant differences between two groups of
samples drawn from different populations and so on ( Al-Mubarak, 1997:205). With regard to
inferential statistics, three tests were performed in this study namely a T-Test, a Binomial Test and
a Chi-Square Test (refer to KAMPHD-CD). The T-Test for equality of means (2-tailed) was used
to test for non-response bias among the users and preparers, and to test for significant mean
differences between the responses of users and preparers. The Binomial Test and Chi-Square Test
were used to test for significant differences in the percentages of the respondents’' responses to
categorical questions with two mutually exclusive and exhaustive outcomes (questions with “Yes”
or “No” answers), since a T-Test cannot be used in such cases, as it is meaningless to calculate the
means of categorical data (Al-Mubarak, 1997:205 ).
5.3.5.3 Qualitative data analysis
Given that question 14 was open-ended, a qualitative data analysis was deemed appropriate to
analyse the responses to this question. To this end, Creswell’s data analysis spiral, as described in
Leedy and Ormrod (2001:161), was employed. Each respondents' response was content analysed
and any patterns or trends that the data reflected were assembled together in six groups of
meaning units to resemble the qualitative characteristics of decision-useful information, namely,
relevance, reliability, verifiability, comparability, timeliness and understandability (GRI, 2000:16;
IASB, 2008:12; FASB, 2010:16). The meaning units were then compared to the theory discussed
in the literature review to test whether they supported and confirmed the theory or not (Leedy &
Ormrod, 2005:136).
5.3.6 Reliability of the research instrument
The reliability of the research instrument was established using a pilot test of the questionnaires

230
conducted to check that the questions were clear, unambiguous and understandable, in order to
ensure consistency in the results obtained. To this end, the questionnaires were completed and
critically evaluated by ten selected academics with vast experience in questionnaire design (See
section 5.3.3.3). Following the recommendations of the academics, the shortcomings in the
questions were then promptly rectified.
The questionnaires were then tested and retested after a two week interval on 20 senior students
(fourth year accounting students) who acted as surrogates for users and preparers, to determine
whether they could be completed properly and whether they yielded consistent results. In
particular, the researcher looked out for problems such as failure to answer questions, respondents
giving contradicting answers to similar questions, and written comments in the margin, which are
indications that the research instrument is unreliable (De Vaus, 1996:54). Interestingly, none of
these problems were encountered in this study. Besides, the students indicated that they found the
questions to be clear, concise and understandable, and thus the questionnaire did not need any
further revision.
5.3.7 Validity
5.3.7.1 Internal validity
Only construct and content validity were deemed relevant for this phase of the study and are
hence discussed below.
5.3.7.1.1 Construct validity
Construct validity refers to the validity of inferences that a research instrument actually represent
or measures the construct being investigated (Straub, 1989:150). Simply put, construct validity
answers the following questions: is the research instrument measuring what it should be
measuring? are the questions relevant to the purpose of the questionnaire? Rowley (2002)
suggested that construct validity can be achieved by reducing subjectivity of questions in a
questionnaire through linking the questions posed to the original research questions or research
objectives. In agreement with Rowley's (2002) suggestion, the questionnaires used in this study
were directly linked to the second, third, fourth, fifth and sixth research objectives.
Another way of achieving construct validity is by pilot testing (Rowley, 2002). In this regard, a

231
pilot test of the questionnaires was conducted in which the questionnaires were completed and
critically evaluated by ten selected academics with vast experience in questionnaire design. As
part of this exercise, the academics were requested to justify and elaborate on their understanding
of each question, and to point out weaknesses that undermined the construct validity of the
questionnaires. The questionnaire was then amended to reflect the suggested corrections, which
included inclusion of questions deemed important and deletion of those perceived to be less
important from the questionnaire. This was to ensure that construct validity is achieved.
5.3.7.1.2 Content validity
Content validity refers to the extent to which a research instrument covers all facets of a given
construct (decision-usefulness of environmental reports) (Boudreau et al., 2001:05). Simply put,
content validity ensures that the questionnaire includes an adequate and representative set of items
that cover the concept (Sekaran, 1992:171). To ensure that content validity is achieved, the input
of the ten accounting academics with vast experience in questionnaire design and environmental
reporting was elicited on the coverage and adequacy of the questions included in the
questionnaires. The questionnaire was then amended to reflect the suggestions made such as
inclusion of questions deemed important, particularly the open-ended question (14) and deletion
of those perceived to be unimportant ones from the questionnaire, which should have ensured
content validity of the questionnaires.
5.3.7.2 External validity
External validity refers to the extent to which the research findings based on a sample can be
generalised to the population from which the sample is taken or to other similar populations in
terms of contexts, individuals, times, and settings (Leedy & Ormrod, 2005:105). This requires the
use of a random and representative sample. With regard to the latter requirement, 100 users, who
comprised 30 representatives of ethical investment funds, 40 accounting researchers, and 30
representatives of environmental NGOs were invited to participate in the survey, in the form of a
census. These three user groups are considered by many researchers to be representative of the
user groups of environmental reports (Tilt, 1994; Deegan & Rankin, 1997; Danatas & Gadenne,
2006; O’Dwyer et al., 2005; Solomon & Solomon, 2006). Similarly, 100 preparers drawn from the
top 100 listed companies operating in different sectors were invited to participate in the survey.
Accordingly, they were a fair representation of all preparers of environmental reports produced by

232
the top 100 listed companies. Given that the respondents in the survey were a fair representation
of the population that they were drawn from, external validity of the results and findings of this
study was achieved.
With regards to the former requirement, effort was made to ensure that the respondents were
selected randomly. Both users and preparers were selected randomly from a variety of websites
that contained extensive lists and links to the websites of the respondents or their organisations.
Their inclusion in the study was however based on whether they agreed to participate in the study
in the pre-survey telephone call made by the researcher. The researcher acknowledges this as one
of the limitations of the study.
With a self-administered questionnaire, there is always a possibility that only those with a
particular interest in the subject may respond to the questionnaire (De Villiers & Van Staden,
2010a:237). This may introduce a non-response bias that occurs when some subjects choose not to
respond at all, or fail to respond to some particular questions, due to their differences in some way
from those who do respond (Vogt, 2005:210). Non-response bias arises when those subjects who
do not return the completed questionnaire have certain characteristics that diminish the
randomness of the sample (for instance if all the non-respondents are male) (Deegan & Rankin,
1997:571). If the sample is biased and no longer random, then it lacks the potential to be
representative of the larger population from which the sample was drawn, thereby limiting the
study's external validity (Vogt, 2005:210). Similarly, if a sample is too small in proportion to the
population or as required by the type of statistical test, the researcher will not be able to make
valid statistical inference about the population, as the sample will not be representative of the
population (Deegan & Rankin, 1997:572).
To minimise the effect of a non-response bias, the current study selected three user groups,
namely; representatives of ethical investment funds, representatives of environmental NGOs, and
environmental reporting researchers, as well as a different types of preparers to ensure that the
respondents were heterogeneous. This increased the likelihood that respondents of different
persuasions answered the questionnaire (De Villiers & Van Staden, 2010a:240). In addition, the
respondents were specifically asked to complete the questionnaire even if they had little interest or
were against environmental disclosure to ensure that the results would be representative of all
views (De Villiers & Van Staden, 2010a:240).

233
To further enhance the external validity of the results and findings of this questionnaire survey,
various measures were undertaken to increase the response rate. These included, the use of a
simplified questionnaire that was made conveniently accessible via a web-link, which also
reduced the possibility of non-response bias (De Villiers & Van Staden, 2010b:440). Respondents
were also encouraged to participate in the survey by the assurance provided that they would be
treated anonymously and that the findings would only be used for research purposes (De Villiers
& Van Staden, 2010a:241). Telephonic follow-ups were also made where the respondents could be
identified, as well as a second e-mail follow-up request where the respondents could not be
identified (O’Dwyer et al., 2005:07). The response rates achieved in this study were also
compared to those of similar prior studies, and found to be typical, which meant that the subject
matter did not deter more potential respondents than prior surveys, thus the probability of non-
response bias was not higher than usual (O’Dwyer et al., 2005:08).
To test for non-response bias, the responses of early responders were compared to those of late
responders, an approach used widely in prior literature (Deegan & Rankin, 1997:571). Early
responders are taken to represent individuals who are favourably disposed towards the subject of
the questionnaire, whereas the late responders are taken to represent those who are less in favour,
as well as those who chose not to complete the questionnaires (De Villiers & Van Staden,
2010a:241). For each of the seven likert scale questions (out of a total of 15 questions in the
questionnaire), a series of T-Tests was conducted for both the users and preparers.
A respondent was deemed to be early if the response was received within two weeks of the
questionnaire being sent to them, and late if the response was received after the due date to
respond. There were no significant differences in the questionnaire answers between those who
responded early when compared to those who responded late for both groups (refer to KAMPHD-
CD). Accordingly there was no evidence of non-response bias in this test. Although this kind of
test is not conclusive in ruling out a non-response bias, however it is an accepted practice that is
used widely in similar surveys (Deegan & Rankin, 1997:571; De Villiers & Van Staden,
2010b:241). Nevertheless, with the acceptable response rate, differing opinions in the results, and
similarity of early and late responders' responses, it is unlikely that non-response bias influenced
the results significantly.

234
5.3.7.3 Limitations of the questionnaire survey
Apart from the non-response bias already discussed, the other limitations of a questionnaire
survey are also well documented in the prior literature. Key among the limitations is the inability
of the researcher to probe responses and seek clarification for ambiguous answers (Nachmias &
Nachmias, 1992; Al-Mubarak, 1997:181). To mitigate for this limitation, respondents were
provided with an option to expound on their answer where the response was “other”. This was
done by requesting them to specify their answer. Furthermore, one question was open-ended to
elicit more information than would have otherwise been provided had the researcher strictly
confined the questionnaire to closed-ended questions. Besides, a logical sequence of questions
was used in a probing pattern.
Yet another limitation of the questionnaire survey is that the researcher cannot ascertain whether
the questionnaire was completed by the appropriate respondent for whom the questionnaire was
intended for (Nachmias & Nachmias, 1992; Al-Mubarak, 1997:181). It is common for senior
personnel to hand over questionnaires to their juniors for completion. To mitigate for this
limitation, the questionnaires were, where possible addressed to specific individuals and not just
positions. Besides, the questionnaires had a demographic profile which would assist the researcher
to determine whether they had been answered by the intended person (De Villiers & Van Staden,
2010b:441).
5.3.8 Ethical considerations
Before the commencement of the actual questionnaire survey, an application for approval of the
research project by the College of Economic and Management Sciences Research Ethics
Committee (CEMS REC) was made and obtained (See Appendix L). Once the approval of the
research project was obtained, respondents were invited to participate in the questionnaire survey
via a cover letter that accompanied the questionnaires (See Appendix F). The purpose of the study
and the participation required from the respondents were explained in the cover letter. The
respondents were further informed in the letter that they had the right to decide voluntarily
whether to participate in the study, right to ask questions, refuse to give information or to
withdraw from the study at any time if they so wished.
In the same letter, anonymity and confidentiality were assured to the respondents by stating that
235
the identity of the respondents could not be linked with their individual responses. To further
ensure anonymity and confidentiality, the respondents were requested not to write their names on
the questionnaires. The respondents were further assured that the information would be used for
the purpose of the research only and that the findings of the research would be made available to
them if they so requested. In addition, the respondents were informed that they would not receive
any remuneration for participation in the study, however, the findings of the study would assist in
improving the decision-usefulness of environmental reports produced by South African
companies.
5.4 CHAPTER SUMMARY AND CONCLUSION
This chapter discussed two research methodologies employed to collect data for meeting the
objectives of this study. The two methodologies discussed were content analysis and questionnaire
survey methodologies, which were undertaken in two phases. Accordingly, the discussion in this
chapter was divided into the two phases. In the first phase, the chapter commenced by defining the
content analysis method and justifying its use in addressing the first research objective. The
chapter then presented the population for the content analysis phase of the study which consisted
of the top 100 JSE listed operating companies, together with the justification for the selection of
the population, as well as the sampling criteria employed. The environmental reporting media,
namely; the IAR, SSR, and company websites were then discussed and the justification for their
selection provided.
The design of the five control lists and categories adapted from the prior studies were then
discussed, as well as the judgement scale employed to distinguish the quality of different
environmental information content. This was followed by a discussion of the pilot study
conducted to finalise the questions and categories in the control lists, as well as the decision rules
for coding. The actual coding processes which entailed scanning of IARs, SSRs and websites of
companies to determine the presence of the pre-selected items contained in the five control lists
was done in a manner that recorded only the actual environmental related disclosures instead of
implied meanings.
The chapter went on to elaborate on how the decision-usefulness of environmental reports was
measured. To measure relevance, reliability (including verifiability), timeliness and
236
understandability, four manual control lists were employed. If an item pre-listed in the control list
was absent in the IAR, SSR and a website of a company, a score of 0 points was assigned, if
present, the quality of such a disclosure was assessed then assigned 1 point, 2 points, or 3 points
according to the quantitative nature of the disclosure, as indicated on the judgement scale. 1 extra
point was awarded if the disclosure was futuristic and 1 more point if the disclosure was specific.
To measure comparability, a manual control list was employed. If a performance indicator pre-
listed in the control list was absent in the IAR, SSR and a website of a company, a score of 0
points was assigned. If present, the quality of the performance indicator was assessed then
assigned scores of 1 point, 2 points, 3 points, 4 points and 5 points depending on how the
performance indicator had been disclosed.
The data captured in the control lists were then analysed in a spread sheet to generate sums for
each qualitative characteristic, as well as a total environmental disclosure quality index for each
company. The latter was used to rank the operating top 100 JSE listed companies in a descending
fashion. The chapter then discussed the measures undertaken to ensure the reliability and validity
of the content analysis phase of the study, as well as the limitations and ethical considerations of
this method.
The second phase of the study, in form of a questionnaire survey meant to collect data for meeting
the second, third, fourth, fifth and sixth objective was then discussed. The second phase
commenced with the justification for questionnaire survey methodology, followed by a discussion
of the population and sample (comprising both users and preparers) as well as the convenient
sampling technique employed in selecting respondents. Two sets of questionnaires designed for
this study were then discussed. The two sets, one for users (representative of ethical investment
funds, representative of NGOs and environmental reporting researchers) and the other for
preparers (finance directors, accountants, executives managers and environmental officers) were
accompanied with a cover letter to encourage the would-be respondents to participate in the
survey and to guarantee them anonymity. The two sets were also designed to maximise the
comparability of responses of the two groups of respondents. To this end, they had identical
sections, similar questions and were mostly closed-ended with responses requested on either a
five-point likert scale, yes/no answers or as multiple-choice questions.

237
The questionnaires were divided into five sections which comprised 15 questions. They were
deliberately simplified to be completable in 15 minutes, a strategy meant to elicit a high response
rate. Each section of the questionnaire, as well as the questions therein and their objectives were
also discussed in the chapter. The questionnaires were pilot tested prior to dissemination to
ascertain that they were clear, unambiguous and understandable by the respondents. The
questionnaires were essentially disseminated to the respondents via an e-mail message with a
request to click on a URL link that redirected the respondents to a web-based survey.
The chapter then discussed the data analysis done using SPSS version 22. Both descriptive
statistics in form of percentages and measures of central tendency (mean) and measures of
variability (standard deviation) were employed to analyse the data. Inferential statistics in form of
a T-Test, Binomial Test and a Chi-Square were also performed. Question 14 which was open-
ended was analysed using Creswell’s data analysis spiral, as its data was qualitative in nature. The
chapter then discussed the measures undertaken to ensure the reliability and validity of the
questionnaire survey phase of the study, as well as the related limitations and ethical
considerations. In conclusion, it is the researcher's contention that the methodology adopted in the
current study was appropriate in addressing the research objectives of the study.
The next chapter (Chapter 6) presents the results and discussion relating to the content analysis
phase of the study.

238
CHAPTER 6
ANALYSIS OF RESULTS OF CONTENT ANALYSIS
6.1 INTRODUCTION
In this chapter, the results of the content analysis phase of the study are presented and discussed.
The chapter proceeds with a discussion of the objective and sub-objectives of the content analysis
phase of the study in section 6.2. This is followed by a discussion of the profile of the top 100
companies included in the content analysis phase of the study, including their market
capitalisation, and classification into sectors according to the FTSE global classification system
and global footprint in section 6.3. Section 6.4 of the chapter then presents results on the relevance
of the environmental reports of South African listed companies. This is followed by a presentation
of results on reliability (verifiability) of the environmental reports of South African listed
companies in section 6.5.
Section 6.6 presents results on comparability of environmental reports of South African listed
companies, followed by a presentation of results on understandability of environmental reports of
South African listed companies in section 6.7. Section 6.8 provides the results on timeliness of
environmental reports of South African listed companies, followed by a presentation of results on
overall decision-usefulness of South African listed companies in section 6.9. Section 6.10 then
provides an explanation of content analysis results using the decision-usefulness theory. Finally,
section 6.11 summarises the results and concludes the chapter.
6.2 OBJECTIVE AND SUB-OBJECTIVES OF THE CONTENT ANALYSIS PHASE OF THE
STUDY
The objective of the content analysis phase of the study was to evaluate the decision-usefulness of
the current environmental reporting practices by South African companies. To achieve this
objective required that the qualitative characteristics that make reports to be decision-useful be
evaluated. This necessitated the sub-division of the research objective into sub-objectives listed
below:

239
• To evaluate the relevance of the current environmental reporting practices by South African
companies
• to evaluate the reliability (verifiability) of the current environmental reporting practices by
South African companies
• to evaluate the comparability of the current environmental reporting practices by South
African companies
• to evaluate the timeliness of the current environmental reporting practices by South African
companies
• to evaluate the understandability of the current environmental reporting practices by South
African companies
6.3 PROFILE OF THE TOP 100 COMPANIES
The top 100 companies whose environmental disclosures located in the Integrated Annual Reports
(IARs), Stand-alone Sustainability Reports (SSR) and Corporate websites were analysed,
comprised all operating large-cap (Top 40) and mid-cap (Top 41-100) companies listed on the JSE
as measured by market capitalisation (See Appendix I).
The top 100 companies included in this study are large size organisations with a high turnover –
typically industry leaders in their own sectors – with physical presence in many provinces of
South Africa as well as with international presence. Given their large sizes and physical presence
in most provinces, these organisations do not only significantly impact the environment in the
areas in which they operate, they also exert pressure on the natural resources in those areas. In
addition, they employ a large number of people and support auxiliary industries in their supply
chain which further exacerbate their impact on the environment indirectly. Furthermore, these
companies are well resourced and can thus afford to employ dedicated personnel to focus on
environmental issues, as well as afford to prepare environmental reports on a variety of media.
As discussed earlier in section 5.23, only 66 companies were included in the sample. These
companies were drawn from diverse sectors, ranging from those with a significant impact on the
environment to those with a minimal impact (See Table 6.1). In terms of the percentage of the top
100 companies sampled, 37.88% were from the Retail and Services sector, 19.70 from the
Industrial and Consumption sector, and 18.18% from the Mining and Resources sector. The

240
remainder comprised 13.64% from the Financial sector, 7.58% from Real Estate sector, and 3.03%
from the ICT sector.
TABLE 6.1: SECTOR CLASSIFICATION OF THE SAMPLED TOP 100 COMPANIES
No Sector Number of
companies
in the
sample
Percentage
1 Retail and Services 25 37.88%
2 Mining and Resources 13 19.70%
3 Industrial and Consumption 12 18.18%
4 Financial 9 13.64%
5 Real Estate 5 7.58%
6 Information and Communication Technologies (ICT) 2 3.03%
Total 66 100%
6.4 ANALYSIS OF RELEVANCE OF CURRENT ENVIRONMENTAL REPORTING
DISCLOSURES
6.4.1 First sub-objective of the analysis
The first sub-objective of the content analysis phase of the study was to evaluate the relevance of
the current environmental reporting practices by the top 100 listed operating South African
companies. Environmental reports are relevant when they address the diverse concerns,
expectations and decision-making needs of the intended users (GRI, 2000:16). This can only
happen when the stakeholders are meaningfully engaged in the reporting process through a
dialogue meant to understand their information needs (Delloite Touche Tohmatsu, 2002:36).
Accordingly, the disclosure of stakeholder engagement practices can be used to gauge the
relevance of the environmental reports (Delloite Touche Tohmatsu, 2002:13).
To evaluate the relevance of the environmental reports, the content analysis of the environmental
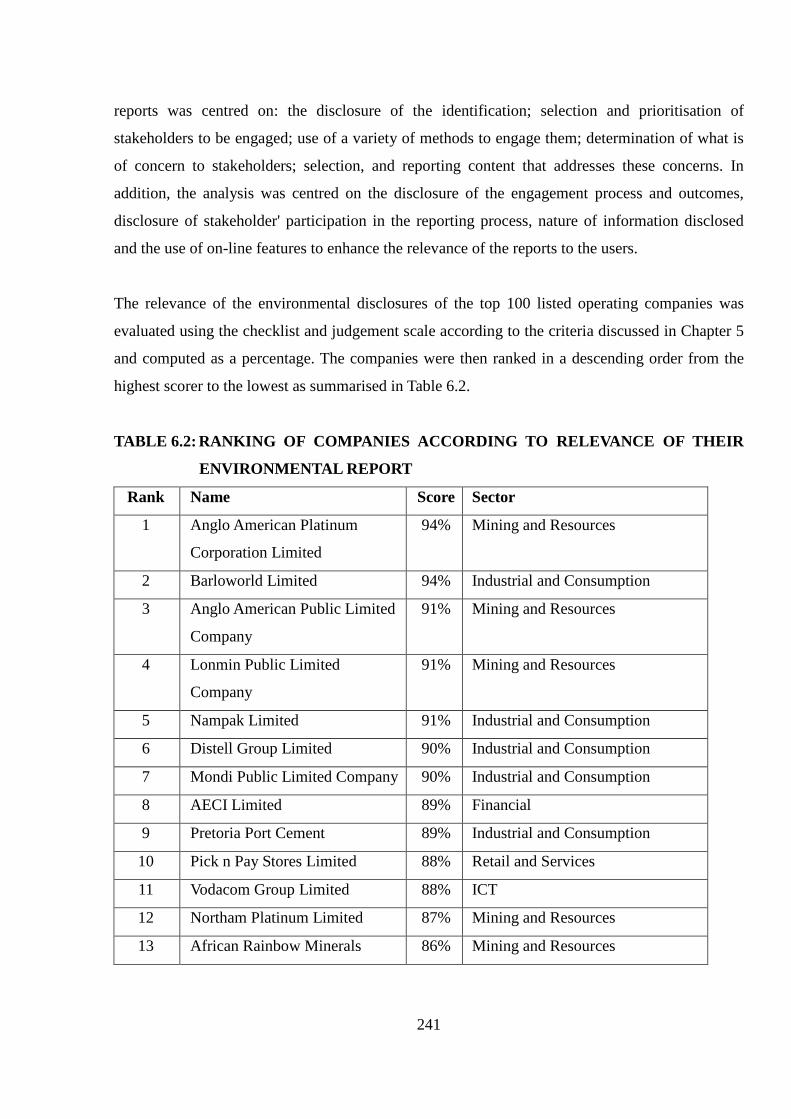
241
reports was centred on: the disclosure of the identification; selection and prioritisation of
stakeholders to be engaged; use of a variety of methods to engage them; determination of what is
of concern to stakeholders; selection, and reporting content that addresses these concerns. In
addition, the analysis was centred on the disclosure of the engagement process and outcomes,
disclosure of stakeholder' participation in the reporting process, nature of information disclosed
and the use of on-line features to enhance the relevance of the reports to the users.
The relevance of the environmental disclosures of the top 100 listed operating companies was
evaluated using the checklist and judgement scale according to the criteria discussed in Chapter 5
and computed as a percentage. The companies were then ranked in a descending order from the
highest scorer to the lowest as summarised in Table 6.2.
TABLE 6.2: RANKING OF COMPANIES ACCORDING TO RELEVANCE OF THEIR
ENVIRONMENTAL REPORT
Rank Name Score Sector
1 Anglo American Platinum
Corporation Limited
94% Mining and Resources
2 Barloworld Limited 94% Industrial and Consumption
3 Anglo American Public Limited
Company
91% Mining and Resources
4 Lonmin Public Limited
Company
91% Mining and Resources
5 Nampak Limited 91% Industrial and Consumption
6 Distell Group Limited 90% Industrial and Consumption
7 Mondi Public Limited Company 90% Industrial and Consumption
8 AECI Limited 89% Financial
9 Pretoria Port Cement 89% Industrial and Consumption
10 Pick n Pay Stores Limited 88% Retail and Services
11 Vodacom Group Limited 88% ICT
12 Northam Platinum Limited 87% Mining and Resources
13 African Rainbow Minerals 86% Mining and Resources
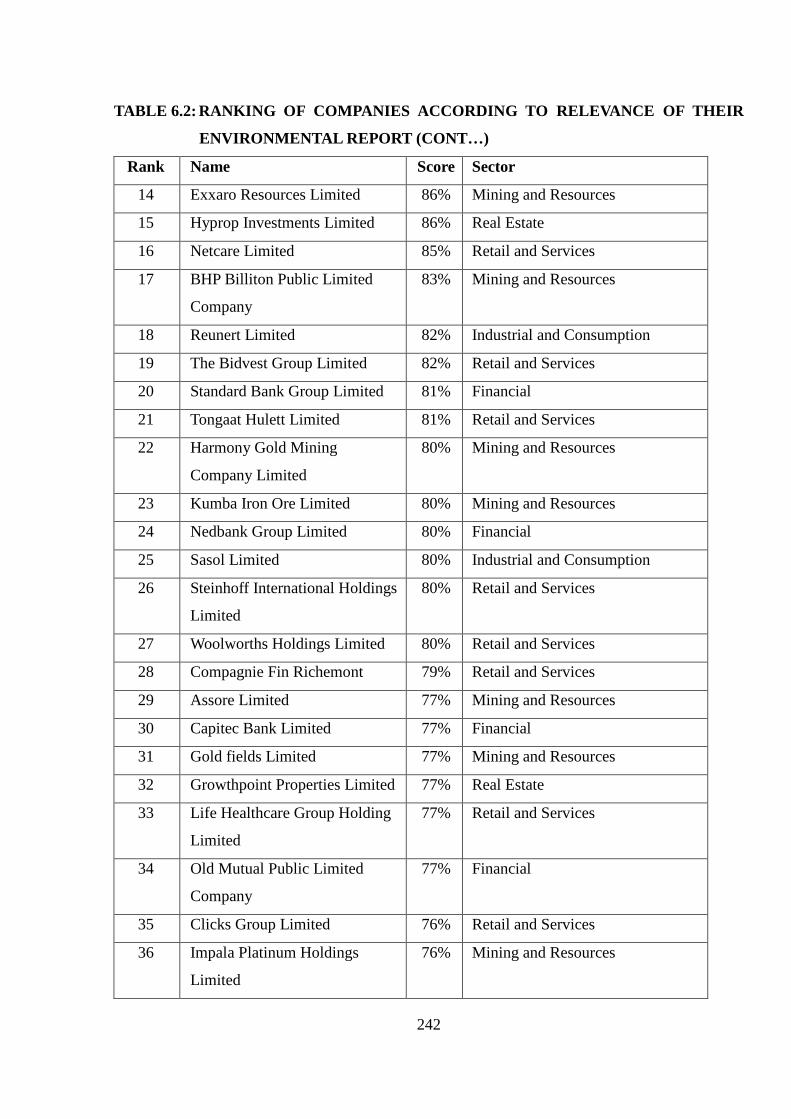
242
TABLE 6.2: RANKING OF COMPANIES ACCORDING TO RELEVANCE OF THEIR
ENVIRONMENTAL REPORT (CONT…)
Rank Name Score Sector
14 Exxaro Resources Limited 86% Mining and Resources
15 Hyprop Investments Limited 86% Real Estate
16 Netcare Limited 85% Retail and Services
17 BHP Billiton Public Limited
Company
83% Mining and Resources
18 Reunert Limited 82% Industrial and Consumption
19 The Bidvest Group Limited 82% Retail and Services
20 Standard Bank Group Limited 81% Financial
21 Tongaat Hulett Limited 81% Retail and Services
22 Harmony Gold Mining
Company Limited
80% Mining and Resources
23 Kumba Iron Ore Limited 80% Mining and Resources
24 Nedbank Group Limited 80% Financial
25 Sasol Limited 80% Industrial and Consumption
26 Steinhoff International Holdings
Limited
80% Retail and Services
27 Woolworths Holdings Limited 80% Retail and Services
28 Compagnie Fin Richemont 79% Retail and Services
29 Assore Limited 77% Mining and Resources
30 Capitec Bank Limited 77% Financial
31 Gold fields Limited 77% Mining and Resources
32 Growthpoint Properties Limited 77% Real Estate
33 Life Healthcare Group Holding
Limited
77% Retail and Services
34 Old Mutual Public Limited
Company
77% Financial
35 Clicks Group Limited 76% Retail and Services
36 Impala Platinum Holdings
Limited
76% Mining and Resources
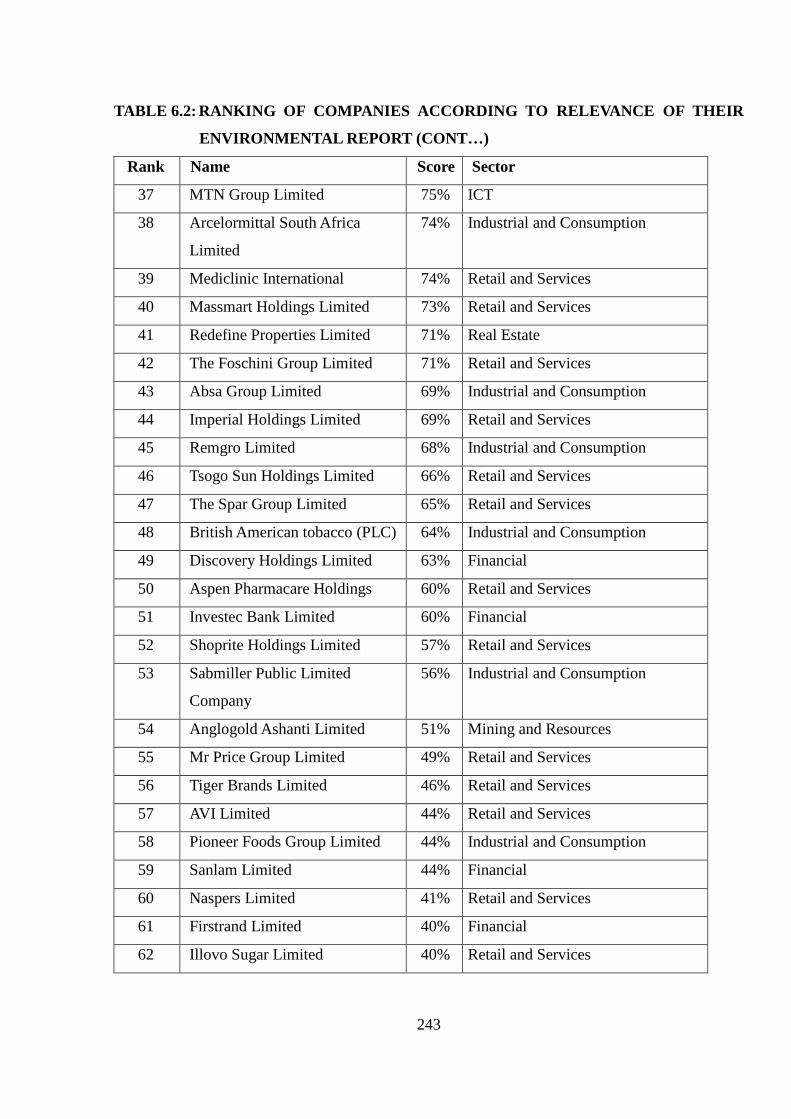
243
TABLE 6.2: RANKING OF COMPANIES ACCORDING TO RELEVANCE OF THEIR
ENVIRONMENTAL REPORT (CONT…)
Rank Name Score Sector
37 MTN Group Limited 75% ICT
38 Arcelormittal South Africa
Limited
74% Industrial and Consumption
39 Mediclinic International 74% Retail and Services
40 Massmart Holdings Limited 73% Retail and Services
41 Redefine Properties Limited 71% Real Estate
42 The Foschini Group Limited 71% Retail and Services
43 Absa Group Limited 69% Industrial and Consumption
44 Imperial Holdings Limited 69% Retail and Services
45 Remgro Limited 68% Industrial and Consumption
46 Tsogo Sun Holdings Limited 66% Retail and Services
47 The Spar Group Limited 65% Retail and Services
48 British American tobacco (PLC) 64% Industrial and Consumption
49 Discovery Holdings Limited 63% Financial
50 Aspen Pharmacare Holdings 60% Retail and Services
51 Investec Bank Limited 60% Financial
52 Shoprite Holdings Limited 57% Retail and Services
53 Sabmiller Public Limited
Company
56% Industrial and Consumption
54 Anglogold Ashanti Limited 51% Mining and Resources
55 Mr Price Group Limited 49% Retail and Services
56 Tiger Brands Limited 46% Retail and Services
57 AVI Limited 44% Retail and Services
58 Pioneer Foods Group Limited 44% Industrial and Consumption
59 Sanlam Limited 44% Financial
60 Naspers Limited 41% Retail and Services
61 Firstrand Limited 40% Financial
62 Illovo Sugar Limited 40% Retail and Services

244
TABLE 6.2: RANKING OF COMPANIES ACCORDING TO RELEVANCE OF THEIR
ENVIRONMENTAL REPORT (CONT…)
Rank Name Score Sector
63 MMI Holdings Limited 34% Retail and Services
64 Truworths International Limited 34% Retail and Services
65 Capital Property Fund 20% Real Estate
66 Resilient Property Income Fund 20% Real Estate
6.4.2 Results on relevance of environmental reports
The results of the current study indicate that the relevance of the environmental reports varied
widely among the companies sampled (See Table 6.2); from 94% for the company with the most
relevant reports to 20% for the company with the least relevant report. This result is consistent
with those of the prior studies which have shown that the disclosure practices of companies tend
to vary widely among listed companies (Kolk, 2005:39; KPMG, 2010:78; MacLean & Gottfrid,
2000:247; Mammatt et al., 2010:01). All the same, the reports produced by the sampled
companies were relevant as only 12 companies scored less than 50%. Simply put, about 82% of
the companies' environmental reports had a relevance score of at least 50%. The average score for
all the 66 companies was 70.43%, further confirmation that the reports were relevant.
6.5 ANALYSIS OF THE RELIABILITY (VERIFIABILITY) OF CURRENT
ENVIRONMENTAL REPORTING DISCLOSURES
6.5.1 Second sub-objective of the analysis
The second sub-objective of the content analysis phase of the study was to evaluate the reliability
and verifiability of the current environmental reporting practices by the top 100 listed operating
South African companies. Environmental reports are reliable and verifiable if they fulfil a number
of conditions, including: when they contain a statement from the most senior decision-maker of a
company; disclose the organisation structure; divulge the initiatives undertaken to mitigate the
environmental impacts; demonstrate external recognition and involvement; are independently
attested to, and if they contain independent third party commentary (Delloite Touche Tohmatsu,
2002:40; GRI, 2006:17). In addition, environmental reports are reliable and verifiable when the
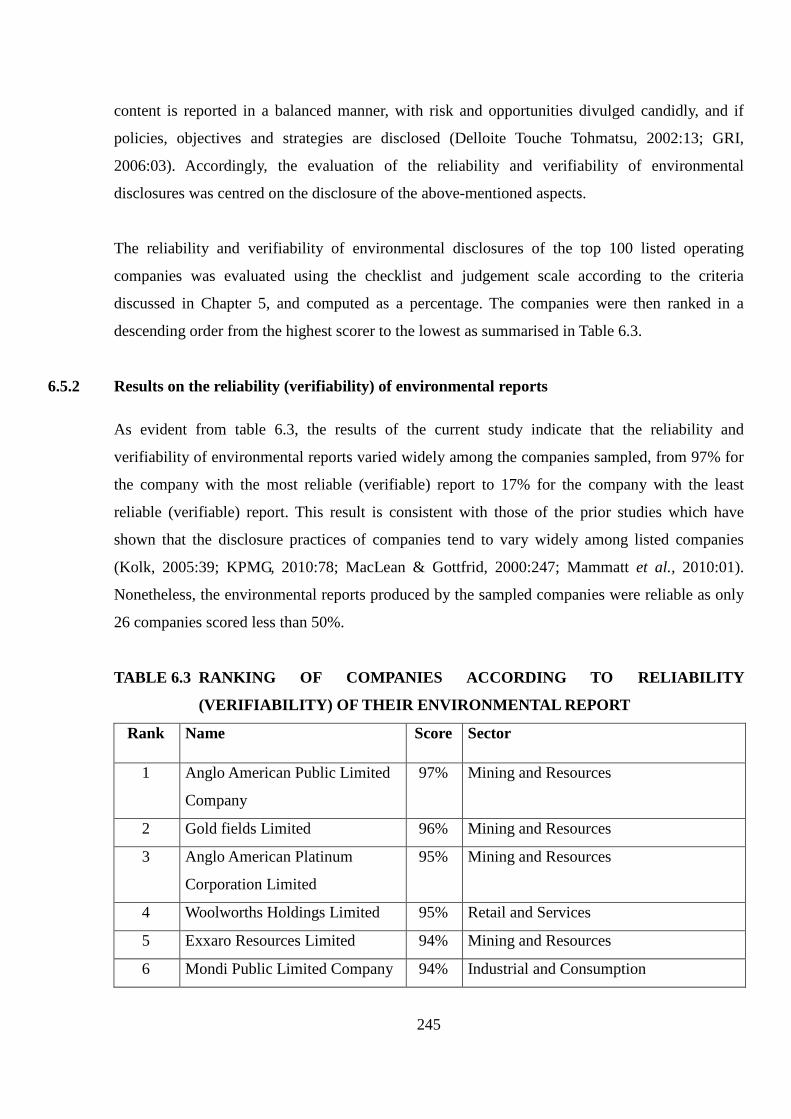
245
content is reported in a balanced manner, with risk and opportunities divulged candidly, and if
policies, objectives and strategies are disclosed (Delloite Touche Tohmatsu, 2002:13; GRI,
2006:03). Accordingly, the evaluation of the reliability and verifiability of environmental
disclosures was centred on the disclosure of the above-mentioned aspects.
The reliability and verifiability of environmental disclosures of the top 100 listed operating
companies was evaluated using the checklist and judgement scale according to the criteria
discussed in Chapter 5, and computed as a percentage. The companies were then ranked in a
descending order from the highest scorer to the lowest as summarised in Table 6.3.
6.5.2 Results on the reliability (verifiability) of environmental reports
As evident from table 6.3, the results of the current study indicate that the reliability and
verifiability of environmental reports varied widely among the companies sampled, from 97% for
the company with the most reliable (verifiable) report to 17% for the company with the least
reliable (verifiable) report. This result is consistent with those of the prior studies which have
shown that the disclosure practices of companies tend to vary widely among listed companies
(Kolk, 2005:39; KPMG, 2010:78; MacLean & Gottfrid, 2000:247; Mammatt et al., 2010:01).
Nonetheless, the environmental reports produced by the sampled companies were reliable as only
26 companies scored less than 50%.
TABLE 6.3 RANKING OF COMPANIES ACCORDING TO RELIABILITY
(VERIFIABILITY) OF THEIR ENVIRONMENTAL REPORT
Rank Name Score Sector
1 Anglo American Public Limited
Company
97% Mining and Resources
2 Gold fields Limited 96% Mining and Resources
3 Anglo American Platinum
Corporation Limited
95% Mining and Resources
4 Woolworths Holdings Limited 95% Retail and Services
5 Exxaro Resources Limited 94% Mining and Resources
6 Mondi Public Limited Company 94% Industrial and Consumption
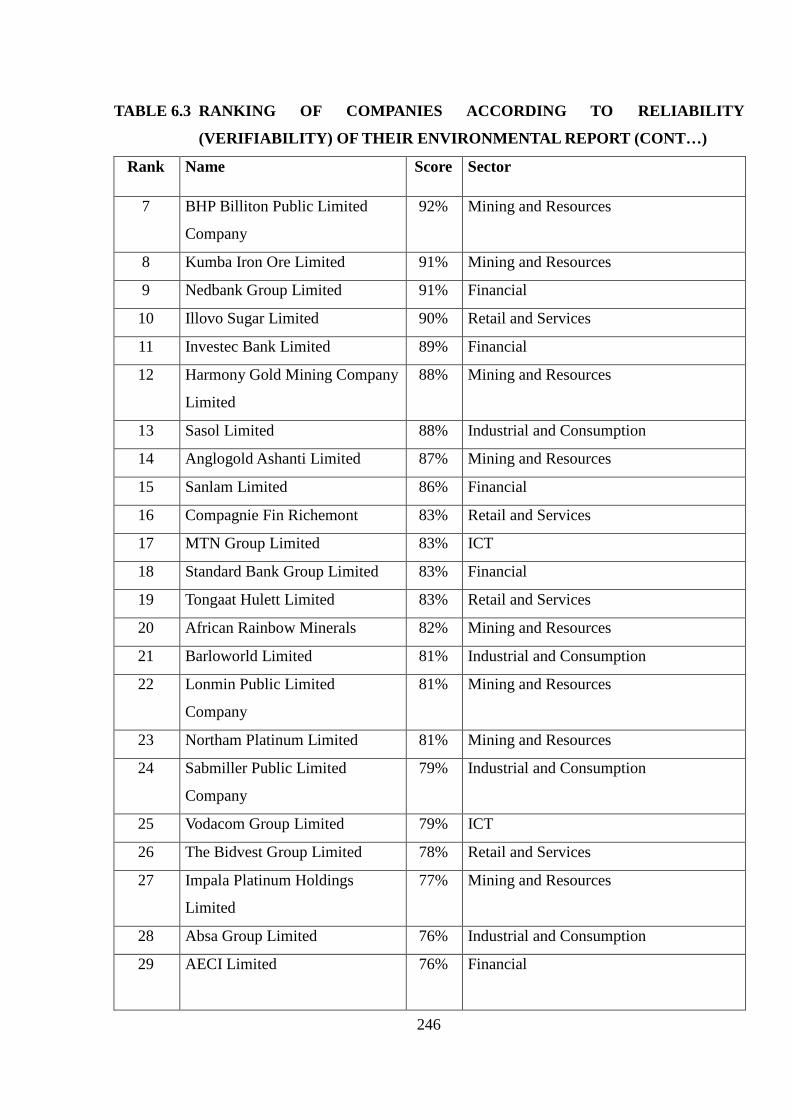
246
TABLE 6.3 RANKING OF COMPANIES ACCORDING TO RELIABILITY
(VERIFIABILITY) OF THEIR ENVIRONMENTAL REPORT (CONT…)
Rank Name Score Sector
7 BHP Billiton Public Limited
Company
92% Mining and Resources
8 Kumba Iron Ore Limited 91% Mining and Resources
9 Nedbank Group Limited 91% Financial
10 Illovo Sugar Limited 90% Retail and Services
11 Investec Bank Limited 89% Financial
12 Harmony Gold Mining Company
Limited
88% Mining and Resources
13 Sasol Limited 88% Industrial and Consumption
14 Anglogold Ashanti Limited 87% Mining and Resources
15 Sanlam Limited 86% Financial
16 Compagnie Fin Richemont 83% Retail and Services
17 MTN Group Limited 83% ICT
18 Standard Bank Group Limited 83% Financial
19 Tongaat Hulett Limited 83% Retail and Services
20 African Rainbow Minerals 82% Mining and Resources
21 Barloworld Limited 81% Industrial and Consumption
22 Lonmin Public Limited
Company
81% Mining and Resources
23 Northam Platinum Limited 81% Mining and Resources
24 Sabmiller Public Limited
Company
79% Industrial and Consumption
25 Vodacom Group Limited 79% ICT
26 The Bidvest Group Limited 78% Retail and Services
27 Impala Platinum Holdings
Limited
77% Mining and Resources
28 Absa Group Limited 76% Industrial and Consumption
29 AECI Limited
76% Financial
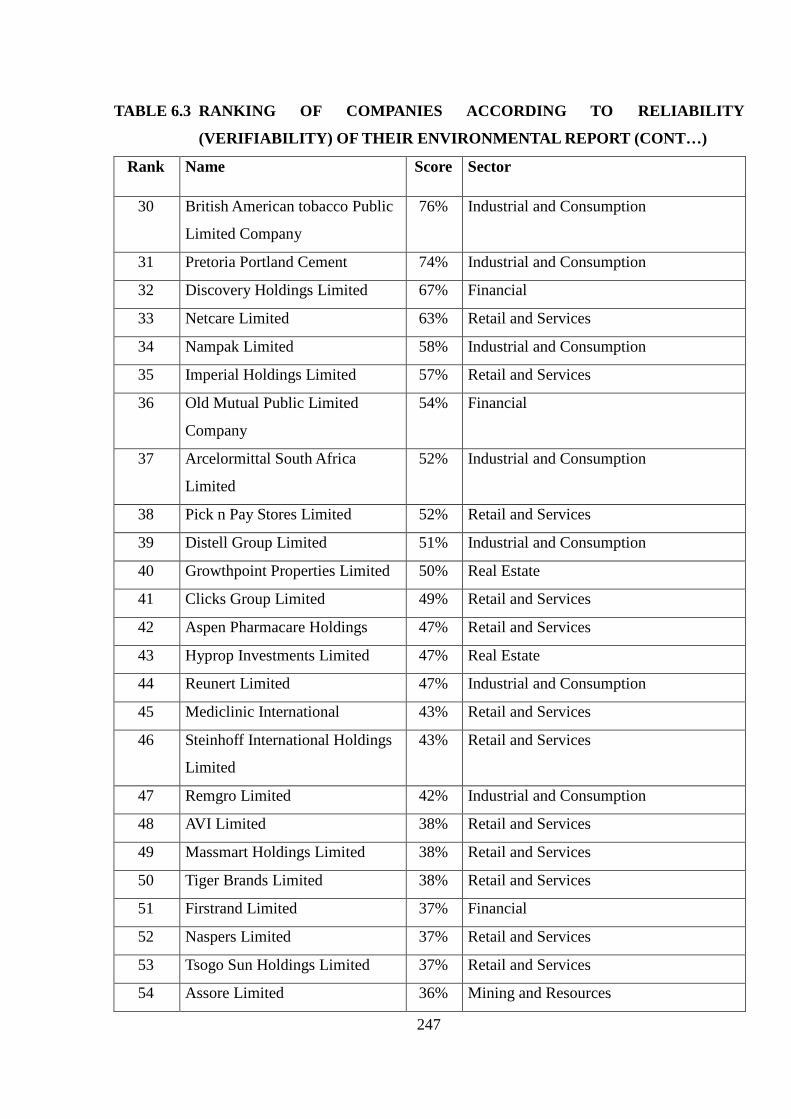
247
TABLE 6.3 RANKING OF COMPANIES ACCORDING TO RELIABILITY
(VERIFIABILITY) OF THEIR ENVIRONMENTAL REPORT (CONT…)
Rank Name Score Sector
30 British American tobacco Public
Limited Company
76% Industrial and Consumption
31 Pretoria Portland Cement 74% Industrial and Consumption
32 Discovery Holdings Limited 67% Financial
33 Netcare Limited 63% Retail and Services
34 Nampak Limited 58% Industrial and Consumption
35 Imperial Holdings Limited 57% Retail and Services
36 Old Mutual Public Limited
Company
54% Financial
37 Arcelormittal South Africa
Limited
52% Industrial and Consumption
38 Pick n Pay Stores Limited 52% Retail and Services
39 Distell Group Limited 51% Industrial and Consumption
40 Growthpoint Properties Limited 50% Real Estate
41 Clicks Group Limited 49% Retail and Services
42 Aspen Pharmacare Holdings 47% Retail and Services
43 Hyprop Investments Limited 47% Real Estate
44 Reunert Limited 47% Industrial and Consumption
45 Mediclinic International 43% Retail and Services
46 Steinhoff International Holdings
Limited
43% Retail and Services
47 Remgro Limited 42% Industrial and Consumption
48 AVI Limited 38% Retail and Services
49 Massmart Holdings Limited 38% Retail and Services
50 Tiger Brands Limited 38% Retail and Services
51 Firstrand Limited 37% Financial
52 Naspers Limited 37% Retail and Services
53 Tsogo Sun Holdings Limited 37% Retail and Services
54 Assore Limited 36% Mining and Resources
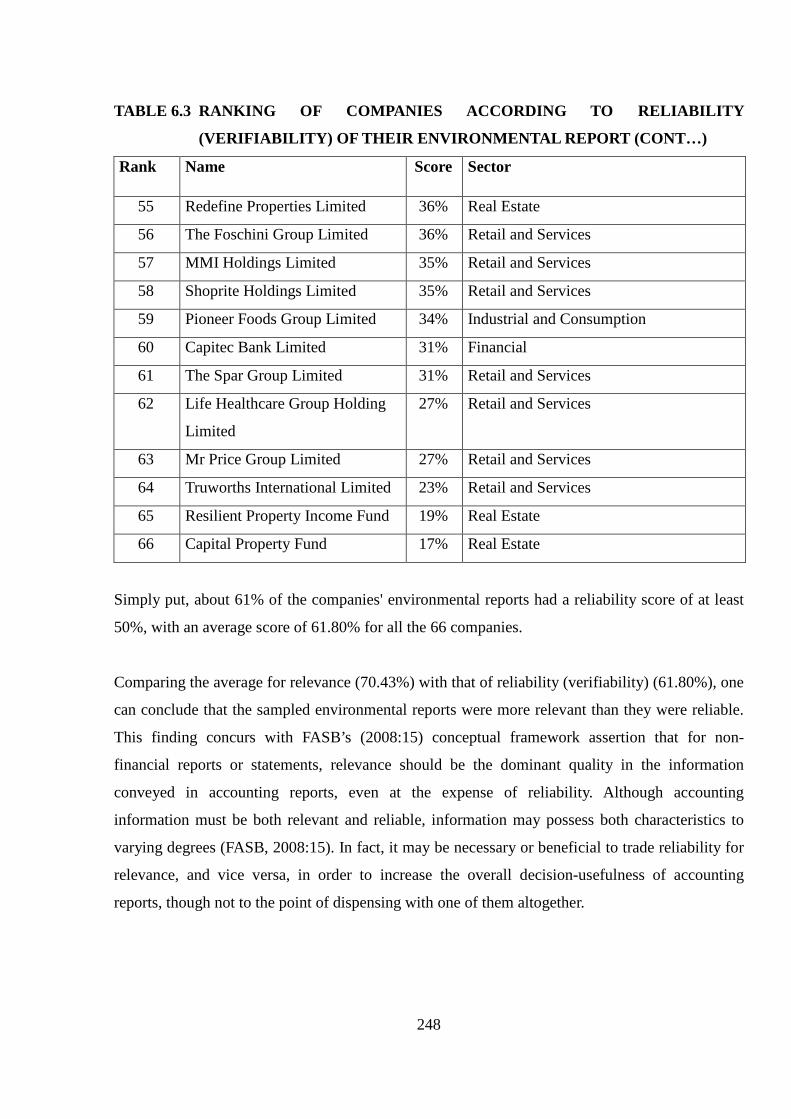
248
TABLE 6.3 RANKING OF COMPANIES ACCORDING TO RELIABILITY
(VERIFIABILITY) OF THEIR ENVIRONMENTAL REPORT (CONT…)
Rank Name Score Sector
55 Redefine Properties Limited 36% Real Estate
56 The Foschini Group Limited 36% Retail and Services
57 MMI Holdings Limited 35% Retail and Services
58 Shoprite Holdings Limited 35% Retail and Services
59 Pioneer Foods Group Limited 34% Industrial and Consumption
60 Capitec Bank Limited 31% Financial
61 The Spar Group Limited 31% Retail and Services
62 Life Healthcare Group Holding
Limited
27% Retail and Services
63 Mr Price Group Limited 27% Retail and Services
64 Truworths International Limited 23% Retail and Services
65 Resilient Property Income Fund 19% Real Estate
66 Capital Property Fund 17% Real Estate
Simply put, about 61% of the companies' environmental reports had a reliability score of at least
50%, with an average score of 61.80% for all the 66 companies.
Comparing the average for relevance (70.43%) with that of reliability (verifiability) (61.80%), one
can conclude that the sampled environmental reports were more relevant than they were reliable.
This finding concurs with FASB’s (2008:15) conceptual framework assertion that for non-
financial reports or statements, relevance should be the dominant quality in the information
conveyed in accounting reports, even at the expense of reliability. Although accounting
information must be both relevant and reliable, information may possess both characteristics to
varying degrees (FASB, 2008:15). In fact, it may be necessary or beneficial to trade reliability for
relevance, and vice versa, in order to increase the overall decision-usefulness of accounting
reports, though not to the point of dispensing with one of them altogether.

249
6.6 COMPARABILITY OF CURRENT ENVIRONMENTAL REPORTING DISCLOSURES
6.6.1 Third sub-objective of the analysis
The third sub-objective of the content analysis phase of the study was to evaluate the
comparability of the current environmental reporting practices by the top 100 listed operating
South African companies. Central to the evaluation of comparability of environmental reports is
the analysis of disclosure of key performance indicators that enable readers to assess the
performance of a company both over time and in comparison with other companies (GRI,
2000:25). GRI (2000:25). This evaluation advocates that where applicable, key performance
indicators disclosed should include quantitative information for the current period, historical
trends for at least the previous two reporting periods, and a target period, as well as a comparison
to industry averages.
Accordingly, the comparability of environmental reports can be gauged by analysing the
disclosure of standardised GRI environmental key performance indicators EN1 to EN30, and
evaluating whether these indicators are disclosed in narrative or quantitative form, relative to prior
periods, to targets or to peers/industry averages. Comparability of environmental reports may also
be gauged by whether or not companies archive their reports for multiple years in an accessible
manner on their websites.
To determine the comparability of the environmental reports, the disclosure of standardised GRI
environmental key performance indicators EN1 to EN30 by the top 100 listed operating
companies was evaluated according to the criteria, checklist and a judgement scale discussed in
Chapter 5. In addition, companies’ websites were evaluated to determine whether they contained
an archive of environmental reports for multiple years. The comparability of the environmental
disclosures of the top 100 listed operating companies was then computed as a percentage and the
companies ranked in a descending order from the highest scorer to the lowest as summarised in
Table 6.4.

250
TABLE 6.4: RANKING OF COMPANIES ACCORDING TO COMPARABILITY OF
THEIR ENVIRONMENTAL REPORT
Rank Name Score Sector
1 Anglo American Platinum
Corporation Limited
51% Mining and Resources
2 Barloworld Limited 50% Industrial and Consumption
3 Standard Bank Group Limited 50% Financial
4 Mondi Public Limited Company 48% Industrial and Consumption
5 Woolworths Holdings Limited 48% Retail and Services
6 Vodacom Group Limited 47% ICT
7 Nedbank Group Limited 46% Financial
8 The Foschini Group Limited 45% Retail and Services
9 Gold fields Limited 44% Mining and Resources
10 Lonmin Public Limited
Company
43% Mining and Resources
11 British American tobacco Public
Limited Company
42% Industrial and Consumption
12 Sasol Limited 42% Industrial and Consumption
13 Pick n Pay Stores Limited 40% Retail and Services
14 Anglo American Public Limited
Company
39% Mining and Resources
15 Tongaat Hulett Limited 38% Retail and Services
16 Absa Group Limited 37% Financial
17 Impala Platinum Holdings
Limited
36% Mining and Resources
18 Mediclinic International 36% Retail and Services
19 Anglogold Ashanti Limited 35% Mining and Resources
20 Investec Bank Limited 35% Financial
21 African Rainbow Minerals 33% Mining and Resources
22 BHP Billiton Public Limited
Company
33% Mining and Resources

251
TABLE 6.4: RANKING OF COMPANIES ACCORDING TO COMPARABILITY OF
THEIR ENVIRONMENTAL REPORT (CONT…)
Rank Name Score Sector
23 Harmony Gold Mining Company
Limited
33% Mining and Resources
24 Exxaro Resources Limited 32% Mining and Resources
25 Kumba Iron Ore Limited 32% Mining and Resources
26 Netcare Limited 32% Retail and Services
27 Discovery Holdings Limited 30% Financial
28 Distell Group Limited 30% Industrial and Consumption
29 Sanlam Limited 30% Financial
30 Aspen Pharmacare Holdings 29% Retail and Services
31 Illovo Sugar Limited 28% Retail and Services
32 Old Mutual Public Limited
Company
28% Financial
33 Compagnie Fin Richemont 27% Retail and Services
34 Remgro Limited 27% Industrial and Consumption
35 Pretoria Portland Cement 26% Industrial and Consumption
36 Reunert Limited 26% Industrial and Consumption
37 The Spar Group Limited 26% Retail and Services
38 Northam Platinum Limited 24% Mining and Resources
39 Arcelormittal South Africa
Limited
23% Industrial and Consumption
40 Imperial Holdings Limited 23% Retail and Services
41 Steinhoff International Holdings
Limited
23% Retail and Services
42 Assore Limited 22% Mining and Resources
43 Nampak Limited 22% Industrial and Consumption
44 The Bidvest Group Limited 21% Retail and Services
45 Massmart Holdings Limited 20% Retail and Services
46 MTN Group Limited 20% ICT
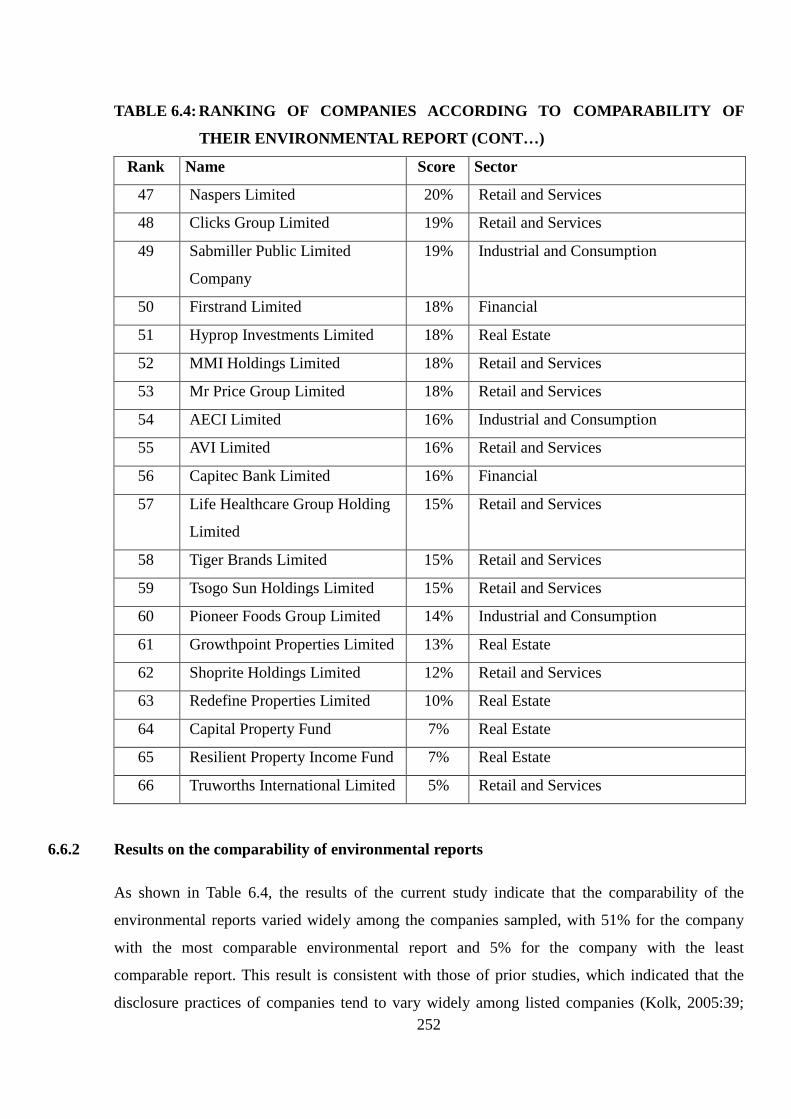
252
TABLE 6.4: RANKING OF COMPANIES ACCORDING TO COMPARABILITY OF
THEIR ENVIRONMENTAL REPORT (CONT…)
Rank Name Score Sector
47 Naspers Limited 20% Retail and Services
48 Clicks Group Limited 19% Retail and Services
49 Sabmiller Public Limited
Company
19% Industrial and Consumption
50 Firstrand Limited 18% Financial
51 Hyprop Investments Limited 18% Real Estate
52 MMI Holdings Limited 18% Retail and Services
53 Mr Price Group Limited 18% Retail and Services
54 AECI Limited 16% Industrial and Consumption
55 AVI Limited 16% Retail and Services
56 Capitec Bank Limited 16% Financial
57 Life Healthcare Group Holding
Limited
15% Retail and Services
58 Tiger Brands Limited 15% Retail and Services
59 Tsogo Sun Holdings Limited 15% Retail and Services
60 Pioneer Foods Group Limited 14% Industrial and Consumption
61 Growthpoint Properties Limited 13% Real Estate
62 Shoprite Holdings Limited 12% Retail and Services
63 Redefine Properties Limited 10% Real Estate
64 Capital Property Fund 7% Real Estate
65 Resilient Property Income Fund 7% Real Estate
66 Truworths International Limited 5% Retail and Services
6.6.2 Results on the comparability of environmental reports
As shown in Table 6.4, the results of the current study indicate that the comparability of the
environmental reports varied widely among the companies sampled, with 51% for the company
with the most comparable environmental report and 5% for the company with the least
comparable report. This result is consistent with those of prior studies, which indicated that the
disclosure practices of companies tend to vary widely among listed companies (Kolk, 2005:39;
253
KPMG, 2010:78; MacLean & Gottfrid, 2000:247; Mammatt et al., 2010:01). Unlike in the other
qualitative characteristics of decision-useful information, the environmental reports of the
sampled companies were not comparable as only three companies scored at least 50%. Quite
distinctly, just above 95% of the companies' environmental reports had a comparability score
below 50%. The average score for all the 66 companies was 27.92%.
Comparing the companies’ environmental reports’ average for comparability (27.92%) to their
average for relevance (70.43%) and reliability (verifiability) (61.80%), one can conclude that the
sampled environmental reports were more relevant and reliable, than they were comparable. The
incomparability of environmental reports can be explained using FASB’s (2008:27) conceptual
framework which posits that incomparability arises because business enterprises, even those in the
same sector, do not use similar inputs, do not apply similar procedures, or do not classify costs
using the same systems.
Sampled companies appear to be aligned with FASB’s (2008:12) conceptual framework assertion
that comparability as an enhancing qualitative characteristic does not significantly impact the
decision-usefulness of accounting information, as does relevance and reliability. In fact,
attempting to force comparability of two measures that are essentially different could undermine
relevance and reliability if comparability is attained by making the unlike disclosures to look alike
(FASB’s, 2008:28). Simply put, in seeking comparability, real differences should not be disguised
as more can be learned from differences than from similarities – if the differences can be
explained (FASB, 2008:27).
Although the use of a consistent disclosure method, whether from one period to another within a
single company, or within a single period across companies is a necessary condition for
comparability, it is not a sufficient condition for the latter (FASB’s, 2008:28). In addition a
consistent disclosure method from one accounting period to another, if pushed too far, can inhibit
accounting progress because no change to a preferred disclosure method can be made without
sacrificing consistency. Yet, there is no way that accounting can progress without change (FASB’s,
2008:28).
254
6.7 ANALYSIS OF UNDERSTANDABILITY OF CURRENT ENVIRONMENTAL
REPORTING DISCLOSURES
6.7.1 Fourth sub-objective of the analysis
The fourth sub-objective of the content analysis phase of the study was to evaluate the
understandability of the current environmental reporting practices by the top 100 listed operating
South African companies. Understandability requires classifying, characterising, and presenting
information clearly and concisely (FASB, 2010:21). In environmental reporting, understandability
of the reports can be enhanced by contextualising the reports: by disclosing the company profile,
scale of operation and providing the reports’ scope and boundary (GRI, 2006:21). In addition, it
can be enhanced by providing a summary of performance indicators, ensuring accessibility of the
information in the reports, use of a logical report structure, use of suitable graphics and pictures,
reporting bilingually as well as through simplification of terms used (Delloite Touché Tohmatsu,
2002:15). Furthermore, understandability can be enhanced by using web capabilities to ease
interactivity, navigation, accessibility of information and user-friendliness of on-line
environmental reports (GRI, 2006:16).
To gauge the understandability of the environmental reports, they were evaluated according to
whether or not they disclosed information discussed in the previous paragraph or whether they
had the features described in it. All these were based on the criteria, checklist and a judgement
scale discussed in Chapter 5. The understandability of the environmental disclosures of the top
100 listed operating companies was then computed as a percentage and the companies ranked in a
descending order from the highest scorer to the lowest as summarised in Table 6.5.
6.7.2 Results on the understandability of environmental reports
As shown in Table 6.5, the results of the current study indicate that the understandability of the
environmental reports varied widely among the companies sampled – 89% for the company with
the most understandable environmental report to 30% for the company with the least
understandable report. This result is consistent with those of the prior similar studies which
reported that the disclosure practices of companies tend to vary widely among listed companies
(Kolk, 2005:39; KPMG, 2010:78; MacLean & Gottfrid, 2000:247; Mammatt et al., 2010:01).
Notwithstanding the above-mentioned disparity in the understandability of the environmental

255
reports, the reports of the sampled companies were understandable as only six companies scored
less than 50%. About 91% of the companies' environmental reports had an understandability score
of at least 50%. The average score for understandability for all the 66 companies sampled was
69.68%.
TABLE 6.5: RANKING OF COMPANIES ACCORDING TO UNDERSTANDABILITY OF
THEIR ENVIRONMENTAL REPORT
Rank Name Score Sector
1 Sasol Limited 89% Industrial and Consumption
2 Vodacom Group Limited 87% ICT
3 Anglo American Public Limited
Company
85% Mining and Resources
4 Barloworld Limited 84% Industrial and Consumption
5 Woolworths Holdings Limited 84% Retail and Services
6 BHP Billiton Public Limited
Company
83% Mining and Resources
7 Pretoria Port Cement 83% Industrial and Consumption
8 Standard Bank Group Limited 82% Financial
9 Anglogold Ashanti Limited 81% Mining and Resources
10 British American tobacco (PLC) 81% Industrial and Consumption
11 Sabmiller Public Limited
Company
80% Industrial and Consumption
12 MTN Group Limited 79% ICT
13 African Rainbow Minerals 78% Mining and Resources
14 Harmony Gold Mining
Company Limited
78% Mining and Resources
15 Old Mutual Public Limited
Company
78% Financial
16 Aspen Pharmacare Holdings 77% Retail and Services
17 Nampak Limited 77% Industrial and Consumption
18 Northam Platinum Limited 77% Mining and Resources
19 Absa Group Limited 76% Financial
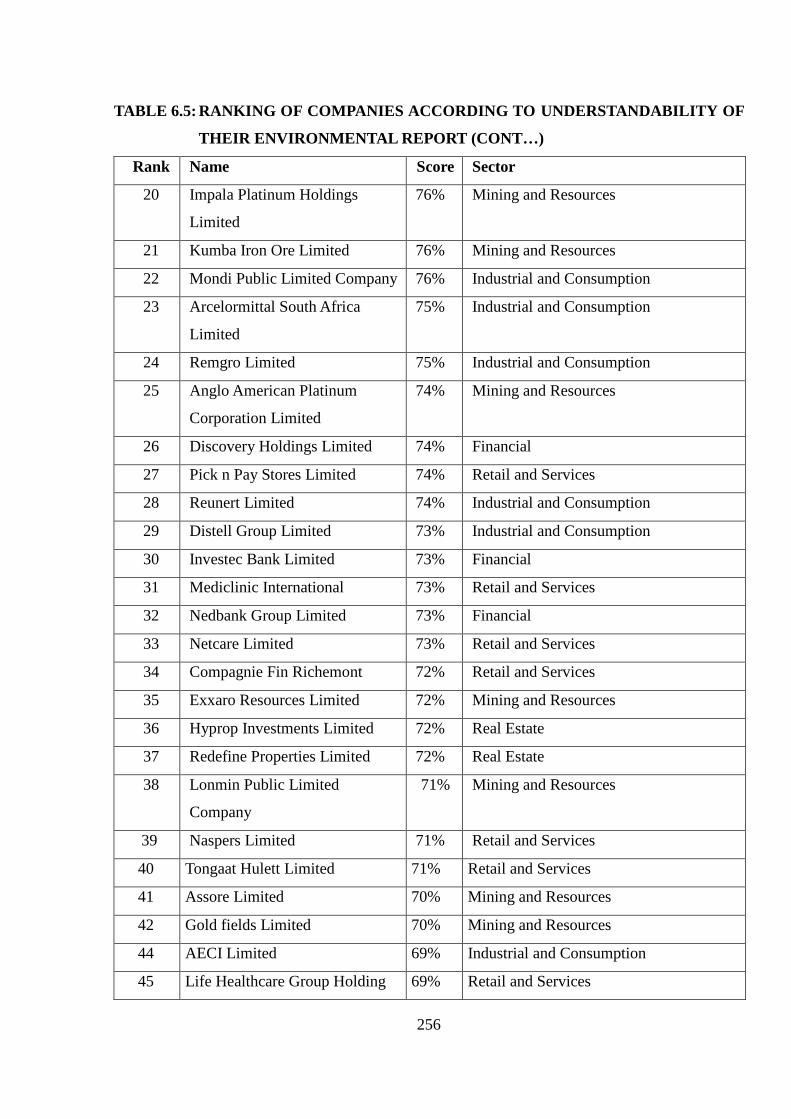
256
TABLE 6.5: RANKING OF COMPANIES ACCORDING TO UNDERSTANDABILITY OF
THEIR ENVIRONMENTAL REPORT (CONT…)
Rank Name Score Sector
20 Impala Platinum Holdings
Limited
76% Mining and Resources
21 Kumba Iron Ore Limited 76% Mining and Resources
22 Mondi Public Limited Company 76% Industrial and Consumption
23 Arcelormittal South Africa
Limited
75% Industrial and Consumption
24 Remgro Limited 75% Industrial and Consumption
25 Anglo American Platinum
Corporation Limited
74% Mining and Resources
26 Discovery Holdings Limited 74% Financial
27 Pick n Pay Stores Limited 74% Retail and Services
28 Reunert Limited 74% Industrial and Consumption
29 Distell Group Limited 73% Industrial and Consumption
30 Investec Bank Limited 73% Financial
31 Mediclinic International 73% Retail and Services
32 Nedbank Group Limited 73% Financial
33 Netcare Limited 73% Retail and Services
34 Compagnie Fin Richemont 72% Retail and Services
35 Exxaro Resources Limited 72% Mining and Resources
36 Hyprop Investments Limited 72% Real Estate
37 Redefine Properties Limited 72% Real Estate
38 Lonmin Public Limited
Company
71% Mining and Resources
39 Naspers Limited 71% Retail and Services
40 Tongaat Hulett Limited 71% Retail and Services
41 Assore Limited 70% Mining and Resources
42 Gold fields Limited 70% Mining and Resources
44 AECI Limited 69% Industrial and Consumption
45 Life Healthcare Group Holding 69% Retail and Services

257
TABLE 6.5: RANKING OF COMPANIES ACCORDING TO UNDERSTANDABILITY OF
THEIR ENVIRONMENTAL REPORT (CONT…)
Rank Name Score Sector
46 Massmart Holdings Limited 69% Retail and Services
47 The Bidvest Group Limited 69% Retail and Services
48 Tiger Brands Limited 69% Retail and Services
49 Clicks Group Limited 68% Retail and Services
50 Pioneer Foods Group Limited 67% Industrial and Consumption
51 MMI Holdings Limited 66% Retail and Services
52 Truworths International Limited 65% Retail and Services
53 Sanlam Limited 63% Financial
54 The Spar Group Limited 62% Retail and Services
55 Imperial Holdings Limited 61% Retail and Services
56 The Foschini Group Limited 61% Retail and Services
57 AVI Limited 59% Retail and Services
58 Growthpoint Properties Limited 56% Real Estate
59 Mr Price Group Limited 56% Retail and Services
60 Firstrand Limited 53% Financial
61 Illovo Sugar Limited 48% Retail and Services
62 Shoprite Holdings Limited 46% Retail and Services
63 Capitec Bank Limited 38% Financial
64 Tsogo Sun Holdings Limited 34% Retail and Services
65 Resilient Property Income Fund 32% Real Estate
66 Capital Property Fund 30% Real Estate
Comparing the companies’ environmental reports’ average for understandability, to their average
score for relevance (70.43%), reliability (verifiability) (61.80%) and comparability (27.92%), one
can conclude that the sampled environmental reports were more relevant than they were
understandable. However, the reports were more understandable than they were reliable and
comparable.

258
6.8 ANALYSIS OF TIMELINESS OF CURRENT ENVIRONMENTAL REPORTING
DISCLOSURES
6.8.1 Fifth sub-objective of the analysis
The fifth sub-objective of the content analysis phase of the study was to evaluate the timeliness of
the current environmental reporting practices by the top 100 listed operating South African
companies. Timeliness requires that information be provided within the time it is needed or before
it loses its capacity to influence decisions (IASB 2008:40). The sooner the information is
received, the more useful it is in influencing decisions (FASB 2010:20).
TABLE 6.6: RANKING OF COMPANIES ACCORDING TO TIMELINESS OF THEIR
ENVIRONMENTAL REPORT
Rank Name Score Sector
1 Old Mutual Public Limited
Company
100% Financial
2 Anglo American Public Limited
Company
90% Mining and Resources
3 Kumba Iron Ore Limited 90% Mining and Resources
4 Sabmiller Public Limited
Company
90% Industrial and Consumption
5 Sanlam Limited 90% Financial
6 Woolworths Holdings Limited 90% Retail and Services
7 Clicks Group Limited 80% Retail and Services
8 Compagnie Fin Richemont 80% Retail and Services
9 Exxaro Resources Limited 80% Mining and Resources
10 Gold fields Limited 80% Mining and Resources
11 Illovo Sugar Limited 80% Retail and Services
12 Impala Platinum Holdings
Limited
80% Mining and Resources
13 Massmart Holdings Limited 80% Retail and Services
14 Mondi Public Limited Company 80% Industrial and Consumption

259
TABLE 6.6: RANKING OF COMPANIES ACCORDING TO TIMELINESS OF THEIR
ENVIRONMENTAL REPORT (CONT…)
Rank Name Score Sector
15 Tongaat Hulett Limited 80% Retail and Services
16 Vodacom Group Limited 80% ICT
17 African Rainbow Minerals 70% Mining and Resources
18 Aspen Pharmacare Holdings 70% Retail and Services
19 AVI Limited 70% Retail and Services
20 Barloworld Limited 70% Industrial and Consumption
21 BHP Billiton Public Limited
Company
70% Mining and Resources
22 Firstrand Limited 70% Financial
23 Harmony Gold Mining
Company Limited
70% Mining and Resources
24 Hyprop Investments Limited 70% Real Estate
25 Imperial Holdings Limited 70% Retail and Services
26 Investec Bank Limited 70% Financial
27 Lonmin Public Limited
Company
70% Mining and Resources
28 Mediclinic International 70% Retail and Services
29 MTN Group Limited 70% ICT
30 Northam Platinum Limited 70% Mining and Resources
31 Pick n Pay Stores Limited 70% Retail and Services
32 Standard Bank Group Limited 70% Financial
33 Steinhoff International Holdings
Limited
70% Retail and Services
34 The Bidvest Group Limited 70% Retail and Services
35 Absa Group Limited 60% Financial
36 AECI Limited 60% Industrial and Consumption
37 Anglo American Platinum
Corporation Limited
60% Mining and Resources
38 Anglogold Ashanti Limited 60% Mining and Resources

260
TABLE 6.6: RANKING OF COMPANIES ACCORDING TO TIMELINESS OF THEIR
ENVIRONMENTAL REPORT (CONT…)
Rank Name Score Sector
39 Arcelormittal South Africa
Limited
60% Industrial and Consumption
40 Assore Limited 60% Mining and Resources
41 British American tobacco Public
Limited Company
60% Industrial and Consumption
42 Capitec Bank Limited 60% Financial
43 Discovery Holdings Limited 60% Financial
44 Distell Group Limited 60% Industrial and Consumption
45 Growthpoint Properties Limited 60% Real Estate
46 Life Healthcare Group Holding
Limited
60% Retail and Services
47 MMI Holdings Limited 60% Retail and Services
48 Mr Price Group Limited 60% Retail and Services
49 Nampak Limited 60% Industrial and Consumption
50 Naspers Limited 60% Retail and Services
51 Nedbank Group Limited 60% Financial
52 Netcare Limited 60% Retail and Services
53 Pioneer Foods Group Limited 60% Industrial and Consumption
54 Pretoria Port Cement 60% Industrial and Consumption
55 Remgro Limited 60% Industrial and Consumption
56 Reunert Limited 60% Industrial and Consumption
57 Sasol Limited 60% Industrial and Consumption
58 Shoprite Holdings Limited 60% Retail and Services
59 Tiger Brands Limited 60% Retail and Services
60 Truworths International Limited 60% Retail and Services
61 The Foschini Group Limited 50% Retail and Services
62 The Spar Group Limited 50% Retail and Services
63 Tsogo Sun Holdings Limited 50% Retail and Services
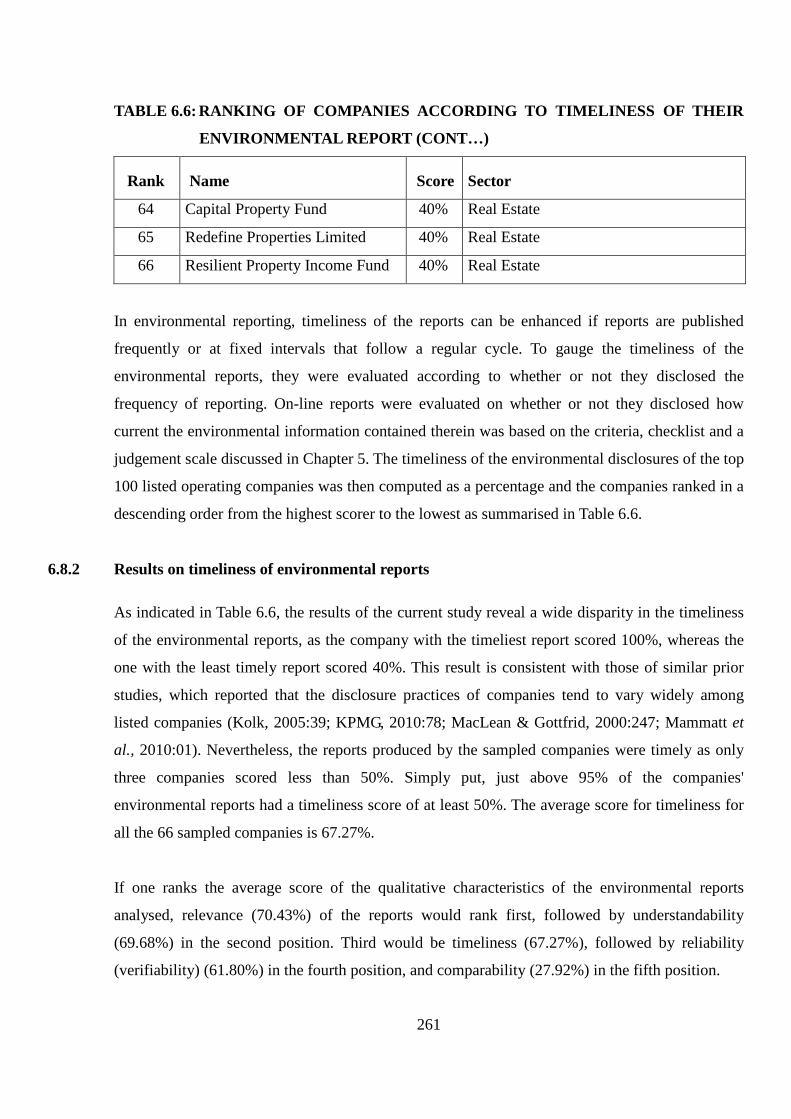
261
TABLE 6.6: RANKING OF COMPANIES ACCORDING TO TIMELINESS OF THEIR
ENVIRONMENTAL REPORT (CONT…)
Rank Name Score Sector
64 Capital Property Fund 40% Real Estate
65 Redefine Properties Limited 40% Real Estate
66 Resilient Property Income Fund 40% Real Estate
In environmental reporting, timeliness of the reports can be enhanced if reports are published
frequently or at fixed intervals that follow a regular cycle. To gauge the timeliness of the
environmental reports, they were evaluated according to whether or not they disclosed the
frequency of reporting. On-line reports were evaluated on whether or not they disclosed how
current the environmental information contained therein was based on the criteria, checklist and a
judgement scale discussed in Chapter 5. The timeliness of the environmental disclosures of the top
100 listed operating companies was then computed as a percentage and the companies ranked in a
descending order from the highest scorer to the lowest as summarised in Table 6.6.
6.8.2 Results on timeliness of environmental reports
As indicated in Table 6.6, the results of the current study reveal a wide disparity in the timeliness
of the environmental reports, as the company with the timeliest report scored 100%, whereas the
one with the least timely report scored 40%. This result is consistent with those of similar prior
studies, which reported that the disclosure practices of companies tend to vary widely among
listed companies (Kolk, 2005:39; KPMG, 2010:78; MacLean & Gottfrid, 2000:247; Mammatt et
al., 2010:01). Nevertheless, the reports produced by the sampled companies were timely as only
three companies scored less than 50%. Simply put, just above 95% of the companies'
environmental reports had a timeliness score of at least 50%. The average score for timeliness for
all the 66 sampled companies is 67.27%.
If one ranks the average score of the qualitative characteristics of the environmental reports
analysed, relevance (70.43%) of the reports would rank first, followed by understandability
(69.68%) in the second position. Third would be timeliness (67.27%), followed by reliability
(verifiability) (61.80%) in the fourth position, and comparability (27.92%) in the fifth position.

262
6.9 ANALYSIS OF OVERALL DECISION-USEFULNESS OF THE CURRENT
ENVIRONMENTAL REPORTING DISCLOSURES
6.9.1 Overall objective of the content analysis phase of the study
The overall objective of the content analysis phase of the study was to evaluate the decision-
usefulness of the current environmental reporting practices by the top 100 listed companies in
South Africa. The overall decision-usefulness score of the companies was determined by dividing
their aggregate score of relevance, reliability (verifiability), comparability, understandability and
timeliness by five as discussed in Chapter 5. The companies were then ranked in a descending
order from the highest scorer to the lowest as summarised in Table 6.7.
TABLE 6.7: RANKING OF SAMPLED COMPANIES ACCORDING TO THE OVERALL
DECISION-USEFULNESS OF THEIR ENVIRONMENTAL REPORTS
Rank Name Score Sector
1
Anglo American Public Limited
Company 80% Mining and Resources
2 Woolworths Holdings Limited 79% Retail and Services
3 Mondi Public Limited Company 78% Industrial and Consumption
4 Vodacom Group Limited 76% ICT
5 Barloworld Limited 76% Industrial and Consumption
6
Anglo American Platinum
Corporation Limited 75% Mining and Resources
7 Kumba Iron Ore Limited 74% Mining and Resources
8 Standard Bank Group Limited 73% Financial
9 Exxaro Resources Limited 73% Mining and Resources
10 Gold fields Limited 73% Mining and Resources
11 Sasol Limited 72% Industrial and Consumption
12
BHP Billiton Public Limited
Company 72% Mining and Resources
13 Tongaat Hulett Limited 71% Retail and Services
14 Lonmin Public Limited
Company 71% Mining and Resources

263
TABLE 6.7: RANKING OF SAMPLED COMPANIES ACCORDING TO THE OVERALL
DECISION-USEFULNESS OF THEIR ENVIRONMENTAL REPORTS
(CONT…)
Rank Name Score Sector
15 Nedbank Group Limited 70% Financial
16 African Rainbow Minerals 70% Mining and Resources
17 Harmony Gold Mining
Company Limited
70% Mining and Resources
18 Impala Platinum Holdings
Limited
69% Mining and Resources
19 Absa Group Limited 68% Financial
20 Northam Platinum Limited 68% Mining and Resources
21 Compagnie Fin Richemont 68% Retail and Services
22 Old Mutual Public Limited
Company
67% Financial
23 Pretoria Port Cement 66% Industrial and Consumption
24 MTN Group Limited 65% ICT
25 Investec Bank Limited 65% Financial
26 Pick n Pay Stores Limited 65% Retail and Services
27 British American tobacco Public
Limited Company
65% Industrial and Consumption
28 Sabmiller Public Limited
Company
65% Industrial and Consumption
29 The Bidvest Group Limited 64% Retail and Services
30 Sanlam Limited 63% Financial
31 Anglogold Ashanti Limited 63% Mining and Resources
32 Netcare Limited 63% Retail and Services
33 Nampak Limited 62% Industrial and Consumption
34 Distell Group Limited 61% Industrial and Consumption
35 Mediclinic International 59% Retail and Services
36 Discovery Holdings Limited 59% Financial
37 Hyprop Investments Limited 59% Real Estate

264
TABLE 6.7: RANKING OF SAMPLED COMPANIES ACCORDING TO THE OVERALL
DECISION-USEFULNESS OF THEIR ENVIRONMENTAL REPORTS
(CONT…)
Rank Name Score Sector
38 Clicks Group Limited 58% Retail and Services
39 AECI Limited 58% Industrial and Consumption
40 Reunert Limited 58% Industrial and Consumption
41 Aspen Pharmacare Holdings 57% Retail and Services
42 Steinhoff International Holdings
Limited
57% Retail and Services
43 Illovo Sugar Limited 57% Retail and Services
44 Arcelormittal South Africa
Limited
57% Industrial and Consumption
45 Imperial Holdings Limited 56% Retail and Services
46 Massmart Holdings Limited 56% Retail and Services
47 Remgro Limited 54% Industrial and Consumption
48 Assore Limited 53% Mining and Resources
49 The Foschini Group Limited 53% Retail and Services
50 Growthpoint Properties Limited 51% Real Estate
51 Life Healthcare Group Holding
Limited
50% Retail and Services
52 The Spar Group Limited 47% Retail and Services
53 Naspers Limited 46% Retail and Services
54 Tiger Brands Limited 46% Retail and Services
55 Redefine Properties Limited 46% Real Estate
56 AVI Limited 45% Retail and Services
57 Firstrand Limited 44% Financial
58 Capitec Bank Limited 44% Financial
59 Pioneer Foods Group Limited 44% Industrial and Consumption
60 MMI Holdings Limited 43% Retail and Services
61 Shoprite Holdings Limited 42% Retail and Services
62 Mr Price Group Limited 42% Retail and Services

265
TABLE 6.7: RANKING OF SAMPLED COMPANIES ACCORDING TO THE OVERALL
DECISION-USEFULNESS OF THEIR ENVIRONMENTAL REPORTS
(CONT…)
Rank Name Score Sector
63 Tsogo Sun Holdings Limited 40% Retail and Services
64 Truworths International Limited 37% Retail and Services
65 Resilient Property Income Fund 24% Real Estate
66 Capital Property Fund 23% Real Estate
6.9.2 Results on the decision-usefulness of environmental reports
As Table 6.7 shows, the results of the current study reveal a wide disparity in the overall decision-
usefulness of the environmental reports, as the company with the most decision-useful report
scored 80%, whereas the one with the least decision-useful report scored 23%. This result is
consistent with the findings of similar prior studies, which reported that the disclosure practices of
companies varied widely among listed companies (Kolk, 2005:39; KPMG, 2010:78; MacLean &
Gottfrid, 2000:247; Mammatt et al., 2010:01).
Nonetheless, the reports produced by the sampled companies were decision-useful as only 15 out
of 66 companies scored less than 50%. In other words, just above 77% of the companies'
environmental reports had an overall decision-usefulness score of at least 50%, with an average
score of about 60% for all the 66 sampled companies.
Although the average scores of the environmental reports for the five qualitative characteristics
ranged from 70.43% for relevance to 27.92% for comparability, the overall average score for
decision-usefulness was 60%. This result concurs with FASB (2008) conceptual framework’s
assertion that accounting information may possess varying degrees of qualitative characteristics
and still be decision-useful (FASB, 2008:15).
6.9.3 Overall decision-usefulness of environmental reports analysed according to the sectors of the
sampled companies
The results of the current study show that the overall decision-usefulness of environmental

266
disclosures differs widely among different sectors, and even within sectors. As evident from Table
6.7, companies from the sectors known to have a significant impact on the environment seemed to
have produced more decision-useful reports than their counterparts from sectors with a lesser
impact on the environment. A closer examination of Table 6.7 reveals that 11 of the top 20 ranked
companies in terms of overall decision-usefulness of the reports are from the Mining and
Resources sector, and that three of the top 20 companies are from the Industrial and Consumption
sector. These two sectors which have a relatively higher impact on the environment therefore
constitute 70% of the top 20 companies as ranked according to the overall decision-usefulness of
the environmental reports. The rest of the top 20 companies is made up of three companies from
the Financial sector, two from Retail and Services sector, and one from the ICT sector.
The observation that companies from the sectors known to have a significant impact on the
environment seemed to have produced more decision-useful reports than their counterparts from
sectors with a lesser impact on the environment is also reflected in the bottom 20 ranked
companies which are mostly from sectors with an insignificant impact on the environmental
impact. Specifically, 11 of the bottom 20 companies are from the Retail and Services sector, four
are from the Real Estate sector, two are from the Financial sector, two from the Industrial and
Consumption sector, and only one was from the Mining and Resources sector. This means that
85% of the bottom 20 companies were from sectors with an insignificant impact on the
environment. The top ranked company with regard to the overall decision-usefulness of the
environmental reports was from the Mining and Resources sector (with a score of 80%), a sector
with a significant impact on the environment, whereas the bottom ranked company was from the
Real Estate sector (with a score of 23%), a sector with an insignificant impact on the environment.
The immediate results above support the findings of prior studies which indicated that the quality
of environmental disclosures of companies with a significant impact on the environment tend to
be higher than those of companies with a lesser impact (European Commission, 2011a:100;
KPMG, 2013:14; KPMG, 2002:05; Trucost & Environmental Agency, 2009, 2006, 2004).
Although important, the above analysis and ranking of companies does not illustrate how the
decision-usefulness of the environmental reports varies in different sectors. To illustrate how it
varies in different sectors, an average score for decision-usefulness was computed for each sector
as shown in Table 6.8.

267
According to Table 6.8, the ICT, a sector known to have an insignificant impact on the
environment than its counterparts listed in the table, had the highest average (71%) percentage
score for overall decision-usefulness of environmental reports. This contradicts the prior studies'
observation that sectors known to have a significant impact on the environment tend to produce
higher quality reports than sectors with a lesser impact on the environment (European
Commission, 2011a:100; KPMG, 2013:14; KPMG, 2002:05; Trucost & Environmental Agency,
2009, 2006, 2004). However, the relatively small number of ICT companies included in this study,
two to be precise, requires that caution be exercised when interpreting the current study's results.
TABLE 6.8: SECTORAL RANKING OF OVERALL DECISION-USEFULNESS OF
ENVIRONMENTAL REPORTS
Number Sector Number of
companies
in the
sample
Average
percentage
per sector
Highest
percentage
per sector
Lowest
percentage
per sector
Variation
in
percentage
1 ICT 2 71% 76% 65% 11%
2 Mining and
Resources
13 70% 80% 53% 27%
3 Industrial and
Consumption
13 63% 78% 44% 34%
4 Financial 9 61% 73% 44% 29%
5 Retail and
Services
24 54% 79% 37% 42%
6 Real Estate 5 41% 59% 23% 36%
The other sectors' ranking of the overall decision-usefulness of environmental reports appears to
conform with the observation made in the prior studies that sectors with a significant impact on
the environment tend to produce higher quality reports than sectors with a lesser impact
(European Commission, 2011a:100; KPMG, 2013:14; KPMG, 2002:05; Trucost & Environmental
Agency, 2009, 2006, 2004). Specifically, the Mining and Resources sector, with an average
overall decision-usefulness percentage score of 70%, has a higher impact on the environment than

268
the Industrial and Consumption sector with an average decision-usefulness percentage score of
63%, and is accordingly ranked higher.
Likewise, the Financial sector with an average overall decision-usefulness percentage score of
61% has a lower impact on the environment than the Industrial and Consumption sector, and is
thus ranked lower than the latter, but higher than the Retail and Services sector which has a score
of 54%. A probable explanation for the relatively high score of the Financial sector above the
Retail and Services sector is that the Financial sector's services have a significant indirect impact
on the environment as it provides funding for major projects, such as mining exploration that have
a significant impact on the environment (KPMG, 1999:04). Again the Real Estate sector trails all
the others with an average overall decision-usefulness percentage score of 41%.
Within sectors, the overall decision-usefulness of the environmental reports varies widely as
indicated in Table 6.8. It is interesting to note that with the exception of the Financial and Real
Estate sectors, the variation in the overall decision-usefulness of the reports appear to increase as
the average percentage score of overall decision-usefulness decreases. However, further study is
required to confirm this observation.
6.9.4 Overall decision-usefulness of environmental reports analysed according to the size of
sampled companies
As evident from a comparison of Appendix I with Table 6.7, the results of the current study
suggest that the overall decision-usefulness of sampled companies' environmental reports appear
to be somewhat related to the size of the company as measured by market capitalisation.
Specifically, out of the top 20 largest companies by market capitalisation, eight were ranked
among the top 20 with regard to the overall decision-usefulness of their environmental reports.
However, only three companies from the bottom 20 largest companies by market capitalisation
were ranked among the top 20 with regard to the overall decision-usefulness of their
environmental reports. Similarly, only three of the top 20 largest companies by market
capitalisation were ranked among the bottom 20 in terms of the overall decision-usefulness of
their environmental reports. The above results are consistent with those of prior studies which
indicated that the quality of environmental disclosures is related to the size of the reporting entity
(Barbu et al., 2012:01; Brammer & Pavelin, 2006:01; Joshi, Suwaidan & Kumar, 2011:01).
269
6.10 EXPLANATION OF CONTENT ANALYSIS RESULTS USING DECISION-USEFULNESS
THEORY
A theory is defined as “a scheme or system of ideas or statements held as an explanation or
account of a group of facts or phenomena” (Deegan, 2011:211). In other words, a theory offers
accounts through which results of a study can be explained. Given that the objective of the content
analysis phase of the study was to evaluate the decision-usefulness of environmental reporting
practices of South African companies, explanation of results of this phase of the study requires a
suitable theory that can evaluate and explain the usefulness of the current environmental reporting
practices in informing the decisions of users (Deegan, 2006:04). Decision-usefulness theory as
contained in the accounting conceptual framework is deemed suitable for this purpose and hence
is employed to explain the results of the content analysis phase of this study.
6.10.1 Relationship between an accounting theory, an accounting conceptual framework and
decision-usefulness theory
According to Hendriksen (1970:01), an accounting theory is “a coherent set of hypothetical,
conceptual and pragmatic principles forming the general framework of reference for a field of
inquiry” (Hendriksen, 1970:01). Hendriksen (1982:01) later refined his definition by stating that
an accounting theory is “a set of broad principles that provide a general frame of reference by
which accounting practice can be evaluated and secondly guide the development of new practices
and procedures”. FASB (2010:05) on the other hand defines an accounting conceptual framework
as a coherent system of interrelated objectives and fundamentals that prescribes the nature,
function and limits of accounting reporting.
Looking at Hendriksen's (1970:01) definition of a theory, and FASB's (2010:05) definition of an
accounting conceptual framework, it is reasonable to argue that a conceptual framework attempts
to provide a theory of accounting (Deegan, 2011:211). This is because the conceptual framework
provides a set of broad principles that provide a general frame of reference by which accounting
practice can be evaluated and guide the development of new accounting practices and procedures
(FASB, 2008:04). Given that conceptual frameworks prescribe certain actions, they are normative
in nature.

270
If as suggested by Deegan (2011:211) an accounting conceptual framework attempts to provide a
theory of accounting, a question emerges as to which theory is it? The answer to this question is
perhaps provided by the FASB and IASB joint conceptual framework, which asserts that a
conceptual framework is a “coherent system of concepts that flow from an objective” (FASB,
2010:05; IASB, 2008:12), and that the objective of accounting reporting is the foundation of the
framework (IASB, 2010:09). Given that the primary objective of accounting is to provide
information that is useful for decision-making (FASB, 2010:01; GRI, 2000:16; IASB, 2010:09;
IASB, 2008:12), it is clear that the decision-usefulness objective is the one from which the
conceptual framework flows from and is thus the foundation of the framework.
Based on the decision-usefulness objective, accounting researchers have proposed a theory,
namely; the decision-usefulness theory, which is premised on the assertion that the primary
purpose of accounting and environmental reporting without an exception, is to provide
information to permit informed judgements and decisions by users of the information (AAA,
1966:01; Inanga & Schneider, 2005:246). As a normative theory, decision-usefulness theory
prescribes the type of accounting information and manner of disclosure that is useful to the users
when making decisions (Deegan, 2006:05). Accordingly, the theory that the conceptual
framework attempts to provide is actually the decision-usefulness theory. Based on the foregoing
discussion, it is the contention of the researcher that an accounting conceptual framework has not
only emanated from decision-usefulness theory, it indeed embodies the theory and is inextricably
linked to the theory. Accordingly, it represents the decision-usefulness theory and will thus be
used to interpret the results of the current study.
6.10.2 Accounting conceptual frameworks
According to accounting conceptual frameworks, the primary objective of the general purpose
accounting reporting is to provide information that is useful to a wide range of users in making
decisions (FASB, 2010:18; FASB, 2008:01; IASB, 2010:09; IASB, 2008:12). The degree to which
accounting information is useful will depend on its qualitative characteristics. The qualitative
characteristics that make accounting information useful include but are not limited to relevance,
reliability, verifiability, comparability, understandability and timeliness (FASB, 2010:19; FASB,
2008:02; IASB, 2010:16; IASB, 2008:35). Relevance and reliability are the two primary
(fundamental) qualitative characteristics that make accounting information useful for decision-
271
making (FASB, 2010:16; FASB, 2008:02; IASB, 2010:17; IASB, 2008:38). If either of these two
qualities is missing, the information will not be useful. Ideally, the choice of an accounting
alternative should produce information that is more relevant and more reliable. However, in
reality it may be necessary to sacrifice some of one quality for a gain in another (FASB, 2010:21;
IASB, 2010:22; FASB, 2008:02; IASB, 2008:58).
Unlike relevance and reliability, the other qualities namely, verifiability, comparability,
understandability and timeliness enhance the decision-usefulness of accounting information
(FASB, 2010:19; IASB, 2010:22; IASB, 2008:38). The enhancing qualitative characteristics,
either individually or as a group cannot make information useful if that information is irrelevant or
unreliable (FASB, 2010:21; IASB, 2010:22; IASB, 2008:41). Accounting information may
possess enhancing qualitative characteristics to varying degrees. It thus may be possible for
accounting information to trade one qualitative characteristic without losing overall decision-
usefulness. In fact, in some cases, trade-offs between characteristics may be necessary or
beneficial (FASB, 2010:21; FASB, 2008:15; IASB, 2010:22; IASB, 2008:58). The notion of a
trade-off can be used to explain the variation in the qualitative characteristics of the sampled
environmental reports (See section 6.8.2).
Apart from providing the primary objective of accounting reporting, and the qualitative
characteristics of decision-usefulness, the conceptual frameworks also assert that providing
decision-useful accounting information is limited by two pervasive constraints, namely cost and
materiality (FASB, 2008:02; IASB, 2008:12). With regard to cost constraint, information can be
useful and yet too costly to justify providing it. To be useful and worth providing, the perceived
benefits of providing the information should exceed its perceived costs (FASB, 2010:21; FASB,
2008:12; IASB, 2010:65; IASB, 2008:13). Therefore companies should only disclose accounting
information if the benefits of disclosing such information outweigh the disclosure costs. This
requires assessing whether benefits of reporting information are likely to justify costs incurred to
provide and use that information (FASB, 2010:22; IASB, 2010:22; IASB, 2008:43). When making
this assessment, it is necessary to consider whether one or more qualitative characteristics might
be sacrificed to some degree to reduce cost.
The costs of providing information include costs of collecting, classifying, processing, verifying,
disseminating as well as the costs that arise as a consequence of providing or not providing the

272
information such as litigation and lost competitive advantages (FASB, 2010:21; FASB, 2008:31;
IASB, 2010:22; IASB, 2008:42). The benefits of providing information include avoidance of
regulation, lower cost of capital, attraction of quality labour, enhancement of reputation and
customers' goodwill. As apparent from the foregoing, the benefits of disclosing accounting
information are not always evident or measurable, and are thus more difficult to quantify than the
costs (FASB, 2008:31). In fact, assessing whether the benefits of providing information justify the
related costs will usually be more qualitative than quantitative, and will often be incomplete
(IASB, 2008:42). Therefore determination of benefits and some costs requires a judgement call
that is bound to vary from one entity to another (FASB, 2010:22; FASB, 2008:31; IASB, 2010:23;
IASB, 2008:42).
With regard to materiality constraint, accounting information is material if its omission or
misstatement significantly misrepresents it to its stakeholders, and thereby change or influence
their conclusion, decisions and actions (FASB, 2008:06; IASB, 2008:41). Materiality is
determined by the magnitude, circumstances in which judgement is made and nature of the
information item in question, all which vary from one entity to another. In other words, given that
materiality depends on the nature and amount of the item judged in the particular circumstances of
its omission or misstatement, it is not possible to specify a uniform quantitative threshold at which
a particular type of information becomes material (FASB, 2010:17; IASB, 2010:17; IASB,
2008:41). Therefore, determining whether or not information is material can only be done in
relation to a particular entity's situation.
A decision as to whether information is material enough to be disclosed entails a judgement call
whether an item is large enough, in light of surrounding circumstances, to influence the judgement
of a reasonable person relying on the information, if it is either omitted or misstated (FASB,
2008:30). A decision not to disclose certain information may be made if the amounts or impacts
involved are too small to make a difference (FASB, 2008:03). However, magnitude by itself,
without regard to the nature of the item and the circumstances in which decisions have to be
made, will not generally be a sufficient basis for a material judgement.
The more material accounting information is, the more relevant, reliable, verifiable, comparable,
understandable and verifiable it should be (FASB, 2008:03). For this reason, materiality constraint
is a pervasive constraint which pertains to all the qualitative characteristics of decision-useful

273
accounting information. For instance, materiality should be considered when determining whether
information has sufficient predictive or confirmatory value to be relevant to users and is
sufficiently complete, neutral and free from error to be reliable (IASB, 2008:42).
In sum, the cost and materiality pervasive constraints guide companies in deciding whether or not
to disclose accounting information, and in determining the degree to which accounting
information disclosed should possess the qualitative characteristics of decision-useful information
(FASB, 2008:02; IASB, 2008:12). In essence therefore, the two constraints are the overriding
factors that limit, or constrain the decision-usefulness of accounting reports and are accordingly
important in explaining the results of the content analysis phase of the study.
6.10.3 Explanation of the results of content analysis using trade-offs of qualitative characteristics
According to the accounting conceptual frameworks, it may be necessary to sacrifice some of one
quality of information for gain in another (FASB, 2010:21; FASB, 2008:15; IASB, 2010:22;
IASB, 2008:58). This assertion could explain why the average for relevance (70.43%) of the
sampled companies' environmental reports was higher than the reports' average for reliability
(verifiability) (61.80%). The relatively low score for reliability (verifiability) could indicate that
this qualitative characteristic was perhaps sacrificed in order to achieve the average score of
relevance of 70.43%. Indeed the FASB’s (2008:15) conceptual framework reiterates that for non-
financial reports or statements, relevance should be the dominant quality in the information
conveyed in accounting reports, even at the expense of reliability.
The assertions that it may be necessary to sacrifice some of one quality of information for gain in
another, and that accounting information may possess varying degrees of qualitative
characteristics and still be decision-useful (FASB, 2010:21; FASB, 2008:15; IASB, 2010:22;
IASB, 2008:58), perhaps also explains the fact that the companies' environmental reports had an
average score for comparability of 27.92% and yet their overall average score for decision-
usefulness was 60%. The foregoing implies that comparability, being an enhancing qualitative
characteristic, was sacrificed and yet the environmental reports still remained decision-useful.
The preceding paragraph further underscores the conceptual frameworks' assertion that enhancing
qualitative characteristics, either individually or as a group, cannot make information useful if that

274
information is irrelevant or unreliable (FASB, 2010:19; IASB, 2010:22). Simply put, information
that is relevant and reliable will be decision-useful, even if it lacks enhancing qualitative
characteristics such as comparability.
6.10.4 Explanation of the results of content analysis using cost and materiality constraints
The cost constraint as propagated by the accounting conceptual framework could be used to
explain the variation in the relevance, reliability (verifiability), comparability, understandability,
timeliness and overall decision-usefulness of environmental reports of the sampled companies.
According to the frameworks, the more decision-useful an environmental report is, the more
costly it is to produce (FASB, 2010:31; FASB, 2008:02; IASB, 2010 64; IASB, 2008:58). For
example, producing a more relevant environmental report may require a more thorough
stakeholder engagement exercise, which is costlier, than producing a less relevant report.
Likewise, producing a more reliable report may require a more robust information system and a
reasonable assurance statement from a third party, which costs more than producing a less reliable
report that does not need a robust system or a reasonable assurance statement.
As alluded to earlier, the costs of providing decision-useful information are ascertainable to some
extent, but the benefits of disclosing the information are not always evident or measurable (FASB,
2008:3; IASB, 2008:25). Accordingly, ascertainment of the benefits is subjective and thus varies
from one entity to another (FASB, 2010:22; IASB, 2010:23). Because of the subjective nature of
the benefits against which to justify additional costs for higher quality reports, companies tend to
rely on subjective judgement calls when determining how relevant, reliable (verifiable),
comparable, understandable and timely their environmental reports should be (FASB, 2008:3;
IASB, 2008:25). As a result, different companies produce reports with varying relevance,
reliability (verifiability), comparability, understandability, timeliness and overall decision-
usefulness.
Materiality constraint as postulated by the accounting conceptual frameworks can also be used to
interpret the wide disparity in relevance, reliability (verifiability), comparability, timeliness,
understandability and overall decision-usefulness of the environmental reports of sampled
companies (FASB, 2008:02; IASB, 2008:12). Materiality of environmental information is
determined by the magnitude, circumstances in which judgement is made and nature of the

275
information item in question, all which vary from one entity to another (FASB, 2010:17; FASB,
2008:03; IASB, 2010:17; IASB, 2008:41). Even for companies from the same sector, their impact
on the environment varies widely, depending on the nature of their specific operations,
distribution, size and so on (FASB, 2008:37; IASB, 2008:41). Therefore, determining whether or
not information is material can only be done in relation to a particular entity's situation and is
bound to vary from one entity to another, as an environmental issue that is material to one entity
may not be material to another (FASB, 2010:17; FASB, 2008:37; IASB, 2008:61).
A decision as to whether environmental information is material enough to be disclosed and how it
should be disclosed requires a judgement call which is subjective in nature thus varies from one
entity to another (FASB, 2010:17; FASB, 2008:30; IASB, 2010:59). Generally, the more material
accounting information is, the more relevant, reliable, verifiable, comparable, understandable,
verifiable it should be (FASB, 2008:03). Given that materiality varies from one entity to another,
the above attributes of decision-useful environmental reports will also vary to reflect the
materiality of environmental information as judged by the management of companies. The
foregoing explains the variation of the above-mentioned attributes of the environmental reports of
the sampled companies, as well as the variation in overall decision-usefulness of the reports.
The cost constraint as postulated by accounting conceptual frameworks can be used to explain the
fact that companies with a significant impact on the environment appear to have more decision-
useful environmental reports than their counter parts with a lesser impact (FASB, 2010:31; FASB,
2008:02; IASB, 2010:22; IASB, 2008:13). Given their obviously visible impact on the
environment, companies from sectors with a significant impact on the environment such as those
from the Mining and Resources sector, have higher political costs of non-disclosure of
environmental information, than their counterparts from sectors with an insignificant impact on
the environment such as those from Retail and Services sector (Wimhurst & Frost, 2000; Patten,
1991). The higher political costs include more stringent regulation, taxation regimes and potential
withdrawal of operating license(s). The companies from sectors with a significant impact
therefore tend to make more voluntary disclosures and of higher quality (more decision-useful) to
minimise their political costs, that arise from a higher political visibility (Tilt, 2009:25).
To put it in another way, the political costs of companies with a significant impact on the
environment that could arise from non-disclosure or inferior quality disclosure are higher than the

276
costs of disclosing high quality environmental disclosures. Therefore the companies opt for the
lower cost, which when compared to benefits such as improved reputation and goodwill are likely
to be lower.
Likewise, the cost constraint can be used to explain why larger companies appear to have more
decision-useful environmental reports than their smaller counter parts. Specifically, larger
companies, have higher political visibility and higher political costs of non-disclosure or
disclosure of inferior quality environmental information than their smaller counterparts (Wimhurst
& Frost, 2000; Patten, 1991). Therefore larger companies are more likely to reduce their political
costs by making more comprehensive and decision-useful environmental disclosures than their
smaller counterparts. Simply put, failure to disclose environmental information or disclosure of
inferior quality information by large companies encourages environmental reporting regulation,
compliance to which is bound to cost money to the companies. It can also be argued that contrary
to the smaller companies, large-size companies need to raise more external funds. In order to
attract external investors, larger companies are willing to disclose better quality environmental
information to reduce agency costs arising from asymmetric information and to gain public
support (Joshi et al., 2011:01).
Another way to explain the apparent higher quality environmental reports of the larger companies
as compared to their smaller counterparts is that larger companies generally have robust
information management systems that can capture, measure, analyse and disseminate accounting
information that enables them to operate (Bae & Ashcroft, 2004:02; Ernst & Young, 2013:07).
Given their robust information systems, the cost of producing higher quality environmental
disclosures for the large companies is lower than the potential reputational costs that these entities
would face if they did not disclose the information (Ernst & Young, 2013:07). By contrast, smaller
companies have low reputational costs but relatively high environmental information capturing,
measuring, analysing, and disseminating costs. Therefore the benefits of producing high quality
environmental information for the larger companies exceed the reputational costs, and the reverse
is true for their smaller counterparts (Ernst & Young, 2013:07). Accordingly, the larger companies
will tend to produce higher quality environmental information than the smaller ones.
The argument in the preceding paragraph could also be used to explain why the ICT sector had the
most decision-useful environmental reports. The ICT sector companies sampled in this study,
277
given the nature of their operations, have robust information systems that lower the cost of
providing high quality environmental information. Even though the ICT sector has an
insignificant impact on the environment, the companies in this sector can produce high quality
environmental reports at a low cost because of the robust information systems that they already
have. Besides, being companies from a communication sector, the ICT sector companies are likely
to have internal expertise in effective and efficient communication at a lower cost, an attribute that
could further explain why the sector had the highest quality of environmental reports.
The relatively high quality disclosures of the companies in the Financial Sector could also be
explained using cost constraint as postulated by the conceptual frameworks (FASB, 2010:31;
FASB, 2008:02; IASB, 2010:22; IASB, 2008:13). Given the indirect impact of the activities of the
companies in this sector such as financing major projects that could have adverse impact on the
environment, the companies in this sector face high reputational and political costs where they are
perceived to be financing environmentally detrimental projects indiscriminately (Global Reporting
Initiativ,e 2005:03). To lower their reputational and political costs, it is imperative for these
companies to disclose high quality environmental information. Besides, given the nature of their
operations, particularly the on-line operations, companies in the Financial sector generally have
robust information management systems that can capture, measure, analyse and disseminate high
quality environmental information at a low cost (Afi, 2013:02). Therefore, the cost of producing
higher quality environmental disclosures for companies in this sector is lower than the
reputational and political costs that these entities would face if they do not disclose high quality
environmental information (GRI, 2005:03).
The materiality constraint can equally be used to explain the relatively higher quality
environmental reports of companies from sectors known to have a significant impact on the
environment than their counterparts from sectors with a lesser significant impact on the
environment. The Mining and Resources sector for example dramatically alters the natural
surroundings, through toxic waste rock, water contamination, acid mine drainage, and air
pollution, abandoned quarry lakes which are visible and are felt by the stakeholders. Therefore it
has a different materiality threshold for environmental issues than the Real Estate sector whose
primary business is renting properties to tenants, and thus has a minimal direct impact on the
environment.

278
Given the adverse impact on the environment, failure by Mining and Resources sector companies
to disclose higher quantity and quality environmental information, through omission or
misstatement of such information would significantly misrepresent the reality to the reports' users,
thereby wrongfully influencing their conclusions, decisions and actions (FASB, 2008:06; IASB,
2008:13). If the users perceive that a mining company’s environmental information misrepresents
the reality, they will undertake measures to pressurise the company to produce decision-useful
information (Deegan & Haque, 2009:14; Wingard, 2001:1). Such measures could include boycott
of a company's products, launching aggressive campaigns against the company, instituting legal
action against a company, naming and shaming a company, deciding not to supply their labour to
the company and lobbying for government intervention. Such measures could compel the
government to intervene by either instituting regulatory intervention or withdrawing a company's
license (KPMG, 2005:7; Jose & Lee, 2006:307; Pramanik, Shil & Das, 2008:151). It is in an
attempt to avoid the foregoing that sectors with a significant impact on the environment such as
the Mining and Resources sector have undertaken a proactive role of availing more relevant,
reliable, comparable, understandable, timely and verifiable environmental information to their
stakeholders, to ensure that they continue to enjoy stakeholders' support.
By contrast, the Real Estate sector, whose primary business is renting of properties to tenants does
not have an obvious and visible impact on the environment. If anything, this sector avails
shopping malls and offices to the members of the community in which the companies operate, and
any impacts on the environment are probably from the tenants such as the leading retailers. Given
the nature of operations of the Real Estate sector, environmental information is not as material to
the sector as it is for the Mining and Resources sector. Therefore failure by Real Estate sector
companies to disclose environmental information or disclosure of inferior quality information
does not affect the reports' decision-usefulness, as it would for the Mining Sector companies
(FASB, 2008:12).
The relatively high quality disclosures of the companies in the Financial sector could also be
explained using materiality constraint as postulated by the decision-usefulness theory. Given the
indirect impact of the activities of the companies in this sector such as financing major projects
that could have adverse impact on the environment, omitting or misstating the indirect
environmental impact of these companies could significantly misrepresent the activities of the
companies to the reports' users, thereby wrongfully influencing their conclusion, decisions and

279
actions (FASB, 2008:06; GRI, 2005:03). This would compel users to intervene by undertaking
adverse measures discussed above, which could jeopardise the operations of the companies
(Deegan & Haque, 2009:14; Wingard, 2001:1). To avoid the adverse measures against them,
companies in the Financial sector have undertaken a proactive role of availing more relevant,
reliable, comparable understandable, timely and verifiable environmental information to their
stakeholders, to ensure that they continue to enjoy their stakeholders' support.
6.11 CHAPTER SUMMARY AND CONCLUSION
The main objective of the content analysis phase of the study is to evaluate the decision-
usefulness of the current environmental reporting practices by South African companies. To this
end, the qualitative characteristics that make the reports decision-useful are evaluated. The
findings of the study reveal that the environmental reports produced by the top 100 listed South
African companies are relevant, reliable (verifiable), understandable and timely. However, the
findings also revealed that the reports are not comparable. Overall, the findings of the current
study reveal that the environmental reports produced by the top 100 listed South African
companies are decision-useful.
The findings of the current study also reveal that the above qualitative characteristics of decision-
useful information vary widely among the sampled companies, a phenomenon that is attributed to
the cost and materiality constraints postulated in the accounting conceptual frameworks. As a
result, the overall decision-usefulness of the environmental reports also varies widely among the
sampled companies, with companies from sectors with a significant impact on the environment
producing more decision-useful reports than their counterparts from sectors with a lesser impact
on the environment. Likewise larger companies also produce more decision-useful environmental
reports than their smaller counterparts.
The next chapter presents the results of the questionnaire survey phase of the study. Chapter 7
proceeds with a restatement of the research objectives of the questionnaire survey phase of the
study outlined in Chapter 1. This is followed by a discussion of the response rate and non-
response bias, as well as the background information of the respondents. Chapter 7 then presents
the results on users' environmental information needs, the extent to which they read the
environmental reports and how they employ the reports, their degree of satisfaction with the

280
reports, as well as how important they perceive environmental reports relative to other types of
reports, and compares all these to preparers’ perceptions, to determine whether there is an
expectation gap.

281
CHAPTER 7
ANALYSIS OF RESULTS OF QUESTIONNAIRE SURVEY
7.1 INTRODUCTION
The purpose of this chapter is to present and discuss the results of the questionnaire survey phase
of the study, in order to address five out of six research objectives outlined in the first chapter of
this thesis. The chapter proceeds with a restatement of the research objectives of the study in
section 7.2. This is followed by a discussion of the response rate and non-response bias in section
7.3. The background information of the respondents is provided in section 7.4. Section 7.5
analyses and discusses results on whether environmental reports were read, whereas section 7.6
analyses and discusses results on users' environmental information needs. This is followed by an
analysis and discussion of results on the extent to which environmental reports are read and how
they are used in section 7.7.
Section 7.8 then analyses and discusses the results on the usage of different media as a source of
environmental reports, whereas section 7.9 presents an analysis and discussion of the results on
how environmental reports were used. This is followed by an analysis and discussion of results on
how useful the environmental reports were perceived to be in section 7.10. Section 7.11 analyses
and discusses the results on the perception of the quality of environmental reports, followed by an
analysis and discussion of results on satisfaction with the quality of environmental reports in
section 7.12. Section 7.13 analyses and discusses the results on suggestions for improvement of
the quality of environmental reports, followed by an analysis and discussion on the results of the
relative importance of environmental reports/statements.
7.2 OBJECTIVES OF THE QUESTIONNAIRE SURVEY PHASE OF THE STUDY
The broad aim of this study was to determine the decision-usefulness of environmental reports
prepared by South African companies to users of those reports. To this end, the following
objectives, as outlined in Chapter 1 were formulated:

282
1. To evaluate the decision-usefulness of the current environmental reporting practices by
South African companies
2. to determine the informational needs of users of environmental reports produced by South
African companies
3. to determine the extent to which users read the environmental reports and whether they
employ the environmental reports when making decisions
4. to determine the degree of satisfaction of users with regard to the decision-usefulness of the
environmental reports and suggest ways of improving the report
5. to investigate how users rank environmental information relative to other types of
information such as financial and social responsibility information
6. to ascertain whether there is an expectation gap between preparers of environmental reports
and users of those reports with regard to the need for, and the decisions-usefulness of the
reports
The analysis and discussion of results to address the first research objective was done in the
previous chapter (Chapter 6). Therefore the analysis and discussion of results in this chapter only
address the second, third, fourth, fifth and sixth research objectives.
7.3 SURVEY RESPONSE
7.3.1 Survey response rate
As mentioned in the previous chapter, the population of the current study comprised both users
and preparers of environmental reports produced by JSE listed companies. Given that the
population of users could foreseeably consist of the entire South African population (Mitchell &
Quinn, 2005:22), the current study focused on: 1) representatives of ethical investment funds, 2)
representatives of environmental Non-Governmental Organisations (NGOs), and 3) environmental
reporting researchers in the country, for practicality purposes. Due to an apparent lack of a
comprehensive public listing of all ethical investment funds, environmental NGOs and
environmental reporting researchers in South Africa, a compilation of a population frame list was
done with aid of the Internet, which yielded 100 users that comprised 30 ethical investment funds,
30 environmental NGOs and 40 accounting researchers.

283
Consistent with prior studies, a census of the identified users was conducted, given the smallness
of the population (Danatas & Gadenne, 2004: 08; Tilt, 1994:53). Out of 100 questionnaires that
were sent out to users, 54 usable questionnaires were returned, resulting in a response rate of 54%
(See Table 7.1). The above response rate was achieved by persistent follow-ups that entailed
resending the questionnaires, e-mailing and making telephone calls to users that had expressed
interest in completing the questionnaire, by contacting the researcher directly, but lacked time.
The latter prompted the researcher to extend the deadline for submission of completed
questionnaires. These measures resulted to a response rate of 54%, a rate higher than that achieved
by Tilt (1994) (46.8%), and O'Dweyer, Unerman and Hession (2004) (52.8%), that also conforms
to Fowler's (1988) recommendation that a response rate should be at least 20% to provide credible
statistics about a population.
The population of preparers of environmental reports comprised representatives of the top 100
operating listed companies, such as finance directors, accountants, environmental executives, and
managers. Again, a census of the preparers was conducted, given the smallness of the population
(Danatas & Gadenne, 2004: 08; Tilt, 1994:53). Out of 100 questionnaires that were sent out to
preparers, 42 usable questionnaires were returned after persistent follow-ups that entailed
resending the questionnaires, e-mailing and making telephone calls to preparers that had
expressed interest in completing the questionnaire, by contacting the researcher directly, but
lacked time. The latter prompted the researcher to extend the deadline for submission of
completed questionnaires. These measures resulted in a response rate of 42% (see Table 7.1),
which also conforms to Fowler’s (1988) recommendation cited in the previous paragraph.
TABLE 7.1: RESPONSE RATE
Respondent category Number of
questionnaires
distributed
Number of
questionnaires
returned
Response rate
Users 100 54 54%
Preparers 100 42 42%
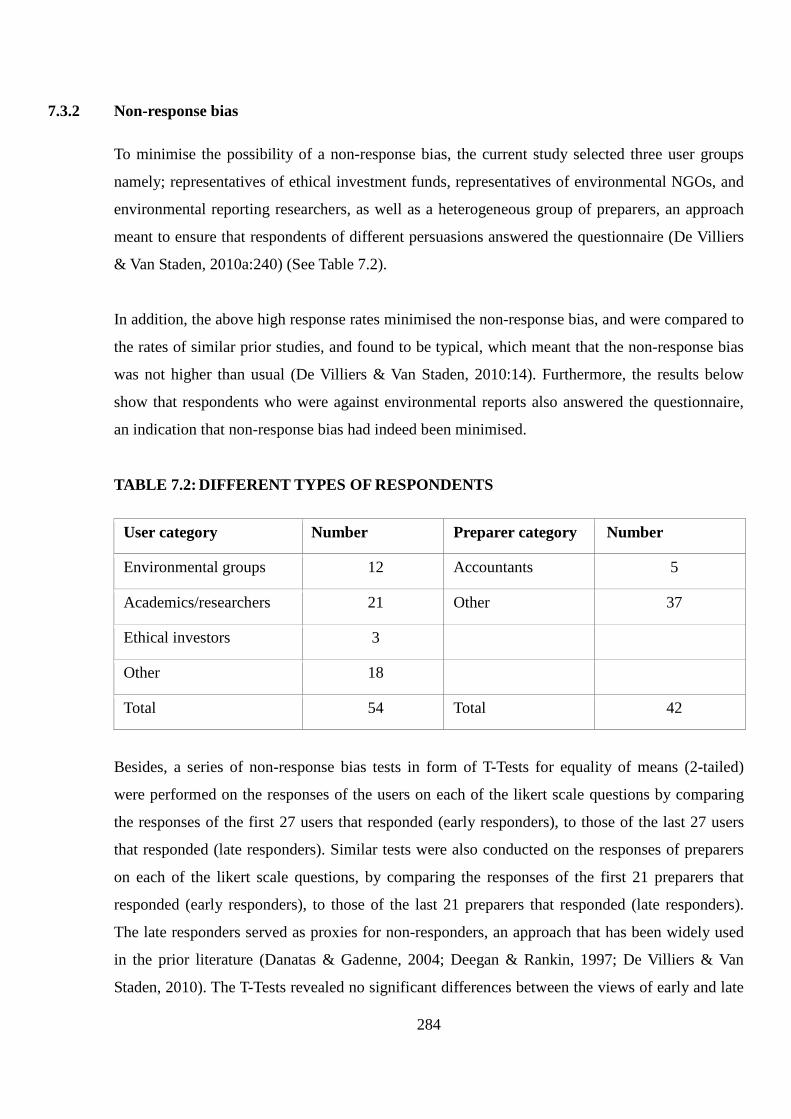
284
7.3.2 Non-response bias
To minimise the possibility of a non-response bias, the current study selected three user groups
namely; representatives of ethical investment funds, representatives of environmental NGOs, and
environmental reporting researchers, as well as a heterogeneous group of preparers, an approach
meant to ensure that respondents of different persuasions answered the questionnaire (De Villiers
& Van Staden, 2010a:240) (See Table 7.2).
In addition, the above high response rates minimised the non-response bias, and were compared to
the rates of similar prior studies, and found to be typical, which meant that the non-response bias
was not higher than usual (De Villiers & Van Staden, 2010:14). Furthermore, the results below
show that respondents who were against environmental reports also answered the questionnaire,
an indication that non-response bias had indeed been minimised.
TABLE 7.2: DIFFERENT TYPES OF RESPONDENTS
User category Number Preparer category Number
Environmental groups 12 Accountants 5
Academics/researchers 21 Other 37
Ethical investors 3
Other 18
Total 54 Total 42
Besides, a series of non-response bias tests in form of T-Tests for equality of means (2-tailed)
were performed on the responses of the users on each of the likert scale questions by comparing
the responses of the first 27 users that responded (early responders), to those of the last 27 users
that responded (late responders). Similar tests were also conducted on the responses of preparers
on each of the likert scale questions, by comparing the responses of the first 21 preparers that
responded (early responders), to those of the last 21 preparers that responded (late responders).
The late responders served as proxies for non-responders, an approach that has been widely used
in the prior literature (Danatas & Gadenne, 2004; Deegan & Rankin, 1997; De Villiers & Van
Staden, 2010). The T-Tests revealed no significant differences between the views of early and late
285
responders for both users and preparers at 95% confidence level (p<0.05) (See Appendix B). With
acceptable response rates, a variety of opinions from heterogeneous respondents and a lack of
significant differences between the early and late responses, it is unlikely that non-response bias
influenced the results of the current study significantly (De Villiers & Van Staden, 2010:15).
7.4 BACKGROUND INFORMATION OF THE RESPONDENTS
The respondents were asked in section A of the questionnaires to provide background information
relating to their gender, age, highest educational qualification, and occupation. This was done to
ascertain whether they were knowledgeable users or preparers of environmental reports, and thus
appropriate as respondents for this study.
7.4.1 Background information of users
The analysis of the background information (see Table 7.3) of the users shows that 55.56 % are
male whereas 44.44% are female. Of the users, 31.48% were aged between 46 and 55 years old,
27.78% between 36 and 45 years old, and 22.22% between 26 and 35 years old; 12.96% were
aged between 56 and 65 years old, whereas 5.56% were over 65 years old. None of the users was
aged less than 25 years old. As far as the highest educational qualification is concerned, 79.25% of
the users had a postgraduate degree, 11.32% had a baccalaureate degree. Only 9.43% had a post
matric or diploma certificate. None of the users had only a matric or no matric.
An examination of the professional occupation of the users reveals that 39.62% were
academics/researchers, whereas 22.64% were representatives of environmental groups. Only
5.66% of users were representatives of ethical investors, whereas 32.08% belonged to the “other”
category. According to the conceptual frameworks (FASB, 2008:02; IASB, 2008:40),
understandability of accounting information depends largely on the characteristics of the users of
that information. Users of accounting reports are assumed to have reasonable knowledge of
business activities and to be able to read an accounting report. The above background information
on users suggests that they were generally well educated, had a reasonable knowledge of business
activities, and thus should have been able to understand the content of environmental reports.
Accordingly, their views on the decision-usefulness of the environmental reports were deemed
valuable to the current study.
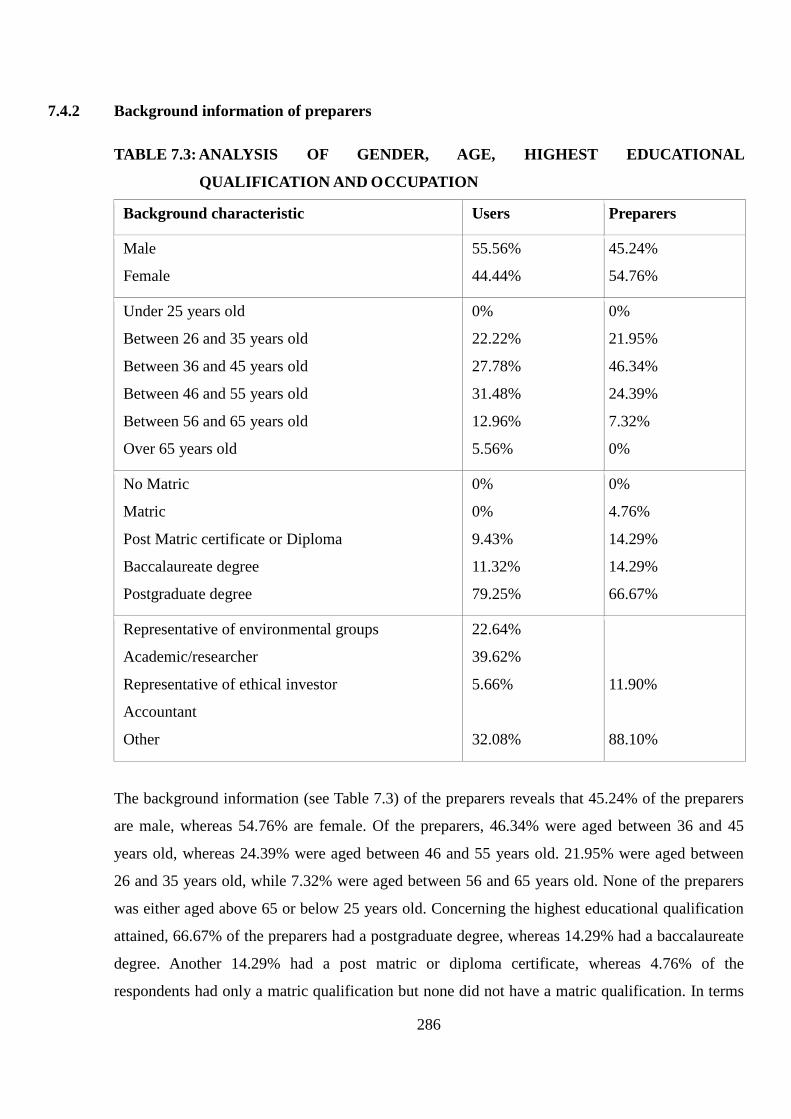
286
7.4.2 Background information of preparers
TABLE 7.3: ANALYSIS OF GENDER, AGE, HIGHEST EDUCATIONAL
QUALIFICATION AND OCCUPATION
Background characteristic Users Preparers
Male
Female
55.56%
44.44%
45.24%
54.76%
Under 25 years old
Between 26 and 35 years old
Between 36 and 45 years old
Between 46 and 55 years old
Between 56 and 65 years old
Over 65 years old
0%
22.22%
27.78%
31.48%
12.96%
5.56%
0%
21.95%
46.34%
24.39%
7.32%
0%
No Matric
Matric
Post Matric certificate or Diploma
Baccalaureate degree
Postgraduate degree
0%
0%
9.43%
11.32%
79.25%
0%
4.76%
14.29%
14.29%
66.67%
Representative of environmental groups
Academic/researcher
Representative of ethical investor
Accountant
Other
22.64%
39.62%
5.66%
32.08%
11.90%
88.10%
The background information (see Table 7.3) of the preparers reveals that 45.24% of the preparers
are male, whereas 54.76% are female. Of the preparers, 46.34% were aged between 36 and 45
years old, whereas 24.39% were aged between 46 and 55 years old. 21.95% were aged between
26 and 35 years old, while 7.32% were aged between 56 and 65 years old. None of the preparers
was either aged above 65 or below 25 years old. Concerning the highest educational qualification
attained, 66.67% of the preparers had a postgraduate degree, whereas 14.29% had a baccalaureate
degree. Another 14.29% had a post matric or diploma certificate, whereas 4.76% of the
respondents had only a matric qualification but none did not have a matric qualification. In terms
287
of professional occupation, 11.9% of the preparers were accountants, however 88.1%, of the
preparers belonged to other category.
Although the above background information of preparers implies that the environmental reporting
task was primarily done by non-accountants, an observation also made in the prior studies (Adams
2002; Gray, Walters, Bebbington & Johnson 1995), still the information suggests that the
preparers were generally well educated and knowledgeable, and thus appropriate to answer the
questionnaire. Comparing and contrasting the background information of the users to that of the
preparers reveals that, the majority of users are male (55.46%), whereas the majority of preparers
are female (54.76%). Most users (31.48%) were aged between 46 and 55, whereas most preparers
(46.34%) were aged between 36 and 45. Qualification wise, majority of both users (79.25%) and
preparers (66.67%) had a postgraduate degree. However, occupation-wise, most users (39.62%)
were academics whereas most preparers (88.10%) belonged to the other category, perhaps due to
specialisation in the environmental reporting arena.
7.5 WHETHER ENVIRONMENTAL REPORTS WERE READ
7.5.1 Whether or not users read environmental reports
Users were asked by way of a yes/no question whether they had read an environmental report in
the past 12 months. The responses to this question are reported in Table 7.4. As shown in the table,
83.33% of the users indicated that they had read an environmental report in the past 12 months,
whereas only 16.67% indicated that they had not. Such an overwhelming majority of users would
not have read environmental reports if the reports were not material to them, or if they were not
benefitting from the reports.
A Binomial Test (2-tailed) was conducted to determine whether there was a significant difference
between the total number of users who read the environmental report, and those who did not. A
significant difference was found between the proportion of the users who had read the
environmental reports (83.33%), and the proportion of those who had not read the reports
(16.67%) (p<0.05).
The preceding results are consistent with the findings reported in the prior literature (Danatas &
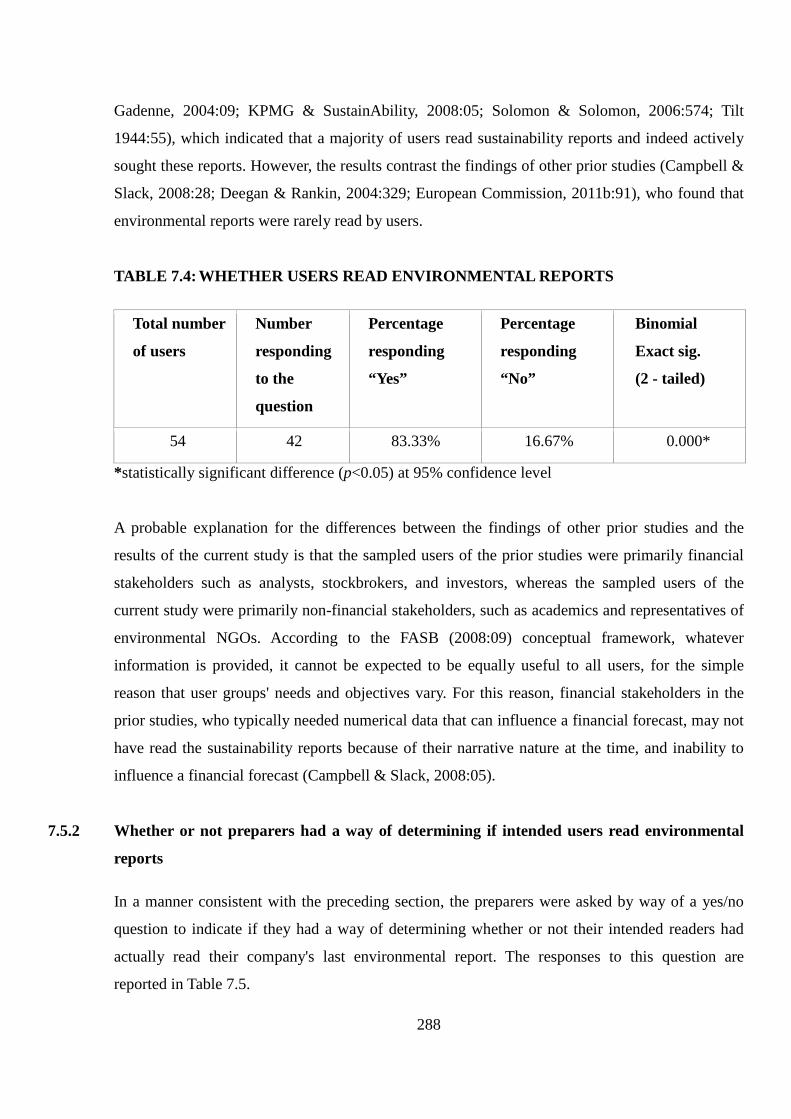
288
Gadenne, 2004:09; KPMG & SustainAbility, 2008:05; Solomon & Solomon, 2006:574; Tilt
1944:55), which indicated that a majority of users read sustainability reports and indeed actively
sought these reports. However, the results contrast the findings of other prior studies (Campbell &
Slack, 2008:28; Deegan & Rankin, 2004:329; European Commission, 2011b:91), who found that
environmental reports were rarely read by users.
TABLE 7.4: WHETHER USERS READ ENVIRONMENTAL REPORTS
Total number
of users
Number
responding
to the
question
Percentage
responding
“Yes”
Percentage
responding
“No”
Binomial
Exact sig.
(2 - tailed)
54 42 83.33% 16.67% 0.000*
*statistically significant difference (p<0.05) at 95% confidence level
A probable explanation for the differences between the findings of other prior studies and the
results of the current study is that the sampled users of the prior studies were primarily financial
stakeholders such as analysts, stockbrokers, and investors, whereas the sampled users of the
current study were primarily non-financial stakeholders, such as academics and representatives of
environmental NGOs. According to the FASB (2008:09) conceptual framework, whatever
information is provided, it cannot be expected to be equally useful to all users, for the simple
reason that user groups' needs and objectives vary. For this reason, financial stakeholders in the
prior studies, who typically needed numerical data that can influence a financial forecast, may not
have read the sustainability reports because of their narrative nature at the time, and inability to
influence a financial forecast (Campbell & Slack, 2008:05).
7.5.2 Whether or not preparers had a way of determining if intended users read environmental
reports
In a manner consistent with the preceding section, the preparers were asked by way of a yes/no
question to indicate if they had a way of determining whether or not their intended readers had
actually read their company's last environmental report. The responses to this question are
reported in Table 7.5.
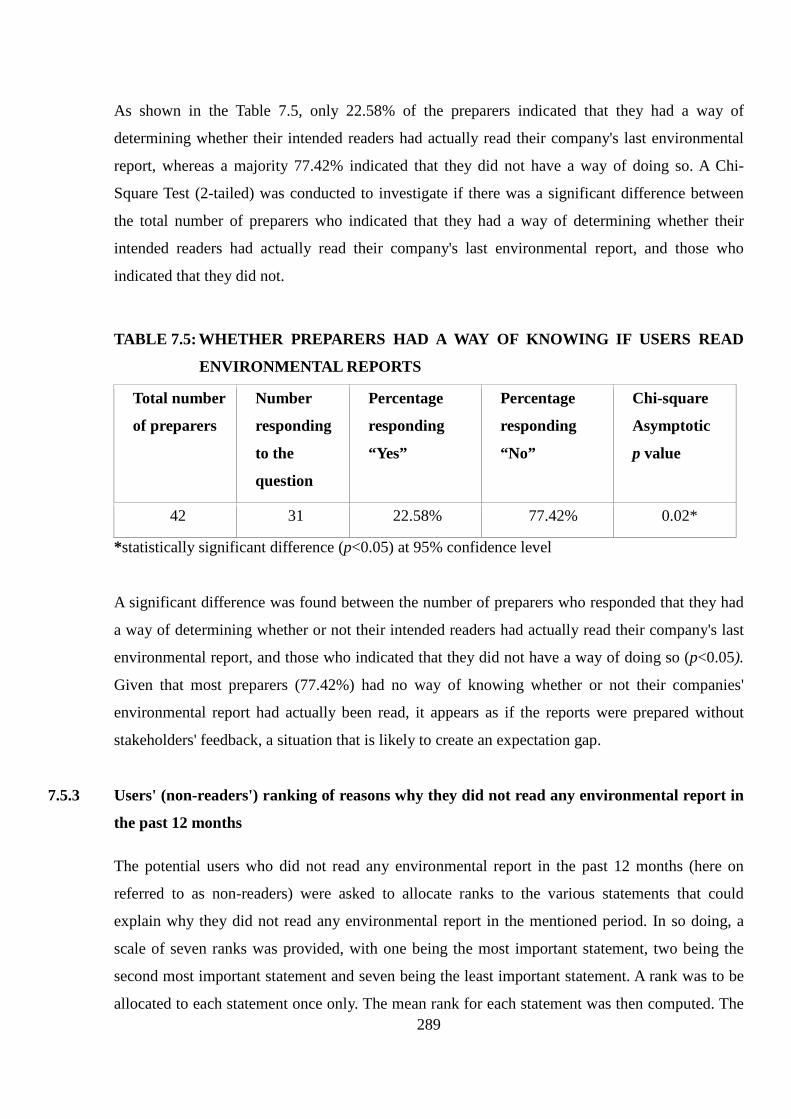
289
As shown in the Table 7.5, only 22.58% of the preparers indicated that they had a way of
determining whether their intended readers had actually read their company's last environmental
report, whereas a majority 77.42% indicated that they did not have a way of doing so. A Chi-
Square Test (2-tailed) was conducted to investigate if there was a significant difference between
the total number of preparers who indicated that they had a way of determining whether their
intended readers had actually read their company's last environmental report, and those who
indicated that they did not.
TABLE 7.5: WHETHER PREPARERS HAD A WAY OF KNOWING IF USERS READ
ENVIRONMENTAL REPORTS
Total number
of preparers
Number
responding
to the
question
Percentage
responding
“Yes”
Percentage
responding
“No”
Chi-square
Asymptotic
p value
42 31 22.58% 77.42% 0.02*
*statistically significant difference (p<0.05) at 95% confidence level
A significant difference was found between the number of preparers who responded that they had
a way of determining whether or not their intended readers had actually read their company's last
environmental report, and those who indicated that they did not have a way of doing so (p<0.05).
Given that most preparers (77.42%) had no way of knowing whether or not their companies'
environmental report had actually been read, it appears as if the reports were prepared without
stakeholders' feedback, a situation that is likely to create an expectation gap.
7.5.3 Users' (non-readers') ranking of reasons why they did not read any environmental report in
the past 12 months
The potential users who did not read any environmental report in the past 12 months (here on
referred to as non-readers) were asked to allocate ranks to the various statements that could
explain why they did not read any environmental report in the mentioned period. In so doing, a
scale of seven ranks was provided, with one being the most important statement, two being the
second most important statement and seven being the least important statement. A rank was to be
allocated to each statement once only. The mean rank for each statement was then computed. The
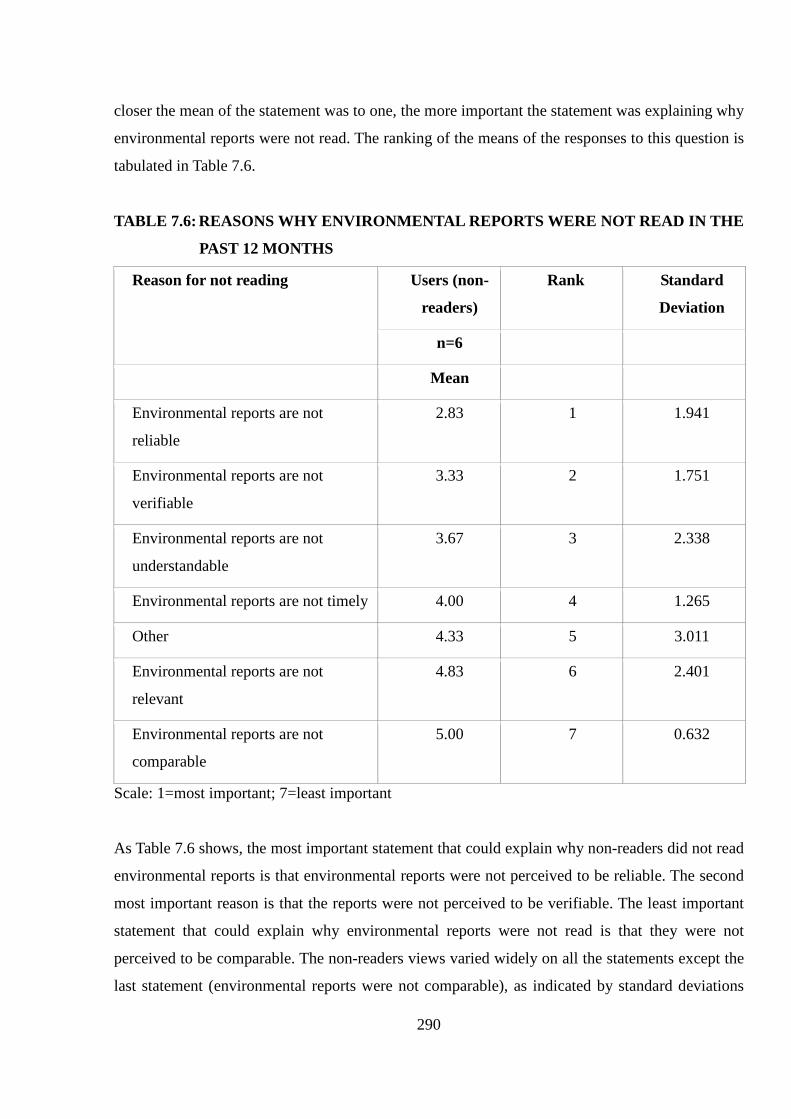
290
closer the mean of the statement was to one, the more important the statement was explaining why
environmental reports were not read. The ranking of the means of the responses to this question is
tabulated in Table 7.6.
TABLE 7.6: REASONS WHY ENVIRONMENTAL REPORTS WERE NOT READ IN THE
PAST 12 MONTHS
Reason for not reading Users (non-
readers)
Rank Standard
Deviation
n=6
Mean
Environmental reports are not
reliable
2.83 1 1.941
Environmental reports are not
verifiable
3.33 2 1.751
Environmental reports are not
understandable
3.67 3 2.338
Environmental reports are not timely 4.00 4 1.265
Other 4.33 5 3.011
Environmental reports are not
relevant
4.83 6 2.401
Environmental reports are not
comparable
5.00 7 0.632
Scale: 1=most important; 7=least important
As Table 7.6 shows, the most important statement that could explain why non-readers did not read
environmental reports is that environmental reports were not perceived to be reliable. The second
most important reason is that the reports were not perceived to be verifiable. The least important
statement that could explain why environmental reports were not read is that they were not
perceived to be comparable. The non-readers views varied widely on all the statements except the
last statement (environmental reports were not comparable), as indicated by standard deviations
291
above one.
The preceding results differ from the findings of KPMG and SustainAbility (2008:29), which
indicated that the main reason why non-readers of sustainability reports did not read the reports
was that the reports were too lengthy, or websites too difficult to navigate, both which rendered
the reports inaccessible and unreadable. Other reasons provided by non-readers in the KPMG and
SustainAbility's (2008:29) study were the perception that the reports had no value, or that the non-
readers lacked knowledge of how to use the reports for decision making, and the availability of
alternative sources of sustainability information perceived to be more efficient and
understandable.
A possible explanation for the difference between the current study's results and KPMG and
SustainAbility's (2008:29) findings is the time difference between when the two studies were
conducted. With passage of time, the Internet has become faster, particularly mobile broadband
data, thus enabling the users of environmental reports to access information on company websites
more efficiently (Research ICT Africa, 2013:01). Besides, the level of awareness of the users in
South Africa has increased dramatically in the recent years, as company stakeholders have
become increasingly conscious of the impacts of companies' activities on the environment, and
thus increasingly see value in sustainability related reports (Goulder Associates, 2014:116).
However, given the general distrust of companies' intentions in the country, non-readers are
sceptical of the reports' reliability and verifiability (McKay, 2013:01). Given that the non-readers
in the current study did not perceive the environmental reports to be reliable, and considering that
reliability is one of the fundamental (primary) characteristics that accounting reports must possess
to be decision-useful (FASB, 2008:28; IASB, 2008:13), one can conclude that the non-readers did
not perceive the reports to be decision-useful.
7.5.4 Measures undertaken by preparers' companies to convert non-readers of environmental
reports to readers
Consistent with the preceding section, the preparers were asked to indicate the extent to which
their companies had undertaken measures to make their environmental reports more relevant,
reliable, comparable, understandable, timely and verifiable, in order to convert non-readers of the
reports to future readers. In doing so a scale of five points was used with one being no extent, two
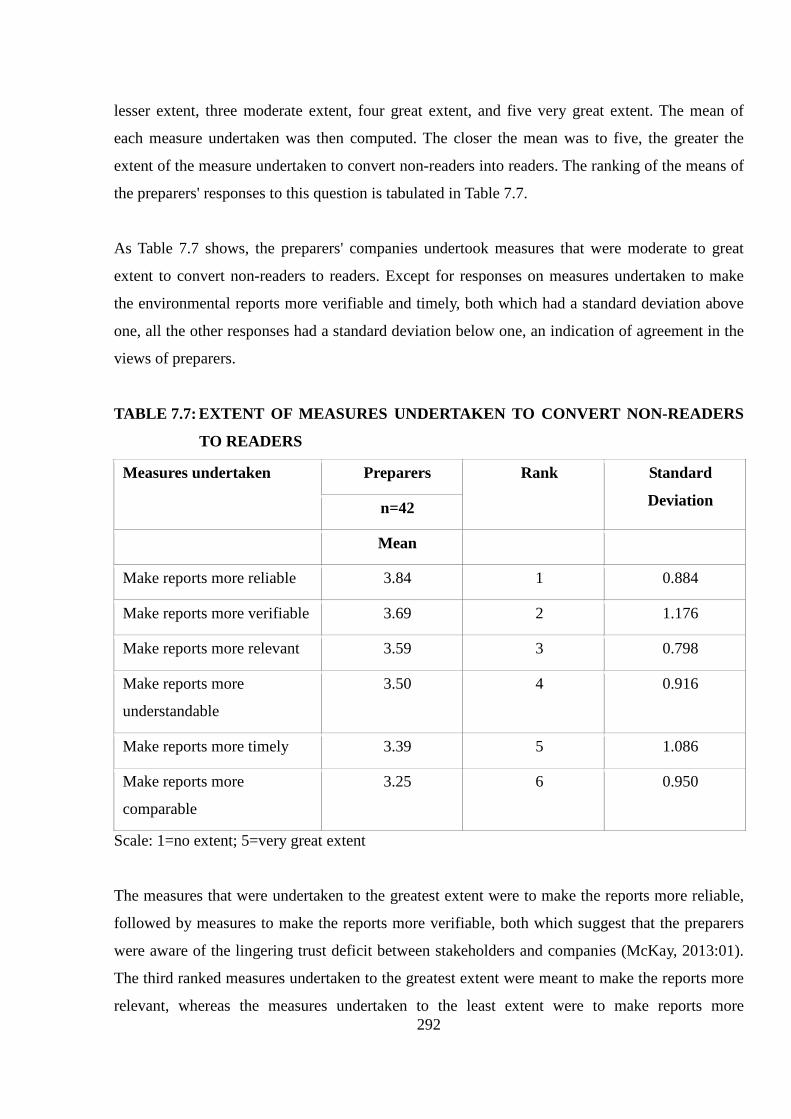
292
lesser extent, three moderate extent, four great extent, and five very great extent. The mean of
each measure undertaken was then computed. The closer the mean was to five, the greater the
extent of the measure undertaken to convert non-readers into readers. The ranking of the means of
the preparers' responses to this question is tabulated in Table 7.7.
As Table 7.7 shows, the preparers' companies undertook measures that were moderate to great
extent to convert non-readers to readers. Except for responses on measures undertaken to make
the environmental reports more verifiable and timely, both which had a standard deviation above
one, all the other responses had a standard deviation below one, an indication of agreement in the
views of preparers.
TABLE 7.7: EXTENT OF MEASURES UNDERTAKEN TO CONVERT NON-READERS
TO READERS
Measures undertaken Preparers Rank Standard
Deviation n=42
Mean
Make reports more reliable 3.84 1 0.884
Make reports more verifiable 3.69 2 1.176
Make reports more relevant 3.59 3 0.798
Make reports more
understandable
3.50 4 0.916
Make reports more timely 3.39 5 1.086
Make reports more
comparable
3.25 6 0.950
Scale: 1=no extent; 5=very great extent
The measures that were undertaken to the greatest extent were to make the reports more reliable,
followed by measures to make the reports more verifiable, both which suggest that the preparers
were aware of the lingering trust deficit between stakeholders and companies (McKay, 2013:01).
The third ranked measures undertaken to the greatest extent were meant to make the reports more
relevant, whereas the measures undertaken to the least extent were to make reports more

293
comparable. This result is consistent with the results disclosed in the content analysis phase of the
study which indicated that the current environmental reports produced by South African
companies were incomparable (See section 6.6.2).
The fact that the measures to make environmental reports comparable were undertaken to the least
extent is consistent with the conceptual frameworks (FASB 2008:27; IASB 2008:51), which assert
that improving comparability may destroy or weaken relevance and reliability of information if
for instance, unlike sets of information are made to look alike. Given that relevance and reliability
are primary qualitative characteristics of decision-useful information while comparability is an
enhancing characteristic, it seems logical for companies to sacrifice the latter, in the interest of
relevance and reliability.
7.5.5 Comparison of non-readers' reasons for not reading environmental reports to measures
undertaken by preparers' to convert non-readers to readers
Comparing the views of non-readers to those of preparers by eliminating the row “other” in non-
readers' responses (as the response “other” was not an option available to preparers), some
interesting observations can be made. First, the most important reasons cited by non-readers for
not reading any environmental report namely, that the reports were not reliable and not verifiable,
appear to correspond with the measures undertaken by companies to the greatest extent to convert
the non-readers to readers (namely measures to make the reports more reliable and to make the
reports verifiable). Second, the least important reason cited by users (non-readers) for not reading
any environmental report namely, that the reports were not comparable appears to correspond with
the measures undertaken by companies to the least extent to convert the non-readers to readers
(namely measures to make the reports more comparable).
The ranking by non-readers, of the reasons that the reports were not understandable (three), and
that they were not timely (four), is more or less similar to the ranking of measures undertaken by
companies to convert the non-readers to readers, namely to make the reports more understandable
(four) and more timely (five).
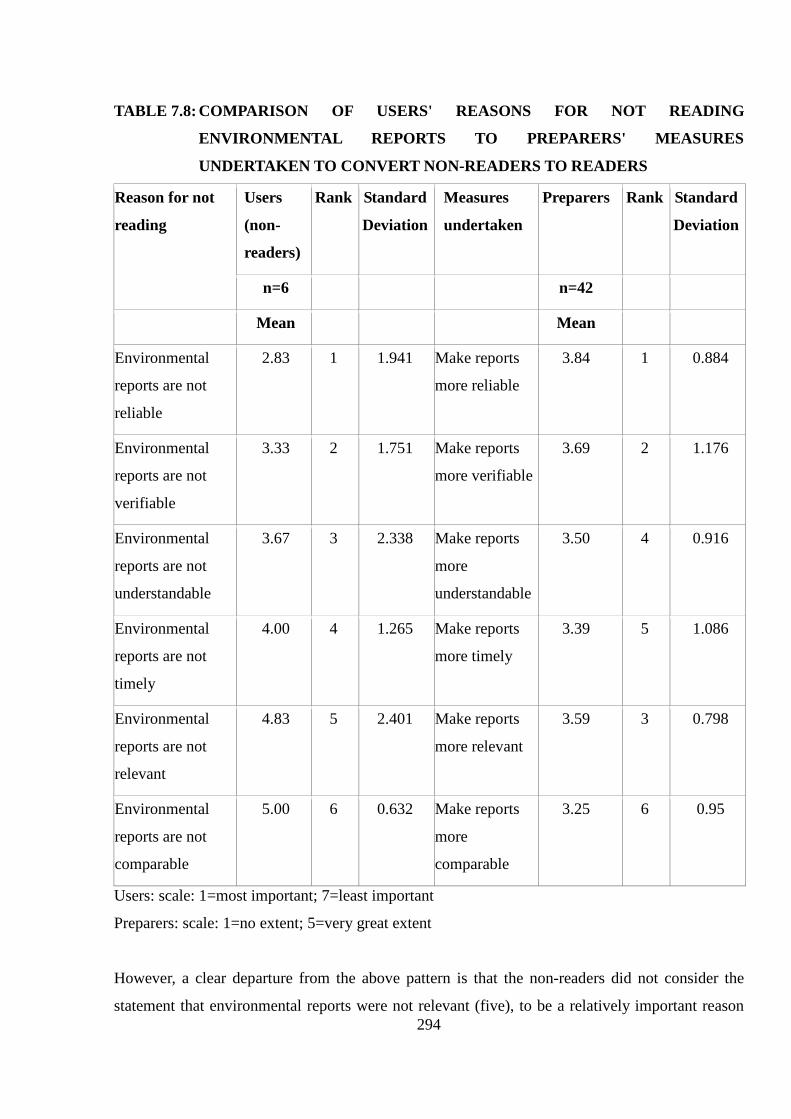
294
TABLE 7.8: COMPARISON OF USERS' REASONS FOR NOT READING
ENVIRONMENTAL REPORTS TO PREPARERS' MEASURES
UNDERTAKEN TO CONVERT NON-READERS TO READERS
Reason for not
reading
Users
(non-
readers)
Rank Standard
Deviation
Measures
undertaken
Preparers Rank Standard
Deviation
n=6 n=42
Mean Mean
Environmental
reports are not
reliable
2.83 1 1.941 Make reports
more reliable
3.84 1 0.884
Environmental
reports are not
verifiable
3.33 2 1.751 Make reports
more verifiable
3.69 2 1.176
Environmental
reports are not
understandable
3.67 3 2.338 Make reports
more
understandable
3.50 4 0.916
Environmental
reports are not
timely
4.00 4 1.265 Make reports
more timely
3.39 5 1.086
Environmental
reports are not
relevant
4.83 5 2.401 Make reports
more relevant
3.59 3 0.798
Environmental
reports are not
comparable
5.00 6 0.632 Make reports
more
comparable
3.25 6 0.95
Users: scale: 1=most important; 7=least important
Preparers: scale: 1=no extent; 5=very great extent
However, a clear departure from the above pattern is that the non-readers did not consider the
statement that environmental reports were not relevant (five), to be a relatively important reason

295
for not reading the reports, whereas the preparers indicated that they undertook measures to make
the reports more relevant (three), to a relatively great extent to convert non-readers to readers. One
can therefore conclude that there is an apparent expectation gap between the non-readers and
preparers with regard to the perceived relevance of the environmental reports.
7.6 USERS' ENVIRONMENTAL INFORMATION NEEDS
7.6.1 Users perceptions on what a company's environmental report should do or should be
The users were asked to rate the importance of 28 statements about what a company's
environmental reports should do or should be. A five point likert scale was used with weightings
of one for not important at all, two, slightly important, three, fairly important, four, very
important, and five, extremely important. Therefore the closer the mean was to five, the more
important the statement was to the users. For the sake of clarity and brevity, the percentages of
those who perceived each of the 28 statements as either very important or extremely important
were added up together, and reported as “percentage that perceive statement to be important” in
the fourth column of Table 7.9.
In essence therefore, those who perceived the statements to be fairly important were
conservatively reported as perceiving the statements not to be important, as the words “fairly
important” suggest neutrality in perception of the importance of the statements. This approach is
justified to ensure that only those who really perceive the statements to be important are reported
as such, and it has also been used in the prior studies (See DeVilliers & Van Staden, 2010:15).
As Table 7.9 shows, most users perceived the 28 statements to be important, as 25 out of 28
statements were perceived to be either very important or extremely important by at least 50% of
the sampled users. 100% of users felt that the disclosure of both negative and positive aspects in a
balanced manner was either very important or extremely important, whereas 91.67% of the users
felt that the identification and description of key relevant issues (significant aspects) was either
very important or extremely important. A similar percentage to the latter (91.67%) also indicated
that provision of specific and accurate information, as well as future oriented information were
either very important or extremely important.

296
TABLE 7.9: USERS' PERCEPTION OF WHAT A COMPANY'S ENVIRONMENTAL
REPORT SHOULD DO/SHOULD BE
No Statement Related
qualitative
characteristic
Percentage
that perceive
statement to
be important
Rank Users Standard
Deviation n=48
Mean
1 Disclose both negative
and positive aspects in
a balanced manner
Reliability 100.00% 1 4.67 0.478
2 Identify and describe
key relevant issues
(significant aspects)
Relevance 91.67% 2 4.61 0.728
3 Be specific and
contain accurate
information
Reliability 91.67% 2 4.47 0.810
4 Provide future
oriented information
Relevance 91.67% 2 4.42 0.732
5 Identify and address
key stakeholders and
their concerns
Relevance 88.89% 5 4.33 0.756
6 Demonstrate the
integration of
environmental issues
into core business
processes
Reliability 88.89% 5 4.33 0.756
7 Compare quantitative
outputs/ impacts
against best practice
/industry standards
Comparability 88.88% 7 4.33 0.676
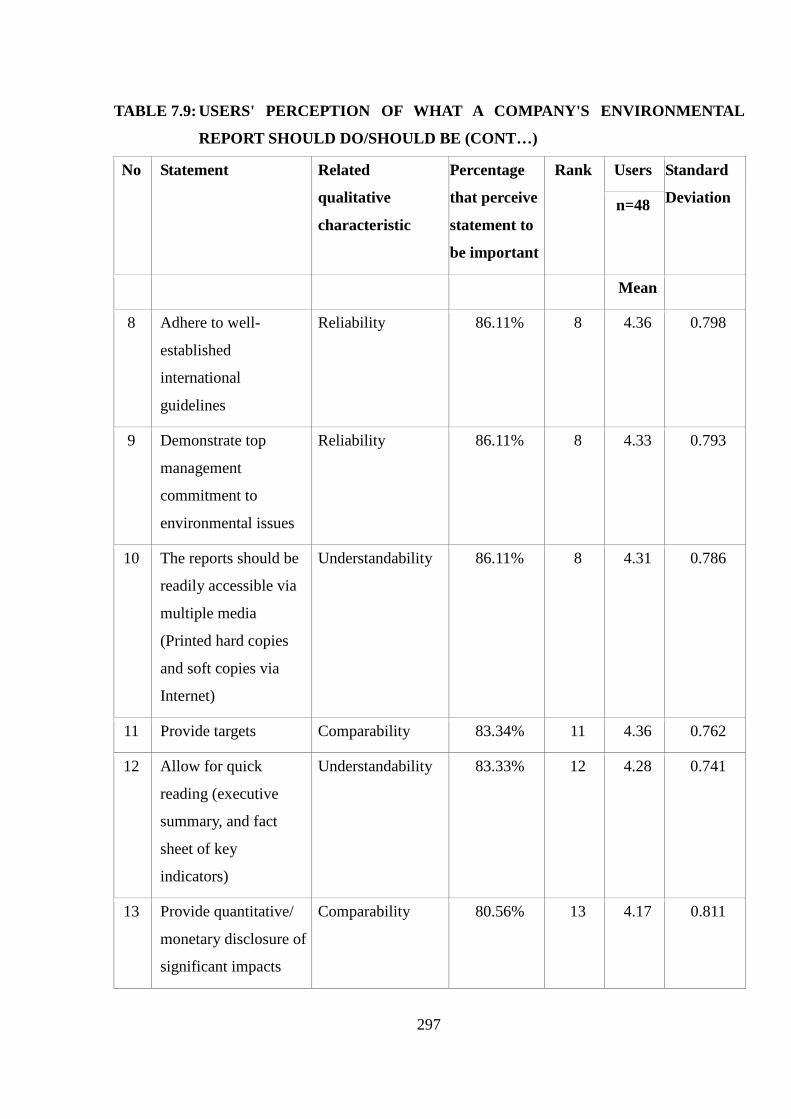
297
TABLE 7.9: USERS' PERCEPTION OF WHAT A COMPANY'S ENVIRONMENTAL
REPORT SHOULD DO/SHOULD BE (CONT…)
No Statement Related
qualitative
characteristic
Percentage
that perceive
statement to
be important
Rank Users Standard
Deviation n=48
Mean
8 Adhere to well-
established
international
guidelines
Reliability 86.11% 8 4.36 0.798
9 Demonstrate top
management
commitment to
environmental issues
Reliability 86.11% 8 4.33 0.793
10 The reports should be
readily accessible via
multiple media
(Printed hard copies
and soft copies via
Internet)
Understandability 86.11% 8 4.31 0.786
11 Provide targets Comparability 83.34% 11 4.36 0.762
12 Allow for quick
reading (executive
summary, and fact
sheet of key
indicators)
Understandability 83.33% 12 4.28 0.741
13 Provide quantitative/
monetary disclosure of
significant impacts
Comparability 80.56% 13 4.17 0.811
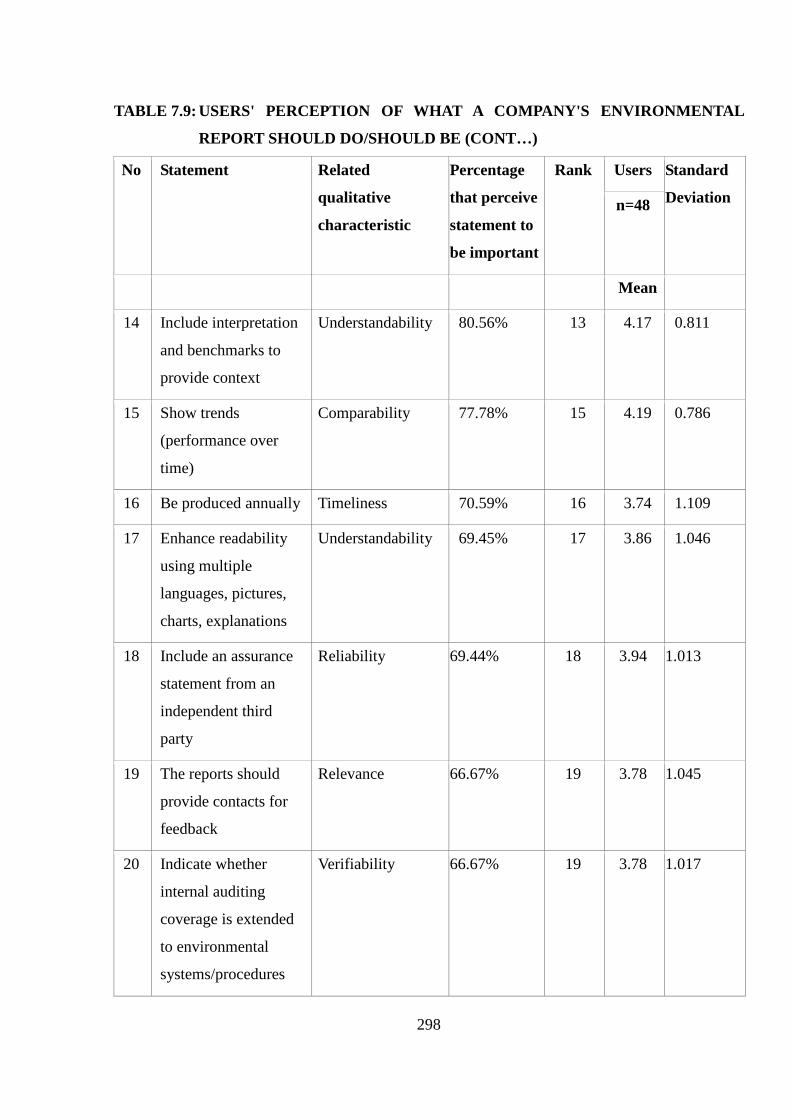
298
TABLE 7.9: USERS' PERCEPTION OF WHAT A COMPANY'S ENVIRONMENTAL
REPORT SHOULD DO/SHOULD BE (CONT…)
No Statement Related
qualitative
characteristic
Percentage
that perceive
statement to
be important
Rank Users Standard
Deviation n=48
Mean
14 Include interpretation
and benchmarks to
provide context
Understandability 80.56% 13 4.17 0.811
15 Show trends
(performance over
time)
Comparability 77.78% 15 4.19 0.786
16 Be produced annually Timeliness 70.59% 16 3.74 1.109
17 Enhance readability
using multiple
languages, pictures,
charts, explanations
Understandability 69.45% 17 3.86 1.046
18 Include an assurance
statement from an
independent third
party
Reliability 69.44% 18 3.94 1.013
19 The reports should
provide contacts for
feedback
Relevance 66.67% 19 3.78 1.045
20 Indicate whether
internal auditing
coverage is extended
to environmental
systems/procedures
Verifiability 66.67% 19 3.78 1.017
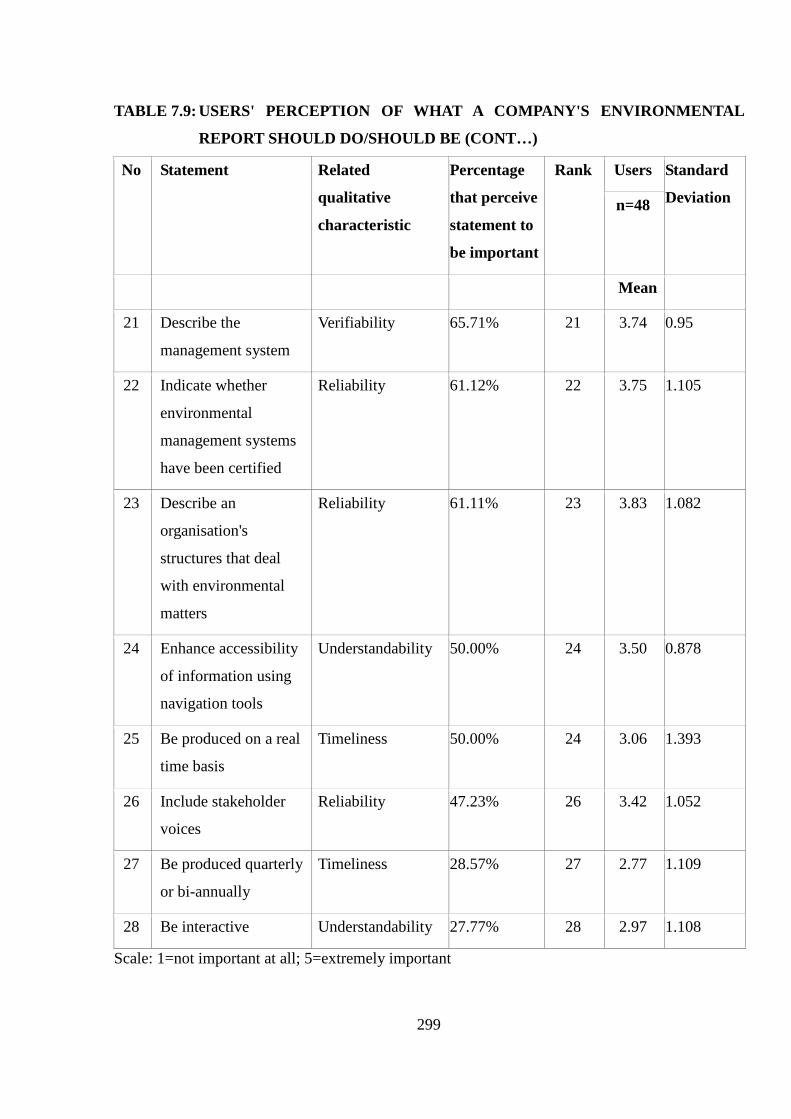
299
TABLE 7.9: USERS' PERCEPTION OF WHAT A COMPANY'S ENVIRONMENTAL
REPORT SHOULD DO/SHOULD BE (CONT…)
No Statement Related
qualitative
characteristic
Percentage
that perceive
statement to
be important
Rank Users Standard
Deviation n=48
Mean
21 Describe the
management system
Verifiability 65.71% 21 3.74 0.95
22 Indicate whether
environmental
management systems
have been certified
Reliability 61.12% 22 3.75 1.105
23 Describe an
organisation's
structures that deal
with environmental
matters
Reliability 61.11% 23 3.83 1.082
24 Enhance accessibility
of information using
navigation tools
Understandability 50.00% 24 3.50 0.878
25 Be produced on a real
time basis
Timeliness 50.00% 24 3.06 1.393
26 Include stakeholder
voices
Reliability 47.23% 26 3.42 1.052
27 Be produced quarterly
or bi-annually
Timeliness 28.57% 27 2.77 1.109
28 Be interactive Understandability 27.77% 28 2.97 1.108
Scale: 1=not important at all; 5=extremely important
300
88.89% felt that identification and addressing key stakeholders and their concerns, and
demonstrating the integration of environmental issues into core business processes were either
very important or extremely important. The standard deviation of user's rating of 17 out of 28
statements of less than one indicates agreement in users' responses on the majority (61%) of the
statements, and concurs with the observation of the European Commission (2011b:104) that
different user groups agree on what a good quality sustainability report should look like.
A striking observation that can be made from the above responses of users is that the top six
statements perceived by most users to be either very important or extremely important relate to the
fundamental (primary) qualitative characteristics of decision-useful information, namely relevance
or reliability. In fact out of the top 10 statements ranked according to the percentage of users that
perceived them either as very important or extremely important, only two statements relate to the
qualitative characteristics that enhance the decision-usefulness of environmental information,
whereas eight statements relate to the fundamental (primary) qualitative characteristics.
Specifically, out of the top 10 statements, five relate to reliability, and three relate to relevance.
Each of the remaining two statements was either related to comparability or to understandability.
The above results support the accounting conceptual frameworks' assertion that relevance and
reliability are the two fundamental (primary) qualities that make accounting information useful for
decision-making and hence desirable (FASB, 2010:16; FASB, 2008:02; IASB, 2010:17; IASB,
2008:13). If either of these two characteristics is missing completely, the information cannot be
decision-useful. The observation that five out of top 10 statements relate to reliability is consistent
with the results discussed earlier in section 7.5.3 which indicated that most non-readers of
environmental reports did not perceive the reports to be reliable, a further indication of a lingering
trust deficit of stakeholders towards companies (McKay, 2013:01).
By contrast, the statement that environmental reports should be interactive was the least popular
as it was perceived to be either very important or extremely important by only 27.77% of the
users. The second least popular statement was that environmental reports should be produced on a
quarterly or bi-annual basis as only 28.57% of the users perceived it to be either very important or
extremely important. Surprisingly, only 47.23% of the users perceived the inclusion of stakeholder
voices in the environmental reports to be either very important or extremely important, making the
statement the third least popular, although the statement relates to reliability, a fundamental
301
qualitative characteristic. Other statements that were less popular included statements that
environmental reports should be produced on a real time basis and that they should enhance
accessibility of information using navigation tools, both which were perceived as very important
or extremely important by 50% of the users.
Another interesting observation that can be made is that four out of five bottom ranked statements
relate to the qualitative characteristics that enhance the decision-usefulness of environmental
information, whereas only one statement relates to the fundamental (primary) qualitative
characteristics. This observation is consistent with the accounting conceptual frameworks
assertion that enhancing qualitative characteristics, either individually or as a group cannot make
information useful if that information is irrelevant or unreliable (FASB, 2010:21; FASB, 2008:21;
IASB, 2010:22; IASB, 2008:41). Therefore enhancing qualitative characteristics are sub-ordinate
to the primary (fundamental) qualitative characteristics and are bound to be perceived to be of
lesser importance. In short, the current results indicate that the users' preferred reports which have
primary (fundamental) qualitative characteristics, and thus which are decision-useful.
Perhaps, one of the most surprising observations that can be made from Table 7.9 is that the
statement “inclusion of an assurance statement from an independent third party”, which ideally
should be the most effective way of enhancing the reliability of an environmental report, was
relatively less popular than one would expect. In fact, it ranked 18th in terms of popularity by the
users, and yet five of the top 10 most popular statements were related to reliability.
The perception by users that assurance statements were relatively less important appears to
support FASB's (2008:23) conceptual framework assertion that verification of accounting
information does not guarantee that the information has a high degree of representational
faithfulness. In fact, according to the conceptual frameworks (FASB, 2010:20; IASB, 2010:63;
IASB, 2008:52), the forward looking information contained in accounting reports is not verifiable,
and therefore verifiability cannot be a required component of faithful representation. A possible
explanation for the relatively low regard of assurance statements is perhaps provided by the
findings of prior studies (CorporateRegister.com & ACCA, 2004:54; Owen, 2003:09), which
indicated that stakeholders were sidelined from the assurance process as assurance engagements
which were determined by and undertaken for the companies' management. This undermined the
perceived independence of the assurance providers, who also doubled as consultants. In addition,
302
assurance statements appeared to vary widely in their scope, methodology and conclusions,
covered only certain pre-selected items of the reports, and contained caveats to protect auditors
from potential liability arising thereafter (KPMG, 1999:25; IRRC, 1996:21).
The above results of the current study concur with the earlier findings of prior studies (Danatas &
Gadenne 2004; European Commission 2011b; KPMG et al., 2010; KPMG & SustainAbility,
2008; IRRC 1995; Tilt 1994), which revealed users' preferences, chief among which was a
balanced disclosure of accurate, positive and negative sustainability information. However, the
above results contrast the earlier findings of some prior studies (European Commission,
2011b:102; Hodge, Subramaniam & Stewar,t 2009; KPMG & SustainAbility, 2008; O’Dwyer et
al., 2004; Tilt, 1994), notable among which was a perception by users that the inclusion of an
assurance statement in a sustainability report had a higher relative importance in achieving
reliability, than was the case in the current study.
A possible explanation for the difference between the results of the current study and the findings
of the prior studies, particularly with regard to the importance of assurance of environmental/
sustainability reports is that the prior studies were conducted in developed countries in which
assurance practices may have advanced to a level that ensured the independence of the assurors,
and their statements. Besides, some of the developed countries in which the studies were
undertaken had mandatory and rigorous regulations that governed the assurance process, which
could have prompted the users to prefer assurance as an approach to ensure reliability of the
environmental/sustainability reports.
7.6.2 Comparison of users and preparers' perceptions on what a company's environmental report
should do or should be
Having asked the users to rate the importance of 28 statements about what a company's
environmental reports should do or should be, the preparers were also asked to rate the 28
statements, using the criteria described above in section 7.6.1. The responses of both users and
preparers were then ranked according to the mean score of responses to each statement, in a
descending order, and then compared to each other to determine whether there were differences in
the perceptions of the two groups with regard to the importance of the 28 statements. In addition,
the mean scores of the users' and preparers' rating of the 28 statements were compared, and T-
303
Tests for equality of means (2-tailed) performed to determine whether there were any statistically
significant differences between the perceptions of the two groups on the importance of the 28
statements.
In general, the responses of both the users and preparers suggest that both groups perceived most
of the 28 statements to be important. Specifically, the users' mean scores of 16 out of 28
statements were between four and five (between very important and extremely important), and
their mean scores for 11 statements were between three and four (between fairly important and
very important). For only two statements were the users' mean scores between two and three
(between slightly important and fairly important). Likewise, the preparers' mean scores of seven
out of 28 statements were between four and five (between very important and extremely
important), and the mean scores of 17 statements were between three and four (between fairly
important and very important). For only four statements were the preparers' mean scores between
two and three (between slightly important and fairly important).
As summarised in Table 7.10, only four out of 28 statements were ranked equally by both users
and preparers. These included the statement that “environmental reports should identify and
describe key relevant issues (significant aspects)”, ranked second by both groups, although the
mean of the users was marginally higher (4.61) than that of the preparers (4.31). Likewise both
users and preparers ranked the statement that “environmental reports should adhere to well-
established international guidelines” fifth, but the users' mean was marginally higher (4.36) than
that of the preparers (4.13). Similarly, both groups ranked the statement that “environmental
reports should indicate whether environmental management systems have been certified” 21st.
Here again the users' mean was higher (3.75) than that of the preparers (3.31). Following the same
pattern, both users and preparers ranked the statement that “environmental reports should be
produced quarterly or bi-annually” 28th. However, the users' mean was again relatively higher
(2.77) than that of the preparers (2.09). The foregoing indicates that users perceived the above
statements to be more important than the preparers did, although both groups ranked them equally,
which could suggest existence of an expectation gap between the two groups on the importance of
the four statements.

304
TABLE 7.10: COMPARISON OF USERS’ AND PREPARERS' PERCEPTIONS ON WHAT
AN ENVIRONMENTAL REPORT SHOULD DO OR SHOULD BE
No Statement Users Rank Preparers Rank Statistical
Significance
of
differences
n=48 n=42
Mean Mean
1 Disclose both negative and
positive aspects in a balanced
manner
4.67 1 4.03 6 0.000*
2 Identify and describe key relevant
issues (significant aspects)
4.61 2 4.31 2 0.098
3 Be specific and contain accurate
information
4.47 3 4.39 1 0.634
4 Provide future oriented
information
4.42 4 3.72 11 0.001*
5 Adhere to well-established
international guidelines
4.36 5 4.13 5 0.226
6 Provide targets 4.36 5 3.88 8 0.019*
7 Identify and address key
stakeholders and their concerns
4.33 7 4.16 4 0.365
8 Demonstrate top management
commitment
4.33 7 4.25 3 0.669
9 Compare quantitative
outputs/impacts against best
practice/industry standards
4.33 7 3.50 17 0.000*
10 Demonstrate the integration of
environmental issues into core
business processes
4.33 7 3.69 12 0.009*

305
TABLE 7.10: COMPARISON OF USERS’ AND PREPARERS' PERCEPTIONS ON WHAT
AN ENVIRONMENTAL REPORT SHOULD DO OR SHOULD BE (CONT…)
No Statement Users Rank Preparers Rank Statistical
Significance
of
differences
n=48 n=42
Mean Mean
11 The reports should be readily
accessible via multiple media
(Printed hard copies and soft
copies via Internet)
4.31 11 3.72 10 0.008*
12 Allow for quick reading
(executive summary/fact sheet)
4.28 12 4.00 7 0.254
13 Show trends 4.19 13 3.69 12 0.018*
14 The report should provide
quantitative/monetary disclosure
of significant outputs/impacts
4.17 14 3.69 12 0.024*
15 Include interpretation and
benchmarks to provide context
4.17 14 3.63 16 0.019*
16 Include an assurance statement
from an independent third party
3.94 16 3.45 19 0.074
17 Enhance readability using multiple
languages, pictures, charts,
explanations
3.86 17 3.23 23 0.027*
18 Description of the organisation's
structures that deal with
environmental matters
3.83 18 3.26
22 0.037*
19
The reports should provide
contacts for feedback and further
information
3.78 19 3.69 12 0.725

306
TABLE 7.10: COMPARISON OF USERS’ AND PREPARERS' PERCEPTIONS ON WHAT
AN ENVIRONMENTAL REPORT SHOULD DO OR SHOULD BE (CONT…)
No Statement Users Rank Preparers Rank Statistical
Significance
of
differences
n=48 n=42
Mean Mean
20 Indicate whether internal auditing
coverage is extended to
environmental systems and
procedures
3.78 19 3.34 20 0.073
21 Indicate whether environmental
management systems have been
certified
3.75 21 3.31 21 0.114
22 Describe the management system 3.74 22 3.50 17 0.323
23 Be produced annually 3.74 22 3.88 8 0.595
24 Enhance accessibility of
information using navigation tools
3.50 24 2.88 25 0.017*
25 Include stakeholder voices 3.42 25 3.06 24 0.181
26 Be produced on a real time basis 3.06 26 2.48 27 0.103
27 Be interactive 2.97 27 2.53 26 0.102
28 Be produced quarterly or bi-
annually
2.77 28 2.09 28 0.019*
Scale: 1=not important at all; 5=extremely important
*statistically significant differences (p<0.05) at 95% confidence level
Apart from the four statements discussed above, all the other statements in Table 7.10 were ranked
differently, but in all cases, the users’ means were higher than those of the preparers. For instance,
the users ranked the statement that “environmental reports should disclose both negative and
positive aspects in a balanced manner” first with a mean score of 4.67, whereas the preparers

307
ranked the statement sixth with a mean score of 4.03. Even in cases where the preparers ranked a
statement higher, the users’ means remained higher than those of preparers. For example, the
preparers ranked the statement “environmental reports should be specific and contain accurate
information” first whereas the users ranked it third, nonetheless the users' mean score for this
statement (4.67) was relatively higher than that of the preparers (4.47). The foregoing suggests
that the users perceived the 28 statements to be more important than the preparers did, which
further suggests the existence of an expectation gap between the two groups with regard to the
perceived importance of the 28 statements.
The results of the T-Tests for equality of means (2-tailed) revealed significant differences (p<0.05)
between the responses of users and preparers in 13 (46% of all statements) out of 28 statements at
a 95% confidence level. Of the 13 significant differences, four relate to statements associated with
comparability, four to statements linked to understandability, three to statements related to
reliability, one to a statement associated with relevance and another to a statement related to
timeliness. The foregoing discussion suggests that the significant differences found mostly relate
to statements associated with enhancing qualitative characteristics, as nine out of the 13
statements with significant differences relate to these characteristics.
The above results suggest the existence of an expectation gap between the users and preparers
with regard to the importance of the 28 statements, but that the expectation gap is primarily
related to the enhancing qualitative characteristics. However, given that three significant
differences found in statements relate to reliability of the environmental reports and one to
relevance, but on a key statement namely that “environmental reports should identify and address
key stakeholders and their concerns”, one can conclude that there was an expectation gap between
users and preparers with regard to the overall decision-usefulness of environmental reports.
The above results are consistent with the findings of prior studies (Mitchell & Quin, 2005;
Myburgh 2001; Deegan & Rankin, 1999), which also found an expectation gap between users and
preparers on various issues related to environmental reporting. The existence of an expectation
gap between the users and preparers with regard to the importance of the 28 statements could
explain why users' may not be satisfied with the decision-usefulness of the current environmental
reporting practices, as documented in the prior studies (Campbell & Slack, 2008; Danatas &
Gadenne 2004; European Commission, 2011b; Mitchell & Hill 2010; Solomon & Solomon, 2006;
308
Tilt 1994; O’Dwyer et al., 2004). The existence of an expectation gap suggests a need for more
concerted efforts to improve the quality of environmental reports, in order to make the reports
more decision-useful.
7.7 EXTENT TO WHICH ENVIRONMENTAL REPORTS ARE READ AND HOW THEY
ARE USED
7.7.1 How often various reading techniques are employed by users when reading environmental
reports
Bearing in mind that the technique employed to read a report determines how well it’s understood,
and used to influence decisions, the users were asked to indicate how often they employed five
techniques when reading environmental reports. The techniques included, scanning (to locate
specific information), skimming (rapid reading of headings, topic sentence to get the main idea),
exploratory reading (to get a fairly accurate picture of the entire report), study reading (to
maximise understanding of the main ideas) and critical reading (questioning, analysing and
evaluating the text). A five point likert scale was used with weightings of one for never, two for
rarely, three for sometimes, four for often, and five for almost always. Therefore the closer the
mean was to five, the more often a reading technique was used by the users.
For the sake of clarity and brevity, the percentages of those who indicated that they had used each
of the five reading techniques either often or almost always were added up together, and reported
as “percentage that used the technique often” in the third column of Table 7.11. In essence
therefore, those who indicated that they had used a reading technique sometimes or rarely are
conservatively reported as never having used the technique, as the words “sometimes” and
“rarely” suggest infrequent to almost non-usage of a technique. This approach is justified because
it ensures that only those who frequently use a reading technique are reported as such, and it has
also been used in prior studies (See DeVilliers & Van Staden, 2010:15).
As Table 7.11 shows, most users (77.15%) indicated that they used scanning, followed by
skimming (74.29%), then exploratory reading (64.70%). The least often used reading technique
was study reading (34.28%), followed by critical reading (42.86%). The results in Table 7.11
further reveal an agreement in the responses of the users as the standard deviations of the

309
responses are below one, except for critical reading.
TABLE 7.11: HOW OFTEN VARIOUS READING TECHNIQUES WERE EMPLOYED
No Reading technique Percentage
that used the
technique
often
Users Standard
Deviation n=48
Mean
1 Scanning (to locate specific pieces of information) 77.15% 4.06 0.873
2 Skimming (rapid reading of headings, topic sentence to
get the main idea)
74.29% 3.89 0.796
3 Exploratory reading (to get a fairly accurate picture of
the entire report)
64.70% 3.68 0.638
4 Critical reading (questioning, analysing and evaluating
the text)
42.86% 3.34 1.027
5 Study reading (to get a maximum understanding of the
main ideas )
34.28% 3.37 0.731
Scale: 1=never; 5=almost always
It is discouraging to note that lesser effective reading techniques (scanning, skimming and
exploratory reading) were more often used by a larger percentage of the users than the more
effective reading techniques (critical and study reading), a situation likely to undermine the
understandability of the information read from the environmental reports. This result differs from
the findings of some earlier prior studies (European Commission, 2011b:102; Solomon &
Solomon, 2006), which indicated that some users did not only thoroughly/extensively read
sustainability reports, they also actively participated in co-writing of sustainability reports with the
reporting entities. The preceding result is also contrary to the conceptual frameworks (FASB,
2008:10; IASB, 2008:40), which appear to emphasize critical and study reading techniques, by
asserting that in making decisions, users are responsible for studying and analysing accounting
information with reasonable diligence. In short, users' preference of lesser effective reading

310
techniques when reading environmental reports undermines the decision-usefulness of the reports.
7.7.2 Comparison of users' and preparers’ perceptions on the frequency of usage of various
reading techniques by users when reading an environmental report
Like the users, the preparers were also asked to express an opinion on how often their readers
employed the five reading techniques, based on the criteria described above in the first paragraph
of section 7.7.1. The responses of both users and preparers were then ranked according to the
mean scores for the responses, in a descending order, and then compared to each other.
TABLE 7.12: COMPARISON OF USERS' AND PREPARERS’ PERCEPTIONS ON
FREQUENCY OF USAGE OF VARIOUS READING TECHNIQUES
No Reading technique Users Rank Preparers Rank Statistical
Significance
of
differences
n=48 n=42
Mean Mean
1 Scanning (to locate specific pieces
of information)
4.06 1 3.81 1 0.239
2 Skimming (rapid reading of
headings, topic sentence to get the
main idea)
3.89 2 3.68 2 0.291
3 Exploratory reading (to get a fairly
accurate picture of the entire
report)
3.68 3 3.00 3 0.000*
4 Study reading (to get a maximum
understanding of the main ideas )
3.37 4 2.71 4 0.006*
5 Critical reading (questioning,
analysing and evaluating the text)
3.34 5 2.55 5 0.033*
Scale: 1=never; 5=almost always

311
*statistically significant differences at 95% confidence level
In addition, T-Tests for equality of means (2-tailed) were performed to determine whether there
were statistically significant differences between the perceptions of the two groups with regard to
the frequency of usage of the five reading techniques employed by users when reading
environmental reports.
As summarised in Table 7.12, the ranking of the five reading techniques, based on the means of
the users and preparers are identical. The ranking reveals that both users and preparers perceive
that the most frequently used technique by users when reading environmental reports is scanning,
followed by skimming, then exploratory reading, followed by study reading, then lastly critical
reading. However, the means of the users on the five reading techniques are higher than those of
the preparers, indicating that users perceived themselves to have used the reading techniques more
often than was perceived by the preparers, which suggests the existence of an expectation gap
between the perceptions of users and preparers.
Indeed, the T-Test for equality of means (2-tailed) performed reveals three significant differences
(p<0.05) in the perceptions of the users and preparers pertaining to exploratory reading, study
reading and critical reading at a 95% confidence level, which further provides evidence of the
existence of an expectation gap. The apparent existence of an expectation gap, particularly on the
three reading techniques considered to be more effective, could perhaps explain the provision of
lengthy environmental reports documented in the prior literature (KPMG, & SustainAbility,
2008:29; Solomon & Solomon, 2006:585; Spada, 2008:32). The lengthy environmental reports
are meant to be read using lesser effective reading techniques such as scanning and skimming,
techniques that are unlikely to inform sound decision-making.
7.8 USAGE OF DIFFERENT MEDIA AS A SOURCE OF ENVIRONMENTAL REPORTS
7.8.1 Users' frequency of reading environmental reports from different media
Users were asked to indicate how often they read environmental reports from various media,
primarily the print media and company websites. With regard to the print media, the users were
required to specify how often they read environmental reports from annual reports or
312
sustainability reports. Likewise, with regard to the company websites, the users were required to
specify how often they read environmental reports in integrated annual reports, or stand-alone
sustainability reports, and the format of the reports that they often read (HyperText Markup
Language (HTML) format or Portable Document Format (PDF). A five point likert scale was used
with weightings of one for never, two for rarely, three for sometimes, four for often, and five for
almost always. Therefore, the closer the mean was to five, the more often environmental reports
were read from a given medium.
For the sake of clarity and conciseness, the percentages of those who indicated that they had read
environmental reports from the various media, either often or almost always, were added up
together, and reported as “percentage of users that read from the medium often” in the third
column of Table 7.13. In essence therefore, those who indicated that they had read from a given
medium sometimes or rarely are conservatively reported as never having read from a given
medium, as the words “sometimes” and “rarely” suggest infrequent reading of the reports from a
given medium. This approach was used to ensure that only those who frequently read
environmental reports from a specific medium are reported as such. Besides, the approach has
also been used in the prior studies (See for example DeVilliers & Van Staden, 2010:15).
As summarised in Table 7.13, most users read environmental reports from companies' websites as
opposed to the print medium. Of the users, 51.43% often read environmental reports in PDF
integrated annual reports posted on companies' websites, 45.72% of users often read
environmental reports in PDF format stand-alone sustainability reports posted on companies'
websites', while 42.86% of users often read environmental reports in HTML format stand-alone
sustainability reports posted on companies' websites'. By contrast, only 34.29% of users often read
environmental reports in print medium integrated annual reports. Likewise, only 26.47% of users
often read environmental reports from print medium stand-alone sustainability reports. The users'
opinions were mixed as the standard deviation of their responses for the three media were above
one, whereas for the other three, below one.
The preceding results highlight the emergence of companies' websites as a medium of choice for
users as this medium made access to environmental reports easily accessible, readily searchable
and portable, time-saving and cost-effective, as opposed to print medium reports (Mlarvizhi &
Yadav, 2008:03). The preference of websites by users is consistent with the accounting conceptual

313
frameworks' assertion that users incur costs to obtain information, and that unless benefits derived
from the information (or in this case the medium from which the information is obtained), exceeds
the costs associated with it, it will not be sought after (FASB, 2008:30; IASB, 2008:42). Hence
users are bound to prefer a medium that minimises costs, such as a company’s website which
minimises inconvenience and time spent in searching and accessing desired information, unlike a
printed report.
TABLE 7.13: HOW OFTEN USERS READ ENVIRONMENTAL REPORTS FROM
DIFFERENT MEDIA
No Medium Percentage of
users that read
from the
medium often
Users Standard
Deviation
n=48
Mean
1 PDF integrated annual reports on companies'
websites
51.43% 3.46 1.170
2 PDF stand-alone sustainability reports on
companies' websites
45.72% 3.43 0.770
3 HTML format stand-alone sustainability reports
on companies' websites
42.86% 3.29 1.172
4 HTML format integrated annual reports on
companies' websites
38.23% 3.32 0.976
5 Print medium integrated annual reports 34.29% 2.83 1.014
6 Print medium stand-alone sustainability reports 26.47% 2.74 0.963
Scale: 1=never; 5=almost always
The above findings are also consistent with the findings of prior studies (Danatas & Gadenne,
2004; Deegan & Rankin, 2004; De Villiers & Van Staden, 2010; KPMG & SustainAbility, 2008;
Mitchell & Hill, 2010; Taib, 2005), which indicated that users preferred reading sustainability
reports from annual reports. Users' preference for annual reports has been attributed to the fact
that the reports are regarded as highly credible, given that their annual production is a statutory
314
requirement, and that some of their sections have to be audited as required by law (Tilt, 1994;
Unerman, 2000; Wilmshurst & Frost, 2000). In addition, annual reports are readily available and
widely accessible given that they are produced regularly.
The above results are also consistent with the earlier findings of some prior studies (KPMG &
SustainAbility, 2008:17), which revealed that the single most popular format for sustainability
reporting among users was the PDF. The preference for PDF reports is rather puzzling as these
reports are merely electronic replicas of printed reports (ACCA & CorporateRegister.com,
2001:09). KPMG and SustainAbility (2008:17) speculates that PDF reports are probably preferred
because they are easily accessible, electronically portable, readily searchable, more re-assuring
given that they are replicas of printed versions of reports, and have a clearly defined structure,
with a beginning, middle and end, unlike HTML format reports. Accordingly, users can tell what
the reports contain (scope) as well as what they exclude (boundary). Given that PDF reports are
hardly interactive, users' preference of PDF format environmental reports is consistent with the
results contained in Table 7.9, which indicate that the statement “environmental reports should be
interactive” was perceived by users to be the least important among 28 statements.
7.8.2 Comparison of users' and preparers’ perceptions on how often users read environmental
reports from different media
Having asked users to indicate how often they read environmental reports from various media, the
preparers were also asked to express an opinion on how often their users read environmental
reports from the same media using the criteria described in the first paragraph of section 7.8.1
above. The responses of both users and preparers were then ranked according to mean scores of
responses, in a descending order, and then compared to each other. In addition, T-Tests for
equality of means (2-tailed) were performed to determine whether there were statistically
significant differences between perceptions of the two groups.
As illustrated in Table 7.14, the ranking of three media was identical for both users and preparers,
namely, PDF integrated annual reports on companies' websites, ranked first, HTML format stand-
alone sustainability reports on companies' websites, ranked third, and print medium stand-alone
sustainability reports ranked sixth. In addition, the ranking of HTML format integrated annual
reports on companies' websites was more or less the same for both users and preparers, as users
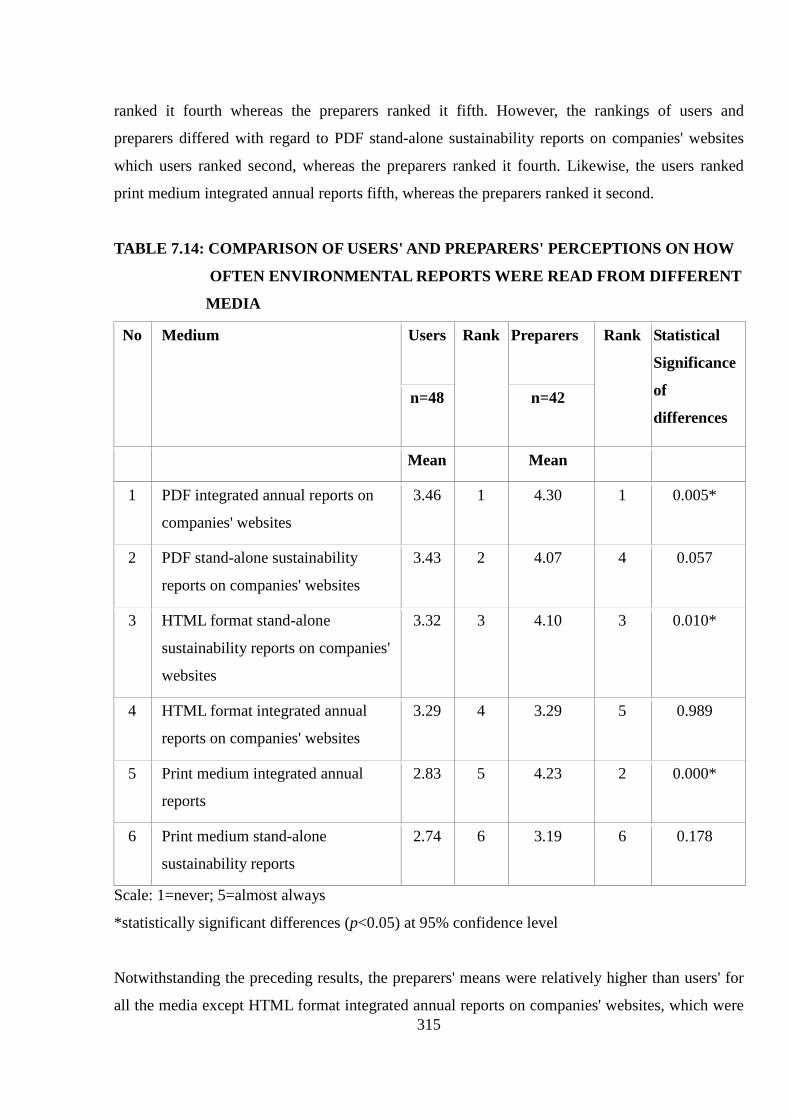
315
ranked it fourth whereas the preparers ranked it fifth. However, the rankings of users and
preparers differed with regard to PDF stand-alone sustainability reports on companies' websites
which users ranked second, whereas the preparers ranked it fourth. Likewise, the users ranked
print medium integrated annual reports fifth, whereas the preparers ranked it second.
TABLE 7.14: COMPARISON OF USERS' AND PREPARERS' PERCEPTIONS ON HOW
OFTEN ENVIRONMENTAL REPORTS WERE READ FROM DIFFERENT
MEDIA
No Medium Users Rank Preparers Rank Statistical
Significance
of
differences n=48 n=42
Mean Mean
1 PDF integrated annual reports on
companies' websites
3.46 1 4.30 1 0.005*
2 PDF stand-alone sustainability
reports on companies' websites
3.43 2 4.07 4 0.057
3 HTML format stand-alone
sustainability reports on companies'
websites
3.32 3 4.10 3 0.010*
4 HTML format integrated annual
reports on companies' websites
3.29 4 3.29 5 0.989
5 Print medium integrated annual
reports
2.83 5 4.23 2 0.000*
6 Print medium stand-alone
sustainability reports
2.74 6 3.19 6 0.178
Scale: 1=never; 5=almost always
*statistically significant differences (p<0.05) at 95% confidence level
Notwithstanding the preceding results, the preparers' means were relatively higher than users' for
all the media except HTML format integrated annual reports on companies' websites, which were
316
equal for both groups (3.29). The foregoing suggests the existence of an expectation gap as
preparers perceived that users read more often from the media provided in Table 7.14, than the
users themselves did.
The T-Tests for equality of means (2-tailed) revealed three statistically significant differences
(p<0.05) in the perceptions of the users and preparers with regard to the media that users most
often read their environmental reports from. The significant differences pertained to how often
users read environmental reports from three media namely PDF format integrated annual reports
on companies' websites, HTML format stand-alone sustainability reports on companies' websites,
and print medium integrated annual reports. These differences suggest the existence of an
expectation gap that could undermine the decision-usefulness of the environmental reports. In
other words, the preparers could be using inappropriate and costly media, particularly the print
medium integrated annual reports, to disseminate the environmental reports, and yet the users do
not read from this medium, a situation that undermines the decision-usefulness of the
environmental reports.
The above results are consistent with the findings of prior studies (Deegan & Rankin, 1999:329;
Haque & Deegan, 2011:13; Mitchell & Quin, 2005:25), which found an expectation gap between
the users and preparers with regard to the usage of annual reports for environmental reporting. In
particular, Deegan & Rankin (1999:313) found that a majority of users (67.8%) sought the
environmental information in the annual reports, whereas only 24.1% of the preparers disclosed
this information in their annual reports, and fewer had plans of doing so in the future.
7.9 HOW ENVIRONMENTAL REPORTS WERE USED
7.9.1 Users' perceptions on how environmental reports were used
Bearing in mind that the ultimate test for usefulness of environmental information is its impact on
decision-making (Dierkes & Antal, 1985:30), users were asked to indicate the purpose for which
they used the environmental reports read. To this end, users were required to indicate their degree
of agreement or disagreement with seven statements. A five point likert scale was used with
weightings of one for strongly disagree, two for disagree, three for neutral, four for agree and five
for strongly agree. Therefore the closer the mean was to five, the more the users agreed with a
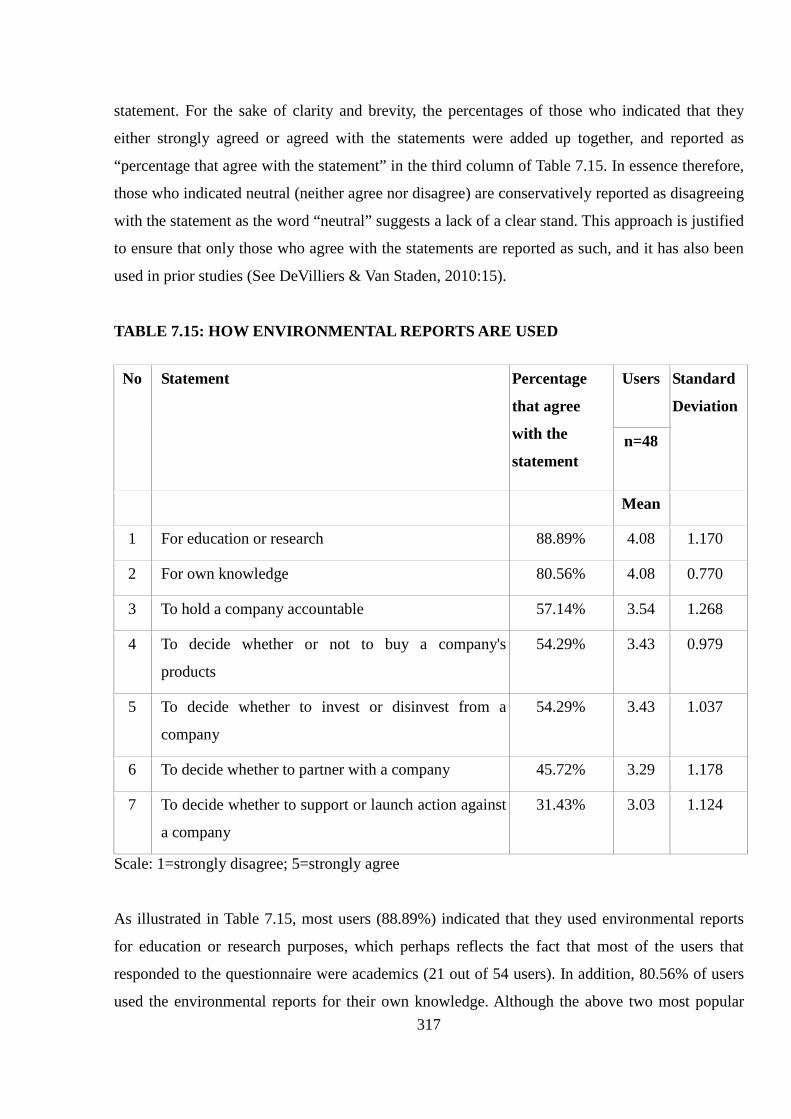
317
statement. For the sake of clarity and brevity, the percentages of those who indicated that they
either strongly agreed or agreed with the statements were added up together, and reported as
“percentage that agree with the statement” in the third column of Table 7.15. In essence therefore,
those who indicated neutral (neither agree nor disagree) are conservatively reported as disagreeing
with the statement as the word “neutral” suggests a lack of a clear stand. This approach is justified
to ensure that only those who agree with the statements are reported as such, and it has also been
used in prior studies (See DeVilliers & Van Staden, 2010:15).
TABLE 7.15: HOW ENVIRONMENTAL REPORTS ARE USED
No Statement Percentage
that agree
with the
statement
Users Standard
Deviation
n=48
Mean
1 For education or research 88.89% 4.08 1.170
2 For own knowledge 80.56% 4.08 0.770
3 To hold a company accountable 57.14% 3.54 1.268
4 To decide whether or not to buy a company's
products
54.29% 3.43 0.979
5 To decide whether to invest or disinvest from a
company
54.29% 3.43 1.037
6 To decide whether to partner with a company 45.72% 3.29 1.178
7 To decide whether to support or launch action against
a company
31.43% 3.03 1.124
Scale: 1=strongly disagree; 5=strongly agree
As illustrated in Table 7.15, most users (88.89%) indicated that they used environmental reports
for education or research purposes, which perhaps reflects the fact that most of the users that
responded to the questionnaire were academics (21 out of 54 users). In addition, 80.56% of users
used the environmental reports for their own knowledge. Although the above two most popular

318
uses of environmental reports do not indicate any action taken by the users after reading the
reports, it still demonstrates the decision-usefulness of environmental reports in informing
opinion, which eventually could result into action. For instance, the research output of academics
could be used to establish the best practice against which companies’ environmental
performance/reporting could be gauged and appropriate action taken against companies perceived
to be underperforming or underreporting.
Table 7.15 also shows that 57.14% of users indicated that they used environmental reports as
members of the public to hold companies accountable. Indeed, according to Jollands, Akroyd and
Sawabe (2012), accountability requires that companies provide decision-useful information to
enable the stakeholders to decide whether the companies are meeting the stakeholders' ever
changing expectations. The foregoing is consistent with the notion that the accountability role of
accounting information has been encapsulated by the decision-usefulness objective, as
information that is decision-useful is also able to discharge accountability (FASB, 2008:11;
Schoonraad, 2004:65).
The decision-usefulness of accounting information is more pronounced when action is taken
based on the information, than when no action results (Dierkes & Antal, 1985:30). As far as the
use of environmental reports for taking action is concerned, 54.29% of users indicated that they
used the reports to decide whether to buy a company's products or not. A similar percentage of
users indicated that they used the reports to decide whether to invest or disinvest from a company.
Of the users, 45.72% indicated that they used the environmental reports to decide whether or not
to partner with a company. Only 31.43% of users indicated that they used the environmental
reports to decide whether or not to support or launch action against a company.
The above results correspond to the findings of the prior studies documented in literature (Danatas
& Gadenne, 2004; De Villiers & Van Staden, 2010a; De Villiers & Van Staden, 2010b; KPMG &
SustainAbility, 2008; O’Dwyer et al., 2004; Solomon & Solomon, 2006; Taib, 2005; Til,t 1994),
all which indicated that environmental reports were used for different purposes by different users.
The above results however contrast the findings of some prior studies (BiE 1994; Campbell &
Slack 2008; Deegan & Rankin, 2004; European commission, 2011b), which found that
environmental disclosures were hardly used to inform their investment or disinvestment decisions,
given that they were mostly narrative in nature. The difference between the current study and the

319
latter prior studies can be explained by the fact that with passage of time, environmental reports in
South Africa increasingly contain quantified data that can inform investment decisions that require
numerical data.
7.9.2 Comparison of users' and preparers’ perceptions on how environmental reports were used
by the users
The preparers were also asked to express an opinion on how users used the environmental reports
read, using a criteria similar to the one described above in the first paragraph of section 7.9.1. The
responses of both users and preparers were then ranked according to their mean scores, in a
descending order, and then compared to each other. In addition, T-Tests for equality of means (2-
tailed) were performed to determine whether there were statistically significant differences
between the perceptions of the two groups.
As highlighted in Table 7.16, only two statements on the uses of environmental reports were
ranked equally by both users and preparers. The two statements were, “for own knowledge”
ranked first, and “to decide whether to support or launch action against a company” ranked
seventh. However, the users' mean scores were higher than those of the preparers on both
statements, an indication that users agreed more to the statements than the preparers did.
The ranking of two other statements, namely “to hold a company accountable” and “to decide
whether to partner with a company” was more or less the same, with the users having ranked the
former third, whereas the preparers ranked it second. The users ranked the latter sixth whereas the
preparers ranked it fifth. However, in the case of these two statements, the preparers’ mean scores
were higher than those of users, an indication that preparers agreed more to the statements than
the users did.
The ranking of three statements was different between users and preparers. Users ranked the
statement “for education or research” first, whereas the preparers ranked it fourth. The users also
ranked the statement “to decide whether or not to buy a company's products” fourth whereas the
preparers ranked it sixth. Lastly, users ranked the statement “to decide whether to invest or
disinvest from a company” sixth whereas the preparers ranked it third. Users’ mean scores for the
first two statements in this paragraph were higher than those of preparers, but the reverse was true

320
for the third statement.
TABLE 7.16: COMPARISON OF USERS' AND PREPARERS' PERCEPTIONS ON THE
USE OF ENVIRONMENTAL REPORTS
No Statement Users Rank Preparers Rank Statistical
Significance
of differences n=48 n=42
Mean Mean
1 For education or research 4.08 1 3.42 4 0.001*
2 For own knowledge 4.08 1 3.67 1 0.045*
3 To hold a company accountable 3.54 3 3.68 2 0.602
4 To decide whether or not to buy a
company's products
3.43 4 3.10 6 0.167
5 To decide whether to invest or
disinvest from a company
3.43 5 3.48 3 0.829
6 To decide whether to partner with
a company
3.29 6 3.32 5 0.893
7 To decide whether to support or
launch action against a company
3.03 7 2.87 7 0.566
Scale: 1=strongly disagree; 5=strongly agree
*statistically significant differences (p<0.05) at 95% confidence level
The T-Tests for equality of means (2-tailed) revealed two statistically significant differences
(p<0.05) in the perceptions of users and preparers with regard to the use of environmental reports
for education or research, and for own knowledge. Given that these two uses were the most
popular among users, significant differences regarding these two suggest the existence of an
expectation gap. The gap could undermine the decision-usefulness of the environmental reports,
as it suggests that preparers may be preparing the reports in a manner that renders them unsuitable
for the intended use by the users. The above results are in line with the findings of the earlier prior
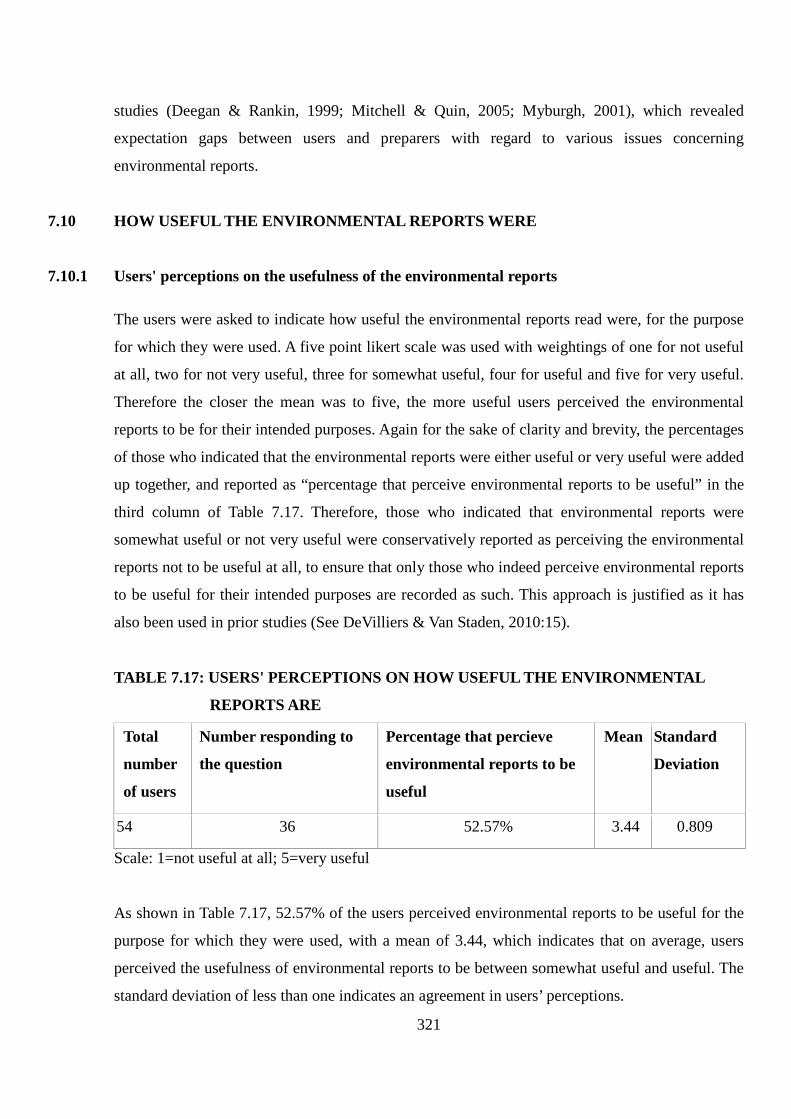
321
studies (Deegan & Rankin, 1999; Mitchell & Quin, 2005; Myburgh, 2001), which revealed
expectation gaps between users and preparers with regard to various issues concerning
environmental reports.
7.10 HOW USEFUL THE ENVIRONMENTAL REPORTS WERE
7.10.1 Users' perceptions on the usefulness of the environmental reports
The users were asked to indicate how useful the environmental reports read were, for the purpose
for which they were used. A five point likert scale was used with weightings of one for not useful
at all, two for not very useful, three for somewhat useful, four for useful and five for very useful.
Therefore the closer the mean was to five, the more useful users perceived the environmental
reports to be for their intended purposes. Again for the sake of clarity and brevity, the percentages
of those who indicated that the environmental reports were either useful or very useful were added
up together, and reported as “percentage that perceive environmental reports to be useful” in the
third column of Table 7.17. Therefore, those who indicated that environmental reports were
somewhat useful or not very useful were conservatively reported as perceiving the environmental
reports not to be useful at all, to ensure that only those who indeed perceive environmental reports
to be useful for their intended purposes are recorded as such. This approach is justified as it has
also been used in prior studies (See DeVilliers & Van Staden, 2010:15).
TABLE 7.17: USERS' PERCEPTIONS ON HOW USEFUL THE ENVIRONMENTAL
REPORTS ARE
Total
number
of users
Number responding to
the question
Percentage that percieve
environmental reports to be
useful
Mean Standard
Deviation
54 36 52.57% 3.44 0.809
Scale: 1=not useful at all; 5=very useful
As shown in Table 7.17, 52.57% of the users perceived environmental reports to be useful for the
purpose for which they were used, with a mean of 3.44, which indicates that on average, users
perceived the usefulness of environmental reports to be between somewhat useful and useful. The
standard deviation of less than one indicates an agreement in users’ perceptions.

322
The above results concur with the findings of prior studies (KPMG & SustainAbility, 2008:11;
Deegan & Rankin, 2004), which found that sustainability/environmental reports were perceived to
be decision- useful by users. However, the above results differ from the findings of other prior
studies (Campbell & Slack, 2008:05; Miller, 2012:01; O’Dwyer et al.,, 2004:01; Wong,
2011:266), which found that non-financial/sustainability reports were not decision-useful as they
were not quantified, and that they were perceived to lack a stakeholder engagement and feedback
mechanism, sufficiency and credibility.
The difference between the current study's results and the findings of the prior studies above could
be due to the differences in the type of respondents sampled. Most of the respondents of the prior
studies whose findings contradict the results of the current study were financial stakeholders or
representatives of environmental NGOs, whereas the respondents of the current study, are a
heterogeneous group comprising three different types of users (Academics, ethical investors,
environmental NGOs). Financial stakeholders who typically need numerical data that can
influence a financial forecast, may not find predominantly narrative sustainability reports to be
decision-useful as such reports are perceived to lack the ability to influence a financial forecast
(Campbell & Slack, 2008:05). On the other hand, NGOs may not reveal their true perception of
decision-usefulness of sustainability reports as they have vested interest in answering questions in
a particular way, to influence public opinion towards certain objectives. Thus, they tend to answer
questionnaires in a manner that supports their existing prejudices (Deegan & Rankin, 1997:571).
7.10.2 Preparers’ perceptions on how useful environmental reports were for the purpose for which
they are used
Using the same criteria described above in the first paragraph of section 7.10.1, the preparers were
also asked to express an opinion on how useful the environmental reports are to the users for
various purposes. For the sake of clarity and brevity, the percentages of those who indicated that
the environmental reports were either useful or very useful were added up together, and reported
as “percentage that perceive environmental reports to be useful” in the fourth column of Table
7.18. Therefore, those who indicated that environmental reports were somewhat useful or not very
useful are conservatively reported as perceiving the environmental reports not to be useful at all,
to ensure that only those who indeed perceive environmental reports to be useful for their intended
purposes are recorded as such. This approach is justified as it has also been used in prior studies
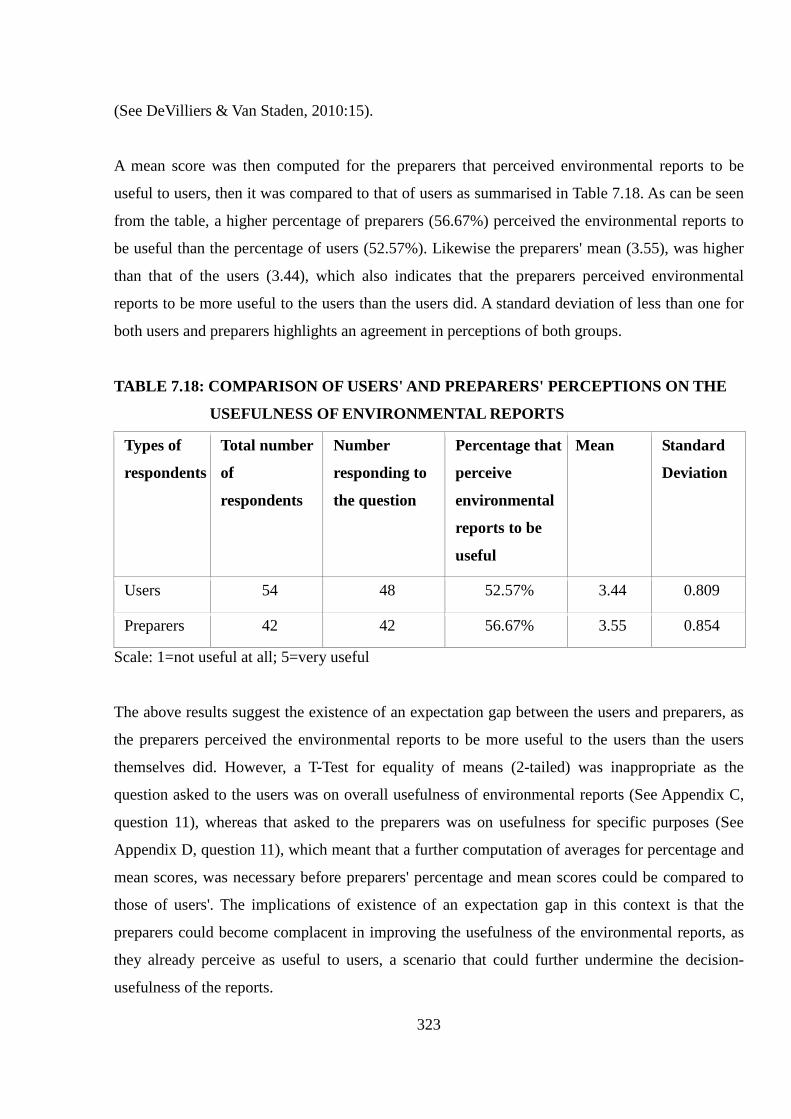
323
(See DeVilliers & Van Staden, 2010:15).
A mean score was then computed for the preparers that perceived environmental reports to be
useful to users, then it was compared to that of users as summarised in Table 7.18. As can be seen
from the table, a higher percentage of preparers (56.67%) perceived the environmental reports to
be useful than the percentage of users (52.57%). Likewise the preparers' mean (3.55), was higher
than that of the users (3.44), which also indicates that the preparers perceived environmental
reports to be more useful to the users than the users did. A standard deviation of less than one for
both users and preparers highlights an agreement in perceptions of both groups.
TABLE 7.18: COMPARISON OF USERS' AND PREPARERS' PERCEPTIONS ON THE
USEFULNESS OF ENVIRONMENTAL REPORTS
Types of
respondents
Total number
of
respondents
Number
responding to
the question
Percentage that
perceive
environmental
reports to be
useful
Mean Standard
Deviation
Users 54 48 52.57% 3.44 0.809
Preparers 42 42 56.67% 3.55 0.854
Scale: 1=not useful at all; 5=very useful
The above results suggest the existence of an expectation gap between the users and preparers, as
the preparers perceived the environmental reports to be more useful to the users than the users
themselves did. However, a T-Test for equality of means (2-tailed) was inappropriate as the
question asked to the users was on overall usefulness of environmental reports (See Appendix C,
question 11), whereas that asked to the preparers was on usefulness for specific purposes (See
Appendix D, question 11), which meant that a further computation of averages for percentage and
mean scores, was necessary before preparers' percentage and mean scores could be compared to
those of users'. The implications of existence of an expectation gap in this context is that the
preparers could become complacent in improving the usefulness of the environmental reports, as
they already perceive as useful to users, a scenario that could further undermine the decision-
usefulness of the reports.

324
The above results are consistent with the finding of Haque et al., 2013:18), who found low levels
of disclosure of climate change information, as compared to what users expected. Consistent with
the conceptual frameworks (FASB, 2010:21; IASB, 2010:65), Haque et al. (2013:18) attributed
their finding partly to perceived higher costs of producing the information relative to mostly
unquantifiable benefits derived.
7.11 PERCEPTION OF THE QUALITY OF ENVIRONMENTAL REPORTS
7.11.1 Users' perception of the quality of environmental reports read
To gauge users' perception of the quality (decision-usefulness) of environmental reports read, they
were asked to indicate the extent to which they agreed with six statements on relevance,
reliability, comparability, understandability, timeliness and verifiability of the reports that they had
read in the past 12 months. A five point likert scale was used with weightings of one for strongly
disagree, two for disagree, three for neutral, four for agree and five for strongly agree. Therefore
the closer the mean was to 5, the more users agreed with the statement. For the sake of clarity and
brevity, the percentages of those who indicated that they either strongly agreed or agreed with the
statements were added up together, and reported as “percentage that agree with the statement” in
the third column of Table 7.19a.
In essence therefore, those who indicated neutral (neither agree nor disagree) are conservatively
reported as disagreeing with the statement as the word “neutral” suggests a lack of a clear stand.
This approach is justified because it ensures that only those who outrightly agree with the
statements are reported as such, and it has also been used in prior studies (See DeVilliers & Van
Staden 2010:15).
As summarised in Table 7.19a, most users (62.86%) felt that the environmental reports they had
read were understandable. Likewise 61.11% of users felt that the reports they had read were
relevant. However, only 37.14% of users felt that the reports they had read were reliable which is
also consistent with the notion of a lingering trust deficit among users with regard to companies'
activities and reporting practices (Mckay, 2013:01). Only 37.14% of users felt that the reports they
had read were timely. Worse still, only 14.29% felt that the reports they had read were verifiable,
even more worse was the fact that only 8.57% of the users felt that the reports they had read were

325
comparable. The standard deviations of less than one for all the six statements indicate agreement
in users' perceptions.
The results in the previous paragraph are somewhat consistent with the earlier results of the
content analysis phase of the study shown in the last paragraph of section 6.8.2, which revealed
that on average environmental reports produced by South African companies were more relevant
and understandable, than they were timely, reliable (verifiable), and comparable. The preceding
results are consistent to some extent with those of Tilt (1994), who found that some forms of
sustainability disclosure media were perceived by environmental NGOs to be easier to understand
than others.
TABLE 7.19A: USERS' PERCEPTION OF THE QUALITY OF ENVIRONMENTAL
REPORTS READ
No Statement Percentage
that agree
with the
statement
Rank Users Standard
Deviation
n=48
Mean
1 The environmental reports were
understandable
62.86% 1 3.57 0.698
2 The environmental reports were relevant 61.11% 2 3.56 0.695
3 The environmental reports were reliable 37.14% 3 3.17 0.785
4 The environmental reports were timely 37.14% 3 3.20 0.797
5 The environmental reports were verifiable 14.29% 5 2.71 0.860
6 The environmental reports were comparable 8.57% 6 2.71 0.667
Scale: 1=strongly disagree; 5=strongly agree
The results also concur with the findings of KPMG and SustainAbility (2008), Danatas and
Gadenne (2004:02; 11), who found that users perceived sustainability disclosures to be relevant to
their needs, but that the disclosures were insufficient, untimely, and of low reliability given their
over-emphasis on positive information whereas omitting negative disclosures. Likewise the above
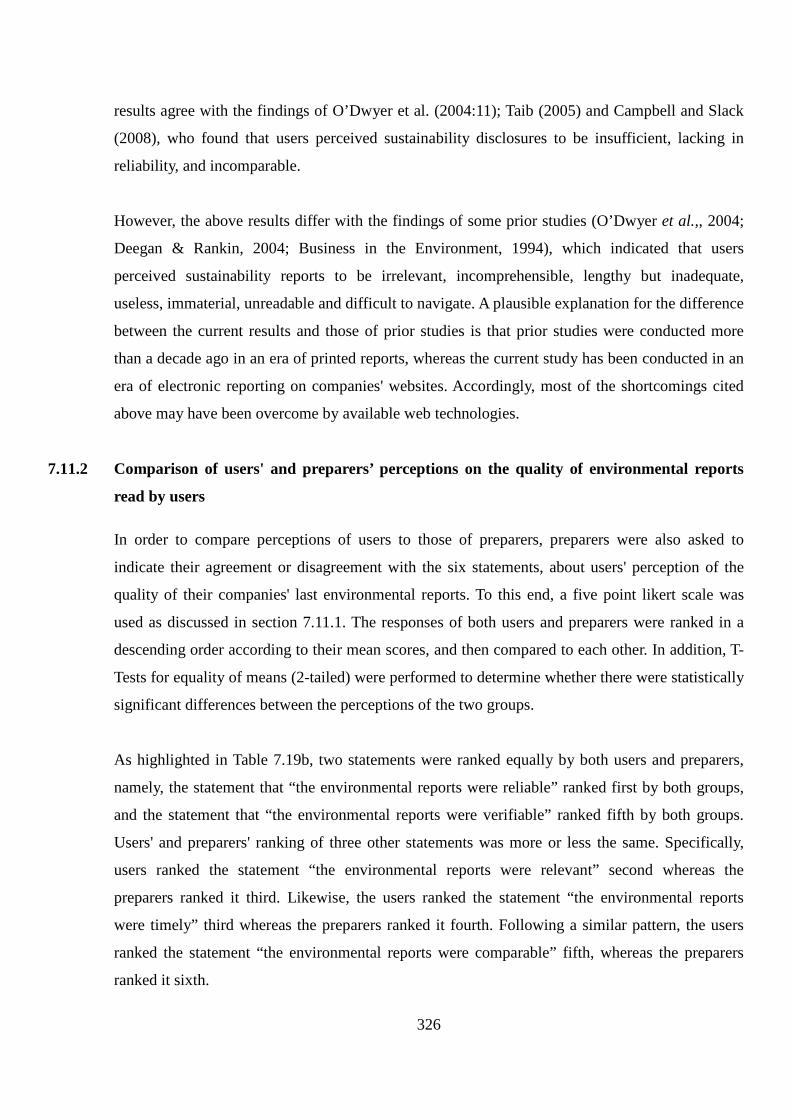
326
results agree with the findings of O’Dwyer et al. (2004:11); Taib (2005) and Campbell and Slack
(2008), who found that users perceived sustainability disclosures to be insufficient, lacking in
reliability, and incomparable.
However, the above results differ with the findings of some prior studies (O’Dwyer et al.,, 2004;
Deegan & Rankin, 2004; Business in the Environment, 1994), which indicated that users
perceived sustainability reports to be irrelevant, incomprehensible, lengthy but inadequate,
useless, immaterial, unreadable and difficult to navigate. A plausible explanation for the difference
between the current results and those of prior studies is that prior studies were conducted more
than a decade ago in an era of printed reports, whereas the current study has been conducted in an
era of electronic reporting on companies' websites. Accordingly, most of the shortcomings cited
above may have been overcome by available web technologies.
7.11.2 Comparison of users' and preparers’ perceptions on the quality of environmental reports
read by users
In order to compare perceptions of users to those of preparers, preparers were also asked to
indicate their agreement or disagreement with the six statements, about users' perception of the
quality of their companies' last environmental reports. To this end, a five point likert scale was
used as discussed in section 7.11.1. The responses of both users and preparers were ranked in a
descending order according to their mean scores, and then compared to each other. In addition, T-
Tests for equality of means (2-tailed) were performed to determine whether there were statistically
significant differences between the perceptions of the two groups.
As highlighted in Table 7.19b, two statements were ranked equally by both users and preparers,
namely, the statement that “the environmental reports were reliable” ranked first by both groups,
and the statement that “the environmental reports were verifiable” ranked fifth by both groups.
Users' and preparers' ranking of three other statements was more or less the same. Specifically,
users ranked the statement “the environmental reports were relevant” second whereas the
preparers ranked it third. Likewise, the users ranked the statement “the environmental reports
were timely” third whereas the preparers ranked it fourth. Following a similar pattern, the users
ranked the statement “the environmental reports were comparable” fifth, whereas the preparers
ranked it sixth.

327
TABLE 7.19B: COMPARISON OF USERS' AND PREPARERS’ PERCEPTIONS ON
THE QUALITY OF ENVIRONMENTAL REPORTS READ BY USERS
No Statement Users Rank Preparers Rank Statistical
Significance of
differences n=48 n=42
Mean Mean
1 The environmental reports were
understandable
3.57 1 3.93 1 0.028*
2 The environmental reports were
relevant
3.56 2 3.80 3 0.177
3 The environmental reports were
timely
3.20 3 3.77 4 0.004*
4 The environmental reports were
reliable
3.17 4 3.83 2 0.001*
5 The environmental reports were
verifiable
2.71 5 3.73 5 0.000*
6 The environmental reports were
comparable
2.71 5 3.63 6 0.000*
Scale: 1=strongly disagree; 5=strongly agree
*statistically significant differences (p<0.05) at 95% confidence level
Interestingly, it is only with regard to ranking the statement that “the environmental reports were
reliable” that users' ranking differed from that of preparers', as users ranked the statement fourth
whereas the preparers ranked it second. However, a closer examination of Table 7.19b reveals that
preparers’ means were higher than those of users' for all the statements, an indication that they
agreed more with the statements than the users did. Indeed the T-Tests for equality of means (2-
tailed) revealed statistically significant differences (p<0.05) in the perceptions of the users and
preparers in five of the six statements at 95% confidence levels. The foregoing suggests the
existence of an expectation gap that could undermine the decision-usefulness of environmental
reports. The above results are consistent with the finding of Haque et al., (2013:18), cited earlier.

328
7.12 SATISFACTION WITH THE QUALITATIVE ATTRIBUTES OF ENVIRONMENTAL
REPORTS
7.12.1 Users' satisfaction with the qualitative attributes of the environmental reports read
Users were asked to indicate how satisfied they were with regard to relevance, reliability,
comparability, understandability, timeliness and verifiability of the environmental reports they had
read in the past 12 months. A five point likert scale was used with weightings of one for not
satisfied at all, two for slightly satisfied, three for moderately satisfied, four for very satisfied, and
five for extremely satisfied. Therefore the closer the mean was to five, the more satisfied the users
were with a qualitative attribute of an environmental report.
For the sake of clarity and conciseness, the percentages of those who indicated that they were
either very satisfied or extremely satisfied, were added up together, and reported as “percentage of
users satisfied with a qualitative attribute” in the third column of Table 7.20. In essence therefore,
those who indicated that they were moderately satisfied or slightly satisfied were conservatively
reported as not satisfied at all, as the words “moderately satisfied” and “slightly satisfied” imply
some reservation with regard to the level of satisfaction. This approach is justified to ensure that
only those who were completely satisfied by a qualitative attribute of an environmental report are
reported as such. Besides, the approach has also been used in prior studies (See for example
DeVilliers & Van Staden, 2010:15).
Overall, Table 7.20 depicts a low level of satisfaction of users with the qualitative attributes of the
environmental reports read in the past 12 months. Only 40% of users indicated that they were
satisfied with the understandability of environmental reports read, whereas 37.14% of users
indicated that they were satisfied with the relevance of environmental reports read. Only 22.86%
of users were satisfied with reliability of the reports read, whereas 20% were satisfied with the
timeliness of the reports. Quite discouragingly, only 5.71% of the users were satisfied with the
comparability of the environmental reports. The standard deviation of less than one for responses
to all the six attributes suggests agreement among the users on their level of satisfaction with the
reports read.

329
TABLE 7.20: USERS' SATISFACTION WITH THE QUALITATIVE ATTRIBUTES OF
ENVIRONMENTAL REPORTS
No Qualitative attribute of an
environmental report
Percentage of
users satisfied
with a qualitative
attribute
Rank Users Standard
Deviation
n=48
Mean
1 Understandability 40.00% 1 3.26 0.886
2 Relevance 37.14% 2 3.06 0.906
3 Reliability 22.86% 3 2.80 0.994
4 Timeliness 20.00% 4 2.89 0.993
5 Verifiability 11.43% 5 2.46 0.980
6 Comparability 5.71% 6 2.46 0.780
Scale: 1=not satisfied at all; 5=extremely satisfied
The preceding results are consistent with the findings of the prior studies (Campbell & Slack,
2008; Danatas & Gadenne, 2004; European Commission, 2011b; Mitchell & Hill, 2010; O’Dwyer
et al., 2004; Solomon & Solomon, 2006; Tilt, 1994), which unanimously indicated that the users
were dissatisfied with the relevance, reliability, comparability, timeliness and understandability of
the environmental reports.
7.12.2 Comparison of users' and preparers’ perceptions regarding user's satisfaction with the
qualitative characteristics of the environmental reports read
Using the criteria described above in the first paragraph of section 7.12.1, the preparers were also
asked to indicate their perceptions on users' satisfaction with the relevance, reliability,
comparability, timeliness, understandability and verifiability of their company's last environmental
report. The responses of both users and preparers were then ranked according to mean scores, in a
descending order, and then compared to each other. In addition, T-Tests for equality of means (2-
tailed) were performed to determine whether there were statistically significant differences
between the perceptions of the two groups.

330
TABLE 7.21: COMPARISON OF USERS' AND PREPARERS’ PERCEPTIONS ON
USERS' SATISFACTION WITH THE QUALITATIVE ATTRIBUTES
OF ENVIRONMENTAL REPORTS READ
No Qualitative attribute of an
environmental report
Users Rank Preparer Rank Statistical
Significance
of differences n=48 n=42
Mean Mean
1 Understandability 3.26 1 3.77 1 0.020*
2 Relevance 3.06 2 3.63 4 0.008*
3 Timeliness 2.89 3 3.67 3 0.001*
4 Reliability 2.80 4 3.70 2 0.000*
5 Verifiability 2.46 5 3.60 5 0.000*
6 Comparability 2.46 5 3.37 6 0.000*
Scale: 1=not satisfied at all; 5=extremely satisfied
*statistically significant differences (p<0.05) at 95% confidence level
As shown in Table 7.21, both users and preparers ranked users' satisfaction with three qualitative
characteristics of environmental reports equally, and these are: understandability, ranked first,
timeliness, ranked third, and verifiability ranked fifth. In addition, users' satisfaction with
comparability of the reports was ranked more or less the same, by both groups as users ranked this
attribute fifth, whereas the preparers ranked it sixth. By contrast, the ranking of the users'
satisfaction with the fundamental attributes of a decision-useful report differed from that of
preparers. Specifically, users ranked satisfaction with relevance of the reports second, whereas the
preparers ranked it fourth. The exact opposite was the case with the ranking of reliability, as users
ranked their satisfaction with this attribute fourth, whereas the preparers ranked this attribute
second.
Another notable difference is that the mean scores of responses of preparers' were higher than
those of users on all the six attributes, including those ranked equally by both users and preparers.
This suggests that preparers perceived users to be more satisfied with the six attributes of

331
decision-useful environmental reports than the users themselves did. Indeed the T-Tests for
equality of means (2-tailed) revealed statistically significant differences (p<0.05) in the
perceptions of the users and preparers with regard to users' satisfaction with all the six qualitative
attributes at 95% confidence levels, suggesting the existence of an expectation gap between users
and preparers.
A possible explanation for the differences in perceptions of users and preparers regarding users'
satisfaction with the six attributes of decision-useful environmental reports can be explained using
the cost constraint articulated in the accounting conceptual frameworks (FASB, 2008:31; IASB,
2008:42). Specifically, most of the costs of providing accounting information such as cost of
collecting, processing, assuring and disseminating the information fall initially on the preparers,
whereas the benefits are reaped by both users and preparers (FASB, 2008:31). Users also may
incur costs if the preparers pass on the above mentioned costs to them or in obtaining information,
for instance downloading a PDF report from a company's website. However, users' costs are a
small fraction of the preparers' and in fact it could be deemed to be negligible.
Considering that some of the benefits of providing accounting reports are intangible,
unquantifiable and even questionable, it is probable that preparers will perceive that just about any
information provided is satisfactory, given that the users do not initially contribute to the cost of
providing such information (IASB, 2008:25). Moreover, bearing in mind that higher quality
environmental disclosures increase costs for reporting entities with unclear commensurate
benefits, preparers will be reluctant to divulge such quality information and will thus be inclined
to perceive the current disclosures as satisfactory, and value for money for the company even if
the opposite is true.
7.13 SUGGESTIONS FOR IMPROVEMENT OF THE QUALITY (DECISION- USEFULNESS)
OF ENVIRONMENTAL REPORTS
7.13.1 Users' suggestions for improvement of the quality (decision-usefulness) of environmental
reports read
Users were asked to suggest how the quality of the environmental reports that they had read in the
past 12 months should be improved. Given that this was an open-ended question, a qualitative

332
data analysis approach was deployed using Creswell’s data analysis spiral, as described in Leedy
and Ormrod (2001:161). Each respondents' response was content analysed and any patterns or
trends that the data reflected were assembled together in six groups of meaning units that matched
the qualitative characteristics of decision-useful information, which were then compared to the
findings in prior studies to determine whether they concurred with the literature or not (Leedy &
Ormrod, 2005:136) (See Table 7.22 and Table 7.24).
Nineteen users responded to this question, however, three did not have any suggestions for
improvement and therefore only 16 users’ suggestions are summarised in Table 7.22. Out of the 16
users that provided suggestions on how the quality of environmental reports should be improved,
50% suggested improvements related to the reliability of the reports, most notably independent
verification of the environmental reports.
Just above 31% suggested improvements related to the relevance of the reports. Twenty five
percent of the users suggested improvements related to the comparability of the reports, whereas
about 19% suggested improvements related to understandability and verifiability of the reports.
Only 7% of users suggested an improvement related to timeliness of the reports. What is
noteworthy is that most of users' suggestions for improvement were related to reliability, an
observation that is consistent with the existence of a trust deficit of users on the reporting
activities of South African companies (Mckay, 2013:01).
The preceding results of the current study are consistent with the findings of prior studies
(DeVilliers & Van Staden, 2010a; European Commission, 2011b; Mitchell & Hill, 2010; Taib,
2005; Tilt, 1994), which suggested that the decision-usefulness of sustainability reports could be
improved by mandatory independent assurance and regulation and use of quantified and accurate
indicators, as well as integration of sustainability reports with financial reports.
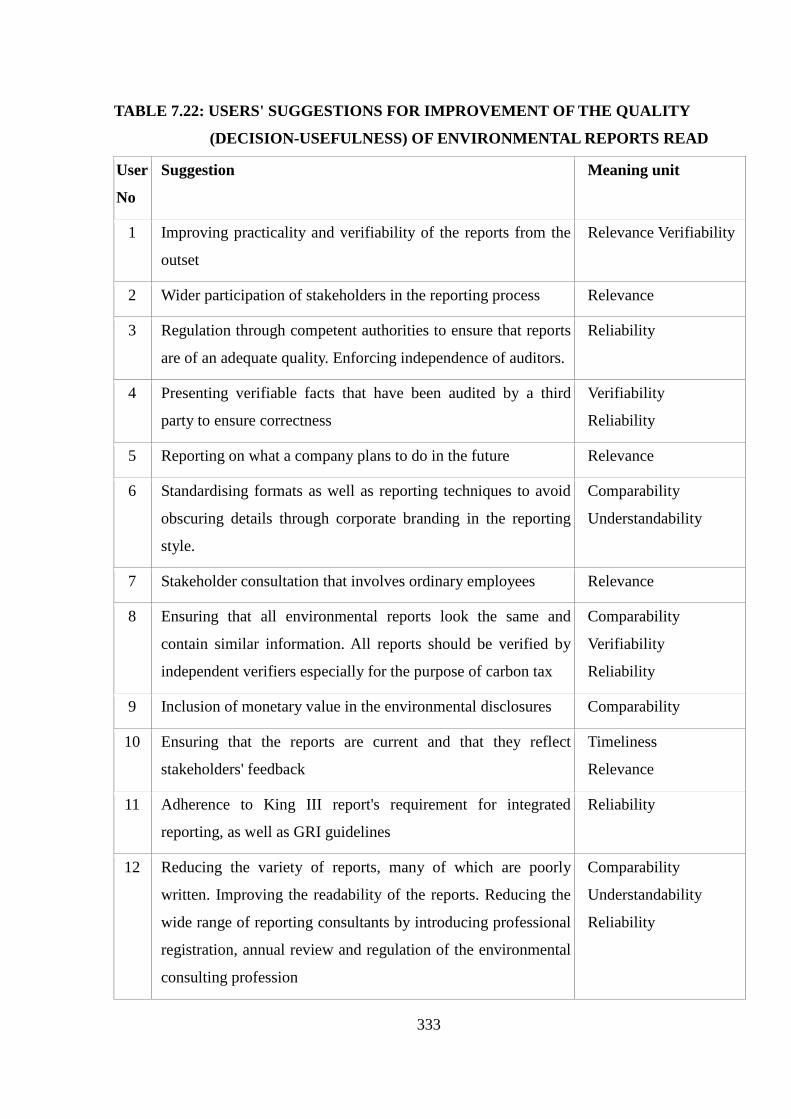
333
TABLE 7.22: USERS' SUGGESTIONS FOR IMPROVEMENT OF THE QUALITY
(DECISION-USEFULNESS) OF ENVIRONMENTAL REPORTS READ
User
No
Suggestion Meaning unit
1 Improving practicality and verifiability of the reports from the
outset
Relevance Verifiability
2 Wider participation of stakeholders in the reporting process Relevance
3 Regulation through competent authorities to ensure that reports
are of an adequate quality. Enforcing independence of auditors.
Reliability
4 Presenting verifiable facts that have been audited by a third
party to ensure correctness
Verifiability
Reliability
5 Reporting on what a company plans to do in the future Relevance
6 Standardising formats as well as reporting techniques to avoid
obscuring details through corporate branding in the reporting
style.
Comparability
Understandability
7 Stakeholder consultation that involves ordinary employees Relevance
8 Ensuring that all environmental reports look the same and
contain similar information. All reports should be verified by
independent verifiers especially for the purpose of carbon tax
Comparability
Verifiability
Reliability
9 Inclusion of monetary value in the environmental disclosures Comparability
10 Ensuring that the reports are current and that they reflect
stakeholders' feedback
Timeliness
Relevance
11 Adherence to King III report's requirement for integrated
reporting, as well as GRI guidelines
Reliability
12 Reducing the variety of reports, many of which are poorly
written. Improving the readability of the reports. Reducing the
wide range of reporting consultants by introducing professional
registration, annual review and regulation of the environmental
consulting profession
Comparability
Understandability
Reliability

334
TABLE 7.22: USERS' SUGGESTIONS FOR IMPROVEMENT OF THE QUALITY
(DECISION-USEFULNESS) OF ENVIRONMENTAL REPORTS READ
(CONT…)
User
No
Suggestion Meaning unit
13 Demonstrating the integration of environmental reporting with
other core aspects of a business, such as financial and social
aspects
Reliability
14 Eliminating bias or subjective reporting as the reports tend to
reflect only positive aspects of a reporting entity, given that
editorial control lies with the companies' management
Reliability
15 Reducing the length, difficulty to download, and sizes of files
to allow readability and accessibility of environmental reports.
Understandability
16 By being honest Reliability
7.13.2 Preparers' suggestions for improvement of the quality (decision-usefulness) of their
companies' last environmental report
As with users, preparers were also asked to suggest how the quality of their company's last
environmental report could be improved. Given that this was an open-ended question, a similar
approach to the one used for users, as described in the first paragraph of section 7.13.1 was
adopted, and the results captured in Table 7.23 and further summarised in Table 7.24. Fourteen
preparers responded to the request for suggestions on how to improve the quality of their
company's last environmental reports. Two indicated that they had no suggestions for
improvement.
As illustrated in Table 7.24, of the twelve that provided suggestions, 75% suggested
improvements related to comparability of the reports, whereas about 33% suggested
improvements related to reliability of the reports. A similar percentage suggested improvements
related to the relevance of the reports, whereas about 17% suggested improvements related to the
understandability of the reports. Only 8% of the preparers suggested improvements related to
verifiability and none of the preparers suggested improvements related to timeliness of the reports.

335
TABLE 7.23: PREPARERS' SUGGESTIONS FOR IMPROVEMENT OF THE QUALITY
(DECISION-USEFULNESS) OF THEIR COMPANIES' LAST
ENVIRONMENTAL REPORT
Preparer
Number
Suggestion Meaning unit
1 Widening stakeholder engagement process Relevance
2 Improving the reporting balance between negative and
positive performance
Focussing on materiality
Ensuring a golden thread throughout the reports
Reliability
Relevance
Understandability
3 Providing comparable information of competitors or
industry averages
Comparability
4 Including a reasonable assurance statement in the
reports as opposed to the current practice of including a
limited assurance statement
Greater focus on industry-wide benchmarking
Reliability
Comparability
5 Including targets to allow monitoring of progress and
for comparability purposes
Comparability
6 Providing more specific targets. Comparability
7 Providing quantitative information and set targets Reliability
Comparability
8 Providing more specific targets, reporting performance
against these targets more extensively and thoroughly
Making use of well documented quantitative measures
Greater transparency and response to stakeholders’
questions
Comparability
Verifiability
Relevance
9 Comparison of performance with industry averages and
benchmarking against best international practice
Comparability
10 More robust measurement of the key environmental
measures
Comparability/
Reliability
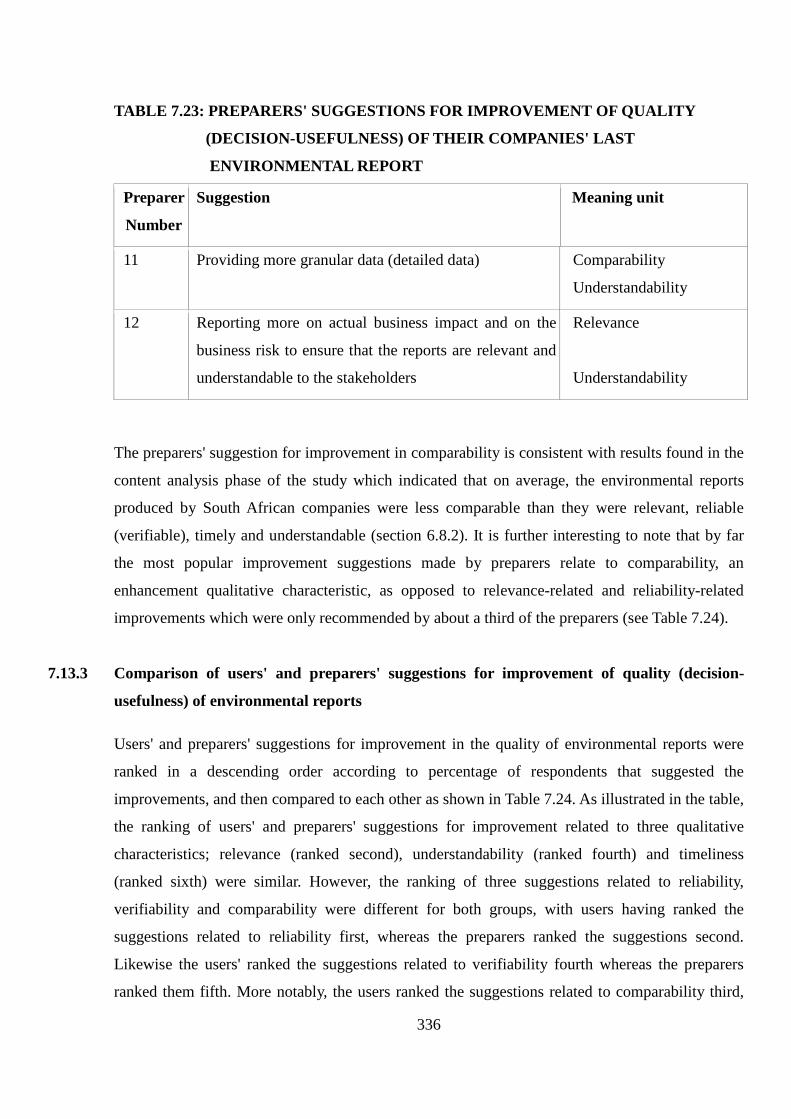
336
TABLE 7.23: PREPARERS' SUGGESTIONS FOR IMPROVEMENT OF QUALITY
(DECISION-USEFULNESS) OF THEIR COMPANIES' LAST
ENVIRONMENTAL REPORT
Preparer
Number
Suggestion Meaning unit
11 Providing more granular data (detailed data) Comparability
Understandability
12 Reporting more on actual business impact and on the
business risk to ensure that the reports are relevant and
understandable to the stakeholders
Relevance
Understandability
The preparers' suggestion for improvement in comparability is consistent with results found in the
content analysis phase of the study which indicated that on average, the environmental reports
produced by South African companies were less comparable than they were relevant, reliable
(verifiable), timely and understandable (section 6.8.2). It is further interesting to note that by far
the most popular improvement suggestions made by preparers relate to comparability, an
enhancement qualitative characteristic, as opposed to relevance-related and reliability-related
improvements which were only recommended by about a third of the preparers (see Table 7.24).
7.13.3 Comparison of users' and preparers' suggestions for improvement of quality (decision-
usefulness) of environmental reports
Users' and preparers' suggestions for improvement in the quality of environmental reports were
ranked in a descending order according to percentage of respondents that suggested the
improvements, and then compared to each other as shown in Table 7.24. As illustrated in the table, the ranking of users' and preparers' suggestions for improvement related to three qualitative
characteristics; relevance (ranked second), understandability (ranked fourth) and timeliness
(ranked sixth) were similar. However, the ranking of three suggestions related to reliability,
verifiability and comparability were different for both groups, with users having ranked the
suggestions related to reliability first, whereas the preparers ranked the suggestions second.
Likewise the users' ranked the suggestions related to verifiability fourth whereas the preparers
ranked them fifth. More notably, the users ranked the suggestions related to comparability third,
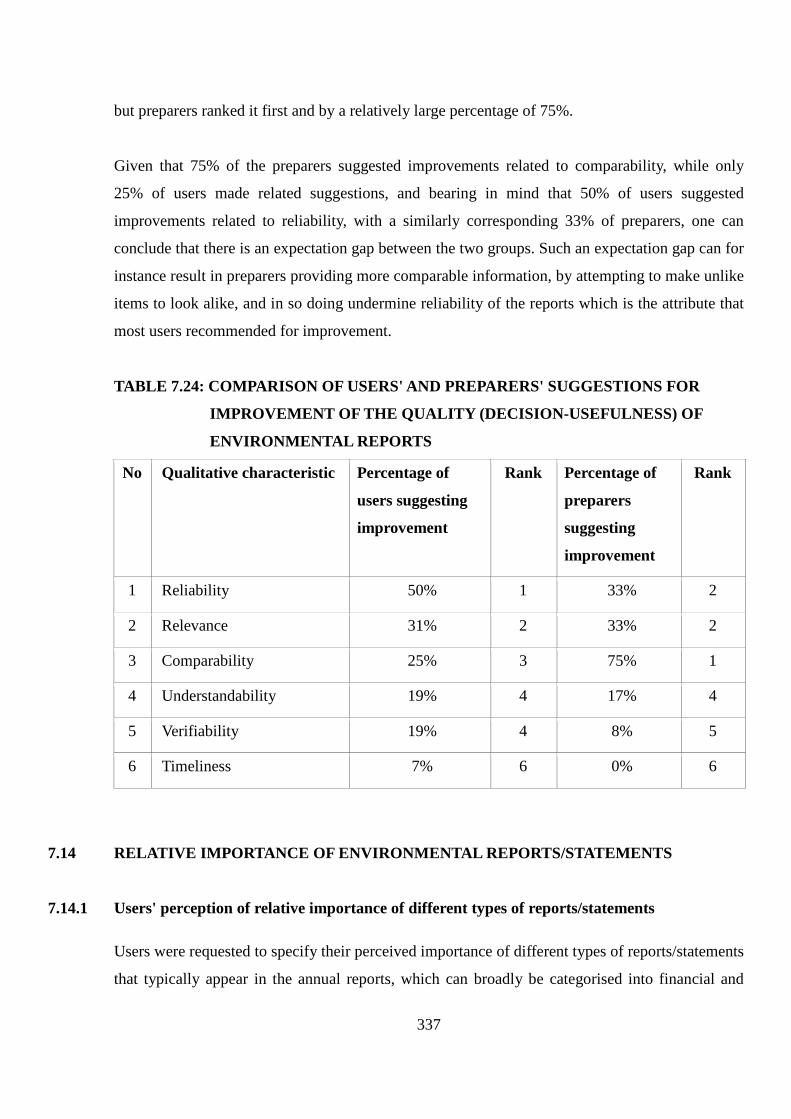
337
but preparers ranked it first and by a relatively large percentage of 75%.
Given that 75% of the preparers suggested improvements related to comparability, while only
25% of users made related suggestions, and bearing in mind that 50% of users suggested
improvements related to reliability, with a similarly corresponding 33% of preparers, one can
conclude that there is an expectation gap between the two groups. Such an expectation gap can for
instance result in preparers providing more comparable information, by attempting to make unlike
items to look alike, and in so doing undermine reliability of the reports which is the attribute that
most users recommended for improvement.
TABLE 7.24: COMPARISON OF USERS' AND PREPARERS' SUGGESTIONS FOR
IMPROVEMENT OF THE QUALITY (DECISION-USEFULNESS) OF
ENVIRONMENTAL REPORTS
No Qualitative characteristic Percentage of
users suggesting
improvement
Rank Percentage of
preparers
suggesting
improvement
Rank
1 Reliability 50% 1 33% 2
2 Relevance 31% 2 33% 2
3 Comparability 25% 3 75% 1
4 Understandability 19% 4 17% 4
5 Verifiability 19% 4 8% 5
6 Timeliness 7% 6 0% 6
7.14 RELATIVE IMPORTANCE OF ENVIRONMENTAL REPORTS/STATEMENTS
7.14.1 Users' perception of relative importance of different types of reports/statements
Users were requested to specify their perceived importance of different types of reports/statements
that typically appear in the annual reports, which can broadly be categorised into financial and
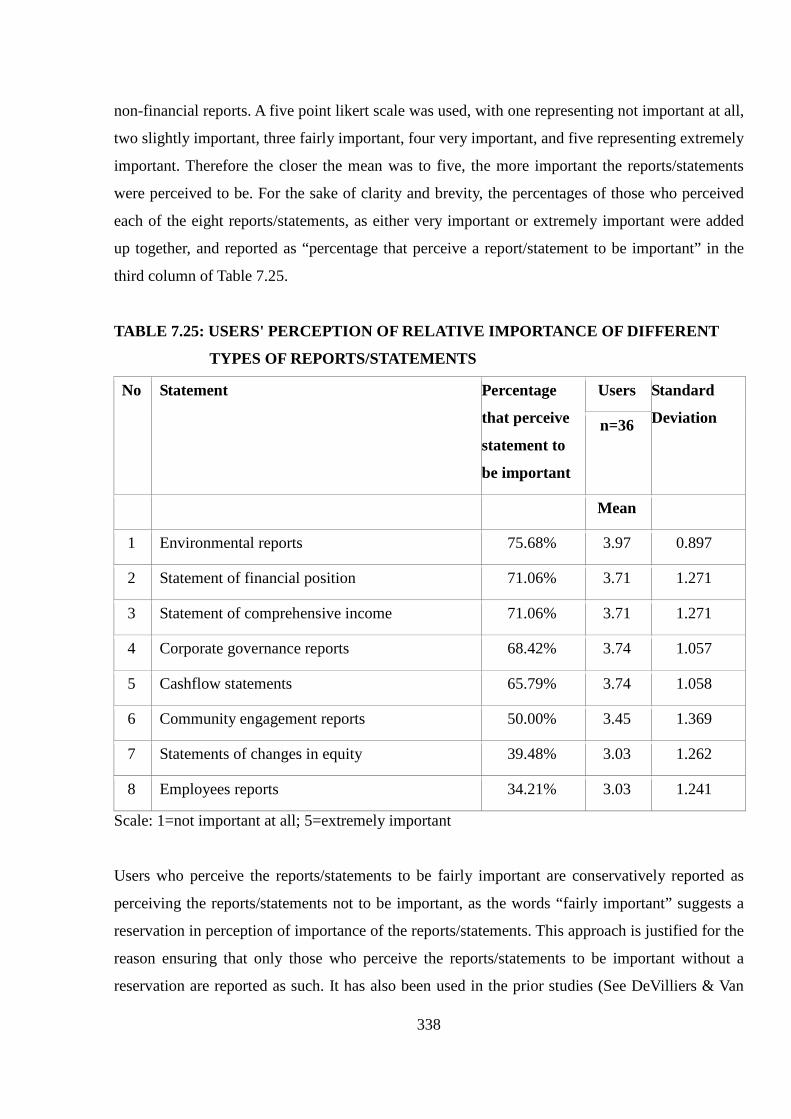
338
non-financial reports. A five point likert scale was used, with one representing not important at all,
two slightly important, three fairly important, four very important, and five representing extremely
important. Therefore the closer the mean was to five, the more important the reports/statements
were perceived to be. For the sake of clarity and brevity, the percentages of those who perceived
each of the eight reports/statements, as either very important or extremely important were added
up together, and reported as “percentage that perceive a report/statement to be important” in the
third column of Table 7.25.
TABLE 7.25: USERS' PERCEPTION OF RELATIVE IMPORTANCE OF DIFFERENT
TYPES OF REPORTS/STATEMENTS
No Statement Percentage
that perceive
statement to
be important
Users Standard
Deviation n=36
Mean
1 Environmental reports 75.68% 3.97 0.897
2 Statement of financial position 71.06% 3.71 1.271
3 Statement of comprehensive income 71.06% 3.71 1.271
4 Corporate governance reports 68.42% 3.74 1.057
5 Cashflow statements 65.79% 3.74 1.058
6 Community engagement reports 50.00% 3.45 1.369
7 Statements of changes in equity 39.48% 3.03 1.262
8 Employees reports 34.21% 3.03 1.241
Scale: 1=not important at all; 5=extremely important
Users who perceive the reports/statements to be fairly important are conservatively reported as
perceiving the reports/statements not to be important, as the words “fairly important” suggests a
reservation in perception of importance of the reports/statements. This approach is justified for the
reason ensuring that only those who perceive the reports/statements to be important without a
reservation are reported as such. It has also been used in the prior studies (See DeVilliers & Van
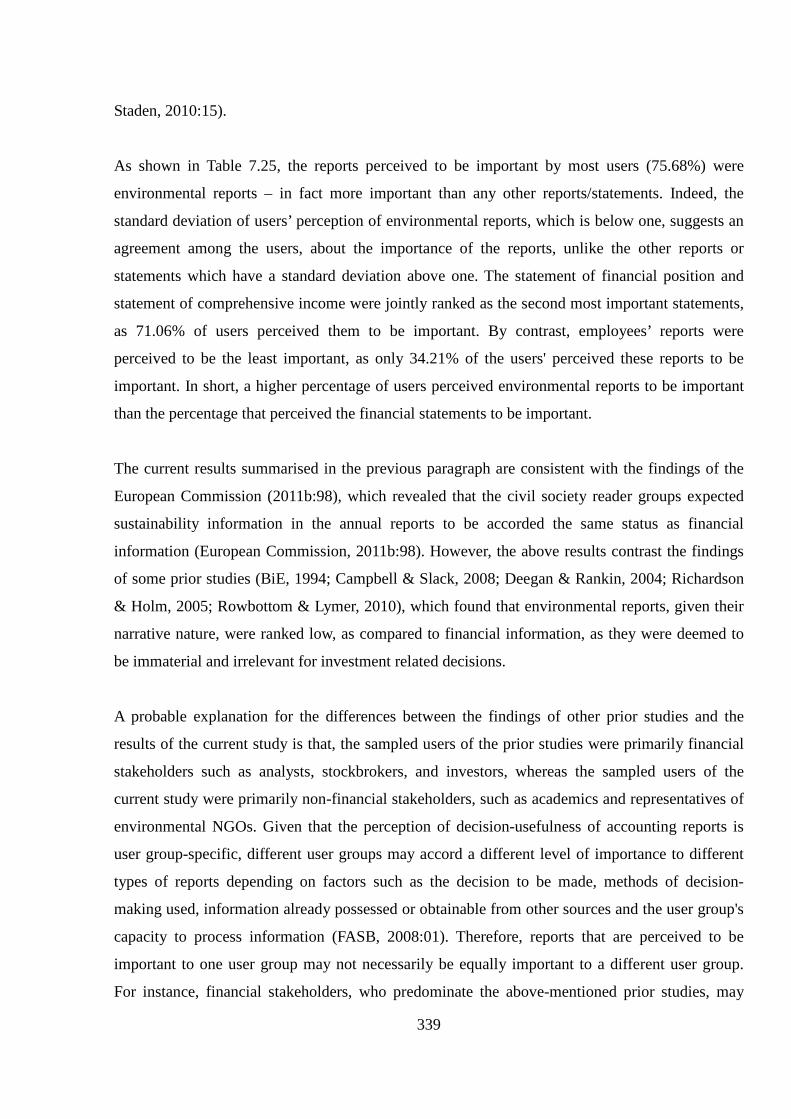
339
Staden, 2010:15).
As shown in Table 7.25, the reports perceived to be important by most users (75.68%) were
environmental reports – in fact more important than any other reports/statements. Indeed, the
standard deviation of users’ perception of environmental reports, which is below one, suggests an
agreement among the users, about the importance of the reports, unlike the other reports or
statements which have a standard deviation above one. The statement of financial position and
statement of comprehensive income were jointly ranked as the second most important statements,
as 71.06% of users perceived them to be important. By contrast, employees’ reports were
perceived to be the least important, as only 34.21% of the users' perceived these reports to be
important. In short, a higher percentage of users perceived environmental reports to be important
than the percentage that perceived the financial statements to be important.
The current results summarised in the previous paragraph are consistent with the findings of the
European Commission (2011b:98), which revealed that the civil society reader groups expected
sustainability information in the annual reports to be accorded the same status as financial
information (European Commission, 2011b:98). However, the above results contrast the findings
of some prior studies (BiE, 1994; Campbell & Slack, 2008; Deegan & Rankin, 2004; Richardson
& Holm, 2005; Rowbottom & Lymer, 2010), which found that environmental reports, given their
narrative nature, were ranked low, as compared to financial information, as they were deemed to
be immaterial and irrelevant for investment related decisions.
A probable explanation for the differences between the findings of other prior studies and the
results of the current study is that, the sampled users of the prior studies were primarily financial
stakeholders such as analysts, stockbrokers, and investors, whereas the sampled users of the
current study were primarily non-financial stakeholders, such as academics and representatives of
environmental NGOs. Given that the perception of decision-usefulness of accounting reports is
user group-specific, different user groups may accord a different level of importance to different
types of reports depending on factors such as the decision to be made, methods of decision-
making used, information already possessed or obtainable from other sources and the user group's
capacity to process information (FASB, 2008:01). Therefore, reports that are perceived to be
important to one user group may not necessarily be equally important to a different user group.
For instance, financial stakeholders, who predominate the above-mentioned prior studies, may
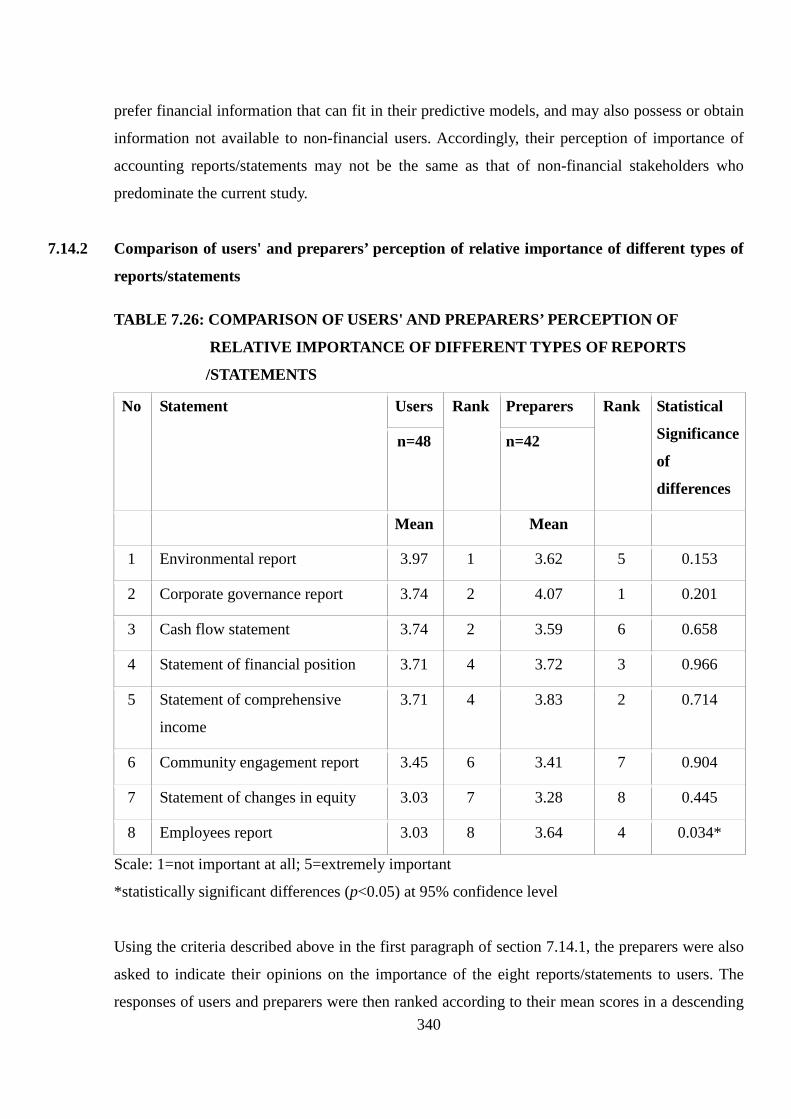
340
prefer financial information that can fit in their predictive models, and may also possess or obtain
information not available to non-financial users. Accordingly, their perception of importance of
accounting reports/statements may not be the same as that of non-financial stakeholders who
predominate the current study.
7.14.2 Comparison of users' and preparers’ perception of relative importance of different types of
reports/statements
TABLE 7.26: COMPARISON OF USERS' AND PREPARERS’ PERCEPTION OF
RELATIVE IMPORTANCE OF DIFFERENT TYPES OF REPORTS
/STATEMENTS
No Statement Users Rank Preparers Rank Statistical
Significance
of
differences
n=48 n=42
Mean Mean
1 Environmental report 3.97 1 3.62 5 0.153
2 Corporate governance report 3.74 2 4.07 1 0.201
3 Cash flow statement 3.74 2 3.59 6 0.658
4 Statement of financial position 3.71 4 3.72 3 0.966
5 Statement of comprehensive
income
3.71 4 3.83 2 0.714
6 Community engagement report 3.45 6 3.41 7 0.904
7 Statement of changes in equity 3.03 7 3.28 8 0.445
8 Employees report 3.03 8 3.64 4 0.034*
Scale: 1=not important at all; 5=extremely important
*statistically significant differences (p<0.05) at 95% confidence level
Using the criteria described above in the first paragraph of section 7.14.1, the preparers were also
asked to indicate their opinions on the importance of the eight reports/statements to users. The
responses of users and preparers were then ranked according to their mean scores in a descending

341
order, and then compared to each other. In addition, T-Tests for equality of means (2-tailed) were
performed to determine whether there were statistically significant differences between the
perceptions of the two groups.
As shown in Table 7.26, the users' and preparers' perception of importance of the eight
reports/statements to the users differed on all reports/statements. Most notable among the
differences was that users ranked environmental reports first, above all financial statements,
whereas the preparers ranked the reports fifth, below primary financial statements such as
statement of financial position and statement of comprehensive income.
Given the differences between users and preparers ranking of the eight reports/statements, one
would have expected the T-Tests for equality of means (2-tailed) to reveal various significant
differences between the views of users and those of preparers. Surprisingly, the T-Tests for
equality of means revealed only one statistically significant difference (p<0.05) in the perceptions
of the users and preparers with regard to the importance of the employees report. Indeed, the users
had ranked this report eighth whereas the preparers had ranked it fourth. Given that the T-Tests
revealed only one significant difference, and that the difference only pertained to employees’
reports, one can conclude that there was no expectation gap between the users and preparers for
all the other reports and statements.
However, given the differences in ranking of the eight reports/statements between the users and
preparers in the current study, its results contrast those of prior studies (Deegan & Rankin,
1999:334; Myburgh, 2001:11; Stainbank & Peebles, 2006:75), which found that both users and
preparers ranked financial statements above environmental reports. In fact, according to Stainbank
and Peebles (2006:75), all the non-financial reports such as environmental reports, employee
reports and corporate governance reports were ranked low by both users and preparers. The
difference between the current study's results and the findings in these earlier studies can be
explained by the difference between the sampled users of the prior studies and the sampled users
in the current study. Specifically, users in earlier prior studies primarily comprised financial
stakeholders such as analysts, stockbrokers, and investors, whereas the sampled users of the
current study primarily comprised non-financial stakeholders such as academics and
representatives of environmental NGOs.
342
Given the perception that decision-usefulness of accounting reports is user group-specific, the
level of importance accorded to different types of information will vary from one user group to
another (FASB, 2008:01). Accordingly, the information perceived to be important by financial
stakeholders (typically will be of financial nature), will be different from the information deemed
important by the non-financial stakeholders (typically of non-financial nature). Since most of the
sampled users in prior studies were financial stakeholders, their preference for financial
information over environmental information should be expected. Likewise, given that most of the
sampled users of the current study were non-financial stakeholders, with a particular interest in
environmental issues, their preference for environmental information over the financial
information should be expected.
7.15 CHAPTER SUMMARY AND CONCLUSION
The broad aim of this study was to determine the decision-usefulness of environmental reports
prepared by South African companies to users of those reports. The findings of the questionnaire
survey phase of the study revealed that an overwhelming majority of users read environmental
reports, and that they preferred that the reports disclose both negative and positive aspects in a
balanced manner, to identify and describe key relevant issues, be specific and contain accurate
information. In addition, most users preferred future oriented information, which identifies and
addresses key stakeholders and their concerns. In short, users’ needs were more inclined towards
more reliable and relevant environmental information, the two fundamental attributes of decision-
useful accounting information.
As to the extent in which users read the environmental reports is concerned, the findings of the
current study reveal that environmental reports were more often read using lesser effective reading
techniques such as scanning, skimming and exploratory reading. The preference of these
techniques is likely to undermine the understandability of the information read from the
environmental reports. The findings of the current study further revealed that the reports read were
mostly read from the PDF integrated annual reports on companies' websites. The latter could
explain the preference of the above-mentioned reading techniques, given the lengthy nature of
PDF integrated annual reports. In general, users' also read more often from websites than from the
print medium, given the accessibility, time-saving and cost effective nature of the websites.
343
In relation to whether users employ the environmental reports for making decisions, the findings
of this study reveal that the reports were mostly used for education or research, and for users' own
knowledge. In addition, the findings revealed that the reports were used to hold companies
accountable, to decide whether or not to buy a company's products, as well as whether to decide to
invest or divest from a company. Only a minority of users used environmental reports to decide
whether to partner with a company, or even to decide whether to support or launch action against
a company. In short, environmental reports were not used as much for making decisions as they
were used for research, own knowledge or for accountability.
Although most users perceived environmental reports to be useful, understandable and relevant,
the findings of the study revealed that most users were dissatisfied by the reports' reliability,
verifiability, timeliness, and comparability. However, when asked to make suggestions for
improvement, most users suggested various ways through which the reliability of the
environmental reports should be improved. In short, users were more concerned with the
reliability of the environmental reports, an aspect that could undermine the decision-usefulness of
the environmental reports.
With regard to the relative importance of environmental reports compared to other types of
reports, the findings of the current study reveal that most users perceived environmental reports to
be relatively more important than even financial statements, such as the statement of financial
position and the statement of comprehensive income. The fact that environmental reports were
perceived to be even more important than the financial statements perhaps suggests the need for
the decision-usefulness of these reports to be improved and to be on par with financial statements.
With regards to the expectation gap between users and preparers of environmental reports, the
findings of the study show evidence of existence of expectation gaps on various issues related to
the decision-usefulness of environmental reports. First, an overwhelming majority of preparers did
not have a way of ascertaining whether or not their companies' environmental reports had been
read. Second, 13 significant differences were found between responses of users and those of
preparers in 28 statements on what environmental reports should be/do. In addition, significant
differences were found between responses of users and preparers on how often users used the
more effective reading techniques to read environmental reports, and how often users read
environmental reports from three of six media. Furthermore, two significant differences were
found between the responses of users and preparers on how environmental reports were used,
344
particularly relating to use of the reports for education/research and for own knowledge.
Third, significant differences were found between the responses of users and preparers on the
understandability, timeliness, reliability, verifiability and comparability of the environmental
reports. In addition, significant differences were found between the responses of users and
preparers on users' satisfaction with all six qualitative characteristics of decision-useful
information. Lastly, whereas users suggested improvements in environmental reports' reliability,
an overwhelming majority of preparers suggested improvements related to comparability. The
existence of the above-mentioned expectation gaps may undermine the decision-usefulness of the
environmental reports.
In general, the environmental reports produced by South African companies were perceived to be
decision-useful by the users, mostly for research, own knowledge and for holding companies
accountable. However there is a need for improvement, particularly with regard to the reliability
of the environmental reports, which is one of the two fundamental characteristics that decision-
useful reports must possess.
The following chapter summarises the key findings and conclusions of this study. It then presents
the original contributions and significance of the study, the limitations of the study as well as
provides suggestions for further research. Chapter 8 ends with the final concluding remarks.

345
CHAPTER 8
SUMMARY AND CONCLUSIONS
8.1 INTRODUCTION
The broad aim of this study was to assess and determine the decision-usefulness of environmental
reports prepared by South African companies to users of those reports. The study was motivated
by a lack of research on users' perception on decision-usefulness of environmental reports in
South Africa in a period during which legislation on corporate reporting, rules on integrated
reporting, and principles of corporate governance have undergone far reaching changes. To
achieve the above aim, content analyses of environmental reports, as well as a questionnaire
survey of users and preparers of the reports were conducted.
The main purpose of this chapter is to summarise the key findings and to present the conclusions
of the study. The chapter also provides the original contributions of this study, discusses its
limitations and provides suggestions for further research.
The chapter proceeds with a restatement of the research problem and objectives, as outlined in
Chapter 1, in section 8.2. This is followed by a summary and conclusion of the evolution of
environmental reporting, presented in Chapter 2, in section 8.3. Section 8.4 presents a summary
and conclusion of the theoretical foundation of environmental reporting adopted in this study,
presented in Chapter 3. Thereafter, a summary and conclusion of review of prior literature on
decision-usefulness of environmental reports, presented in Chapter 4, is provided in section 8.5.
Section 8.6 provides a summary and conclusion of research design and methodology employed in
this study, presented in Chapter 5. This is followed by a summary and conclusion of key findings
of the content analysis phase of the study, presented in Chapter 6, in section 8.7. Section 8.8
presents a summary of key findings of the questionnaire survey phase of the study, presented in
Chapter 7, followed by a discussion of original contribution and significance of this study in
section 8.9. Section 8.10 provides the limitations of the study, followed by suggestions for further
research in section 8.11. Section 8.12 provides the final concluding remarks.
346
8.2 CHAPTER 1: RESEARCH PROBLEM AND OBJECTIVES
8.2.1 Research problem
The research problem investigated by this thesis is that the increase in the volume and number of
environmental reports produced by South African companies appears to have occurred without a
commensurate improvement in quality (KPMG, 2013:39). As a result, the decision-usefulness of
the environmental reports produced is doubtful (IRC, 2011:01). Notwithstanding the
commendable effort by South African companies to increase the quantity of environmental reports
produced, they appear to have done so by side-lining users from the reporting process (IRC,
2011:01; KPMG, 2013:23). Consequently, the environmental reports seem not to address users'
needs. In addition, environmental reports produced by South African companies have increasingly
been criticised for tending to be biased and/or, self-laudatory with minimal negative information
disclosure even when such information is known to exist (KPMG, 2013:76). These criticisms have
further undermined the perceived decision-usefulness of the reports.
Given that limited environmental reporting research has been conducted in South Africa on users'
environmental information needs, the extent to which they read environmental reports, whether
they employ the reports to inform their decisions, their level of satisfaction with the reports and
perception of relative importance of the reports, little is known about their perception of decision-
usefulness of the reports. Considering that the main objective of accounting, and environmental
reporting is not an exception (FASB, 2010:01; GRI, 2013:17; IASB, 2010:43), is to provide
information that is useful to users for making decisions, it is imperative that users' perceptions on
decision-usefulness of environmental reports be investigated if the above overarching objective is
to be met.
8.2.2 Research objectives
The broad aim of this study was to assess and determine the decision-usefulness of environmental
reports prepared by South African companies to users. Towards this end, the following specific
objectives were pursued:
1. To evaluate the decision-usefulness of the current environmental reporting practices by South
African companies
347
2. to determine the information needs of users of environmental reports produced by South
African companies
3. to determine the extent to which users read the environmental reports and whether they
employ the reports when making decisions
4. to determine the degree of satisfaction of users with regard to the decision-usefulness of the
environmental reports and suggest ways of improving those reports
5. to investigate how users rank environmental information relative to other types of information
such as financial and social responsibility information
6. to ascertain whether there is an expectation gap between preparers of environmental reports
and users of those reports with regard to the decisions-usefulness of the reports
8.3 CHAPTER 2: SUMMARY AND CONCLUSION OF EVOLUTION OF
ENVIRONMENTAL REPORTING
In Chapter 2, the origins and developments of environmental reports were traced from 1960 to
2014 to assess whether the developments had resulted in decision-useful reports. Despite the
general improvement of environmental/sustainability reports from dis-informative greened
advertisements of the 1960s to a systematic approach of environmental reporting in 2014 that
enhanced the relevance, reliability, comparability, verifiability, timeliness and understandability of
environmental reports, the decision-usefulness of environmental reports remained questionable
(Vrabic, 2010:16).
With regard to the latter, stakeholder engagement initiatives of many companies appeared
superficial in manner likely to result in irrelevant reports (Bromley & Powell, 2012:485). In
addition, many companies' environmental reports contained incomplete, inaccurate, selective and
self-laudatory information, with low levels of reasonable assurance (KPMG, 2013:76).
Furthermore, the reports varied widely in a manner that rendered them incomparable (Fonseca,
2010:05). Besides, many reports were lengthy in nature, overloaded with over-aggregated
information, a situation that rendered them incomprehensible (Laud & Schepers, 2009:368). Some
reports also appeared to contain repeated information over several years (Scott & Jackson,
2002:201). Given the above concerns regarding relevance, reliability, comparability, timeliness,
understandability and verifiability of reports produced by most companies, the final conclusion on
decision-usefulness of the sustainability reports produced remained evasive.
348
8.4 CHAPTER 3: SUMMARY AND CONCLUSION OF THEORETICAL FOUNDATION OF
ENVIRONMENTAL REPORTING
Chapter 3 examined various theoretical perspectives employed in the existing literature in an
attempt to describe, explain, and evaluate the current environmental reporting practices and to
prescribe how the reporting should be practiced. Ultimately, decision-usefulness theory, which
posits that environmental reports are prepared because different stakeholders require information
to support their decisions (AAA, 1966:01), was selected as it renders itself well to the content
analysis and questionnaire survey methodologies adopted in this study. The theory was also
deemed suitable because of its normative nature that questions the status quo and prescribes how
environmental reporting should be practiced (Deegan, 2006:05).
The decision-makers paradigm of this theory was adopted for this study as it assumes that the
decision-makers themselves know best the type of information that they want and that such
information should be provided (Laughlin & Gray, 1988:334). The current study adopted the
Behavioural Accounting Research approach (BAR) of decision-makers paradigm, an approach
that entails directly asking the users to indicate the information that they want, in order to
prescribe that information (Belkaoui, 2004:368; Deegan, 2006:12; Laughlin & Gray, 1988:335).
The BAR approach was also selected because it is consistent with the overall aim of this study,
and it has been successfully employed in similar prior research as it renders itself well to content
analysis and questionnaire survey methodologies employed in this study (European Commission,
2011b; Said et al., 2013). Chapter 3 concluded that decision-usefulness theory was suitable for
describing, explaining, and evaluating the current environmental reporting practices and to
prescribing how the reporting should be practiced.
8.5 CHAPTER 4: SUMMARY AND CONCLUSION OF PRIOR RESEARCH ON DECISION-
USEFULNESS OF ENVIRONMENTAL REPORTS
Chapter 4 reviewed the prior literature on decision-usefulness of sustainability reports in general
and environmental reports in particular. Key prior content analysis studies that evaluated the
decision-usefulness of sustainability/environmental were reviewed, followed by surveys
conducted to determine the environmental information needs of users and whether or not they
read and employed the information to inform their decisions. The chapter also reviewed prior
349
studies on users’ satisfaction with the decision-usefulness of environmental reports, as well as
studies on users' perception of relative importance of environmental reports. Lastly, the chapter
reviewed studies conducted to determine whether there is an expectation gap between preparers
and users of environmental reports. In so doing, Chapter 4 highlighted gaps in the prior literature
and the questions that have remained unanswered.
8.5.1 Review of prior content analysis studies
The review of prior content analysis studies conducted prior to 2010 revealed that the quality of
sustainability reports in general, and environmental reports in particular was questionable, as most
disclosures were irrelevant, unreliable, incomparable, untimely, incomprehensible, and
unverifiable (Deegan & Rankin, 1996:52; Gamble et al., 1995; Guthrie & Parker, 1990; KPMG,
1993; 1996; 1999, Niskala & Pretes, 1995). By contrast, a review of studies conducted post 2010
revealed that environmental reports were increasingly, more relevant, reliable, comparable,
verifiable, understandable and timely (Bolivar, 2009; Chatterjee & Mir, 2008; KPMG, 2013, 2011,
2008, 2005, 2002; Mammatt et al., 2010; Trucost and Environmental Agency, 2010, 2006, 2004).
However, the decision-usefulness of the reports remained questionable even with the
improvement in the reports.
8.5.2 Review of prior surveys
The review of surveys on users' needs revealed that users unanimously preferred environmental
(sustainability) information that is relevant, reliable, understandable, comparable, verifiable and
timely (Danatas & Gadenne, 2004; European Commission, 2011b; KPMG & SustainAbility,
2008; KPMG et al., 2010; IRRC, 1995; Tilt, 1994). However, there were some unique differences
as some preferences seemed to vary from one reader group to another, based on a group's unique
needs (European Commission, 2011b; KPMG et al., 2010). Chapter 4 also revealed that various
user groups read and employed environmental information to inform various decisions (Danatas
& Gadenne, 2004:09; KPMG & SustainAbility, 2008:05; Solomon & Solomon, 2006:574; Tilt,
1944:55). In addition, the chapter revealed different patterns of usage of environmental reports in
different countries (KPMG et al., 2010:23). The chapter further revealed that financial
stakeholders employed environmental reports to a limited extent as they perceived them to be
immaterial to their decisions (Campbell & Slack, 2008:28; Deegan & Rankin, 2004:329;
European Commission, 2011b:91).

350
Chapter 4 revealed dissatisfaction of users with the decision-usefulness of the environmental
reports in all prior studies reviewed, albeit not to the same extent (Campbell & Slack, 2008;
Danatas & Gadenne, 2004; European Commission, 2011b; Mitchell & Hill, 2010; Solomon &
Solomon, 2006; O’Dwyer et al., 2004; Tilt, 1994). Some studies, particularly the early ones found
that the users were generally dissatisfied with the environmental disclosures which they perceived
to be unreliable, irrelevant, untimely, incomparable, unclear, unverifiable, incomplete and
insufficient (O’Dwyer et al., 2004; Tilt, 1994). Other studies revealed that some media of
disclosure were deemed more reliable than others, and that some were more understandable than
others (Danatas & Gadenne, 2004). Yet other studies revealed that environmental information was
viewed by users as insufficient even when deemed relevant (Danatas & Gadenne, 2004). By
contrast, a few studies, particularly the more recent ones, found the reports to be satisfactory to
some users and not others (European Commission, 2011b; KPMG et al., 2010).
With regard to the perceived relative importance of environmental information, most prior studies
indicated that users perceived financial disclosures to be the most important disclosures in the
annual reports, whereas environmental and social disclosures were perceived to be the least
important (BiE, 1994; Campbell & Slack, 2008; Deegan & Rankin, 2004; Richardson & Holm,
2005; Rowbottom & Lymer, 2010). By contrast, one study indicated that some users wanted
environmental reports to be accorded the same status as financial reports (European Commission,
2011b:98).
Chapter 4 further revealed that some prior studies found significant differences between the
expectations of users and preparers in relation to various issues related to environmental reporting
such as disclosure levels, reasons for and importance of topics disclosed, the medium of
disclosure, frequency, location and regulation of disclosures (Deegan & Rankin, 1999; Mitchell &
Quin, 2005; Myburgh, 2001). By contrast, some studies revealed convergence in the views of the
users and some preparers on certain issues (Mitchell & Quin, 2005).
Based on the review of the prior literature, Chapter 4 identified various gaps such as limited
research on decision-usefulness of environmental reports in developing countries, failure of prior
studies to apply theory, lack of academic impartiality in the prior studies, out-datedness of the
prior studies and use of ad hoc samples that did not allow generalisability of their findings. Other
gaps identified included, a lack of focus on decision-usefulness of environmental reports,

351
surveying of views of a single user group, eliciting views of proxies instead of actual users, and
inconsistent or contradicting results. Given the above-mentioned gaps, chapter 4 concluded that
there were many unresolved issues on the decision-usefulness of environmental reports over
which the empirical evidence was either inconclusive or contradictory. Therefore research was
required to evaluate the decision-usefulness of the environmental reports of South African
companies, and to determine users' perception of decision-usefulness of the reports.
8.6 CHAPTER 5: SUMMARY AND CONCLUSION OF RESEARCH DESIGN AND
METHODOLOGY
Chapter 5 discussed two research methodologies, namely content analysis and questionnaire
survey employed to collect data for meeting the six objectives of this study.
8.6.1 Content analysis phase of the study
Chapter 5 commenced by defining the content analysis method and justifying its use in addressing
the first research objective. It then presented the population for the content analysis phase of the
study which comprised top 100 JSE listed operating companies, and justified the selection of the
population, as well as the sampling criteria employed. The chapter then presented the media from
which environmental reports were analysed, namely IARs, SSRs and company websites and
justified the selection of the same.
The design of five manual control lists and two judgement scales employed to evaluate the quality
of environmental reports was then discussed. This was followed by a discussion of the pilot study
conducted to finalise the questions and categories in the control lists, as well as the decision rules
for coding adopted. The actual coding processes entailed scanning the IARs, SSRs and websites
of companies to determine the presence of preselected environmental related items contained in
the five control lists. The data captured in control lists was analysed using a spreadsheet to
generate an environmental disclosure sub-quality index for each qualitative characteristic, as well
as the total environmental disclosure quality index for each company. The latter was used to rank
the companies in a descending fashion. Chapter 5 then discussed the measures undertaken to
ensure the reliability and validity of the content analysis phase of the study, as well as the
limitations and ethical considerations of the method.
352
8.6.2 Questionnaire survey phase of the study
Having discussed the content analysis phase of the study, chapter 5 discussed the questionnaire
survey methodology designed to collect data for meeting the second, third, fourth, fifth and sixth
objective of the current study. The questionnaire survey phase commenced with the justification
for the questionnaire survey methodology, followed by a discussion of the population and sample
(that comprised both users and preparers) as well as the sampling technique employed to select
respondents. Two sets of questionnaires designed, one for users and the other for preparers, were
then discussed. The two were designed to maximise comparability of responses of the two groups
of respondents and as such had identical sections, similar questions and were mostly closed-
ended.
Chapter 5 then discussed the data analysis conducted using SPSS version 22. Both descriptive as
well as inferential statistics were employed to analyse the data except for one question which was
open-ended in both sets of questionnaires, and thus was analysed using Creswell’s data analysis
spiral given its qualitative nature. The chapter then discussed the measures undertaken to ensure
the reliability and validity of the findings of the questionnaire survey phase of the study, as well as
the related limitations and ethical considerations. Chapter 5 then concluded by affirming that the
methodologies adopted in the current study were appropriate in addressing the research objectives
of the study.
8.7 CHAPTER 6: SUMMARY AND CONCLUSION OF KEY FINDINGS OF THE CONTENT
ANALYSIS PHASE OF THE STUDY
Chapter 6 commenced by outlining the objective and sub-objectives of the content analysis phase
of the study, followed by the profile of the top 100 companies included in the study. The chapter
then presented the results on relevance, reliability (verifiability), comparability, understandability,
timeliness and overall decision-usefulness of top 100 South African listed companies. This was
followed by an explanation of the results using the decision-usefulness theory.
8.7.1 Objective and sub-objectives of the content analysis phase of the study
The overall objective of the content analysis phase of the study was to evaluate the decision-
usefulness of the current environmental reporting practices by South African companies. To

353
achieve this objective required that the qualitative characteristics that make reports to be decision-
useful be evaluated, which necessitated a further sub-division of the research objective into five
sub-objectives listed below:
i. To evaluate the relevance of the current environmental reporting practices by South
African companies
ii. to evaluate the reliability (verifiability) of the current environmental reporting
practices by South African companies
iii. to evaluate the comparability of the current environmental reporting practices by
South African companies
iv. to evaluate the timeliness of the current environmental reporting practices by South
African companies
v. to evaluate the understandability of the current environmental reporting practices by
South African companies
8.7.2 First sub-objective: relevance of environmental reports
Results of the content analysis phase of the study indicate that the relevance of the environmental
reports varied widely among the companies sampled, from 94% for the company with the most
relevant report to 20% for the company with the least relevant report. The results further show that
the reports were relevant as only 12 out of 66 companies scored less than 50%. In other words,
about 82% of the companies' environmental reports had a relevance score of at least 50%. Given
that the average relevance score for the 66 companies sampled was 70.43%, Chapter 6 concluded
that the environmental reports produced by top 100 South African companies were relevant.
8.7.3 Second sub-objective: reliability (verifiability) of environmental reports
The results of the current study indicate that the reliability (verifiability) of the reports of the
sampled companies varied widely, from 97% for the company with the most reliable (verifiable)
report to 17% for the company with the least reliable (verifiable) report. Notwithstanding the
variation in reliability (verifiability), chapter 6 concluded that the environmental reports of
sampled top 100 listed companies were reliable (verifiable) as only 26 companies scored less than
50%. In other words, about 61% of the companies' environmental reports had a reliability
(verifiability) score of at least 50%, with an average score of 61.80% for the 66 companies

354
sampled. Therefore the environmental reports sampled were more relevant (70.43%) than they
were reliable (verifiable) (61.80%). This conclusion is consistent with FASB’s (2008:15)
conceptual framework assertion that for non-financial reports/statements, relevance should be the
dominant quality in accounting reports, even if that is at the expense of reliability.
8.7.4 Third sub-objective: comparability of environmental reports
The results of the current study indicate that the comparability of environmental reports varied
widely among sampled companies, as the company with the most comparable report had a score
of 51%, whereas the company with the lowest score had a score of 5%. The environmental reports
of the sampled companies were not comparable as only three companies scored at least 50%.
Discouragingly, above 95% of the companies' environmental reports had a comparability score
below 50%. With an average comparability score for all 66 sampled companies' environmental
reports of 27.92%, Chapter 6 concluded that the environmental reports of the companies were not
comparable. Chapter 6 explained the incomparability of environmental reports using FASB’s
(2008:27) conceptual framework, which posits that incomparability arises because companies,
even if in the same sector, do not use similar inputs, apply similar procedures, or classify costs
using the same systems.
8.7.5 Fourth sub-objective: understandability of environmental reports
Results of the current study indicate that the understandability of the environmental reports varied
widely among the sampled companies – from 89% for the company with the most understandable
report to 30% for the company with the least understandable report. Despite the disparity in the
understandability of the reports, the reports of the sampled companies were understandable as
only six companies scored less than 50%. About 91% of the companies' environmental reports had
an understandability score of at least 50%. Given that the average score for understandability for
the 66 companies sampled was 69.68%, Chapter 6 concluded that the environmental reports of the
companies were understandable.
8.7.6 Fifth sub-objective: timeliness of environmental reports
As was the case with the other qualitative characteristics, the results of the current study revealed
a wide disparity in the timeliness score of the environmental reports, ranging between 100% for

355
the company with the timeliest report to 40% for the one with the least timely report. In spite of
the disparity, the reports of the sampled companies were timely as only three companies scored
less than 50%. Simply put, just above 95% of the companies' environmental reports had a
timeliness score of at least 50%. With an average timeliness score of 67.27% for all 66 companies
sampled, Chapter 6 concluded that the environmental reports were timely. The chapter further
ranked the qualitative characteristics of the sampled reports according to the average scores. In
this regard, relevance (70.43%) ranked first, followed by understandability (69.68%) in the second
position, then timeliness (67.27%) in the third position. In the fourth position was reliability
(verifiability) (61.80%) followed by comparability (27.92%) in the fifth position.
8.7.7 Results of analysis of overall decision-usefulness of environmental reports
8.7.7.1 Determination of the overall decision-usefulness score
The overall decision-usefulness score for each company was computed by aggregating the
company’s average score for relevance, reliability (verifiability), comparability, understandability
and timeliness, then dividing it by five. The resulting index was then used to rank companies in a
descending order from the highest scorer to the lowest as discussed in Chapter 5.
8.7.7.2 Results of overall decision-usefulness of environmental reports
The results of the current study revealed a wide disparity in the overall decision-usefulness of the
environmental reports, as the company with the most decision-useful report scored 80%, whereas
the one with the least decision-useful report scored 23%. This result is in line with the findings of
similar prior studies, which reported that the disclosure practices of companies varied widely
among listed companies (MacLean & Gottfrid, 2000:247; Kolk, 2005:39; KPMG, 2010:78;
Mammatt et al., 2010:01). Notwithstanding the variation, the reports produced by sampled
companies were decision-useful as only 15 out of 66 companies scored less than 50%. In other
words, just above 77% of the companies' environmental reports had an overall decision-usefulness
score of at least 50%. With an average score of about 60% for all 66 companies sampled, Chapter
6 concluded that the environmental reports produced by the sampled South African companies
were decision-useful.
The fact that the average scores of the sampled environmental reports for the five qualitative

356
characteristics ranged from 70.43% for relevance to 27.92% for comparability, and that the overall
average score for decision-usefulness was 60% supports FASB’s conceptual framework (FASB,
2010:21; IASB, 2010:22). According to the framework, accounting information may possess
varying degrees of qualitative characteristics and still be decision-useful. According to the
conceptual framework, comparability as an enhancing qualitative characteristic does not
significantly impact the decision-usefulness of accounting information, as does relevance and
reliability (FASB, 2008:12). In fact, forcing comparability of two measures that are essentially
different should be avoided as it can undermine relevance and reliability if comparability is
attained by making the unlike disclosures to be alike (FASB, 2008:28).
8.7.7.3 Sector analysis of overall decision-usefulness of environmental reports
Results of the current study show that the overall decision-usefulness of environmental reports
varies widely among different sectors, and even within sectors. In general, companies from the
sectors known to have a significant impact on the environment appear to have produced more
decision-useful reports than their counterparts from sectors with a lesser impact on the
environment. This observation concurs with the findings of prior similar studies (KPMG, 2002:05;
European Commission, 2011b:100; KPMG, 2013:14; Trucost & Environmental Agency, 2009,
2006, 2004). Notwithstanding the above conclusion, some sectors with a lesser impact on the
environment particularly the ICT sector and Financial sector had a high average overall decision-
usefulness scores for their reports.
8.7.7.4 Analysis of overall decision-usefulness of environmental reports according to sizes of
companies
Results of the current study also suggest that in general, the overall decision-usefulness of
sampled companies' environmental reports appears to be related to the size of the company as
measured by market capitalisation. Specifically, larger companies appear to produce more
decision-useful environmental reports than their smaller counterparts, a finding that is also
consistent with those of the prior studies (Barbu, Dumontier, Feleaga & Feleaga, 2012:01;
Brammer & Pavelin, 2006:01; Joshi, Suwaidan & Kumar, 2011:01).

357
8.7.7.5 Explanation of content analysis results using decision- usefulness theory
Chapter 6 reiterated that the accounting conceptual frameworks have not only emanated from
decision-usefulness theory, they indeed embody the theory and are inextricably linked to it.
Accordingly, they represent the theory and thus can be used to explain the results of the current
study. In particular, the cost and materiality pervasive constraints articulated in the frameworks are
meant to guide companies in deciding whether or not to disclose accounting information, and in
determining the degree to which accounting information disclosed should possess the qualitative
characteristics of decision-useful information (FASB, 2008:02; IASB, 2008:12). Accordingly they
can be and were used in explaining the results of the content analysis phase of this study.
8.7.7.6 Overall conclusion of Chapter 6
The overall objective of the content analysis phase of the study was to evaluate the decision-
usefulness of the current environmental reporting practices by South African companies. The
overall conclusion of Chapter 6 is that the environmental reports produced by the listed sampled
companies are decision-useful. In addition, companies from sectors with a significant impact on
the environment appear to have more decision-useful environmental reports than those from the
sectors with an insignificant impact on the environment. Furthermore, larger companies also
appear to have more decision-useful reports than their smaller counterparts.
8.8 CHAPTER 7: SUMMARY OF KEY FINDINGS OF THE QUESTIONNAIRE SURVEY
PHASE OF THE STUDY
Chapter 7 presented and discussed the results of the questionnaire survey phase of the study,
which addressed the second, third, fourth, fifth and sixth objective of this thesis. The chapter
commenced with a restatement of the research objectives, followed by a discussion of the
response rate, non-response bias, and the background information of the respondents. The chapter
then presented the analysis and discussion of results on whether environmental reports are read,
users' environmental information needs, extent to which environmental reports are read and how
they are used. Chapter 7 then analysed and discussed results on the usage of different media as a
source of environmental reports, how the reports were used, and how useful they were perceived
to be. This was followed by an analysis and discussion of results on users' perception of quality of
environmental reports, their satisfaction with the same, suggestions for improvement of the

358
quality of the reports and perception of relative importance of the reports.
8.8.1 Population and response rate
The population of users comprised representatives of 30 ethical investment funds, representatives
of 30 environmental NGOs and 40 accounting researchers all totalling to 100 users. A
questionnaire was sent to the entire population of users that yielded a response rate of 54%. For
the purpose of comparing users’ perceptions to those of preparers, a similar questionnaire was also
sent to 100 preparers representing the top 100 listed companies which yielded a response rate of
42%.
8.8.2 Results on information needs of users of environmental reports produced by South African
companies
The second objective of this thesis was to determine the information needs of users of
environmental reports produced by South African companies. To this end, users were required to
indicate their perception of importance of 28 statements on what a company's environmental
reports should do or should be. Results indicate that users perceived the disclosure of both
negative and positive aspects in a balanced manner to be the most important issue, followed by
identification and description of key relevant issues. Other issues perceived to be important by
users include provision of specific and accurate information, provision of future oriented
information, as well as identification and addressing of key stakeholders' concerns. In short, users’
needs were more inclined towards more reliable and relevant environmental information, which
happen to be the two fundamental qualitative characteristics of decision-useful accounting
information. Surprisingly, the inclusion of an assurance statement in environmental reports was
perceived to be relatively of lesser importance.
The above results of the current study concur with the earlier findings of some prior studies
(Danatas & Gadenne, 2004; European Commission, 2011b; IRRC, 1995; KPMG &
SustainAbility, 2008; KPMG et al,. 2010), but contrast those of other prior studies (Hodge et al.,
2009; KPMG & SustainAbility, 2008; O’Dwyer et al., 2004; Tilt, 1994). The users in the latter
studies had prioritised the inclusion of an assurance statement in a sustainability report to enhance
its reliability. Chapter 7 attributed the above contrast to the fact that the prior studies were
conducted in developed countries in which assurance practices on environmental issues are
359
advanced, independent, rigorous and mandatory, aspects which may have inclined users to prefer
assurance as a measure to enhance the reliability of the reports.
8.8.3 Results on the extent to which users read and employ environmental reports
The third objective of this thesis was to determine the extent to which users read the
environmental reports and whether they employ the reports when making decisions. To this end,
users were asked to indicate whether they had actually read environmental reports in the past 12
months, how they read and used those reports.
8.8.3.1 Results on the extent to which users read the environmental reports
The results reveal that 83.33% of the users had read an environmental report in the past 12
months, whereas 16.67% had not. A Binomial Test (2-tailed) conducted found a significant
difference between the proportion of the users who had read the reports (83.33%), and the
proportion of those who had not (16.67%) (p<0.05). These results are consistent with the findings
reported in the prior literature (KPMG & SustainAbility, 2008:05; Danatas & Gadenne, 2004:09;
Solomon & Solomon, 2006:574; Tilt, 1944:55), which indicated that a majority of users read
sustainability reports and indeed actively sought these reports. However, the results contrast the
findings of other prior studies (Campbell & Slack, 2008:28; Deegan & Rankin, 2004:329;
European Commission, 2011b:91), which found that environmental reports were rarely read by
users. The difference was attributed to the fact that the current study had mostly sampled non-
financial stakeholders whereas the prior studies with opposing findings had mostly sampled
financial stakeholders, who typically do not read non-financial reports.
The results of the current study also reveal that environmental reports are more often read using
lesser effective reading techniques such as scanning, skimming and exploratory reading –
techniques that are likely to undermine the understandability of the information read. The users'
preference of the lesser effective reading techniques was attributed to their preference for
environmental reports in PDF IARs, which are typically lengthy in nature. The above result differs
from the findings of the European Commission (2011b:102), and Solomon and Solomon (2006),
which indicated that users did not only thoroughly read sustainability reports, they also actively
participated by co-writing the reports with the reporting entities. The preceding result also
contradicts the accounting conceptual frameworks (FASB, 2008:10; IASB, 2008:40), which assert

360
that in making decisions, users are responsible for studying and analysing accounting information
with reasonable diligence.
8.8.3.2 Results on whether users employ environmental reports for making decisions
With regard to how users used the environmental reports read, the results of this study reveal that
the reports were mostly used for education or research, and for users' own knowledge. In addition,
they were used to a lesser extent by users to hold companies accountable, to decide whether or not
to buy a company's products, as well as to decide whether to invest or divest from a company.
Only a minority of users used the reports to decide whether to partner with a company, or even to
decide whether to support or launch action against a company. In short, environmental reports
were not used as much for making action-oriented decisions as they were used for research, own
knowledge or for holding companies accountable.
The above results concur with the findings of some prior studies (Danatas & Gadenne, 2004; De
Villiers & Van Staden, 2010a; De Villiers & Van Staden, 2010b; KPMG & SustainAbility, 2008;
O’Dwyer et al., 2004; Solomon & Solomon, 2006; Taib, 2005; Tilt, 1994), but contrast the
findings of other prior studies (BiE, 1994; Campbell & Slack, 2008; Deegan & Rankin, 2004).
The latter studies found that environmental disclosures were hardly used to inform investment or
divestment decisions, given their narrative nature. The contrast can be explained by the time
difference between the current study and the latter studies which were conducted at least six years
ago when sustainability reporting was predominantly narrative in nature. With passage of time,
environmental reports particularly in South Africa, have increasingly quantified their data in a
manner that can inform investment decisions.
8.8.4 Results on users’ satisfaction with decision-usefulness of environmental reports and
suggestions for improvement
The fourth objective of this thesis was to determine the degree of satisfaction of users with the
decision-usefulness of the environmental reports as well as their suggestions for improving the
reports. To this end, users were asked to indicate: how useful the environmental reports read were
for the purpose for which they were used; how relevant, reliable, comparable, understandable,
timely and verifiable the reports read were; how satisfied they (users) were with above-mentioned
attributes of the reports read. In addition, users were asked to make suggestions for improving the
361
quality of the environmental reports read.
8.8.4.1 Results on how useful environmental reports read were for the purpose they were used
Results of the current study indicate that 52.57% of users perceived environmental reports to be
useful for the purpose for which the reports were used with a mean of 3.44 (between somewhat
useful and useful). These results concur with the findings of prior studies (Deegan & Rankin,
2004; KPMG & SustainAbility, 2008:11), which found that sustainability/environmental reports
were perceived to be decision-useful by users. However, the above results differ from the findings
of other prior studies (Campbell & Slack, 2008;05; Miller, 2012:01; O’Dwyer et al., 2004; Wong,
2012:266), which found that non-financial/sustainability reports were not decision-useful as they
were not quantified, and that they were perceived to lack a stakeholder engagement and feedback
mechanism, sufficiency and credibility.
A plausible explanation for the difference between the current study's results and those of prior
studies was attributed to the difference in the type of respondents sampled by the two sets of
studies. Most of the respondents of the prior studies (with findings that differed from those of the
current study) were financial stakeholders or representatives of environmental NGOs, whereas the
respondents of the current study are a heterogeneous group comprising three different types of
users (Academics, ethical investors, environmental NGOs). Financial stakeholders who typically
need numerical data that can influence a financial forecast, may not find predominantly narrative
sustainability reports to be decision-useful as such reports are perceived to lack the ability to
influence a financial forecast (Campbell & Slack, 2008:05). On the other hand, NGOs may not
reveal their true perception of decision-usefulness of sustainability reports as they have vested
interest in answering questions in a particular way, to influence public opinion towards certain
objectives. Academics, who are the main respondents in the current study are however impartial
and thus are bound to have differing responses.
8.8.4.2 Results on users’ perception of relevance, reliability, comparability, understandability,
timeliness and verifiability of environmental reports read
Results of the current study reveal that most users perceived environmental reports to be
understandable (62.86%) and relevant (61.11%). However, only a minority perceived the reports
to be reliable (37.14%) and timely (37.14%). Likewise only a minority perceived the reports to be
362
verifiable (14.29%). Worse still, only 8.57% of users perceived the reports to be comparable.
These results are consistent with those of prior studies (Campbell & Slack, 2008; Danatas &
Gadenne, 2004:02; 11; KPMG & SustainAbility, 2008; O’Dwyer et al., 2004:11).
8.8.4.3 Results on users’ satisfaction with the relevance, reliability, comparability,
understandability, timeliness and verifiability of the environmental reports read
Results of the current study indicate that 40% of users were satisfied with the understandability of
environmental reports read, whereas 37.14% were satisfied with the relevance of the reports read.
Only 22.86% of users were satisfied with reliability of the reports read, whereas 20% were
satisfied with the timeliness of the reports. Only 11.43% of users were satisfied with the
verifiability of the reports read. Quite discouragingly, only 5.71% of the users were satisfied with
the comparability of the environmental reports. These results are consistent with the findings of
the prior studies (Campbell & Slack, 2008; Danatas & Gadenne, 2004; European Commission
2011b; Mitchell & Hill, 2010; O’Dwyer et al., 2004; Solomon & Solomon, 2006; Tilt, 1994).
8.8.4.4 Results on users' suggestions for improvement of quality of environmental reports read
As far as suggestions for improvement are concerned, 50% of users suggested improvements
related to reliability of the reports most notably verification of reports by independent auditors,
elimination of biased or subjective reporting, integration of environmental issues with other core
business activities as well as adherence to King III Report recommendations and GRI guidelines.
A lesser percentage (31%) suggested improvements related to the relevance of the reports most
noteworthy of which was improving stakeholder consultation and feedback in the reporting
process. Yet other users (25%) suggested improvements related to the comparability of the reports
by standardising the formats of reports. Some users (19%) suggested improvements related to
understandability namely, improving readability of the reports, reducing their length and file size.
Only 7% of users suggested improvement related to timeliness of the reports. In short, the two
qualitative characteristics that most users suggested improvement on, were reliability and
relevance, which happen to be the fundamental attributes of decision-useful information. The
above results are consistent with the findings of prior studies (European Commission, 2011b;
DeVilliers & Van Staden, 2010a; Mitchell & Hill, 2010; Taib, 2005; Tilt, 1994).

363
8.8.5 Results on how users rank environmental information relative to other types of information
such as financial and social responsibility information
The fifth objective of this thesis was to investigate how users rank environmental information
relative to other types of information. To achieve the objective, users were requested to indicate
their perceived importance of different types of reports/statements that typically appear in the
annual reports. Results of the current study show that environmental reports ranked first as they
were regarded to be important by most users (75.68%), followed by the statement of financial
position and statement of comprehensive income which jointly ranked second (71.06%).
Corporate governance reports ranked fourth (68.42%), cash flow statements fifth (65.79%) and
community engagement reports sixth (50.00%). Statement of changes in equity ranked seventh
(39.48%) whereas employees’ reports ranked eighth (34.21%). In sum, a higher percentage of
users perceived environmental reports to be important than the percentage that perceived the same
of financial statements. The above results of the current study are consistent with the findings of
the European Commission (2011b:98), but contrast the findings of other prior studies (BiE, 1994;
Campbell & Slack, 2008; Deegan & Rankin, 2004; Richardson & Holm, 2005; Rowbottom &
Lymer, 2010;), which found that sustainability reports, given their narrative nature, were
perceived to be irrelevant, immaterial and of lesser importance than financial information for
investment related decisions.
The difference between the current results and those of the prior studies could be explained by the
fact that sampled users of the prior studies were primarily financial stakeholders, whereas those of
the current study were mostly non-financial stakeholders. Given that the perception of decision-
usefulness of accounting reports is user group-specific, different user groups may accord a
different level of importance to the same reports (FASB, 2008:01). Financial stakeholders, who
typically need numerical data that can influence a financial forecast, may not find predominantly
narrative sustainability reports to be important as such reports are perceived to lack the ability to
influence a financial forecast (Campbell & Slack, 2008:05). By contrast, non-financial
stakeholders may find environmental reports to be more important as they may be interested in
narrative information that also provide context and that are readily understandable.
364
8.8.6 Results on whether there is an expectation gap between preparers and users of
environmental reports
The sixth objective of this thesis was to ascertain whether there are expectation gaps between
users and preparers of environmental reports on the decision-usefulness of the reports. To achieve
this objective, users' and preparers' responses to similar questionnaires were compared to ascertain
if there were any significant differences between the two groups that indicate the existence of
expectation gaps. Consistent with the prior studies (Deegan & Rankin, 1999; Haque et al., 2013;
Mitchell & Quin, 2005; Myburgh, 2001), results of the current study provided evidence of the
existence of expectation gaps on various issues. To start with, 13 significant differences were
found between responses of users and those of preparers in 28 statements on what environmental
reports should be or should do. In addition, three significant differences were found between
responses of users and preparers on how often users used five reading techniques to read
environmental reports. Likewise, three significant differences were found between users and
preparers responses' on how often users read environmental reports from six media sources.
Furthermore, two significant differences were found between the perceptions of the two groups on
seven ways in which the environmental reports were used.
Significant differences were also found between the responses of users and preparers on the
reliability, understandability, timeliness, verifiability and comparability of the environmental
reports. In addition, six significant differences were found between the responses of the two
groups with regard to users' satisfaction with the six qualitative characteristics of decision-useful
information. Furthermore, whereas users suggested improvements related to environmental
reports' reliability, an overwhelming majority of preparers suggested improvements related to their
comparability. Besides, an overwhelming majority of preparers (77.42%) did not have a way of
determining whether their reports had been read. The existence of the above-mentioned
expectation gaps undermines the decision-usefulness of the environmental reports.
8.8.7 Overall conclusion of Chapter 7
In summary, users of environmental reports produced by South African companies need relevant
and reliable reports, and that an overwhelming majority do read the reports and employ the reports
for making decisions. However, users are not fully satisfied with the decision-usefulness of the
reports and suggest improvements mainly on the relevance and reliability of the reports. The
365
results also show that users rank environmental reports above all other reports including financial
statements. The results further indicate the existence of an expectation gap between users and
preparers on various issues related to environmental reports, a situation likely to undermine the
reports' decision-usefulness.
The overall conclusion of Chapter 7 is that environmental reports produced by South African
companies are perceived to be decision-useful by the users, mostly for research, own knowledge
and for holding companies accountable. However there is a need for improvement, particularly
with regard to the reliability of the environmental reports, which is one of the two fundamental
characteristics that decision-useful reports must possess.
8.9 CONTRIBUTIONS, SIGNIFICANCE AND RECOMMENDATIONS OF THE STUDY
8.9.1 Original contributions of the study
This study makes several original contributions to environmental reporting literature. Firstly, it is
the first study in the South African context to empirically evaluate the quality (decision-
usefulness) of environmental reports in line with the accounting conceptual framework and the
GRI guidelines combined. In so doing, the study introduces to the academic literature an extensive
five dimensional qualitative characteristic framework for evaluating the decision-usefulness of
environmental reports. The five control lists and two judgement scales developed by the current
study, are to the best of the authors' knowledge, the first comprehensive instruments, that attempt
to capture the relevance, reliability (verifiability), comparability, understandability and timeliness
of environmental reports of South African companies, in manner that is consistent with the
accounting conceptual frameworks and the recommendations of the GRI guidelines.
Secondly, the current study uniquely employs decision-usefulness theory to provide insights into
the environmental reporting practices of South African companies. In so doing, the study re-
contextualises the theory that is typically employed in explaining financial reporting, and
demonstrates its applicability in explaining the decision-usefulness of the environmental reporting
practices of South African companies, thus affords new insights into a less understood reporting
phenomenon.

366
Thirdly, by using both content analysis methodology and questionnaire survey methodology, the
current study uniquely combines two disparate methodologies to enrich its findings as the results
obtained from one method are used to corroborate the results of the alternative method, an
approach which provides a better insight into the decision-usefulness of environmental reporting
practice.
Fourthly, the current study is the first one in the South African context, to comprehensively
compare the views of users and preparers on various aspects of decision-usefulness of
environmental reports. Most prior studies had only focused on one aspect such as perceived
importance of various types of reports (Mitchell & Quinn, 2005; Myburgh, 2001), or perceived
importance of qualitative characteristics of various reports that are contained in annual reports
(Stainbank & Peebles, 2006). By comprehensively comparing the views of users and preparers,
this study contributes to a better understanding of where the expectation gaps lie, information
which can be used to develop a holistic solution to address the gaps.
8.9.2 Significance of the findings of the study
8.9.2.1 Significance of the findings of the study to preparers
The findings of the current study provide valuable insights to the preparers of environmental
reports wishing to enhance the decision-usefulness of their reports to stakeholders as they are
made aware of users' needs, the extent to which they read the reports, how they employ the
reports, the attributes of the reports that satisfy their needs and how they rank environmental
reports relative to other types of reports. In addition, preparers are made aware of reading
techniques employed by users when reading environmental reports, and the preferred medium
from which they read the reports. With this awareness, preparers should be able to bridge the
expectation gap by preparing more decision-useful reports that are satisfactory to users.
Based on the findings of the current research, preparers may also want to carefully assess the
value of external assurance of environmental reports. Though results suggest that users perceive
assurance of the reports to be important and that it indeed can improve users’ satisfaction with the
reports, they rank it relatively low when compared to other measures that enhance reliability.
Considering the costs required for assurance, preparers may have to be prudent by instead opting
for the other measures considered to be more important in enhancing the reliability of
367
environmental reports. Preparers also need to take cognisance of the different ways that different
users use environmental reports through a comprehensive stakeholder engagement exercise that
identifies the unique needs of different users groups. In so doing, the preparers should be able to
cater for different stakeholders' needs by providing the type of information needed and in a
manner that suits the stakeholders.
8.9.2.2 Significance of the findings of the study to government, accounting professional bodies and
other regulatory bodies
The findings of this study are also significant to the government and accounting standard
setters/reporting guideline developers, given that these authoritative bodies undertake the task of
formulating new legislation and accounting standards/guidelines respectively, and amend the
existing ones. The findings provide invaluable insights on specific attributes perceived by users to
enhance decision-usefulness of environmental reports, which could be used to inform future
endeavours to guide South African companies' environmental reporting practices. If deemed
appropriate, the findings could in fact be embedded and integrated into the legislation, standards
and guidelines to reinforce the preparation of decision-useful reports for the benefit of the under-
privileged non-financial stakeholders. This should alter the current status quo in which most
guidelines and recommendations tend to over-emphasize the quantity of environmental
disclosures without much consideration as to the decision-usefulness of such disclosures. The
government, accounting standard setters/reporting guideline developers and the regulatory bodies
should however adopt a cautious approach when enacting or amending legislation/accounting
standards/reporting guidelines to ensure that the costs of providing such information do not
outstrip the benefits. This may achieved by requiring only certain sectors or sizes of companies to
comply with certain legislation/standards.
The findings of this study are particularly important to the accounting professional bodies and
sustainability reporting guideline developers most notably the GRI. The accounting professional
bodies will be made aware that non-financial stakeholders too need accounting information for
decision-making, which implies a need to update the existing accounting conceptual frameworks
that have so far prioritised financial stakeholders, to reflect this emerging reality. In addition, the
accounting professional bodies may wish to consider promulgating a conceptual framework for
presentation and preparation of non-financial information that primarily prioritises non-financial

368
stakeholders. The GRI, given that one of its core objectives is to elevate the rigor, comparability,
auditability and general acceptance of sustainability reporting practices to a level equivalent to
that of financial reports, should benefit from this study by employing its findings to inform the
strategy adopted to achieve the above objective.
8.9.2.3 Significance of the findings of the study to academics
The findings of this study are also significant to accounting academics who may adapt the
framework developed in the content analysis phase of this study to evaluate the decision-
usefulness of other non-financial reports, with a view to improve the quality of these reports. This
should improve the overall decision-usefulness of IARs thus resulting in better informed decisions
by users. In addition, the findings of the questionnaire survey phase of this study reinforces the
need for further surveys to better understand the needs of users, so that companies can be made
aware of the same. Resultantly, preparation of decision-useful environmental reports could
become a regular and expected practice of all companies. Universities may embed the findings of
this study in their curriculum to ensure that future accountants do not only appreciate the
importance of environmental reports and related non-financial reports, but to also ensure that they
are equipped with the necessary skills required to prepare decision-useful environmental and other
non-financial reports.
8.9.2.4 Significance of the findings of the study to companies' stakeholders
Different stakeholder groups will also be informed of the need to pay attention to the quality of
environmental reports rather than just merely focusing on the quantity. Such a focus will
eventually compel companies to find better ways of producing decision-useful information that
address the ever changing and varied concerns of stakeholders. Besides, the findings of this study
serve to redress the imbalance between preparers and users in lobbying regulators to enforce
preparation of decision-useful information. In fact, the regulators may draw directly from this
study’s findings input required for formulating the measures that are meant to improve the
decision-usefulness of environmental reports produced by South African companies.
8.9.3 Recommendations of the study
Based on the findings of this research, various recommendations are suggested. First, South

369
African companies should establish a mechanism of determining whether or not their
environmental reports are read and by whom. This intelligence will enable them to produce more
relevant reports tailored to the needs of different user groups. Second, the companies should
improve the reliability and verifiability of their environmental reports. These should be done by,
disclosing negative and positive aspects in a balanced manner, providing specific and accurate
information, demonstrating integration of environmental issues into core business processes,
adhering to international guidelines and demonstrating top management commitment to
environmental issues, among other measures.
Third, the environmental reports of South African companies should identify and describe key
relevant issues, provide future oriented information, identify and address key stakeholders and
their concerns, among other measures, to improve their relevance. Fourth, comparability of South
African companies' environmental reports, which was found to be dismally low should be
improved. This could be done by enacting legislation or accounting standards that require
quantification of environmental disclosures, disclosure against targets and against industry
benchmarks. The legislation and accounting standards could be used to level out the playing field
by requiring all companies to produce some standard environmental information. Given that
companies release information through a variety of media (channels), they must ensure that their
data remains consistent across various reporting platforms and within the different business units,
particularly in the case of multinational companies.
Fifth, South African companies should preferably present their environmental reports in PDF
IARs or PDF SSRs on company websites instead of using print medium which is increasingly less
popular among users. However, the environmental reports should be made concise in order to
encourage users to employ more effective reading techniques such as critical reading and study
reading, techniques which increase the likelihood of such reports being used for decision making.
Sixth, preparers should endeavour to produce relevant, reliable, verifiable, comparable, timely and
understandable reports to satisfy users' expectations. This can only be achieved by a meaningful
stakeholder engagement and feedback mechanism aimed at establishing exactly what the
stakeholders' environmental information needs are in order to satisfy them. Ultimately, the
production of decision-useful reports should become the norm rather than the exception among
South African companies.

370
Seventh, environmental reporting should be taken seriously by South African companies as some
users perceive these reports to be more important than financial statements, or any other reports
for that matter. This could mean allocating more resources to environmental reporting to improve
the decision-usefulness of the reports, and integrating environmental performance and reporting
exercise into the core business activities. Lastly, the expectation gap between users and preparers
of South African environmental reports should be reduced through a meaningful stakeholder
engagement mechanism.
8.10 LIMITATIONS OF THE STUDY
8.10.1 Limitations of the content analysis phase of the study
The following limitations should be considered when interpreting the findings of the content
analysis phase of the study. Firstly, the construction of disclosure indices is susceptible to
subjectivity or bias as the same document may be interpreted differently by different researchers
(Kamal, 2012:400). Secondly, the computation of the overall decision-usefulness score involved
attaching an equal weighting to five qualitative characteristics (Kamal, 2012:400). However, each
qualitative characteristic cannot be equally important to all stakeholders. Thirdly, a content
analysis study, by its very nature does not provide precise data as the resulting data is merely
indicative of the quality of environmental reports and not an absolute (Hibbit, 2004:479).
Therefore the methodology may be unsuitable for further statistical analysis (Campbell, 2001).
Fourthly, the study provides a snap shot of the quality of environmental reports produced by listed
companies, as only one year's environmental reports were analysed. Accordingly, the results
reported may neither be representative of the quality of disclosures in other years, nor reflect the
emerging trends in the quality of environmental reports analysed. Lastly, the current study only
focused on three media types used for environmental reporting, whereas there are various other
alternative media that a company could possibly use, such as brochures, live broadcast,
promotional leaflets, press releases and so on (Kamal, 2012:20). With such a focus, there is a
possibility that some environmental disclosures may have been missed, where alternative media
was used.
371
8.10.2 Limitations of the questionnaire survey phase of the study
One key limitation that is inherent with self-administered questionnaire surveys is the existence of
non-response bias which arises when only the targeted respondents with a particular interest in the
subject respond to the questionnaire (De Villiers & Van Staden, 2010a:237). Non-response bias
could also arise when some subjects choose not to respond at all, or fail to respond to some
particular questions, due to their differences in some way from those who do respond (Vogt,
2005:210). Non-response bias thus diminishes the randomness of the sample (Deegan & Rankin,
1997:571). If the sample is biased and no longer random, it lacks the potential to be representative
of the larger population from which the sample was drawn, thereby limiting the study's external
validity (Vogt, 2005:210).
Another limitation inherent with a questionnaire survey is the inability of the researcher to probe
responses and seek clarification for ambiguous answers (Nachmias & Nachmias, 1992; Al-
Mubarak, 1997:181). In addition, the researcher cannot ascertain whether the questionnaire was
completed by the appropriate respondent for whom the questionnaire was intended as it is
common for senior personnel to hand over questionnaires to their juniors to complete (Nachmias
& Nachmias, 1992; Al-Mubarak, 1997:181).
Apart from the above generic inherent limitations of questionnaire surveys, there were some
limitations that were specific to this study. One of the limitations arose from the fact that only
three user groups, namely; ethical investment funds, environmental NGOs, and accounting
researchers were invited to participate in the questionnaire survey. Given that potential users
include many other stakeholder groups, the perceptions of the three groups invited may not be
representative of the perceptions of all stakeholder groups. In addition, there is a possibility that
the population frame employed in the current study could be incomplete, and thus some potential
users may have been excluded from the study.
Another limitation specific to this study is that one of the sampled user groups, namely,
environmental NGOs, by its very nature has vested interest in answering questions in a particular
way, to influence public opinion towards its objectives. Accordingly this group may have
answered the questionnaire in a manner that supports its existing prejudices. Yet another possible
limitation of a questionnaire survey such as this one that focuses on perceptions on environmental

372
reports is the probability that users may have provided socially desirable answers that do not
represent their true perceptions, given the pressure that prejudice them to conform to socially
desirable norms.
Besides the above-mentioned limitations, the results of the current study contribute significantly
to the understanding of users' perceptions on decision-usefulness of environmental reports.
Therefore, the limitations of this study should be weighed against the contribution made by the
study, in this neglected area of research. Besides, as elaborated in Chapter 5, various measures
were undertaken to ameliorate the above limitations.
8.11 SUGGESTIONS FOR FURTHER RESEARCH
8.11.1 Suggestions emanating from limitations of content analysis phase of the study
Given that construction of disclosure indices is susceptible to subjectivity or bias, further research
is required that replicates the current study, using similar control lists and judgement scales in
order to validate the current study's findings. In addition, as opposed to the current study which
arrived at the overall decision-usefulness score by attaching an equal weighting to five qualitative
characteristics (Kamal, 2012:400), future studies could attach different levels of weights to the
qualitative characteristics to reflect the qualities perceived as important by specific stakeholder
groups of interest.
Further research could also conduct a statistical analysis to determine if, for example, there is a
correlation between the various qualitative characteristics. In addition, a correlational analysis
could be conducted to determine if indeed there is a relationship between the overall decision-
usefulness score of a company and the size of a company or the sector in which a company
belongs.
The current study only provides a snap shot of the decision-usefulness of environmental reports
produced by top 100 listed companies, as only one year's environmental reports were analysed.
Future studies could analyse the content of environmental reports for a period of more than one
year, to provide a more representative picture of the decision-usefulness of environmental reports
over several years and provide the emerging trends in the decision-usefulness of environmental
373
reports produced.
One of the limitations cited above is that the current study only focused on three media used for
environmental reporting, namely; IARs, SSRs and company websites. Given that South African
companies employ many other alternative media, future research could analyse the decision-
usefulness of the environmental information in the alternative media, and compare the results to
those of the current study.
Given that the sample selected in this study comprised only the JSE top 100 listed operating
companies, the work of this study could be extended by future studies by evaluating the decision-
usefulness of environmental reports of listed companies below the top 100 companies. Likewise,
the future studies could evaluate the decision-usefulness of environmental reports of unlisted
companies such as private companies, closed corporations and public entities to provide a more
holisting view of decision-usefulness of environmental reporting practice in South Africa. Future
studies could also expand the evaluation of decision-usefulness to other forms of non-financial
disclosures such as employee disclosures, social-economic disclosures and corporate governance
disclosures, to provide a more an all rounded view of decision-usefulness of non-financial
reporting practice of South African companies. In addition, the future studies could focus on
decision-usefulness of specific environmental disclosures such as climate change disclosures.
The comprehensive framework developed in this study to evaluate the quality of environmental
reports is an initial step in the direction of examining decision-usefulness of environmental
reports. The content analysis instruments alongside the decision-usefulness theory employed in
this study to gauge and explain the decision-usefulness of environmental reports, could be utilised
and even expanded to investigate the decision-usefulness of non-financial reports in other
countries, perhaps in form of a comparative analysis, with a view to identify similarities,
differences and the best practice worth emulating. Alternatively, future research could evaluate
other qualitative characteristics of environmental reports apart from the ones mentioned in this
study, or even just focus on just one qualitative characteristic discussed in this study such as
reliability and analyse it comprehensively to provide a deeper insight. Another possible avenue
that could be pursued by future research could be in form of a more detailed content analysis of
environmental reports of companies in specific sectors, particularly those known to have a direct
or indirect significant impact on the environment.
374
8.11.2 Suggestions emanating from limitations of questionnaire survey phase of the study
Although various measures were undertaken to minimise non-response bias, still, there is a
possibility that non-response bias could have impacted the results of the study given the small
sample number of users and preparers selected to participate in the current study in relation to the
entire possible population of users and preparers. Future studies could further attempt to reduce
non-response bias and increase the generalisability of their findings by using a larger and more
diverse sample of users and preparers. The sampling of diverse users will also minimise the
influence of responses of prejudiced groups.
A questionnaire survey that elicits the perceptions of other user groups, other than those included
in this study is also necessary to determine whether there is some consistency in the desired
qualitative characteristics of environmental reports. The findings of such a questionnaire survey
could be compared to those of the current study to ascertain if a framework for a report that is
decision-useful to all user groups can be developed, or whether the needs of different user groups
are just too incompatible.
Given the inability of the researcher to probe responses and seek clarification for ambiguous
answers in a questionnaire survey such as this one, future studies could employ interviews to
mitigate these limitations (Nachmias & Nachmias, 1992; Al-Mubarak, 1997:181). The use of
interviews in the future studies will allow researchers an opportunity to assess a respondent's
understanding and interpretation of questions and to clarify any confusion that arises about the
meaning of the question or the response. In so doing, the interviews can provide a more useful and
richer insight into the decision-usefulness of environmental reports, particularly if the views and
perspectives of acknowledged experts on decision-usefulness of environmental reporting practices
are sought.
Given that questionnaire surveys do not provide answers to “why” questions, future studies could
use interviews to probe in detail why users read environmental reports, why they perceived certain
attributes of environmental reports to be more important than others, why certain possible users
did not read environmental reports, and why certain methods of reading environmental reports or
media are preferred. In addition, interviews could be used to investigate why the reports are used
more for some purposes than for others, why users find environmental reports to be useful yet

375
they are dissatisfied by the reports and why they perceive the reports to be more important than
financial reports/statements and other reports. The interviews may also be in form of case studies
meant to provide a richer and deeper understanding of decision-usefulness of environmental
reports produced by the best reporting companies. This could entail asking questions why and
how the companies produce more decision-useful reports than other companies, with a view to
establish the best practice that can be emulated by others.
In addition, interviews can be used to deal with situations that pose challenges for mail-out
questionnaires, such as eliciting responses from respondents lacking in reading and writing skills
or when sensitive information is sought. Using face-to-face interviews in future studies can ensure
that only appropriate respondents participate in the study, and that they are encouraged to provide
candid responses with a degree of choice and free will, as opposed to providing responses
perceived to be socially desirable. An alternative method through that future studies could ensure
that respondents responses are candid is by using experiments as opposed to questionnaire
surveys.
The current study's results reveal that the most popular way of increasing users' satisfaction with
the decision-usefulness of environmental reports is by independent assurance of the reports. Yet
when users are asked to rank various statements according to their perceived importance, they
rank a statement on usage of an assurance statement much lower than other statements that
enhance decision-usefulness of the reports. Such a contradicting result suggests a need for further
research, perhaps using a bigger and more diverse sample, to ascertain users perceptions on
assurance statements.
The decision-usefulness of environmental reports to three user groups was ascertained in the
current study, as if the groups and as if environmental disclosures in reports were homogenous.
The study could be extended further by ascertaining the types and attributes of environmental
reports' disclosures that are decision-useful to specific user groups. Likewise, the current study
elicited the views of users in a snapshot. An empirical study that examines the perceptions of users
and preparers over a period of several years may add value to literature as individuals view on
decision-usefulness of environmental reports are bound to change with the passage of time.

376
8.11.3 Other suggestions for further research
As suggested earlier, the government and standard setters/guideline developers may wish to take
into consideration the findings of this study when revising legislation and accounting
standards/guidelines, or when formulating new ones. Further research could investigate whether
legislation or standards/guidelines are the most appropriate or feasible way to enhance the
decision-usefulness of environmental reports, or whether other disclosure enforcement
mechanisms such as listing requirements, environmental awards are more appropriate. If
legislation or standards/guidelines are found to be appropriate and feasible, subsequent research
could further investigate the willingness of the government and standard setters/guideline
developers to introduce new legislations or standards/guidelines that require reporting of decision-
useful environmental information.
8.12 FINAL CONCLUDING REMARKS
The overall conclusion of the thesis is that the environmental reports produced by top 100 listed
South African companies are not only decision-useful, but also that the users of those reports
perceive them to be decision-useful. Accordingly the hypothesis posited in the first chapter that
users of environmental reports prepared by South African companies do not find those reports to
be useful for decision-making is rejected.
377
BIBLIOGRAPHY
3BL Media. 2011. Finalists Chosen for Ceres-ACCA North American Sustainability Reporting
Awards. <http://www.earthtimes.org/articles/press/american-sustainability-reporting-
awards1628141.html> Accessed 15 February 2011.
Abbott, W.F. & Monsen, R.J. 1979. On the measurement of corporate social responsibility: self
reported disclosures as a method of measuring corporate involvement. Academy of Management
Journal, 22(3):50–515.
Abu-Baker, N.I. & Karim, N.M. 1997. Corporate social responsibility and accountability as a
comprehensive approach for developing reporting and disclosure practices in Jordan. Dirasat,
Administrative Sciences, 25(2):409–428.
Accenture & United Nations Global Compact (UNGC). 201.UN Global Compact-Accenture CEO
study : towards a new era of sustainability in the banking industry.
<http://www.unglobalcompact.org/docs/news.../8.../UNGC_Accenture_Banking.pd> Accessed
28 February 2011.
AccountAbility. 2006. The materiality report: aligning strategy, performance and reporting.
<http://www.accountability.org/images/.../0/8/.../The%20Materiality%20Report.pdf> Accessed
25 May 2011.
AccountAbility. 2008. Introduction to the revised AA1000 Assurance Standard and the AA1000
AccountAbility Principles Standard 2008. <http://www.accountability.org/about-us/publications/
introduction-to.html> Accessed 28 August 2011.
Adams, C.A. 2002. Internal organisational factors influencing corporate social and ethical
reporting: Beyond current theorising. Accounting, Auditing & Accountability Journal, 15(2):223–
250.
Adams, M.B. 1994. Agency Theory and the Internal Audit. Managerial Auditing Journal, 9(8):8–
12.
378
Adams. R. 2008. Accounting Report.
<http://www.unep.fr/scp/csd/wssd/contributions/sector_reports/sectors/accounting/account_sum.
html> Accessed 15 February 2011.
Admiraal, M., Nivra, R. & Turksema, R. 2009. Reporting on non financial information.
<http//www.intosaijournal.org/technicalarticles/technicaljul2009b.html> Accessed 15 December
2009.
Aerts, W. & Cormier, D. 2009. Media legitimacy and corporate environmental communication.
Accounting, Organizations and Society, 34(1):1–27.
Afi .(2013). Management information systems. <http://www.afi.es/afi/libre/PDFS/Grupo/Folletos
/afimis_eng.pdf> Accessed 18 March 2014.
Ahmad Z., Hassan S., & Mohammad J. 2003. Determinants of environmental reporting in
Malaysia. International Journal of Business Studies, 11(1):69–90.
Ahmed, K. & Courtis, J.K. 1999. Associations between corporate characteristics and disclosure
levels in annual reports: A meta-analysis. British Accounting Review, 31:35–61.
Alexander, D., Britton, A. & Jorissen, A. 2007. (3rd ed.). International financial reporting and
analysis. London:Thomson Learning.
Alin, I., Victor, M. & Dumitru, M. 2011. Environmental reporting within the Romanian
companies. International Journal of Energy and Environment, 1(5):123–131.
Al-Mubarak, F. 1997. "The usefulness of corporate annual reports to investment analysts in Saudi
Arabia." Unpublished Doctor of Philosophy thesis. Newcastle. Newcastle University.
Alrazi, B., De Villiers, C. & Van Staden, C. 2011. The comprehensiveness of environmental
reporting by global electric utilities: The type of information and the reporting media. Paper
submitted at the NZ Sustainability Accounting Research Symposium, Auckland. August.
379
Ambe, C.M. 2007. "Environmental management accounting in South Africa: status, challanges
and implementation framework." Unpublished Doctor of Technology thesis: Cost and
management accounting thesis. Pretoria. Tswane University of Technology.
American Accounting Association. 1966. A Statement of Basic Accounting Theory. Sarasota,
Florida:American Accounting Association.
American Accounting Association. 1977. Statement on Accounting Theory and Theory
Acceptance. Sarasota, Florida:American Accounting Association.
American Institute of Certified Public Accountants (AICPA). 1973. Objectives of financial
statements: Report of the study group on the objectives of financial statements. New
York:American Institute of Certified Public Accountants.
American Institute of Certified Public Accountants (AICPA), Canadian Institute of Chartered
Accountants (CICA) & Chartered Institute of Management Accountants (CIMA). 2010. Evolution
of corporate sustainability practices perspectives from the UK, US and Canada.
<http://www.cica.ca/research-and-guidance/mda-and.../item45663.pdf> Accessed 16 February
2011.
Antal, A. B., Dierkes, M., MacMillan. K & Marz, L. 2002. Corporate social reporting revisited.
<http://www.bibliothek.wz-berlin.de/pdf/2002/ii02-105.pdf> Accessed 15 December 2009.
Antal, A.B & Sobczak, A. 2004. Beyond CSR: Organizational Learning for Global Responsibility.
<http://www.mendeley.com/.../beyond-csr-organisational-learning-global-responsibility/-United>
Accessed 15 December 2010.
Antonites, E. & De Villiers, C.J. 2003. Trends in South African corporate environmental
reporting: a research note. Meditari Accountancy Research, 11:1–10.
Arrington, E. 1990. Intellectual tyranny and the public interest: the quest for the Holy Grail and
the quality of life. Advances in Public Interest Accounting, 3:1–16.

380
Asian Development Bank. 2009. Observations and suggestions. <http://www.adb.org/Documents/
PRCM/PRC-Environmental-Assessment.pdf> Accessed 30 December 2009.
Association of Chartered Certified Accountants (ACCA). 2002. Industry as a partner for
sustainable development. <http://www.accaglobal.com/pubs/general/activities/library/> Accessed
20 December 2010.
Association of Chartered Certified Accountants (ACCA). 2007. Social and environmental
reporting and the business case. <http://www2.accaglobal.com/pubs/general/activities/> Accessed
15 February 2011.
Association of Chartered Certified Accountants (ACCA). 2009. Key issues in sustainability
assurance. <http://www2.accaglobal.com/pubs/general/activities/research> Accessed
19 November 2010.
Association of Chartered Certified Accountants (ACCA). 2010. Sustainability reporting
sustainability disclosure amongst companies in selected ASEAN member countries and responses
from stakeholders. <http://www.reportingrse.org/force_document.php?...report> Accessed
21 November 2010.
Association of Chartered Certified Accountants (ACCA) & AccountAbility. 2004. The future of
sustainability assurance: ACCA research report no. 86. <http://www2.Acca
global.com/pubs/general./.../research/research.../rr-086-001.pdf> Accessed 28 December 2010.
Association of Chartered Certified Accountants (ACCA) & CorporateRegister.com. 2001.
Environmental, social and sustainability reporting on the World Wide Web: a guide to best
practice. <http://www.corporateregister.com/pdf/Guide.pdf> Accessed 15 February 2011.
Australasian Reporting Awards (ARA). 2011. Introduction to the ARA criteria.
<http://www.araward.com.au/index.php/eng/Criteria> Accessed 19 July 2011.
Azzone, G., Brophy, M., Noci, G. Welford, R. & Young.W. 1997. A stakeholders' view of
environmental reporting. Long Range Planning, 30(5):699–709.
381
Bae, B. & Ashcroft, P. 2004. Implementation of ERP Systems: Accounting and Auditing
implications. <http://www.isaca.org/journal/past-issues/2004/volume-5/documents/jpdf045
-implementationoferpsystem.pdf> Accessed 18 July 2011.
Bailey, D. 1990. Accounting: tool of business or tool of society? In: Cooper, D.J. & Hopper, T.M.
(eds.). Critical accounts. London:MacMillan.
Barac, K. 2004. Financial reporting on the Internet in South Africa. Meditari Accountancy
Research 12(1):1–20.
Barbu, E., Dumontier, P, Feleaga, N. & Feleaga, L. 2012. Mandatory Environmental Disclosures
by Companies Complying with IAS/IFRS: The Case of France, Germany and the UK. The
International Journal of Accounting, 49(2):248-252.
Barker, R. 1998. The market for information: evidence from finance directors, analysts and fund
managers. Accounting and Business Research, 29(1):3–20.
Bartlett, S. & Chandler R.A. 1997. The corporate report and the private shareholder: Lee and
Tweedie twenty years on. British Accounting Review, 29(3):245–261.
Batt C. 2000. Companies far from passing the green test.
<http://www.theage.com.au/news/20001026/A8985-2000Oct26.html> Accessed 23 March 2011.
Baue, B. & Murninghan, M. 2010. The accountability web: weaving corporate accountability and
interactivetechnology . <http://www.hks.harvard.edu/m.../workingpaper> Accessed 25 August
2011.
Bay, N. & Petit, C. 1998. Company Boards: Looking for Balance, Australian CPA, 29–31.
Beattie, V. & Pratt, K. 2002. Voluntary annual report disclosures: what users want. The Institute
of Chartered Accountants of Scotland. Edinburgh.
Bebbington, J. & Gray, R.H. 2001. An Account of Sustainability: Failure, success and a

382
reconceptualisation. Critical Perspectives on Accounting, 12(5):557–587.
Bebbington, J., Gray, R. & Laughlin, R. 2001. Financial Accounting: Practice and Principles.
London:International Thomson Business Press.
Bebbington, J & Larrinaga, C. 2007. Environmental Reporting in the UK: An Analysis of
Emerging Trends. Paper presented at the British Accounting Association Annual Conference,
Royal Holloway. April.
Belkaoui, A. 1984. Socio-Economic Accounting. Connecticut:Quorum Books.
Belkaoui, A.R. 1992. (3rd ed.). Accounting theory. London:Academic Press.
Belkaoui, A. R. 2004. (5th ed.). Accounting theory. London:Thomson Learning.
Belkaoui, A.R. & Jones, S. 1996. (1st Australian ed.). Accounting Theory. Sydney,
Australia:Harcourt Brace and Company.
Benjamin, J.J. & Stanga, K.G. 1977. Differences in disclosure needs of major users of financial
statements. Accounting and Business Research, 7(27):187–192.
Beretta, S. & Bozzolan, S. 2004. A framework for the analysis of risk communication.
International Journal of Accounting, 39(3):265–288.
Bettenhausen, K., Byrd. J. & Cooperman, E.S. 2010. Environmental risk and shareholder returns:
Evidence from the announcement of the toxic 100 index. International Review of Accounting,
Banking and Finance, 2(3):28–45.
Blacconiere, W.G. & Patten, D.M. 1994. Environmental disclosures, regulatory costs and changes
in firm value. Journal of Accounting and Economics, 18:357–77.
Black, T.R. 1999. (1st ed.). Doing quantitative research in the social sciences: an integrated
approach to research design, measurement and statistics. London:Sage Publications.

383
Blundell, A.W. 2007. "Continuous auditing technologies and models." Unpublished Master’s
Dissertation, Port Elizabeth. Nelson Mandela Metropolitan University.
Bogiages, G.H. & Vorster, Q. 1993. Green reporting in the Republic of South Africa. Pretoria:
School of Accounting Sciences, University of Pretoria.
Boiral, O. 2010. Can sustainability performance be compared?
<http://www.cirano.qc.ca/note/2010-01a.pdf> Accessed 28 December 2010.
Bolivar, M.P.R. 2009. Evaluating Corporate Environmental Reporting on the Internet: Utility and
Resource Industries in Spain, Business and Society, 48 (2):179–205.
Bond, D. 2013. Governing disaster: the political life of the environment during the BP oil spill.
Cultural anthropology, 28(4):694–715.
Booth, P., Moores, K.J. & McNamara, R. 1987. Researching the information content of social
responsibility disclosures. British Accounting Review, 19(1):31–51.
Borkowski, S.C., Welsh, M.J. & Wentzel, K. 2010. Johnson & Johnson: A model for sustainability
reporting. Strategic Finance, 92(3):29–37.
Botosan, C.A. 1997. Disclosure level and the cost of equity capital. The Accounting Review,
72(3):323-349.
Boudreau, M.C., Gefen, D. & Straub, D. 2001. Validation in information systems research: A State
of the art assessment. MIS Quarterly, 25(1):1–16.
Brammer, S.J. & Pavelin, S. 2006. Voluntary environmental disclosures by large UK companies.
Journal of Business Finance and Accounting, 33(7):1168–1188.
Brink, T.M.W. & Woerd, F. 2003. Industry specific sustainability benchmarks: an ECSF pilot
bridging corporate sustainability with social responsible investments. <http://www.ecsf. info/
uploaded/040524150038.pdf> Accessed 18 December 2010.
384
Bromley, P. & Powell, W.W. 2012. From smoke and mirrors to walking the talk: Decoupling in the
contemporary world. Academy of Management Annals, 6(1):483–530.
Brown, H.S., Jong. M. & Lessidrenska, T. 2007. The rise of the Global Reporting Initiative (GRI)
as a Case of Institutional Entrepreneurship. <http://www.hks.harvard .edu/m-rcbg/CSRI/working
paper_36_brown.pdf> Accessed 15 December 2010.
Buhr, N. 1998. Environmental performance, legislation and annual report disclosure: The case of
Acid Rain and Falconbridge. Accounting, Auditing and Accountability Journal, 11(2):163–190.
Buniamin, S., Alrazi, B., Johari, N.H. & Rahman, N.R. 2008. An investigation of the association
between corporate governance and environmental reporting in Malaysia. Asian Journal of
Business and Accounting, 1(2):65–88.
Burrowes, A., Sparkes, A. & Adams, A. 2001. Ethical considerations of environmental
disclosures: a case study of Kemira Oyj, Finland. <http://www.wei.research.glam.ac.uk/>
Accessed 15 December 2010.
Business & Society, Morris & Chapman 2010. Survey of best practices, trends and benchmarks in
sustainability reporting. <http://www.businessandsociety.be/.../883c0525> Accessed 28 December
2010.
Business in the Environment (BiE). 1994. City Analysts and the Environment, Business in the
Environment, London.
Buys, P. 2010. Ontology and epistemology: a transcendental reflection on decision-usefulness as
an accounting objective. South African Journal of Economic and Management Sciences,
14(1):109–121.
Buzby, S. & Falk, H. 1978. A survey of the interest in social responsibility information mutual
funds. Accounting, Organizations and Society, 3(3):191–201.
Came, F. 2011. Do markets really respond to corporate sustainability efforts?
385
<http://www.greenbiz.com/news/2011/03/24/do-markets-really-respond-corporate-sustainability-
efforts> Accessed 15 January 2013.
Campbell, D.J. 2001. Environmental disclosure in the UK corporate report: some evidence for
Legitimacy theory. Paper presented at the 10th CSEAR summer school, Glasgow. September.
Campbell, D. 2004. A longitudinal and cross-sectional analysis of environmental disclosure in UK
companies- a research note. The British Accounting Review, 36, 107–117.
Campbell, D. & Slack, R. 2008. Narrative reporting: analysts' perceptions of its value and
relevance. <http://www2.accaglobal.com/pubs/economy/analysis/acca/.../tech_3.pdf> Accessed
10 January 2012.
Canadian Business for Social Responsibility (CBSR) & Craib Design and Communications
(CDC). 2008. CSR trends 2008. Our 2nd comprehensive survey of sustainability report trends,
benchmarks and best practices.
<http://www.csr360gpn.org/uploads/files/resources/CSR_Trends08. pdf> Accessed 28 December
2010.
Canadian Institute of Chartered Accountants (CICA). 1980. Stamp Report: Corporate reporting:
its future evolution. Toronto:Canadian Institute of Chartered Accountants.
Carbon Disclosure Project. 2010. Leadership indexes and the CDP 2010 disclosure and
performance scores. <https://www.cdproject.net/enUS/Results/pages/leadershipindex.aspx>
Accessed 5 January 2011.
Cespa, G. & Cestone, G. 2007. Corporate Social Responsibility and Managerial Entrenchment.
<http://www.ideas.repec.org/p/sef/csefwp/173.html> Accessed 12 January 2012.
Chambers, R.J. 1955. Blueprint For a Theory of Accounting. Accounting Research, 6(1):17–25.
Chambers, R.J. 1957. Detail for a Blueprint. The Accounting Review, 32(2):206–15.

386
Chambers, R.J. 1966. Accounting, evaluation and economic behavior. Englewood Cliffs, New
Jersey:Prentice-Hall Inc.
Chan, C.C.C. & Milne, M.J. 1999. Investor Reactions to Corporate Environmental Saints and
Sinners: An Experimental Analysis. Accounting and Business Research, 29(4):265–279.
Charter, M., Peattie, K. Ottman, J. & Polonsky, M.J. 2002. Marketing & sustainability.
<http://www.cfsd.org.uk/smart-know-net/smart-know-net.pdf> Accessed 10 January 2012.
Chatterjee, B. & Mir, M.Z. 2008. The current status of environmental reporting by Indian
companies, Managerial Auditing Journal, 23(6):609–629.
Chen, A.S. & Hsu, M.H., Chen T.S, Chang T.J. 2005. An integrated inundation model for highly
developed urban areas, Water Sci Technol, 51(2):221–229.
Chenhall, R.H. & Juchau, R. 1977. Investor information needs: An Australian study. Accounting
& Business Research, 7(27):111–119.
Chironna, J. & Zwikker, E. 2010. XBRL opens doors for auditors in governance, risk
management, and compliance.
<http://www.bowne.com/securitiesconnect/details.asp?storyID=2091> Accessed 15 February
2011.
Choi, J.S. 1999. An investigation of the initial voluntary environmental disclosures made in
Korean semi-annual financial reports. Pacific Accounting Review, 11(1):73–102.
Clarkson, P.M., Li, Y., Richardson, G.D. & Vasvari, F.P. 2008. Revisiting the relation between
environmental performance and environmental disclosure: An empirical analysis. Accounting,
Organizations and Society, 33(4-5):303–327.
Cloud 9. 2007. Revelations: the initial journey through the ages. <http://www.theinitial
journey.com/throughtheages/southafrica_01.html> Accessed 5 January 2011.

387
Coalition for Environmentally Responsible Economies (CERES) & Association of Chartered
Certified Accountants (ACCA). 2010. Report of the judges: CERES-ACCA North American
Awards for sustainability reporting 2010. <http://www.ceres.org/resources/reports/2010-judges-
report/at_download/file> Accessed 20 December 2010.
Coetsee, D. 2010. The role of accounting theory in the development of accounting principles.
Meditari Accountancy Research, 18(1):1–16.
Cormier, D. & Magnan, M. 2003. Environmental reporting management: A European perspective.
Journal of Accounting and Public Policy, 22(1):43–62.
Congressional Research Service (CRS). 2010. The Emergency Planning and Community Right-
to-Know Act (EPCRA): a summary. <http://www.fas.org/sgp/crs/misc/RL32683.pd> Accessed
18 January 2011.
Cooke, T.E. 1989. Voluntary corporate disclosure by Swedish companies. Journal of International
Financial Management and Accounting, 1(2):171–195.
Cooper, D.J. 1988. A social analysis of of corporate pollution disclosures: a comment. Advances
in Public Interest Accounting, 2:179-86.
Coopers & Lybrand Consultants. 1993. Business and the environment: An executive guide.
Sydney:Coopers & Lybrand.
Cooper, D.J. & Sherer, M.J. 1984. The value of corporate accounting reports: arguments for a
political economy of accounting. Accounting Organisations and Society, 9(3/4):207–232.
CorporateRegister.com. 2007. The corporate climate communications report 2007 : a study of
climate change disclosures by the global FT500. <http://www.corporate
register.com/pdf/CCCReport_07.pdf> Accessed 29 May 2011.
CorporateRegister.com. 2008. Global winners and reporting trends.
<http://www.corporateregister.com/pdf/CRRA07.pdf> Accessed 25 January 2011.

388
Corporate Register.com. 2009. CRRA: CR Reporting Awards '08: global winners & reporting
trends. <http://www.corporateregister.com/pdf/CRRA08.pdf> Accessed 30 May 2011.
CorporateRegister.com. 2010. CRRA: CR Reporting Awards '10: global winners & reporting
trends. <http://www.corporateregister.com/pdf/CRRA10.pdf> Accessed 28 March 2011.
CorporateRegister.com & Association of Chartered Certified Accountants (ACCA). 2004.
Towards transparency: progress on global sustainability reporting.
<http://www.corporateregister.com/pdf/TowardsTransparency.pdf.> Accessed 25 February 2011.
Corporate Responsibility Coalition (CRC). 2011. Simply put: towards an effective UK regime for
environmental and social reporting by companies. <http://www.corporate-responsibility.org/wp/
wp-content/uploads/2011/.../Simply-Put.pd> Accessed 18 July 2011.
Cowan, S. 2007. "Environmental reporting and the impacts of mandatory reporting requirements."
Unpublished Doctorate thesis, Melbourne, Royal Melbourne Institute of Technology university.
Cowen, S.S., Ferreri, L.B., & Parker, L.D. 1987. The impact of corporate characteristics on social
responsibility disclosure: A typology and frequency based analysis. Accounting, Organizations
and Society, 12(2):111-122.
Coy, D. & Dixon, K. 2004. The public accountability index: Crafting a parametric disclosure
index for annual reports. British Accounting Review, 36:79–106.
CPA Australia & Global Reporting Initiative (GRI). 2013. Sustainability reporting: Practices,
performance and potential.
<http://www.cpaaustralia.com.au/~/media/corporate/allfiles/document/ professional-
resources/sustainability/sustainability-reporting-practice-performance-potential.pdf> Accessed
16 September 2014.
Craib Design & Communications (CDC). 2007. CSR trends 2007. <http://www.craib.com/csr-
trends/context/reporting_on_the_issues.html> Accessed 28 December 2011.
389
Craib Design and Communications (CDC) & PricewaterhouseCoopers (PwC). 2009. A
comprehensive survey of corporate social responsibility report trends, benchmarks and best
practices.<http//www.pwc.com/ca/en/sustainability/.../csr-trends-3-en.pdf> Accessed 20 January
2011.
Craib Design and Communications (CDC) & PricewaterhouseCoopers (PwC). 2010. CSR trends
2010: Our fourth comprehensive survey of corporate social responsibility report trends,
benchmarks and best practices. <http//www.pwc.com/ca/en/sustainability/.../csr-trends-2010-
09.pdf> Accessed 18 January 2012.
Craig, R. & Bailey, M. 1987. The presentation of corporate social responsibility disclosures. The
Chartered Accountant in Australia, 54–57.
Creswell, J. W. 2003. (2nd ed.). Research design: qualitative, quantitative and mixed methods
approaches. Thousand Oaks, California:Sage Publications.
Creswell, J.W. 2005. (2nd ed.). Educational research: Planning, conducting, and evaluating
quantitative and qualitative research. New Jersey:Pearson Education Inc.
Cronje, C.J. 2010. A more subtle set of information in corporate annual reports for disadvantaged
stakeholders. South African Journal of Economic and Management Sciences, 13(2):222–235.
CPA Australia. 2005. Sustainability reporting perspectives on regulatory and professional
initiatives across the Asia Pacific. <http://www.cpaaustralia.com.au/cps../rde/.../asia-pacific-
sustainability-reporting.pdf> Accessed 5 January 2011.
CSR Europe. 2010. A CSR Europe contribution to the European Commission ESG workshops
2009/2010. <http://www.ec.europa.eu/.../corporate-social-responsibility/.../trends_and_best_p
ractice> Accessed 19 July 2011.
CXOtoday. 2009. SAP Launches Sustainability Management App.
<http://www.cxotoday.Com/story /sap-launches-sustainability-management-app> Accessed
5 January 2011.

390
D'Amato, A., Henderson, S. & Florence, S. 2009. Corporate social responsibility and sustainable
business: a guide to leadership tasks and function.
<http://www.ccl.org/leadership/pdf/research/CorporateSocialResponsibility.pdf> Accessed
10 January 2011.
Danastas, L. & Gadenne, D. 2004. A Study of external pressure groups: users of corporate social
disclosure. Paper presented at the Corporate Governance and Ethics Conference, Sydney. June.
Danastas, L., & Gadenne, D. 2006. Social and Environmental NGO's as users of Corporate Social.
Disclosure. Journal of Environmental Policy and Management, 8(1):85–102.
Danish Commerce and Companies Agency (DCCA). 2010. Corporate social responsibility and
reporting in Denmark impact of the legal requirement for reporting on CSR in the Danish
Financial Statements Act.
<http://www.dcca.dk/graphics/.../CSR/CSR_and_Reporting_in_Denmark.pdf> Accessed 12 June
2011.
Das, A.S. 2010. New Survey Shows Most CEOs Want to Pursue Sustainability But Lack Clear
Definition? <http://www.sustainabilityforum.com/blog/new-survey-shows-most-ceos-want-
pursue-sustainability-lack-clear-definition> Accessed 12 June 2011.
Day, F.S. 1986. The use of annual reports by UK investment analysts. Accounting and Business
Research, 16(64):295–307.
Deegan, C. & Gordon, B. 1996. A study of the environmental disclosure policies of Australian
corporations. Accounting and Business Research, 26(3):187–99.
Deegan, C. & Rankin, M. 1996. Do Australian companies report environmental news objectively?
An analysis of environmental disclosures by firms prosecuted successfully by the Environmental
protection Authority, Accounting Auditing and Accountability Journal, 9(2):52–69.
Deegan, C. & Rankin, M. 1997. The materiality of environmental information to users of annual
reports. Accounting Auditing and Accountability Journal, 10(4):562–583.

391
Deegan, C. & Rankin, M. 1999. The Environmental Reporting Expectations Gap: Australian
Evidence. British Accounting Review, 31:313–346.
Deegan, C. 2002. The legitimising effect of social and environmental disclosures: a theoretical
foundation. Accounting, Auditing & Accountability Journal, 15(3):282–311.
Deegan. C. 2006. Financial Accounting Theory.( 2nd ed.). Sydney:McGraw-Hill Book Company.
Deegan. C. 2011. Financial Accounting Theory. (3rd ed.). Sydney:McGraw-Hill Book Company.
Deegan, C. & Blomquist, C. 2006. Stakeholder influence on corporate reporting: an exploration of
the interaction between the World Wide Fund for nature and the Australian minerals industry.
Accounting, Organizations and Society, 31(45):343-372.
Deegan C. & Blomquist C. (2001). Stakeholder influence on corporate reporting: An exploration
of the interaction between the World Wide Fund for Nature and the Australian Minerals Industry.
Paper presented at the Asia Pacific interdisciplinary research in accounting conference, Adelaide,
15-17 July.
Deegan. C., Cooper. B.J., & Shelly, M. 2006. An investigation of TBL report assurance
statements: UK and European evidence. Managerial Auditing Journal, 21:329-371.
Deegan, C. & Gordon, B. 1996. A Study of The Environmental Disclosure Practices of Australian
Corporations. Accounting and Business Research, 26(3):187–199.
Deegan C. & Haque, S. 2009. An exploration of corporate climate change-related governance
practices and related disclosures: Evidence from Australia. Paper presented at the accounting &
finance association conference of Australia and New Zealand (AFAANZ), Adelaide. July.
Deegan C. & Islam, M. 2009. NGO's use of the media to create changes in corporate activities
and accountabilities: evidence from a developing country. Paper presented at the accounting &
finance association conference of Australia and New Zealand (AFAANZ), Adelaide. July.
392
Deegan, C. & Rankin, M. 1997. The materiality of environmental information to users of annual
reports. Accounting, Auditing and Accountability Journal, 10(4):562–583.
Deegan, C. & Rankin, M. 1999. The environmental reporting expectations gap: Australian
evidence. British Accounting Review, 31(3):313–346.
Deegan, C. & Unerman, J. 2006. Financial accounting theory. European edition.
Berkshire:McGraw-Hill.
Delmas, M. & Burbano, V.C. 2011. The Drivers of Greenwashing. California Management
Review. 54(1):64–87.
Deloitte. 2009. CFO insights: sustainability: developing key performance indicators measuring
sustainability is the bottom Line.
<http://www.deloitte.com/.../us_cfo_kpis%20for%20sustainability_Nov202009.pd> Accessed
17 July 2011.
Deloitte. 2011. Sustainability reporting managing risks and opportunities.
<http://www.deloitte.com/us_fas_dfc_Sustainability%20Reporting_030411%20> Accessed
19 June 2011.
Delloite Touche Tohmatsu (DTT). 2002. Deloitte Sustainability Reporting Scorecard.
<http://www.deloitte. com/ assets/ Dcom.../DTT_ERS_FullScorecard_032106.pdf> Accessed
15 January 2011.
Denis, D.J., Denis, K.D. & Sarin, A. 1999. Agency theory and the influence of equity ownership
structure on corporate diversification strategies. Strategic Management Journal, 20(11):1071–
1076.
De Vaus, D.A. 1996. Surveys in Social Research (4th ed.). London:University College London
Press.
Devine, C.T. 1960. Research methodology and accounting theory formation. Accounting Review,
393
387–399.
De Villiers, C.J. 1996. "The awareness level of different stakeholder groups and their willingness
to support corporate environmental reporting in South Africa." Unpublished Doctor of Commerce
thesis. Pretoria. University of Pretoria.
De Villiers, C.J. 1998a. South African environmental reporting: what it is, what it should be.
<http://www.www3.bus.osaka-cu.ac.jp/apira98/archives/pdfs/18.pdf> Accessed 23 March 2010.
De Villiers, C.J. 1998b. The willingness of South Africans to support more green reporting. South
African Journal of Economic and Management Sciences, NS, 1(1):145–167.
De Villiers, C.J. 2000. Social responsibility disclosure by South African industrial holding
companies: a research note. South African Journal of Accounting Research,14(1):65–73.
De Villiers, C.J. 2003.Why do South African companies not report more environmental
information when managers are so positive about this kind of reporting? Meditari Accountancy
Research, 11:11–23.
De Villiers, C.J. & Antonites, E. 2003.Trends in South African corporate environmental reporting:
a research note. Meditari Accountancy Research, 14:1–10.
De Villiers, C.J. & Barnard, P. 2000. Environmental reporting in South Africa from 1994
to 1999: A research note. Meditari Accountancy Research, 8:15–23.
De Villiers, C.J. & Lubbe, D.S. 2001. Industry differences in respect of corporate environmental
reporting in South Africa: A research note. Meditari Accountancy Research, 9:81–91.
De Villiers, C.J. & Van Staden, C.J. 2006. Can less environmental disclosure have a legitimising
effect? Evidence from Africa. Accounting, Organizations and Society, 31:763–781.
De Villiers, C. & Van Staden, C. 2008. Environmental accountability: a shareholder requirement?
Paper presented at the accounting & finance association of Australia and New Zealand

394
(AFAANZ), Adelaide. July.
De Villiers, C. & Van Staden, C. 2009. Good, bad and crisis firms: how much and where they
disclose environmental information. Paper presented at the accounting & finance association of
Australia and New Zealand (AFAANZ), Adelaide. July.
De Villiers, C. & Van Staden, C.J. 2010a. Shareholders' requirements for corporate environmental
disclosures: a cross country comparison. British Accounting Review, 429(4):227–240.
De Villiers, C.J. & Van Staden, C.J. 2010b. Shareholders’ corporate environmental disclosure
need. South African Journal of Economic and Management Sciences, 13(4):436–445.
De Villiers, C. & Van Staden, C. 2011. Where firms choose to disclose voluntary environmental
information. Journal of Accounting and Public Policy, 30(6):504–521.
De Villiers, C.J. & Vorster, Q. 1995. More corporate environmental reporting in South Africa?
Meditari Accountancy Research, 3:44–66.
De Vries, I. & De Villiers, C.J. 1997. Ethical investing by South African unit trust managers,
Meditari Accountancy Research, 3–43.
Dierkes, M. & Antal, A.B. 1985. The usefulness and use of social reporting information.
Accounting, Organizations and Society, 10(1):29–34.
Douglas, A., Doris, J., & Johnson, B. (2004). Case study: Corporate social reporting in Irish
financial institutions. The TQM Magazine, 16(6):387–395.
Earl, G. & Clift, R. 1999. Stakeholder value analysis: a methodology for integrating. stakeholder
values into corporate environmental investment decisions. Business Strategy Environment, 8:149–
162.
Economist Intelligence Unit (EIU). 2010. Global trends in sustainability performance
management <http://www.fm.sap.com/.../EIU__Sustainability_Performance_Management>
395
Accessed 15 January 2011.
Elkington, J. & Thorpe, J. 2009. The road to credibility.
<http://www.123people.co.uk/s/jodie+thorpe> Accessed 30 January 2011.
Emtairah, T. 2002. Corporate environmental policy: review of policy action in Europe.
<http://www.iiiee.lu.se/commerce/research> Accessed 5 August 2009.
Environmental Agency. 2004. Environmental disclosures in the annual report & accounts of
companies in FTSE All-Share. <http://www.environment-agency.gov.uk> Accessed 5 September
2011.
Environmental Agency. 2009. Environmental disclosures: the third major review of environmental
reporting in the annual report & accounts of the FTSE all-Share companies.
<http://www.Environ- ment agency.gov.uk/.../Business/Environmental_Disclosures. Accessed
10 September 2011.
Environmental Agency. 2010. Environmental disclosures summary key findings of the third major
review of environmental reporting in the annual report & accounts of the FTSE All-Share
companies. <http://www.environmentagency.gov.uk/.../Environmental_Disclosures_summary>
Accessed 6 September 2011.
Environmental Agency. 2011. European Pollutant Release and Transfer Register.
<http://www.environment-agency.gov.uk/business/.../pollution/36750.aspx> Accessed 26 May
2011.
Environmental Leader. 2009. GRI touts 46% increased use of gri guidelines in sustainability
reporting. <http://www.environmentalleader.com/.../gri-touts-46-increase-use-of-gri-guideline>
Accessed 15 August 2011.
Environmental Leader. 2011. Big four audit firms lead sustainability assurance services.
<http://www.environmentalleader.com/.../big-four-audit-firms-lead-sustainability> Accessed
25 March 2011.
396
Environmental Mainstreaming Initiative (EMI). 2007. Profiles of tools and tactics for
environmental mainstreaming. <http://www. environmental-mainstreaming.org/.../EM%20Profile
%20No%205%2> Accessed 25 April 2011.
Environment News Service. 2005. Rio Stock Exchange begins trade in Carbon Credits.
<http://www.ens-newswire.com/ens/nov2005/2005-11-23-01.asp> Accessed 03 September 2011.
Environmental Protection Agency. 2008. Understanding the Clean Air Act .
<http://www.epa.gov/air/peg/understand.html> Accessed 5 August 2009.
Environmental Protection Agency. 2010. History of the Clean Air Act.
<http://www.epa.gov/air/caa/ caa_history.html> Accessed 5 January 2011.
Epstein, M. 1991. What shareholders really want. New York Times. April 28.
Epstein, M. & Friedman, M. 1994. Social disclosure and the individual investor. Accounting,
Auditing and Accountability Journal, 7(4):94–109.
Epstein, M.J. & Roy, M.J. 2001. Sustainability in action: identifying and measuring the key
performance drivers . Long Range Planning Journal, 34:585–604.
Ernst & Young. 2007. Keep the balance Steady : survey on the quality of sustainability reports
2007. <http://www.ec.europa.eu/enterprise/newsroom/cf/_getdocument.cfm?> Accessed
23 January 2011.
Ernst & Young. 2010. The financial sector from a non-financial perspective : the path forward.
<http://www.ey.com/Publication/...path_forward/.../The%20Path%20Forward.pdf> Accessed
25 January 2011.
Ernst & Young, & Greenbiz. 2013. Value of sustainability reporting.
<http://www.ey.com/US/en/Services/Specialty-Services/Climate-Change-and-Sustainability-
Services/Value-of-sustainability-reporting> Accessed 25 March 2013.
397
Ethical Investment Research Services (EIRS). 2007. The state of responsible business: global
corporate response to environmental, social and governance (ESG) challenges.
<http://www.Eiris.org/files/.../stateofespbusinessexecsumsep07.pdf> Accessed 25 January 2011.
European Commission. 2008. EMAS – Factsheet.
<http://www.ec.europa.eu/environment/emas/pdf/ factsheet/fs_iso_en.pdf> Accessed 25 March
2011.
European Commission. 2011a.What is EMAS? <http://ec.europa.eu/environment/emas/index
_en.htm> Accessed 22 August 2011.
European Commission. 2011b. The state of play in sustainability reporting in the European
Union. <http://www.ec.europa.eu/social/BlobServlet?docId=6728&langId=en> Accessed
25 January 2012.
European Environment Agency (EEA). 1998. Environmental management tools for SMEs: a
handbook. <http://www.eea.europa.eu/en/publications/GH-14-98-065-EN.../envii ssu10.pdf>
Accessed 5 September 2010.
Ernst & Young. 2007. Keep the balance Steady: survey on the quality of sustainability reports
2007. <http://www.ec.europa.eu/enterprise/newsroom/cf/_getdocument.cfm?> Accessed
23 January 2011.
Ernst & Young, & Greenbiz. 2013. Six growing trends in corporate
sustainability.<http://www.ey.com/Publication/vwLUAssets/Six_growing_trends_in_corporate_su
stainability_2013/$FILE/Six_growing_trends_in_corporate_sustainability_2013.pdf> Accessed
16 September 2014.
Fédération des Experts Comptables Européens (FEE). 1996. FEE’s activities in the area of
environmental reporting and environmental auditing. <http://www.p2pays.org/ref/26/25623.pdf>
Accessed 25 August 2011.
Fédération des Experts Comptables Européens (FEE). 2000. Towards a generally accepted
398
framework for environmental reporting.
<http://www.fee.be/publications/default.asp?library_ref=4 &content> Accessed 25 January 2011.
Ferro, N. 2006. Riding the waves of reforms in corporate law, an overview of recent
improvements in Italian corporate codes of conduct. http://ageconsearch.umn.edu/bitstream/
12125/1/ sp060082 .pdf. Accessed 23 March 2010.
Financial Accounting Standards Board (FASB). 1978. (SFAC No. 1): Objectives of financial
reporting. New York. Financial Accounting Standards Board.
Financial Accounting Standards Board (FASB). 2008. Conceptual framework: statement of
financial accounting concepts No. 8. <http://www.fasb.org/cs/BlobServer?blobcol=urldata&blob
table=MungoBlobs&blobkey=id&blobwhere=1175820900526&blobheader=application%2Fpdf>
Accessed 16 June 2010.
Financial Accounting Standards Board (FASB). 2010. Conceptual framework: statement of
financial accounting concepts No. 8.
<http://www.www.fasb.org/cs/BlobServer?blobcol...id...application%2Fpdf> Accessed 15 January
2011.
Flammer, C. 2012. Corporate social responsibility and stock prices: The environmental awareness
of shareholders. <http://www.corporate-sustainability.org/conferences/fourth.../Flammer.pdf>
Accessed 16 September 2014.
Fonseca, A. 2010. Barriers to strengthening the Global Reporting Initiative framework: exploring
the perceptions of consultants, practitioners, and researchers.
<http://www.csinrcid.ca/downloads/csin_conf_alberto_fonseca.pdf> Accessed 13 June 2011.
Fogarty, T. & Rogers, R. 2005. Financial analysts’ reports; an extended institutional theory
evaluation. Accounting, Organizations and Society, 30(4):331–356.
Fowler, F.J. 1988. Survey research methods. Beverly Hills, Carlifornia:Sage.

399
Freedman, M. & Jaggi, M. 1988. An analysis of the association between pollution disclosure and
economic performance. Accounting, Auditing & Accountability Journal, 1(2):43–58.
Freedman, M. & Patten, D.M. 2004. Evidence on the pernicious effect of financial report
environmental disclosure. Accounting Forum, 28(1):27–41.
Friedman, M. 1962. Capitalism and Freedom. Chicago, Illinois: University of Chicago Press.
Frost, G., Jones, S., Loftus J. & Van der Laan. S. 2005. A survey of sustainability reporting
practices of Australian reporting entities. Australian Accounting Review, 15(1):89–96.
Frost, G. R., & Wilmshurst, T. D. 2000. The Adoption of Environmental-Related Management
Accounting: An Analysis of Corporate Environmental Sensitivity. Accounting Forum., 24(4):344-
365.
Fung, A., Graham, M. & Weil, D. 2002. The political economy of transparency: what makes
disclosure policies sustainable?
<http://www.hidalgo.gob.mx/.../The%20Political%20Economy%20of%20Transparency%20What
%20Make> Accessed 23 March 2010.
Funnell, W.N. 1995. Preserving history in accounting: seeking common ground between new and
old history. <http://www.ro.uow.edu.au/cgi/viewcontent.cgi> Accessed 5 January 2011.
Furmann, S. Ott, C. Looks, E. & Gunther, T.W. 2013. The Contents of Assurance Statements of
Sustainability Reports and Information Asymmetry. <http://arw-suisse.ch/wp-content/uploads/
2013/05/fuhrmann-etal1.pdf> Accessed 16 September 2014.
Futtera Sustainability Communication (FSC), SustainAbility & KPMG. 2010. Reporting change:
readers & reporters survey 2010. <http://www.futerra.co.uk/download s/Reporting_Change.pdf>
Accessed 25 May 2011.
Gamble, G., Hsu, K., Kite, D. & Radtke. R. 1995. Environmental disclosures in annual reports and
10ks: An examination, Accounting Horizons, 9(3):34–54.

400
Gamble, G., Hsu, K., Jackson, C. & Tollerson, C. 1996. Environmental disclosures in annual
reports: An international perspective. The International Journal of Accounting, 31(3):293–331.
Gee. D. 2001. Business and the environment: current trends and developments in corporate
reporting and ranking. <http://www.pedz.uni-mannheim.de/daten/edz-bn/eua/01/tech54.pdf>
Accessed 23 March 2010.
Germanwatch. 2008. A brief legal opinion: minimum benchmarks for reporting of companies on
(climate) risks under European law : an analysis of Italian, French and German law.
<http://www.climate-mainstreaming.net/autoeu08.pdf> Accessed 5 July 2011.
Gillwald, A., Calandro, E. & Chetty, M. 2013. How do mobile and fixed broadband stack up in
SA? <http://www.researchictafrica.net/publications/Research_ICT_Africa_Policy_Briefs/
2013_RIA_Policy_Brief_No_2_-_How_do_mobile_and_fixed_broadband_stack_up_in_SA.pdf>
Accessed 20 December 2013.
Glautier, G.W.E. & Underdown, E. 1986. (3rd ed.). Accounting theory and practice.
London:Longman.
Global Environmental Management Initiative (GEMI). 2000. ISO 14001 environmental
management system self-assessment checklist.<http://www.gemi.org/resources/ISO_111.pdf.
Accessed 23 March 2010.
Global Reporting Initiative (GRI). 2000. Sustainability reporting guidelines on economic, enviro-
nmental and social performance.
<http://www.globalreporting.org/NRR/.../SR_FINAL_09_06_with_links.pdf> Accessed 24 March
2010.
Global Reporting Initiative (GRI). 2005. Financial services sector supplement: environmental
performance. <http://www.aeca.es/comisiones/rsc/documentos_fundamentales_rsc/gri/sector
_suplements/gri_financial_env.pdf> Accessed 26 March 2010.
Global Reporting Initiative (GRI). 2006. Sustainability reporting guidelines.
401
<https://www.globalreporting.org/resourcelibrary/G3-Sustainability-Reporting-Guidelines.pdf>
Accessed 28 May 2011.
Global Reporting Initiative (GRI). 2008. Global Reporting Initiative sustainability report .
<http://www.www.globalreporting.org/NR/.../SR_FINAL_09_06_with_links.pdf> Accessed
28 May 2011.
Global Reporting Initiative (GRI). 2012. Modernizing sustainability reporting – GRI, G4 and
XBRL. Paper presented at the 24th XBRL International Conference, Abu Dhabi. March.
Global Reporting Initiative (GRI). 2013. G4 Guidelines – Reporting principles and standard
disclosures. <https://www.globalreporting.org/resourcelibrary/GRIG4-Part1-Reporting-Principles-
and-Standard-Disclosures.pdf> Accessed 16 September 2014.
Global Reporting Initiative (GRI). 2014. Trends in external assurance of sustainability reports.
<https://www.globalreporting.org/resourcelibrary/GRI-Assurance.pdf> Accessed 16 September
2014.
Global Reporting Initiative (GRI) & Association of Chartered Certified Accountants (ACCA).
2009. High-impact sectors: the challenge of reporting on climate change.
<http://www.globalreporting.org/.../OtherResearchPublications.htm> Accessed 28 May 2011.
Global Reporting Initiative (GRI) & KPMG. 2007. Reporting the business implications of climate
change in sustainability reports.
<http://www.www.globalreporting.org/NR/.../0/ClimateChange_GRI_KPMG07.pdf> Accessed
29 March 2011.
Global Reporting Initiative (GRI), KPMG & SustainAbility. 2008. Count me in the readers’ take
on sustainability reporting.
<http://www.globalreporting.org/NR/rdonlyres3F57ACC8.../0/CountMeIn.pdf> Accessed
28 August 2011.
Golder Associates. 2014. Solutions for African mining challenges.

402
<http://www.golder.Com/eu/en/modules.phpname=Publication&sp_id=351&page_id=212&
service_id=78> Accessed 16 June 2014.
Gonedes, N.J. 1972. Efficient capital markets and external accounting. The Accounting Review,
11–21.
Gonedes, N.J. & Dopuch, N. 1974. Capital-market equilibrium, information production, and
selecting accounting techniques: theoretical framework and review of empirical work: Studies on
financial accounting objectives. Journal of Accounting Research, 12:48–129.
Gouws, D.G. 1997. Perspectives surrounding accounting communication. Meditari Accountancy
Research, 18(34):61–82.
Graham, T. 2009. The growing need for expanded corporate reporting.
<http://www.saica.co.za/Portals/0/documents/28_4_09.pdf> Accessed 23 March 2010.
Gray, R. 1992. Accounting and environmentalism: an exploration of the challenge of gently
accounting for accountability, transparency and sustainability. Accounting, Organizations &
Society, 17(5):399–425.
Gray, R.H. 1994. The Accounting Profession and the Environmental Crisis: (or can accountancy
save the world?). Meditari, 1–51.
Gray, R.H., Owen, D. & Adams, C. 1996. Accounting and accountability: changes and challenges
in corporate social and environmental reporting. London:Prentice Hall.
Gray, R., Kouhy, R. & Lavers, S. 1995. Corporate social and environmental reporting:a review of
the literature and a longitudinal study of UK closure. Accounting, Auditing & Accountability
Journal, 8(2):47–77.
Gray, R., Owen, D. & Maunders, K. 1987. Corporate social reporting: Accounting and
accountability. London: Prentice-Hall.

403
Gray, R.H., Owen, D.L. & Maunders, K.T. 1988. Corporate social reporting:emerging trends in
accountability and the social contract. Accounting, Auditing, and the Accountability Journal,
1(1):6–20.
Gray, R., Walters, D., Bebbington, J., and Thomson, I. 1995. The greening of enterprise: An
exploration of the (non) role of environmental accounting and environmental accountants in
organisational change. Critical Perspectives on Accounting, 6(3):211- 39.
Green Business Guide. 2011. SA faces big bill, big tests as climate talks head for Durban.
<http://www.greenbusinessguide.co.za/category/climate-change-conference> Accessed 5 January
2011.
Greening, D.W. & Turban, D.B. 2000. Corporate social performance as a competitive advantage
in attracting a quality workforce. Business and Society, 39:254–280.
Greyvenstein, R. 2010. "Earnings management on the JSE before and after King II." Unpublished
Masters thesis, Pretoria, Universty of Pretoria.
Guthrie, J. & Abeysekera, I. 2006. Content analysis of social, environmental reporting: What is
new? Journal of Human Resource Costing and Accounting, 10(2):114–126.
Guthrie, J.E. & Mathews, M.R. 1985. Corporate social accounting in Australasia. Research in
corporate social performance and policy, 7:251–277.
Guthrie, J. & Parker, L.D. 1990. Corporate social disclosure practice: a comparative international
analysis, Advances in Public Interest Accounting, 3(1):159–175.
Greenhouse Gas Protocol. 2011. About the GHG Protocol. <http://www.ghgprotocol.org/about-
ghgp> Accessed 08 February 2011.
Grocery Manufacturers Association (GMA) & Deloitte. 2007. Sustainability: balancing
opportunity and risk in the consumer products industry
<http://www.gmaonline.org/downloads/wygwam/ sustainability-balancing.pdf> Accessed

404
23 September 2010.
Guthrie, J.E. & Parker, L.D. 1990. Corporate social disclosure practice: A comparative
international analysis. Advances in Public Interest Accounting, 3:59–176.
Hackston, D. & Milne, M.J. 1996. Some Determinants of Social and Environmental Disclosures
in New Zealand Companies. Accounting, Auditing & Accountantability Journal, 9(1):77–108.
Hall, C.A.S & Day, J.W. 2009. Revisiting the limits to growth after peak oil.
<http://www.esf.edu/efb/hall/2009-05Hall0327.pdf> Accessed 5 January 2011.
Halme, M. & Huse, M. 1997. The Influence of Corporate Governance, Industry and Country.
Factors on Environmental Reporting. Scandinavian Journal of Management, 13(2):137–157.
Hanafi, R.A. 2006. "An exploration of corporate social and environmental disclosure in Egypt and
the UK: a comparative study." Unpublished Doctorate thesis, Glasgow, Glasgow University.
Handford, R. 2010. Global Trends in sustainability performance management.
<http://www.footprinttalent.wordpress.com/2010/05/13/global-trends-in-
sustainabilityperformance-management/> Accessed 3 February 2010.
Harte, G. & Owen, D. 1991. Environmental Disclosure in the Annual reports of British Companies: A
Research Note. Accounting Auditing & Accountability Journal, 4(3): 51–61.
Harvard Business School (HBS). 2010. The landscape of integrated reporting reflections and next
steps. <http://www.hbs.edu/.../The%20Landscape%20of%20Integrated%20 Reporting.pdf>
Accessed 10 June 2011.
Hasseldine, J., Salama, A.I. & Toms, J.S. 2005. Quantity versus quality: the impact of
environmental disclosures on the reputations of UK Plcs. British Accounting Review, 37(2):231–
248.
Haywood, L.K., Brent, A.C., Trotter., D.H & Wise, R. 2010. Corporate sustainability: a social -
405
ecological research agenda for South African business. Journal of Contemporary Management,
7:326–346.
Haque, S., Deegan, C. & Inglis, R. 2013. Disclosure of climate change-related corporate
governance practices. Paper presented at the Asia Pacific Interdisciplinary Research in
Accounting Conference, Kobe, Japan. July.
Heard, J.E. & Bolce, W.J. 1981. The political significance of corporate social reporting in the
United States of America. Accounting, Organizations and Society, 6(3):247–254.
Henderson, S. & Scherer, B. 1986. Towards decision-useful government accounts. Accounting
Forum, 10(2):5–13.
Hendriksen, E.S. 1970. Accounting Theory. Homewood, Illinois:Richard D. Irwin.
Hendriksen, E.S. 1982. Accounting Theory. (4th ed.). Homewood, Illinois:Richard D. Irwin.
Henriques, A. 2007. Corporate Truth: The Limits to Transparency. London: Earthscan.
Herzig, C. 2010. Internet-supported sustainability reporting. Empirical findings from the German
DAX30. <http://www.crrconference.org/downloads/herzig.pdf.> Accessed 29 May 2011.
Hibbit, C. 2004. External environmental disclosure and reporting by large European companies:
An economic, social and political analysis of managerial behaviour.
<http://www.rozenbergps.com/files/hibbit.pdf> Accessed 23 December 2010.
Hibiki, A. & Akimura, T.H. 2004. Environmental policies and firm-level management practices in
Japan. <http://www.oecd.org/dataoecd/22/29/31650143.pdf> Accessed 28 December 2010.
Hines, R. 1988. Popper's methodology of falsificationism and accounting research. The
Accounting Review, 63(4):657–662.
Holsti, O. 1969. Content analysis for the social sciences and humanities. London:Addison-Wesley.
406
Hooks, J. & Van Staden, C. 2004. Preparers’ perceptions of the decision usefulness of FRS15.
Qualitative Research in Accounting & Management Journal, 1(1):46–65.
Hooks, J. & Van Staden, C.J. 2011. Evaluating environmental disclosures: The relationship
between quality and extent measures. British Accounting Review 43(3), 200–213.
Ho, S.S. & Wong, K.S. 2004. Report on annual reports usage and perceived usefulness of
corporate annual reports. Corporate Ownership and Control, 1(3):61–71.
Hodge, K., Subramaniam, N. & Stewart, J. 2009. Assurance of sustainability reports : impact on
report users' perceptions of confidence and perceptions of information credibility. Australian
Accounting Review, 19(3):178–194.
Hourcade, J.C., Shukla, P.R. & Mathy, S. 2005. Cutting the climate-development gordian
knoteconomic options in a politically constrained world. <http://www.centre-
cired.fr/IMG/pdf/CIREDWP-200606.pdf> Accessed 23 March 2010.
Howes, R. 1999. Accounting for environmentally sustainable profits. Management Accounting
(UK), 77(1):32–33.
Htun. N.T. 2008. "The impact of environmental disclosure on stock price: An evidence from
Taiwan." Unpublished Master's of Business Administration thesis. Tainan, Taiwan. National
Cheng Kung University.
Hwang, S.C., Khoo, T.A. & Wong, D.C. 2013. Perception of preparers and users on sustainability
reporting in Singapore. Journal of Education and Vocational Research, 4(6):174–183.
Hunt, H.G. & Grinnell, D.J. 2004. Financial analysts’ views of the value of environmental
information. Advances in Environmental Accounting and Management, 2:101–120.
ICAEW. 1975. The Corporate Report. ICAEW. London.
IFAC. 2009. Sustainability Framework. <http://web.ifac.org/ sustainability-framework/overview>
407
Accessed 30 December 2009.
Ijiri, Y. 1975. Theory of accounting measurement. Sarasota, Florida: American Accounting
Association.
Ilinitch, A.Y., Soderstrom, N.S. & Thomas, T.E. 1998. Measuring corporate environmental
performance. Journal of Accounting and Public Policy, 17:383–408.
Inanga, E.L. & Schneider, W.B. 2005. The failure of accounting research to improve accounting
practice: a problem of theory and lack of communication, Critical Perspectives on Accounting,
16:227–248.
Ince, D. 1998. "Corporate social and environmental reporting an application of stake holder
theory." Unpublished Doctor of Philosophy thesis. Exeter. Exeter University.
Incite Sustainability. 2007. Sustainability reporting. <http://www.incite.co.za/services /reporting>
Accessed 30 January 2011.
Incite Sustainability. 2008. Carbon disclosure project report 2008: JSE Top 100.
<https://www.cdproject.net/.../67_329_169_CDP%20South%20Africa%20Report%202008.pdf>
Accessed 30 January 2011.
Incite Sustainability. 2009. Carbon disclosure project report 2009: JSE 100.
<https://www.cdpproject.net/.../CDP%202009%20South%20Africa%20JSE%20100%20Report.
pdf> Accessed 30 January 2011.
Incite Sustainability. 2010. Carbon disclosure project report 2010: JSE100. <https://www.cd
project.net/CDPResults/CDP-2010-South-Africa-JSE100.pdf> Accessed 30 January 2011.
Ingram, R.W. 1978. Investigation of the information content of certain social responsibility
disclosure. Journal of Accounting Research, 16(2):270–85.
Ingram, R.W. & Frazier, K.B. 1980. Environmental performance and corporate disclosure.
408
Journal of Accounting Research, 18(2):614–22.
Institute for Global Environmental Strategies (IGES). 2002. A Study on the comparability of the
environmental reports: mainly of the automobile, beer, and chemical industries.
<http://www.enviro scope.iges.or.jp/modules/envirolib/upload/.../BE2_3012.pdf.> Accessed
12 July 2012.
Institute of Chartered Accountants in England and Wales (ICAEW). 1975. The Corporate Report
of the Accounting Standards Steering Committee. London:ICAEW.
Institute of Chartered Accountants in England and Wales (ICAEW). 2005. Agency theory and the
role of audit. <http://www.icaew.com/en/technical/audit-and.../ audit...aqf/fundamentals>
Accessed 25 December 2011.
Institute of Chartered Accountants in England and Wales (ICAEW) & Environmental Agency.
2009. Sustainable Business : turning questions into answers, environmental issues and annual
financial reporting. <https://www.www.environment-agency.gov.uk/.../Business/TECPLN8045_
env_report_a> Accessed 30 August 2011.
Institite of Directors in Southern Africa (IODSA). 1994. King Report on Corporate Governance
for South Africa. <http://www.iodsa.co.za/products_reports.asp?CatID=151> Accessed 30 January
2011.
Institite of Directors in Southern Africa (IODSA). 2002. King Report on Corporate Governance
for South Africa. <http//:www.ecgi.org/codes/documents/executive_summary.pdf–Similar>
Accessed 30 January 2011.
Institite of Directors in Southern Africa (IODSA). 2007. Integrated sustainability reporting in
South Africa. <http://www.iodsa.co.za/downloads/.../IoD%20Bulletin%201st %202007.pdf>
Accessed 30 January 2011.
Institite of Directors in Southern Africa (IODSA). 2009. King Report on Corporate Governance
for South Africa. <http://www. african.ipapercms.dk/IOD/KINGIII/kingiii report/> Accessed
409
30 December 2009.
Institite of Directors in Southern Africa (IODSA). 2010. Integrated reporting sustainable
development forum.
<http://www.iodsa.co.za/.../Integrated_Reporting_SDF_Position_Paper_3.pdf> Accessed
30 January 2011.
Institute of Directors in Southern Africa (IODSA). 2012. Practice notes: Reporting in terms of the
JSE listing requirements. <http://www.iodsa-gai.co.za/documents/IoDSA_GAI_Handout_
2012.pdf> Accessed 20 May 2013.
Institute of International Finance Inc. 2007. Corporate governance in South Africa: an investor
perspective. <https://www.iif.com/download.php?id=0N6SZ+azhm0> Accessed 30 January 2011.
Institute of Management Accountants (IMA). 2008. The evolution of accountability: sustainability
reporting for accountants. <http://www.nickshepherd.ca/pdf/SMA_ Sustainability_ 063 008.pdf>
Accessed 30 January 2011.
Integrated Reporting Committee (IRC). 2011. Framework for integrated reporting and the
integrated report discussion paper. <http://www.sustainabilitysa.org> Accessed 22 August 2011.
International Accounting Standards Board (IASB). 1989. Framework for the preparation and
presentation of financial statements. London:International Accounting Standards Board.
International Accounting Standards Board (IASB). 2008. Exposure draft of an improved
conceptual framework for Financial Reporting.
<http://www.iasb.org/NR/...00FD.../conceptual_framework_exposure_draft.pdf> Accessed
01 September 2011.
International Federation of Accountants (IFAC). 2005. International standard on assurance
engagements 3000 assurance engagements other than audits or reviews of historical financial
information. <http://www.ifac.org/Guidance/EXD-Download.php?EDFID=00375> Accessed
02 May 2011.
410
International Federation of Accountants (IFAC). 2009. Sustainability Framework.
<http://web.ifac.org/sustainability-framework /overview> Accessed 30 December 2009.
International Federation of Accountants (IFAC). 2011. Proposed International Standard on
Assurance Engagements: ISAE 3000 (Revised), assurance engagements other than audits or
reviews of historical financial information. <http://www.ifac.org/Guidance/EX D-
Download.php?EDFID=00375> Accessed 02 June 2011.
International Petroleum Industry Environmental Conservation Association (IPIECA) & American
Petroleum Institute (API). 2010. Oil and gas industry guidance on voluntary sustainability
reporting. <http://www.ipieca.org/system/files/publications/reporting_guide.pdf> Accessed
30 September 2010.
Investor Responsibility Research Center (IRRC). 1996. Environmental reporting and third party
statements. <http://www.gemi.org/resources/TPS_112.pdf> Accessed 03 September 2011.
Investor Responsibility Research Center (IRRC). 1996. Environmental reporting and third party.
Ioannou, I. & Serafeim, G. 2011. The consequences of mandatory corporate sustainability
reporting. <http://www.www.hbs.edu/research/pdf/11-100.pdf> Accessed 02 September 2011.
Islam, M.A. 2009. "Social and environmental reporting practices of organisations operating in, or
sourcing products from, a developing country: evidence from Bangladesh." Unpublished Doctor
of Philosophy thesis. Melbourne. Royal Melbourne Institute of Technology (RMIT) University.
Islam, M. & Deegan, C. 2010. Media pressures and corporate disclosure of social responsibility
performance: A case study of two Global clothing and sports retail companies. Accounting and
Business Research, 40(2):1–20.
Jacobs, B.W. Singhal, V.R. & Subramanian, R. 2008. An Empirical Investigation of Environmental
Performance and the Market Value of the Firm.
<http://mgt.gatech.edu/.../phd/.../jacobs_et_a_env_events_paper_080920.pdf> Accessed
15 January 2012.
411
Jaggi, B. & Freedman, M. 1982. An analysis of the information content of pollution disclosures.
Financial Review, 19(5):142–52.
Jira, C.F. & Toffel, M.W. 2013. Engaging supply chains in climate change. Manufacturing and.
Service Operations Management, 15(4):559–577.
Joint Accreditation System - Australia and New Zealand (JAS-ANZ). 2009 JAS-ANZ snapshot.
<http://www.www.jasanz.org/images/stories/Documents/.../JASANZ_Snap shot_Jan09.p>
Accessed 02 July 2011.
Johansson, J. 2007. Sell-side analysts’ creation of value – key roles and relational capital. Journal
of Human Resource Costing and Accounting, 11(1):30–52.
Johnson R.B. & Christensen L.B. 2010. (4th ed.). Educational research: Quantitative, qualitative
and mixed approaches. Carlifonia: Sage.
Jollands, S., Akroyd. C. & Sawabe, N. 2012. Investigating the role of stand-alone sustainability
reports. <http://www.apira2013.org/proceedings/pdfs/K300.pdf> Accessed 23 October 2012.
Jones, K. & Alabaster, T. 1999. Critical analysis of corporate environmental reporting scoring
systems. Journal of Enviromental Assessment Policy and Management, 1(1):27–60.
Jones, M.J. 2006. Accounting for the environment: Towards a theoretical perspective for
environmental reporting. Paper presented at the British Accounting Association conference,
Portsmouth, April.
Jones, T.C. 1990. Corporate social accounting and the capitalist enterprise. In: Cooper, D.J. &
Hopper, T.M. (eds.) Critical accounts. London:MacMillan.
Jose, A. & Lee, S. 2006. Environmental reporting of global corporations: A content analysis based
on website disclosures. Journal of Business Ethics, 72:307–321.
Joshi, P.L. & Suwaidan, M.S. & Kumar, R. 2011. Determinants of environmental disclosures by

412
Indian industrial listed companies: empirical study. International Journal of Accounting and
Finance. 3(2):109–130.
Judge, J. 2004. A Brief History of Sustainability Reporting.
<http://www.iema.net/news/envnews?aid=4699> Accessed 01 January 2011.
Kam, V. 1990. Accounting theory. (2nd ed.). New York:John Wiley.
Kamal, A.R. 2012. "The relationship between corporate governance and environmental disclosure:
UK evidence." Unpublished Doctor of Philosophy thesis. Durham. Durham University.
Karliner, J. 2001. A Brief History of Greenwash.
<http://www.knowmore.org/wiki/index.php?title=A_Brief_History_of_Greenwash> Accessed 01
January 2011.
Katsoulakos, P., Koutsodimou, M. Matraga, A. & Williams, L. 2004. A historic perspective of the
CSR movement. <http://www.csrquest.net/uploadfiles/1D.pdf> Accessed 01 January 2011.
Kim, E.H. & Lyon, T.P. 2012. Strategic environmental disclosure: Evidence from the DOE's
voluntary greenhouse gas registry. Journal of Environmental Economics and Management,
61(3):311–326.
King, M. 2003. Principles, not rules: thanks to codes drafted under Mervyn King, South Africa
has taken the lead in defining corporate governance in broadly inclusive terms – Interview.
<http://www.findarticles.com/p/articles/mi_m4153/is_4_60/ai_106863373/> Accessed 12 July
2009.
Kisenyi, V. 1999. What (if anything) has accounting got to do with the impending environmental
crisis? <http://www.fiuc.org/iaup/sap> Accessed 30 December 2011.
Kok, T.K. 2008. "Motivations for corporate social reporting and non-reporting in Malaysia: an
explanatory study from a public relation perspective." Unpublished Master’s Dissertation,
Auckland. University of Waikato.
413
Kolk, A. 2004. A decade of sustainability reporting: developments and significance. International
Journal of Environment and Sustainable Development, 3(1):51–63.
Kolk, A. 2005. Sustainability reporting. VBA Journaal, 21(3):34–42.
Kolk, A. & Perego, P. 2010. Determinants of the adoption of sustainability assurance statements:
an international investigation. <http://www.dare.uva.nl/document/177593> Accessed 19 June
2010.
Koornhof, C. 1998. "Accounting information on flexibility." Unpublished Doctor of Commercii
(Accounting sciences) Thesis. Pretoria. University of Pretoria.
KPMG. 1993. International survey of environmental reporting 1993. London:KPMG.
KPMG. 1996. International survey of environmental reporting 1996. Stockholm:KPMG.
KPMG. 1999. KPMG International survey of environmental reporting 1999. The
Netherlands:KPMG.
KPMG 2002. KPMG. International survey of corporate sustainability reporting 2002.
<http://www.gppi.net/fileadmin/gppi/KPMG2002.pdf> Accessed 12 July 2009.
KPMG. 2005. International survey of corporate responsibility reporting 2005.
<http://www.kpmg.nl/Docs/Corporate_Site/Publicaties/International_Survey_Corporate_
Responsibility_2005.pdf>Accessed 12 July 2009.
KPMG. 2008a. Climate changes your business.
<http://www.kpmg.com/Global/IssuesAndInsights/ArticlesAndPublications/Pages/
Climatechangesyourbusiness.aspx> Accessed on 12 July 2009.
KPMG. 2008b. International survey of corporate responsibility reporting. Http://www. kpmg.com
/RutUS_prod/Documents/8/Corporate Sustainability_Report_US_Final.pdf. Accessed 12 July
2009.

414
KPMG. 2010. Carrots and sticks- promoting transparency and sustainability.
<http://www.kpmg.com/Carrots-and-Sticks-Promoting-Transparency-and-Sustainability.aspx>
Accessed 12 January 2011.
KPMG. 2011. International survey of corporate responsibility reporting
2011.<http://www.kpmg.com/global/en/issuesandinsights/articlespublications/corporate-
responsibility/pages/2011-survey.aspx> Accessed 12 July 2012.
KPMG. 2013. The KPMG Survey of Corporate responsibility reporting 2013.
<http://www.kpmg.com/global/en/issuesandinsights/articlespublications/corporate-
responsibility/pages/corporate-responsibility-reporting-survey-2013.aspx> Accessed 31 December
2013.
KPMG. Centre For Corporate Governance In Africa (CFCGIA), Global Reporting Initiative (GRI)
& United Nations Environmental Programme (UNEP). 2013. Carrots and sticks: Sustainability
reporting policies worldwide – today's best practice, tomorrow's trends.
<https://www.globalreporting.org/resourcelibrary/carrots-and-sticks.pdf> Accessed 29 December
2013.
KPMG Huazhen. 2008. Sustainability reporting a guide .
<http://www.kpmg.com/CN/en/.../Docum- ents /sustainable_guide_0811.pdf–China> Accessed
22 December 2010.
KPMG & SustainAbility 2008. Count me in – The readers’ take on sustainability
reporting.<http://www.kpmg.com/GR/en/.../Sustainability/Documents/CountMeIn.pdf> Accessed
12 July 2012.
KPMG & SustainAbility & Futtera. 2010. Reporting change: Readers and reporters survey 2010.
<http://www.futerra.co.uk/downloads/Reporting_Change.pdf> Accessed 18 June 2012.
Kraus, J. 2010. Embarking on preparing a sustainability report? here are some tips.
<http://www.source-44.com/userfiles/file/PrepSusRep_JenniferKraus.pdf> Accessed 18 August

415
2011.
Krechowicz, D. & Fernando, H. 2009. Undisclosed risk: corporate environmental and social
reporting in emerging Asia. <http://www.pdf.wri.org/undisclosed_risk_emerging_asia.pdf>
Accessed 15 February 2011.
Krippendorff, K. 1980. Content analysis: An introduction to its methodology. Newbury Park:Sage
Publications.
Kucbel-Saumier, M. 2007. "Strategic opportunities in the corporate sustainability reporting market
for a specialised software firm." Unpublished Master’s Dissertation, Simon Fraser University.
British Columbia.
Kuhn, T.S. 1962. The structure of scientific revolutions. Chicago: University of Chicago Press.
Kuhn T.S. 1970. The structure of scientific revolutions. Chicago: University of Chicago Press.
Kuhn, J.R. & Sutton, S.G. 2010. Continuous auditing in ERP system environments: the current
state and future directions . Journal of Information Systems, 24(1):91–112.
Laine, M. 2005. Meanings of the term “sustainable development” in Finnish corporate
disclosures. Accounting Forum, 29:395–413.
Larsson, L. 2010. European sustainability reporting association report for Sweden (2009) .
<http://www.pwc.com/se/sv/hallbar.../sweden-report-to-esra-2010.pdf–Sweden> Accessed 12 June
2011.
Laud, R.L. & Schepers, D.H. 2009. Beyond transparency: Information overload and a model for
intelligibility. Business and Society Review, 114:365–91.
Laughlin, R & Gray, R. 1988. Financial accounting: Method and meaning. London:Van Nostrand
Reinhold.
Leavoy, P. 2010. Does CSR Reporting Help the Planet, or Just Help Reporting?

416
<http://www.greenbiz.com/blog/2010/09/30/does-csr-reporting-help-planet-or-just-help-
reporting> Accessed 12 January 2011.
Lee, T.A. & Tweedie, D.P. 1975. Accounting information: an investigation of private shareholder
usage. Accounting and Business Research, 5:280–291.
Leedy P.D. 1989. (4th ed). Practical research: Planning and design, New York: Macmillan
Publishing Company.
Leedy, P.D. 1997. (6th ed.). Practical research: Planning and design New Jersey:Pearson Prentice
Hall.
Leedy, P.D. & Ormrod, J.E. 2001. (7th ed.). Practical research: planning and design New
Jersey:Pearson Educational International and Prentice Hall.
Leedy, P.D. & Ormrod, J.E. 2005. (8th ed.). Practical research: planning and design. New
Jersey:Pearson Educational International and Prentice Hall.
Le Roux, F. 2010. "The applicability of the third King report on corporate governance to small
and medium enterprises." Unpublished Master’s Dissertation, Capetown. University of
Stellenbosch.
Lindblom, C.K. 1994. The implications of organizational legitimacy for corporate social
performance and disclosure. Proceedings of the Critical Perspectives on Accounting Conference,
April, New York.
Lockard, D. & Rider, C. 2005. The History of Water Filters—Part III. <http://www.oawu.
net/H2O/ 2005 /.../The.History.of.Water.Filters.Part3.pdf> Accessed 12 January 2011.
Lodhia, S. 2006. Corporate perceptions of web-based environmental communication: An
exploratory study into companies in the Australian minerals industry. Journal of Accounting and
Organizational Change, 2(1):74–88.
Lorraine, N.H., Collison, D.J. & Power, D.M. 2004. An analysis of the market impact of

417
environmental performance information. Accounting Forum, 28(1):7–26.
Luo, X. & Bhattacharya, C.B. 2006. Corporate social responsibility, customer satisfaction, and
market value. Journal of marketing, 70(4):1–18.
Macalister, T. 2007. Consumers distrust business on climate change.
<http://www.guardian.co.uk/business/2007/jun/19/climate change.> Accessed 30 December 2009.
Macfarquar, C. & Tooley, S. 2009. Business reporting: financial analysts expectations for
management disclosures. New Zealand Journal of Applied Business Research, 7(1):1–23.
MacLean, R. & Gottfrid, R. 2000. Corporate environmental reports: stuck Management processes
hold back real progress. Corporate Environmental Strategy,7 (3):244–255.
Macnamara, J. 2005. Media content analysis: Its uses, benefits and best practice methodology.
Asia Pacific Relations Journal, 6(1):1–34.
Mammatt, J. 2009. Integrated sustainability reporting and assurance.
<http://www.icsa.co.za/JayneMammat/.> Accessed 12 October 2010.
McKay, D. 2013. Trust deficit tops SA mining concerns.
<http://www.miningmx.com/page/special_reports/joburg-indaba/1636845-Trust-deficit-tops-SA-
mining-concerns. Accessed 28 August 2013.
McKinsey Quarterly. 2009. McKinsey global survey results: how companies are benefiting from
Web2.0 . <http://www.mckinseyquarterly.com/How_companies_ are _benefiting_fromweb20>
Accessed 10 January 2011.
McKinsey Quarterly. 2010.The rise of the networked enterprise: Web 2.0 finds its payday .
<http://www.download.mckinseyquarterly.com/the_rise_of_the_networked_enterprise.pdf>
Accessed 10 January 2011.
McMurtrie, T. 2005. Factors influencing the publication of social performance information: an

418
Australian case study. Corporate Social Responsibility & Environmental Performance, 12(3),
129–143.
Maguire, M. 2011. The future of corporate social responsibility reporting.
<http://www.bu.edu/pardee/files/ 2011/01/PardeeIIB-019-Jan-2011.pdf> Accessed 15 April 2011.
Mahmoud, E. 2009. "Corporate social reporting in a transition economy: the case of Libya."
Unpublished Doctor of Philosophy thesis. Huddersfield. University of Huddersfield.
Malherbe, S. & Seagal, N. 2001. Corporate Governance in South Africa. Discussion
document.South Africa: OECD Development Centre.
<http://www.tips.org.za/publication/corporate governanc e-south-africa> Accessed 12 January
2011.
Mammatt, J. 2009. Integrated sustainability reporting and assurance. Http://www.icsa.
co.za/JayneMammat/. Accessed 12 October 2010.
Mammatt, J., Marx, B. and van Dyk, V., 2010. Sustainability reporting and assurance: the way of
the future. ASA Accountancy Journal, December 2009/January 2010 Issue:22–25.
Marlin, J.T & Marlin, A.T. 2003. A brief history of social reporting.
<http://www.Businessrespect.net/page.php?Story_ID=857> Accessed 12 January 2011.
Marquis, C. & Toffel, M.W. 2014.Scrutiny, Norms, and Selective Disclosure: A Global Study of
Greenwashing. <http://www.hbs.edu/faculty/Pages/item.aspx?num=40289> Accessed 18 August
2014.
Marx, B. & Van Dyk, V. 2009. Sustainability reporting and assurance: the way of the future.
<http://www.accountancysa.org.za/.../ShowItemArticle.asp> Accessed 12 January 2011.
Mascha, M.F. & Miller, C. 2014. Sustainability reporting: Information asymmetry and message
inconsistency.Paper presented at the American Accounting Association annual meeting and
conference on teaching and learning in accounting, Atlanta. August.
419
Matela, P.S. 2006. "ISO 14001 environmental performance as a stand-alone tool and back up
requirement from other environmental tools for enhanced performance: South African case study."
Unpublished Master’s Dissertation, Johannesburg. University of the Witwatersrand.
Mathews, M.R. 1985. The case for social accounting. Accounting Forum, 8(3):23–49.
Mathews, M.R. 1987. Social responsibility accounting disclosure and information content for
shareholders. British Accounting Review, 19(2):161–168.
Mathews, M.R. 1993. Socially Responsible Accounting. London:Chapman and Hall.
Mathews, M.R. & Reynolds, M.A. 2000. The environment and the accountant as ethical actor.
Advances in Environmental Accounting and Management, 1:83–100.
May, G. 1943. Financial accounting: A distillation of experience. New York:The MacMillan
Company.
Mitchell, C.G. & Hill, T.R. 2010. An exploratory analysis of stakeholders’expectations and
perceptions of corporate social and environmental reporting in South Africa. Southern African
Journal of Accounting Research, 24(1)29–78.
Mitchell, C.G. & Quinn, N.W. 2005. Environmental reporting disclosure in South Africa: A
comparative study of the expectations of selected groups of preparers and users. Meditari
Accounting Research, 13(2):17–33.
McKinsey Quarterly. 2009. McKinsey global survey results: how companies are benefiting from
Web2.0 . <http://www.mckinseyquarterly.com/How_companies_are_benefiting_fromweb20>
Accessed 10 January 2011.
McKinsey Quarterly. 2010.The rise of the networked enterprise: Web 2.0 finds its payday .
<http://www.download.mckinseyquarterly.com/the_rise_of_the_networked_enterprise.pdf>
Accessed 10 January 2011.
420
Meadows, D.H., Meadows. D.L., Randers. J. & Behrens. W.W. 1972. The Limits to Growth. New
York:Universe Books.
Menselsohn, M. Hjartarson, J. & Pearce, J. 2010. Saving dollars and making sense an agenda for
a more efficient, effective and accountable federation. <http://www.mowatcentre. ca/research-
topic-mowat.php?mowatResearchID> Accessed 17 February 2011.
Miller, H. 2012. Investors don’t read CSR reports. <http://www.triplepundit.com/2012/10/bsr-
sustainability-business-trends> Accessed 04 September 2014.
Milne, M.J. & Alder, R.W. 1999. Exploring the reliability of social and environmental disclosures
content analysis. Accounting, Auditing and Accountability Journal, 12(2):237–256.
Mitchell, C.G. & Hill, T.R. 2010. An exploratory analysis of stakeholders' expectations and
perceptions of corporate social and environmental reporting in South Africa. SA Journal of
Accounting Research, 24(1):49–78.
Mitchell, C.G. & Quinn, N.W. 2005. Environmental reporting disclosure in South Africa: A
comparative study of the expectations of selected groups of preparers and users. Meditari
Accountancy Research, 13(2):17–33.
Mlarvizhi, P. & Yadav, S. 2008. Corporate environmental reporting on the internet: an insight into
Indian practices. <http://www.iitk.ac.in/.../Industrial%20Economics,%20 Environment,%20CSR-
10> Accessed 13 April 2011.
Momin, M.A. 2010. NGOs perception of corporate social disclosure in Bangladesh.
<http://w3.man ukau.ac.nz/aaac/ARA_2010_papers/Momin.pdf> Accessed 13 May 2012.
Moneva, J.M. & Cuellar, B. 2009. The value relevance of financial and non-financial
environmental reporting. Environmental and Resource Economics journal, 44(3):441–456.
Moloi, S.T.M. 2008. "Assesment of corporate governance reporting in the annual reports of South
421
African listed companies." Unpublished Master’s Dissertation, Pretoria. University of South
Africa.
Morolo, M.Z. 2007. "Children’s acquisition of computer literacy skills in the mamelodi digital
doorway project." Unpublished Master’s Dissertation, Pretoria. University of Pretoria.
Morrow, D. & Rondinelli, D. 2002. Adopting corporate environmental management systems:
motivations and results of ISO 14001 and EMAS Certification. European Management Journal,
20(2):159–171.
Mouton, J. 2005. How to succeed in your master and doctoral studies: A South
African guide and resource book. Pretoria:Van Schaik
Munich Personal Repec Archive (MPRA). 2007. Remembering thirty-five years of social
accounting: a review of the literature and the practice. <http://mpra.ub.uni-muenchen.de/3454>
Accessed 30 December 2009.
Myburgh. J.E. 2001. The informativeness of voluntary disclosure in the annual reports of listed
industrial companies in South Africa. Meditari Accountancy Research, 9:199–216.
Nachmias, D. & Nachmias, C.F. 1992. Research methods in the social sciences. New York:St
Martin Press.
Nagayama, S. & Takeda, F. 2006. An Empirical Study on the Impact of Environmentally Friendly
News on. Stock Prices in Japan. <http://www.apeaweb.org/confer/sea06/papers/takeda-
nagayama.pdf> Accessed 31 December 2011.
Naser, K., & Abu-Baker, N. 1999. Empirical evidence on corporate social responsibility reporting
and accountability in developing country: the case of Jordan. Advances in International
Accounting, 12:193–226.
National Audit Office of Denmark (NAOD). 2002. Green accounts and environmental
management. <http://www.eurosaiwgea.org/Environmental%20audits/.../2002-Denmark>
422
Accessed 30 December 2009.
Neimark, M.K. 1992. The Hidden Dimensions of Annual Reports: Sixty years of
social conflict at General Motors. New York:Markus Weiner Publishing.
Neuman, W.L. 1997. Social research methods: Qualitative and quantitative approaches.
Boston:Allyn and Bacon
Neuman, W.L. 2000. (4th ed.). Social research methods: Qualitative and quantitative approaches.
Boston:Allyn and Bacon
Nevondo, N. T. 2005. Adults’ engagement with computers in an adult basic education and
training (ABET) programme. <http://etd.rau.ac.za/theses/available/etd-08312006-
121721/restricted/finalcomplete.pdf> Accessed 30 December 2009.
New Hampshire Department of Environmental Services (NHDES). 2002. Research into the
effectiveness of environmental management systems.
<http://www.des.nh.gov/organization/commissioner/pip/ publications/.../nhdes-01-3.pdf>
Accessed 30 July 2011.
Nik Ahmad, N.N. & Sulaiman, M. 2002. Environmental disclosures in malaysian annual reports:
a study of the construction and industrial products sectors. Paper presented at the European
Accounting Association (EAA) 25th annual congress, Copenhagen. April.
Niskala, M. & Pretes, M. 1995. Environmental reporting in Finland: A note on the use of annual
reports. Accounting, Organizations and Society, 20(6):457–466.
Noci, G. & Citterio, A. 2003. Practices on e-nvironmental reporting.
<http://www.futuresconference.fi/2003/papers/aCitterio_practices.pdf> Accessed 30 December
2009.
North Atlantic Treaty Organization. 1998. Evaluation of demonstrated and emerging technologies
for the treatment of contaminated land and groundwater (Phase III).
423
<http://www.epa.gov/tio/down load/remed/nat98ann.pdf> Accessed 30 December 2009.
Norman, W. & MacDonald, C. 2003. Getting to the Bottom of “Triple Bottom Line”.
<http://www.businessethics.ca/3bl/triple-bottom-line.pdf> Accessed 29 November 2010.
Nuzula, N.F. & Kato, M. 2011. Do Japanese capital markets respond to the publication of
corporate social responsibility reports? Journal of Accounting, Finance and Economics, 1(1):48–
60.
O’Donovan, G. 2002. Environmental disclosures in the annual report: Extending the applicability
and predictive power of legitimacy theory. Accounting, Auditing & Accountability Journal,
15(3):344–371.
O’Donovan, G. 2002. Environmental disclosures in the annual report: Extending the applicability
and predictive power of legitimacy theory. Accounting, Auditing & Accountability Journal,
15(3):344–371.
O'Dwyer, B. 2000. Corporate Social Reporting in Ireland: Legitimacy Denied?, paper
presented at the School of Commerce Seminar Series, Flinders University, Adelaide. May.
O’Dwyer, B., Unerman, J. & Hession, E. 2004. The emergence and future development of
Corporate Social Disclosure in Ireland: The perspectives of Non-Governmental Organisations.
Accounting. Auditing and Accountability Journal, 18(1):14–43.
O'Dwyer, B., Unerman, J. & Hession, E. 2005. User needs in sustainability accounting:
Perspectives of stakeholders in Ireland. European Accounting Review, 14(4):759–787.
Oregon Green Permits Program Guide (OGPPG). 2000. Attachment C: sources on environmental
reporting and performance measures: Technical report: corporate environmental reporting.
<http://www.deq.state.or.us/programs/.../GreenPermits/.../Att chmtC> Accessed 15 December
2010.
Organisation for Economic Co-operation and Development (OECD). 1997. International

424
benchmarking experience from OECD countries.
<http://www.www.oecd.org/governance/budgeting/1902957.pdf.> Accessed 10 May 2013.
Organisation for Economic Co-operation and Development (OECD). 2009. Overview of selected
initiatives and instruments relevant to corporate social responsibility.
<http://www.oecd.org/dataoecd/18/56/40889288.pdf> Accessed 15 May 2011.
O’Dwyer, B., Unerman, J. & Hession, E. 2004. The emergence and future development of
Corporate Social Disclosure in Ireland: The perspectives of Non-Governmental Organisations.
Accounting. Auditing and Accountability Journal, 18(1):14–43.
O'Rourke, A. 2003. A new politics of engagement: shareholder activism for corporate social
responsibility. Business Strategy and the Environment, 12:227–239.
Owolabi, A. 2009. Environmental disclosures in annual reports: the Nigerian perspective.
<http://www.riviste.paviauniversitypress.it/index.php/ea/article/view/433/489> Accessed
18 December 2011.
Owen, D.L. 1992. Green reporting: The challenge of the nineties. London: Chapman & Hall.
Owen D.L. 2003. Recent developments in European social and environmental reporting and
auditing practice—a critical evaluation and tentative prognosis. <http://www.Nottin
gham.ac.Uk/business/ICCSR/research> Accessed 30 December 2009.
Owen D., Gray.R. & Maunders. K. 1987. Researching the information content of social
responsibility disclosure: a comment. British Accounting Review, 19 (2):169–176.
Orion Consulting Network. 2002. Best practice simplified internal and external reporting for.
local governments in Queensland. <http://www.orionco.net/pdf/report.pdf> Accessed
21 December 2011.
Overland, J. 2007. Corporate social responsibility in context: the case for compulsory
sustainability disclosure for listed public companies in Australia?
425
<http://www.law.mq.edu.au/html/MqJICEL/vol4/2_Overland.pdf> Accessed 15 August 2011.
Owen D.L. 2003. Recent developments in European social and environmental reporting and
auditing practice—a critical evaluation and tentative prognosis. <http://www.Nottin
gham.ac.Uk/business/ICCSR/research> Accessed 30 December 2009.
Pahuja, S. 2007. Corporate environmental reporting expectation gap: Evidence from India. ICFAI
Journal of Accounting Research, 6(2):21–42.
Parker, L.D. 2005. Social and environmental accountability research. A view from the
commentary box. Accounting, Auditing and Accountability Journal, 18(6):842–860.
Patten, D.M. 1991. Exposure, Legitimacy, and Social Disclosure. Journal of Accounting and
Public Policy, 10(4):297–308.
Patten, D.M. 1992. Intra-industry environmental disclosures in response to the Alaskan oil spill:
a note on legitimacy theory. Accounting, Organizations and Society, 17(5):471–475.
Patten, D. M. 2002. The relation between environmental performance and environmental
disclosure: a research note. Accounting, Organizations and Society, 27(8):763 –773.
Patten D.M. & W.Crampton. W. 2004. Legitimacy and the Internet: An examination of
corporateweb page environmental disclo-sures. Advances in Environmental Accounting and
Management, 2:31–57.
Peiyuan, G. 2005. Corporate environmental reporting and disclosure in China. CSR Asia.
<http://ww w.csrasia.com/upload/environmentalreporting.pdf> Accessed 30 December 2009.
Perego, P. 2009. Causes and consequences of choosing different assurance providers: an
international study of sustainability reporting. International Journal of Management, 26(3):412–
425.
Perks, R.W., Rawlinson, D. & Ingram, L. 1992. An exploration of ethical investment in the UK.

426
British Accounting Review, 24(1):43–66.
Porwal, L.S. 2001. Accounting theory: An introduction. 3rd edition. New Delhi: Tata Mcgraw-Hill.
Pramanik, A.K., Shil, N.C. & Das, B. 2008. Corporate environmental reporting: An emerging
issue in the corporate world. International Journal of Business and Management, 12(3):146–154.
PricewaterhouseCoopers (PwC). 2007a. Measuring up sustainability reporting in the forest, paper
& packaging industry.
<http://www.www.pwc.com/en_GX/gx/sustainability/assets/pwcfpsustainability.pdf> Accessed 30
December 2010.
PricewaterhouseCoopers (PwC). 2007b. Guide to key performance indicators.
<http://www.pwc.com/ gx/en/corporate-reporting/assets/pdfs/uk_kpi_guide.pdf> Accessed
12 May 2013.
PricewaterhouseCoopers (PwC). 2008. Joining the dots: A summary of the narrative reporting
practices of the FTSE 350. <http://www.corporatereporting.com /joining_the_dots.html>
Accessed 30 August 2011.
PriceWaterhouseCoopers (PwC). 2009a. Carbon disclosure project report: More companies are
seeing the need to report carbon activity. <http://www.pwc.com/gx/en/carbon-disclosure-project
/index.jhtml> Accessed 30 December 2009.
PriceWaterhouseCoopers (PwC). 2009b. Corporate governance executive guide to king III. King’s
counsel: Understanding and unlocking the benefits of sound corporate governance.
<http://www.compliance week.com/s/documents/south-africa-report.pdf> Accessed 30 December
2009.
PricewaterhouseCoopers (PwC). 2009c. King’s Counsel: understanding and unlocking the benefits
of sound corporate governance. <http://www.pwc.com/.../Executive-Guide-to-KINGIII- public-
sector-guide-02.pdf> Accessed 30 October 2010.

427
PricewaterhouseCoopers (PwC). 2011. Lights, camera, action... scripting internal audit for a
changed world. <http://www.pwc.com/.../internal-audit/.../state-of-internal-audit-profession-
study> Accessed 26 January 2011.
PricewaterhouseCoopers (PwC) & Carbon Disclosure Project. 2007. Review of the contribu-tion
of reporting to GHG emissions reductions and associated costs.
<http://www.ukmediacentre.pwc.com/imagelibrary/downloadMedia.ashx?...1833> Accessed
30 January 2011.
PricewaterhouseCoopers (PwC) & CDC. 2009. CSR trends 3 : a comprehensive survey of
corporate social responsibility report trends, benchmarks and best practices.
<http://www.pwc.com/ca/en /sustainability/publications/csr-trends-3-en.pdf> Accessed 26 July
2011.
PricewaterhouseCoopers (PwC) & CDC. 2010. CSR trends
2010.<http://www.pwc.com/ca/en/sustainability/publications/csr-trends-2010-09.pdf> Accessed
30 November 2010.
Radley Yeldar & Global Reporting Initiative (GRI). 2011. Trends in online sustainability
reporting. <http://www..globalreporting.org/.../TrendsInOnlineSustainabilityReporting2011.p>
Accessed 30 June 2011.
Raferty, K. 2005. "An investigation of the response of entities in the South African JSE ICT sector
in 2005 to Environmental Sustainability Reporting." Unpublished Master’s Dissertation,
Grahamstown. Rhodes University.
Ramdhony, D., Padachi, K. & Giroffle. L. 2010. Environmental Reporting in Mauritian Listed
Companies. <http://www.uom.ac.mu/.../Ramdhony,%20Padachi%20&%20Giroffle%20~%205>
Accessed 28 December 2010.
Republic of South Africa. 1995. Labour relations Act No. 66, 1995.
<http://www.info.gov.za/gazette/acts/1995/a66-95.htm> Accessed 30 December 2010.

428
Republic of South Africa. 1996. The Constitution of the Republic of South Africa Act No
108,1996. <http://www.info.gov.za/documents/constitution/1996/a108-96.pdf> Accessed
30 December 2010.
Republic of South Africa. 1997. Basic Conditions of Employment Act No. 75, 1997.
<http://www.capegateway.gov.za/eng/pubs/public_info/B/3342> Accessed 30 December 2010.
Republic of South Africa. 1998a. Employment Equity Act No. 55, 1998. <http://www.info.
gov.za/view/DownloadFileAction?id=70714&bcsi_scan_6E70 9EC7EB BC9476.>Accessed
30 December 2010.
Republic of South Africa. 1998b. National Environmental Management Act No. 107, 1998.
<http://www.info.gov.za/gazette/acts/1998/a107-98.pdf> Accessed 30 December 2010.
Republic of South Africa. 2003a. International conventions and protocolss on climate change.
<http://www.environment.gov.za/.../climate_change_conventions_26052003.html.> Accessed 30
December 2009.
Republic of South Africa. 2003b. Broad-Based Black Economic Empowerment Act No. 53, 2003.
<http://www. info.gov.za/view/DownloadFileAction?id=6803> Accessed 30 December 2010.
Republic of South Africa. 2010. National climate change response green paper 2010.
<http://www.polity.org.za/.../national-climate-change-response-green-paper-2010-2010-11-18>
Accessed 30 December 2010.
ResponsibleGold.org. 2011. Codes & Initiatives. <http://www.responsiblegold.org/codes.asp>
Accessed 18 June 2011.
Rikhardsson, P. & Holm, C. 2005. Do as you say – say as you do: Measuring the actual use of
environmental information in investment decisions.
<http://www.hha.dk/afl/wp/man/M_2005_02.pdf> Accessed 30 December 2011.
Rikhardsson, P., Holm, C. 2008. The effect of environmental information on investment allocation

429
decisions - an experimental study. Business Strategy and the Environment, 17(6):382–397.
Risk Metrics Group (RMG). 2009. Study on monitoring and enforcement practices in corporate
governance in the member states. <http://www.ec.europa.eu/internal_market/.../ studies/comply-
or- explain-090923_en.pdf> Accessed 30 November 2010.
Ritzer, G. 1975. Sociology: A Multiple Paradigm Science. The American Sociologist, 15–17.
Roberts, C.B. 1991. Environmental Disclosures: A Note on Reporting Practices in Mainland
Europe. Accounting, Auditing & Accountability journal, 4(3):62–71.
Rockness, J., & Williams, P.F. 1988. A descriptive study of social accounting responsibility mutual
funds. Accounting, Organizations and Society, 13(4):397–411.
Roser,S.R. 1979. "Relevancy of social accounting information for decision-makers: an empirical
Study." Unpublished Doctor of Philosophy thesis. Nebraska. University of Nebraska.
Rowbottom, N. & Lymer, A. 2007. User demands for management commentary: The operating
and financial review. Paper presented at the European accounting association conference, Lisbon.
April.
Rowley, J. 2002. Using case studies in research. Management research news, 25(1):16–27.
Rudd, M. 2011. US BP oil spill report demands industry reform. <http://www.supplychain
digital.com/tags/environmental-disasters/us-bp-oil-spill-report-demands-industry-reform>
Accessed 15 February 2011.
Sacconi, L. 2004. A social contract account for CSR as extended model of corporate governance
(Part II): Compliance, reputation and reciprocity. Journal of Business Ethics, 11:77–96.
Sagoff, M. 1990. The economy of the earth. Cambridge:Cambridge University Press.
Said, R.M., Sulaiman, M. Ahmad, N.N. & Senik, R. 2013. Environmental information usefulness:

430
bank officers perceptions in Malaysia.Paper presented at the 4th international conference on
business and economic research, Bandung, Indonesia. March.
Saka, C. & Burritt, R.L. 2004. Continuing problems with the quality of Pollutant Release and
Transfer Register (PRTR) information: a comparison of three international motor manufacturers .
<http://www.smu.edu.sg/events/apira/2004/Final%20Papers/1133-Burritt.pdf> Accessed 15
February 2011.
Sanders, T., Hatfield, H. & Moore, U. 1938. A Statement of Accounting Principles. New
York:American Institute of Certified Public Accountants.
Schiavi, P. 2005. Regulating the Social and Environmental Performance of the Australian
Minerals Industry: A Sociological Analysis of Emerging Forms of Governance.
<http://www.csrm.uq.edu.au /docs/PetrinaSchiavi_RegNetPaper.doc> Accessed 22 March 2011.
Schocker, A.D. & Sethi, S.P. 1974. An approach to incorporating social preferences in developing
corporate action strategies. California Management Review, 97–105.
Schoonraad, N. 2004. "Managing financial communication: towards a conceptual model."
Unpublished Masters of Commerce Dissertation (Communication Management). Pretoria.
University of Pretoria.
Scotland Excel. 2010. Responsible sustainable procurement strategy. <http://www.scot-land-
excel.org.uk /nmsruntime/saveasdialog.aspx?lID=1120> Accessed 30 January 2011.
Scott, P. & Jackson, R. 2002. Environmental, social and sustainability reporting on the web: best
practices. Corporate Environmental Strategy, 9(2):193–202.
Sekaran, U. 1992. Research methods for business: A skill building approach. (2nd ed.) New
Jersey:John Wiley and Sons Inc.
Sekaran, U. 2003. Research methods for business: A skill building approach.(4th ed.). New
Jersey:John Wiley and Sons Inc.

431
Shane, P. & Spicer, B.1983.Market response to environmental information produced outside the
firm. The Accounting Review, 58(3):521–38.
Sharenet, 2013. Top 100 Companies by Market Capital:2013/02/28.
<http://www.sharenet.co.za/index. phtml?content=/free/topco.phtml> Accessed 28 February 2013.
Shocker, A.D. & Sethi, S.P. 1973. An approach to incorporating societal preferences in developing
corporate action strategies. California Management Review, 97–105.
Skillius, A. & Wennberg, U. 1998. Continuity, credibility and comparability: key challe- nges for
corporate environmental performance measurement and communication.
<https://www.ertc.deqp.go.th/ertc/images/stories/.../eea_corp _env_reptg.pdf> Accessed 30
January 2011.
Slater, A. 2005. What you had was good – gems from a governance guru.
<http://www.Globalreporting.org/NR/.../SlaterGemsFromGovernanceGuru.pdf> Accessed 15
February 2011.
Smith, J., Shaw, B. & Brink, F. 1992. A taxonomy of accounting. (9th ed.). London:Longman.
Solomon, J.F., Solomon, A. 2006. Private social, ethical and environmental disclosure.
Accounting, Auditing & Accountability Journal, 19(4):564–591.
Somoye, R.O., Akintoye. I.R. & Oseni, J.E. 2009. Determinants of equity prices in the stock
markets. International Research Journal of Finance and Economics, (30):177–189.
South African Government. 2009. South Africa yearbook 2009/10 history. <http://www.gc
is.gov.za/ resource_centre/sa_info/yearbook/2009-10.htm> Accessed 30 January 2011.
South African Institute of Chartered Accountants (SAICA). 1990. AC 000: Framework for the
preparation and presentation of financial statements. Johannesburg: South African Institute of
Chartered Accountants.
432
South African Institute of Chartered Accountants (SAICA). 2010. Sustainability.
<https://www.saica. co.za/TechnicalInformation/Sustainability/IntroductionandBackground
/tabid/1591/language /en-US /Defa ult.aspx> Accessed 30 January 2011.
Spada. 2008. Environmental reporting trends in FTSE 100 sustainability reports.
<https://www.spada.co.uk/.../2008/.../environmental-reporting-spada-white-paper> Accessed 30
January 2011.
Stainbank, L.J. 2009. The value added statement: does it add any value? Meditari Accountancy
Research, 17(2):137–149.
Stainbank, L. & Peebles, C. 2006. The usefulness of corporate annual reports in South Africa:
perceptions of preparers and users. Meditari Accountancy Research, 14(1):69–80.
Standards South Africa. 2004. Corporate Social Responsibility (CSR): implications for an ISO
standard. <https://www.sabs.co.za/.../Standards.../> Accessed 15 February 2011.
Stanford University. 1997. The History of Apartheid in South Africa. <http://www-cs-
students.stanford.edu/~cale/cs201/apartheid.hist.html> Accessed 30 January 2011.
Staubus, G.J. 1961. A theory of accounting to investors. Berkeley, Carlifornia:University of
California Press.
Staubus, G.J. 1999. The decision-usefulness theory of accounting: A limited history. New York and
London:Garland Publishing Company.
Steiner, H.H. 1979. "Social reporting in annual reports by the U.S. oil industry since 1970."
Unpublished Master’s Dissertation, Texas. Texas Tech University.
Stephenson, M.M. 2003. Selection and application of computer assisted audit tools.
<http://www.acl.com/pdfs/090103-KnowledgeLeader.pdf> Accessed 08 April 2011.
Sterling, R.R. 1972. Decision-oriented financial accounting. Accounting and Business Research,
433
198–208.
Strandberg Consulting. 2009. The business case for sustainability.
<http://www.corostrandberg.com/.../Business_Case_for_Sustainability_21.pdf> Accessed 29
December 2011.
Strandberg Consulting. 2013. Sustainability reporting trends and implications.
<http://corostrandberg.com/wp-content/uploads/2013/12/Sustainability-Reporting-Trends-2013-
final.pdf> Accessed 16 September 2014.
Straub, D. W. 1989. Validating instruments in MIS Research. MIS Quarterly, 13(2):147–169.
SustainAbility. 1998. The CEO agenda. Can business leaders satisfy the triple bottom line?
<http://www.enviroreporting.com/others/unep_es_ceo.pdf.> Accessed 30 December 2009.
SustainAbility, Fundação Brasileira para o Desenvolvimento Sustentável (FBDS), United Nations
Environmental Programme (UNEP). 2008. The Road to Credibility a survey of sustainability
reporting in Brazil. <http://www.unep.fr/scp/gri/.../Brazil%20Global%20Reporters%2008.pdf.>
Accessed 24 March 2011.
SustainabilitySA. 2009. How do companies embed sustainability?
<http://www.sustainabilitysa.org/ SustainabilityTools.aspx> Accessed 30 December 2009.
SustainabilitySA. 2010. Green taxes. <http://www.sustainabilitysa.org/saenvironmental
taxes.aspx> Accessed 30 December 2010.
SustainabilitySA. 2011. A new book on reporting tools and approaches.
<http://www.sustainability sa.org/> Accessed 30 January 2011.
Systems, Applications & Products Library (SAPLIB). 2009. Top 4 Common problems with
sustainability reporting. <http://www.saplib.com/top 4-common-problems-with-sustainability-
reporting/> Accessed 15 February 2011.

434
Taib, A. 2005. Social and environmental reporting: perceptions of NGOs in Malaysia.
Unpublished Masters Thesis, Malaysia. International Islamic University.
Tarrant, H. 2011.. King unveils pioneering integrated reporting guidance: Mervyn King -
chairman, Integrated Reporting Committee.
<http://www.moneyweb.co.za/mw/view/mw/en/page295799?oid.> Accessed 30 January 2011.
The Chief Executive Officer. 2010. TechniData: Environmental performance management (EPM).
<http://www.the-chiefexecutive.com/projects/CEO008_Sustain/> Accessed 05 January 2010.
The Earth Encyclopedia. 2010. National Oil and Hazardous Substances Pollution Contingency
Plan. <http://www.eoearth.org/articles/view/158426.> Accessed 30 January 2011.
Thompson, P. & Cowton, C.J. 2004. Bringing the environment into bank lending: Implications for
environmental reporting. British Accounting Review, 36(2):197–218.
Tilt, C.A. 1994. The influence of external pressure groups on corporate social disclosure.
Accounting, Auditing and Accountability Journal, 7(4):47–72.
Tilt, C.A. 1997. Environmental policies of major australian companies: Australian evidence.
British Accounting Review, 29(4):367–394.
Tilt, C. A. 2008. Environmental disclosure outside the annual report. International. Journal of
Management and Decision Making, 9(3):288–309.
Tilt, C. 2009. Corporate responsibility, accounting and accountants. Professionals ́perspectives of
corporate social responsibility, 11–32.
Tinker, A. & Niemark, M. 1987. The role of annual reports in gender and class contradictions at
General Motors:1917–1976. Accounting, Organizations and Society, 12(1):65–88.
Tonello, M. 2010. Director notes: the role of the board in sustainability oversight.
<http://www.conference-board.org/retrievefile.cfm?filename=DN-008-10.pdf.> Accessed 30 July
2011.
435
Tooley, S. & Hooks, J. 2010. Public accountability: the perceived usefulness of school annual
reports. Australasian Accounting, Business and Finance Journal, 4(2):38–59.
Tornroos, L. 2005. "Corporate environmental reporting suggestions for an incremental and
standardised framework applicable to a variety of companies especially small and medium-sized
enterprise." Unpublished Doctor of Science in Technology thesis. Helsinki. Helsinki University of
Technology. Helsinki.
Trochim, W. & Donnelly, J. 2008. The research methods knowledge base. Ohio:Cengage
Learning.
Trucost and Environmental Agency. 2004. Environmental disclosures in the annual reports and
accounts of companies in FTSE all-share. <http://www.environment-agency.gov.uk/business
/topics/performance/124795.aspx.> Accessed 30 December 2011.
Trucost and Environmental Agency. 2006. Environmental disclosures: The second major review of
environmental reporting in the annual report & accounts of the FTSE all-share.
<http://www.environment-agency.gov.uk/business/topics/performance/124795.aspx.> Accessed 30
December 2011.
Trucost and Environmental Agency. 2009. Environmental disclosures:The third major review of
environmental reporting in the annual report & accounts of the FTSE all-share
companies.<http://www.environment-agency.gov.uk/business/topics/performance/124795.aspx.>
Accessed 30 December 2011.
Tyler, E. & Turner, D. Carbon disclosure project South Africa report 2007.
<http://www.nbi.org.za/ welcome.php?pg=2&pgm=M&id=10786.> Accessed 05 January 2010.
Ullman, A. 1985. Data in search of a theory: a critical examination of the relationships among
social performance, social disclosure, and economic performance of U.S. firms. Academy of
management review, 10(3): 540–557.

436
Unerman, J. 2000. Methodological issues: Reflections on quantification in corporate social
reporting content analysis. Accounting, Auditing and Accountability, 13(5):667–680.
Unerman, J. & O’Dwyer, B. 2004. Enron, WorldCom, Andersen et al.: A challenge to modernity.
Critical Perspectives on Accounting, 15(6–7):971–993.
United Nations. 1998. United Nations conference on trade and development . <http://www.unctad
.org/en/docs/c2isard2.en.pdf.> Accessed 15 June 2011.
United Nations. 2002. Johannesburg summit 2002. <http://www.un.org/jsummit/html/basic_info
/basicinfo.html.> Accessed 05 January 2010.
United Nations Conference on Trade And Development (UNCTAD). 1999. The social
responsibility of transnational corporations. <http://www.unctad.org/en/docs/poiteiitm21.en.pdf>
Accessed 31 December 2011.
United Nations Environmental Programme (UNEP) & Global Reporting Initiative (GRI).
Sustainability Reporting: Public Policy Trends Workshop. <http://www.unep.fr/scp/gri/pdf/
Sector Meet.pdf.> Accessed 05 July 2011.
United Nations Principles for Responsible Investment (UNPRI). 2007. Principles for responsible
investment. <http://www.unpri.org/report07/PRIReportOnProgress2007.pdf.> Accessed 05 May
2010.
Urminsky, M.D. 2004. Public policy, reporting and disclosure of employment and labour
information by multinational enterprises. <http://www.ilo.org/wcmsp5/groups/public/ @ed.../
publication /wcms_100990.pdf.> Accessed 15 January 2010.
Van Niekerk, M.C. 1998. "Die invloed van omgewingsinligting in finansiële jaarverslae van
Suid - Afrikaanse genoteerde maatskappye op beleggingsbesluite van bestuurders van
effektetrusts." Unpublished Doctor of Philosophy thesis. Pretoria. University of Pretoria.
Van Wyk, B.J. 2005. "The balance of power and the transition to democracy in South Africa."

437
Unpublished Master’s Dissertation, Pretoria. University of Pretoria.
Various environmental non-governamental organisations. 2010. SRI Index ignores significant
violations of environment laws. <http://www.cer.org.za/wpcontent/uploads/ 201 0/.../email-from -
JSE-SRI-9-Dec-2010.pdf.> Accessed 01 January 2011.
Virgilio. V. M. 2010. Sustainable development in practice: lessons learned from Amazon as.
<http://www.environmental-mainstreaming.org/.../Lessons%20Learned%20from%20Amazo
nas%20-%2017508IIED.pdf/> Accessed 01 January 2011.
Visser, W. 2005. Business frontiers: social responsibility, sustainable development and economic
justice. <http://www.waynevisser.com/book_business_frontiers.htm.> Accessed 05 January 2010.
Vrabic, A. 2010. "Corporate social responsibility in the oil and gas industry." Unpublished
Master’s Dissertation, Maastricht . Universiteit Maastricht.
Vogt, P. 2005. Dictionary of Statistics & Methodology (3rd ed.). Illinois:Sage Publications.
Walden, W.D. & Stagliano, A.J. 2004. An assessment of the quality of environmental disclosure
themes. Advances in environmental accounting and managemen, 2:137–65.
Wallen, C. & Wasserfaller, M. 2008. Internal organisational factors influencing voluntary CSR
disclosure -The case of three Swedish state-owned companies. <http://www.skolarbete.net/>
Accessed 01 September 2011.
Walter, H. 2006. Historical perspectives of accounting. <http://www.earticles.info/e/a/title
/Historical -perspectives-of-accounting.> Accessed 05 January 2010.
Warsame, H., Neu, D. & Simmons, C.V. 2002. Responding to discrediting events: Annual report
disclosure responses to environmental fines. Accounting and the Public Interest, 2:22–40.
Wensen, K.V., Wijnand, B., Johanna, K. & Jutta, K. 2011. The state of play in sustainability
reporting in the European Union. <http://www.ec.europa.eu/social/BlobServlet?docId=67
27&lang.> Accessed 26 August 2010.
438
Wilson, M. 2003. Corporate sustainability: What is it and where does it come from? IVEY
Business Journal, 1-5.
Wingard, H.C. 2001. "Financial performance of environmentally responsible South African listed
companies." Unpublished Doctor of Commerce thesis. Pretoria. University of Pretoria.
Winter, S. G. 1986. Comments on Arrow and on Lucas. Journal of Business, 59(4):427–434.
Wiseman, J. 1982. An evaluation of environmental disclosures made in corporate annual reports.
Accounting, Organizations and Society, 7(1):53–63.
Wolfe, R.A. 1991. The use of content analysis to assess corporate social responsibility. Research
in corporate social performance and policy. Greenwich:JAI Press.
Wong, R. 2011. Corporate social and environmental reporting. A user perspective. Unpublished
Doctor of Philosophy thesis. United Kingdom. University of Bath.
World Bank. 2010. World development report: Development and climate change.
<http://www.world bank.org /wdr.> Accessed 12 March 2010.
World Business Council for Sustainable Development (WBCSD). 2008. Guidelines for identifying
business risks and opportunities arising from ecosystem change. Version 1. Conches-Geneva:
WBCSD. <http://www.wbcsd.org/includes/getTarget.asp?type=d&id=M zYwMzQ.> Accessed 05
January 2010.
Wolk, H.I., Dodd, J.L. & Rozycki, J.J. 2008. Accounting theory. Thousand Oaks, Califonia:Sage.
Wolk, H.I. & Tearney, M.G. 1997. Accounting Theory: A Conceptual and Institutional Approach.
Cincinnati, Ohio:South-Western College.
Wolk, H.I., Tearney, M.G. & Dodd, J.L. 2001. (5th ed.). Accounting Theory: A conceptual and
institutional approach. Cincinnati, Ohio:South-Western College.
439
World Federation of Exchanges (WFE). 2010. Exchanges, ESG and investment decisions .
<http://www.world-exchanges.org/files/.../WFE%20ESG%20publication%20.pdf.> Accessed 05
March 2011.
World Resources Institute. 2004. The Greenhouse gas protocol. <http://pdf.wri.org/ghg_protocol
_2004.pdf.> Accessed 30 December 2009.
Wyatt, S.J. & Woodard, S. 2010. Final Report: Post World War Two Survey. <http://www.
cmhpf.org/postww2survey.htm.> Accessed 01 January 2011.
Wyngaard, R.G. & Hendricks, P.S.A. 2010. South Africa’s King III: highlighting the need for a
separate non-profit governance code <http://www.nonprofitlawyer.co.za/.../55e59ce 091f35412
ffff81657f000101.pdf.> Accessed 08 June 2011.
Yatim, N. 1997. Disclosure : A consensus between users and preparers of the Malaysian listed
companies. Unpublished Masters Thesis, Australia. Curtin University of Technology.
Yekinni, C.O. (2008). Social and environmental reporting: how informative is the disclosure of
community involvement cost – qualitative or quantitative. Proceedings of corporate responsibility
research conference, 7–9 September, Belfast.
Yosie, T.F. & Herbst, T.D. 1998. Using stakeholder processes in environmental decisionmaking:
an evaluation of lessons learned, key issues, and future challenges.
<http://www.gdrc.org/decision/ nr98ab01.pdf.> Accessed 28 April 2011.
Young, S.G. 2010. New media and environmental governance: engendering participation and
creating constituencies to address climate change in small island developing states.
<http://www.conference.unitar.org/yale/sites/conference.unitar.../Paper_Young_MK.pdf.>
Accessed 10 June 2011.
Zeff, S.A. 1999. 'The evolution of the conceptual. framework for business. enterprises in the
united states.' The Accounting Historians Journal, 26 (2):89–131.

440
Zulkifli, N., Telford, B. & Marriott, N. 2009. 'Social and environmental accounting in Malaysia:
practitioners’ views.' Research in Accounting in Emerging Economies, 9:145–167.

441
APPENDIX A
RELEVANCE CONTROL LIST JUDGEMENT
SCALE
Questions Categories
Not disclosed Disclosed as Narrative
Disclosed as quantitative but non monetary
Disclosed as monetary
Time (Futuristic)
Specificity
Total points awarded
Maximum points awardable
CATEGORY NO QUESTION 0
1
2
3 1 additional
point 1 additional point
Selection of stakeholders for engagement
1 Does the report identify the stakeholders of the company for engagement purposes?
1 1 2
1.1 If the stakeholders are identified, is an indication provided of the stakeholders relative importance?
2 2
Methods of engagement of stakeholders
2 Does the report disclose the approaches/ methods of engagement employed to engage with stakeholders?
3 2 2
2.1 If the approaches/methods used in engagement are disclosed, are different methods employed to engage different stakeholders? 4
2 Engagement process and outcome
3 Does the report describe the process of engagement with stakeholders? 5 3 2
3.1 If the process of engagement is described, is mention made of whether the engagement initiatives are quantified using a consistent metric to measure their effectiveness in terms of impacts and outcomes?
6 3
3.2 If the process of engagement is described, is mention made of whether any of the engagement was undertaken specifically as part of the report preparation process?
7 2
3.3 If the process of engagement is described, is mention made of the outcomes of stakeholder engagement /dialogues such as key topics and concerns raised through engagement?
8 2
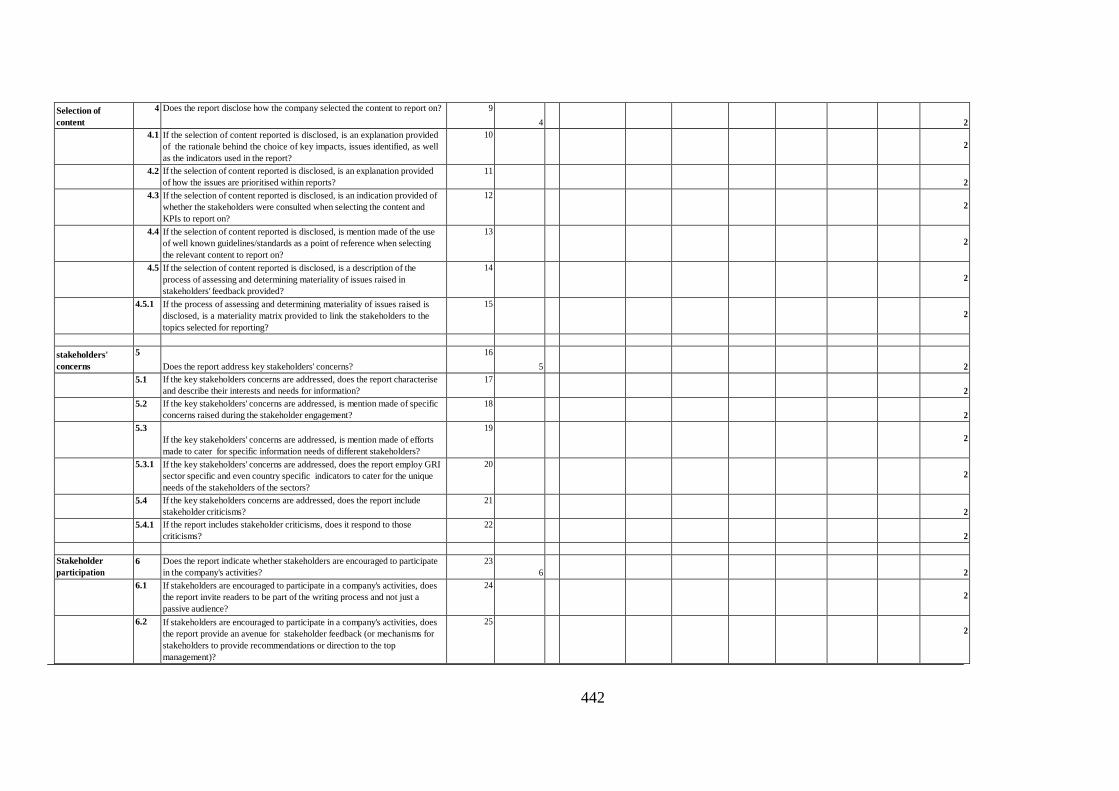
442
Selection of content
4 Does the report disclose how the company selected the content to report on? 9 4
2 4.1 If the selection of content reported is disclosed, is an explanation provided
of the rationale behind the choice of key impacts, issues identified, as well as the indicators used in the report?
10 2
4.2 If the selection of content reported is disclosed, is an explanation provided of how the issues are prioritised within reports?
11 2
4.3 If the selection of content reported is disclosed, is an indication provided of whether the stakeholders were consulted when selecting the content and KPIs to report on?
12 2
4.4 If the selection of content reported is disclosed, is mention made of the use of well known guidelines/standards as a point of reference when selecting the relevant content to report on?
13 2
4.5 If the selection of content reported is disclosed, is a description of the process of assessing and determining materiality of issues raised in stakeholders' feedback provided?
14 2
4.5.1 If the process of assessing and determining materiality of issues raised is disclosed, is a materiality matrix provided to link the stakeholders to the topics selected for reporting?
15 2
stakeholders' concerns
5 Does the report address key stakeholders' concerns?
16 5
2 5.1 If the key stakeholders concerns are addressed, does the report characterise
and describe their interests and needs for information? 17
2 5.2 If the key stakeholders' concerns are addressed, is mention made of specific
concerns raised during the stakeholder engagement? 18
2 5.3
If the key stakeholders' concerns are addressed, is mention made of efforts made to cater for specific information needs of different stakeholders?
19 2
5.3.1 If the key stakeholders' concerns are addressed, does the report employ GRI sector specific and even country specific indicators to cater for the unique needs of the stakeholders of the sectors?
20 2
5.4 If the key stakeholders concerns are addressed, does the report include stakeholder criticisms?
21 2
5.4.1 If the report includes stakeholder criticisms, does it respond to those criticisms?
22 2
Stakeholder participation
6 Does the report indicate whether stakeholders are encouraged to participate in the company's activities?
23 6
2 6.1 If stakeholders are encouraged to participate in a company's activities, does
the report invite readers to be part of the writing process and not just a passive audience?
24 2
6.2 If stakeholders are encouraged to participate in a company's activities, does the report provide an avenue for stakeholder feedback (or mechanisms for stakeholders to provide recommendations or direction to the top management)?
25 2
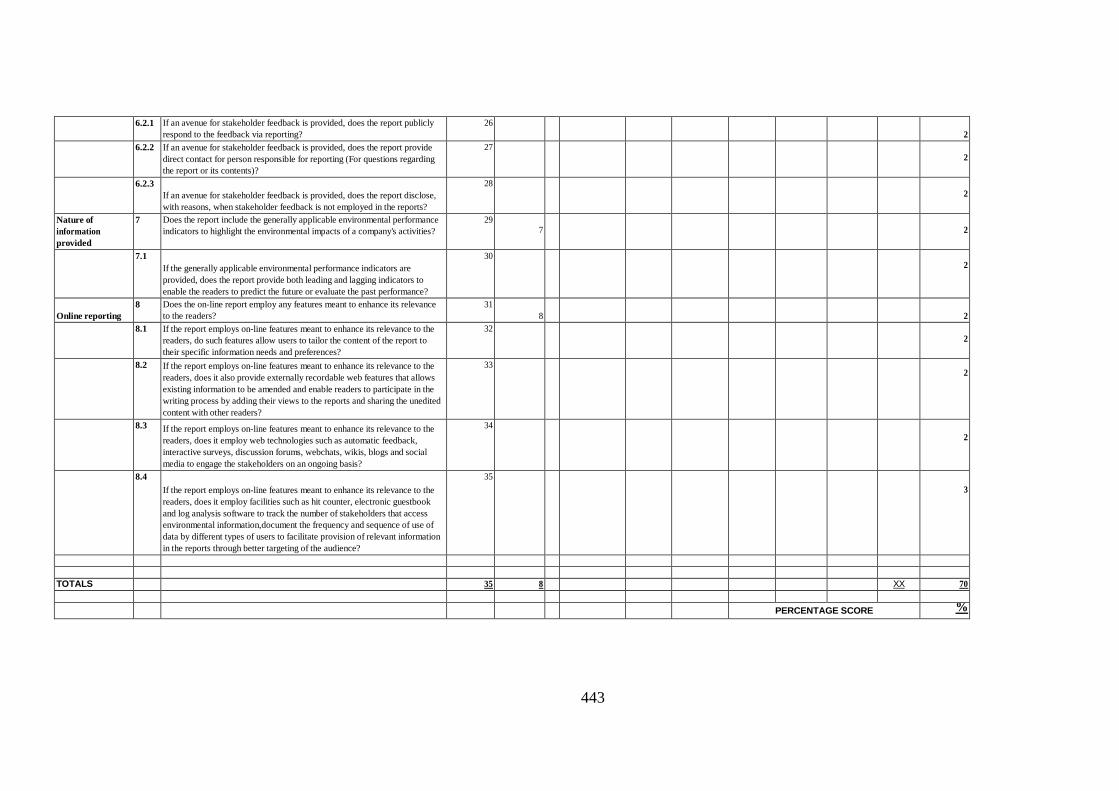
443
6.2.1 If an avenue for stakeholder feedback is provided, does the report publicly
respond to the feedback via reporting? 26
2 6.2.2 If an avenue for stakeholder feedback is provided, does the report provide
direct contact for person responsible for reporting (For questions regarding the report or its contents)?
27 2
6.2.3 If an avenue for stakeholder feedback is provided, does the report disclose, with reasons, when stakeholder feedback is not employed in the reports?
28 2
Nature of information provided
7 Does the report include the generally applicable environmental performance indicators to highlight the environmental impacts of a company's activities?
29 7
2
7.1 If the generally applicable environmental performance indicators are provided, does the report provide both leading and lagging indicators to enable the readers to predict the future or evaluate the past performance?
30 2
Online reporting
8 Does the on-line report employ any features meant to enhance its relevance to the readers?
31 8
2 8.1 If the report employs on-line features meant to enhance its relevance to the
readers, do such features allow users to tailor the content of the report to their specific information needs and preferences?
32 2
8.2 If the report employs on-line features meant to enhance its relevance to the readers, does it also provide externally recordable web features that allows existing information to be amended and enable readers to participate in the writing process by adding their views to the reports and sharing the unedited content with other readers?
33 2
8.3 If the report employs on-line features meant to enhance its relevance to the readers, does it employ web technologies such as automatic feedback, interactive surveys, discussion forums, webchats, wikis, blogs and social media to engage the stakeholders on an ongoing basis?
34 2
8.4 If the report employs on-line features meant to enhance its relevance to the readers, does it employ facilities such as hit counter, electronic guestbook and log analysis software to track the number of stakeholders that access environmental information,document the frequency and sequence of use of data by different types of users to facilitate provision of relevant information in the reports through better targeting of the audience?
35 3
TOTALS 35 8 XX 70
PERCENTAGE SCORE %
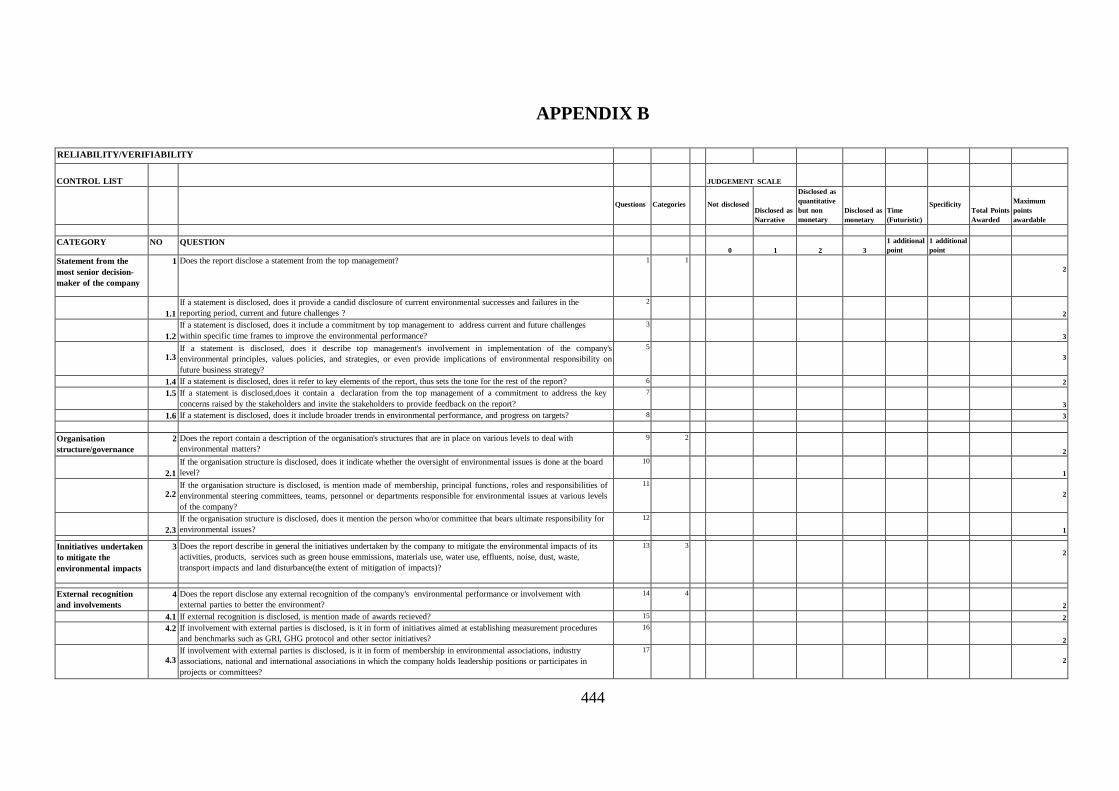
444
APPENDIX B
RELIABILITY/VERIFIABILITY CONTROL LIST
JUDGEMENT SCALE
Questions Categories
Not disclosed Disclosed as Narrative
Disclosed as quantitative but non monetary
Disclosed as monetary
Time (Futuristic)
Specificity
Total Points Awarded
Maximum points awardable
CATEGORY NO QUESTION 0
1 2
3 1 additional point 1 additional
point Statement from the most senior decision- maker of the company
1 Does the report disclose a statement from the top management? 1 1 2
1.1
If a statement is disclosed, does it provide a candid disclosure of current environmental successes and failures in the reporting period, current and future challenges ?
2 2
1.2
If a statement is disclosed, does it include a commitment by top management to address current and future challenges within specific time frames to improve the environmental performance?
3 3
1.3 If a statement is disclosed, does it describe top management's involvement in implementation of the company's
environmental principles, values policies, and strategies, or even provide implications of environmental responsibility on future business strategy?
5 3
1.4 If a statement is disclosed, does it refer to key elements of the report, thus sets the tone for the rest of the report? 6 2 1.5 If a statement is disclosed,does it contain a declaration from the top management of a commitment to address the key
concerns raised by the stakeholders and invite the stakeholders to provide feedback on the report? 7
3 1.6 If a statement is disclosed, does it include broader trends in environmental performance, and progress on targets? 8 3 Organisation structure/governance
2 Does the report contain a description of the organisation's structures that are in place on various levels to deal with environmental matters?
9 2 2
2.1
If the organisation structure is disclosed, does it indicate whether the oversight of environmental issues is done at the board level?
10 1
2.2 If the organisation structure is disclosed, is mention made of membership, principal functions, roles and responsibilities of
environmental steering committees, teams, personnel or departments responsible for environmental issues at various levels of the company?
11 2
2.3
If the organisation structure is disclosed, does it mention the person who/or committee that bears ultimate responsibility for environmental issues?
12 1
Innitiatives undertaken to mitigate the environmental impacts
3 Does the report describe in general the initiatives undertaken by the company to mitigate the environmental impacts of its activities, products, services such as green house emmissions, materials use, water use, effluents, noise, dust, waste, transport impacts and land disturbance(the extent of mitigation of impacts)?
13 3 2
External recognition and involvements
4 Does the report disclose any external recognition of the company's environmental performance or involvement with external parties to better the environment?
14 4 2
4.1 If external recognition is disclosed, is mention made of awards recieved? 15 2 4.2 If involvement with external parties is disclosed, is it in form of initiatives aimed at establishing measurement procedures
and benchmarks such as GRI, GHG protocol and other sector initiatives? 16
2
4.3 If involvement with external parties is disclosed, is it in form of membership in environmental associations, industry associations, national and international associations in which the company holds leadership positions or participates in projects or committees?
17 2
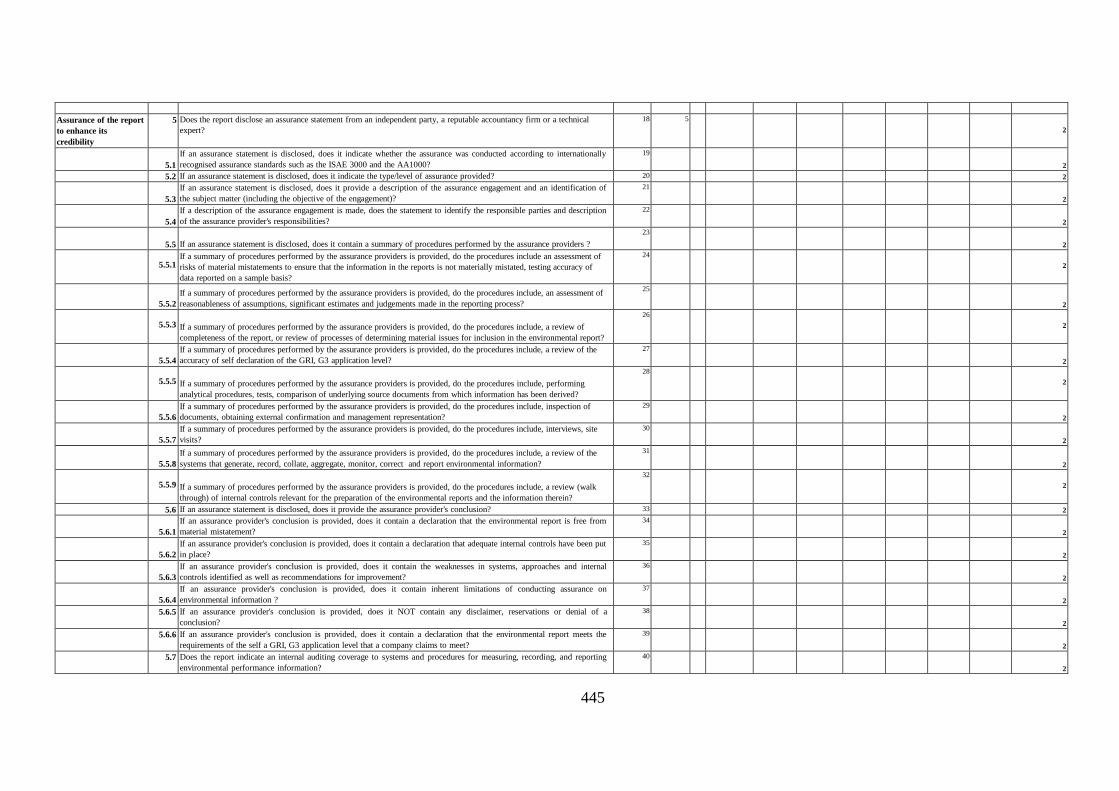
445
Assurance of the report to enhance its credibility
5 Does the report disclose an assurance statement from an independent party, a reputable accountancy firm or a technical expert?
18 5 2
5.1
If an assurance statement is disclosed, does it indicate whether the assurance was conducted according to internationally recognised assurance standards such as the ISAE 3000 and the AA1000?
19 2
5.2 If an assurance statement is disclosed, does it indicate the type/level of assurance provided? 20 2
5.3 If an assurance statement is disclosed, does it provide a description of the assurance engagement and an identification of the subject matter (including the objective of the engagement)?
21 2
5.4
If a description of the assurance engagement is made, does the statement to identify the responsible parties and description of the assurance provider's responsibilities?
22 2
5.5
If an assurance statement is disclosed, does it contain a summary of procedures performed by the assurance providers ?
23 2
5.5.1 If a summary of procedures performed by the assurance providers is provided, do the procedures include an assessment of
risks of material mistatements to ensure that the information in the reports is not materially mistated, testing accuracy of data reported on a sample basis?
24 2
5.5.2
If a summary of procedures performed by the assurance providers is provided, do the procedures include, an assessment of reasonableness of assumptions, significant estimates and judgements made in the reporting process?
25 2
5.5.3 If a summary of procedures performed by the assurance providers is provided, do the procedures include, a review of
completeness of the report, or review of processes of determining material issues for inclusion in the environmental report? 26
2
5.5.4
If a summary of procedures performed by the assurance providers is provided, do the procedures include, a review of the accuracy of self declaration of the GRI, G3 application level?
27 2
5.5.5 If a summary of procedures performed by the assurance providers is provided, do the procedures include, performing
analytical procedures, tests, comparison of underlying source documents from which information has been derived? 28
2
5.5.6
If a summary of procedures performed by the assurance providers is provided, do the procedures include, inspection of documents, obtaining external confirmation and management representation?
29 2
5.5.7
If a summary of procedures performed by the assurance providers is provided, do the procedures include, interviews, site visits?
30 2
5.5.8
If a summary of procedures performed by the assurance providers is provided, do the procedures include, a review of the systems that generate, record, collate, aggregate, monitor, correct and report environmental information?
31 2
5.5.9 If a summary of procedures performed by the assurance providers is provided, do the procedures include, a review (walk
through) of internal controls relevant for the preparation of the environmental reports and the information therein? 32
2
5.6 If an assurance statement is disclosed, does it provide the assurance provider's conclusion? 33 2
5.6.1 If an assurance provider's conclusion is provided, does it contain a declaration that the environmental report is free from material mistatement?
34 2
5.6.2
If an assurance provider's conclusion is provided, does it contain a declaration that adequate internal controls have been put in place?
35 2
5.6.3
If an assurance provider's conclusion is provided, does it contain the weaknesses in systems, approaches and internal controls identified as well as recommendations for improvement?
36 2
5.6.4
If an assurance provider's conclusion is provided, does it contain inherent limitations of conducting assurance on environmental information ?
37 2
5.6.5 If an assurance provider's conclusion is provided, does it NOT contain any disclaimer, reservations or denial of a conclusion?
38 2
5.6.6 If an assurance provider's conclusion is provided, does it contain a declaration that the environmental report meets the requirements of the self a GRI, G3 application level that a company claims to meet?
39 2
5.7 Does the report indicate an internal auditing coverage to systems and procedures for measuring, recording, and reporting environmental performance information?
40 2
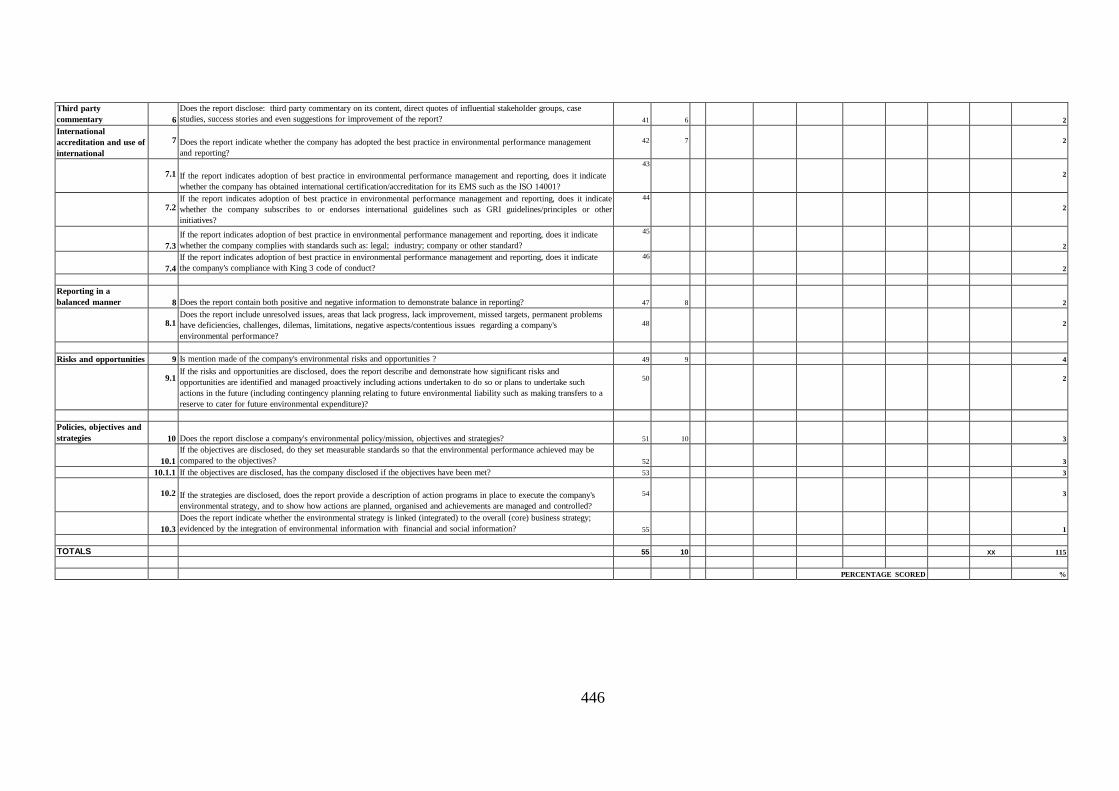
446
Third party commentary
6 Does the report disclose: third party commentary on its content, direct quotes of influential stakeholder groups, case studies, success stories and even suggestions for improvement of the report?
41 6 2
International accreditation and use of international
7 Does the report indicate whether the company has adopted the best practice in environmental performance management
and reporting?
42 7 2
7.1 If the report indicates adoption of best practice in environmental performance management and reporting, does it indicate
whether the company has obtained international certification/accreditation for its EMS such as the ISO 14001? 43
2
7.2 If the report indicates adoption of best practice in environmental performance management and reporting, does it indicate
whether the company subscribes to or endorses international guidelines such as GRI guidelines/principles or other initiatives?
44 2
7.3
If the report indicates adoption of best practice in environmental performance management and reporting, does it indicate whether the company complies with standards such as: legal; industry; company or other standard?
45 2
7.4
If the report indicates adoption of best practice in environmental performance management and reporting, does it indicate the company's compliance with King 3 code of conduct?
46 2
Reporting in a balanced manner
8 Does the report contain both positive and negative information to demonstrate balance in reporting?
47 8 2
8.1 Does the report include unresolved issues, areas that lack progress, lack improvement, missed targets, permanent problems
have deficiencies, challenges, dilemas, limitations, negative aspects/contentious issues regarding a company's environmental performance?
48
2
Risks and opportunities 9 Is mention made of the company's environmental risks and opportunities ? 49 9 4
9.1 If the risks and opportunities are disclosed, does the report describe and demonstrate how significant risks and opportunities are identified and managed proactively including actions undertaken to do so or plans to undertake such actions in the future (including contingency planning relating to future environmental liability such as making transfers to a reserve to cater for future environmental expenditure)?
50
2
Policies, objectives and strategies
10 Does the report disclose a company's environmental policy/mission, objectives and strategies? 51 10
3
10.1 If the objectives are disclosed, do they set measurable standards so that the environmental performance achieved may be compared to the objectives?
52 3
10.1.1 If the objectives are disclosed, has the company disclosed if the objectives have been met? 53 3
10.2 If the strategies are disclosed, does the report provide a description of action programs in place to execute the company's environmental strategy, and to show how actions are planned, organised and achievements are managed and controlled?
54
3
10.3
Does the report indicate whether the environmental strategy is linked (integrated) to the overall (core) business strategy; evidenced by the integration of environmental information with financial and social information?
55 1
TOTALS 55 10 XX 115 PERCENTAGE SCORED %

447
APPENDIX C
UNDERSTANDABILITY/CLARITY CONTROL LIST
JUDGEMENT SCALE
Not disclosed
Disclosed as Narrative
Disclosed as quantitative but non monetary
Disclosed as monetary
Time (Futuristic)
Specificity
Total Points awarded
Maximum points awardable
CATEGORY NO QUESTION Questions
Categories 0
1 2
3 1 additional point
1 additional point
Company's profile 1 Does the report disclose any information that provides the company's profile? 1 1 1
1.1 If the report discloses information that provide a company's profile, does it mention the company's primary brands, products, or services to indicate the nature of the company's operations? 2
2
1.2 If the report discloses information that provide a company's profile, does it mention the operational structure of the company, main divisions, operating companies, subsidiaries, and joint ventures, or sites of major operations as well as provide a description of the operations, processes, or activities undertaken?
3
2
Scale of operation 2 Does the report indicate the scale of operation of the company ? 4 2 1
2.1
If the report indicates the scale of operation of the company, does it mention the number of employees, or geographical area covered or volume of products or number of services rendered, net sales or total assets employed? 5
5
2.2 If the report indicates the scale of operation of the company, does it disclose major changes in organisational context (organisation size, structure, ownership, capital structure and activities, mergers, divestments, spin-offs, expansion, openings and closings, as well as changes in operations) since last report?
6 5
Scope/boundary 3 Does the report indicate its scope/ boundary? 7 3 1
3.1 If the report indicates its scope/ boundary, does it define the parts of the company (and related boundaries) to which the described aspects, activities and performance refer?
8 2
3.2
If the report indicates its scope/ boundary, does it specify the activities, plants, business units, or sites covered in relation to the entire organisation (e.g. as percentage of turnover, number of employees or production volume, etc.)?
9 3
3.3
If the report indicates its scope/ boundary, does it provide boundaries and limitations in form of restrictions or exclusions to scope?
10 2
Summary of performance indicators
4 Does the report provide the trends of Key performance indicators in summary tables, fact sheet, charts or graphs, for a
reader to follow the emerging patterns and capture the most important messages of the report within a short period of time?
11 4
5
4.1
If summary tables, charts or graphs of key performance indicators are provided, are they accompanied by commentary or interpretation that make information understandable to the readers?
12 2
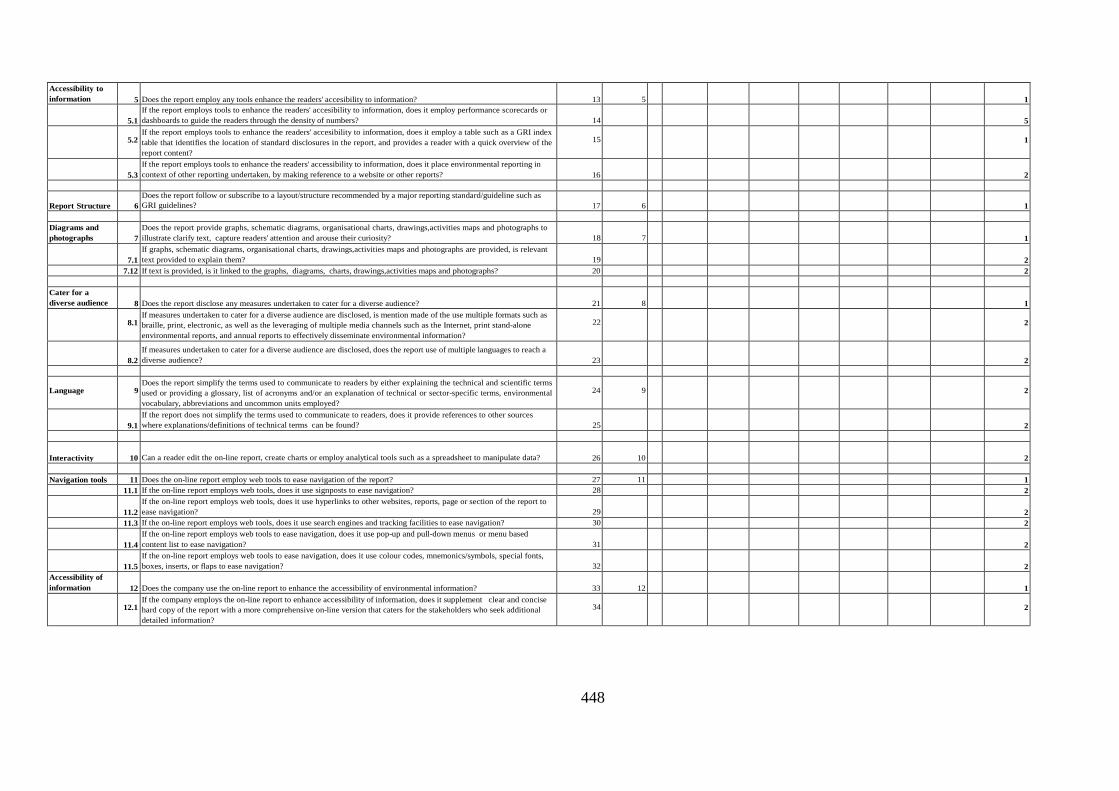
448
Accessibility to information
5 Does the report employ any tools enhance the readers' accesibility to information? 13 5
1
5.1 If the report employs tools to enhance the readers' accesibility to information, does it employ performance scorecards or dashboards to guide the readers through the density of numbers?
14 5
5.2 If the report employs tools to enhance the readers' accesibility to information, does it employ a table such as a GRI index
table that identifies the location of standard disclosures in the report, and provides a reader with a quick overview of the report content?
15
1
5.3
If the report employs tools to enhance the readers' accessibility to information, does it place environmental reporting in context of other reporting undertaken, by making reference to a website or other reports?
16 2
Report Structure
6 Does the report follow or subscribe to a layout/structure recommended by a major reporting standard/guideline such as GRI guidelines?
17 6 1
Diagrams and photographs
7 Does the report provide graphs, schematic diagrams, organisational charts, drawings,activities maps and photographs to illustrate clarify text, capture readers' attention and arouse their curiosity?
18 7 1
7.1
If graphs, schematic diagrams, organisational charts, drawings,activities maps and photographs are provided, is relevant text provided to explain them?
19 2
7.12 If text is provided, is it linked to the graphs, diagrams, charts, drawings,activities maps and photographs? 20 2 Cater for a diverse audience
8 Does the report disclose any measures undertaken to cater for a diverse audience? 21 8
1
8.1 If measures undertaken to cater for a diverse audience are disclosed, is mention made of the use multiple formats such as braille, print, electronic, as well as the leveraging of multiple media channels such as the Internet, print stand-alone environmental reports, and annual reports to effectively disseminate environmental information?
22
2
8.2
If measures undertaken to cater for a diverse audience are disclosed, does the report use of multiple languages to reach a diverse audience?
23 2
Language
9 Does the report simplify the terms used to communicate to readers by either explaining the technical and scientific terms used or providing a glossary, list of acronyms and/or an explanation of technical or sector-specific terms, environmental vocabulary, abbreviations and uncommon units employed?
24 9
2
9.1
If the report does not simplify the terms used to communicate to readers, does it provide references to other sources where explanations/definitions of technical terms can be found?
25 2
Interactivity
10 Can a reader edit the on-line report, create charts or employ analytical tools such as a spreadsheet to manipulate data? 26 10
2 Navigation tools 11 Does the on-line report employ web tools to ease navigation of the report? 27 11 1 11.1 If the on-line report employs web tools, does it use signposts to ease navigation? 28 2
11.2 If the on-line report employs web tools, does it use hyperlinks to other websites, reports, page or section of the report to ease navigation?
29 2
11.3 If the on-line report employs web tools, does it use search engines and tracking facilities to ease navigation? 30 2
11.4 If the on-line report employs web tools to ease navigation, does it use pop-up and pull-down menus or menu based content list to ease navigation?
31 2
11.5
If the on-line report employs web tools to ease navigation, does it use colour codes, mnemonics/symbols, special fonts, boxes, inserts, or flaps to ease navigation?
32 2
Accessibility of information
12 Does the company use the on-line report to enhance the accessibility of environmental information? 33 12
1
12.1 If the company employs the on-line report to enhance accessibility of information, does it supplement clear and concise hard copy of the report with a more comprehensive on-line version that caters for the stakeholders who seek additional detailed information?
34
2
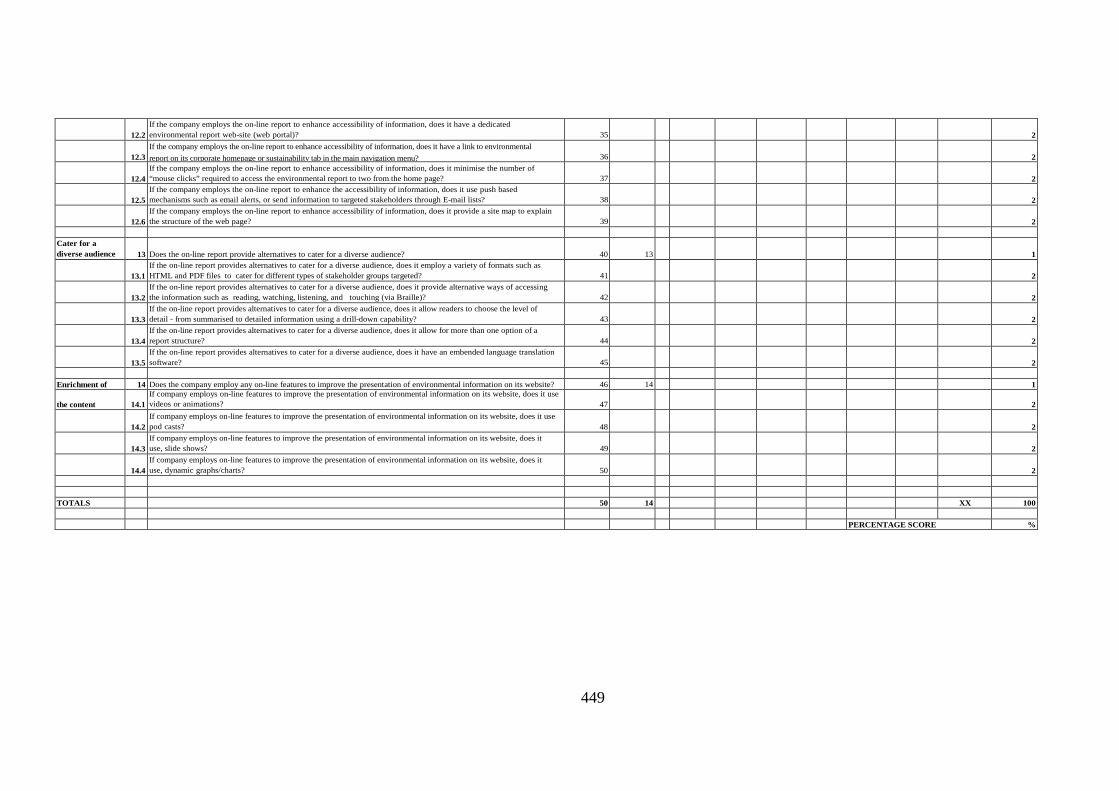
449
12.2 If the company employs the on-line report to enhance accessibility of information, does it have a dedicated environmental report web-site (web portal)?
35 2
12.3
If the company employs the on-line report to enhance accessibility of information, does it have a link to environmental report on its corporate homepage or sustainability tab in the main navigation menu?
36
2
12.4 If the company employs the on-line report to enhance accessibility of information, does it minimise the number of “mouse clicks” required to access the environmental report to two from the home page?
37 2
12.5
If the company employs the on-line report to enhance the accessibility of information, does it use push based mechanisms such as email alerts, or send information to targeted stakeholders through E-mail lists?
38 2
12.6
If the company employs the on-line report to enhance accessibility of information, does it provide a site map to explain the structure of the web page?
39 2
Cater for a diverse audience
13 Does the on-line report provide alternatives to cater for a diverse audience? 40 13
1
13.1 If the on-line report provides alternatives to cater for a diverse audience, does it employ a variety of formats such as HTML and PDF files to cater for different types of stakeholder groups targeted?
41 2
13.2
If the on-line report provides alternatives to cater for a diverse audience, does it provide alternative ways of accessing the information such as reading, watching, listening, and touching (via Braille)?
42 2
13.3
If the on-line report provides alternatives to cater for a diverse audience, does it allow readers to choose the level of detail - from summarised to detailed information using a drill-down capability?
43 2
13.4
If the on-line report provides alternatives to cater for a diverse audience, does it allow for more than one option of a report structure?
44 2
13.5
If the on-line report provides alternatives to cater for a diverse audience, does it have an embended language translation software?
45 2
Enrichment of 14 Does the company employ any on-line features to improve the presentation of environmental information on its website? 46 14 1 the content
14.1 If company employs on-line features to improve the presentation of environmental information on its website, does it use videos or animations?
47 2
14.2
If company employs on-line features to improve the presentation of environmental information on its website, does it use pod casts?
48 2
14.3
If company employs on-line features to improve the presentation of environmental information on its website, does it use, slide shows?
49 2
14.4
If company employs on-line features to improve the presentation of environmental information on its website, does it use, dynamic graphs/charts?
50 2
TOTALS 50 14 XX 100 PERCENTAGE SCORE %

450
APPENDIX D
TIMELINESS CONTROL LIST
JUDGEMENT SCALE
Questions Categories
Not disclosed
Disclosed as a narrative
Disclosed as quantitative but non monetary
Disclosed as monetary
Time (Futuristic)
Specificity
Total Points awarded
Maximum Points awardable
CATEGORY NO QUESTION
0
1
2
3 1 additional point
1 additional point
Frequency 1 Does the report indicate the frequency of reporting? 1 1 1
1.1 If the frequency of reporting is disclosed, does the report indicate the reporting period covered (fiscal/calendar year) by the information provided?
2 2
1.2
If the frequency of reporting is disclosed, does the report also indicate the date (year) of the immediately preceding report (if any)?
3 2
1.3
If the frequency of reporting is disclosed, is the reporting cycle annual or more frequent than annual?
4 1
Reports posted on the website
2
Does the report disclose the currency of the environmental information disclosed ?
5
2 2
2.1
If the currency of the environmental information is disclosed, is mention made of when the web page was last updated?
6
2
2.2
If the currency of the environmental information is disclosed, is the last update at least four months from the date the website is examined by the researcher?
7
1
2.3
If the currency of the environmental information is disclosed, does the company use webcasts to broadcast new environmental information or provide real time information?
8
2
2.4
Does the company alert readers when new environmental information is placed on its website (for example using email alerts)?
9
2
2.5
Does the company employ Rich Site Summary (RSS) feeds, a format used to publish frequently updated works?
10
TOTALS 10 2 XX 15 PERCENTAGE SCORE %
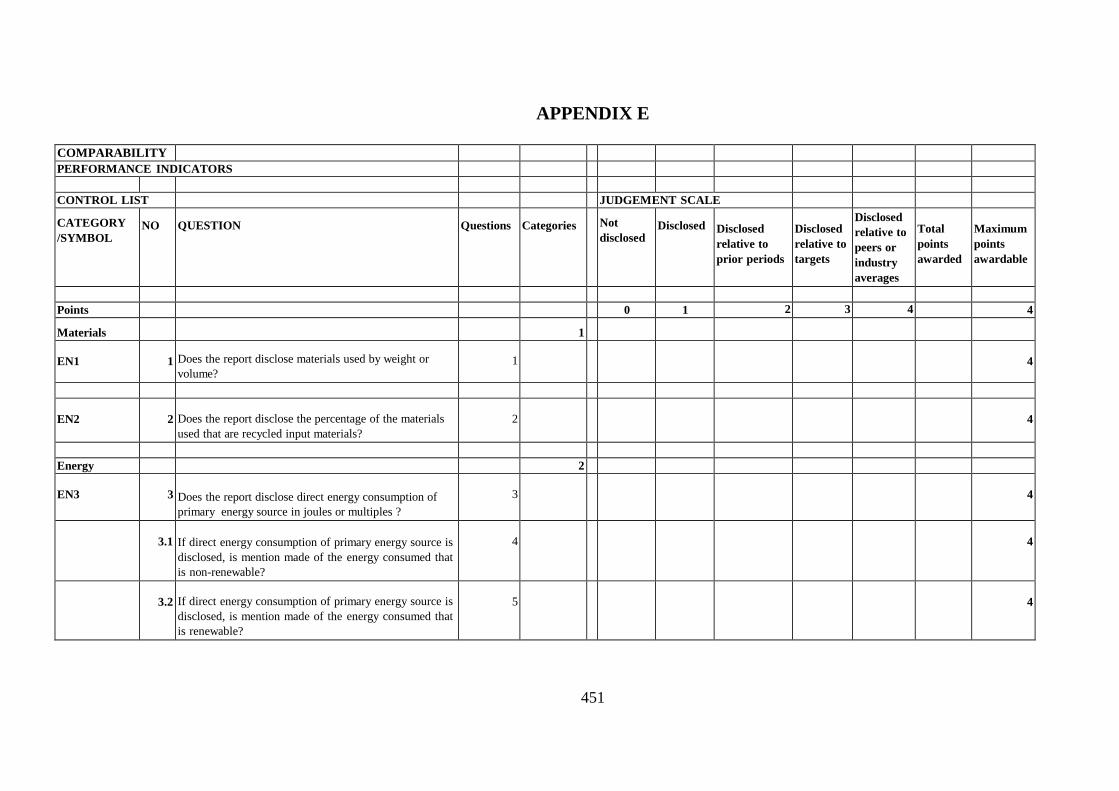
451
APPENDIX E
COMPARABILITY PERFORMANCE INDICATORS CONTROL LIST JUDGEMENT SCALE
CATEGORY /SYMBOL
NO
QUESTION
Questions
Categories
Not disclosed
Disclosed
Disclosed relative to prior periods
Disclosed relative to targets
Disclosed relative to peers or industry averages
Total points awarded
Maximum points awardable
Points 0 1 2 3 4 4
Materials
1 EN1
1
Does the report disclose materials used by weight or volume?
1
4
EN2
2
Does the report disclose the percentage of the materials used that are recycled input materials?
2
4
Energy 2 EN3
3
Does the report disclose direct energy consumption of primary energy source in joules or multiples ?
3
4
3.1
If direct energy consumption of primary energy source is disclosed, is mention made of the energy consumed that is non-renewable?
4
4
3.2
If direct energy consumption of primary energy source is disclosed, is mention made of the energy consumed that is renewable?
5
4
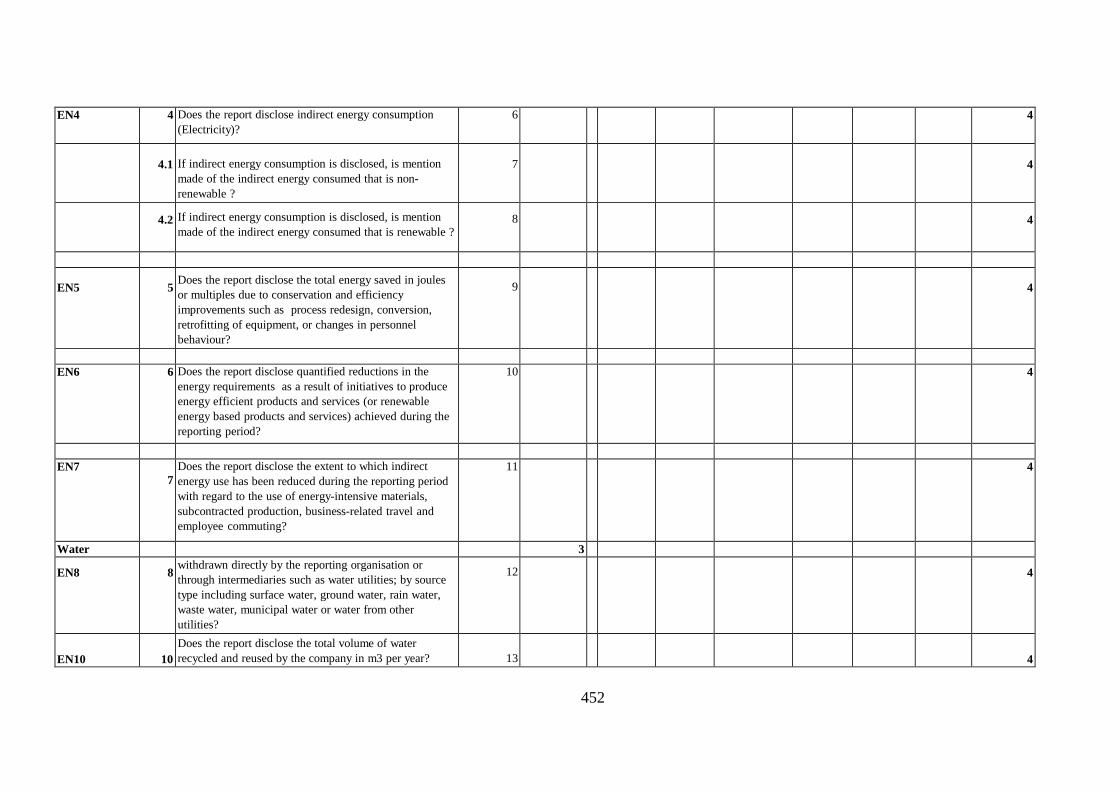
452
EN4 4 Does the report disclose indirect energy consumption (Electricity)?
6 4
4.1
If indirect energy consumption is disclosed, is mention made of the indirect energy consumed that is non- renewable ?
7
4
4.2
If indirect energy consumption is disclosed, is mention made of the indirect energy consumed that is renewable ?
8
4
EN5
5 Does the report disclose the total energy saved in joules
or multiples due to conservation and efficiency improvements such as process redesign, conversion, retrofitting of equipment, or changes in personnel behaviour?
9
4
EN6 6 Does the report disclose quantified reductions in the
energy requirements as a result of initiatives to produce energy efficient products and services (or renewable energy based products and services) achieved during the reporting period?
10 4
EN7
7 Does the report disclose the extent to which indirect energy use has been reduced during the reporting period with regard to the use of energy-intensive materials, subcontracted production, business-related travel and employee commuting?
11 4
Water 3 EN8
8 withdrawn directly by the reporting organisation or
through intermediaries such as water utilities; by source type including surface water, ground water, rain water, waste water, municipal water or water from other utilities?
12 4
EN10
10
Does the report disclose the total volume of water recycled and reused by the company in m3 per year?
13
4
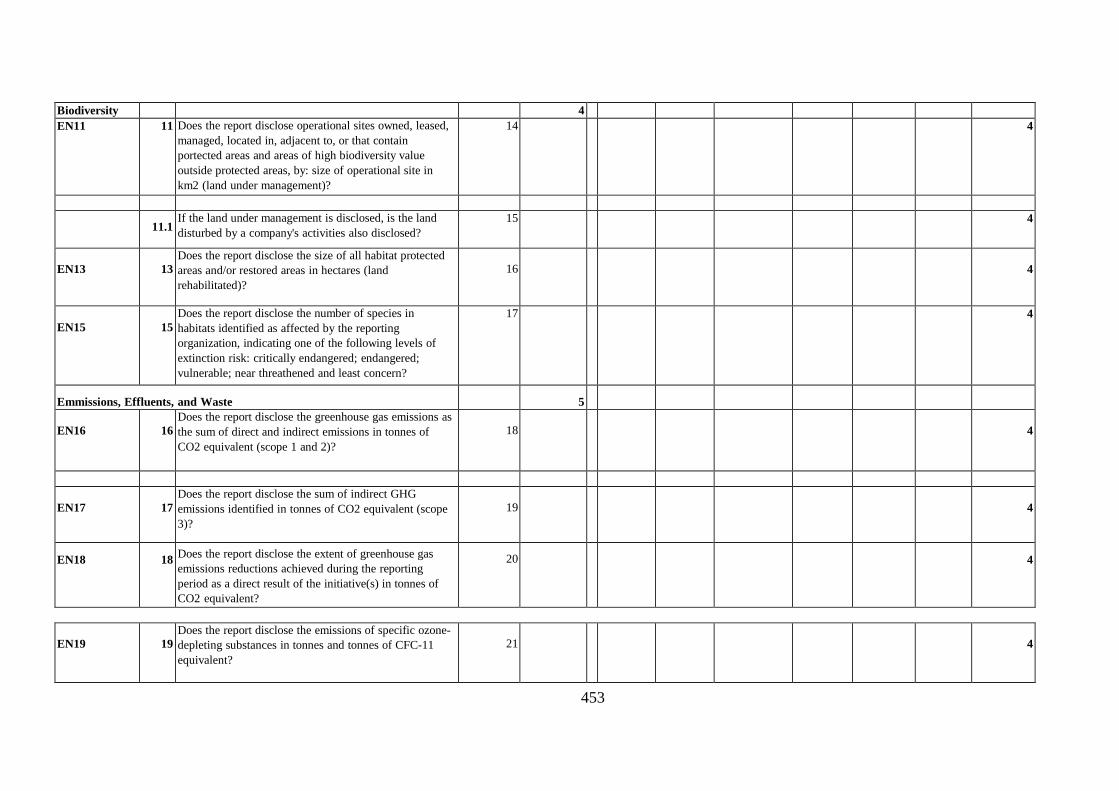
453
Biodiversity 4 EN11 11 Does the report disclose operational sites owned, leased,
managed, located in, adjacent to, or that contain portected areas and areas of high biodiversity value outside protected areas, by: size of operational site in km2 (land under management)?
14 4
11.1 If the land under management is disclosed, is the land disturbed by a company's activities also disclosed?
15 4
EN13
13
Does the report disclose the size of all habitat protected areas and/or restored areas in hectares (land rehabilitated)?
16
4
EN15
15
Does the report disclose the number of species in habitats identified as affected by the reporting organization, indicating one of the following levels of extinction risk: critically endangered; endangered; vulnerable; near threathened and least concern?
17 4
Emmissions, Effluents, and Waste
5 EN16
16
Does the report disclose the greenhouse gas emissions as the sum of direct and indirect emissions in tonnes of CO2 equivalent (scope 1 and 2)?
18
4
EN17
17
Does the report disclose the sum of indirect GHG emissions identified in tonnes of CO2 equivalent (scope 3)?
19
4
EN18
18 Does the report disclose the extent of greenhouse gas
emissions reductions achieved during the reporting period as a direct result of the initiative(s) in tonnes of CO2 equivalent?
20
4
EN19
19
Does the report disclose the emissions of specific ozone- depleting substances in tonnes and tonnes of CFC-11 equivalent?
21
4
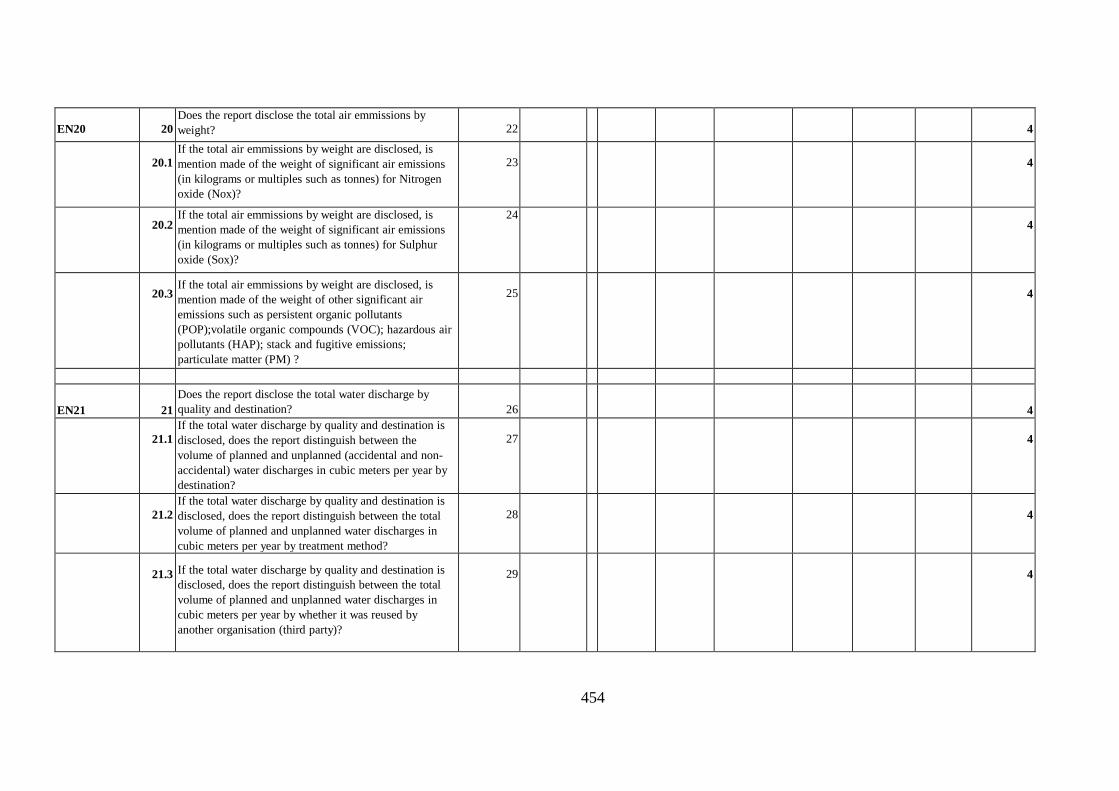
454
EN20
20
Does the report disclose the total air emmissions by weight?
22
4
20.1 If the total air emmissions by weight are disclosed, is mention made of the weight of significant air emissions (in kilograms or multiples such as tonnes) for Nitrogen oxide (Nox)?
23
4
20.2 If the total air emmissions by weight are disclosed, is
mention made of the weight of significant air emissions (in kilograms or multiples such as tonnes) for Sulphur oxide (Sox)?
24 4
20.3 If the total air emmissions by weight are disclosed, is
mention made of the weight of other significant air emissions such as persistent organic pollutants (POP);volatile organic compounds (VOC); hazardous air pollutants (HAP); stack and fugitive emissions; particulate matter (PM) ?
25
4
EN21
21
Does the report disclose the total water discharge by quality and destination?
26
4
21.1
If the total water discharge by quality and destination is disclosed, does the report distinguish between the volume of planned and unplanned (accidental and non- accidental) water discharges in cubic meters per year by destination?
27
4
21.2
If the total water discharge by quality and destination is disclosed, does the report distinguish between the total volume of planned and unplanned water discharges in cubic meters per year by treatment method?
28
4
21.3
If the total water discharge by quality and destination is disclosed, does the report distinguish between the total volume of planned and unplanned water discharges in cubic meters per year by whether it was reused by another organisation (third party)?
29
4
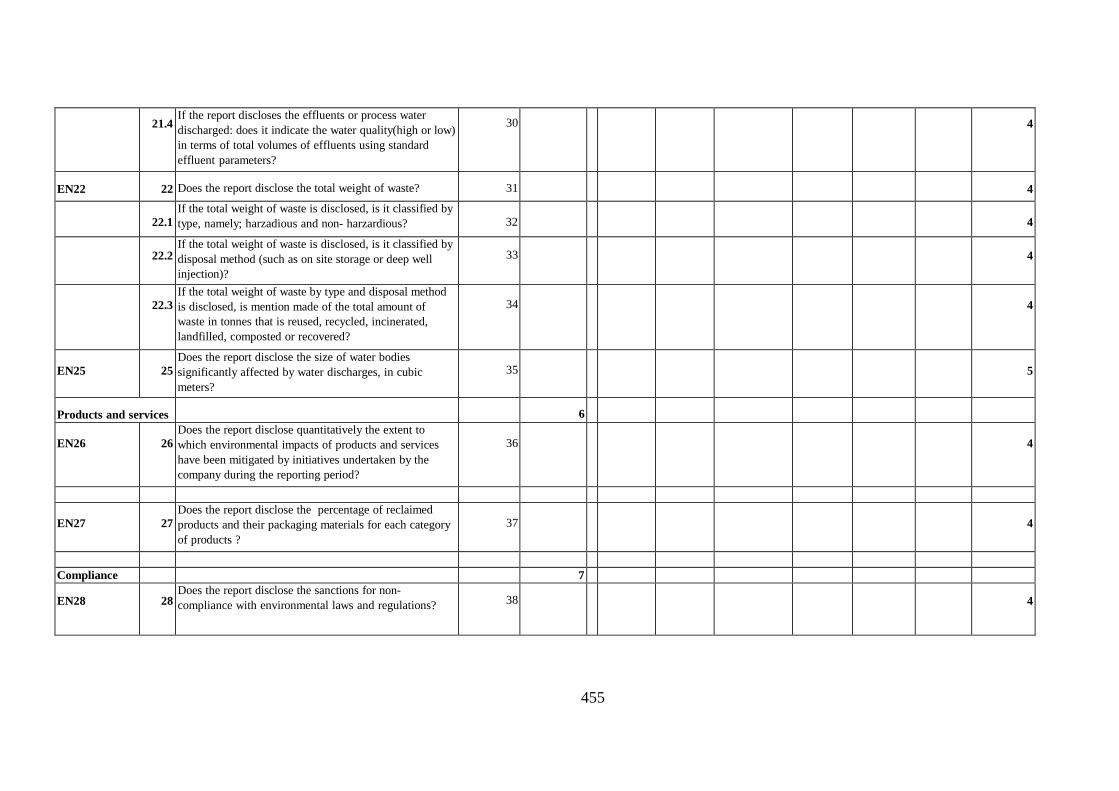
455
21.4 If the report discloses the effluents or process water
discharged: does it indicate the water quality(high or low) in terms of total volumes of effluents using standard effluent parameters?
30 4
EN22
22
Does the report disclose the total weight of waste?
31
4
22.1 If the total weight of waste is disclosed, is it classified by type, namely; harzadious and non- harzardious?
32
4
22.2 If the total weight of waste is disclosed, is it classified by disposal method (such as on site storage or deep well injection)?
33
4
22.3
If the total weight of waste by type and disposal method is disclosed, is mention made of the total amount of waste in tonnes that is reused, recycled, incinerated, landfilled, composted or recovered?
34
4
EN25
25
Does the report disclose the size of water bodies significantly affected by water discharges, in cubic meters?
35
5
Products and services
6 EN26
26
Does the report disclose quantitatively the extent to which environmental impacts of products and services have been mitigated by initiatives undertaken by the company during the reporting period?
36
4
EN27
27
Does the report disclose the percentage of reclaimed products and their packaging materials for each category of products ?
37
4
Compliance 7 EN28
28
Does the report disclose the sanctions for non- compliance with environmental laws and regulations?
38
4
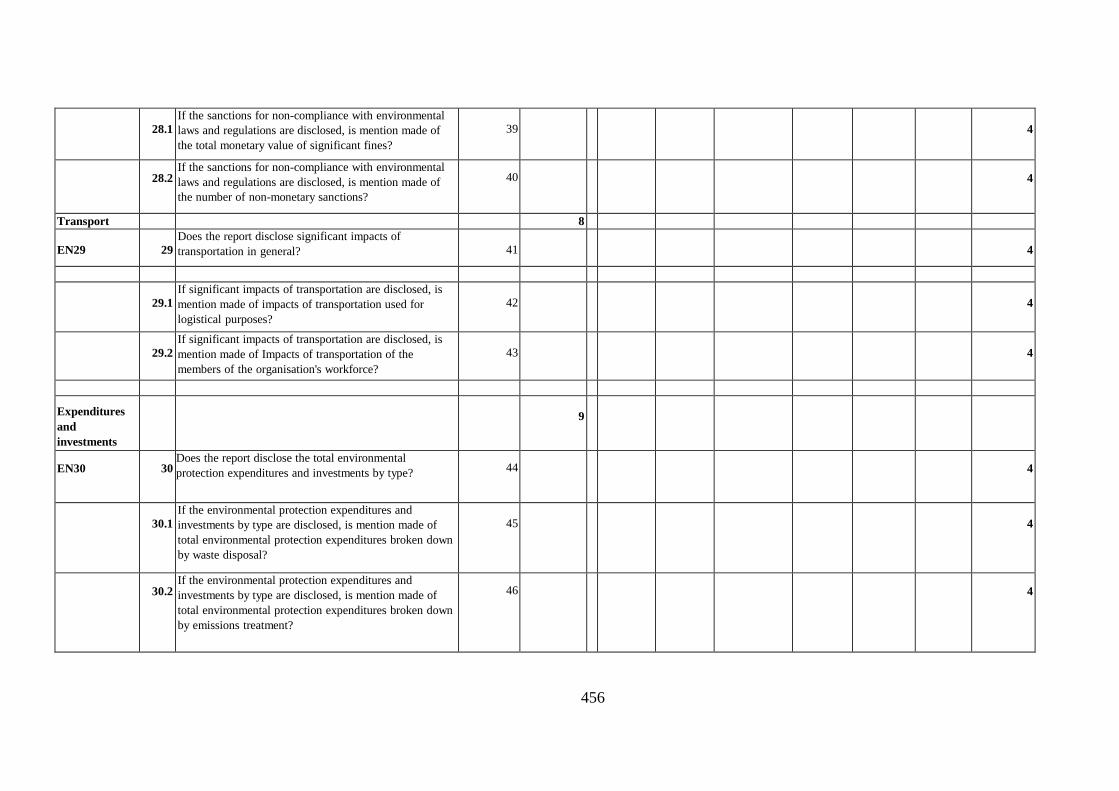
456
28.1
If the sanctions for non-compliance with environmental laws and regulations are disclosed, is mention made of the total monetary value of significant fines?
39
4
28.2
If the sanctions for non-compliance with environmental laws and regulations are disclosed, is mention made of the number of non-monetary sanctions?
40
4
Transport 8 EN29
29
Does the report disclose significant impacts of transportation in general?
41
4
29.1 If significant impacts of transportation are disclosed, is mention made of impacts of transportation used for logistical purposes?
42
4
29.2
If significant impacts of transportation are disclosed, is mention made of Impacts of transportation of the members of the organisation's workforce?
43
4
Expenditures and investments
9
EN30
30
Does the report disclose the total environmental protection expenditures and investments by type?
44
4
30.1
If the environmental protection expenditures and investments by type are disclosed, is mention made of total environmental protection expenditures broken down by waste disposal?
45
4
30.2
If the environmental protection expenditures and investments by type are disclosed, is mention made of total environmental protection expenditures broken down by emissions treatment?
46
4

457
30.3 If the environmental protection expenditures and investments by type are disclosed, is mention made of the total environmental protection expenditures broken down by remeditation costs?
47
4
30.4
If the environmental protection expenditures and investments by type are disclosed, is mention made of the total environmental protection expenditures broken down by prevention costs?
48
4
30.5 If the environmental protection expenditures and
investments by type are disclosed, is mention made of total environmental protection expenditures broken down by environmental management costs?
49 4
On-line reports
10
31 Where a website is used, are reports for multiple years archived?
50
3
TOTALS 50 10 XX 200 PERCENTAGE SCORED %

458
APPENDIX F
INVITATION TO PARTICIPATE IN AN ACADEMIC RESEARCH STUDY 1 July 2013
Dear respondent You are invited to participate in a research study titled “decision-usefulness of corporate environmental reporting in South Africa”. This study is being conducted by Mr Peter Kamala, a doctoral student in financial accounting under the supervision of Professor HC Wingard and Professor CJ Cronjé of the college of accounting sciences, University of South Africa (UNISA). The purpose of this study is to determine whether the stakeholders of South African companies find environmental reports to be useful for making decisions. Because you are a stakeholder of a South African company or are involved in preparation of your company's environmental report, your opinions are very valuable for this study. Your participation in this study is voluntary and you are free to withdraw your participation at any time without obligation. The survey should take only Ten minutes to complete. This survey has been approved by the Research Ethics Committee in the College of Economic and Management Sciences, at UNISA. There are no risks associated with participating in this study. The information from all respondents will at all times be treated as confidential and will not be made available to any entity or third party. Neither your name nor that of your organisation will be linked to any responses as the responses will be captured anonymously. The information obtained from the questionnaires will be used for academic research purposes only. Although you will not receive any compensation for participating, the information collected in this study may benefit the accounting profession by providing a better understanding of the quality of environmental information that is useful for decision-making. By completing and submitting this survey, you are indicating your consent to participate in the study. Your participation is appreciated. Please click on the survey link below and complete the questionnaire no later than 31 August, 2013 http://www......com/Survey/U2L.....YM
If you have any questions or concerns about completing the questionnaire or about participating in this study, please contact Mr Peter Kamala on cell number 0732533605; [email protected] or his supervisor Professor Christa Wingard [email protected]
Thank you for taking time to assist me in my educational endevours. If you would like an electronic copy of the findings of this research please contact me on the email address provided above. Sincerely, Peter Kamala Doctoral Candidate Department of Financial Accounting, College of accounting Sciences, UNISA
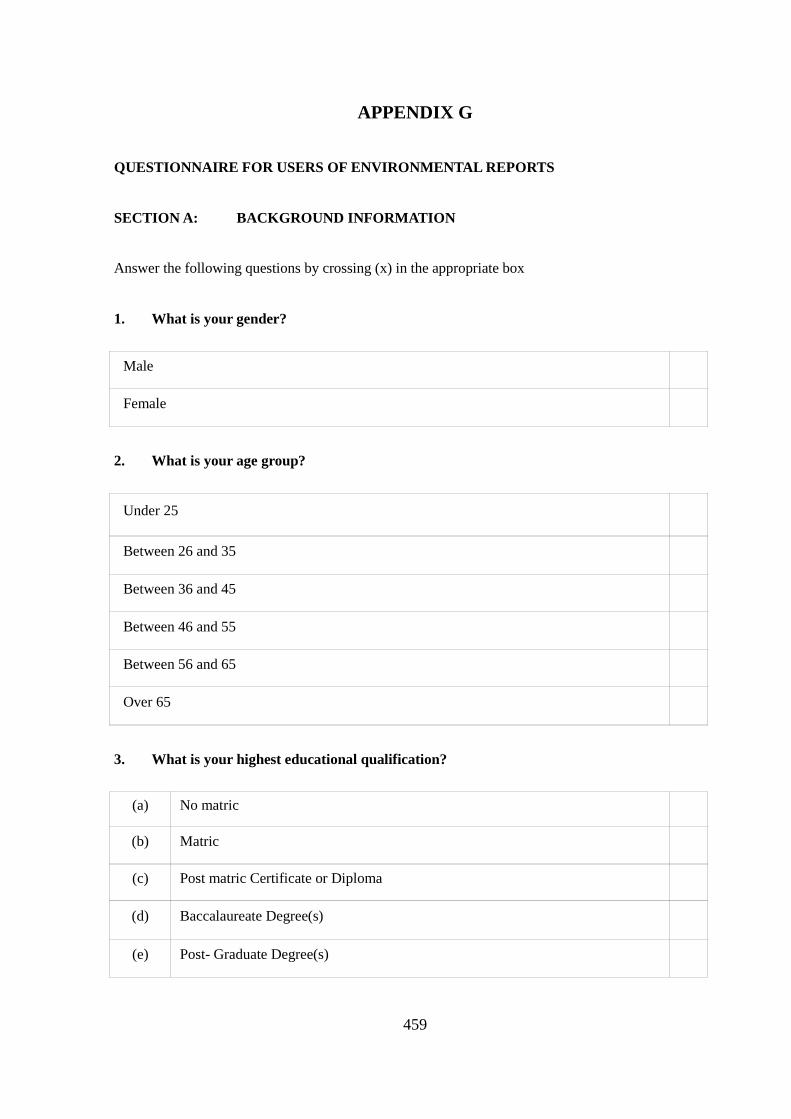
459
APPENDIX G
QUESTIONNAIRE FOR USERS OF ENVIRONMENTAL REPORTS
SECTION A: BACKGROUND INFORMATION
Answer the following questions by crossing (x) in the appropriate box
1. What is your gender?
Male
Female
2. What is your age group?
Under 25
Between 26 and 35
Between 36 and 45
Between 46 and 55
Between 56 and 65
Over 65
3. What is your highest educational qualification?
(a) No matric
(b) Matric
(c) Post matric Certificate or Diploma
(d) Baccalaureate Degree(s)
(e) Post- Graduate Degree(s)

460
4. What is your main occupation?
(a) A representative of an environmental group
(b) An academic/researcher
(c) A representative of an ethical investor
(d) Other (please specify)
SECTION B : USERS' ENVIRONMENTAL INFORMATION NEEDS
This section of the questionnaire aims to determine whether you have read an environmental report in
the past 12 months, as well as your perception on how an environmental report should be.
5. Did you read at least one environmental report in the past 12 months? (Indicate your
response by crossing (x) in the appropriate box).
(a) Yes
(b) No
If you answered no to question 5, please answer question 6 only. If you answered yes to question 5,
please skip question 6 and continue from question 7.
6. Which of the following explains why you did not read any environmental report in the past
12 months?
For question 6 above, rank the options provided according to your perception of their importance in
explaining why you did not read any environmental report in the past 12 months. The most important
reason should be ranked as 1, the second most important reason should be ranked as 2 and so on. The
least important reason should be ranked as 7. Allocate each rank once only.

461
(a) Environmental reports are not relevant
(b) Environmental reports are not reliable
(c) Environmental reports are not understandable
(d) Environmental reports are not timely
(e) Environmental reports are not comparable
(f) Environmental reports are not verifiable
(g) Other (please specify)
7. How important to you are the following statements about environmental reports?
Indicate your response by crossing (x) in the appropriate box [1=Not important at all, 2=Slightly
important, 3=Fairly important, 4=Very important, 5=Extremely important]
Environmental reports should:
Not
impo
rtant
at a
ll
Slig
htly
impo
rtant
Fairl
y im
porta
nt
Very
impo
rtant
Extre
mel
y im
porta
nt
(i) Identify and address key stakeholders and their concerns
and challenges
(ii) Identify and describe key relevant issues (significant
aspects)
(iii) Be readily accessible via multiple media (annual reports
and Internet)
(iv) Provide contacts for feedback and further information

462
Not
impo
rtant
at a
ll
Slig
htly
impo
rtant
Fairl
y im
porta
nt
Very
impo
rtant
Extre
mel
y im
porta
nt
(v) Be interactive
(vi) Include stakeholders' voices
(vii) Provide future oriented information
(viii) Demonstrate top management commitment to
environmental issues
(ix) Be specific and contain accurate information
(x) Include an assurance statement from an independent
third party
(xi) Include organisation structures that deal with
environmental matters
(xii) Disclose both negative and positive aspects in a balanced
manner
(xiii) Adhere to well established international reporting
guidelines
(xiv) Provide quantitative/monetary disclosure of significant
outputs/impacts
(xv) Compare quantitative outputs/impacts against best
practice/industry standards
(xvi) Show trends
(xvii) Provide targets
(xviii) Include interpretation and benchmarks to provide context
(xix) Enhance readability using multiple languages, pictures,
charts, explanations

463
Not
impo
rtant
at a
ll
Slig
htly
impo
rtant
Fairl
y im
porta
nt
Very
impo
rtant
Extre
mel
y im
porta
nt
(xx) Enhance accessibility of information using navigation
tools
(xxi) Allow for quick reading using an executive summary and
key indicators
(xxii) Describe the management system
(xxiii) Demonstrate the integration of environmental issues into
business processes
(xxiv) Indicate whether the environmental management systems
have been certified
(xxv) Indicate whether internal auditing is extended to
environmental systems
(xxvi) Be produced annually
(xxvii) Be produced quarterly or bi-annually
(xxviii) Be produced on a real time basis
SECTION C: EXTENT TO WHICH ENVIRONMENTAL REPORTS ARE READ AND
HOW THEY ARE USED
This section of the questionnaire aims to determine the extent to which you read environmental reports
and whether you use the reports to make decisions.
8. How often do you employ the following reading techniques when reading an
environmental report?
Indicate your response by crossing (x) in the appropriate box [1=never, 2=rarely, 3=sometimes,
4=often, 5=almost always]

464
Nev
er
Rar
ely
Som
etim
es
Ofte
n
Alm
ost A
lway
s
(a) Scanning (to locate specific pieces of information)
(b) Skimming (rapid reading of headings, topic sentence to
get the main idea)
(c) Exploratory reading (to get a fairly accurate picture of the
entire report)
(d) Study reading (to get a maximum understanding of the
main ideas )
(e) Critical reading (questioning, analysing and evaluating the
text)
9. How often do you read environmental reports in the following media?
Indicate your response by crossing (x) in the appropriate box [1=never, 2=rarely, 3=sometimes,
4=often, 5=almost always]
Nev
er
Rar
ely
Som
etim
es
Ofte
n
Alm
ost A
lway
s
(a) Printed annual reports (Integrated Annual reports)
(b) Printed separate sustainability report
(c) Companies' websites HTML format of annual reports
(Integrated annual reports)
(d) Companies' websites HTML format of sustainability
reports
(e) Companies' websites PDF format of annual reports
(Integrated annual reports)

465
Nev
er
Rar
ely
Som
etim
es
Ofte
n
Alm
ost A
lway
s
(f) Companies' websites PDF format of sustainability reports
10. To what extent do you agree with each of the following statements about how you use
environmental reports?
Indicate your response by crossing (x) in the appropriate box [1=Strongly disagree, 2=Disagree,
3=Neutral, 4=Agree, 5=Strongly Agree]
I use environmental reports:
Stro
ngly
dis
agre
e
Dis
agre
e
Neu
tral
Agr
ee
Stro
ngly
agr
ee
(a) For education or research
(b) To hold a company accountable
(c) To decide whether to buy a company's products or not
(d) To decide whether to invest or disinvest from a company
(e) To decide whether to support or launch action against a
company
(f) To decide whether to partner with a company
(g) For my own knowledge

466
11. How useful are the environmental reports for the purpose for which you used the
environmental report? Answer by crossing (x) in the appropriate box
Not useful at all Not very useful Neutral Useful Very useful
SECTION D: LEVEL OF SATISFACTION WITH THE REPORTS
This section of the questionnaire aims to determine your level of satisfaction with the quality of the
environmental reports that you read in the past 12 months.
12. To what extent do you agree with each of the following statements about the general
quality of the environmental reports that you read in the past 12 months?
Indicate your response by crossing (x) in the appropriate box [1=Strongly disagree, 2=Disagree,
3=Neutral, 4=Agree, 5=Strongly Agree]
I found the environmental reports to be:
Stro
ngly
Dis
agre
e
Dis
agre
e
Neu
tral
Agr
ee
Stro
ngly
Agr
ee
(a) Relevant
(b) Reliable
(c) Comparable
(d) Understandable
(e) Timely
(f) Verifiable

467
13. In general, how satisfied are you with the following quality attributes of the environmental
reports that you read in the past 12 months?
Indicate your response by crossing (x) in the appropriate space [1=Not satisfied at all, 2=Slightly
satisfied, 3=Moderately satisfied, 4=Very satisfied, 5=Extremely satisfied]
Not
satis
fied
at a
ll
Slig
htly
satis
fied
Mod
erat
ely
satis
fied
Very
satis
fied
Extre
mel
y sa
tisfie
d
(a) Relevance
(b) Reliability
(c) Comparability
(d) Understandability
(e) Timeliness
(f) Verifiability
14. Can you suggest how the quality (decision-usefulness) of the environmental reports that
you read in the past 12 months should be improved?
_____________________________________________________________________________
_____________________________________________________________________________
__________________________________________________________________________

468
SECTION E: RELATIVE IMPORTANCE OF THE ENVIRONMENTAL REPORTS
This section of the questionnaire aims to determine how you rank environmental information relative
to other types of information such as financial and social responsibility information.
15. How important are the following types of information to you?
Indicate your response by crossing (x) in the appropriate box [1=Not at all important, 2=Slightly
important, 3=Fairly important, 4=Very important, 5=Extremely important]
Not
impo
rtant
at a
ll
Slig
htly
impo
rtant
Fairl
y im
porta
nt
Very
impo
rtant
Extre
mel
y im
porta
nt
(a) Comprehensive statement of financial position (Balance
sheet)
(b) Comprehensive statement of income and expenditure
(Income statement)
3(c) Statement of cash flows
(d) Statement of changes in equity
(e) Environmental report
(f) Corporate governance report
(g) Employee report
(h) Community engagement report

469
APPENDIX H
QUESTIONNAIRE FOR PREPARERS OF ENVIRONMENTAL/SUSTAINABILITY
REPORTS
SECTION A: BACKGROUND INFORMATION
The aim of this section is to provide some background information about yourself that is useful for the
analysis of the results of this survey. Note that the information provided will be used for this study
only.
Answer the following questions by crossing (x) the relevant box
1. What is your gender?
Male
Female
2. What is your age group?
Under 25
Between 26 and 35
Between 36 and 45
Between 46 and 55
Between 56 and 65
Over 65
3. What is your highest educational qualification?
(a) No matric
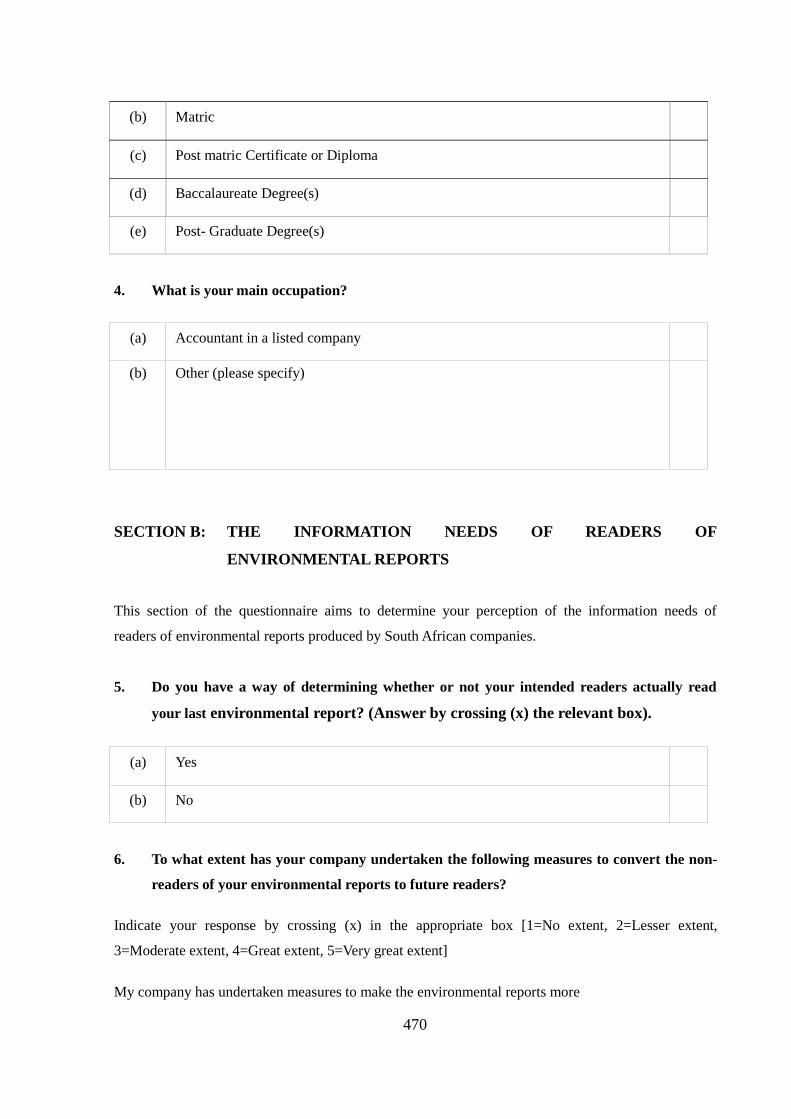
470
(b) Matric
(c) Post matric Certificate or Diploma
(d) Baccalaureate Degree(s)
(e) Post- Graduate Degree(s)
4. What is your main occupation?
(a) Accountant in a listed company
(b) Other (please specify)
SECTION B: THE INFORMATION NEEDS OF READERS OF
ENVIRONMENTAL REPORTS
This section of the questionnaire aims to determine your perception of the information needs of
readers of environmental reports produced by South African companies.
5. Do you have a way of determining whether or not your intended readers actually read
your last environmental report? (Answer by crossing (x) the relevant box).
(a) Yes
(b) No
6. To what extent has your company undertaken the following measures to convert the non-
readers of your environmental reports to future readers?
Indicate your response by crossing (x) in the appropriate box [1=No extent, 2=Lesser extent,
3=Moderate extent, 4=Great extent, 5=Very great extent]
My company has undertaken measures to make the environmental reports more

471
No
exte
nt
Less
er
exte
nt
Mod
erat
e ex
tent
G
reat
ex
tent
Ve
ry g
reat
ex
tent
(a) Relevant 1 2 3 4 5
(b) Reliable 1 2 3 4 5
(c) Comparable 1 2 3 4 5
(d) Understandable 1 2 3 4 5
(e) Timely 1 2 3 4 5
(f) Verifiable 1 2 3 4 5
7. How important to you are the following statements about what your company's
environmental reports should do or should be?
Indicate your response by crossing (x) in the appropriate box [1=Not important at all, 2=Slightly
important, 3=Fairly important, 4=Very important, 5=Extremely important].
My company's environmental reports should:
Not
im
porta
nt
at a
ll Sl
ight
ly
impo
rtant
Fa
irly
impo
rtant
Ve
ry
impo
rtant
Ex
trem
ely
impo
rtant
(i) Identify and address key stakeholders and their
concerns and challenges 1 2 3 4 5
(ii) Identify and describe key relevant issues (significant
aspects) 1 2 3 4 5
(iii) Be readily accessible via multiple media (annual
reports and Internet) 1 2 3 4 5
(iv) Provide contacts for feedback and further information 1 2 3 4 5
(v) Be interactive 1 2 3 4 5

472
Not
im
porta
nt
at a
ll Sl
ight
ly
impo
rtant
Fa
irly
impo
rtant
Ve
ry
impo
rtant
Ex
trem
ely
impo
rtant
(vi) Include stakeholders' voices 1 2 3 4 5
(vii) Provide future oriented information 1 2 3 4 5
(viii) Demonstrate top management commitment to
environmental issues 1 2 3 4 5
(ix) Be specific and contain accurate information 1 2 3 4 5
(x) Include an assurance statement from an independent
third party 1 2 3 4 5
(xi) Include organisation structures that deal with
environmental matters 1 2 3 4 5
(xii) Disclose both negative and positive aspects in a
balanced manner 1 2 3 4 5
(xiii) Adhere to well established international reporting
guidelines 1 2 3 4 5
(xiv) Provide quantitative/monetary disclosure of
significant outputs/impacts 1 2 3 4 5
(xv) Compare quantitative outputs/impacts against best
practice/industry standards 1 2 3 4 5
(xvi) Show trends 1 2 3 4 5
(xvii) Provide targets 1 2 3 4 5
(xviii) Include interpretation and benchmarks to provide
context 1 2 3 4 5
(xix) Enhance readability using multiple languages, pictures,
charts, explanations 1 2 3 4 5
(xx) Enhance accessibility of information using navigation 1 2 3 4 5

473
Not
im
porta
nt
at a
ll Sl
ight
ly
impo
rtant
Fa
irly
impo
rtant
Ve
ry
impo
rtant
Ex
trem
ely
impo
rtant
tools
(xxi) Allow for quick reading using an executive summary and
key indicators 1 2 3 4 5
(xxii) Describe the management system 1 2 3 4 5
(xxiii) Demonstrate the integration of environmental issues into
business processes 1 2 3 4 5
(xxiv) Indicate whether the environmental management systems
have been certified 1 2 3 4 5
(xxv) Indicate whether internal auditing is extended to
environmental systems 1 2 3 4 5
(xxvi) Be produced annually 1 2 3 4 5
(xxvii) Be produced quarterly or bi-annually 1 2 3 4 5
(xxviii) Be produced on a real time basis 1 2 3 4 5
SECTION C: EXTENT OF TO WHICH ENVIRONMENTAL REPORTS ARE
READ AND HOW THEY ARE USED
This section of the questionnaire aims to determine your perception of the extent to which your
company's environmental reports are read and whether they are used to make decisions.
8. In your opinion, how often do the readers of your environmental reports employ
the following reading techniques when reading your company's environmental
reports?
Indicate your response by crossing (x) in the appropriate box [1=never, 2=rarely, 3=sometimes,
4=often, 5=almost always]
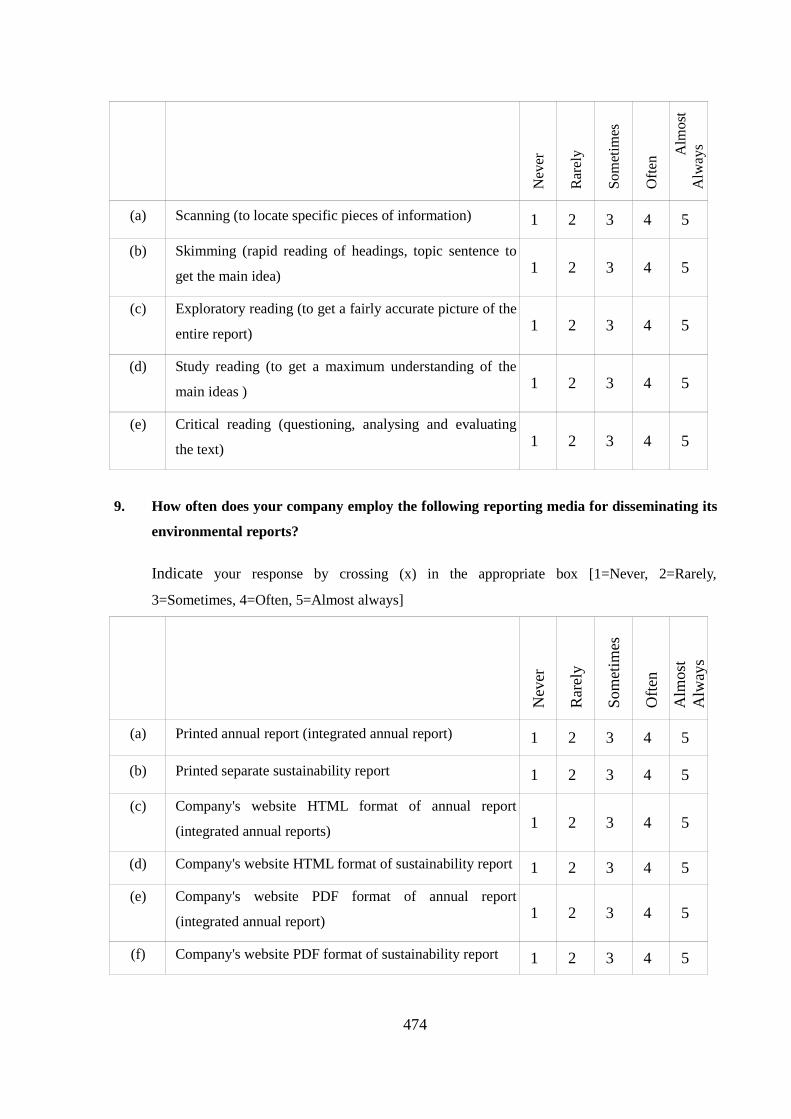
474
Nev
er
Rar
ely
Som
etim
es
Ofte
n
A
lmos
t A
lway
s
(a) Scanning (to locate specific pieces of information) 1 2 3 4 5
(b) Skimming (rapid reading of headings, topic sentence to
get the main idea) 1 2 3 4 5
(c) Exploratory reading (to get a fairly accurate picture of the
entire report) 1 2 3 4 5
(d) Study reading (to get a maximum understanding of the
main ideas ) 1 2 3 4 5
(e) Critical reading (questioning, analysing and evaluating
the text) 1 2 3 4 5
9. How often does your company employ the following reporting media for disseminating its
environmental reports?
Indicate your response by crossing (x) in the appropriate box [1=Never, 2=Rarely,
3=Sometimes, 4=Often, 5=Almost always]
Nev
er
Rar
ely
Som
etim
es
Ofte
n
Alm
ost
Alw
ays
(a) Printed annual report (integrated annual report) 1 2 3 4 5
(b) Printed separate sustainability report 1 2 3 4 5
(c) Company's website HTML format of annual report
(integrated annual reports) 1 2 3 4 5
(d) Company's website HTML format of sustainability report 1 2 3 4 5
(e) Company's website PDF format of annual report
(integrated annual report) 1 2 3 4 5
(f) Company's website PDF format of sustainability report 1 2 3 4 5
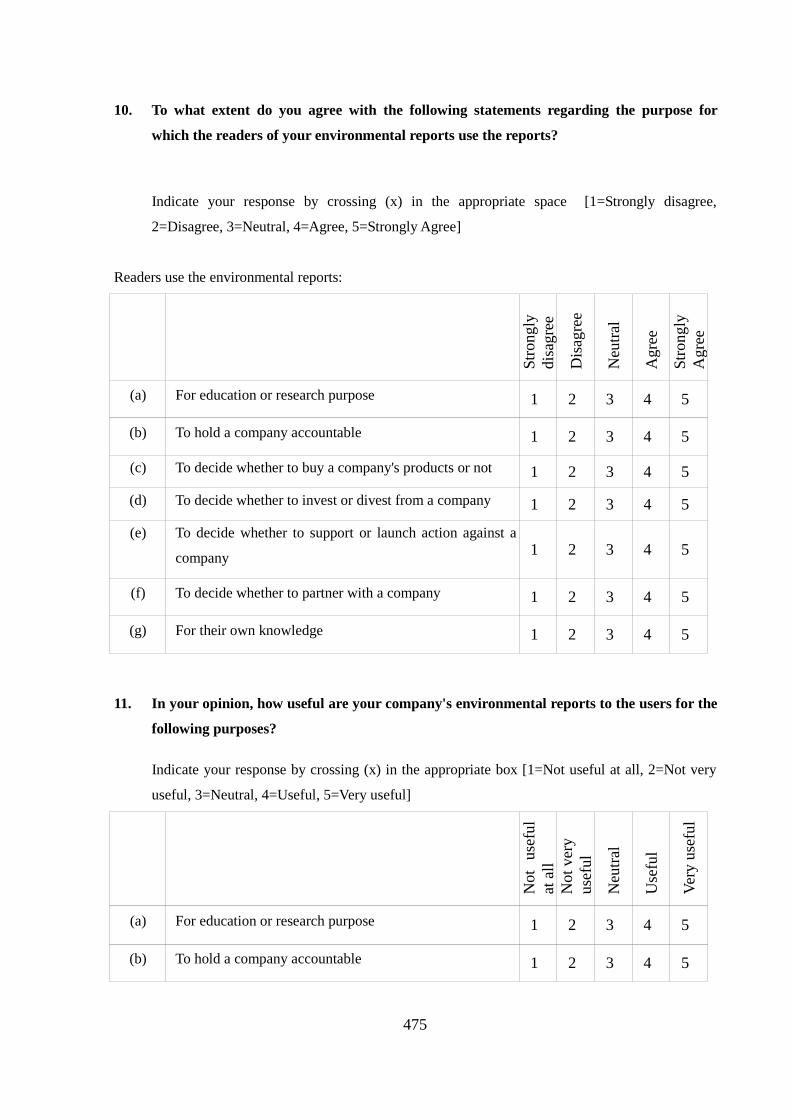
475
10. To what extent do you agree with the following statements regarding the purpose for
which the readers of your environmental reports use the reports?
Indicate your response by crossing (x) in the appropriate space [1=Strongly disagree,
2=Disagree, 3=Neutral, 4=Agree, 5=Strongly Agree]
Readers use the environmental reports:
Stro
ngly
di
sagr
ee
Dis
agre
e
Neu
tral
Agr
ee
Stro
ngly
A
gree
(a) For education or research purpose 1 2 3 4 5
(b) To hold a company accountable 1 2 3 4 5
(c) To decide whether to buy a company's products or not 1 2 3 4 5
(d) To decide whether to invest or divest from a company 1 2 3 4 5
(e) To decide whether to support or launch action against a
company 1 2 3 4 5
(f) To decide whether to partner with a company 1 2 3 4 5
(g) For their own knowledge 1 2 3 4 5
11. In your opinion, how useful are your company's environmental reports to the users for the
following purposes?
Indicate your response by crossing (x) in the appropriate box [1=Not useful at all, 2=Not very
useful, 3=Neutral, 4=Useful, 5=Very useful]
Not
use
ful
at a
ll N
ot v
ery
usef
ul
Neu
tral
Use
ful
Very
use
ful
(a) For education or research purpose 1 2 3 4 5
(b) To hold a company accountable 1 2 3 4 5
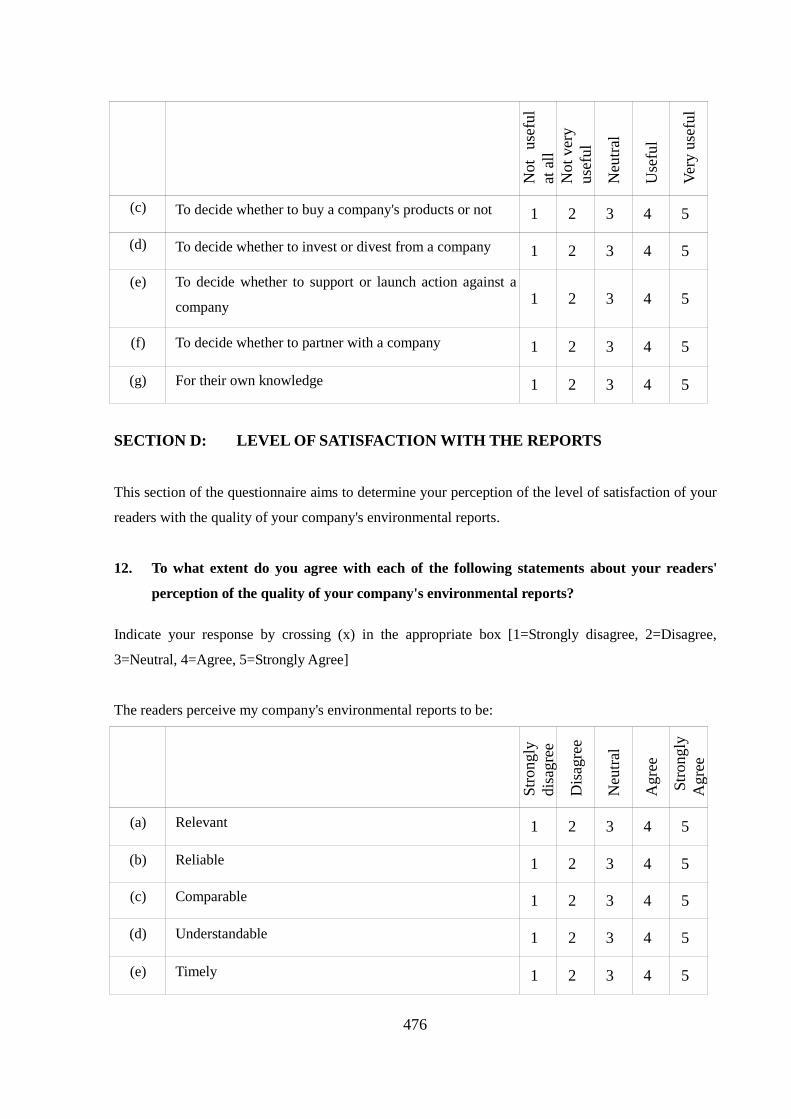
476
Not
use
ful
at a
ll N
ot v
ery
usef
ul
Neu
tral
Use
ful
Very
use
ful
(c) To decide whether to buy a company's products or not 1 2 3 4 5
(d) To decide whether to invest or divest from a company 1 2 3 4 5
(e) To decide whether to support or launch action against a
company 1 2 3 4 5
(f) To decide whether to partner with a company 1 2 3 4 5
(g) For their own knowledge 1 2 3 4 5
SECTION D: LEVEL OF SATISFACTION WITH THE REPORTS
This section of the questionnaire aims to determine your perception of the level of satisfaction of your
readers with the quality of your company's environmental reports.
12. To what extent do you agree with each of the following statements about your readers'
perception of the quality of your company's environmental reports?
Indicate your response by crossing (x) in the appropriate box [1=Strongly disagree, 2=Disagree,
3=Neutral, 4=Agree, 5=Strongly Agree]
The readers perceive my company's environmental reports to be:
Stro
ngly
di
sagr
ee
Dis
agre
e
Neu
tral
Agr
ee
Stro
ngly
A
gree
(a) Relevant 1 2 3 4 5
(b) Reliable 1 2 3 4 5
(c) Comparable 1 2 3 4 5
(d) Understandable 1 2 3 4 5
(e) Timely 1 2 3 4 5

477
Stro
ngly
di
sagr
ee
Dis
agre
e
Neu
tral
Agr
ee
Stro
ngly
A
gree
(f) Verifiable 1 2 3 4 5
13. In your opinion, how satisfied were your readers with the following quality attributes of
the last environmental report that your company published?
Indicate your response by crossing (x) in the appropriate box [1=Not satisfied at all, 2=Slightly
satisfied, 3=Moderately satisfied, 4=Very satisfied, 5=Extremely satisfied]
Not
satis
fied
at a
ll Sl
ight
ly
satis
fied
Mod
erat
ely
satis
fied
Very
satis
fied
Extre
mel
y sa
tisfie
d
(a) Relevance 1 2 3 4 5
(b) Reliability 1 2 3 4 5
(c) Comparability 1 2 3 4 5
(d) Understandability 1 2 3 4 5
(e) Timeliness 1 2 3 4 5
(f) Verifiability 1 2 3 4 5
14. Can you suggest how the quality (decision-usefulness) of the last environmental report that
your company published should be improved?
______________________________________________________________________
______________________________________________________________________
______________________________________________________________________
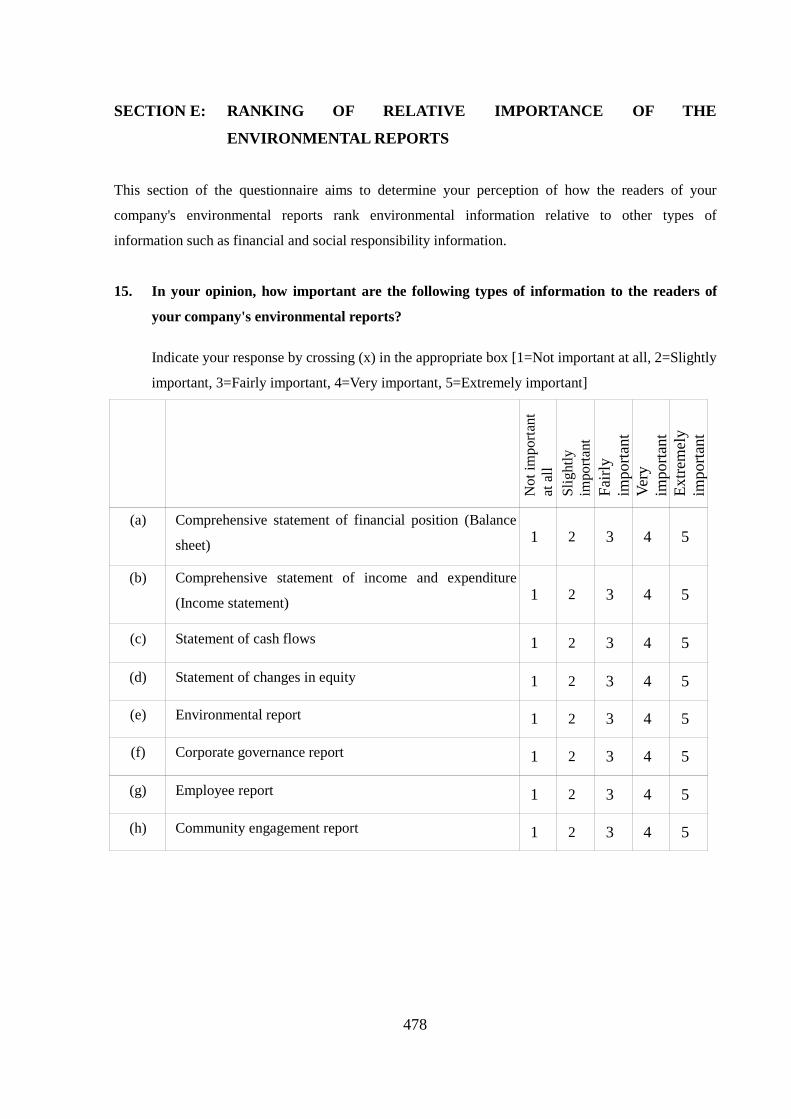
478
SECTION E: RANKING OF RELATIVE IMPORTANCE OF THE
ENVIRONMENTAL REPORTS
This section of the questionnaire aims to determine your perception of how the readers of your
company's environmental reports rank environmental information relative to other types of
information such as financial and social responsibility information.
15. In your opinion, how important are the following types of information to the readers of
your company's environmental reports?
Indicate your response by crossing (x) in the appropriate box [1=Not important at all, 2=Slightly
important, 3=Fairly important, 4=Very important, 5=Extremely important]
Not
impo
rtant
at
all
Sl
ight
ly
impo
rtant
Fa
irly
impo
rtant
Ve
ry
impo
rtant
Ex
trem
ely
impo
rtant
(a) Comprehensive statement of financial position (Balance
sheet) 1 2 3 4 5
(b) Comprehensive statement of income and expenditure
(Income statement) 1 2 3 4 5
(c) Statement of cash flows 1 2 3 4 5
(d) Statement of changes in equity 1 2 3 4 5
(e) Environmental report 1 2 3 4 5
(f) Corporate governance report 1 2 3 4 5
(g) Employee report 1 2 3 4 5
(h) Community engagement report 1 2 3 4 5

479
APPENDIX I
JSE TOP 100 COMPANIES BY MARKET CAPITALISATION: 2013/01/01
Number Full Name Market Capitalisation
1 British American Tobacco public limited company 1105430301727
2 Sabmiller public limited company 834888296500 3 BHP Billiton public limited company 612657988207 4 Compagnie Fin Richemont SA 451530000000 5 MTN group limited 333100660218 6 Anglo American public limited company 325814304231 7 Naspers limited 301266687775 8 Sasol limited 284569710064 9 Standard Bank group limited 177162743809
10 Vodacom group limited 166055666400 11 Kumba Iron Ore limited 159274735002 12 Firstrand limited 159271852714 13 Old Mutual public limited company 148375037680 14 Absa group limited 103350425187 15 Sanlam limited 98847000000 16 Shoprite holdings limited 97283797930 17 Remgro limited 91410210300 18 Aspen Pharmacare holdings limited 91146857000 19 Nedbank group limited 89285765975
20 Anglo American Platinum corporation limited 84612691732
21 The Bidvest group limited 83801821345 22 Anglogold Ashanti limited 69682689788 23 Impala Platinum holdings limited 63929507589 24 Woolworths holdings limited 60448769014 25 Mediclinic International 57159290304 26 Tiger Brands limited 56596366794 27 Exxaro Resources limited 54677460792 28 RMB holdings limited 53136509125 29 Nbkioexxstub10 49402800000 30 Intuprop 49143190965 31 Discovery holdings limited 47882476351 32 Mondi public limited company pre 47487908494 33 Nbnpnr268.50cii 46674000000 34 Growthpoint Properties limited 45681133621 35 Assore limited 45521654490 36 Steinhoff International holdings limited 44857247008 37 Gold Fields limited 44839800094 38 Imperial holdings limited 42626186910

480
39 Investec public limited company 41962072791 40 Massmart holdings limited 41456678794 41 Truworths International limited 39345587525 42 Reinet Investments SCA 38600433342
43 Capital & Counties property public limited company 37068950463
44 African Rainbow Minerals 36930567477 45 Life Healthcare group holdings limited 36529451737 46 MMI holdings limited 36482237988 47 Npnnih 35638000000 48 Rand Merch Insurance holdings limited 35582235886 49 Liberty holdings limited 35202891879 50 Netcare limited 33674745199 51 Mr Price group limited 32478074003 52 Sabnii 31218000000 53 Tsogo Sun holdings limited 29569149700 54 Nb sab r234.57cij 28525000000 55 Redefine Properties limited 28475109209 56 Kionif 26644000000 57 Nb kior245.75cih1 26038000000 58 Nbsolr194.00cij 25978000000 59 Uranium One Incorporated 24950843808 60 Distell 24934536617 61 Lonmin public limited company 24282954665 62 Nampak 23923692625 63 The Foschini group limited 23535318823 64 Kiostf 21518000000 65 Coronation Fund Managers limited 21267785401 66 Santam limited 21255596867 67 Capitec bank holdings limited 20918651638 68 New gold issuer limited 20538261289 69 Solnii 20287000000 70 The spar group limited 20043094220 71 Barloworld limited 19759584973 72 Investec limited 19574741480 73 AVI limited 19185706204 74 Pick n Pay Stores limited 18990106099 75 Pretoria Portland Cement company limited 18797038070 76 Pioneer Foods group limited 18516073867 77 Brait S.A. 18364404492 78 Btista 18304000000 79 Harmony Gold Mining Company limited 18080604484 80 Hyprop Investments limited 17236723682 81 Kionnb 17078000000 82 Nb solr281.32cnf 16704000000 83 Nbbilr132.14cij1 16643000000 84 Nb tbs r133.5cii 1 16619000000 85 Capital Property Fund limited 16310910731

481
86 Illovo Sugar limited 16051198351 87 Clicks group limited 16045745180 88 Hosken Consolidated Investments limited 15964625351 89 Tbsnih 15917000000 90 Nbbvtr103.85cii1 15531000000 91 Mondi limited 15321530262 92 Resilient Property Income Fund limited 14905728723 93 Bilnii 14806000000 94 A E C I limited 14247590654 95 Reunert limited 13873414965 96 Tongaat Hulett limited 13462536507 97 Northam Platinum limited 13176264939 98 Bvtnih 13058000000 99 Solnne 13020000000
100 Arcelormittal SA limited 13015962254
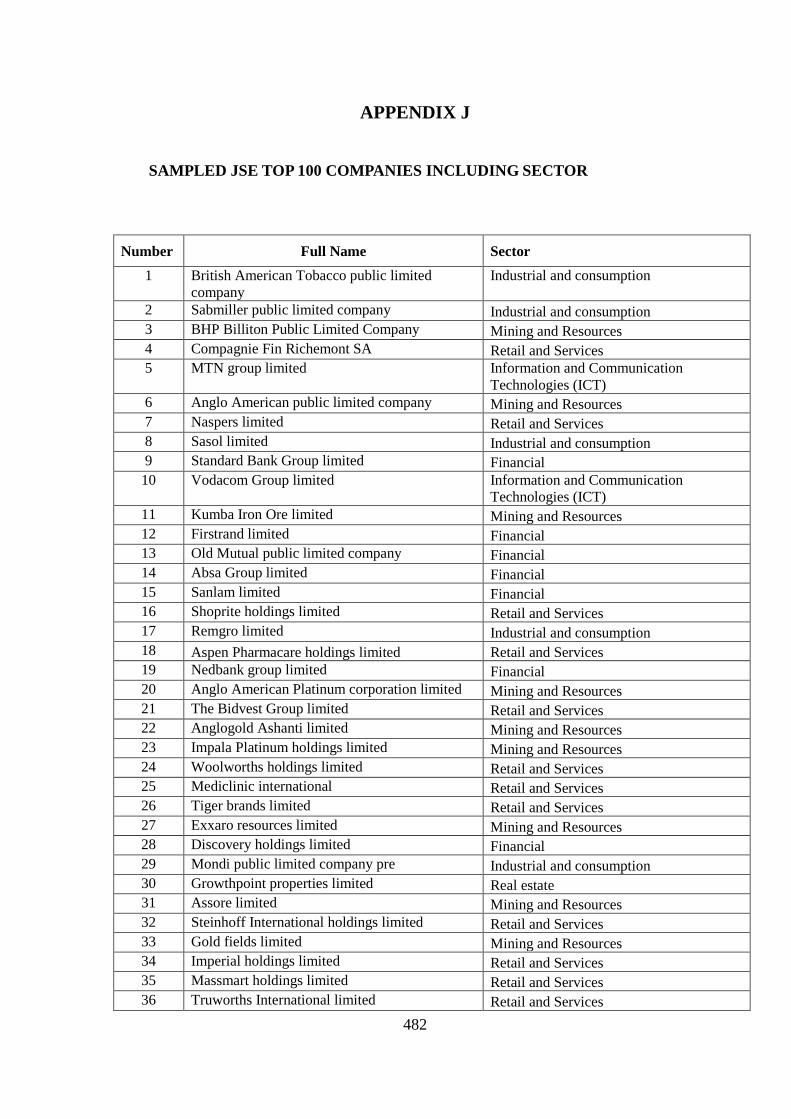
482
APPENDIX J
SAMPLED JSE TOP 100 COMPANIES INCLUDING SECTOR
Number Full Name Sector 1 British American Tobacco public limited
company Industrial and consumption
2 Sabmiller public limited company Industrial and consumption 3 BHP Billiton Public Limited Company Mining and Resources 4 Compagnie Fin Richemont SA Retail and Services 5 MTN group limited Information and Communication
Technologies (ICT) 6 Anglo American public limited company Mining and Resources 7 Naspers limited Retail and Services 8 Sasol limited Industrial and consumption 9 Standard Bank Group limited Financial
10 Vodacom Group limited Information and Communication Technologies (ICT)
11 Kumba Iron Ore limited Mining and Resources 12 Firstrand limited Financial 13 Old Mutual public limited company Financial 14 Absa Group limited Financial 15 Sanlam limited Financial 16 Shoprite holdings limited Retail and Services 17 Remgro limited Industrial and consumption 18 Aspen Pharmacare holdings limited Retail and Services 19 Nedbank group limited Financial 20 Anglo American Platinum corporation limited Mining and Resources 21 The Bidvest Group limited Retail and Services 22 Anglogold Ashanti limited Mining and Resources 23 Impala Platinum holdings limited Mining and Resources 24 Woolworths holdings limited Retail and Services 25 Mediclinic international Retail and Services 26 Tiger brands limited Retail and Services 27 Exxaro resources limited Mining and Resources 28 Discovery holdings limited Financial 29 Mondi public limited company pre Industrial and consumption 30 Growthpoint properties limited Real estate 31 Assore limited Mining and Resources 32 Steinhoff International holdings limited Retail and Services 33 Gold fields limited Mining and Resources 34 Imperial holdings limited Retail and Services 35 Massmart holdings limited Retail and Services 36 Truworths International limited Retail and Services

483
37 African Rainbow Minerals Mining and Resources 38 Life Healthcare group holdings limited Retail and Services 39 MMI holdings limited Retail and Services 40 Netcare limited Retail and Services 41 Mr Price group limited Retail and Services 42 Tsogo Sun holdings limited Retail and Services 43 Redefine Properties limited Real estate 44 Distell group limited Industrial and consumption 45 Lonmin public limited company Mining and Resources 46 Nampak limited Industrial and consumption 47 The Foschini group limited Retail and Services 48 Capitec bank holdings limited Financial 49 The Spar group limited Retail and Services 50 Barloworld limited Industrial and consumption 51 Investec limited Financial 52 AVI limited Retail and Services 53 Pick n Pay Stores limited Retail and Services 54 Pretoria Portland Cement company limited Industrial and consumption 55 Pioneer Foods group limited Retail and Services 56 Harmony Gold Mining company limited Mining and Resources 57 Hyprop Investments limited Real estate 58 Capital Property Fund Real estate 59 Illovo Sugar limited Retail and Services 60 Clicks group limited Retail and Services 61 Resilient Property Income Fund Real estate 62 A E C I limited Industrial and consumption 63 Reunert limited Industrial and consumption 64 Tongaat Hulett limited Retail and Services 65 Northam Platinum limited Mining and Resources 66 Arcelormittal SA limited Industrial and consumption

484
APPENDIX K
DECISION RULES FOR ENVIRONMENTAL DISCLOSURE QUALITY • All disclosures must be explicitly stated, they cannot be implied meanings.
• All disclosures that fit within the categories or respond to an interrogation question
must be included regardless of whether they are self-praising.
• All disclosures that fit within the categories or respond to an interrogation question
must be included regardless of their format, including financial statements, narratives,
pictures, photographs, charts and graphical representations.
• Disclosures having more than one possible classification or containing two or more
information items are classified under the category that yields the highest points.
• Repeated disclosures are not recorded, disclosures containing the same information
item are only considered once.
• A disclosure item containing a combination of different types of information such as
monetary quantitative, non-monetary quantitative and declarative information is
classified as comprising the type of disclosure with the highest points.
• A disclosure item containing a combination of general and specific information will be
recorded as having specific information.
• A disclosure item containing a combination of historical and futuristic information will
be recorded as having futuristic information.
• A disclosure item is classified as comprising verifiable information if at least one of
three situations exists: 1) the disclosure is found in one of the externally audited
sections of the annual report; 2) an independent auditor' report explicitly states that the
environmental report is wholly audited; 3) an independent auditor' report explicitly
identifies the item as audited. Otherwise the disclosure is considered non-verifiable.

485
APPENDIX L
UNlSA
university of south africa
Ref#: 2013/CEMS/SAS/0006
RESEARCH ETHICS REVIEW COMMITTEE:
SCHOOL OF ACCOUNTING SCIENCES
Mr. PN Kamala (student number 46408843)
Supervisor: HC Wingard (staff number 1100017)
This is to certify that the application for ethics clearance submitted by
PN Kamala (46408843)
for the study
The decision-usefulness of corporate environmental reports in South Africa
submitted for Ethics Clearance in the fulfillment of the
Degree of DCom (Accounting)
has been approved.
The application for ethics clearance for the abovementioned research was reviewed by the SAS Research Ethics Review Committee on 5 June 2013 in compliance with the Unisa Policy on Research Ethics. Ethical clearance has been granted. Please be advised that the research ethics review committee needs to be informed should any part of the research methodology as outlined in the Ethics Application (Ref.Nr.: 2013/CEMS/SAS/0006), change in any way.
The Research Ethics Review Committee wishes you all the best with this research undertaking.
Kind regards,
Prof HC Wingard, Chair of the SAS Research Ethics Review Committee
Department of Financial Accounting, Unisa
19 June 2013
University of South Africa
Preller Street Muckleneuk Ridge. City of Tshwane PO Box 392 UNISA 0003 South Africa
"'" i@pllore: +27 I 2 429 3IIIFacsimile: +27 12 429 41SO www.u nisa.ac.za


