
The Consolidation and Strength Behavior of Mechanically Compressed
Fine-Grained Sediments A Ph.D. Defense
by Brendan Casey
Thesis Supervisor: Dr. Jack Germaine
Committee Chair: Prof. Herbert Einstein
Committee Members: Dr. Richard Plumb, Prof. Peter Flemings, Prof. Brian Evans & Prof. Charles Ladd
Friday, April 25th 2014
1 /49
Outline
• Motivation and Objectives
• Resedimentation
• Permeability Results
• Triaxial Equipment and Procedures
• Principle of Effective Stress
• Shear Strength Behavior
• Summary and Conclusions
2 /49
Outline
• Motivation and Objectives
• Resedimentation
• Permeability Results
• Triaxial Equipment and Procedures
• Principle of Effective Stress
• Shear Strength Behavior
• Summary and Conclusions
3 /49

Motivation
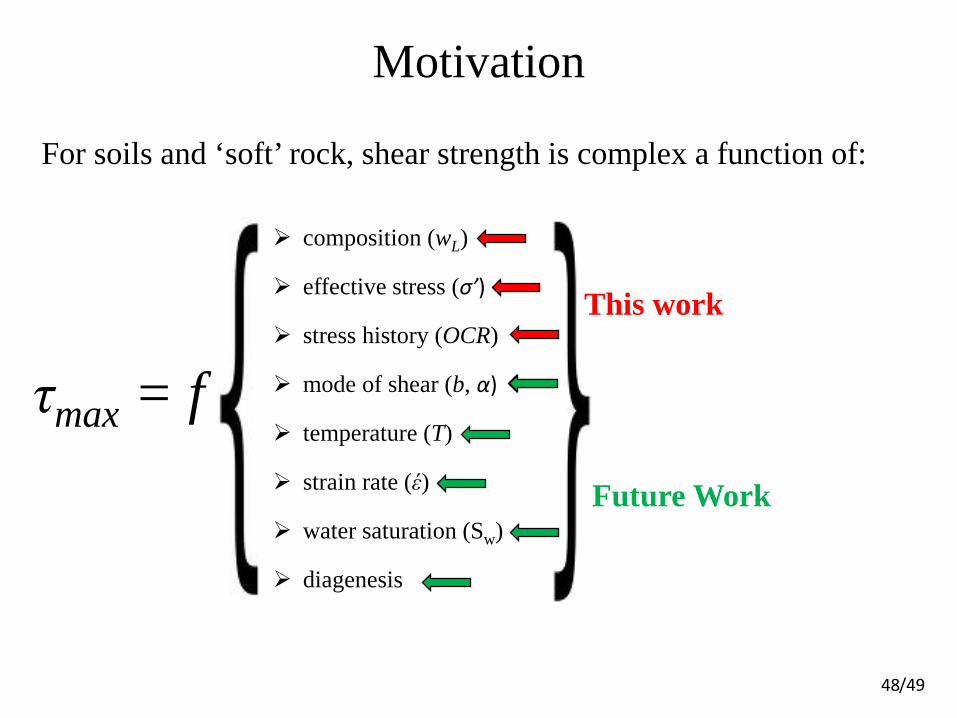
composition (wL)
effective stress (σ’)
stress history (OCR)
mode of shear (b, α)
temperature (T)
strain rate (έ)
water saturation (Sw)
diagenesis
/49 4
This work
For soils and ‘soft’ rock, shear strength is complex a function of:
τmax = f
/49 5
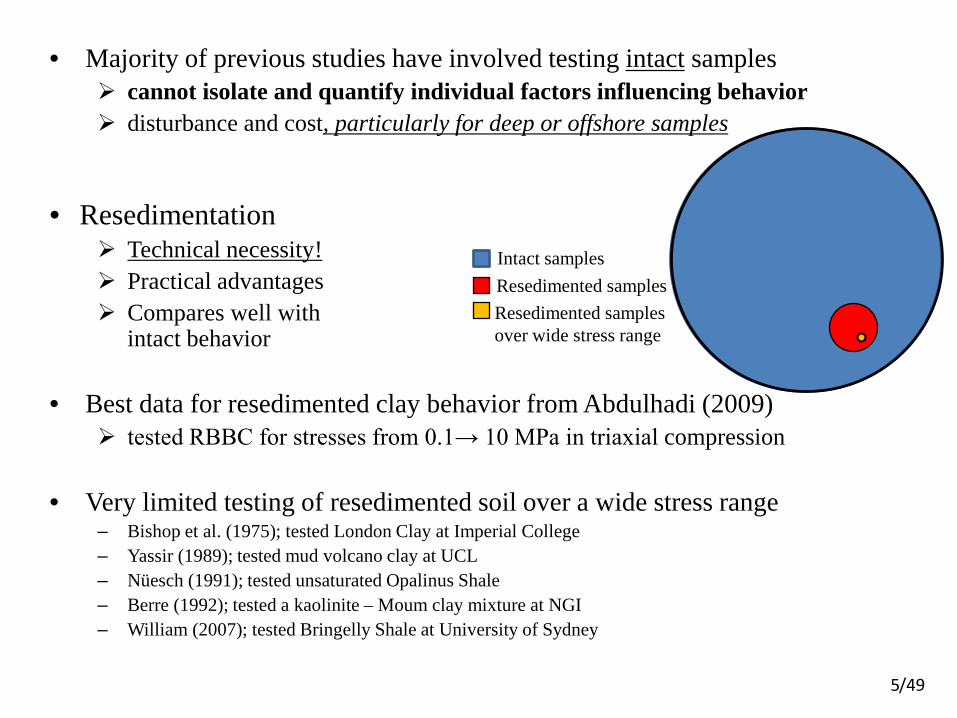
• Majority of previous studies have involved testing intact samples cannot isolate and quantify individual factors influencing behavior disturbance and cost, particularly for deep or offshore samples
• Resedimentation
Technical necessity! Practical advantages Compares well with
intact behavior
• Best data for resedimented clay behavior from Abdulhadi (2009) tested RBBC for stresses from 0.1→ 10 MPa in triaxial compression
• Very limited testing of resedimented soil over a wide stress range – Bishop et al. (1975); tested London Clay at Imperial College – Yassir (1989); tested mud volcano clay at UCL – Nüesch (1991); tested unsaturated Opalinus Shale – Berre (1992); tested a kaolinite – Moum clay mixture at NGI – William (2007); tested Bringelly Shale at University of Sydney
Intact samples Resedimented samples Resedimented samples over wide stress range

Outline
• Motivation and Objectives
• Resedimentation
• Permeability Results
• Triaxial Equipment and Procedures
• Principle of Effective Stress
• Shear Strength Behavior
• Summary and Conclusions
6 /49

Resedimentation
3. Mix dry powder and water into slurry
4. Vacuum the slurry
5. Pour slurry into a consolidometer
1. Obtain core material 2. Breakdown into powder and blend
7 /49
Comparisons of resedimented vs. intact behavior: • Berman 1993 (BBC) • Mazzei 2008 (RGoM Ursa) • Casey 2011 (BBC) • House 2012 (BBC) • Betts 2014 (RGoM Eugene Is.)

Resedimentation
4. Load incrementally Different consolidometers used depending on
testing needs Low stress triaxial: σ’p = 0.1 MPa Medium stress triaxial: σ’p = 2 MPa High stress triaxial: σ’p = 10 MPa Time required for resedimentation strongly
dependent on soil type (cv)
5. Swell to OCR = 5
6. Extrude and trim test specimen
8 /49

What am I dealing with?
9 /49
Contributing researchers: Grennan (2010) Abdulhadi (2009), Sheahan (1991) Jones (2010) Kontopoulos (2012) Betts (2014), Fahy (2014)

Outline
• Motivation and Objectives
• Resedimentation
• Permeability Results
• Triaxial Equipment and Procedures
• Principle of Effective Stress
• Shear Strength Behavior
• Summary and Conclusions
10 /49

1E-20
1E-19
1E-18
1E-17
1E-16
1E-15
0.2 0.3 0.4 0.5 0.6 0.7
Vert
ical
Per
mea
bilit
y, k
(m2 )
Porosity, n
R. Presumpscot Clay (RPC)
R. Ursa Clay (RGoM-Ursa)
R. London Clay (RLC)
Permeability
increasing wL
1
1E-1
1E-3
1E-5
1E-2
1E-4 Vert
ical
Per
mea
bilit
y, k
(mD
)
11 /49

1E-20
1E-19
1E-18
1E-17
1E-16
1E-15
0.2 0.3 0.4 0.5 0.6 0.7
Vert
ical
Per
mea
bilit
y, k
(m2 )
Porosity, n
R. Presumpscot Clay (RPC)
R. Ursa Clay (RGoM-Ursa)
R. London Clay (RLC)
log(k) = γ.(n – 0.5) + log(k0.5) for 0.20 < n < 0.75
γ
k0.5
Permeability
1
1E-1
1E-3
1E-5
1E-2
1E-4 Vert
ical
Per
mea
bilit
y, k
(mD
)
12 /49

-19
-18
-17
-16
-15
-14
-13
20 40 60 80 100
log(
k 0.5)
Liquid Limit, wL(%)
5
6
7
8
9
10
11
12
13
20 40 60 80 100
γ
Liquid Limit, wL(%)
Permeability Correlations
log(k0.5)= -7.55log(wL) – 3.4 r2 = 0.90
γ = 0.067(wL) + 5.1 r2 = 0.75
Nankai
Cornwall
log(k) = γ.(n – 0.5) + log(k0.5)
13 /49

Permeability Model: Error Analysis
14 /49

Permeability: Predicting In situ Behaviour
0
20
40
60
80
100
120
0.3 0.4 0.5 0.6
Dep
th (f
t)
liquid limitporosity
1E-17 1E-16 1E-15
Permeability, k (m2)
Boston Blue Clay
Liquid limit / Porosity
15 /49

Permeability: Predicting In situ Behaviour
16 /49

Outline
• Motivation and Objectives
• Resedimentation
• Permeability Results
• Triaxial Equipment and Procedures
• Principle of Effective Stress
• Shear Strength Behavior
• Summary and Conclusions
17 /49
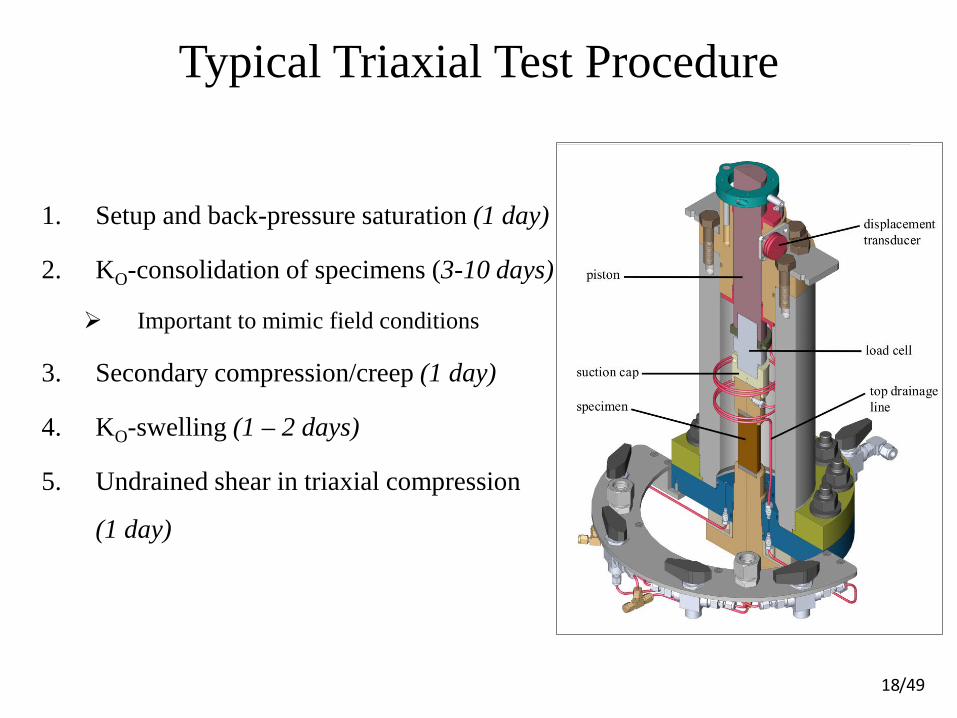
Typical Triaxial Test Procedure
1. Setup and back-pressure saturation (1 day)
2. KO-consolidation of specimens (3-10 days)
Important to mimic field conditions
3. Secondary compression/creep (1 day)
4. KO-swelling (1 – 2 days)
5. Undrained shear in triaxial compression
(1 day)
18 /49

/49 19
low pressure triaxial (σ’p < 2 MPa)
high pressure triaxial (10 < σ’p < 100 MPa)
medium pressure triaxial (2 < σ’p < 10 MPa)
Outline
• Motivation and Objectives
• Resedimentation
• Permeability Results
• Triaxial Equipment and Procedures
• Principle of Effective Stress
• Shear Strength Behavior
• Summary and Conclusions
20 /49

Effective Stress
• Effective Stress: Partial stress which controls changes in deformation and shear resistance of porous materials
• Conventional Terzaghi (1923) definition for saturated soil: σ’ = σ – u
– assumes particles are: 1) incompressible, and 2) have a constant yield strength
• Some have proposed modified definitions, such as: – ‘Intergranular stress’
– (Skempton 1960) (a = contact area between particles per unit area)
• At high stresses the contact area can become significant; can true effective stress deviate from Terzaghi definition? ...literature typically assumes no
/49 21
σ’ = (σ – u) + au + (R – A)

Tests of Bishop and Skinner (1977)
22
• Most significant testing program to examine effective stress in relation to shear resistance
• Drained triaxial compression tests involving large changes in back-pressure but keeping (σ3 – ub) constant during shearing
• Significance of interparticle contact area determined from discontinuities in shear stress-strain curve
• Tested sand, silt, crushed marble, lead shot for pore pressures up to 40 MPa
/49

Tests of Bishop and Skinner (1977)
Results and conclusions: • Terzaghi definition applicable for full range of stresses tested with
no observable change in shear resistance • Intergranular stress equation not valid • Inconclusive re. Skempton’s (1960) equation However…. • No clays were tested • Nature of inter-particle contacts is potentially different for clays
23 /49
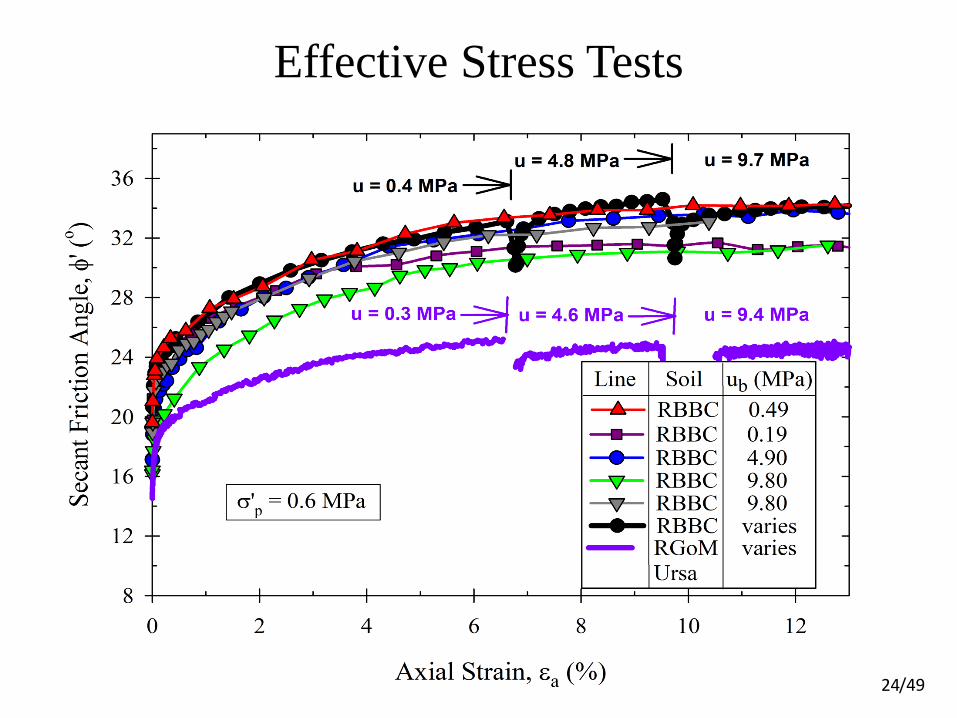
Effective Stress Tests
/49 24

Outline
• Motivation and Objectives
• Resedimentation
• Permeability Results
• Triaxial Equipment and Procedures
• Principle of Effective Stress
• Shear Strength Behavior
• Summary and Conclusions
25 /49

0.00
0.05
0.10
0.15
0.20
0.25
0.30
0.35
0.40
0 2 4 6 8 10 12
Nor
mal
ized
Shea
r Str
ess,
q/σ
' vc
Axial Strain, εa (%)
σ’vc = 0.2 MPa
Stress-Strain Response during Shearing
105 MPa
9.8 MPa
1.2 MPa
su/σ’vc
R. Ugnu Clay @ OCR = 1
26 /49

0.10
0.15
0.20
0.25
0.30
0.35
0.40
0.1 1 10 100
Und
rain
ed S
tren
gth
Ratio
, su/σ'
vc
Preconsolidation Stress, σ'p (MPa)
R. Ugnu Clay
R. London Clay
Undrained Strength @ OCR = 1
su/σ’vc = S1(1000σ’p [MPa])T s u/σ’
v
S1
T
σ‘p
27 /49

0.10
0.15
0.20
0.25
0.30
0.35
0.40
0.1 1 10 100
Und
rain
ed S
tren
gth
Ratio
, su/σ'
v
Preconsolidation Stress, σ'p (MPa)
Skibbereen Silt
R. Presumpscot Clay
R. Boston Blue Clay
R. GoM Ursa Clay
R. Ugnu Clay
R. S.F. Bay Mud
R. London Clay
R. GoM Eugene Is.
Undrained Strength @ OCR = 1
s u/σ’
v
S1
T
σ‘p
28 /49

0
0.1
0.2
0.3
0.4
0.5
0.6
0.7
20 30 40 50 60 70 80 90 100
S 1
Liquid Limit, wL(%)
-0.20
-0.15
-0.10
-0.05
0.00
0.05
0.10
0.15
20 30 40 50 60 70 80 90 100
T
Liquid Limit, wL(%)
Undrained Strength - Liquid Limit Correlations S1 = 0.86log(wL) - 1.04 r2 = 0.97
T = -0.46log(wL) + 0.73 r2 = 0.95
29 /49

Overconsolidated Behavior
/49 30
OCR = 4
OCR = 1
OCR = 8
OCR = 2
σ‘vc = 0.6 MPa σ‘vc = 40 MPa
R. Boston Blue Clay

Increase in Ductility with Stress
/49 31
R. Boston Blue Clay

Undrained Strength: Overconsolidated Soil
/49 32
0
0.2
0.4
0.6
0.8
1
1.2
1.4
1.6
0.1 1 10 100
Und
rain
ed S
tren
gth
Ratio
, su/σ'
vc
Preconsolidation Stress, σ'p (MPa)
su/σ’vc = 0.366(1000σ’p)-0.024
su/σ’vc = 1.701(1000σ’p)-0.028
su/σ’vc = 1.083(1000σ’p)-0.035
su/σ’vc = 0.593(1000σ’p)-0.020
T is independent of OCR
T S1(OC) R. Boston Blue Clay
OCR = 4
OCR = 1
OCR = 8
OCR = 2

Undrained Strength: Overconsolidated Soil
/49 33
S1(OC) = 0.368(OCR)0.73, r2 = 0.9999
approx. constant for fine-grained soils
R. Boston Blue Clay
S 1(O
C)
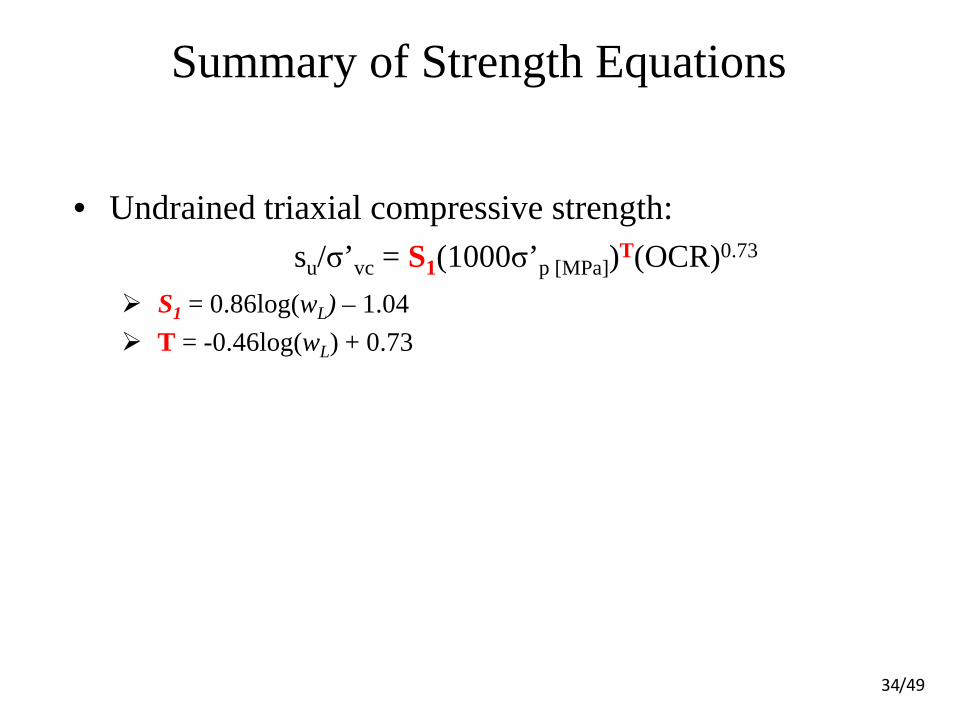
Summary of Strength Equations
• Undrained triaxial compressive strength:
S1 = 0.86log(wL) – 1.04 T = -0.46log(wL) + 0.73
/49 34
su/σ’vc = S1(1000σ’p [MPa])T(OCR)0.73
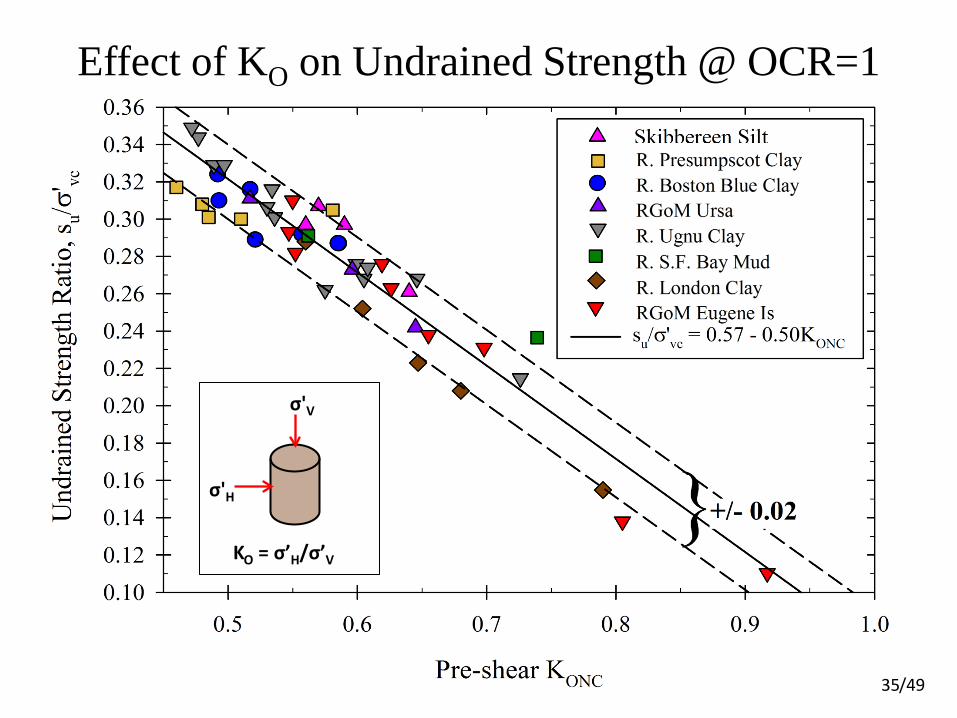
Effect of KO on Undrained Strength @ OCR=1
σ'H
σ'V
KO = σ’H/σ’V
35 /49

10
15
20
25
30
35
40
0.1 1 10 100
Criti
cal S
tate
Fric
tion
Angl
e, φ
’ cs (°
)
Preconsolidation Stress, σ'p (MPa)
R. Ugnu Clay
R. London Clay
Friction Angle
/49 36
A B
φ
σ‘p
φ = A(0.001σ’p [MPa])B

10
15
20
25
30
35
40
0.1 1 10 100
Criti
cal S
tate
Fric
tion
Angl
e, φ
' cs (°
)
Preconsolidation Stress, σ'p (MPa)
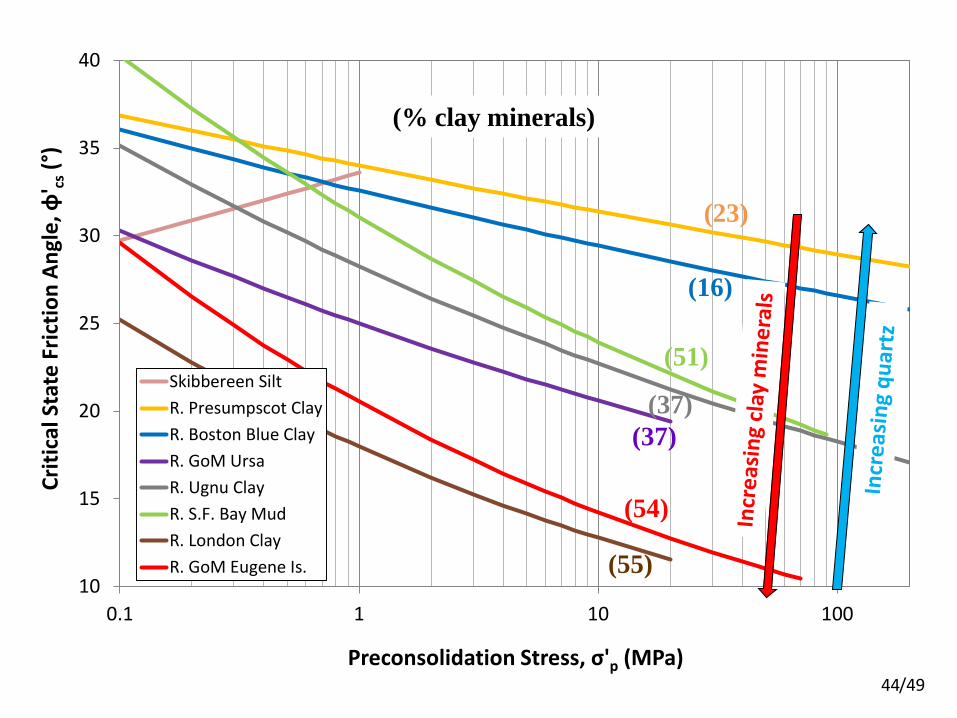
Skibbereen Silt
R. Presumpscot Clay
R. Boston Blue Clay
R. GoM Ursa
R. Ugnu Clay
R. S.F. Bay Mud
R. London Clay
R. GoM Eugene Is.
Friction Angle
37 /49
A B
φ
σ‘p

0
10
20
30
40
50
20 40 60 80 100
A (˚)
Liquid Limit, wL(%)
-0.20
-0.15
-0.10
-0.05
0.00
0.05
0.10
20 40 60 80 100
B
Liquid Limit, wL(%)
Friction Angle - Liquid Limit Correlations
A = -75log(wL) + 148 r2 = 0.89
B = -0.39log(wL) + 0.59 r2 = 0.95
38 /49

Summary of Strength Equations
• Undrained triaxial compressive strength:
S1 = 0.86log(wL) – 1.04 T = -0.46log(wL) + 0.73
• Drained triaxial compressive strength:
A = -75log(wL) + 148 B = -0.39log(wL) + 0.59
/49 39
φ‘cs = A(0.001σ’p [MPa])B
su/σ’vc = S1(1000σ’p [MPa])T(OCR)0.73

Effect of OCR on φ’cs
40 /49
25
27
29
31
33
35
37
39
0.1 1 10 100
Criti
cal S
tate
Fric
tion
Angl
e, φ‘ cs
(°)
Preconsolidation Stress, σ'p (MPa)
OCR = 1
OCR = 2
OCR = 4
OCR = 8
R. Boston Blue Clay
/49 41
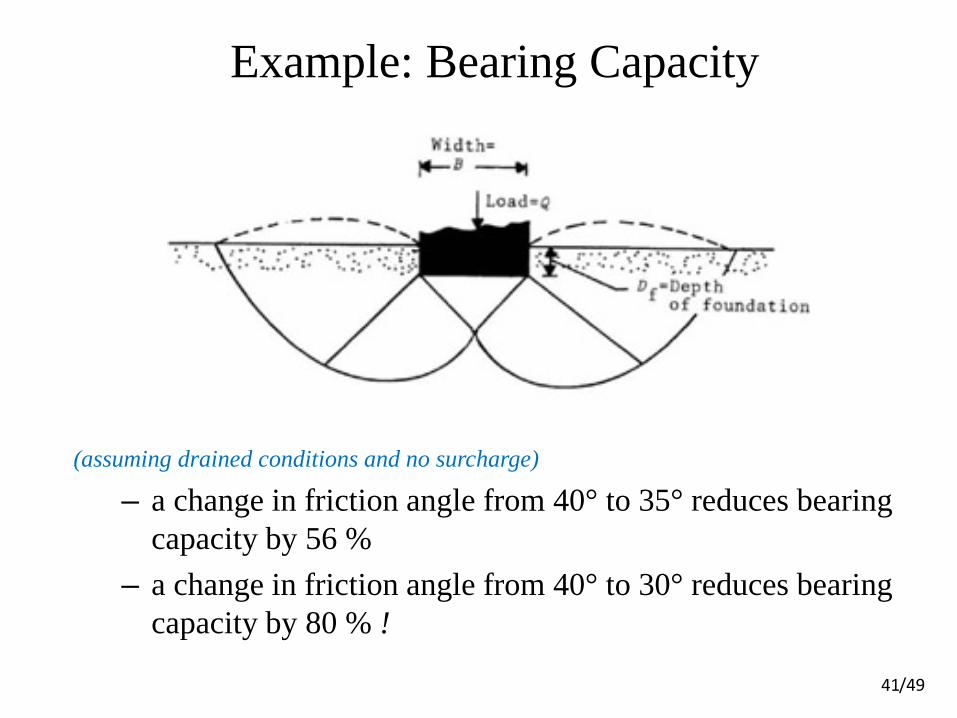
(assuming drained conditions and no surcharge)
– a change in friction angle from 40° to 35° reduces bearing capacity by 56 %
– a change in friction angle from 40° to 30° reduces bearing capacity by 80 % !
Example: Bearing Capacity

Particle Reorientation
/49 42
Adams (2014), Ph.D.
Compression
….but failure in triaxial compression occurs at ~ 50˚→65˚
50˚- 65˚ → Particle reorientation with stress cannot explain strength behavior
Courtesy of Taylor Nordquist
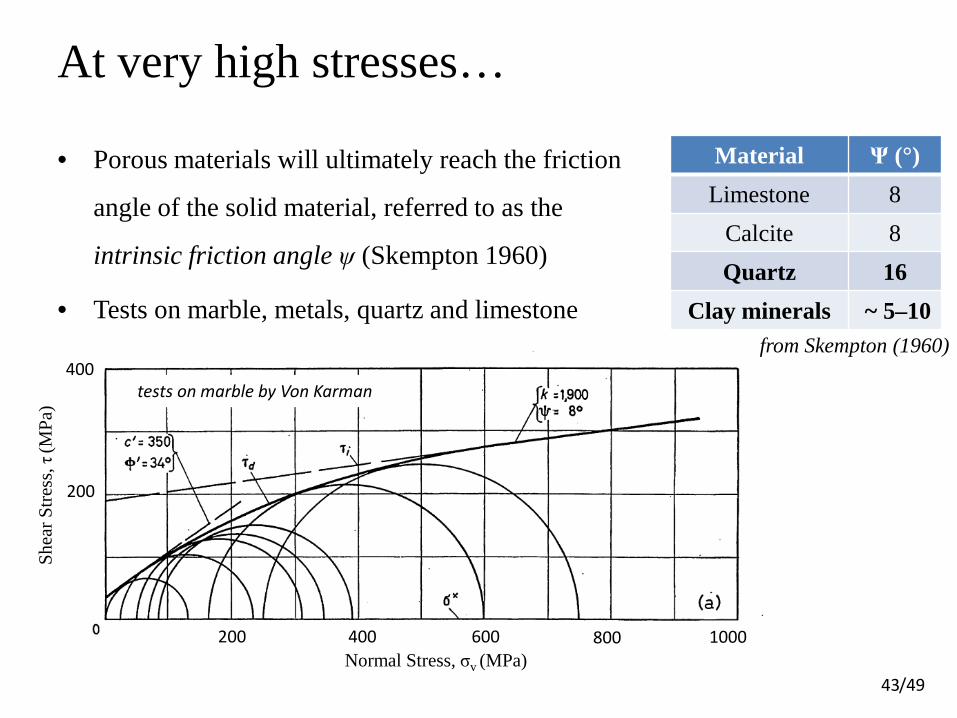
At very high stresses…
/49 43
from Skempton (1960)
tests on marble by Von Karman
200 1000 800 600 400 Normal Stress, σv (MPa)
400
200
Shea
r Stre
ss, τ
(MPa
)
• Porous materials will ultimately reach the friction
angle of the solid material, referred to as the
intrinsic friction angle ψ (Skempton 1960)
• Tests on marble, metals, quartz and limestone
Material Ψ (°) Limestone 8
Calcite 8 Quartz 16
Clay minerals ~ 5–10
10
15
20
25
30
35
40
0.1 1 10 100
Criti
cal S
tate
Fric
tion
Angl
e, φ
' cs (°
)
Preconsolidation Stress, σ'p (MPa)
Skibbereen SiltR. Presumpscot ClayR. Boston Blue ClayR. GoM UrsaR. Ugnu ClayR. S.F. Bay MudR. London ClayR. GoM Eugene Is.
44 /49
(23)
(37)
(55)
(54)
(16)
(51)
(% clay minerals)
(37)

Yield Surface Evolution
/49 45
R. Boston Blue Clay
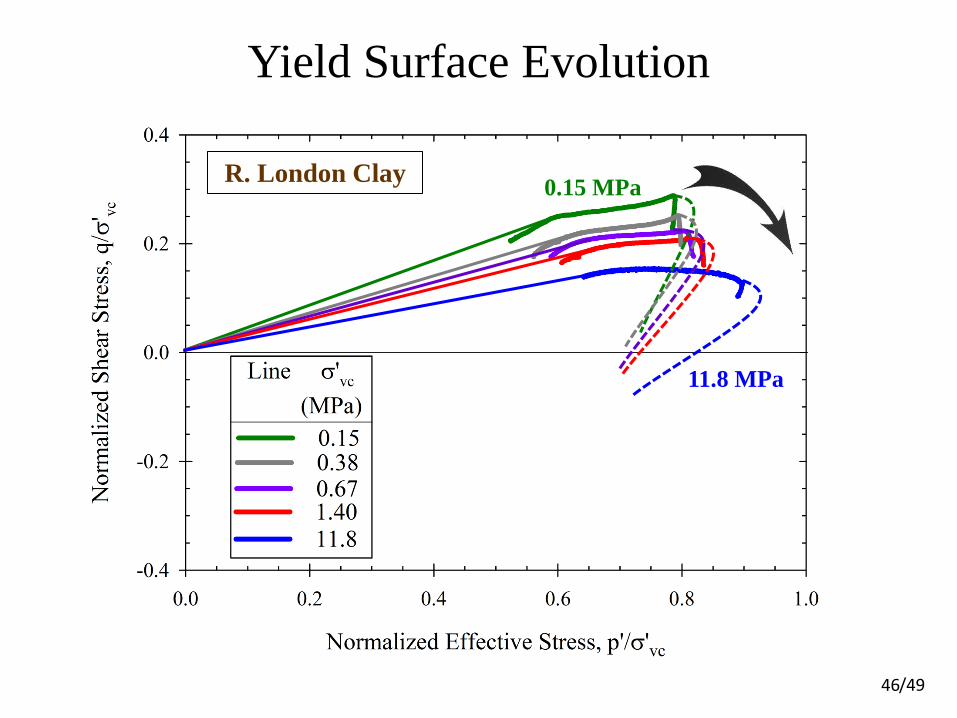
Yield Surface Evolution
/49 46
0.15 MPa
11.8 MPa
R. London Clay

Conclusions • Resedimentation is a technical necessity and practically
advantageous to study the behavior of soils systematically
• Correlations developed from resedimented soil using liquid limit can predict intact permeability, a robust indicator of composition
• Conventional Terzaghi definition of effetive stress is valid for fine-grained soils at high in situ pore pressures
• Shear strength properties vary consistently with stress level and are closely linked to composition/plasticity
• Variations in strength properties with stress reflect an evolving yield surface
/49 47
Motivation
composition (wL)
effective stress (σ’)
stress history (OCR)
mode of shear (b, α)
temperature (T)
strain rate (έ)
water saturation (Sw)
diagenesis
/49 48
This work
For soils and ‘soft’ rock, shear strength is complex a function of:
τmax = f
Future Work

Publications • Casey, B. and Germaine, J.T. (2013). “The Stress Dependence of Shear
Strength in Fine-Grained Soils and Correlations with Liquid Limit”, Journal of Geotechnical and Geoenvironmental Engineering, 139 (10), 1709-1717. doi: 10.1061/(ASCE)GT.1943-5606.0000896
• Casey, B., Germaine, J.T., Flemings, P.B., Reece, J.S., Gao, B., and Betts, W. (2013). “Liquid Limit as a Predictor of Mudrock Permeability”, Journal of Marine and Petroleum Geology, 44, 256-263. http://dx.doi.org/10.1016/j.marpetgeo.2013.04.008
• Casey, B. & Germaine, J.T. (2013). “Variation of Cohesive Sediment Strength with Stress Level”, Advances in Multiphysical Testing of Soils and Shales, Springer Series in Geomechanics
• Casey, B., Fahy, B.P., Flemings, P.B. & Germaine, J.T. (2014). Shear Strength of Two Gulf of Mexico Mudrocks and a Comparison with Other Sediments, Fourth EAGE Shale Workshop, 6-9 April 2014, Porto
• Casey, B. & Germaine, J.T. (2014). “An Evaluation of Three Triaxial Systems with Results from 0.1 to 100 MPa” Geotechnical Testing Journal, in review
49 /49


