
The Computational Biology of Genetically Diverse Assemblages
Allen Rodrigo1, Frederic Bertels1, Mehul Rathod2, Sean Irvine2, John Cleary2,3, Peter Tsai1
1The Allan Wilson Centre for Molecular Ecology and Evolution and the Bioinformatics Institute New Zealand, University of Auckland
2NetValue Ltd3Department of Computer Science, University of Waikato
Metagenomics• The study of the genetics of diverse assemblages of
(micro)organisms from natural environments is called metagenomics.
• Metagenomic studies…– Utilise new high-throughput sequencing technologies– Typically include unknown organisms and novel genes– Will generate large amounts of genetic data– Can be performed in a range of environments– Requires significant computational resources and new algorithms– Have the potential to revolutionize the way we think about the
genetic makeup of the environment
The New Icons

Source: J. Craig Venter Institute www.jvci.org
Preliminary Results of the GOS Study
• 2000 new protein “types”
– Many viral proteins– New occurrences of proteins in previously
unrecorded taxonomic groups
• >6000 new open reading frames (potential protein coding sequences)

Metagenomics of Communities at Neighbouring Thermal Vents
Rarefaction Curves
Higher taxa
Species
Huber et al, 2007, Science 318: 97 - 100

The Marine Viromes Project
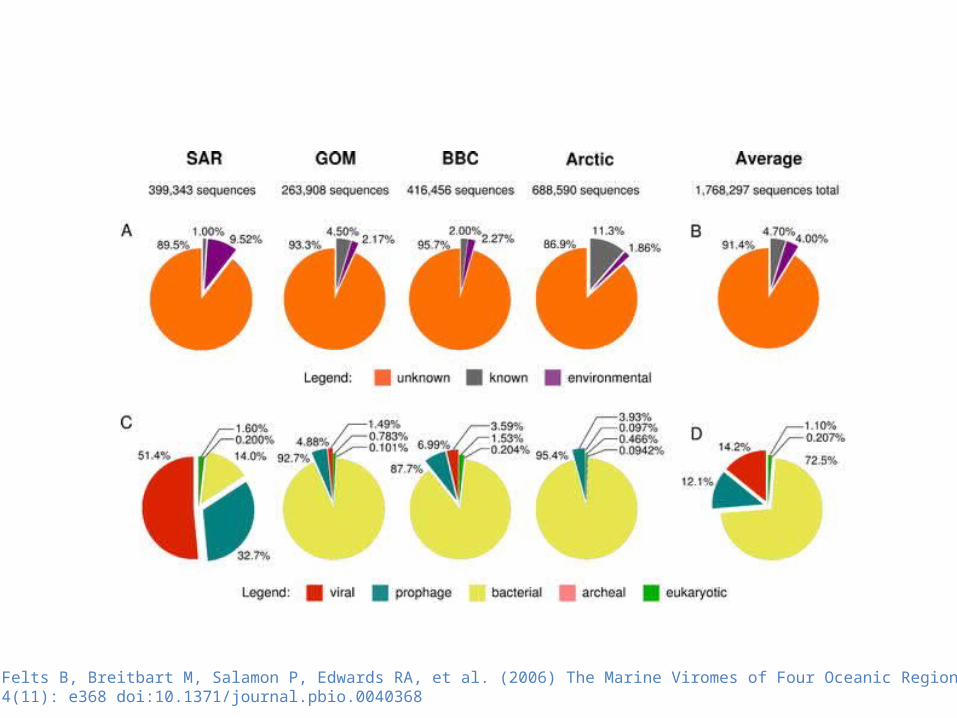
Angly FE, Felts B, Breitbart M, Salamon P, Edwards RA, et al. (2006) The Marine Viromes of Four Oceanic Regions. PLoS Biol 4(11): e368 doi:10.1371/journal.pbio.0040368

Community Comparisons
• If the primary purpose is to relate community structure to environment, space or time then:
– We need to quantify the similarities between different communities
– So that we can relate these similarities to the environmental, temporal or spatial similarities.
Community Comparisons
• The bottleneck in these analyses is the identification of each sequence in the sample.
• Sequences may be amplicons of single loci or environmental shotgun sequences.

New Sequencing Technologies
• Roche, Illumina, and Applied Biosystems have released next-generation sequencers that produce large quantities of sequence information.– Millions of shotgun fragments, each between
25nt-250nt long– 106 - 109 nt in a single run (within days)
• Other technologies will follow.

Community Comparisons
• The bottleneck in these analyses is the identification of each sequence in the sample.
• The challenge is to either• Find algorithms that can speed up this process• Free ourselves of the process
Identifying The Species Present
• Using BLAST takes time. • However, new tools are presently available.• Used SLIMSearch (www.slimsearch.com)
– Proprietory search algorithm based on word matching
– Disclosure: I am on the SAB!
Identifying The Species Present
Simulations: • Select random 60 genomes from the set of 546 fully-
sequenced bacterial genomes • Compute the number of reads for each genome in the 60
following the log normal distribution as above– 250nt reads, 0.7x coverage (distributed over 60 genomes using
a log normal distribution mean = 2, standard deviation = 3.3)– Approx. 600,000 reads
• Set error at 0.5%– generated by random selection from the genome and
appropriate mutation(90% indels 10% substitutions) • Time SLIMSearch and BLASTN with each set as query
against 546 genomes

Identifying The Species Present
• BLASTN (sec) -- 247127.56 = 68.6hrs
• SLIMSearch (sec) -- 384.53 = 6 mins
computer configuration– TAHI 2 x Dual core opteron 2212 (2.0 GHz), 8 GB RAM, 1 TB (2 x 500GB), Debian AMD64
4.0(Etch), DELL Poweredge 1435
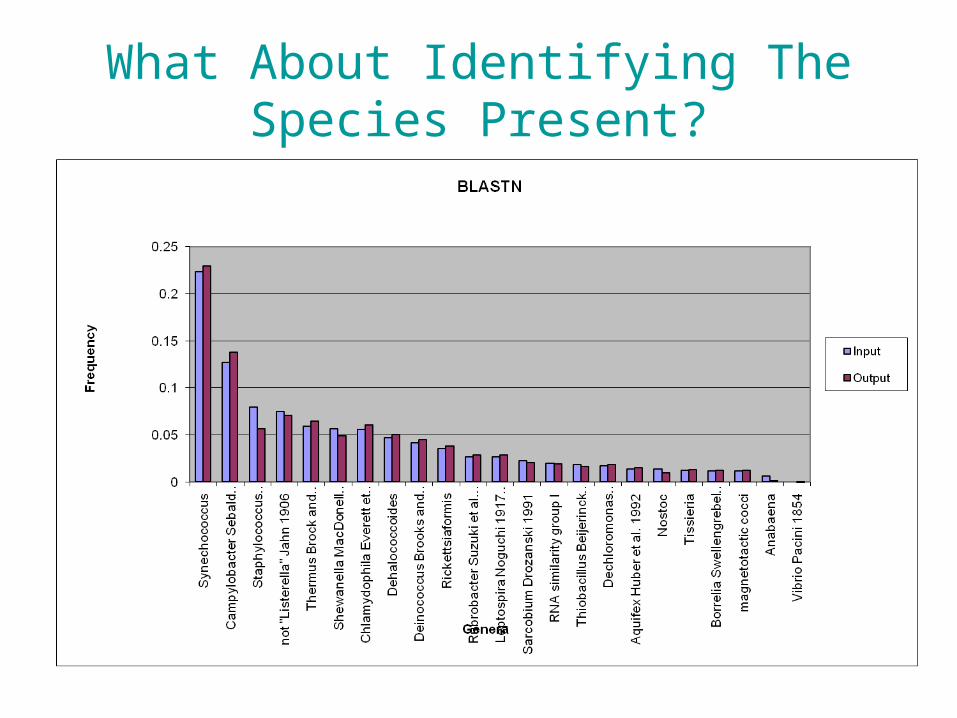
What About Identifying The Species Present?
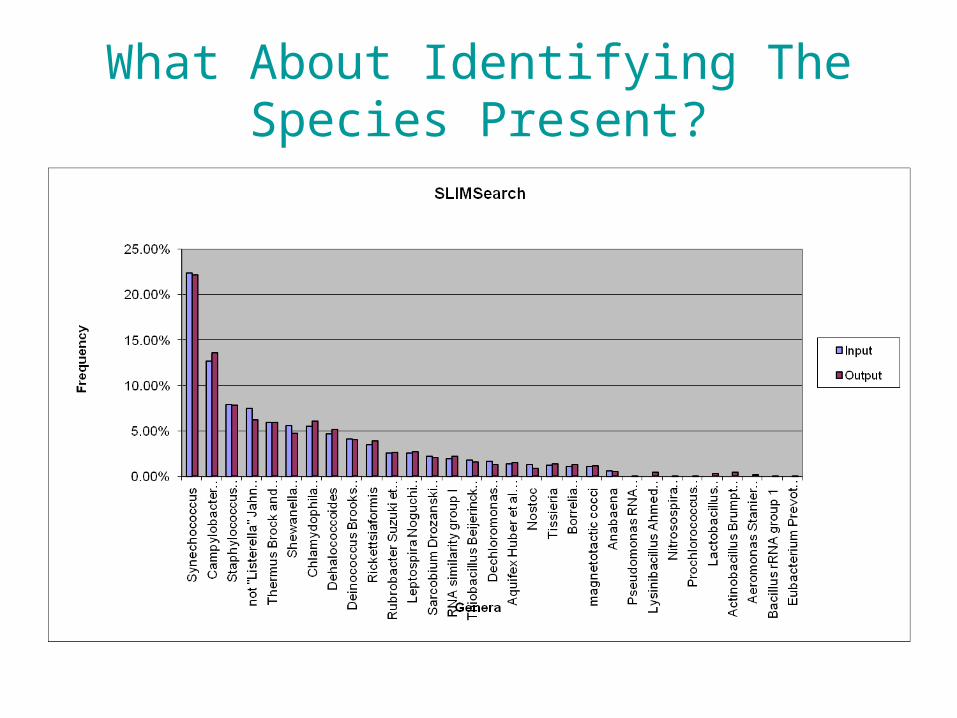
What About Identifying The Species Present?
Community Comparisons
• The bottleneck in these analyses is the identification of each sequence in the sample.• Sequences may be amplicons of single loci or
environmental shotgun sequences.
• The challenge is to either• Find algorithms that can speed up this process• Free ourselves of the process

Identification-Free Comparisons
• We have chosen to explore the use of alignment-free methods.
• These can be classed into 2 broad types:
• Similarity of word frequency spectra
• Compression-type procedures

Similarity of Word Frequency Spectra
• Define a word-length, k.
• For each taxon/sequence, identify the frequencies of all possible k-words.
• Compare frequency spectra between pairs using an appropriate distance metric.– Metrics tend to differ based on
• how they normalise word frequencies,• the distances used, and • how expected frequencies are calculated.
• Dates back to Blaisdell (1986).
Compression-based Methods
• Some sophisticated maths, but a very simple idea.
• What is the “compressibility” of two datasets when they are combined, relative to the sum of their individual “compressibilities”?– How much shared information is there between
two datasets?• Previous work has shown some nice
phylogenetic properties.

Alignment-free Comparisons• We applied word frequency and compression algorithms to
datasets consisting of:
– 16S complete rDNA sequences of 35 bacteria spanning a wide range of phyla and with a range of GC-contents from the Ribosomal Database Project (Maidak et al, 1997).
– the same 16S rDNA sequences, cut into random short fragments of length 250 (+/-50) each with 3X coverage, using the program READSIM (source: http://www-ab.informatik.uni-tuebingen.de/software/ readsim/welcome.html) with a relatively high error rate of approximately 4%
– full genomes of the same bacteria as in (a).
Alignment-free Comparisons
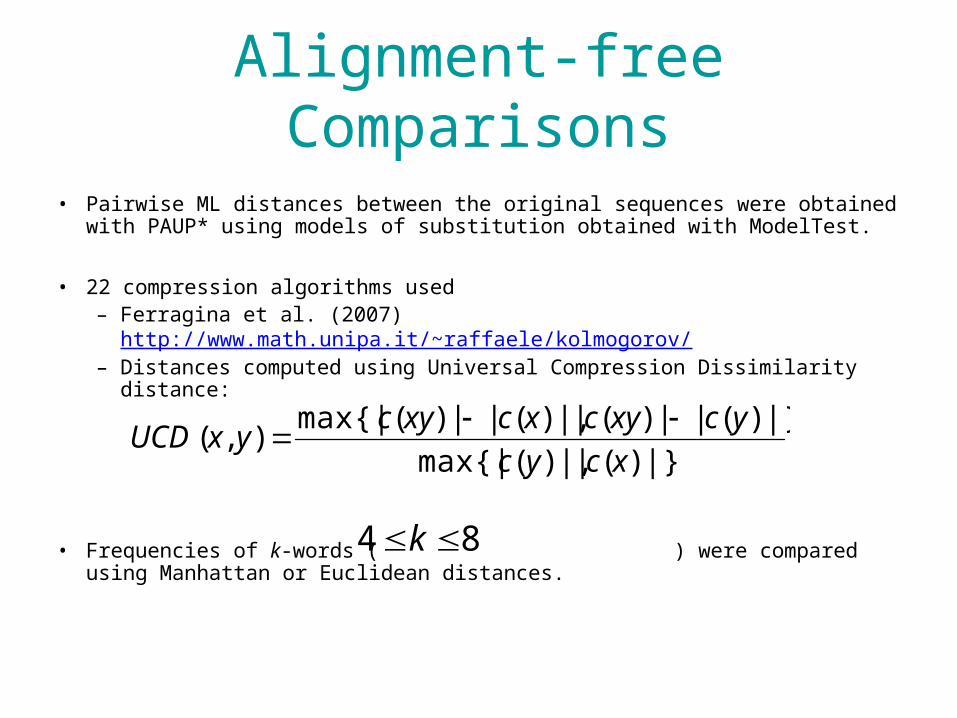
• Pairwise ML distances between the original sequences were obtained with PAUP* using models of substitution obtained with ModelTest.
• 22 compression algorithms used – Ferragina et al. (2007) http://www.math.unipa.it/~raffaele/kolmogorov/ – Distances computed using Universal Compression Dissimilarity distance:
• Frequencies of k-words ( ) were compared using Manhattan or Euclidean distances.
84 k
|})(||,)(max{|
|})(||)(||,)(||)(max{|),(
xcyc
ycxycxcxycyxUCD
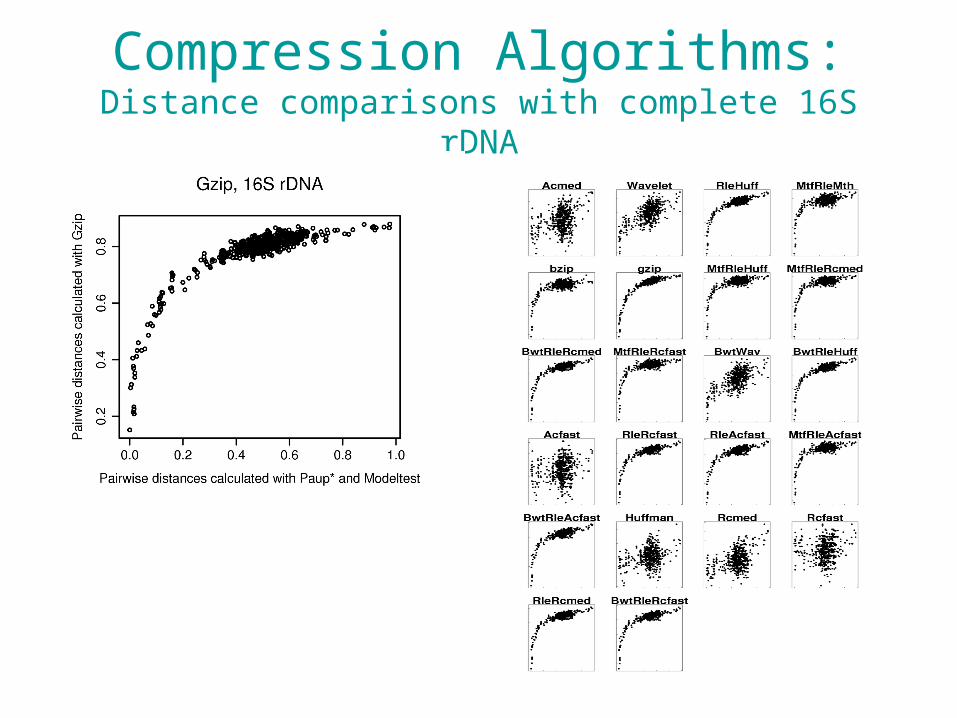
Compression Algorithms:Distance comparisons with complete 16S rDNA
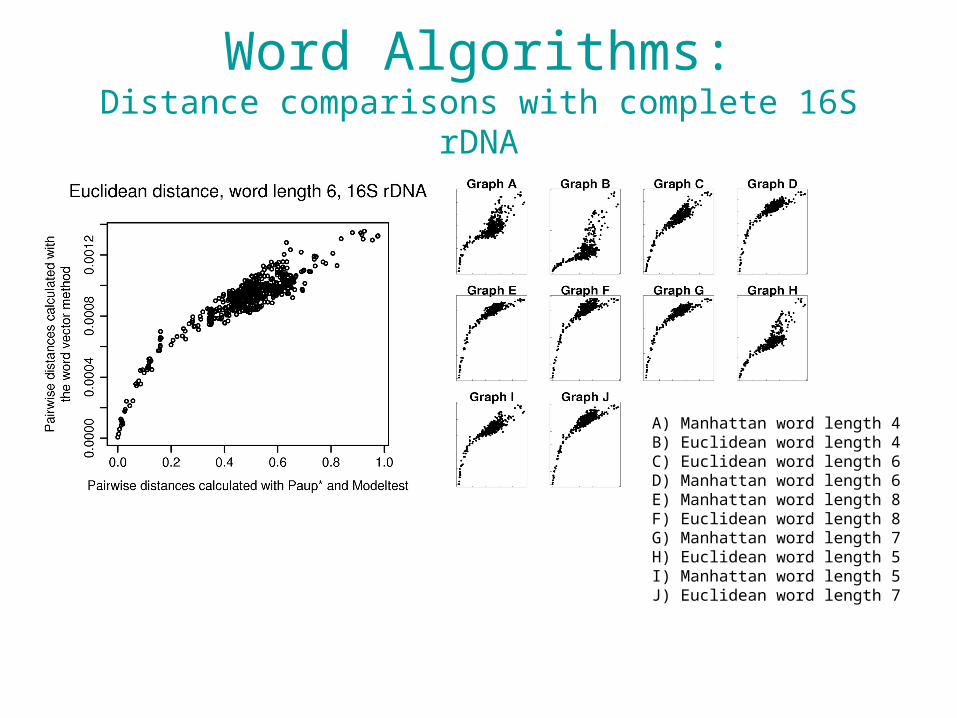
Word Algorithms:Distance comparisons with complete 16S rDNA
A) Manhattan word length 4B) Euclidean word length 4C) Euclidean word length 6D) Manhattan word length 6E) Manhattan word length 8F) Euclidean word length 8G) Manhattan word length 7H) Euclidean word length 5I) Manhattan word length 5J) Euclidean word length 7

Compression Algorithms:Distance comparisons with short-read 16S rDNA

Word Algorithms:Distance comparisons with short-read 16S rDNA
A) Manhattan word length 4B) Euclidean word length 4C) Euclidean word length 6D) Manhattan word length 6E) Manhattan word length 8F) Euclidean word length 8G) Manhattan word length 7H) Euclidean word length 5I) Manhattan word length 5J) Euclidean word length 7
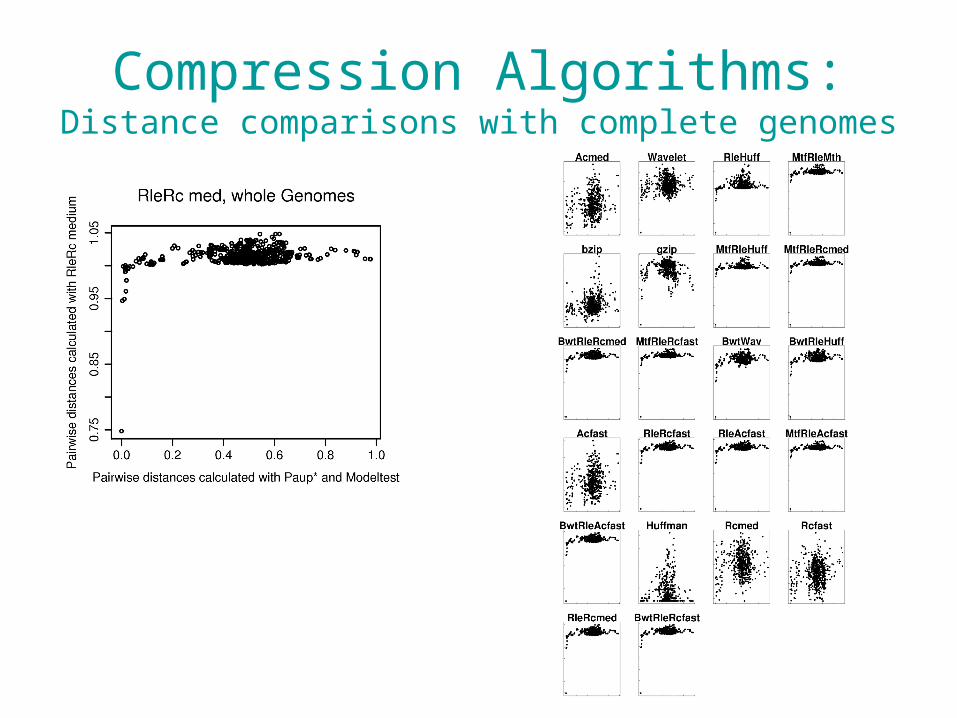
Compression Algorithms:Distance comparisons with complete genomes

Word Algorithms:Distance comparisons with complete genomes
A) Manhattan word length 4B) Euclidean word length 4C) Euclidean word length 6D) Manhattan word length 6E) Manhattan word length 8F) Euclidean word length 8G) Manhattan word length 7H) Euclidean word length 5I) Manhattan word length 5J) Euclidean word length 7

Problems and Challenges
• It appears that we are able to use compression and word-frequency methods with a single locus.
• With whole genomes, these methods break down.– Lateral gene transfer– GC content differences across the genome– Numbers of repeats

• Can we use alignment-free methods to quantify the similarity of communities for which only a single locus has been sequenced?
• Simulations– 100 communities– Each with 10 randomly-selected bacterial species’
16SrRNA– Log-normal species frequency distribution
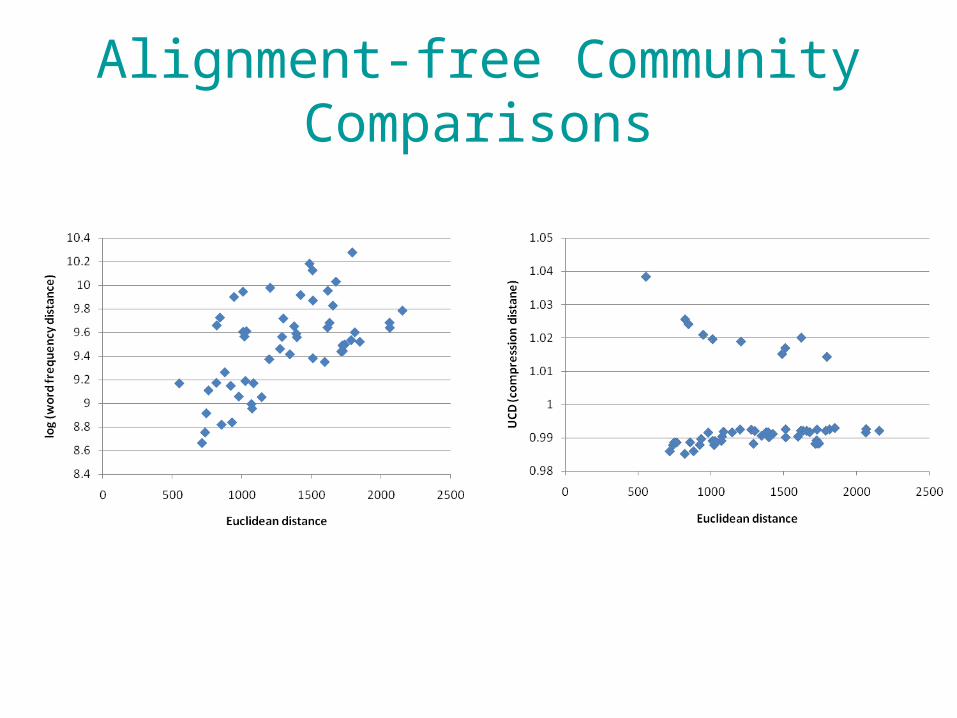
Alignment-free Community Comparisons

Provisional Conclusions
• Alignment-free methods hold promise for the rapid estimation of pairwise distances between amplicons and NGS from single species or communities
• They work less well with whole genomes.• Advancements in search/identification
strategies may negate the necessity for these fast methods.

Acknowledgements
NZ-France Dumont D’Urville Fund


