
The coming age of continuous
monitoring and auditing
IAAIA Workshop on Continuous Monitoring
Dubai, February 2011
Miklos A. Vasarhelyi
KPMG Professor of AIS, Rutgers Business School
Technology consultant, AT&T Labs

22
Outline
• The Real Time Economy– Electronic measurement and reporting (XBRL)
– Monitoring and control
• Continuous Assurance– Continuous data assurance
– Continuous control monitoring
– Continuous risk management and assessment
• Evolving towards the future
2

33
The Real Time Economy

44
Latencies
Business
Process
1
Business
Process
2
Inter-process latency
Outcomes
Decision
latency
Intra-process latency
Time it
takes to
perform a
process
Time it
takes to
pass
informatio
n between
processes
Time it takes for
a decision to
lead to an
outcome
Decision
It may take
time to reach
a decision
Outcome
latency
55
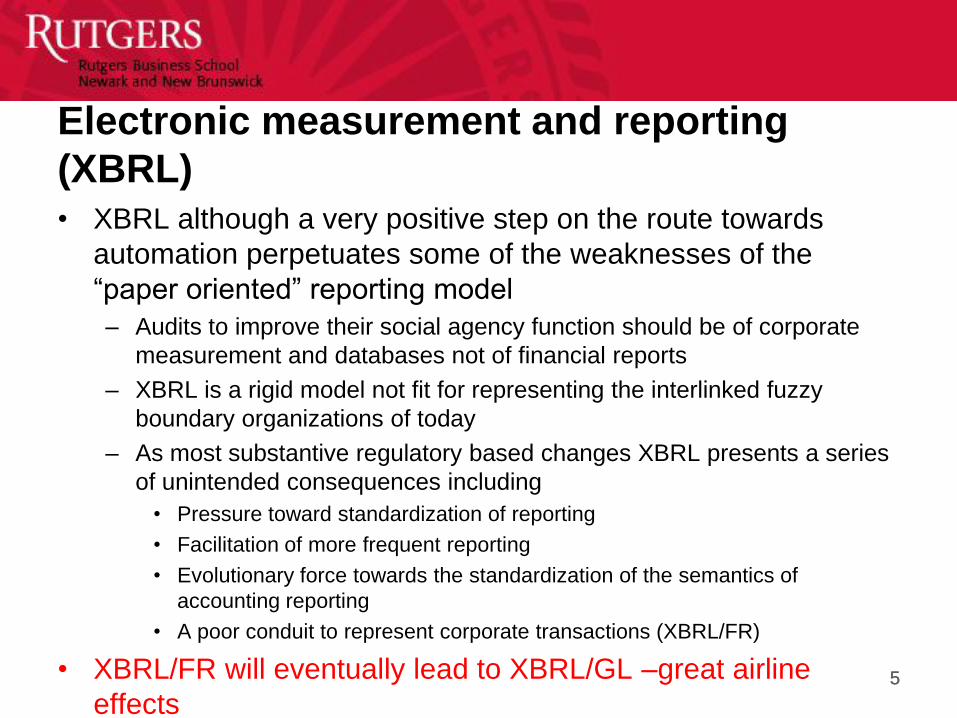
Electronic measurement and reporting
(XBRL)• XBRL although a very positive step on the route towards
automation perpetuates some of the weaknesses of the
“paper oriented” reporting model
– Audits to improve their social agency function should be of corporate
measurement and databases not of financial reports
– XBRL is a rigid model not fit for representing the interlinked fuzzy
boundary organizations of today
– As most substantive regulatory based changes XBRL presents a series
of unintended consequences including
• Pressure toward standardization of reporting
• Facilitation of more frequent reporting
• Evolutionary force towards the standardization of the semantics of
accounting reporting
• A poor conduit to represent corporate transactions (XBRL/FR)
• XBRL/FR will eventually lead to XBRL/GL –great airline
effects
66
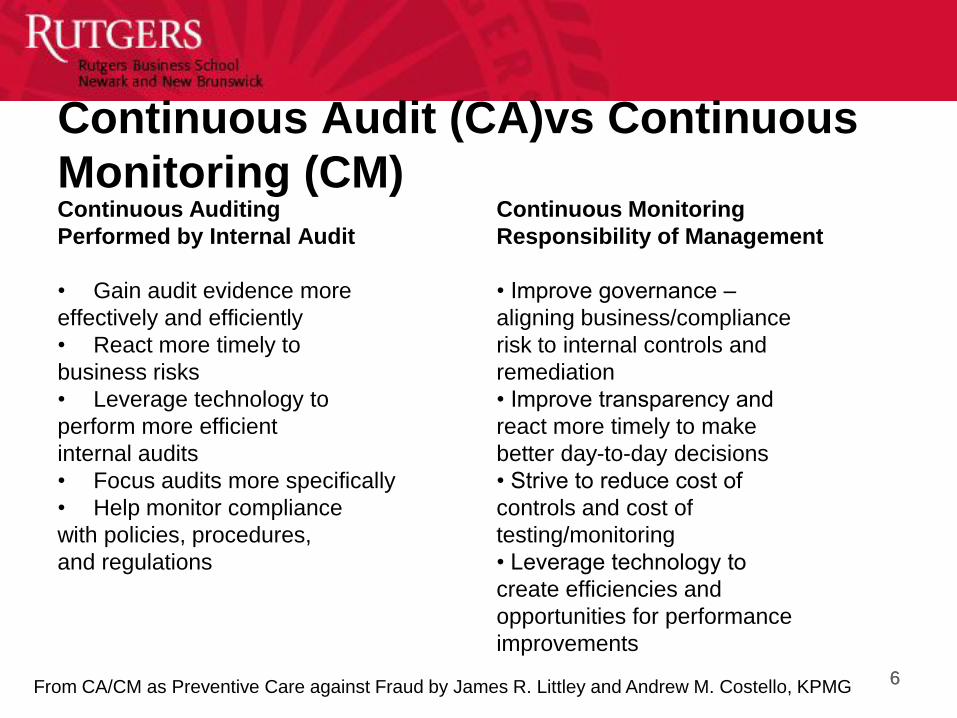
Continuous Audit (CA)vs Continuous
Monitoring (CM)Continuous Auditing
Performed by Internal Audit
• Gain audit evidence more
effectively and efficiently
• React more timely to
business risks
• Leverage technology to
perform more efficient
internal audits
• Focus audits more specifically
• Help monitor compliance
with policies, procedures,
and regulations
Continuous Monitoring
Responsibility of Management
• Improve governance –
aligning business/compliance
risk to internal controls and
remediation
• Improve transparency and
react more timely to make
better day-to-day decisions
• Strive to reduce cost of
controls and cost of
testing/monitoring
• Leverage technology to
create efficiencies and
opportunities for performance
improvements
From CA/CM as Preventive Care against Fraud by James R. Littley and Andrew M. Costello, KPMG

77
• 1. Develop the business case
• 2. Develop a strategy for adoption
• 3. Plan Design and Implementation
• 4. Build and Implement the CM or CA system
• 5. Monitor Performance and Progress, and refine as
needed
7
CA/CM roadmap *
* Deloitte: Continuous monitoring and continuous auditing: from idea to
implementation

88
Five levels of RTE processes
• Business Process
• Measurement of the processes
• Relationship models
• KPI monitoring
• Continuous monitoring and
assurance

95
•Investment
•Regions
•Clients
•Dynamics
•Product
detail
•Regions
•Clients
•Dynamics
•Inventory
•Distribution
•Ownership
•Dynamics
•Collection
•Aging of
receivables
•Clients
•Dynamics
•Drill Down
•History
•Distribution
Data level
Sales change = Incremental Marketing cost * 2.7 +- 12%
E-Care queries = number of sales * 4.1
Delay relationships
Relationship level
Structural level
SalesMarketingA/R
Cash
Bad Debts Provisioning
Inventory
E-Care
Analytic monitoring levelKPIs: Marketing/Sales Ratio
Inventory turnover
Intra-company transfers
•Drill Down
•History
•Distribution
•Drill Down
•History
•Distribution
Continuous Reporting
Continuous Assurance
Transaction assurance, Estimate assurance, Compliance assurance,
Judgment evaluation
Monitoring and Control: 5 levels of activity

1010
Continuous Assurance

111111
An evolving audit framework
Assurance of
Key Processes
Process level
Assurance
•Process reviews a la
Systrust
•Internal or outsourced
•Third party processes
are to become the norm
•Intra and Inter process
controls an issue
Assurance of
Reports
Report level
Assurance
•Compliance reports
becoming commonplace
•Traditional audit is an
instance of RLA
•Generated and modified
by different processes
Assurance of
Data elements
Data level
Assurance
•XML/ XBRL datum
•Generated and modified
by different processes
•Balkanization of data
•Control / Assurance tags
121212
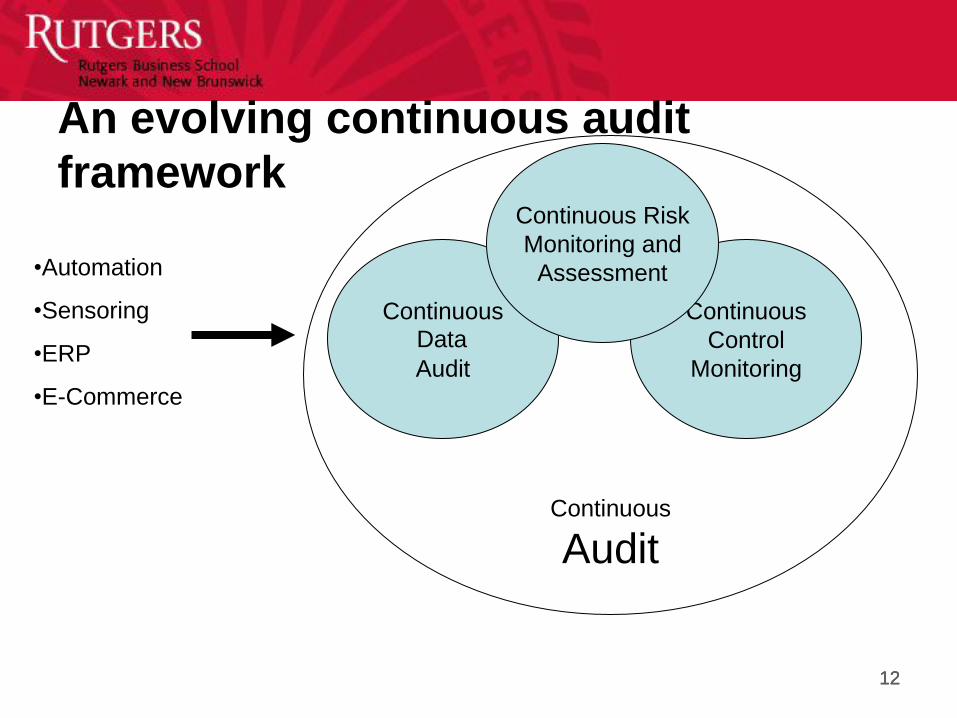
An evolving continuous audit
framework
•Automation
•Sensoring
•ERP
•E-Commerce
Continuous
Audit
Continuous
Control
Monitoring
Continuous
Audit
Data
Continuous Risk
Monitoring and
Assessment

1313
Continuous data assurance

Continuous Process Auditing at AT&T
(1986-1991)

15
CPAS concepts
• metrics
• analytics
• standards:
– of operation
– of variance
– others
• alarms
• measurement vs monitoring

16
CPAS definition
• The Continuous Process Audit System (CPAS) approach can
be defined as a philosophy of auditing that aims to monitor
key corporate processes on a continuous basis, in order to
achieve audit by exception.
17
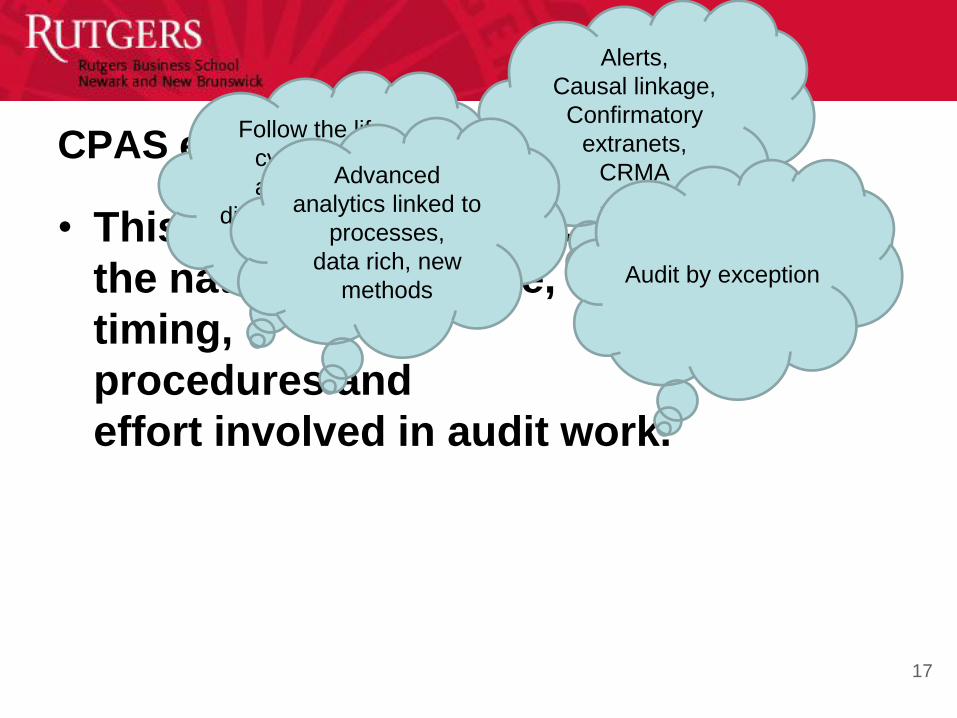
CPAS effort
• This methodology will change
the nature of evidence,
timing,
procedures and
effort involved in audit work.
Alerts,
Causal linkage,
Confirmatory
extranets,
CRMA
Follow the life-
cycle of the
application,
different timing for
different cycles
Advanced
analytics linked to
processes,
data rich, new
methodsAudit by exception

18
Continuity Equations / Long Distance Billing
R e c e iv in g C a ll
d e ta il d a ta fro m
in d e p e n d e n t
te le p h o n e
c o m p a n ie s in
m a g . ta p e s
C re a t in g d a ta se ts
o n e -to -o n e
m a n y-to -m a n y
o n e -to -m a n y '
S p lit t in g c a ll
d e ta il in to
f ile s to b e
p o s te d to
d if fe re n t
b ille rs
P o s t in g f ro m o n e
b ille r f ile to a c c o u n ts
in se v e ra l b illin g
c yc le s
1 2 3 4
R a tin g e a c h
B illa b le
C u s to m e r
5
reservationsflights
Billing colections

CPAS OVERVIEW
System
Operational
Report
Operation
al
Report
Operational
Report
Filter
Database
System Operational Reports
Workstation
DF-level 0Alarm
Data Flow Diagrams
DF-level 1 DF-level 1 DF-level 1
DF-level 2
Reports Analytics Metrics
20
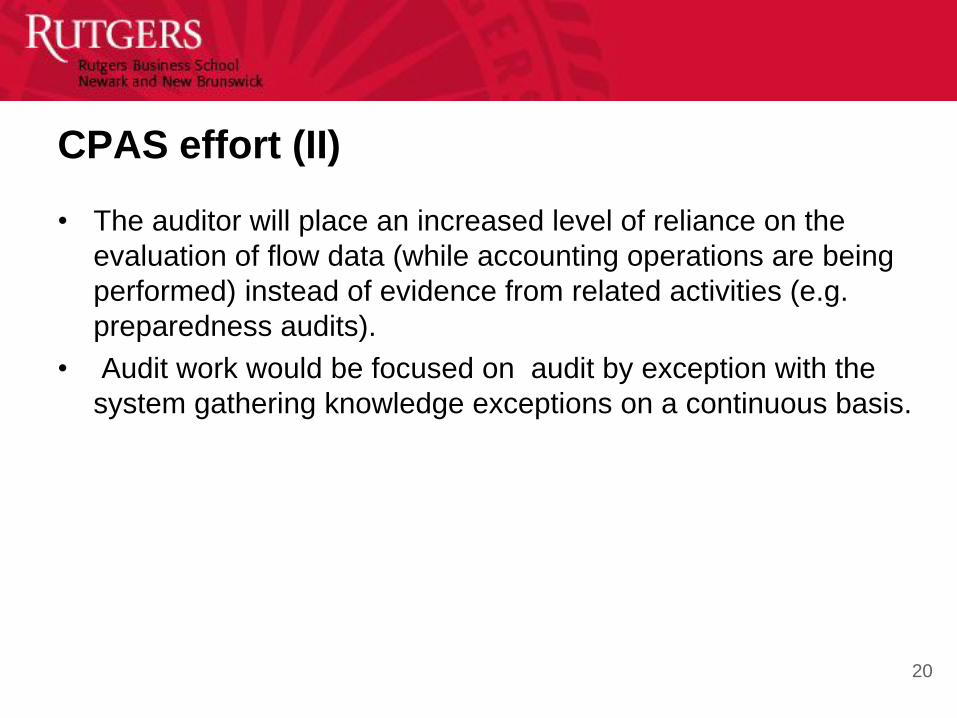
CPAS effort (II)
• The auditor will place an increased level of reliance on the
evaluation of flow data (while accounting operations are being
performed) instead of evidence from related activities (e.g.
preparedness audits).
• Audit work would be focused on audit by exception with the
system gathering knowledge exceptions on a continuous basis.

fer
FlowFront - Interactive Flow Diagram Viewer - AT&T Bell Laboratories - Murray Hill, NJ
Date: 04/01/89 Set Date Recalculate Metrics Recalculating With Check.
Help Text Quit!
FlowFront Hierarchy
Overview
Pay
Inquiry
Billing
Bill Upda
AmtDue
Billing System - Customer Billing Module
Errors
Trans Customer
Database
Extract
Customer
Accounts
Calculate
Amount
Due
Update Billing Info
Journal Files Format Bill Print Bill
Journal FilesAccounts
Missing:
10 Table
Process Errors
1000 1000
998 988
2
0

Trans
Data
fer
FlowFront - Interactive Flow Diagram Viewer - AT&T Bell Laboratories - Murray Hill, NJ
Date:
RPC:
04/01/89
Silver Springs
Set Date Recalculate Metrics Plot Request graph.level 1
Help Text Quit!PE: 60
FlowFront Hierarchy
Overview
Pay
Billing
Inquiry
Errors
Bill Upda
AmtDue
Billing System - Overview
Percent Of Accounts Successfully Billed
S
Graphics
Pe
rce
nt B
ille
d0
20
40
60
8
0
100
10099 99 991009898 97
9598
67
23
85
3/16 3/17 3/18 3/21 3/22 3/23 3/24 3/25 3/28 3/29 3/30 3/31 4/1
Mean: 89.076923076923 StdDev: 21.872591442494
4/1/89Pro
Tra
fernsu
Order
nals CTJ
Cus
fe
FlowFront - Interactive Flow Diagram Viewer - AT&T Bell Laboratories - Murray Hill, NJ
Date:
RPC:
11/27/89
Silver Springs
Set Date Recalculate Metrics Starting S analysis server, please wait...
Help Text Quit!PE: 60
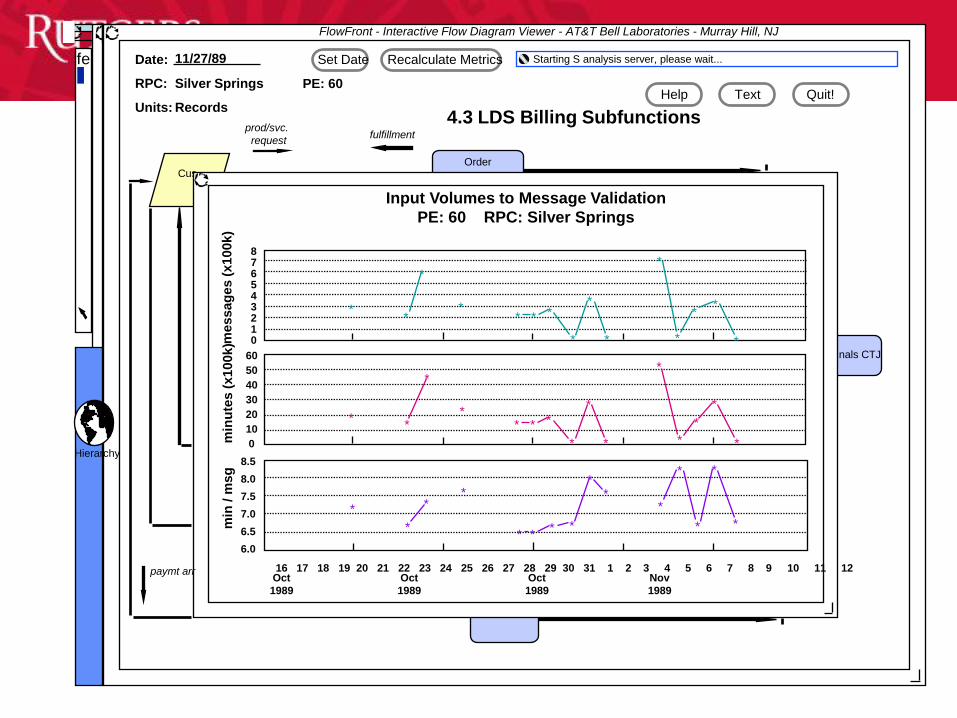
4.3 LDS Billing SubfunctionsUnits: Records
prod/svc.
requestfulfillment
Input Volumes to Message Validation
PE: 60 RPC: Silver Springs
876543210
60
50
40
30
20
10
0
8.5
8.0
7.5
7.0
6.5
6.0
min
/ m
sg
min
ute
s (
x100k)m
essag
es (
x100k)
16 17 18 19 20 21 22 23 24 25 26 27 28 29 30 31 1 2 3 4 5 6 7 8 9 10 11 12Oct
1989
Oct
1989
Oct
1989
Nov
1989
*
*
**
****
**
*
*
*
*
*
**
*
** * *
*
*
*
*
*
*
*
*
**
*
** * *
*
*
*
*
*
**
*
paymt arr
Hierarchy

rejdrop
UpdateOrder
ProcessingGOR TOPAS
fer
FlowFront - Interactive Flow Diagram Viewer - AT&T Bell Laboratories - Murray Hill, NJ
Date:
RPC:
11/27/89
Silver Springs
Set Date Recalculate Metrics Text Request for MPS.cam
Help Text Quit!PE: 60
PayRP
Journal
MsgTr
FlowFront Hierarchy
CAM
MPS. ca
MIU.ca
BNA.r
Toll.m
UCase
NError
CCase
CError
MPFB Flowchart: Message Processing
Functional Level: UPE, RPE
Hierarchical Level: 1
Parent Process: CAM
Primary Source of Information: Business LDS 4.3
Functional and System Process Flows: AT&T End User Profile
1.0 PURPOSE
• To edit messages entering system
• To guide and rate messages
• To reject messages that are in error to the Message
Investigation Unit (MIU)
• To send messages that should be billed in another PE or by
the LEC there via the Returns and Transfer function
2.0 MAJOR INPUTS
• Usage tapes from the Local Exchange Companies
• Independent Telephone Companies (ICOs)
• Recorded Information Collection System (RICS)
• Correct Messages from MIU
• Messages from other parts of the Billing system
• Control Accounts (formerly Auditors Prefix)
3.0 MAJOR OUTPUTS
• Guided and rated messages passed to APE billers for bill
preparation
• Messages sent to other parts of the billing system or returned
to the LEC
• Dropped messages that should be billed in another billing
system
• Errors to MIU
4.0 PROCESSES
S
248773
return, lub, transfer
lub and transfer msgs
EHDB
677951
AT&T
LEC
55626
usag
e usage
Page 1 of 5NEXT PREVIOUS FIRST LAST SAVE QUIT
MPS.CAM

252525
Itau-Unibanco projects
• Branch monitoring through KPIs and
transaction monitoring
• Transitory Accounts
• Product Sales Project
• Implementation considerations
– Hiring a systems integrator
– Effect on downstream systems
– Behavioral changes
Sale Monitoring / Agent
Transitory
accounts
incentives
262626
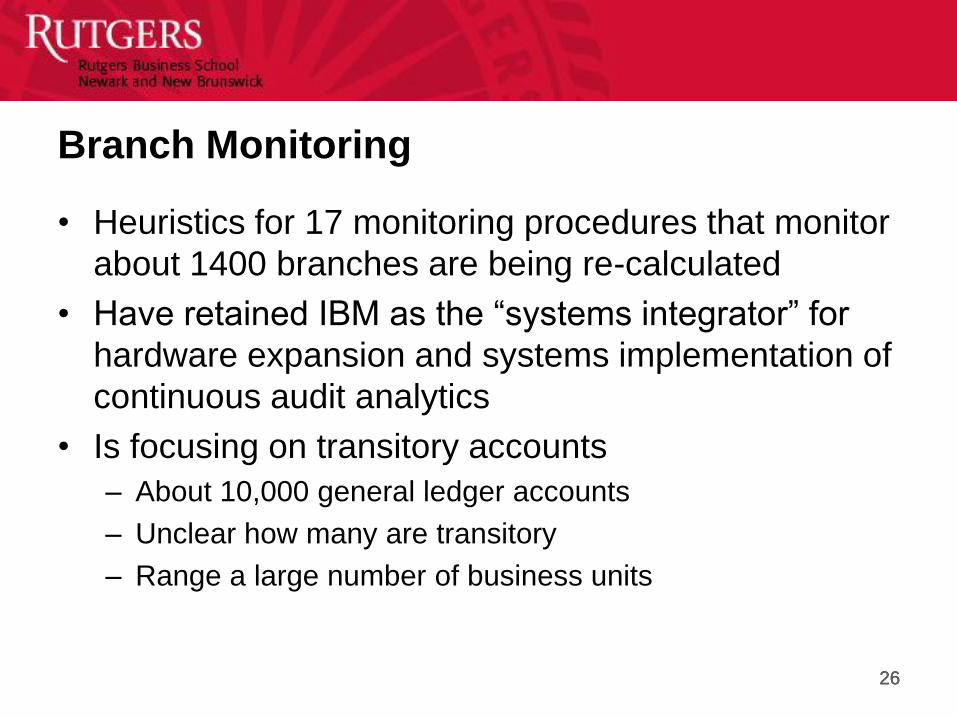
Branch Monitoring
• Heuristics for 17 monitoring procedures that monitor
about 1400 branches are being re-calculated
• Have retained IBM as the “systems integrator” for
hardware expansion and systems implementation of
continuous audit analytics
• Is focusing on transitory accounts
– About 10,000 general ledger accounts
– Unclear how many are transitory
– Range a large number of business units

2727
Unibanco – Some CA Program Features
• Automated monitoring of over 5 million customer accounts on a daily basis using 25 automated procedures to:
– Detect errors
– Deter inappropriate events & behaviors
– Reduce or avoid financial losses
– Help assure compliance with existing laws, policies, norms and procedures
• Examples of “low hanging fruit:”
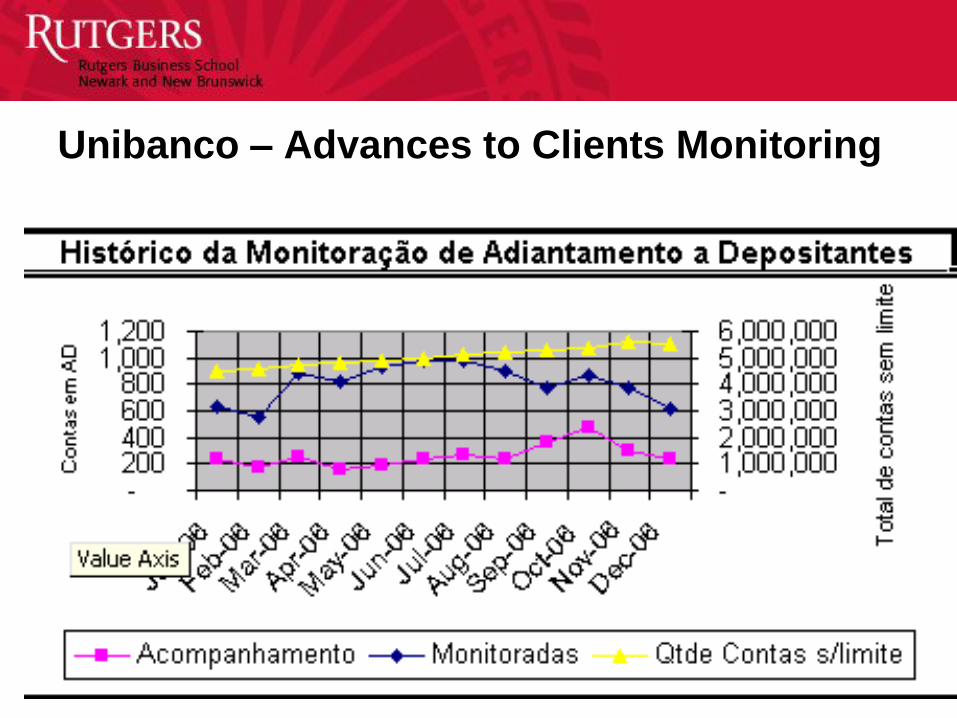
– Customer advances
– Excess over credit limit
– Returned checks
– Federal tax payment cancellations
– TED emissions (should this be omissions?)
2828
Unibanco – Advances to Clients Monitoring
292929
Transitory Accounts
• Level 1
– Analytic review of all accounts
• Level 2
– Monitoring of risky accounts at the mainframe level
• Level 3
– Daily analytics on transactions and generic characteristics of
high risk accounts
– Generic filter to analyze daily transactions of particular accounts
flagged in daily level 2 monitoring
• Level 4 (future)
– Continuity equations and relationships

303030
Overall Quality of each account
Skewed
(skewness > 1)
Peaked
(Kurtosis > 1)
Peaked
(Kurtosis > 1)
Lowest Bound
(e.g., P90)
Normal Bound
(e.g., P99)
Low Bound
(e.g., P95)
N
Y
Y
N
NY
or

3131
Continuous Data Assurance (CDA) at HCA
• HSP is a large national provider of healthcare services, composed of
locally managed facilities that include numerous hospitals and
outpatient surgery centers.
• IT internal audit provided access to unfiltered extracts from their
transactional databases, comprising all procurement cycle daily
transactions from October 1st, 2003 through June 30th, 2004: Over
500,000 data points.
• Dataset mimics what a CDA system has to deal with: highly
disaggregate data flowing through CA system in real time.
• Audit procedures have to be developed for this environment.

3232
Lessons from HCA project
• Intricate processes can and must be monitored
• This may be done at the transaction levels, in
addition to more aggregate levels
• Models are necessary that are adaptive and can
react to current circumstances
• Errors may be automatically corrected
• A tool may be derived from the performed work
that could be superior to existing tools
333333
Metlife
• Data stream of over 200K wire transfers
• Data only currently available for the wires and the records
possess little information
• Little context knowledge of the major feeding streams
• No fraud training data available
• Worked during the audit supplementing the audit team work
• Developed a series of data filters relating to specific
conditions and trends
• Working on an aggregate weighting model
• Need in the field verification of picked data

343434
Metlife (Project 2-3)
• Usage of clustering techniques to
extract aberrations in data in
parallel to the above discussed
effort
• Usage of clustering techniques in
the evaluation of exceptions in life
insurance claims
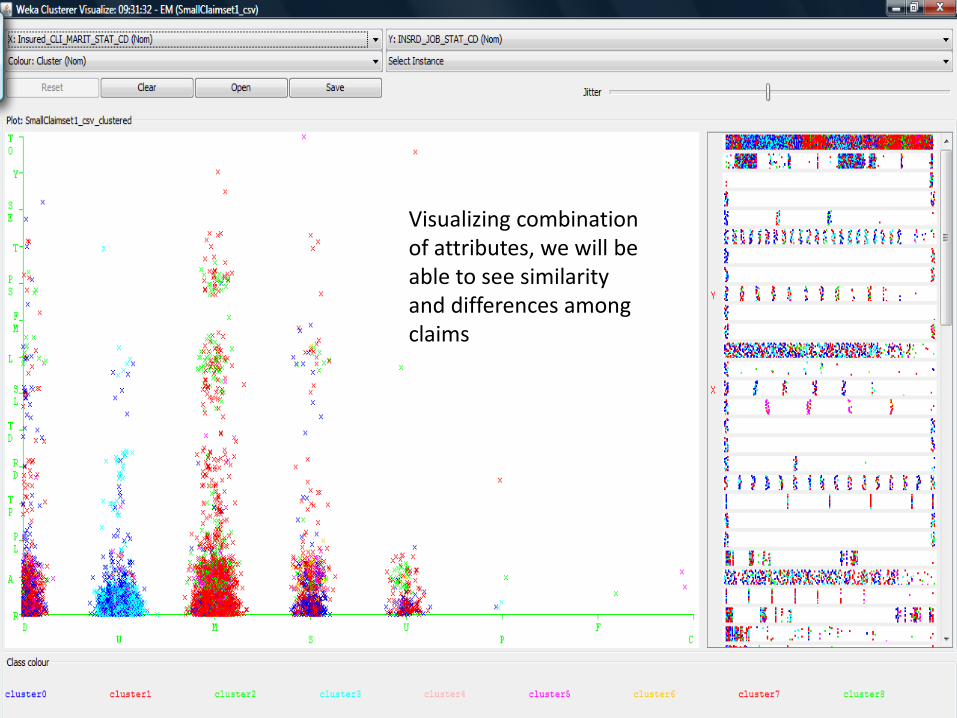
Visualizing combination of attributes, we will be able to see similarity and differences among claims

0.00%
10.00%
20.00%
30.00%
40.00%
50.00%
60.00%
cluster0 cluster1 cluster2 cluster3 cluster5 cluster6 cluster7 cluster8
Cluster by Insured information
POPULATION
663
14000
15500
31000
106103
1023000
Population 22.60% 47.05% 7.21% 17.19% 3.43% 0.64% 1.55% 0.33%
663 28.89% 44.02% 3.84% 20.54% 1.35% 0.45% 0.68% 0.23%
14000 19.02% 50.92% 1.23% 26.99% 1.23% 0.00% 0.00% 0.61%
15500 14.40% 56.27% 2.11% 23.12% 2.38% 0.13% 0.53% 1.06%
31000 56.22% 19.40% 3.98% 16.92% 1.99% 0.00% 1.00% 0.50%
106103 43.27% 35.67% 0.00% 20.47% 0.58% 0.00% 0.00% 0.00%
1023000 4.49% 52.65% 0.82% 39.59% 2.45% 0.00% 0.00% 0.00%
Cluster 0 Cluster 1 Cluster2 Cluster3 Cluster5 Cluster6 Cluster7 Cluster8
We can cluster claims using different group of attributes and flag the claims from specific groups in specific clusters. Several clustering of different groups of attributes can make up the score.
37
P&G (work with the audit innovation team)
• KPI projects
• Automating order to cash
• Vendor files / duplicate
payments
• Risk dashboard
3838
KPI project
• Company has facilities in over 160 countries
• Some facilities are manufacturing, some are pure distribution and sales
• Content is local and world sourced
• Substantive part of the work is building models for inventory and sales
flow and trying to understand / model the level and flow variables
• The objective is to detect out of the normal events both of business and
exception nature (errors and fraud)
• There are 4 large ERPs feeding the data / data is extracted in ACL and
modeled in SAS
• 16 different models have been developed and are being tested

3939
Order to cash project -> selective
automation
• This project aims to selectively automate parts of the audit
using order to cash as the context
– Audit action sheets
– Taxonomization of protocols
– Change of nature of evidence
– Classification of automation level
• Manual
• Deterministic
• Table comparison
• Historical / stochastic
– Architecture of the Structure
– Prototyping of selected models

4040
Continuous control monitoring

414141
Siemens projects
• Focused on audit automation
– First project looked at automating CCM in SAP
– Second project focused on a wider scope of automation
– A third project would think about reengineering the audit action sheets
– The fourth project aims at formalizing SOD, activities, and control structures

4242
The Siemens project learnings
• ERPs are very opaque
• Ratings schema are used and desirable
• 20-40% of the controls may be deterministically monitored
• Maybe other 20-40% may be convertible to be monitorable
• New form of alarm evidence that we do not know how to deal
• Continuous risk management and assessment needed for weighting evidence and choice of procedures

43
Continuous Risk Monitoring and
Assessment
Assurance on Risk Management
44
Increasing emphasis on risk assessment
In compliance with SOX, management must monitor internal controls to ensure that risks are being assessed and handled well.
With ERM companies should identify and manage all risks to achieving its objectives.
In compliance with Basel, banks are required to assess their overall capital adequacy in relation to their risk profile.
Regulatory authorities have encouraged financial institutions to validate their risk-related models to increase the reliability of their risk assessment.
45
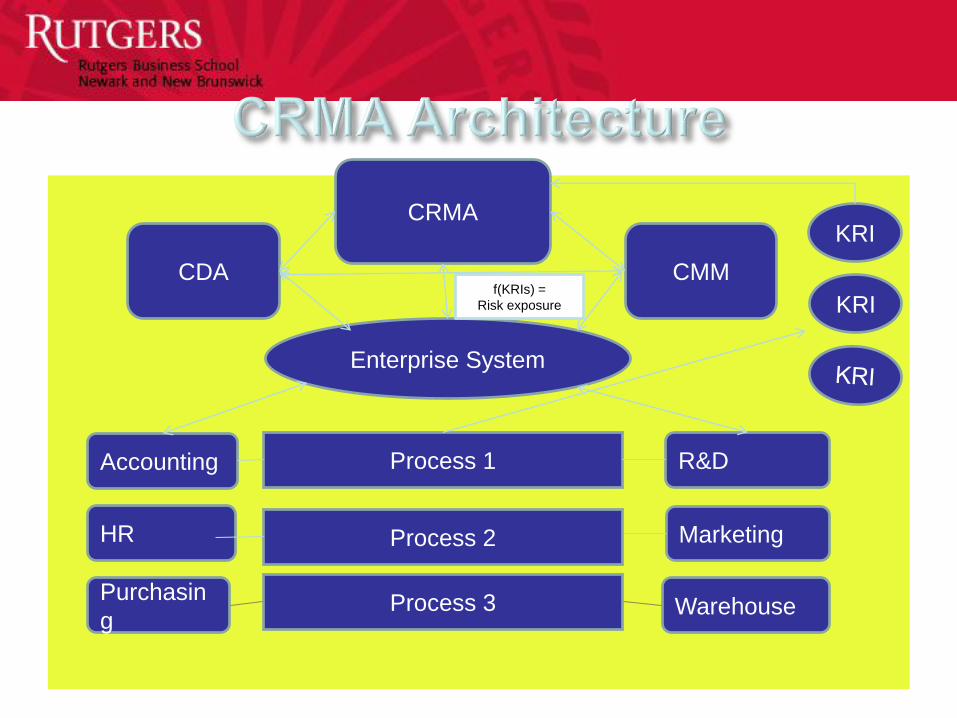
• CRMA is a real time based integrated risk assessment
approach, aggregating data across different functional tasks
in organization to assess risk exposure, providing reasonable
assurance on firm’s risk assessment.
• CRMA continuously computes key risk indicators (KRIs) with firm’s cross-functional data from its key business processes, as well as from external sources and validates them against whether they are linked to the firm’s risk exposure.

46
• KRI provides early warning systems to track the level of risk in the organization
• KRI can be identified through analysis of key business activities– 6 steps for KRI identification (Scandizzo, 2005)
• Well identified and computed KRIs provide a reliable basis for computing the riskiness of firm for specific risk, such operational risk, liquidity risk, as well as the overall riskiness of firm.– f(KRI(i),KRI(ii),…KRI(n))= Risk exposure
– External risk factors may be mapped manually into the computation of KRIs and risk exposure.
47
• Within CRMA, key business processes and risk factors are identified to compute KRIs and risk exposures, and they are continuously monitored.
• CCM monitors violation against business controls and provides assurance on whether controls are followed. This mitigates control KRIs. CRMA continuously monitors changes in control KRIs with CCM, assuring CCM is working.
• CDA validates transaction data and evaluates quality of transactions. This mitigates data management KRIs. CRMA assures CDA is effective by keep monitoring. CDA also helps feeding CRMA with validated transaction data.
48
Marketing
Warehouse
Accounting
HR
Purchasin
g
R&D
Process 3
Process 1
Process 2
Enterprise System
CRMA
CDA CMM
KRI
KRIf(KRIs) =
Risk exposure

4949
Evolving towards the future
5050
Opportunities for research
• Creating Control system measurement and monitoring
schemata
• Creating standards for Business Process Monitoring and
Alarming
• Automatic Confirmation Tools
• Development of a variety of modular Audit bots (agents) to be
incorporated into programs of audit automation
• Creation of alternative real-time audit reports for different
compliance masters
51
Complementary research needs
• Expansion of assurance to non-financial processes to relate
to these through continuity equations (Kogan et al, 2010)
• Standards are needed for CA (CICA/ AICPA, 1999; IIA, 2003;
ISACA 2010)
• Research on the development of complementary assurance
products

52
Reconsideration of concepts and standards
• Independence needs to be re-defined
• The external audit billing model has to be restructured to bill
on function not hours
• Audit firms must put improved knowledge collection and
management processes to feed their audit analytic toolkit
• Audit firms have to engage in auditor automation and pro-
actively promote corporate data collection during-the-process
• Value added must be justified in terms of data quality
• Materiality needs to be redefined

535353
• http://raw.rutgers.edu– A wide range of presentations / videos and papers from
the multiple CA and CR conferences promoted by
Rutgers
• http://raw.rutgers.edu/dubai


