THE BITTER TASTE OF VICTORY:
EFFECTS OF A BITTER TASTING QUININE SOLUTION
ON MAXIMAL INTENSITY EXERCISE PERFORMANCE
Sharon Gam
This thesis is presented for the degree of Doctor of Philosophy at
The University of Western Australia
Faculty of Science
School of Sport Science, Exercise and Health
2014

i
Executive Summary
It is generally acknowledged that for an ergogenic aid administered orally to enhance
exercise performance it must first be absorbed by the gastrointestinal (GI) tract before
exerting its effects. Recently, however, it has been reported that some ergogenic aids can
affect exercise performance without their prior absorption by the GI tract. This is best
illustrated by the many studies which, over the past decade, have shown that rinsing the
mouth with a carbohydrate (CHO) solution, without swallowing it, significantly improves
the performance of endurance exercise, short sprints, and maximal voluntary force
production. These ergogenic effects of CHO mouth rinsing have been attributed to the
activation of the brain by afferent taste signals, but the specific mechanisms by which this
brain activation translates to enhanced exercise performance has not yet been elucidated.
Given the benefits of CHO mouth-rinsing on exercise performance, this raises the issue
of whether other types of tastants, such as bitter tasting solutions, may also improve
exercise performance. For this reason, the purpose of this thesis was to investigate
whether the bitter tastant quinine can improve maximal sprint performance, and, if so, to
examine some of the possible mechanisms whereby this effect may occur.
The first study of this thesis investigated whether mouth rinsing combined with the
ingestion of a bitter tasting quinine solution improves the performance of maximal
cycling sprint in male competitive cyclists. A combined mouth rinse and ingestion
protocol was implemented in this study in order to activate as many bitter taste receptors
(T2Rs) in the oral cavity and remainder of the upper GI tract as possible. Since the effect
of quinine on performance had never been investigated previously, this study was
conducted in two parts. The first part of the study determined the dose response
relationship between quinine concentration and both subjective taste responses and

ii
objective autonomic nervous system (ANS) responses. A 2 mM quinine solution was
chosen since mouth rinsing and ingesting quinine at this concentration significantly
activated measures of ANS function such as skin conductance amplitude, ohmic
perturbation duration, and instantaneous heart rate amplitude without causing significant
feelings of nausea. In order to investigate the effect of quinine on sprint performance, a
group of trained competitive cyclists were asked to rinse their mouth for 10-s and then
ingest either the bitter tasting 2 mM quinine solution, a sweet tasting aspartame solution,
plain water, or no rinse at all (control), with each treatment administered on separate days
following a counterbalanced study design. Immediately after ingesting the solution,
participants performed a maximal 30-s sprint on a cycle ergometer. Mean power output
during the sprint was significantly higher after quinine administration compared with the
other three conditions, and peak power output was higher compared with the water and
control conditions. There were no differences in heart rate, rating of perceived exertion
or blood variables (i.e. blood lactate and glucose) between the four conditions. Since the
sprint was performed immediately after the ingestion of the quinine solution (therefore
not allowing time for the quinine to be absorbed by the gastrointestinal tract), it is likely
that the ergogenic effect of the combination of mouth rinsing and ingestion of quinine on
maximal sprint performance was mediated by taste signals originating from T2Rs in the
oral cavity and upper esophagus, which in turn may have activated the areas of the brain
associated with emotional processing and motor behaviour.
The specific concentration of quinine applied in the above-mentioned study was limited
to 2 mM, since ingesting a stronger quinine solution is very unpleasant and caused
feelings of nausea in some participants. This raises the question of whether a mouth-rinse
only protocol may offer a more practical and less unpleasant way to expose individuals
to the ergogenic benefits of quinine. Before addressing this issue, the optimal

iii
concentration of quinine to be used as a mouth-rinse had to be determined. The second
study of thesis showed that mouth rinsing with a 10 mM quinine solution evoked maximal
activation of measures of ANS function such as skin conductance amplitude, ohmic
perturbation duration, and heart rate amplitude without causing significant feelings of
nausea. Using a 10 mM quinine solution as a mouth rinse, the second study of this thesis
examined its effect on the performance of a 30-s maximal cycling sprint in male
competitive cyclists. To this end, participants rinsed their mouth for 10-s and then
expelled either a 10 mM bitter quinine solution, a sweet glucose solution, water, or were
not given any solution at all (control), with all treatments administered on separate days
following a counterbalanced design, immediately before performing a 30-s maximal
cycling sprint. There were no significant differences in mean or peak power output
between the four conditions. Taken together, the findings of the first two studies of this
thesis suggest that the activation of T2Rs throughout the entire oral cavity and upper GI
tract may be required for quinine to elicit an ergogenic effect. This notion is supported by
the observation that although some T2Rs are found on the anterior portion of the tongue,
they are predominantly expressed at the root of the tongue, an area which may not be
adequately activated by mouth rinsing alone without ingestion.
The specific mechanisms by which the activation of the brain by afferent taste signals
may improve exercise performance remains unclear. One possibility is that taste signals
are able to activate motor areas of the brain through connections from areas associated
with emotional processing, leading to enhanced motor responses. This can be investigated
with the use of transcranial magnetic stimulation (TMS), a non-invasive method to
evaluate corticomotor excitability (i.e. the excitability of neurons in the pathway from the
motor cortex to the muscle). There is some evidence to suggest that CHO mouth rinsing
improves corticomotor excitability, raising the possibility that quinine administration may

iv
also have such an effect. Therefore, the final study of this thesis investigated whether
quinine administration could increase corticomotor excitability, measured using TMS. It
was found that the combination of mouth rinsing and ingestion of the same concentration
of quinine as that used in the first study of this thesis increased corticomotor excitability
compared with baseline measurements taken immediately prior to solution
administration. This observation indicates that the combined mouth rinsing and ingestion
of a bitter quinine solution may improve sprint performance, at least in part, by facilitating
an increase in motor output from the brain to the muscles.
In summary, the results of this thesis demonstrate that mouth rinsing and ingesting a bitter
tasting quinine solution can significantly improve the performance of a maximal cycling
sprint, perhaps through a central effect on emotional and motor areas of the brain,
although mouth rinsing a quinine solution alone, without ingestion, does not affect
performance. Quinine administration could be a useful strategy for improving the
performance of maximal exercise tasks, as well as high intensity periods within longer
endurance exercise bouts such as hill climbs or the final sprint to the finish, although the
latter possibility has not yet been tested. Further research into this area may add to the
understanding of the way the brain integrates signals from the oral cavity with motor
behaviour, as well as uncover novel strategies to improve exercise performance.

v
Statement of Candidate Contribution
The work involved in designing and conducting the studies described in this thesis has
been conducted primarily by Sharon Gam (the candidate). The thesis outline and
experimental design of the three studies were developed and planned in consultation with
Dr Paul Fournier and Dr Kym Guelfi (the candidate’s supervisors) with contributions
from Dr Geoff Hammond in the planning and execution of the third study (Chapter Four).
All participant recruitment and management was carried out by the candidate, along with
the organisation, implementation and collection of data for the experiments. In addition,
the candidate was responsible for all data analysis, and original drafting of the thesis and
peer-reviewed publications. Dr Paul Fournier, Dr Kym Guelfi and Dr Geoff Hammond
(Chapter Four) have provided feedback for further drafts and editing of the thesis and
manuscripts.
This thesis contains published work and work prepared for publication, some of which
has been co-authored. Permission has been granted by Dr Paul Fournier, Dr Kym
Guelfi and Dr Geoff Hammond for the published work to be included in this thesis.
Signed:
_______________________ ________________________
Sharon Gam Dr Paul Fournier
(Candidate) (Coordinating Supervisor)

vi
Table of Contents
Executive summary......................................................................................................... i
Statement of candidate contribution................................................................................ v
Table of contents............................................................................................................. vi
List of tables.................................................................................................................... xiii
List of figures.................................................................................................................. xiv
List of abbreviations........................................................................................................ xvii
Acknowledgements......................................................................................................... xxi
Publications arising from this thesis................................................................................ xxiii
Chapter 1: Literature review............................................................................................ 1
1.1 Introduction....................................................................................................... 2
1.2 Effect of carbohydrate mouth rinsing on relatively short, high intensity
endurance exercise performance.......................................................................
3
1.3 Effect of carbohydrate mouth rinsing on maximal exercise performance........ 10
1.4 Proposed mechanisms for the ergogenic effect of carbohydrate mouth
rinsing................................................................................................................
14
1.4.1 Sweet/carbohydrate taste receptors.................................................. 15
1.4.2 Brain activation in response to taste................................................. 17
1.4.3 Carbohydrate mouth rinsing and functional magnetic resonance
imaging..............................................................................................
19
1.4.4 Carbohydrate mouth rinsing and corticomotor excitability.............. 21
1.5 Carbohydrate mouth rinsing summary.............................................................. 24
1.6 Evidence that bitter taste may affect exercise performance.............................. 25
1.6.1 Bitter taste receptors......................................................................... 25

vii
1.6.2 Expression of bitter taste receptors and bitter responsiveness of
cranial nerves....................................................................................
28
1.6.3 Individual variation in bitter taste perception.................................. 30
1.6.4 Brain activation in response to bitter taste....................................... 32
1.6.5 Brain activation and exercise performance...................................... 33
1.6.6 Bitter taste and the autonomic nervous system................................. 34
1.6.7 Negative brain theory........................................................................ 36
1.6.8 Corticomotor excitability.................................................................. 38
1.6.9 Caffeine mouth rinsing...................................................................... 40
1.7 Conclusions....................................................................................................... 41
1.8 Summary............................................................................................................ 42
1.8.1 Statement of the problem................................................................... 42
1.8.2 Aims................................................................................................... 43
1.8.3 Hypotheses......................................................................................... 43
Chapter 2: Mouth rinsing and ingesting a bitter solution improves sprint cycling
performance.....................................................................................................................
44
2.1 Abstract.............................................................................................................. 45
2.2 Introduction....................................................................................................... 46
2.3 Methods............................................................................................................. 48
2.3.1 Study Part 1: Dose response relationship between quinine
concentration and bitter taste perception and ANS responses..........
48
2.3.1a Participants...................................................................... 48
2.3.1b Experimental design......................................................... 49
2.3.1c Session 1 - Assessment of PROP tasting status................ 49

viii
2.3.1d Session 2 - Assessment of the dose response relationships
between quinine intake and both taste perception and
ANS responses...................................................................
50
2.3.1e Autonomic nervous system measurements........................ 51
2.3.1f Data and statistical analysis............................................. 52
2.3.2 Study Part 2: Effect of quinine administration on sprint
performance.......................................................................................
53
2.3.2a Participants...................................................................... 53
2.3.2b Experimental design......................................................... 53
2.3.2c Initial session.................................................................... 54
2.3.2d Experimental sessions....................................................... 55
2.3.2e Statistical analysis............................................................ 57
2.4 Results............................................................................................................... 57
2.4.1 Study Part 1: Dose response relationship between quinine
concentration and bitter taste perception and ANS responses..........
57
2.4.1a Effect of PROP tasting status on the dose response
relationship between quinine concentration and bitter
taste perception and ANS responses.................................
57
2.4.1b Taste perception responses............................................... 58
2.4.1c Autonomic nervous system responses............................... 62
2.4.1d Determination of the quinine concentration to be used for
Study Part 2.......................................................................
66
2.4.2 Study Part 2: Effect of quinine administration on sprint
performance.......................................................................................
66
2.4.2a Nutritional intake and environmental conditions............. 66
2.4.2b Mean and peak power output........................................... 66

ix
2.4.2c Mean power output between 0 – 10, 10 – 20 and 20 – 30s,
and fatigue index...............................................................
67
2.4.2d PROP tasting and sprint performance............................. 69
2.4.2e Heart rate and blood variables........................................ 69
2.4.2f Subjective ratings............................................................. 69
2.5 Discussion.......................................................................................................... 72
Chapter 3: Mouth rinsing with a bitter solution without ingestion does not improve
sprint cycling performance..............................................................................................
77
3.1 Abstract.............................................................................................................. 78
3.2 Introduction....................................................................................................... 79
3.3 Methods............................................................................................................. 80
3.3.1 Study Part 1: Dose response relationship between quinine
concentration and bitter taste perception and ANS responses..........
80
3.3.1a Participants...................................................................... 80
3.3.1b Experimental design......................................................... 81
3.3.1c Session 1 - Assessment of PROP tasting status................ 81
3.3.1d Session 2 - Assessment of the dose response relationships
between quinine mouth rinsing and both taste perception
and ANS responses............................................................
81
3.3.1e Session 3 – Comparison of the effect of combined mouth
rinsing and ingestion of a 2 mM quinine solution and
mouth rinsing a 10 mM quinine solution on taste
perception and ANS responses.........................................
83
3.3.1f Data and statistical analysis............................................. 83

x
3.3.2 Study Part 2: Effect of quinine mouth rinsing on sprint
performance.......................................................................................
84
3.3.2a Participants...................................................................... 84
3.3.2b Experimental design......................................................... 84
3.3.2c Initial session.................................................................... 85
3.3.2d Experimental sessions....................................................... 85
3.3.2e Statistical analysis............................................................ 86
3.4 Results............................................................................................................... 87
3.4.1 Study Part 1: Dose response relationship between quinine
concentration and bitter taste perception and ANS responses..........
87
3.4.1a Effect of PROP tasting status on the dose response
relationship between quinine concentration and bitter
taste perception and ANS responses.................................
87
3.4.1b Taste perception responses............................................... 87
3.4.1c Autonomic nervous system responses............................... 92
3.4.1d Comparison of the effect of combined mouth rinsing and
ingestion of a 2 mM quinine solution and mouth rinsing
a 10 mM quinine solution on taste perception and ANS
responses..........................................................................
96
3.4.1e Determination of the quinine concentration to be used for
study Part 2.......................................................................
96
3.4.2 Study Part 2: Effect of quinine mouth rinsing on sprint
performance.......................................................................................
98
3.4.2a Nutritional intake and environmental conditions............. 98
3.4.2b 30-s sprint performance.................................................... 98
3.4.2c PROP tasting and sprint performance............................. 100

xi
3.4.2d Heart rate and blood variables........................................ 100
3.4.2e Subjective ratings............................................................. 100
3.5 Discussion.......................................................................................................... 103
Chapter 4: Mouth rinsing and ingestion of a bitter tasting solution increases
corticomotor excitability in male competitive cyclists....................................................
106
4.1 Abstract.............................................................................................................. 107
4.2 Introduction....................................................................................................... 108
4.3 Methods............................................................................................................. 109
4.3.1 Participants....................................................................................... 109
4.3.2 Experimental design.......................................................................... 109
4.3.3 Assessment of PROP tasting status................................................... 110
4.3.4 Transcranial magnetic stimulation................................................... 111
4.3.5 Data and statistical analysis............................................................. 112
4.4 Results............................................................................................................... 113
4.4.1 Effect of order of solution administration and participant group on
MEP amplitude..................................................................................
113
4.4.2 Effect of quinine and water administration on mean MEP
amplitude...........................................................................................
113
4.4.3 Effect of quinine and water administration on MEP amplitude over
time....................................................................................................
116
4.4.4 Prop tasting and MEP amplitude...................................................... 118
4.5 Discussion.......................................................................................................... 118
Chapter 5: General Discussion........................................................................................ 122
5.1 Summary............................................................................................................ 123

xii
5.2 Implications....................................................................................................... 127
5.3 Limitations......................................................................................................... 128
5.4 Directions for future research............................................................................ 130
5.5 Conclusions....................................................................................................... 130
Chapter 6: References...................................................................................................... 132
Appendices...................................................................................................................... 153
Appendix A (Human Ethics Approval Letters)............................................................... 153
Appendix B (Information Sheets and Consent Forms – Study One).............................. 158
Appendix C (Information Sheets and Consent Forms – Study Two).............................. 167
Appendix D (Information Sheets and Consent Forms – Study Three)........................... 176
Appendix E (Perceptual Scales and Instructions)........................................................... 183

xiii
List of Tables
Table 2.1 Mean power (Pmean) and peak power output (Ppeak) during a 30-s
maximal sprint and various periods within the sprint (P0-10, 10-20, 20-30)
after mouth rinsing and ingestion of quinine (QUI), a no-rinse control
(CON), water (WAT) or aspartame (ASP)............................................
68
Table 3.1 Mean power (Pmean) and peak power output (Ppeak) during a 30-s
maximal sprint and various periods within the sprint (P0-10, 10-20, 20-30)
after mouth rinsing with quinine (QUI), a no-rinse control (CON),
water (WAT) or glucose (GLU)............................................................
99

xiv
List of Figures
Figure 1.1 Mechanisms involved in the transduction of sweet taste.............................. 16
Figure 1.2 Central gustatory pathways........................................................................... 18
Figure 1.3 Mechanisms involved in the transduction of bitter taste............................... 27
Figure 1.4 Expression and innervation of bitter taste receptors in the oral cavity......... 29
Figure 2.1 Psychophysical curves in response to mouth rinsing and ingesting quinine
for subjective ratings of taste intensity in all participants and with
participants grouped by PROP tasting status................................................
59
Figure 2.2 Psychophysical curves in response to mouth rinsing and ingesting quinine
for subjective ratings of unpleasantness in all participants and with
participants grouped by PROP tasting status................................................
60
Figure 2.3 Psychophysical curves in response to mouth rinsing and ingesting quinine
for subjective ratings of nausea in all participants and with participants
grouped by PROP tasting status....................................................................
61
Figure 2.4 Psychophysical curves in response to mouth rinsing and ingesting quinine
for the amplitude of the skin conductance response in all participants and
participants grouped by PROP tasting status................................................
63
Figure 2.5 Psychophysical curves in response to mouth rinsing and ingesting quinine
for ohmic perturbation duration in all participants and participants grouped
by PROP tasting status...................................................................................
64
Figure 2.6 Psychophysical curves in response to mouth rinsing and ingesting quinine
for the amplitude of the instantaneous heart rate response in all participants
and participants grouped by PROP tasting status...........................................
65

xv
Figure 2.7
Effect of mouth rinsing and ingesting solutions composed of 2 mM quinine,
plain water, 0.05% w/v aspartame, and a no-solution control condition on
heart rate, blood glucose level and blood lactate level at 5 min pre-exercise,
immediately post-exercise, and 7 min post-exercise......................................
70
Figure 2.8 Effect of mouth rinsing and ingesting solutions composed of 2 mM quinine,
plain water, 0.05% w/v aspartame, and a no-solution control condition on
rating of perceived exertion and nausea score at 5 min pre-exercise,
immediately post-exercise, and 7 min post-exercise......................................
71
Figure 3.1 Psychophysical curves in response to mouth rinsing with quinine for
subjective ratings of taste intensity in all participants and with participants
grouped by PROP tasting status....................................................................
89
Figure 3.2 Psychophysical curves in response to mouth rinsing with quinine for
subjective ratings of unpleasantness in all participants and with participants
grouped by PROP tasting status.....................................................................
90
Figure 3.3 Psychophysical curves in response to mouth rinsing with quinine for
subjective ratings of nausea in all participants and with participants grouped
by PROP tasting status...................................................................................
91
Figure 3.4 Psychophysical curves in response to mouth rinsing with quinine for the
amplitude of the skin conductance response in all participants and
participants grouped by PROP tasting status................................................
93
Figure 3.5 Psychophysical curves in response to mouth rinsing with quinine for ohmic
perturbation duration in all participants and participants grouped by PROP
tasting status..................................................................................................
94
Figure 3.6 Psychophysical curves in response to mouth rinsing with quinine for the
amplitude of the instantaneous heart rate response in all participants and
participants grouped by PROP tasting status................................................
95

xvi
Figure 3.7 Comparison of (a) subjective and (b) ANS responses between mouth
rinsing and ingesting a 2 mM quinine solution and mouth rinsing a 10 mM
quinine solution.............................................................................................
97
Figure 3.8 Effect of mouth rinsing with solutions composed of 10 mM quinine, plain
water, 7.1% w/v glucose, and a no-solution control condition on heart rate,
blood glucose level and blood lactate level at 5 min pre-exercise,
immediately post-exercise, and 7 min post-exercise.....................................
101
Figure 3.9 Effect of mouth rinsing with solutions composed of 10 mM quinine, plain
water, 7.1% w/v glucose, and a no-solution control condition on rating of
perceived exertion and nausea score at 5 min pre-exercise, immediately
post-exercise, and 7 min post-exercise..........................................................
102
Figure 4.1 EMG traces from a representative participant showing raw MEPs recorded
from the dominant FDI muscle before and after the combined mouth rinsing
and ingestion of either a 2 mM bitter quinine solution or plain
water..............................................................................................................
114
Figure 4.2 Mean normalised percent change in MEP amplitude immediately after the
combined mouth rinsing and ingestion of either a 2 mM bitter quinine
solution or plain water...................................................................................
115
Figure 4.3 Mean normalised percent change in MEP amplitude for each single TMS
pulse immediately after the combined mouth rinsing and ingestion of either
a 2 mM bitter quinine solution or plain water.................................................
117

xvii
List of Abbreviations
1-RM One repetition maximum
ACC Anterior cingulate cortex
Ag Silver
ANS Autonomic nervous system
ANOVA Analysis of variance
ASP Aspartame condition/treatment
bpm Beats per minute
°C Degrees Celsius
cAMP Cyclic adenosine monophosphate
CCK Cholecystokinin
CHO Carbohydrate
Cl Chloride
CO2 Carbon dioxide
CON Control condition (no solution)
EMG Electromyographic
ES Effect size
FDI First dorsal interosseous muscle
FI Fatigue index
fMRI Functional magnetic resonance imaging
FO/AI Frontal operculum/anterior insula
GI Gastrointestinal
gLMS General labelled magnitude scale
GLU Glucose condition/treatment
h Hours
HR Heart rate

xviii
Hz Hertz
iTMS Repetitive paired-pulse TMS designed to induce I-wave
facilitation
IHR Instantaneous heart rate
IP3 Inositol 1,4,5-triphosphate
kg Kilograms
kg/m2 Kilogram per square metre
kJ Kilojoules
LIST Loughborough intermittent shuttle test
m Metres
mm Millimetres
M Moles per litre
MEP Motor evoked potential
min Minutes
mL Millilitres
mL/kg/min Millilitres per kilogram per minute
mM Millimoles per litre
ms Milliseconds
MVC Maximal voluntary contraction
MVF Maximal voluntary force
n Number of participants
NaCl Sodium chloride
O2 Oxygen
OFC Orbitofrontal cortex
OPD Ohmic perturbation duration
p Significance level

xix
PET Positron emission tomography
PLC Phospholipase C
Pmean Mean power output
Ppeak Peak power output
P0-10 Mean power output from 0 to 10 seconds
P10-20 Mean power output from 10 to 20 seconds
P20-30 Mean power output from 20 to 30 seconds
PROP 6-n-propylthiouracil
QUI Quinine hydrochloride condition/treatment
rMT Resting motor threshold
NST Nucleus of the solitary tract
RPE Rating of perceived exertion
s Seconds
SC Skin conductance
SD Standard deviation
SEM Standard error of the mean
tDCS Transcranial direct current stimulation
T1R Sweet taste receptor cell
T2R Bitter taste receptor cell
TRC Taste receptor cell
TMS Transcranial magnetic stimulation
µL Microlitres
µS Microsiemens
µV Microvolts
V O2max Maximal rate of oxygen consumption
V O2peak Peak rate of oxygen consumption

xx
W Watts
WAT Plain water condition/treatment
w/v Weight by volume
yr years

xxi
Acknowledgements
I would like to sincerely thank the following people, without whom I would not have been
able to complete this thesis:
Firstly, thank you to my coordinating supervisor, Dr Paul Fournier, for your guidance,
knowledge and enthusiasm. I really appreciate all the time you spent brainstorming with
me in the early stages of this project and thank you for keeping me motivated throughout
this long journey.
Thank you to my co-supervisor, Dr Kym Guelfi, for being so supportive and
encouraging, and for the helpful (and quick!) feedback. Thank you so much for always
being there when I needed advice, and for generally being such a wonderful and caring
person. You’ve really made this whole process much less stressful.
I would also like to thank Dr Geoff Hammond for your assistance with the planning and
execution of my last study. Thank you for taking the time to teach me how to use the
transcranial magnetic stimulator and for your help with the statistical analysis and write-
up of the study. You were very patient and accessible and I learned a lot in our meetings.
I am very grateful to all of my participants for their time and effort in participating in
these studies, especially considering that I asked them to taste some very unpleasant
solutions, perform challenging sprints and let me zap their brains. This research could not
have been completed without them.

xxii
Thank you to all of the staff members, technical staff, front office ladies and postgraduate
students at the School of Sport Science, Exercise and Health for your assistance and for
making this time more enjoyable - the little chats and hellos throughout the day always
made it a little easier to get back to work.
To my family, thank you for your unconditional support, even though you’ve been so far
away. I can’t wait to see you!
Finally, to Judah, thank you so much for your love, patience and understanding, for
distracting me when I needed it and for encouraging me when I was stressed out and
wanted to give up. You have no idea how much your support means to me.

xxiii
Publications arising from this thesis
Peer–Reviewed Publications
Gam, S., Guelfi, K. J., & Fournier, P. A. (2014). Mouth rinsing and ingesting a bitter
solution improves sprint cycling performance. Medicine and Science in Sports and
Exercise, 46(8), 1648-1657. This paper appears in Chapter 2.
Gam, S., Tan, M., Guelfi, K. J., & Fournier, P. A. (2015). Mouth rinsing with a bitter
solution without ingestion does not improve sprint cycling performance. European
Journal of Applied Physiology, 115(1), 129-138. This paper appears in Chapter 3.
Gam, S., Guelfi, K. J., Hammond, G., & Fournier, P. A. (2015). Mouth rinsing and
ingestion of a bitter-tasting solution increases corticomotor excitability in male
competitive cyclists. European Journal of Applied Physiology, doi: 10.1007/s00421-015-
3200-2. This paper appears in Chapter 4.
Conference Proceedings
Gam, S., Tan, M., Guelfi, K. J., & Fournier, P. A. (2014). Mouth rinsing with a bitter
solution without ingestion does not improve sprint cycling performance. 6th Exercise &
Sports Science Australia Conference and Sports Dietitians Australia Update: Research
to Practice. 10-12th April 2014, Adelaide Convention Centre, Adelaide, South Australia,
Australia.
Gam, S., Guelfi, K. J., & Fournier, P. A. (2014). Mouth rinsing and ingesting a bitter
solution improves sprint cycling performance. American College of Sports Medicine 61st
Annual Meeting, 5th World Congress on Exercise is Medicine® and World Congress on
the Role of Inflammation in Exercise, Health and Disease 27-31st May 2014, Orange
County Convention Center, Orlando, Florida, USA.

1
Chapter One Literature Review

Chapter One – Literature Review
2
1.1 Introduction
In recent years, several studies have reported that rinsing the mouth with a carbohydrate
(CHO) solution, without ingesting it, can significantly improve exercise performance
(Carter et al., 2004b; Rollo et al., 2008; 2010; Chambers et al., 2009; Gant et al., 2010;
Jeukendrup & Chambers, 2010; Pottier et al., 2010; Fares & Kayser, 2011; Beaven et al.,
2013; Lane et al., 2013; Muhamed et al., 2014; Sinclair et al., 2014). Although the
mechanisms underlying this ergogenic effect remain unclear, it has been suggested that it
may be mediated by the activation of taste receptor cells (TRCs) by the presence of CHO
in the oral cavity. These receptors send signals to the brain, activating areas which may
alter perception of effort, motivation and arousal, as well as influence descending motor
output, thereby improving performance (Carter et al., 2004b; Chambers et al., 2009; Gant
et al., 2010). The improvement in exercise performance by the activation of CHO-
sensitive taste receptors raises the question of whether the activation of TRCs by other
taste stimuli, namely a bitter tastant, can also improve exercise performance. The effect
of bitter taste on exercise performance has never been previously investigated, although
there is some indirect evidence that bitter taste may have the potential to benefit
performance. This evidence includes imaging studies that have demonstrated the
activation of similar areas of the brain in response to sweet and bitter taste (Zald et al.,
2002; Small et al., 2003), as well as studies that have found the largest and longest lasting
autonomic nervous system (ANS) activation in response to bitterness compared with
other types of tastants including sweet, salty and sour (Rousmans et al., 2000; Robin et
al., 2003). This review of the literature will provide an overview of studies on CHO mouth
rinsing and exercise performance, detail the possible mechanisms associated with this
ergogenic effect, and provide evidence that bitter taste may also have the capacity to
improve exercise performance.

Chapter One – Literature Review
3
1.2 Effect of carbohydrate mouth rinsing on relatively short, high intensity
endurance exercise performance
It is well established that the ingestion of CHO during prolonged, moderate intensity
endurance exercise (≥ 2 h, 60-75% V O2max) improves performance (Coggan & Coyle,
1991), likely through the maintenance of high rates of CHO oxidation (Arkinstall et al.,
2001), along with a decrease in the rate of muscle glycogen utilisation to spare it for later
use (Bosch et al., 1996), although not all studies have shown a performance benefit via
the latter mechanism which may be affected by the type of exercise (Cermak & van Loon,
2013). CHO ingestion during relatively short, high intensity endurance exercise (≤ 1 h, >
75% V O2max) also improves performance (Jeukendrup et al., 1997). However, the
mechanism responsible for this improvement is unlikely to be related to the metabolic
effects of CHO since endogenous CHO does not limit this type of exercise (Hawley et
al., 1997). In support of this notion, Carter and colleagues (2004a) showed that the
intravenous infusion of glucose did not improve 1-h cycling time trial performance
despite increased CHO availability, suggesting that CHO can exert a non-metabolic,
central effect on exercise performance. The use of a CHO mouth rinse is an effective way
to test this theory, since the expulsion of the solution after mouth rinsing prevents the
CHO from being absorbed in the gut to contribute to a metabolic effect. An improvement
in exercise performance with the use of a CHO mouth rinse can therefore be attributed to
a central (non-metabolic) effect of CHO.
The ergogenic effect of CHO mouth rinsing was first demonstrated in a study by Carter
and colleagues (2004b), in which nine endurance-trained cyclists (seven men and two
women) performed a 1-h time trial during which they were given either a 6.4%
maltodextrin solution (CHO) or water (placebo) to rinse in the mouth for 5-s at every
12.5% of the trial completed. CHO was provided in the form of maltodextrin to minimise

Chapter One – Literature Review
4
the possibility of a placebo effect as a 6.4% maltodextrin solution does not taste sweet for
most individuals. A significant 2.9% improvement in performance time was observed in
the CHO mouth rinse trial compared with the water placebo. Likewise, mean power
output was significantly higher in the CHO trial compared with the placebo. Despite this
higher power output, rating of perceived exertion (RPE; Borg, 1982) and heart rate were
similar between trials. These researchers proposed that the presence of CHO in the oral
cavity may have activated reward or pleasure centres in the brain, thereby reducing the
perception of effort of the exercise. This may improve performance by allowing
participants to exercise at a higher intensity for the same amount of perceived fatigue or
discomfort.
The finding that mouth rinsing a non-sweet CHO solution improved time trial
performance raised questions as to the role of sweetness in the ergogenic effect of CHO
mouth rinsing. Chambers and colleagues (2009) addressed this issue by adding artificial
sweetener to two CHO mouth rinse solutions (one containing glucose and the other
containing maltodextrin) to match their taste with that of an artificially sweetened placebo
solution. In this study, a group of eight male endurance-trained cyclists completed a 1-h
cycling time trial during which they rinsed their mouth for 10-s at every 12.5% of the trial
completed with either a 6.4% glucose solution or a placebo containing a mixture of the
non-caloric sweeteners aspartame and saccharin. A separate group of eight endurance-
trained cyclists (six men and two women) performed the same time trial with either 6.4%
maltodextrin mouth rinses (artificially sweetened to match the taste of the placebo) or an
aspartame/saccharin mouth rinse placebo. Both of the caloric CHO solutions improved
performance compared with the artificially sweetened placebo, despite there being no
differences in the perceived taste between the CHO solutions and the placebo. More
specifically, a significant 2.0% improvement in time to completion was observed with the

Chapter One – Literature Review
5
glucose rinse compared with the placebo trial. Likewise, a significant 3.1% improvement
in time to completion was observed in the maltodextrin trial compared with the placebo.
Together, these findings suggest that the ergogenic effect of rinsing the mouth with CHO
is not mediated by the sweetness of the mouth rinse. Instead, Chambers and colleagues
(2009) proposed that oral receptors may exist which are sensitive to some characteristic
of CHO (possibly the caloric content) independent of sweetness.
These early CHO mouth rinse studies provided evidence that exercise performance can
be improved by the activation of oral CHO receptors. However, it is important to note
that in addition to the oral cavity, taste receptors are also found in extra-oral structures
throughout the gastrointestinal (GI) tract (Rozengurt & Sternini, 2007). The activation of
these extra-oral taste receptors may help explain the previously mentioned finding that
CHO ingestion (without mouth rinsing) improves short (≤ 1h) high intensity endurance
exercise performance in which the availability of endogenous CHO is not a limiting factor
(Jeukendrup et al., l997). In order to directly compare the effect of CHO mouth rinsing
with CHO ingestion, Pottier et al. (2010) recruited twelve endurance-trained triathletes
who performed four separate 1-h cycling time trials. In two of the trials, participants
rinsed their mouth for 5-s (but did not ingest) at every 12.5% of the time trial completed
with either a CHO-electrolyte solution (Gatorade) or a taste-matched, non-caloric placebo
containing aspartame. In the other two trials, participants ingested (but did not rinse) the
same CHO-electrolyte or placebo solutions at the same time points. CHO mouth rinsing
resulted in a significant 3.7% improvement in performance compared with placebo mouth
rinsing, while CHO ingestion did not improve performance compared with placebo
ingestion. The authors speculated that the ergogenic effect of the CHO mouth rinse was
related to the duration for which the solution was kept in the mouth, with the lack of effect
in the ingestion condition perhaps a result of insufficient time to activate TRCs in the oral

Chapter One – Literature Review
6
cavity. This possibility was examined in a study by Rollo et al. (2011) in which ten male
endurance-trained runners performed three 1-h treadmill runs. A solution was
administered before and at 15-min intervals during each run, which was composed of a
6.4% CHO-electrolyte solution (Lucozade) on two occasions and an artificially
sweetened, taste-matched placebo on one occasion. Participants either mouth rinsed the
CHO solution for 5-s before ingesting it, mouth rinsed the CHO solution for 5-s without
ingestion, or mouth rinsed (5-s) and ingested the placebo solution, so that the oral
exposure time was the same in all three conditions. The combined mouth rinsing and
ingestion of the CHO solution significantly improved total distance covered compared
with both mouth rinsing alone and mouth rinsing and ingesting the placebo solution. CHO
mouth rinsing alone did not significantly improve performance compared with the
placebo condition. The authors suggested that the ingestion of fluid in the placebo
condition (which may have tempered the effects of dehydration) may have been related
to the lack of ergogenic effect observed with CHO mouth rinsing alone, since in previous
studies the placebo solutions have been expelled rather than ingested.
The results of Pottier et al. (2010) and Rollo et al. (2011) suggested that the time for which
the solution is held in the mouth is important in eliciting an ergogenic effect. To further
investigate this issue, Sinclair et al. (2014) recruited eleven male recreational cyclists who
performed 30-min of self-paced cycling on three occasions with mouth rinses
administered every 6 min. Participants either rinsed their mouth for 5-s with water to
serve as a placebo, rinsed their mouth for 5-s with a 6.4% maltodextrin solution, or rinsed
their mouth for 10-s with the same maltodextrin solution. Distance cycled was
significantly greater (approximately 6%) in the 10-s condition compared with placebo,
but there was no significant difference between the 5-s rinse and placebo. These results

Chapter One – Literature Review
7
indicate that there may be a dose response to the duration of mouth rinsing, with a 10-s
mouth rinse duration being more effective at improving endurance exercise performance.
Another important factor that has been investigated in CHO mouth rinse research over
the last few years is the issue of the nutritional status of the participants. Initial CHO
mouth rinse studies reporting benefits were performed with participants in a fasted state
(ranging from 3 h to overnight; Carter et al., 2004b; Rollo et al., 2008; Chambers et al.,
2009; Pottier et al., 2010). Beelen et al. (2009) investigated whether a similar effect would
be observed if the exercise test was performed 2 h after participants (fourteen male
endurance-trained cyclists) consumed a standardised breakfast containing approximately
2.4 g/kg of CHO. Under these conditions, CHO mouth rinsing with a 6.4% maltodextrin
solution did not improve 1-h cycling time trial performance compared with a water
placebo. This indicates that CHO mouth rinsing may not be effective in improving
performance when participants are in a post-prandial state, which likely replicates an
actual competitive situation. However, a limitation of this study is that it did not directly
compare the effect of CHO mouth rinsing in post-prandial state with a fasted state.
This limitation was addressed in a study by Lane et al. (2013) which found that CHO
mouth rinsing significantly improved 1-h cycling time trial performance in twelve male
competitive cyclists who commenced the time trials in either a fed (2 h after consuming
a standardised breakfast containing approximately 2.5 g/kg of CHO) or overnight fasted
state. The performance enhancement was 3.4% in the fasted state and 1.8% in the fed
state compared with mouth rinsing with an artificially sweetened placebo solution in a
corresponding fed or fasted state. This provides evidence that CHO mouth rinsing can
improve endurance exercise performance even in a practical, post-prandial state, although
the magnitude of the performance improvement may be greater in a fasted state. The

Chapter One – Literature Review
8
discrepancy between the studies of Lane et al. (2013) and Beelen et al. (2009) may be
related to the concentration of the solutions employed and the duration of mouth rinsing.
The CHO solutions in both studies were composed of maltodextrin, however Lane and
colleagues used a more concentrated solution (10% maltodextrin) compared with that
used by Beelen and colleagues (6.4% maltodextrin). In addition, participants in Lane et
al. (2013) rinsed the solution in their mouth for 10-s compared with 5-s in Beelen et al.
(2009). This supports the findings of Sinclair et al. (2014) that the duration of mouth
rinsing may be important in eliciting the central activation required to elicit an ergogenic
effect.
Further evidence for a beneficial effect of CHO mouth rinsing in a fed state comes from
the study of Fares and Kayser (2011), in which thirteen non-athletic males (as opposed to
the endurance-trained athletes recruited in most CHO mouth rinse studies) performed four
cycling time-to-exhaustion tests at 60% of maximal power output in either fed or fasted
states with the use of either a 6.4% CHO mouth rinse or a water placebo. Similar to Lane
et al. (2013), CHO mouth rinsing in this study improved endurance performance in both
a fed (3% increase in time to exhaustion) and fasted state (7% increase) with the greatest
improvement in performance observed in the fasted state. Given the suggested central
effect of CHO mouth rinsing, this dampening of the ergogenic effect in fed participants
may be related to a decrease in the activation of brain areas associated with the emotional
processing of gustatory stimuli (measured using functional magnetic resonance imaging;
fMRI) when participants are fed to satiety (Kringelbach et al., 2003).
An important limitation of the aforementioned studies is that none included a no-rinse
control condition in order to determine whether the act of rinsing the mouth itself has a
detrimental effect on performance, possibly by interrupting the athlete’s concentration or

Chapter One – Literature Review
9
by interrupting the breathing cycle. Gam and colleagues (2013) addressed this issue by
comparing the effect of CHO mouth rinsing with both a placebo water condition, as well
as a no-rinse control condition during 1-h cycling time trials in ten male cyclists. This
study found that time trial performance decreased by 2.7% when participants rinsed their
mouth with plain water at intervals throughout the time trial compared with the no-rinse
condition. The addition of CHO to the rinse solution returned performance to the level
achieved in the no-rinse condition, with a trend for improved performance. Accordingly,
this study indicates that while CHO mouth rinsing does appear to have an ergogenic effect
on endurance exercise, a proportion of this effect serves to oppose the detrimental effect
of the act of mouth rinsing itself. Previous studies therefore have likely overestimated the
magnitude of the CHO mouth rinse-mediated improvement in performance when the
mouth rinse protocol is employed during (rather than immediately prior to) an exercise
bout.
It is important to note that not all studies have demonstrated an ergogenic effect of CHO
mouth rinsing on high intensity endurance exercise performance. Whitham and
McKinney (2007) recruited seven recreationally active males to perform 2 running time
trials in which they completed a 15 min preload at 65% of V O2peak before a 45-min self-
paced time trial on a treadmill. Participants rinsed their mouth for 5-s with either a
combination of 6% maltodextrin and 3% lemon juice solution or a 3% lemon juice
placebo at the start of the preloading run phase and every 6 min of both the preload and
time trial. There were no differences in distance covered during the time trials between
conditions. The non-significant results in this study were attributed to the lack of
sensitivity of the equipment, given that participants had to manually adjust the speed of
the treadmill. Since the central effect of CHO mouth rinsing is likely to produce subtle,
unconscious changes, a test which requires conscious adjustment of pace may not be

Chapter One – Literature Review
10
sensitive enough to detect an effect. Indeed, a study by Rollo et al. (2008) had participants
perform similar running time trials using an automated treadmill which allowed for the
spontaneous selection of speeds without manual input. Participants ran a significant 1.7%
farther when they mouth rinsed a 6% maltodextrin solution for 5-s every 5 min during the
time trial compared with mouth rinsing with an artificially sweetened placebo. This
indicates the importance of selecting an appropriately sensitive testing method in order to
be able to detect the small but significant changes in performance associated with CHO
mouth rinsing.
1.3 Effect of carbohydrate mouth rinsing on maximal exercise performance
Given the evidence that CHO mouth rinsing may improve relatively high intensity
endurance exercise performance (through the activation of brain areas associated with
reward or motivation; Carter et al., 2004b), some researchers have suggested that CHO
mouth rinsing may also be effective at improving the performance of other types of
exercise which might benefit from increased central drive and motivation, such as those
requiring maximal efforts. Accordingly, a number of recent studies have investigated the
effect of CHO mouth rinsing on maximal sprint exercise, maximal voluntary force
production and strength (Gant et al., 2010; Chong et al., 2011, 2014; Painelli et al., 2011;
Beaven et al., 2013; Bortolotti et al., 2013; Dorling & Earnest, 2013; Phillips et al., 2014).
Chong et al. (2011) were the first to investigate the effect of CHO mouth rinsing on the
performance of a single maximal sprint effort. In this study, fourteen male competitive
cyclists rinsed their mouth for 5-s with either a 6.4% maltodextrin solution, a 7.1%
glucose solution matched for energy content with the maltodextrin solution, plain water,
or did not rinse their mouth at all (control) immediately before performing a maximal 30-
s sprint on a cycle ergometer. There were no differences in sprint performance between

Chapter One – Literature Review
11
the four conditions. The authors suggested that perhaps a single 5-s CHO mouth rinse did
not provide a sufficient stimulus to improve performance, especially given that the total
oral exposure time of the CHO solutions in endurance exercise studies was 40-80 s (Carter
et al., 2004b; Rollo et al., 2008; Chambers et al., 2009). To investigate whether multiple
CHO mouth rinses (and therefore a total oral exposure time comparable to that of the
endurance exercise studies) would produce an ergogenic effect, Phillips et al. (2014)
administered 8 x 5-s mouth rinses to twelve physically active men prior to a maximal 30-
s cycling sprint. The mouth rinses were composed of either 6% maltodextrin or an
artificially sweetened placebo, and were given once every 2 min before the sprint effort.
Peak power output was significantly improved by 2.3% compared with the placebo.
However, this initial improvement may have come at a cost to the performance of the
remainder of the sprint, with a trend towards lower mean power output for the duration
of the sprint in the CHO compared with the placebo condition.
The finding that a single 5-s CHO mouth rinse did not improve maximal sprint
performance (Chong et al., 2011) and that increasing the oral exposure time of the
solution improved only one aspect of sprint performance (Phillips et al., 2014) suggests
that perhaps even greater activation of CHO receptors (through the combined stimulation
of receptors in the oral cavity as well as in the GI tract) is necessary to elicit the strong
stimulus required to improve overall sprint performance. Chong et al. (2014) investigated
whether the activation of receptors throughout the oral cavity with the use of repeated
mouth rinses, as well as the activation of receptors in the GI tract, could improve maximal
sprint performance. Twelve male competitive cyclists ingested 100 mL of either a 10%
glucose solution, a 0.05% aspartame solution, a 9.0% maltodextrin solution, or plain
water followed 15 min later by repeated 5-s mouth rinsing and ingestion of 11 boluses of
the corresponding solution over a 5 min period. Immediately after the repeated mouth

Chapter One – Literature Review
12
rinses, participants performed a 45-s maximal cycling sprint. Peak power output was 9-
16% higher in the glucose condition compared with the other three conditions, and there
was a strong trend towards an increase in mean power output in the glucose condition
compared with the other three conditions. The authors speculated that the ergogenic effect
may have been mediated by the activation of glucose-sensitive taste receptors in the GI
tract in combination with those in the oral cavity.
While the evidence is limited, Chong et al. (2014) demonstrated that CHO mouth rinsing
may have the capacity to improve the performance of a single bout of maximal sprint
exercise. This raises the issue of whether CHO mouth rinsing could be beneficial for other
types of sprint exercise, such as repeated sprints. In order to investigate whether CHO
mouth rinsing improves the performance of repeated sprints, Beaven et al. (2013)
recruited twelve recreationally-trained men who rinsed their mouth for 5-s with either a
6% glucose solution or a taste-matched artificially sweetened placebo (composed of
saccharin) immediately before the performance of each sprint in a series of 5 x 6-s cycling
sprints with 24-s of active recovery between sprints. Peak and mean power output was
significantly higher in the initial sprint following the administration of the CHO solution
compared with the placebo. However, a decrease in performance of the subsequent sprints
was observed in the CHO condition, with significantly lower mean and peak power output
in the final sprint in the series compared with the placebo. In contrast, Bortolotti et al.
(2013) observed no effect of mouth rinsing on the performance of a series of overground
sprints. These researchers recruited nine youth soccer players to perform six 40-m sprints
interspersed with 20-s of passive recovery. Participants rinsed their mouth for 10-s with
either a 6% maltodextrin solution or a non-caloric taste-matched placebo at 5 min prior
to the start of the exercise test as well as immediately before the test. There was also a
control condition in which no mouth rinse was administered. Similarly, Dorling and

Chapter One – Literature Review
13
Earnest (2013) found no improvement in the performance of three repeated sprint ability
tests or a Loughborough Intermittent Shuttle Test (LIST), which involved 15-min sections
of intermittent shuttle running over a 20-m distance, when eight active male participants
rinsed their mouth for 5-s with either a 6.4% maltodextrin solution or a taste-matched
placebo before each repeated sprint ability test and each section of the LIST.
In regards to other forms of maximal exercise, two studies have examined the effect of
CHO mouth rinsing on voluntary muscle force production (Gant et al., 2010; Painelli et
al., 2011), with differing results. Painelli et al. (2011) recruited twelve recreationally
strength-trained men to complete a maximal strength test (1-RM) and a strength
endurance test using a bench press exercise. Participants rinsed their mouth for 10 to 15-
s with either a 6.4% dextrose solution or a taste-matched artificially sweetened placebo
(composed of aspartame) immediately prior to each attempt in the 1-RM test and
immediately before each set in the strength endurance test. There were no significant
differences in 1-RM between conditions, and no significant difference in the number of
repetitions performed in each set or the total exercise volume in the strength endurance
test. The authors speculated that the CHO mouth rinse stimulus was insufficient to affect
maximal strength performance since strength-trained individuals may be able to activate
the available pool of motor neurons to a great extent, with little to no neural activation
deficits which rinsing could improve (Ahtiainen & Hakkinen, 2009).
Gant et al. (2010) investigated whether mouth rinsing and ingesting a CHO solution could
immediately increase maximal voluntary force production during a fatiguing elbow
flexion exercise. Sixteen healthy male participants completed an isometric elbow flexion
task for 30 min which required them to maintain a contraction at 15% of their maximal
voluntary force, interspersed with 2 to 3-s maximal isometric contractions performed

Chapter One – Literature Review
14
every 2 min. Immediately prior to one of the maximal contractions, participants rinsed
their mouth for 15-s and then ingested either a 0.4 g/kg maltodextrin solution or a taste-
matched placebo. A significant 2% increase in maximal elbow flexion force was observed
in the CHO condition compared with the placebo. This ergogenic effect was attributed to
central activation by afferent taste signals which may have increased descending drive to
the muscle. The discrepancy in results between this study and that of Painelli et al. (2011)
may be attributed to differences in the participant population (Painelli and colleagues
recruited strength-trained men while the participants in Gant et al. [2010] were described
as ‘healthy young males’), as well as the strength test used. A compound, multi-joint
exercise was employed by Painelli and colleagues, while a single-joint, isometric exercise
was used by Gant and colleagues. More research is needed to clarify the effect of CHO
mouth rinsing on maximal strength and force production.
1.4 Proposed mechanisms for the ergogenic effect of carbohydrate mouth rinsing
The precise mechanisms by which CHO mouth rinsing enhances exercise performance
are unclear. Given that CHO mouth rinsing improves exercise performance without
increasing heart rate or RPE (Carter et al., 2004b; Chambers et al., 2009), it has been
suggested that the activation of certain areas of the brain by afferent taste signals may
reduce the perception of effort of the exercise, allowing participants to exercise at a higher
intensity for the same amount of perceived fatigue or discomfort, or alter the motivation
or arousal of the participant (Carter et al., 2004b; Chambers et al., 2009). Others have
suggested that afferent taste signals may have the capacity to affect the motor system and
possibly increase descending drive to the muscle (Gant et al., 2010). These possibilities
will be discussed in further detail below.

Chapter One – Literature Review
15
1.4.1 Sweet/carbohydrate taste receptors
The ergogenic effect of CHO mouth rinsing has been suggested to originate from the
activation of TRCs in the oral cavity (Carter et al., 2004b; Chambers et al., 2009). Sweet
taste receptors, which identify the presence of nutritionally valuable, CHO rich foods,
belong to a class of G-protein coupled taste receptors named T1Rs. There are three
different types of T1Rs; T1R1, T1R2 and T1R3, with T1R2 and T1R3 functioning
together to detect sweetness (Kinnamon, 2012). Once a tastant binds to the T1R2/T1R3
receptor, intracellular taste transduction is activated (Figure 1.1), starting with the
coupling of the T1R to the G-protein gustducin.
There appears to be more than one sweet taste transduction mechanism depending on
whether the tastant is composed of a natural sugar or a synthetic sweetener. In the case of
sugar, gustducin activates a cyclic nucleotide cascade, leading to an increase in cyclic
adenosine monophosphate (cAMP), membrane depolarisation and calcium uptake. In
contrast, the binding of a synthetic sweetener leads to the activation of phospholipase C
(PLC), causing a rise in inositol-1,4,5-trisphosphate (IP3) which in turn elevates cystolic
calcium concentration to stimulate transient receptor potential channel 5. These
transduction mechanisms result in a change in membrane currents which produces action
potentials, the release of neurotransmitters, and the subsequent excitation of cranial
nerves innervating the oral cavity, including the vagus, glossopharyngeal and chorda
tympani branch of the facial nerve (Lindemann, 2001; Kinnamon, 2012).

Chapter One – Literature Review
16
Figure 1.1 Mechanisms involved in the transduction of sweet taste. R, T1R receptor(s);
AC, adenylate cyclase; cAMP, cyclic adenosine monophosphate; PDE,
phosphodiesterase; CAM, calmodulin; PKA, protein kinase A; PLC, phospholipase C;
DAG, diacylglycerol; IP3, inositol-1,4,5-trisphosphate; PKC, protein kinase C (adapted
from Lindemann, 2001).

Chapter One – Literature Review
17
It is important to note that non-sweet, caloric CHO such as maltodextrin have the capacity
to improve exercise performance while sweet, non-caloric artificial sweeteners do not
have such an effect (Carter et al., 2004b; Chambers et al., 2009). This suggests that an, as
yet unidentified, class of taste receptors may exist which are sensitive to the caloric value
of food, regardless of sweetness. In support of this notion, there is evidence for the
existence of a T1R3-independent taste receptor in mice which may be responsive to
caloric value independent of sweetness (Delay et al., 2006). It is possible that a similar
type of receptor exists in humans which may be related to the effect of non-sweet CHO
mouth rinsing on exercise performance.
1.4.2 Brain activation in response to taste
Once taste transduction is activated, information from the cranial nerves innervating the
oral cavity converges in the nucleus of the solitary tract (NST) of the medulla, which is
the primary visceral sensory nucleus of the brainstem (de Araujo & Simon, 2009). NST
fibers project directly to the ventroposterior medial nucleus of the thalamus, which then
relays information to several other brain areas, including the frontal operculum and
adjoining anterior insula (FO/AI) which is the primary gustatory cortex located in the
cerebrum (Kelley et al., 2005). The FO/AI codes for the intensity of the taste stimulus
and projects to, among other areas, the orbitofrontal cortex (OFC) which is known as the
secondary gustatory cortex and codes for the hedonic and motivational aspects of taste
stimuli (Rolls et al., 2010). Gustatory information also reaches structures in the limbic
system, including the amygdala, anterior cingulate cortex (ACC), striatum and
hypothalamus (Scott, 2010; Figure 1.2). These limbic structures are implicated in
processing the emotional significance of taste and have connections to other areas of the
brain which play a role in preparing the body to respond to emotional stimuli. The
activation of these limbic structures may have implications for exercise performance,

Chapter One – Literature Review
18
perhaps influencing the perception of effort or motivation and thereby eliciting an
ergogenic effect.
Figure 1.2 Central gustatory pathways. ACC, anterior cingulate cortex; FO/AI, frontal
operculum/anterior insula; NST, nucleus of the solitary tract; OFC, orbitofrontal cortex.
Highlighting: Yellow, relay of neural signals; Grey, gustatory cortices; Blue, emotional
responses; Purple, autonomic responses; Green, conscious perception; Red, behaviour.
Chapter One – Literature Review
19
1.4.3 Carbohydrate mouth rinsing and functional magnetic resonance imaging
In order to investigate the specific areas of the brain which may contribute to the
ergogenic effect of a CHO mouth rinse, Chambers et al. (2009) performed fMRI scans
while resting participants rinsed their mouth for 10-s with either an 18% glucose solution,
an 18% maltodextrin solution or a saccharin solution (artificial sweetener) matched in
taste (sweetness) to the glucose solution. Several brain areas were activated by the glucose
solution including the FO/AI, OFC, and the dorsolateral prefrontal cortex which is
involved in high level cognitive processing (Kringelbach et al., 2004). Two limbic
structures were also activated: the striatum and ACC. The striatum is generally associated
with the processing of pleasurable or rewarding stimuli (Jensen et al., 2003), while the
ACC is associated with emotional or motivational processing (Bush et al., 2000), as well
as autonomic regulation to meet behavioural demands (Critchley et al., 2003). In
comparison, the saccharin solution activated the FO/AI as well as the dorsolateral
prefrontal cortex. but did not activate the striatum or ACC, despite being matched for
taste to the glucose solution to ensure there were no significant differences in perceived
sweetness or perceived pleasantness between solutions. The differences in brain
activation were therefore attributed to the caloric value of the glucose solution compared
with the saccharin solution. Brain areas activated by the non-sweet maltodextrin solution
included the FO/AI, the dorsolateral prefrontal cortex, the OFC, striatum and ACC. In
comparison with glucose, only the dorsal part of the ACC was not activated by the
maltodextrin solution, which was rated significantly less sweet and less pleasant
compared with the glucose solution. These findings support the view that CHO mouth
rinsing may improve performance by activating areas of the brain (specifically within the
limbic system) which may influence perception of effort, motivation or arousal.
Importantly, these brain areas are activated by caloric CHO regardless of sweetness, but
not by a non-caloric artificial sweetener. This may assist in explaining why caloric CHO

Chapter One – Literature Review
20
solutions have been shown to improve exercise performance, while artificially sweetened
solutions do not have such an effect. However, it is important to note that this study was
performed with participants at rest, so it is unclear whether comparable brain activation
would be observed in response to CHO mouth rinsing during an exercise bout.
In a step towards addressing this issue of possible differences between brain activation in
resting versus exercising participants, Turner et al. (2014) investigated the effects of CHO
mouth rinsing on brain activation while participants performed an exercise task. These
researchers conducted fMRI scans while participants mouth rinsed a 14.8% maltodextrin
solution (CHO), a taste-matched, energy-free placebo, or a control solution consisting of
the principal ionic components of saliva, both at rest and while performing a pinch-grip
task. The task required participants to squeeze a pinch-grip force dynamometer to produce
10% of maximum pinch-grip force when prompted by a visual cue. The solutions did not
produce any differences in cortical activation when participants were at rest. However,
during the motor task, the CHO solution produced greater activation in the FO/AI and
anterior cingulate gyrus compared with the control solution. The latter finding of
increased activation in the anterior cingulate gyrus in the CHO condition is in agreement
with Chambers et al. (2009), that taste signals have the capacity to influence the limbic
system. The CHO solution also produced greater activation in the supplementary motor
cortex compared with the control solution. The supplementary motor cortex receives
inputs from the ACC, has strong connections to the primary motor cortex (Morecraft &
Van Hoesen, 1992), and is responsible for the preparation and initiation of movement
(Nachev et al., 2008), thus providing a functional link for the limbic system to impact
motor behaviour. Compared with the placebo solution, the CHO solution also produced
greater activation in regions involved in visual perception. The novel finding of increased
activation in the supplementary motor cortex indicates that oral CHO may also prime

Chapter One – Literature Review
21
sensorimotor pathways, perhaps leading to increased motor output and thereby an
improvement in performance. The other novel finding of greater activation in regions
involved in visual perception with the CHO rinse, led the authors to speculate that oral
CHO administration may prime some cortical networks involved in visual perception,
enhancing the early processing of visual information.
1.4.4 Carbohydrate mouth rinsing and corticomotor excitability
Given the evidence that CHO mouth rinsing activates the supplementary motor area
(Turner et al., 2014), it is possible that the ergogenic benefit of CHO mouth rinsing to
performance may be mediated, at least in part, by the effects of afferent taste signals on
the motor system. In support of this notion, Gant and colleagues (2010) used transcranial
magnetic stimulation (TMS) to examine the effect of CHO mouth rinsing on corticomotor
excitability. TMS is a non-invasive, painless and safe method for activating neurons in
the brain and, when applied over the primary motor cortex, can be used to assess the
integrity of neurons in the pathway between the motor cortex and muscle (Reis et al.,
2008). When a TMS pulse is applied, short-latency responses in a target muscle can be
recorded using electromyography (EMG). These responses are called motor evoked
potentials (MEPs), the amplitude of which reflects the excitability of neurons in the
corticomotor pathway. These responses occur in resting, as well as actively contracted
muscles, with the latter MEPs being larger (Di Lazzaro et al., 2008).
The study of Gant et al. (2010) involved two experiments to assess the effect of CHO
mouth rinsing on corticomotor excitability using TMS. The first experiment had a group
of sixteen healthy men complete a 30-min fatiguing isometric elbow flexion task. This
task required participants to maintain an isometric elbow flexion at 15% of maximal
voluntary force (MVF) for 30 min, interspersed with 2 to 3-s maximal voluntary

Chapter One – Literature Review
22
contractions (MVCs) performed every 2 min. Immediately prior to the MVC at min 11,
participants rinsed their mouth for 15-s and then ingested either a CHO drink containing
0.4 g/kg of maltodextrin or an energy-free placebo drink that was matched for taste using
an artificial sweetener. Single-pulse TMS was applied over the area of the primary motor
cortex controlling the biceps brachii during each MVC to examine changes in motor
cortical excitability during maximal contractions, especially as fatigue set in. MEP
amplitude during the MVC at min 11 (immediately after the mouth rinse) was normalised
to MEP amplitude in the preceding MVC (at min 9) to assess post-rinse MEP amplitude
compared with pre-rinse amplitude. Immediately after CHO rinsing and ingestion, there
was a significant 30% increase in MEP amplitude, with no significant change after
placebo ingestion.
In the second experiment, seventeen healthy volunteers (men and women) rinsed their
mouth with the same solutions as those employed in the first experiment without ingesting
them. TMS was applied over the area of the primary motor cortex controlling the first
dorsal interosseous (FDI) muscle of the dominant hand. Two trials were performed with
each mouth rinse solution, one while the FDI was relaxed and the other while the FDI
was isometrically contracted, with each trial comprising two blocks. In the first block, 12
MEPs were recorded while participants rinsed their mouth with plain water, and then
another 12 MEPs were recorded while participants rinsed their mouth with the CHO or
placebo solutions. Mean MEP amplitudes from the CHO or placebo block were
normalised to mean MEP amplitude in the corresponding period of water rinses. While
MEP amplitudes were similar between conditions in the relaxed muscle, there was a
significant 9% increase in MEP amplitude in the CHO mouth rinse condition compared
with the placebo condition when the FDI was contracted. These results indicate that the
presence of CHO in the mouth has the capacity to facilitate corticomotor output. The

Chapter One – Literature Review
23
authors suggested that the beneficial effect of the CHO mouth rinse was most likely due
to activation of receptors in the mouth producing afferent activity in cranial nerves which
may in turn influence descending motor activity, perhaps through descending motor
tracts.
While Gant and colleagues’ (2010) results provide an interesting insight into the effects
of CHO mouth rinsing on the corticomotor pathway, there are some methodological
aspects of this study which warrant discussion. A well-known issue in TMS studies is the
large trial-to-trial variation in MEP amplitude within individuals, even if the stimulus
parameters are kept constant. This variation has been attributed to spontaneous
fluctuations in motoneuron membrane potentials at both a cortical and spinal level (Kiers
et al., 1993; Rosler et al., 2008). While MEP variability is lower during voluntary muscle
contraction than in resting muscle (Kamen, 2004), this variability still represents a
significant methodological issue, even with maximal muscle contraction. For this reason,
it is common practice to record several MEPs (at least 10 MEPs are generally
recommended) at a given stimulus intensity and take the mean MEP amplitude as an
indicator of corticomotor excitability (Kiers et al., 1993; McDonnell et al., 2004). Gant
and colleagues (2010) recorded one MEP during each maximal voluntary contraction in
their first experiment, and therefore it is possible that within-subject variation in MEP
amplitude may have affected the results. In their second experiment, Gant and colleagues
normalised the mean MEP amplitude (from 12 recorded MEPs in each trial) while
participants rinsed their mouth with the CHO or placebo solution to the mean MEP
amplitude recorded while participants rinsed their mouth with plain water. This may not
represent a true baseline as it does not allow for assessment of the possibility that rinsing
the mouth with water in itself may affect MEP amplitude. Given that tasting and
swallowing water has been shown to activate areas of the brain including somatosensory

Chapter One – Literature Review
24
and nearby gustatory cortices, as well as some limbic structures (Zald & Pardo, 2000), it
is possible that activation of these areas may have modified corticomotor excitability in
response to water.
It is also important to note that these mechanistic studies were performed with participants
either at rest or performing relatively simple motor tasks involving single joints or
muscles, rather than whole body exercise as in the performance studies. Given the
extremely complex nature of the brain’s regulation of exercise performance, these results
must be interpreted cautiously. They do, however, give an interesting insight into the
possible central effects of CHO and how this may translate into improved exercise
performance.
1.5 Carbohydrate mouth rinsing summary
Based on the results of the aforementioned studies, CHO mouth rinsing appears to have
the capacity to improve relatively short, high intensity endurance exercise, generally with
a performance improvement of between 2-4% compared with placebo mouth rinse
solutions. Mechanistic studies have found that CHO mouth rinsing activates brain areas
associated with reward or motivation which may alter the perception of effort of the
exercise or the motivation or arousal of the participant, allowing for an increase in
exercise intensity for the same amount of fatigue or discomfort. In the case of maximal
exercise, the results are less clear. Of the six studies which have investigated the effect of
CHO mouth rinsing on maximal sprint exercise, three have found no effect on
performance. Of the other three studies, two have observed a performance improvement
at the beginning of the exercise bout, but this may have come at a cost to the performance
of the remainder of the exercise. Only one study has demonstrated a clear performance
improvement. In regards to other types of maximal exercise, CHO mouth rinsing has been

Chapter One – Literature Review
25
shown to improve maximal force production in a single-joint elbow flexion exercise, but
not a multi-joint bench press exercise. A mechanistic study on the effect of CHO mouth
rinsing on the motor system indicates that taste signals have the capacity to influence
descending motor drive, which may improve maximal exercise performance.
1.6 Evidence that bitter taste may affect exercise performance
Given the evidence that the presence of CHO in the mouth can influence exercise
performance through signals generated from TRCs which are sent to various areas of the
brain, it is possible that other classes of tastants, namely bitter taste, may also improve
exercise performance. Indirect evidence to support this possibility comes from brain
imaging studies which have demonstrated similar activation of brain areas involved in
emotional processing in response to both sweet and bitter tastants, as well as studies which
have measured ANS activation in response to different tastes. The following section will
give an overview of bitter taste receptors and transduction, provide evidence that bitter
taste activates the brain, and propose some possibilities for how this brain activation may
translate to improved exercise performance.
1.6.1 Bitter taste receptors
Bitter taste is detected by a class of G-protein coupled receptors known as T2Rs. T2Rs
comprise a family of approximately 25-30 receptors in mammals, each of which binds to
one or more bitter compounds (Meyerhof et al., 2011). Of the five basic tastes, bitter taste
appears to be the most complex, as evidenced by the ability of a small group of T2Rs to
recognise thousands of structurally diverse bitter compounds (Brockhoff et al., 2010).
This ability to recognise a large number of bitter compounds is thought to be the result of
differences in individual T2R ligand binding pockets, with each T2R generally
responding to several different bitter compounds on the basis of structural differences.
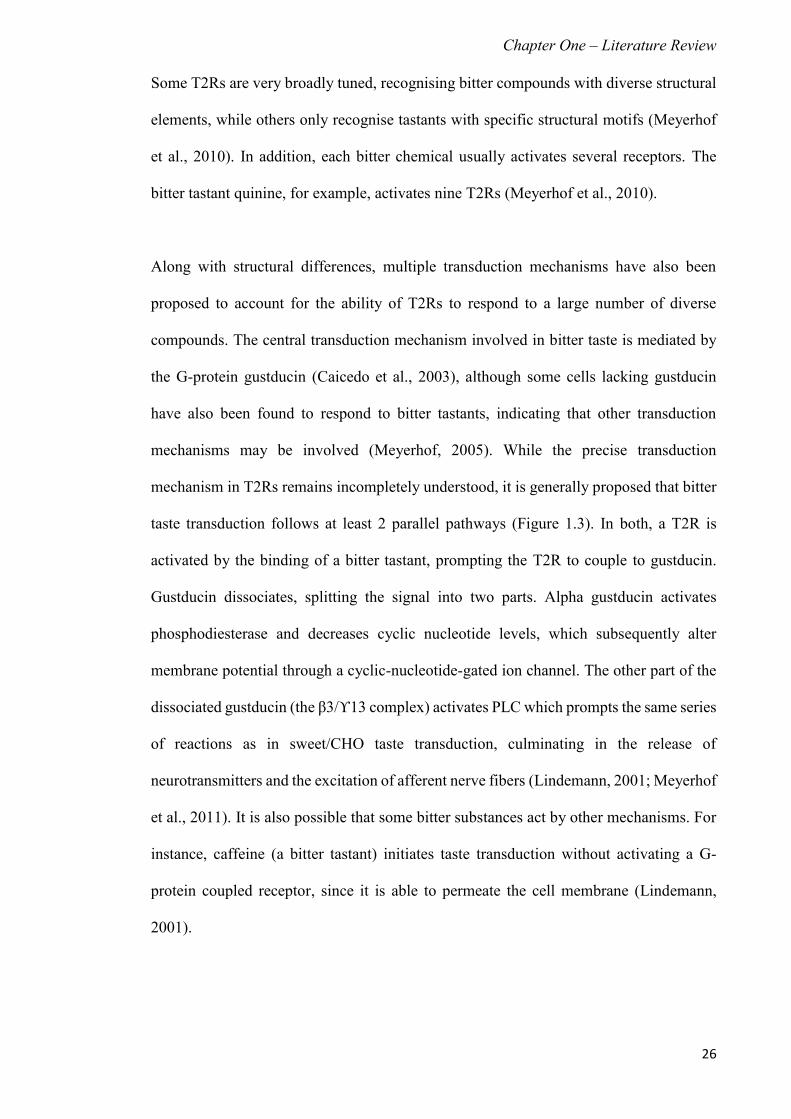
Chapter One – Literature Review
26
Some T2Rs are very broadly tuned, recognising bitter compounds with diverse structural
elements, while others only recognise tastants with specific structural motifs (Meyerhof
et al., 2010). In addition, each bitter chemical usually activates several receptors. The
bitter tastant quinine, for example, activates nine T2Rs (Meyerhof et al., 2010).
Along with structural differences, multiple transduction mechanisms have also been
proposed to account for the ability of T2Rs to respond to a large number of diverse
compounds. The central transduction mechanism involved in bitter taste is mediated by
the G-protein gustducin (Caicedo et al., 2003), although some cells lacking gustducin
have also been found to respond to bitter tastants, indicating that other transduction
mechanisms may be involved (Meyerhof, 2005). While the precise transduction
mechanism in T2Rs remains incompletely understood, it is generally proposed that bitter
taste transduction follows at least 2 parallel pathways (Figure 1.3). In both, a T2R is
activated by the binding of a bitter tastant, prompting the T2R to couple to gustducin.
Gustducin dissociates, splitting the signal into two parts. Alpha gustducin activates
phosphodiesterase and decreases cyclic nucleotide levels, which subsequently alter
membrane potential through a cyclic-nucleotide-gated ion channel. The other part of the
dissociated gustducin (the β3/ϒ13 complex) activates PLC which prompts the same series
of reactions as in sweet/CHO taste transduction, culminating in the release of
neurotransmitters and the excitation of afferent nerve fibers (Lindemann, 2001; Meyerhof
et al., 2011). It is also possible that some bitter substances act by other mechanisms. For
instance, caffeine (a bitter tastant) initiates taste transduction without activating a G-
protein coupled receptor, since it is able to permeate the cell membrane (Lindemann,
2001).

Chapter One – Literature Review
27
Figure 1.3 Mechanisms involved in the transduction of bitter taste. R, GCPRs of the T2R
family; α, α-subunit of gustducin; βγ, G-protein subunits β3 and γ13; PLCβ2,
Phospholipase C subtype; IP3, inositol-1, 4, 5-triphosphate; PDE, taste-specific
phosphodiesterase; cAMP, cyclic adenosine monophosphate; cGMP, cyclic guanosine
monophosphate; sGC, soluble guanylate cyclase; NO, nitric oxide; NOS, NO synthase
(adapted from Lindemann, 2001).

Chapter One – Literature Review
28
1.6.2 Expression of bitter taste receptors and bitter responsiveness of cranial nerves
With respect to the oral cavity, an important aspect of the processing of bitter taste is that
papillae (specialised folds and protrusions containing groups of taste buds) in different
regions of the oral cavity exhibit variable expression of T2Rs (Travers & Geran, 2009;
Figure 1.4). Animal studies have shown that T2R expression in the circumvallate papillae
(which form a v-shaped line across the root of the tongue) is much higher than in the
fungiform papillae (which are scattered on the anterior tongue; Adler et al., 2000;
Chandrashekar et al., 2000; Sugita & Shiba, 2005). In humans, Behrens et al. (2007)
observed strong T2R expression in the circumvallate papillae but failed to find any T2R
expression in the fungiform papillae. Since humans can detect bitter stimuli on the
anterior tongue, these authors suggested that perhaps only a subset of human fungiform
taste buds express T2Rs. In addition to differences in T2R expression between lingual
papillae, the cranial nerves innervating the oral cavity also appear to respond differentially
to bitter stimuli. Animal studies have provided evidence that the glossopharyngeal nerve
which innervates the circumvallate papillae is more responsive to bitter stimuli than the
chorda tympani nerve innervating the fungiform papillae (Hellekant et al., 1997; Danilova
& Hellekant, 2003; Geran & Travers 2006; 2011). This distribution and innervation
pattern of T2Rs in the oral cavity makes sense in the context that bitter taste perception
evolved as a protective mechanism, preventing the ingestion of potentially toxic or
harmful substances (Meyerhof, 2005). Increased bitter perception at the back of the oral
cavity may serve as the last line of defense against the ingestion of such substances.

Chapter One – Literature Review
29
Figure 1.4 Expression and innervation of bitter taste receptors in the oral cavity. T2R,
bitter taste receptor

Chapter One – Literature Review
30
T2Rs have also been found in extra-oral structures including the epiglottis, soft palate and
upper esophagus (Adler et al., 2000), as well as in the intestinal cells of rodents and
humans (Chen et al., 2006; Rozengurt, 2006; Jeon et al., 2008; Kaji et al., 2009). T2Rs in
the gut are thought to be responsible for intestinal chemical sensing (Kaji et al., 2009). In
support of this notion, Chen et al. (2006) found that two bitter tastants (denatonium
benzoate and phenylthiocarbamide) induced calcium increases in intestinal cells. The
authors hypothesised that the increase in calcium in response to bitter tastants may trigger
the release of hormones by enteroendocrine cells. Indeed, gut peptides including peptide
YY, glucagon-like peptide–1 (Rozengurt, 2006) and cholecystokinin (CCK; Jeon et al.,
2008) are released in response to intestinal T2R signaling. Given CCKs known role in
limiting intestinal motility and food intake, it has been suggested that T2Rs in the
intestinal tract may act to limit the absorption of potentially toxic compounds that reach
the small intestine despite the initial aversion response through T2R activation in the oral
cavity (Jeon et al., 2011). This distribution of T2Rs in the oral cavity and extra-oral
structures such as the upper esophagus and intestine may be relevant in terms of selecting
mouth rinsing protocols (mouth rinsing alone vs. combined mouth rinsing and ingestion).
There is some evidence from CHO mouth rinsing studies that the location of the activated
taste receptor cells is important in eliciting an ergogenic effect, at least for maximal sprint
exercise (Chong et al., 2014). This is also likely to be important in the case of a bitter
solution, given the differential expression of T2Rs in the oral cavity and throughout the
GI tract.
1.6.3 Individual variation in bitter taste perception
An interesting issue in bitter taste perception is the large variation in tasting ability
between individuals. Some of this variability can be attributed to environmental factors,
but genetic variation also plays an important role (Mennella et al., 2005). A well-known

Chapter One – Literature Review
31
example of this is the inherited ability to taste the bitter substance 6-n-propylthiouracil
(PROP; Tepper, 2008). In Caucasian populations, approximately 30% of people cannot
taste PROP (nontasters), 45% are medium tasters, and 25% are very sensitive to PROP
(supertasters). This variation in PROP tasting status has been found in populations
throughout the world, though the percentage of nontasters, medium tasters and
supertasters within a population varies with race and ethnicity (Tepper, 2008). One
specific taste receptor (T2R38) is responsible for the taste of PROP. PROP non-tasters
either lack or have very low numbers of this taste receptor, while supertasters have
relatively high numbers of this receptor (Meyerhof et al., 2010).
Importantly, some studies have reported that PROP supertasting is associated with
increased sensitivity to other tastes (including sweet and bitter tastes; Duffy & Bartoshuk,
2000), although other studies have not found such a relationship (Drewnowski et al.,
1997; Ly & Drewnowski, 2001). In relation to quinine, the bitter tastant of interest in this
thesis, Lim et al. (2008) found a significant correlation between PROP tasting status and
the perceived intensity of quinine, as did Gent and Bartoshuk (1983). In contrast, other
studies have found no correlation between sensitivity to PROP and quinine taste intensity
(Hall et al., 1975; Mela, 1989; Schifferstein & Frijters, 1991; Keast & Roper, 2007).
Independent of PROP tasting status, there is some evidence of individual variation in the
perceived bitterness of quinine (Hansen et al., 2006) which is associated with variation in
one or more genes on chromosome 12 (Reed et al., 2010). Individual variation in bitter
taste perception may have implications for mouth rinsing and performance, since
differences in the number of activated T2Rs would be expected to influence the intensity
of afferent taste signals and therefore the effect on performance. It may therefore be
important to screen for the differences in bitter taste perception of study participants to
assess whether individual differences in taste sensitivity do indeed influence the

Chapter One – Literature Review
32
ergogenic effect of a bitter solution. Given that there is no standard test for determining
quinine tasting status and the existence of a widely-used, easily administered and reliable
test to asses PROP tasting ability (Tepper et al., 2001), a PROP taste test may be the most
appropriate way to make this determination.
1.6.4 Brain activation in response to bitter taste
As mentioned previously, researchers have suggested that the ergogenic effect of CHO
mouth rinsing may be related to the activation of brain areas which have been referred to
as “reward or pleasure centres”, such as the ACC and striatum (Chambers et al., 2009;
Turner et al., 2014). While these areas have historically been associated with reward or
pleasure, there is also evidence that they respond to unpleasant stimuli (including
unpleasant tastants; O’Doherty et al., 2001; Zald et al., 2002; Small et al., 2003; Roitman
et al., 2005). Two studies have directly compared the brain responses to the taste
perception of bitter quinine and sweet sucrose. Zald and colleagues (2002) used positron
emission tomography (PET) to examine changes in regional cerebral blood flow while
tasting high concentrations of bitter quinine hydrochloride (20 mM) and sweet tasting
sucrose (30% w/v). As expected, both quinine and sucrose activated the primary and
secondary gustatory cortices relative to tasting water. In addition, both solutions
significantly activated the ACC and the amygdala, which plays a fundamental role in
producing autonomic arousal in response to emotional stimuli, particularly threat stimuli
(Zald et al., 2002; Critchley, 2005). Likewise, Small and colleagues (2003) used fMRI
scans to examine brain activation in response to tasting two quinine (0.01 and 1 mM) and
two sucrose solutions (18 and 56 mM). Similar patterns of brain activation were found in
this study in response to both quinine and sucrose, with responses in several areas
including the primary and secondary gustatory cortices, anterior cingulate gyrus,
amygdala, striatum and hypothalamus (the latter being a major area responsible for the

Chapter One – Literature Review
33
regulation of the ANS through descending projections to the medulla and spinal cord;
Smith et al., 1990; Palkovits, 1999; Kramer et al., 2000). Given these similarities in brain
activation between sweet and bitter tastes, it is possible that bitter mouth rinsing may also
affect exercise performance, perhaps in a similar way to that reported for CHO mouth
rinsing.
1.6.5 Brain activation and exercise performance
The above evidence that bitter taste activates similar structures in the limbic system to
those activated by sweet taste may have implications for exercise performance. During
endurance exercise, activation of areas involved in emotional processing may counteract
accumulating signals of fatigue from the periphery which would otherwise cause a
decrease in exercise intensity (Lambert et al., 2005). This may explain the observation in
CHO mouth rinse studies that mouth rinsing allowed participants to exercise at higher
intensities without increases in the perception of effort (Carter et al., 2004b; Chambers et
al., 2009). In addition, the activation of the limbic system may influence motor areas,
possibly through the basal ganglia motor cortical circuit which receives dense projections
from the striatum (Mogenson et al., 1980; Kelley et al., 2005), as well as through the ACC
which has connections to the supplementary motor area (Morecraft & Van Hoesen, 1992;
Figure 1.2). The previously described results from Gant et al. (2010) and Turner et al.
(2014) demonstrate that taste signals can indeed activate motor areas in the brain. This
may be relevant for the performance of bouts of endurance as well as maximal sprint or
strength exercise.
An increase in the activation of motor areas in the brain could potentially increase
exercise performance, given that studies have found a direct relationship between the
activity level of these areas (measured by fMRI signal intensity) and muscle force

Chapter One – Literature Review
34
production and EMG activity (Dai et al., 2001; van Duinen et al., 2008). To demonstrate
this relationship, participants were asked to exert a prescribed level of force, guided by
visual feedback, in either a handgrip (Dai et al., 2001) or index finger abduction exercise
task (van Duinen et al., 2008), while fMRI scans were administered. As the level of
voluntary muscle force and EMG activity increased, fMRI signal intensity also increased
in brain regions associated with motor control including the primary sensory and motor
cortices and the supplementary motor cortex, indicating an increase in descending drive
to the muscle as well as an increase in the processing of sensory information from the
periphery. Although these studies investigated the relationship between brain activation
and submaximal force production, this relationship also appears to be relevant in the case
of prolonged, fatigue-inducing exercise. This has been demonstrated by Benwell et al.
(2007) with a progressive increase in fMRI signal observed in the primary sensory and
motor cortices during a fatiguing handgrip exercise. The authors speculated that increased
activity in these areas may have represented increased sensory processing and enhanced
corticomotor drive to maintain task performance as the exercising muscles fatigued. It
should be noted that the muscle force production tasks in these studies were relatively
simple and only involved the contraction of small hand muscles, so it is unclear whether
whole-body exercise would elicit a similar pattern of activation in the motor areas of the
brain. It is also unclear whether an increase in brain activation would be sufficient to
improve whole-body maximal exercise performance given the greater amount of
fatiguing signals coming from the periphery during this type of exercise compared with
simple, isolation exercise tasks.
1.6.6 Bitter taste and the autonomic nervous system
Another mechanism by which the activation of the brain by bitter tastants may influence
exercise performance is through stimulation of the ANS. The ANS provides a rapid,

Chapter One – Literature Review
35
adaptive response to allow the body to respond to environmental or physiological stress
(Buijs & van Eden, 2000). This is especially relevant for stimuli which signal a potential
threat to homeostasis, such as bitter taste. The ANS is centrally controlled by the
hypothalamus and brainstem which stimulate the release of hormones and
neurotransmitters that act on a wide range of organs (Tsigos & Chrousos, 2002) and result
in enhanced attention, increased cardiac output and respiration and a redirection of blood
flow to the aroused brain, heart and muscles (Kyrou & Tsigos, 2009). Taste signals have
the capacity to activate the ANS through connections between limbic structures including
the amygdala and ACC to the hypothalamus (Critchley et al., 2003; Jensen et al., 2003;
Kelley et al., 2005; Roitman et al., 2005; Figure 1.2), as well as through direct projections
from the amygdala to the brainstem (Buijs & van Eden, 2000).
To demonstrate that taste can indeed activate the ANS, Rousmans and colleagues (2000)
measured peripheral ANS responses (instantaneous heart rate, skin potential, skin
resistance, skin blood flow, and skin temperature) to four different tastants (sweet, salty,
sour, and bitter), as well as to a control solution composed of mineral water. Interestingly,
the degree of ANS activation in response to the tastants was related to the perceived
pleasantness of the taste. Sweet taste, which was perceived as the most pleasant, produced
the weakest and shortest ANS responses. Bitter taste, perceived as the most unpleasant,
produced the greatest and longest-lasting ANS responses which were three to four times
larger than the responses to sweet taste. These findings have been confirmed by Robin et
al. (2003), who assessed whether there were gender differences in the ANS responses to
gustatory stimuli. Tasting a bitter quinine solution elicited the largest ANS responses,
while a sweet sucrose solution elicited the weakest responses in both men and women,
with no significant differences between genders. Similarly, Horio (2000) demonstrated
that each of the five prototypical tastes (sweet, salty, sour, bitter and umami) are capable

Chapter One – Literature Review
36
of immediately increasing heart rate compared with baseline measurements and compared
with tasting water. In this study, quinine and sucrose elicited a similar increase in heart
rate, however the increase in response to quinine lasted significantly longer than the
response to sucrose, as well as the other taste solutions. This ability of bitter tastants to
activate the ANS may provide a potential mechanism by which bitter mouth rinsing might
increase performance, perhaps by providing increased resources to the muscle at the start
of the exercise bout.
1.6.7 Negative brain theory
A further rationale for the potential effect of bitter taste on exercise performance is the
theory that the human brain is biased toward the motivational avoidance system, with
enhanced neural circuitry devoted to responding to and coping with potentially harmful
environmental stimuli compared with pleasant or neutral stimuli. This is known as the
negative brain theory (Carretie et al., 2009), which contends that exposure to negative or
unpleasant stimuli requires the facilitation of physiological resources to be mobilised
more urgently than neutral or positive (pleasant) stimuli, since the consequences of
encountering unpleasant stimuli are often more severe. As mentioned previously, bitter
taste is perceived as unpleasant and may signal a potential homeostatic threat (Meyerhof,
2005), which in turn may trigger a relatively robust physiological response. This may
assist in explaining the findings of Rousmans et al. (2000) and Robin et al. (2003) that an
unpleasant bitter solution evoked larger and longer lasting ANS activation compared with
the administration of a pleasant sweet tasting solution.
The negative brain theory is supported by several studies showing that the neural
responses (measured by event-related potentials and single-unit neuron responses) to
viewing unpleasant visual stimuli are stronger and/or faster than the responses to viewing

Chapter One – Literature Review
37
neutral or pleasant ones (Carretie et al., 2001; 2003; 2006; Kawasaki et al., 2005). Since
the purpose of these neural processes is to facilitate action in order to avoid or minimise
the negative consequences associated with unpleasant stimuli, there is evidence that
enhanced neural responses lead to more intense motor responses. This has been
experimentally demonstrated in several studies using visual stimuli. Coombes et al.
(2005) observed a significant improvement in the performance of a square-tracing task
(by increasing speed without decreasing accuracy) immediately after participants viewed
unpleasant compared with pleasant and neutral pictures. Coombes et al. (2006) also
demonstrated a significant increase in mean force production during a sustained (10-s)
isometric wrist extension performed while participants viewed unpleasant compared with
pleasant and neutral pictures. Reaction time in a maximal isometric wrist extension task
was also significantly improved while participants viewed unpleasant compared with
pleasant and neutral pictures (Coombes et al., 2007; 2009), as was peak force production
in the same maximal wrist extension task (Coombes et al., 2009). Other studies have
found that the viewing of both pleasant and unpleasant pictures significantly improved
the performance of various motor tasks compared with neutral pictures, with no
significant differences between pleasant and unpleasant pictures. These included
improvements in a choice reaction time test (Koganemaru et al., 2012), an increased
ability to maintain a prescribed low-level grip force in the absence of feedback (Naugle
et al., 2012), and increases in maximal grip force (Schmidt et al., 2009). It is important to
note that all of these studies have used visual stimuli to evoke emotional responses,
leaving unanswered questions as to whether other types of stimuli, such as taste stimuli,
may elicit similar responses.

Chapter One – Literature Review
38
1.6.8 Corticomotor excitability
The previously mentioned findings of Gant et al. (2010) that CHO mouth rinsing
immediately increases corticomotor excitability raises the possibility that bitter taste may
also have such an effect. Unfortunately, the study of Gant et al. (2010) is the only study
to date which has examined the effect of taste on the corticomotor pathway, however
there is evidence that other emotional stimuli can influence corticomotor excitability. For
instance, studies have reported that viewing unpleasant pictures significantly increased
MEP amplitudes compared with viewing both pleasant and neutral pictures (Coelho et
al., 2010; Oliveri et al., 2010; van Loon et al., 2010). Others have found that the viewing
of both pleasant and unpleasant pictures significantly increased MEP amplitudes
compared with neutral stimuli, with no significant difference between viewing pleasant
and unpleasant pictures (Hajcak et al., 2007; Coombes et al., 2009; Koganemaru et al.,
2012). Other studies have utilised emotional auditory stimulation to induce changes in
corticomotor excitability, with increases in MEP amplitude when participants listened to
unpleasant compared with neutral sounds (Baumert et al., 2011; Komeilipoor et al., 2013),
though not all studies have found such an effect (Baumgartner et al., 2007). To date, no
studies have examined corticomotor excitability in response to different tastants including
bitter taste, though it is possible that unpleasant taste stimuli may elicit similar responses
to those observed with other types of unpleasant stimuli.
An increase in corticomotor excitability, evoked by an unpleasant stimulus, might
improve exercise performance by allowing increased motor output to the muscle, which
has implications for the generation of muscle force as well as muscular endurance. This
possibility is supported by studies which have used non-invasive interventions that cause
a transient increase in corticomotor excitability and have demonstrated improvements in
the subsequent performance of fatiguing motor tasks (Benwell et al., 2006; Cogiamanian

Chapter One – Literature Review
39
et al., 2007: Teo et al., 2012). Benwell and colleagues (2006) utilised a paired-pulse
repetitive TMS protocol designed to induce I-wave facilitation (iTMS; an intervention
previously shown to increase corticomotor excitability; Thickbroom et al., 2006) and
single-pulse TMS (to act as a control since this type of TMS does not increase
corticomotor excitability) and evaluated the subsequent performance of a maximal 10-s
pinch grip exercise. Exercise performance after each intervention was compared with
baseline performance measured before the intervention. Corticomotor excitability (as
measured by MEP amplitude) increased after iTMS and remained elevated for 11 min,
whereas there was no change in MEP amplitude after single-pulse TMS. The associated
maximal force production was similar before and after iTMS, but the rate of force decline
over the 10-s exercise period was significantly attenuated, resulting in an overall 6.3%
improvement in force production compared with the baseline measure. In contrast, the
control condition did not significantly improve task performance. The authors suggested
that the increase in corticomotor excitability induced by the iTMS protocol may have
increased motor drive to the muscle, and that this increase in corticomotor excitability
may also have compensated for the reduced input to the motor cortex which is thought to
occur as fatigue develops (Taylor et al., 2000).
Similarly, Teo et al. (2012) demonstrated an improvement in the performance of a 10-s
repetitive maximal index finger flexion-extension task after iTMS compared with single-
pulse TMS. Maximal voluntary movement rate at the beginning of the task increased by
8% and the decline in movement rate over the 10-s exercise period was reduced by 6%
following iTMS but not single-pulse TMS. Cogiamanian et al. (2007) used anodal
transcranial direct current stimulation (tDCS), another non-invasive intervention known
to temporarily increase corticomotor excitability (Nitsche et al., 2003). These researchers
demonstrated a 15% improvement in muscular endurance measured by the time for which

Chapter One – Literature Review
40
participants could maintain an isometric contraction of the elbow flexors at 35% of their
MVC compared with cathodal tDCS (which did not increase corticomotor excitability),
as well as compared with a control condition in which no intervention was performed. It
should be noted, however, that not all studies have observed improvements in motor
performance following such interventions. Agostino et al. (2007) found no differences in
the performance of a maximal index finger abduction task with the use of high frequency
repetitive TMS compared with “sham” TMS, despite a significant increase in
corticomotor excitability in the repetitive TMS condition.
1.6.9 Caffeine mouth rinsing
While no previous research has investigated the effect of bitter mouth rinsing on exercise
performance, some indirect support for this notion comes from the recent finding that the
administration of caffeine immediately before an exercise bout, in the form of caffeinated
chewing gum or in a mouth rinse solution, can improve performance. Caffeine is known
to have a bitter taste, activating five T2Rs (Meyerhof et al., 2010), and it is sometimes
used in taste perception studies for this reason (Hansen et al., 2006). While caffeine
research has historically focused on the central effects elicited after its absorption in the
GI tract, two recent studies have demonstrated improvements in maximal exercise
performance with the use of caffeine which may be attributed to central activation by
afferent taste signals since the caffeine treatments were administered immediately before
the exercise bouts, thus allowing no time for absorption. Beaven et al. (2013) recruited
twelve recreationally-trained male cyclists to perform a series of 5 x 6-s maximal cycling
sprints with 24-s of recovery, each performed immediately after mouth rinsing for 5-s
with a 1.2% caffeine solution. When participants were divided into caffeine responders
and non-responders, a significant 5.5% improvement in mean power output was observed
for the responders in the initial sprint with no decrement in performance in the subsequent

Chapter One – Literature Review
41
sprints compared with mouth rinsing with an artificially sweetened placebo. Although the
caffeine was mixed with saccharin to match the taste of the placebo solution, it is possible
that the presence of caffeine in the oral cavity may have activated T2Rs which may have
contributed to the ergogenic effect. Similarly, Paton et al. (2010) had nine male
competitive cyclists chew caffeinated gum immediately before the third set in a repeated
sprint exercise task comprising four sets of 5 x 30-s cycling sprints with 30-s active
recovery between sprints and 5 min active recovery between sets. The caffeinated gum
significantly improved performance by 5.4% compared with a placebo gum. Again, the
taste of the caffeine was disguised in this study to match the placebo, however this does
not exclude the possibility that the activation of taste receptors by caffeine contributed to
the ergogenic effect. In contrast, Doering et al., (2014) found no differences in 1-h cycling
time trial performance with the repeated administration of a mouth-rinse composed of a
diet cola beverage with an added 35 mg anhydrous caffeine compared with a placebo
solution composed of the same non-caffeinated beverage. The major difference between
this study and the two previously mentioned studies is the use of an endurance exercise
bout rather than a maximal sprint. It therefore appears that the oral receptor mediated
ergogenic effect of caffeine may be dependent on exercise intensity.
1.7 Conclusions
Given the evidence that the stimulation of TRCs by the presence of CHO in the oral cavity
can significantly improve exercise performance, possibly through the activation of
emotional and motor areas of the brain, it is possible that the activation of TRCs by other
types of tastants, for example bitter taste, may have a similar, or even potentially greater,
effect. In support of this prediction, brain imaging studies have demonstrated similar
patterns of brain activation in emotional areas of the brain in response to tasting sweet
and bitter substances, and bitter taste has been reported to elicit larger and longer-lasting
ANS activation than sweet taste. Increases in emotional signals in the brain may improve

Chapter One – Literature Review
42
exercise performance by increasing motivation and/or counteracting fatiguing signals
from the periphery, as well as by increasing motor output through connections to motor
areas of the brain. Meanwhile, increased ANS activation may improve performance by
providing additional resources to the muscle, which is especially relevant for maximal
exercise bouts. Furthermore, strong bitter taste is highly unpleasant, raising the possibility
that the brain responses to bitter taste may lead to improvements in corticomotor
excitability and motor output given that studies have shown increased motor responses to
unpleasant visual and auditory stimuli.
1.8 Summary
1.8.1 Statement of the problem
No previous research has investigated the effect of bitter taste per se on exercise
performance. As such, there are several issues to be considered in assessing whether bitter
taste may be useful in improving performance. The first important consideration is the
composition of the bitter solution. Quinine, a natural alkaloid found in the bark of the
cinchona tree, was chosen as the bitter tastant in this thesis for several reasons. It is safe
for human consumption as it is commonly found as the bittering agent in tonic water
(Drewitt et al., 1993) and, in very high concentrations, is used to treat malaria (Pasvol,
2006). It is also well-researched in terms of taste perception, as it is often used as a bitter
tastant in tasting studies (Keast & Roper, 2007). Since no studies have investigated
quinine in the context of exercise performance, it is unclear how concentrated the solution
should be in order to elicit an effect. Another important issue is the type of exercise test
to be used in the performance studies. The findings that bitter taste activates emotional
areas of the brain, as well as the ANS, suggests that bitterness could improve types of
exercise which might benefit from increased central drive, motivation and rapid
mobilisation of resources to the muscle, such as a maximal sprint. Finally, the appropriate

Chapter One – Literature Review
43
protocol for administering the bitter solution to produce an ergogenic effect needs to be
determined (e.g. mouth rinsing alone, combined mouth rinsing and ingestion). This is
especially relevant given the uneven distribution of T2Rs in the oral cavity and the
presence of T2Rs in extra-oral areas.
1.8.2 Aims
The primary aim of this thesis was to determine whether administration of a bitter quinine
solution immediately prior to a maximal exercise bout can improve performance and to
investigate a mechanism which may be related to this possible ergogenic effect.
Specifically, the aims of this thesis were to investigate:
- Whether the combination of mouth rinsing and ingestion of a bitter quinine
solution can improve the performance of a maximal 30-s cycling sprint.
- Whether mouth rinsing alone (without ingestion) of a bitter quinine solution can
improve the performance of a maximal 30-s cycling sprint.
- Whether the combination of mouth rinsing and ingestion of a bitter quinine
solution can immediately increase corticomotor excitability measured with TMS.
1.8.3 Hypotheses
The hypotheses relating to these aims are that:
- Combined mouth rinsing and ingestion of a bitter quinine solution will improve
30-s maximal cycling sprint performance.
- Mouth rinsing alone with a bitter quinine solution will not improve 30-s maximal
cycling sprint performance.
- Combined mouth rinsing and ingestion of a bitter quinine solution will increase
corticomotor excitability.

44
Chapter Two Mouth rinsing and ingesting a bitter
solution improves sprint cycling performance
Based on a manuscript published in Medicine and Science in Sports and
Exercise:
Gam, S., Guelfi, K. J., & Fournier, P. A. (2014). Mouth rinsing and
ingesting a bitter solution improves sprint cycling performance. Medicine
and Science in Sports and Exercise, 46(8), 1648-1657.

Chapter Two – Study 1
45
2.1 Abstract
Purpose: There is evidence that carbohydrate (CHO) mouth rinsing can improve
endurance exercise performance as well as muscle force production and sprint
performance. Whether the oral administration of non-CHO tastants also affects exercise
performance is not known. The purpose of this study was to investigate whether mouth
rinsing and ingesting a bitter-tasting solution composed of quinine improves maximal
sprint cycling performance. Methods: Fourteen competitive male cyclists performed a
30-s maximal cycling sprint immediately after rinsing their mouth for 10-s and then
ingesting a 2 mM bitter quinine solution, plain water, a 0.05% (w/v) sweet aspartame
solution, or no solution at all (control). Cycling power output was recorded during the
sprint. Heart rate, perceived exertion, blood lactate, and blood glucose were measured
pre-exercise, immediately post-exercise, and 7 min post-exercise. Results: Quinine
administration significantly improved mean power output by 2.4% – 3.9% compared with
the three other conditions (p ≤ 0.021, effect size [ES] = 0.81 – 0.85). Peak power output
in the quinine condition was higher compared with the water (3.7%, p = 0.013, ES = 0.71)
and control (3.5%, p = 0.021, ES = 0.84) conditions but was not significantly different
from aspartame (1.9%, p = 0.114, ES = 0.47). There were no significant differences in
cycling performance between water, aspartame, and control conditions. There were no
differences in heart rate, perceived exertion, or blood variables between any of the
conditions. Conclusions: This study shows for the first time that mouth rinsing and
ingesting a bitter-tasting solution immediately before a maximal sprint effort can improve
performance.
Keywords: quinine, bitter taste, T2Rs, exercise performance, power output

Chapter Two – Study 1
46
2.2 Introduction
In recent years, several studies have reported that rinsing the mouth with a carbohydrate
(CHO) solution, without ingesting it, can improve exercise performance in endurance
events lasting 1 h or less (Carter et al., 2004b; Rollo et al., 2008; Chambers et al., 2009;
Jeukendrup & Chambers, 2010; Pottier et al., 2010; Fares & Kayser, 2011; Lane et al.,
2013). Although not all studies have found such an ergogenic effect (Whitham &
McKinney, 2007; Beelen et al., 2009), their negative findings have been attributed to the
pre-exercise nutritional status of the participants (Beelen et al., 2009) or a lack of
sensitivity of the methodology used to measure performance (Whitham & McKinney,
2007). With respect to the effect of CHO mouth rinsing on other aspects of exercise
performance, some studies have found no effect of CHO mouth rinsing on sprint
performance (Chong et al., 2011) or maximal strength (Painelli et al., 2011). Others have
provided evidence that CHO mouth rinsing does improve sprint performance and muscle
force production (Gant et al., 2010; Beaven et al., 2013; Chong et al., 2014). Indeed, Gant
et al. (2010) found that the presence of CHO in the mouth increased maximal voluntary
force production in the elbow flexors, Beaven et al. (2013) showed that a single 5-s
glucose mouth rinse improved mean power output in the initial sprint of a series of 5 x 6-
s sprints compared with a non-caloric placebo, and Chong et al. (2014) found that
combined CHO mouth rinsing and ingestion improved the peak and mean power output
during a 45-s cycling sprint effort.
The ergogenic effect of CHO mouth rinsing has been explained by the presence of
receptors in the oral cavity, which when stimulated by the presence of CHO, send signals
that activate reward or pleasure centres in the brain, thereby improving exercise
performance by reducing the perception of effort of the exercise (Carter et al., 2004b).
This notion is supported by the work of Chambers et al. (2009) who showed, using

Chapter Two – Study 1
47
functional magnetic resonance imaging (fMRI), that CHO mouth rinsing with both
glucose and non-sweet maltodextrin resulted in the activation of brain areas generally
associated with reward, including the anterior cingulate cortex and striatum. It is
important to note that this ergogenic effect of CHO mouth rinsing appears to depend on
the caloric content of CHO in the rinse solution rather than the perception of sweetness,
per se. Indeed, several studies have shown that the administration of non-sweet CHO
(maltodextrin; Carter et al., 2004b; Chambers et al., 2009; Fares & Kayser, 2011)
provides some ergogenic benefits whereas non-caloric artificial sweeteners have no effect
on performance (Chambers et al., 2009).
The evidence that the stimulation of CHO receptors in the oral cavity has the capacity to
improve both endurance and sprint exercise performance raises the obvious question of
whether stimulation of other types of taste receptors by other classes of tastants may also
affect exercise performance. Of interest, fMRI-based studies have shown that the brain
areas activated in response to the bitter tastant quinine overlap to a great extent with those
stimulated by CHO (Zald et al., 2002; Small et al., 2003). Furthermore, quinine has been
shown to evoke greater and longer lasting autonomic nervous system (ANS) responses
compared with the other four prototypical tastants (sweet, sour, salty, and umami;
Rousmans et al., 2000; Robin et al., 2003). This raises the intriguing possibility that a
bitter tasting mouth rinse may also enhance exercise performance.
In view of the recent findings that CHO mouth rinsing significantly improves sprint
performance (Beaven et al., 2013, Chong et al., 2014), the primary aim of this study was
to investigate whether combining mouth rinsing with the ingestion of a bitter tasting
solution composed of quinine acutely improves mean and peak power during a 30-s
maximal cycling sprint effort. Mouth rinsing and ingestion were combined to ensure the

Chapter Two – Study 1
48
activation of bitter taste receptors throughout the oral cavity, including those at the back
of the tongue and in the upper gastrointestinal (GI) tract. Since it is unclear how
concentrated the quinine solution should be, the purpose of this study was also to identify
the quinine concentration resulting in both maximal bitterness perception and ANS
activation, without causing side effects such as nausea, and to adopt this quinine
concentration to test its effect on sprint performance.
2.3 Methods
2.3.1 Study Part 1: Dose response relationship between quinine concentration and
bitter taste perception and ANS responses
Since no previous research has examined the effect of quinine ingestion on exercise
performance, the concentration of quinine to be used in this study was determined by
identifying the quinine concentration that results in the strongest taste and ANS responses
(skin conductance; SC, ohmic perturbation duration; OPD, and instantaneous heart rate;
IHR) without causing any feelings of nausea.
2.3.1a Participants
Eighteen healthy male volunteers provided written consent to participate in this study
(mean ± SD; age 26 ± 3 yr; body mass index 24 ± 3 kg/m2). All were nonsmokers, did
not report any gustatory or olfactory disorders, and were not taking any medication or
suffering from illnesses that might alter their sense of taste or smell. Ethical clearance
was obtained from the Human Research Ethics Committee of The University of Western
Australia (Appendix A).

Chapter Two – Study 1
49
2.3.1b Experimental design
Participants attended the laboratory for two sessions, each conducted at the same time of
day. First, participants completed a 6-n-propylthiouracil (PROP) tasting session to assess
the sensitivity of the participants to the bitter chemical PROP. This is because marked
inter-individual variations have been reported in bitter tasting sensitivity, with the ability
to taste the bitter chemical PROP generally adopted to compare individuals (Tepper et
al., 2001). The next session examined the relationship between the concentration of
quinine and bitter taste intensity, unpleasantness, nausea level and ANS responses.
Participants were instructed to avoid eating or drinking anything other than water for 1 h
prior to each testing session.
Upon arrival at the laboratory, participants had electrodes placed at various locations on
their hand and chest to allow for the continuous measurement of SC and IHR, respectively
(as detailed later). Participants then put on headphones (Monster Beats Solo, Beats
Electronics, Santa Monica, CA, USA) through which brown noise was played at a
standardised volume (Simplynoise.com) in order to minimise external auditory
distractions that could interfere with baseline ANS signals. Participants were instructed
to sit comfortably for 15 min to adapt to the experimental conditions before commencing
the session.
2.3.1c Session 1 - Assessment of PROP tasting status
The PROP tasting status of each participant was assessed by measuring the perceived
intensity of PROP compared to a reference sodium chloride (NaCl) solution using the
three solution test described by Tepper and colleagues (2001). Briefly, this involved
rinsing the mouth for 10-s with three NaCl solutions (0.01, 0.1 and 1.0 M) and three PROP
solutions (0.032, 0.32, 3.2 mM) in ascending order, alternating between NaCl and PROP

Chapter Two – Study 1
50
solutions. After expelling each solution, participants rated its intensity on a general
labeled magnitude scale (gLMS; Green et al., 1996, Appendix E). Participants waited 45-
s between solutions, during which time they were allowed to drink water ad libitum.
Participants were categorised into PROP tasting groups by comparing the responses to
the low, medium and high concentration of PROP with the response to the corresponding
NaCl solution. If participants rated at least two of the three PROP solutions lower than
the corresponding NaCl solutions (by at least 10 gLMS units) they were classified as non-
tasters. If participants gave similar ratings to the PROP and NaCl solutions they were
classified as medium tasters, and if participants rated at least two of the three PROP
solutions higher than the corresponding NaCl solutions they were classified as
supertasters (Tepper et al., 2001).
2.3.1d Session 2 - Assessment of the dose response relationships between quinine intake
and both taste perception and ANS responses
In order to determine the dose response relationships between quinine intake and both
taste and ANS responses, each participant was required to rinse his mouth with and then
ingest 25 ml of six solutions of increasing concentration of quinine hydrochloride (Sigma-
Aldrich, St. Louis, MO, USA) and six solutions of a single NaCl concentration (Sigma-
Aldrich). All solutions were prepared with doubly deionised water (Direct-Q 5 Ultrapure
Water System, Millipore, MA, USA). The concentrations of quinine were 0, 0.5, 1, 2, 3,
and 4 mM. NaCl was presented in a standardised concentration of 0.1 M to serve as a
dishabituator (Epstein et al., 1992). Quinine was selected as the bitter tastant in this study
since it is safe for human consumption (commonly found as the bittering agent in tonic
water; Drewitt et al., 1993), and is often used as a bitter tastant in tasting studies (Keast
& Roper, 2007).

Chapter Two – Study 1
51
On the day of testing, all solutions were kept at room temperature (24 C) and placed on
a table in front of the participant in identical plastic cups. At the onset of the test,
participants first tasted one of the NaCl solutions, then alternated quinine and NaCl
solutions. Quinine solutions were presented in order of ascending concentration because
the expected nausea associated with ingesting the highest concentration of quinine would
have the potential to invalidate the assessment of subsequent solutions. Each solution was
rinsed in the mouth for 10-s before being ingested. Immediately following quinine
ingestion, participants gave subjective ratings of taste intensity and unpleasantness using
a gLMS (Green et al., 1996; Appendix E) with adjectives altered to specify either intensity
or unpleasantness. Participants also gave ratings of nausea using a 100 mm visual analog
scale bounded by the descriptors “no nausea” and “extreme nausea” (Muth et al., 1996;
Appendix E). In addition, ANS responses were recorded continuously during each session
(as detailed below). The administration of each consecutive solution (either quinine or
NaCl) took place once SC and IHR returned to baseline levels and were no longer
fluctuating (approximately 2-3 min). In the rest period between solutions, participants
rinsed their mouth with water ad libitum. Preliminary work was performed to ensure that
the rest period between consecutive successive quinine exposures at a given concentration
did not result in any significant differences in taste perception.
2.3.1e Autonomic nervous system measurements
ANS responses to quinine were assessed indirectly by measuring SC and IHR. SC (µS)
was measured using bipolar finger electrodes (MLT116F GSR, AD Instruments, Sydney)
placed on the second phalanx of the index and third digit on the non-dominant hand. The
amplitude of each response was measured, as well as the ohmic perturbation duration
(OPD) index (i.e. the time taken for the responses to return to baseline level) which has
been shown to reflect the emotional load of the stimulus (Vernet-Maury et al., 1995).

Chapter Two – Study 1
52
IHR (bpm) was recorded from three silver electrodes placed in a precordial position. The
electrode sites were first shaved, lightly abraded, and cleaned with alcohol wipes prior to
placement of electrodes. The D2 derivation signal (interval between consecutive R
waves) was processed and delivered in the form of IHR frequency. The IHR response
was measured as the difference between the pre-stimulus level value and the maximum
increase induced by the stimulus.
The SC electrodes were used with a galvanic skin response amplifier (FE116 GSR Amp,
AD Instruments, Sydney) interfaced with a PowerLab data acquisition system (PowerLab
2/20, AD Instruments, Sydney). SC and IHR signals were amplified, filtered, and
recorded throughout the sessions with a sampling frequency of 10 Hz using the PowerLab
system and analysed with LabChart 7 software (AD Instruments).
2.3.1f Data and statistical analysis
Psychophysical curves were graphed for mean subjective (intensity, unpleasantness and
nausea) and ANS (SC, OPD and IHR) responses across the range of solution
concentrations. One-way repeated measures ANOVA were used to compare the
responses between quinine concentrations followed by Fisher’s LSD post hoc tests, with
differences accepted at p < 0.05 (Statistical Package for the Social Sciences Version 17.0
for Windows software, Chicago, IL). Participants were then divided into groups based on
their PROP tasting status, with the ANS and subjective responses compared using two-
way mixed-model ANOVA with Fisher’s LSD post hoc tests. All values, unless otherwise
stated, are expressed as mean ± SEM.

Chapter Two – Study 1
53
2.3.2 Study Part 2: Effect of quinine administration on sprint performance
2.3.2a Participants
Fourteen trained male cyclists (mean ± SD; age: 30.1 ± 5.4 yr, height: 1.84 ± 0.09 m,
mass: 77.0 ± 11.7 kg, V O2peak: 61.9 ± 7.7 ml/kg/min; PROP tasting status: 3 nontasters,
5 medium tasters, 6 supertasters) were recruited for this study from cycling and triathlon
clubs. Participants were fully informed of the testing procedures before their written
consent was obtained. However, in order to minimise the possibility of a placebo effect,
they were deceived about the true aims of the study and were instead informed that the
purpose of the study was to determine the effect of different taste solutions on the
metabolic responses to maximal exercise. After completing all trials, participants were
personally debriefed as to the true aim of the study. The procedures were approved by the
Human Research Ethics Committee of The University of Western Australia (Appendix
A).
2.3.2b Experimental design
Each participant visited the laboratory on five separate occasions, each separated by 7
days and conducted at the same time of day for each participant. The initial visit involved
the assessment of PROP tasting status and V O2peak prior to familiarisation with both the
mouth rinsing procedure and sprint protocol to be used in the subsequent experimental
trials.
For the following four experimental trials, participants completed a 30-s maximal cycling
sprint immediately after rinsing their mouth and ingesting either a bitter quinine solution
(QUI), plain water (WAT), a sweet aspartame solution (ASP), or a no-rinse control
(CON) administered in a randomised, counterbalanced order. The WAT and ASP

Chapter Two – Study 1
54
conditions served as placebos, since neither water nor aspartame mouth rinsing is
beneficial for maximal cycling sprint performance (Chong et al., 2011) or endurance
exercise (Chambers et al., 2009).
2.3.2c Initial session
Before investigating the effect of quinine on sprint performance, individual differences
in PROP taste perception were determined for each participant (methods as previously
described). Following the PROP tasting test, participants completed an incremental
exercise test to determine their V O2peak. The test consisted of 3-min stages with 1-min
rest between stages, with participants cycling at a set power output that increased by 50
W in each stage. The test continued until volitional exhaustion, or until the participant
was unable to maintain the prescribed power output. During this test, participants
breathed through a mouthpiece connected to a Hans Rudolph valve and tubing into a
computerised gas-analysis system (Meta 2000, School of Sports Science Exercise and
Health, University of Western Australia). This system consisted of a ventilometer
(Morgan, Kent, United Kingdom) to measure the volume of inspired air and Ametek
Applied Electrochemistry S-3A/I oxygen and CD-3A carbon dioxide analysers (AEI
Technologies, Pittsburgh, PA) to measure the fraction of O2 and CO2 in expired air. The
ventilometer was calibrated before the test using a 1-L syringe, while the O2 and CO2
analysers were calibrated against a beta gas containing a known physiological
concentration of O2 and CO2 (BOC Gases Australia Ltd.). The criterion for reaching V
O2peak was the attainment of two of the following three conditions: a plateau in oxygen
consumption (a change in V O2 of < 2.1 ml/kg/min between stages of increasing
intensity), a respiratory-exchange ratio of > 1.15, or a heart rate > 90% of age-predicted
maximum.

Chapter Two – Study 1
55
Following the V O2peak test, participants were given plain water to rinse and then ingest,
after which they completed the sprint protocol to be used in the subsequent experimental
trials in order to become accustomed to the experimental procedures. Before leaving the
laboratory, participants were given a food and physical activity diary and were asked to
record all food and drink intake and physical activity in the 24 h prior to each experimental
trial. Energy intake (kJ) was quantified from the food diaries using commercially
available software (Foodworks; Xyris Software, Kenmore Hills, QLD, Australia). A copy
of the diary from the first trial was returned to each participant, and they were asked to
replicate the same diet and activity patterns in the 24 h prior to each trial (Jeacocke &
Burke, 2010). Compliance was confirmed upon arrival to the laboratory for each
experimental trial by inspection of food diaries from the previous 24 h. Participants were
also instructed to fast overnight before each trial and to avoid strenuous exercise, alcohol
and caffeine in the 24 h preceding each trial.
2.3.2d Experimental sessions
On arriving at the lab in the morning, participants had their body mass measured and were
fitted with a heart rate monitor (Garmin Ltd., Kansas, USA). They then performed a 4-
min light cycling warm up at 40% of V O2peak, followed by a 2 to 3-s practice sprint start
(Exertech EX-10 front access cycle ergometer, Repco Cycle Company, Huntingdale,
Victoria). Seat height was standardised for each participant. After a 10-min rest,
participants were given either 0.36 mL/kg body mass of either a 2 mM quinine
hydrochloride solution (QUI; Sigma-Aldrich), plain water (WAT), a 0.05% w/v
aspartame solution (ASP; Sigma-Aldrich), or they were not given any mouth rinse at all
(CON). A volume of 0.36 mL/kg was chosen to account for differences in body size, with
each participant receiving approximately 25-35 mL of solution per session. Participants
were instructed to rinse their mouth for 10-s and then ingest the solution. The solution

Chapter Two – Study 1
56
was ingested after rinsing to ensure that bitter receptors at the back of the tongue were
activated since there is evidence that the strongest sensation of bitterness occurs in that
area of the oral cavity (Travers & Geran, 2009).
Immediately after ingesting the solution, participants performed a 30-s maximal sprint
effort, initiated in a standing position with the preferred foot starting at the “2 o’clock”
position. Exercise testing was performed immediately after ingesting the testing solution
in order for the findings not to be confounded by any effect that the GI absorption of the
solution may have on exercise performance. The cycle ergometer was interfaced with a
customised program (Cyclemax, School of Sport Science, Exercise and Health, The
University of Western Australia) to allow for the measurement of mean power output
over 0-30 s (Pmean), peak power output (Ppeak), and mean power output over 0-10 s (P0-10),
10-20 s (P10-20), and 20-30 s (P20-30) of the sprint. Fatigue index (FI), which is the rate of
power decline during the test, was also calculated as described in Coppin et al. (2012).
Participants were instructed to cycle in an “all-out” manner for 30-s without pacing
themselves.
Before the commencement of the mouth rinse protocol and at 0 and 7 min post-sprint,
heart rate was recorded and each participant provided a subjective rating of perceived
exertion (RPE; Borg, 1982; Appendix E) and nausea. Nausea ratings were made using a
100 mm visual analog scale anchored with the descriptors “No Nausea” and “Extreme
Nausea” (Muth et al., 1996; Appendix E). Immediately after each rating of nausea levels
were taken, a capillary blood sample (125 µL) was obtained from the fingertip
(Clinitubes, Radiometer, Copenhagen) and analysed immediately for blood lactate and
glucose levels using a blood gas analyser (ABLTM 725, Radiometer, Copenhagen).

Chapter Two – Study 1
57
2.3.2e Statistical analysis
The effects of mouth rinse treatment on each performance variable were compared using
one-way repeated measures ANOVA followed by Fisher’s LSD post hoc tests, with
differences accepted at p < 0.05 (Statistical Package for the Social Sciences Version 17.0
for Windows software, Chicago, IL). Cohen’s effect size (ES) statistics were also used to
highlight any trends. A pearson product moment correlation was used to evaluate whether
PROP tasting ability (measured by summing the gLMS scores for the three PROP
solutions for each participant) was related to improvement in sprint performance. All
values, unless otherwise stated, are expressed as mean ± SEM.
2.4 Results
2.4.1 Study Part 1: Dose response relationship between quinine concentration and
bitter taste perception and ANS responses
2.4.1a Effect of PROP tasting status on the dose response relationship between quinine
concentration and bitter taste perception and ANS responses
Of the 18 participants, 5 were nontasters, 5 were medium tasters, and 8 were supertasters.
When participants were grouped into nontasters, medium tasters, and supertasters, there
were no significant differences between groups for any of the ANS variables examined,
or for subjective ratings of taste intensity and unpleasantness (p > 0.05). However, PROP
supertasters did differ from medium and non-tasters in that they experienced significant
nausea in response to the ingestion of a 4 mM quinine solution, whereas average nausea
level was not affected by this concentration of quinine in both medium tasters and non-
tasters. This indicates that, with the exception of nausea level, sensitivity to PROP is not
related to the ANS and perceptual responses to quinine. This is in agreement with other

Chapter Two – Study 1
58
studies (Delwiche et al., 2001, Keast & Roper, 2007) who have found no correlation
between PROP sensitivity and sensitivity to other bitter compounds, including quinine.
2.4.1b Taste perception responses
Psychophysical curves for taste intensity, unpleasantness and nausea are shown in Figures
2.1, 2.2 and 2.3, respectively. As the concentration of quinine increased, there were
significant increases in the perception of taste intensity and unpleasantness (p < 0.05;
Figure 2.1, 2.2). Nausea ratings were not affected by quinine concentrations below 4 mM,
but were higher at 4 mM compared with all other concentrations (p = 0.048; Figure 2.3).

Chapter Two – Study 1
59
0
2 0
4 0
6 0
8 0
1 0 0
Tas
te I
nte
nsi
ty (
gLM
S)
0 1 2 3 40
2 0
4 0
6 0
8 0
1 0 0
Q u in in e C o n c e n tr a tio n (m M )
Tas
te I
nte
nsi
ty (
gLM
S)
**
**
##
##
a
b
Figure 2.1 Psychophysical curves in response to mouth rinsing and ingesting quinine for
subjective ratings of taste intensity in (a) all participants and (b) participants grouped by
PROP tasting status (PROP supertasters [ ], medium tasters [ ] and non-tasters [ ]).
‘*’ indicates a significant difference from preceding concentration level in all
participants, ‘#’ indicates significant difference from preceding concentration level in all
PROP groups (p < 0.05). Values are expressed as mean ± SEM (n = 18).

Chapter Two – Study 1
60
0
2 0
4 0
6 0
8 0
1 0 0
Un
ple
asan
tnes
s (g
LM
S)
0 1 2 3 40
2 0
4 0
6 0
8 0
1 0 0
Q u in in e C o n c e n tr a tio n (m M )
Un
ple
asan
tnes
s (g
LM
S)
*
**
*
##
#
#
a
b
Figure 2.2 Psychophysical curves in response to mouth rinsing and ingesting quinine for
subjective ratings of unpleasantness in (a) all participants and (b) participants grouped by
PROP tasting status (PROP supertasters [ ], medium tasters [ ] and non-tasters [ ]).
‘*’ indicates a significant difference from preceding concentration level in all
participants, ‘#’ indicates significant difference from preceding concentration level in all
PROP groups (p < 0.05). Values are expressed as mean ± SEM (n = 18).

Chapter Two – Study 1
61
0
2 0
4 0
6 0
8 0
1 0 0
Nau
sea
(mm
)
0 1 2 3 40
2 0
4 0
6 0
8 0
1 0 0
Q u in in e C o n c e n tr a tio n (m M )
Nau
sea
(mm
)
&
*
a
b
Figure 2.3 Psychophysical curves in response to mouth rinsing and ingesting quinine for
subjective ratings of nausea in (a) all participants and (b) participants grouped by PROP
tasting status (PROP supertasters [ ], medium tasters [ ] and non-tasters [ ]).
‘*’ indicates a significant difference from preceding concentration level in all
participants, ‘&’ indicates significant difference from preceding concentration level in
PROP supertasters only (p < 0.05). Values are expressed as mean ± SEM (n = 18).

Chapter Two – Study 1
62
2.4.1c Autonomic nervous system responses
Psychophysical curves for SC amplitude, OPD and IHR amplitude are shown in Figures
2.4, 2.5 and 2.6, respectively. As the concentration of quinine increased, there were
significant increases in SC amplitude, OPD and IHR amplitude (p < 0.05; Figure 2.4, 2.5,
2.6).

Chapter Two – Study 1
63
0
1
2
3
4
5
6
7
8
SC
am
pli
tud
e
( S
iem
ens)
0 1 2 3 40
1
2
3
4
5
6
7
8
Q u in in e C o n c e n tr a tio n (m M )
SC
am
pli
tud
e
( S
iem
ens)
*
* **
#
##
#
a
b
Figure 2.4 Psychophysical curves in response to mouth rinsing and ingesting quinine for
the amplitude of the skin conductance (SC) response in (a) all participants and (b)
participants grouped by PROP tasting status (PROP supertasters [ ], medium tasters
[ ] and non-tasters [ ]). ‘*’ indicates a significant difference from preceding
concentration level in all participants, ‘#’ indicates significant difference from preceding
concentration level in all PROP groups (p < 0.05). Values are expressed as mean ± SEM
(n = 18).

Chapter Two – Study 1
64
0
1 0
2 0
3 0
4 0
5 0
6 0
7 0
8 0
OP
D (
s)
0 1 2 3 40
1 0
2 0
3 0
4 0
5 0
6 0
7 0
8 0
Q u in in e C o n c e n tr a tio n (m M )
OP
D (
s)
** *
*
##
##
a
b
Figure 2.5 Psychophysical curves in response to mouth rinsing and ingesting quinine for
ohmic perturbation duration (OPD) in (a) all participants and (b) participants grouped by
PROP tasting status (PROP supertasters [ ], medium tasters [ ] and non-tasters [ ]).
‘*’ indicates a significant difference from preceding concentration level in all
participants, ‘#’ indicates significant difference from preceding concentration level in all
PROP groups (p < 0.05). Values are expressed as mean ± SEM (n = 18).

Chapter Two – Study 1
65
0
5
1 0
1 5
2 0
2 5
3 0
IHR
am
pli
tud
e (b
pm
)
0 1 2 3 40
5
1 0
1 5
2 0
2 5
3 0
Q u in in e C o n c e n tr a tio n (m M )
IHR
am
pli
tud
e (b
pm
)
## #
#
* * **a
b
Figure 2.6 Psychophysical curves in response to mouth rinsing and ingesting quinine for
the amplitude of the instantaneous heart rate (IHR) response in (a) all participants and (b)
participants grouped by PROP tasting status (PROP supertasters [ ], medium tasters
[ ] and non-tasters [ ]). ‘*’ indicates a significant difference from preceding
concentration level in all participants, ‘#’ indicates significant difference from preceding
concentration level in all PROP groups (p < 0.05). Values are expressed as mean ± SEM
(n = 18).

Chapter Two – Study 1
66
2.4.1d Determination of the quinine concentration to be used for Study Part 2
On the basis of the findings of Study Part 1 and to ensure that no participant experienced
nausea in response to quinine ingestion, a quinine concentration of 2 mM was adopted
for testing the effect of quinine on sprint performance, despite being associated with
submaximal taste and ANS responses compared with higher concentrations.
2.4.2 Study Part 2: Effect of quinine administration on sprint performance
2.4.2a Nutritional intake and environmental conditions
There was no significant difference in either total energy intake (CON 10,464 ± 201;
QUI 10,573 ± 234; WAT 10,556 ± 230; ASP 10,431 ± 231 kJ; p = 0.470) or carbohydrate
intake (CON 326 ± 24; QUI 325 ± 20; WAT 318 ± 21; ASP 334 ± 21 g; p = 0.500) for
the 24 h prior to each experimental trial. Laboratory temperature and relative humidity
were similar between trials (p > 0.05).
2.4.2b Mean and peak power output
There was a significant main effect of treatment on mean power output for the 30-s sprint
(p = 0.007). Post hoc analysis revealed that mean power was higher in QUI compared
with CON (p = 0.021), WAT (p < 0.001), and ASP (p = 0.018; Table 2.1). These
differences were supported by large ES (Table 2.1). There were no significant differences
in mean power output between the CON, WAT and ASP conditions (p > 0.05).
The main effect of treatment on peak power approached significance (p = 0.052). Peak
power was significantly higher in QUI compared with CON (p = 0.021, ES = 0.84) and
WAT (p = 0.013, ES = 0.79), but did not differ significantly from ASP (p = 0.114, ES =
0.47; Table 2.1). There were no significant differences in peak power between CON,
WAT, and ASP (p > 0.05).

Chapter Two – Study 1
67
2.4.2c Mean power output between 0 – 10, 10 – 20 and 20 – 30 s, and fatigue index
P0-10 was significantly higher in QUI compared with WAT (p = 0.01, ES = 0.84), but was
not significantly different from CON (p = 0.08, ES = 0.52) or ASP (p = 0.19, ES = 0.48;
Table 2.1). P10-20 was significantly higher in QUI compared with CON (p = 0.02, ES =
0.73), WAT (p = 0.005, ES = 0.94) and ASP (p = 0.026, ES = 0.69; Table 2.1). P20-30 was
not significantly different between QUI, CON (p = 0.138, ES = 0.43), and WAT (p =
0.138, ES = 0.44), but approached significance in QUI compared with ASP (p = 0.059,
ES = 0.67; Table 2.1). There were no significant differences in P0-10, P10-20 or P20-30
between the CON, WAT and ASP conditions (p > 0.05). There were no effects of
treatment on FI (p = 0.646) between experimental conditions.

Chapter Two – Study 1
68
Table 2.1 Mean power (Pmean) and peak power output (Ppeak) during a 30-s maximal
sprint and various periods within the sprint (P0-10, 10-20, 20-30) after mouth rinsing and
ingestion of quinine (QUI), a no-rinse control (CON), water (WAT) or aspartame (ASP)
(n = 14; mean ± SEM).
Performance Variable
Treatment Result
Mean relative change
from QUI (%); ES
p
Mean relative change
from CON (%); ES
p
P mean (W) QUI 917 47
CON 882 50 -3.9%; 0.83 0.021 *
WAT 882 51 -3.9%; 0.85 0.020 * 0.0%; 0.00 1.000
ASP 895 48 -2.4%; 0.81 0.018 * 1.5%; 0.33 0.253
P peak (W) QUI 1291 84
CON 1247 83 -3.5%; 0.84 0.021 *
WAT 1245 82 -3.7%; 0.79 0.013 * -0.2%; 0.03 0.915
ASP 1267 81 -1.9%; 0.47 0.114 1.6%; 0.34 0.235
P 0-10 (W) QUI 1132 73
CON 1072 78 -5.6%; 0.52 0.082
WAT 1086 79 -4.2%; 0.84 0.010 * 1.3%; 0.13 0.652
ASP 1112 68 -1.7%; 0.48 0.104 3.8%; 0.39 0.185
P 10-20 (W) QUI 901 44
CON 880 45 -2.4%; 0.73 0.020 *
WAT 876 45 -2.9%; 0.94 0.005 * -0.5%; 0.12 0.657
ASP 878 47 -2.6%; 0.69 0.026 * -0.2%; 0.06 0.832
P 20-30 (W) QUI 707 31
CON 693 33 -2.0%; 0.43 0.138
WAT 691 34 -2.3%; 0.44 0.138 -0.2%; 0.03 0.918
ASP 695 36 -1.7%; 0.67 0.059 0.3%; 0.06 0.832
Fatigue Index (%)
QUI 45 3
CON 49 3 7.4%; 0.51 0.474
WAT 47 3 5.1%; 0.47 0.408 -2.5%; 0.16 0.725
ASP 50 3 9.1%; 0.59 0.128 1.9%; 0.06 0.830
* indicates significant difference between treatments (p < 0.05)

Chapter Two – Study 1
69
2.4.2d PROP tasting and sprint performance
Of the 14 participants, 3 were nontasters, 5 were medium tasters and 6 were supertasters.
No correlation was found between sensitivity to PROP and any of the improvements in
mean power (r2 = 0.046, p = 0.877), peak power (r2 = 0.088, p = 0.765), P0-10 (r2 = 0.071,
p = 0.810), P10-20 (r2 = 0.051, p = 0.862), or P20-30 (r2 = 0.069, p = 0.814). Furthermore, all
participants were able to taste the QUI and ASP solutions and described them with the
appropriate descriptor (e.g. bitter, sweet).
2.4.2e Heart rate and blood variables
Within each trial, both heart rate and blood lactate increased significantly in response to
the 30-s sprint (p < 0.05), with heart rate decreasing during the 7-min post-sprint period
and blood lactate remaining elevated at 7-min post exercise (Figure 2.7). Heart rate and
blood lactate were similar at all time points between the four experimental treatments (p
> 0.05; Figure 2.7). Likewise, blood glucose concentrations were similar between trials
at all time points (p > 0.05; Figure 2.7).
2.4.2f Subjective ratings
Within each trial, RPE increased significantly in response to the 30-s sprint (p < 0.05).
RPE was similar at all time points between the four experimental treatments (p > 0.05;
Figure 2.8). Likewise, nausea ratings were similar between trials at all time points (p >
0.05; Figure 2.8).

Chapter Two – Study 1
70
Q U I W A T A S P C O N0
2 04 06 08 0
1 0 01 2 01 4 01 6 01 8 0
He
ar
t R
ate
(b
pm
)
* * * *
Q U I W A T A S P C O N0
1
2
3
4
5
6
7
Blo
od
glu
co
se (
mM
)
Q U I W A T A S P C O N0
2
4
6
8
1 0
1 2
1 4
1 6
Blo
od
la
cta
te (
mM
)
*
** *
*
*
**
a b
c
Figure 2.7 Effect of mouth rinsing and ingesting solutions composed of 2 mM quinine
(QUI), plain water (WAT), 0.05% w/v aspartame (ASP), and a no-solution control
condition (CON) on (a) heart rate, (b) blood glucose level and (c) blood lactate level at 5
min pre-exercise ( ), immediately post-exercise ( ), and 7 min post-exercise ( ).
‘*’ indicates a significant difference from pre-exercise (p < 0.05). Values are expressed
as mean ± SEM (n = 14).
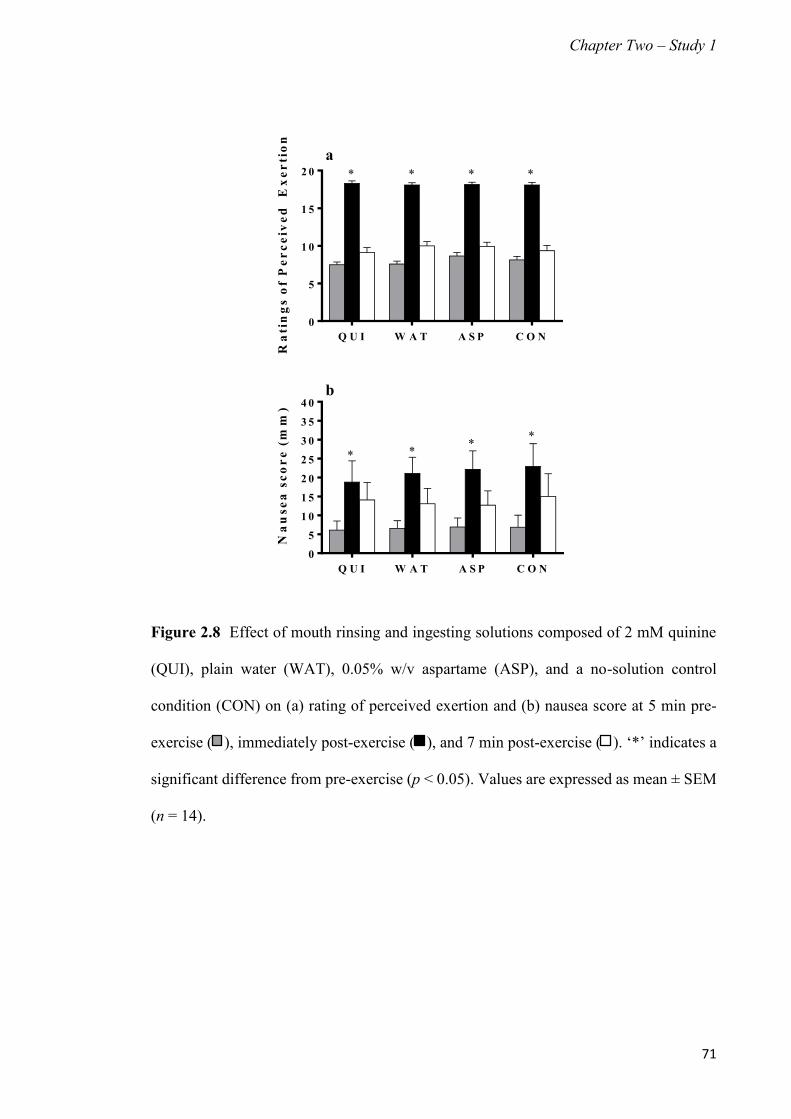
Chapter Two – Study 1
71
Q U I W A T A S P C O N0
5
1 0
1 5
2 0
Rat
ings
of
Per
ceiv
ed E
xert
ion
* * * *
Q U I W A T A S P C O N0
5
1 0
1 5
2 0
2 5
3 0
3 5
4 0
Nau
sea
scor
e (m
m)
* * * *
a
b
Figure 2.8 Effect of mouth rinsing and ingesting solutions composed of 2 mM quinine
(QUI), plain water (WAT), 0.05% w/v aspartame (ASP), and a no-solution control
condition (CON) on (a) rating of perceived exertion and (b) nausea score at 5 min pre-
exercise ( ), immediately post-exercise ( ), and 7 min post-exercise ( ). ‘*’ indicates a
significant difference from pre-exercise (p < 0.05). Values are expressed as mean ± SEM
(n = 14).

Chapter Two – Study 1
72
2.5 Discussion
There is evidence that CHO mouth rinsing improves endurance exercise performance as
well as muscle force production and maximal sprint performance (Carter et al., 2004b;
Rollo et al., 2008; Chambers et al., 2009; Gant et al., 2010; Jeukendrup & Chambers,
2010; Pottier et al., 2010; Fares & Kayser, 2011; Beaven et al., 2013; Lane et al., 2013;
Chong et al., 2014) likely via the stimulation of CHO taste receptors in the oral cavity.
This raises the issue of whether the oral administration of non-CHO tastants may also
affect exercise performance. This study shows for the first time that mouth rinsing with a
bitter tasting quinine solution followed by its ingestion immediately before a maximal 30-
s cycling sprint can improve performance. A significant 2.4 – 3.9% improvement in mean
power output was observed with the administration of quinine compared with an
aspartame solution, water and a no-rinse control condition. Peak power output was also
significantly higher (3.5 – 3.7%) with quinine compared with water and the no-rinse
condition. There were no differences in any of the performance measures between
aspartame, water, and no-rinse conditions, and there was no relationship between PROP
tasting status and the magnitude of the quinine-mediated improvement in performance.
Since the bitter taste of the quinine solution could not be masked, a number of precautions
were taken to ensure that any ergogenic effect of quinine on sprint performance was not
the result of a placebo effect. Firstly, participants were deceived about the true purpose
of the study. They were told that the aim of this study was to examine the effect of
different solutions on the responses of several blood variables (e.g. blood glucose and
blood lactate) to a maximal sprint. In order to further minimise the possibility of a placebo
effect, two placebo treatments were administered, namely plain water and a sweet
aspartame solution, with both known not to enhance performance (Chambers et al., 2009,
Chong et al., 2011). Given the absence of significant differences in any of the

Chapter Two – Study 1
73
performance or subjective measurements between the water, aspartame, and no-rinse
conditions, it is unlikely that a placebo effect occurred in response to quinine intake.
Consistent with the fact that this study followed a counterbalanced experimental design,
there was no order effect of trial administration for any of the performance variables
measured (p > 0.05), indicating that the familiarisation trial was sufficient to negate any
learning effects. In addition, the coefficient of variation between the familiarisation sprint
(which included a water rinse) and the water rinse experimental sprint was 2.1 and 2.2%
for mean and peak power output, respectively, suggesting limited variability with the
competitive cyclists and the performance test used in this study. The relative
improvements in performance observed with the use of quinine compared with the control
condition (3.9%) is high enough to be important for competitive athletes since Paton and
Hopkins (2001) have asserted that the smallest worthwhile enhancement in power output
for competitive track cyclists in events lasting < 60 s is approximately 0.5 - 1%. Whether
the performance in other sprint events lasting less than 30 s (e.g. 100 and 200 m track
sprint) would also benefit from quinine administration remains to be determined.
The mechanisms underlying the ergogenic benefits of quinine administration on sprint
performance remain to be elucidated. One possibility is that quinine improves sprinting
performance in a way similar to that proposed for CHO mouth rinsing by altering the
perception of effort, motivation and/or arousal level of the participants during exercise,
allowing them to exercise at a higher intensity (Carter et al., 2004b). Evidence that this
may be the case here is the observation that RPE did not differ between quinine and other
conditions despite the higher mean and peak power in the quinine trial. Since glucose
ingestion has been reported to facilitate corticomotor output to both fresh and fatigued
muscles (Gant et al., 2010), quinine administration may also have this effect. The

Chapter Two – Study 1
74
aforementioned proposed mechanisms are consistent with the findings that there is
marked overlap between the brain regions (e.g. anterior cingulate cortex, striatum)
stimulated by CHO and quinine (Zald et al., 2002; Small et al., 2003).
The unpleasantness associated with the strong bitter taste of quinine may also have played
a role in its ergogenic effect. Exposure to unpleasant visual stimuli has been found to
result in improved reaction times and increased muscle force production in an isometric
wrist extension task (Coombes et al., 2006; 2009), as well as increased corticomotor
excitability (Coombes et al., 2009; Coelho et al., 2010) compared with viewing neutral
and pleasant stimuli. Negative taste stimuli may act in a similar way, thus providing
support for the “negative brain theory” (Carretie et al., 2009) that the pattern of brain
activation in response to a negative or unpleasant stimulus favors urgent processing and
action. Whether the unpleasantness of the strong bitter taste of quinine contributes to its
ergogenic effect on sprint performance remains to be determined.
It is important to note that although quinine was chosen as the bitter tastant in this study,
thousands of structurally diverse compounds elicit bitter taste. Moreover, there are over
25 mammalian bitter taste receptors (known as T2Rs; Meyerhof, 2005), and each
responds to several different bitter compounds. Some of these receptors are very broadly
tuned, recognising bitter compounds with diverse structural elements, while others only
recognise tastants with specific structures (Meyerhof et al., 2010). Therefore, it is possible
that different bitter tastants may or may not affect exercise performance in the same
manner as quinine. In addition, the localisation of the T2Rs along the upper GI tract is
another factor that may mediate the effect of bitter tastants on exercise performance.
While T2Rs are found in taste buds in all regions of the oral cavity, there is evidence that
bitterness is sensed most strongly in the circumvallate papillae where the taste buds are

Chapter Two – Study 1
75
located in a V-shaped line at the back of the tongue and are innervated by the
glossopharyngeal nerve (Travers & Geran, 2009). Since bitter taste is typically associated
with substances that are potentially toxic or harmful, the T2Rs in the circumvallate
papillae may serve as the last line of defence against the ingestion of these substances
(Meyerhof, 2005) thus explaining the strongest sensation of bitterness in this area. It is
for this reason that the 10-s mouth rinse was combined with ingestion in this study in
order to maximally activate as many bitter receptors in the oral cavity as possible,
including those at the back of the tongue. It is unclear, however, whether mouth rinsing
alone, or ingestion alone without prolonged mouth rinsing with quinine would be
sufficient to produce an ergogenic effect comparable to that attained here with combining
mouth rinsing and ingestion of quinine.
Other factors likely to impact the effect of quinine on sprinting performance include the
concentration and timing of quinine administration. A concentration of 2 mM was used
in the current study because at this level quinine did not cause any nausea, irrespective of
one’s PROP tasting status. Given that stronger ANS responses were observed in response
to higher quinine concentrations and that not all participants experienced nausea under
these conditions, it is possible that ingesting quinine at more than 2 mM may further
improve sprint performance in some individuals. The time elapsed between quinine
administration and sprint performance is another factor that may affect the benefits of
quinine. This notion is supported by the observation that the ANS responses to quinine
last for no more than 80 - 120 s (Rousmans et al., 2000; Robin et al., 2003), thus
suggesting that for quinine to be beneficial, exercise should be performed immediately
after quinine intake.
In conclusion, this study shows for the first time that mouth rinsing and ingestion of a
quinine solution immediately before a maximal 30-s sprint can improve mean and peak

Chapter Two – Study 1
76
power output. These findings are likely to be meaningful for sprinters or power athletes
involved in short duration events. The mechanisms underlying the effect of quinine
remain to be elucidated, as well as the effect of quinine (or other bitter tastants) mouth
rinsing and ingestion on different modes of exercise, including endurance and resistance
exercise.

77
Chapter Three Mouth rinsing with a bitter solution without ingestion does not improve
sprint cycling performance
Based on a manuscript published in the European Journal of Applied
Physiology:
Gam, S., Tan, M., Guelfi, K. J., & Fournier, P. A. (2015). Mouth rinsing
with a bitter solution without ingestion does not improve sprint cycling
performance. European Journal of Applied Physiology, 115(1), 129-138.

Chapter Three – Study 2
78
3.1 Abstract
Purpose: Recently, it has been demonstrated that combining mouth rinsing with the
ingestion of a 2 mM quinine solution immediately before a 30-s cycling sprint
significantly improves performance. However, the strong bitterness of such a solution
produces an unpleasant taste and evokes nausea at higher concentrations. Given the
possibility that mouth rinsing with quinine without ingesting it may not produce nausea,
a mouth rinse-only protocol may be a more practical approach to administer quinine for
improving exercise performance. The purpose of the present study was to determine
whether mouth rinsing with quinine without ingesting it improves 30-s sprint cycling
performance. Methods: Twelve competitive male cyclists performed a 30-s maximal
cycling sprint immediately after rinsing their mouth for 10-s with either a 10 mM bitter
quinine solution (QUI), plain water (WAT), a 7.1% w/v sweet glucose solution (GLU),
or no solution at all (control; CON). Sprint performance was assessed, and heart rate,
rating of perceived exertion and blood variables were measured pre- and post-exercise.
Results: Mean power output during the 30-s sprint (QUI 888 ± 38; CON 873 ± 39; WAT
885 ± 37; GLU 873 ± 42 W; p = 0.431) as well as peak power (QUI 1230 ± 61; CON
1208 ± 65; WAT 1220 ± 70; GLU 1202 ± 59 W; p = 0.690) were similar between the 4
conditions. There were no significant differences in any other performance measures,
heart rate, subjective ratings or blood variables between conditions. Conclusions: Mouth
rinsing with a bitter tasting quinine solution without ingestion does not improve 30-s
sprint cycling performance.
Keywords: Quinine, bitter taste receptor, maximal exercise, power output

Chapter Three – Study 2
79
3.2 Introduction
It has recently been demonstrated for the first time that mouth rinsing plus ingestion of a
bitter tasting 2 mM quinine solution immediately before performing a maximal 30-s
cycling sprint significantly improves mean and peak power output compared with two
placebo solutions (plain water and a sweet aspartame solution) as well as a control
condition in which no solution was administered (Chapter 2; Gam et al., 2014). Since
exercise was performed immediately after ingesting the quinine solution, the ergogenic
effect was attributed to the stimulation of the bitter taste receptor cells (known as T2Rs)
in the oral cavity and along the upper portion of the gastrointestinal (GI) tract.
Unfortunately, ingesting quinine solutions at higher concentrations than 2 mM produces
a very strong bitter taste which is unpleasant and causes nausea (Chapter 2; Gam et al.,
2014). This is thought to be a defense mechanism protecting against the intestinal
absorption of potentially harmful substances (Peyrot de Gachons et al., 2011; Wicks et
al., 2005). Accordingly, a 2 mM quinine solution was adopted in the previous study
because this was the highest concentration that evoked significant autonomic nervous
system (ANS) responses without causing significant feelings of nausea when rinsed in
the mouth and then ingested (Chapter 2; Gam et al., 2014).
Since mouth rinsing with a quinine solution without ingesting it may be less unpleasant
and not produce nausea, a mouth rinse-only protocol may be a more practical approach
to administer quinine for improving exercise performance. However, given the
differences in T2R expression and innervation between the anterior portion of the oral
cavity and the remainder of the upper GI tract (Behrens et al., 2007), it is unclear whether
mouth rinsing alone, even with a higher concentration of quinine, would be sufficient to
produce an ergogenic effect.

Chapter Three – Study 2
80
The possibility that quinine mouth rinsing alone may be effective is indirectly supported
by the many studies which have demonstrated that carbohydrate (CHO) mouth rinsing
alone is beneficial for endurance performance (Carter et al., 2004b; Rollo et al., 2008;
Chambers et al., 2009; Jeukendrup & Chambers, 2010; Pottier et al., 2010; Lane et al.,
2013; Fares & Kayser, 2011), but challenged by the findings that a single CHO mouth
rinse does not enhance maximal cycling sprint performance (Chong et al., 2011). It should
be noted, however, that since CHO and bitter tastants are sensed by a different class of
taste receptors (Niki et al., 2010), it is possible that these tastants have different effects
on exercise performance. The aim of this study was firstly to determine the optimal
concentration of quinine solution to be rinsed in the mouth without ingestion, and then to
investigate whether a quinine mouth rinse alone enhances maximal cycling sprint
performance.
3.3 Methods:
3.3.1 Study Part 1: Dose response relationship between quinine concentration and
bitter taste perception and ANS responses
3.3.1a Participants
Eighteen healthy male volunteers provided written consent to participate in this study
(mean ± SD; age 26 ± 3 yr; body mass index 24 ± 3 kg/m2). All were nonsmokers, did
not report any gustatory or olfactory disorders, and were not taking any medication which
might alter their sense of taste or smell. Ethical clearance was obtained from the Human
Research Ethics Committee of The University of Western Australia (Appendix A).
Chapter Three – Study 2
81
3.3.1b Experimental Design
Participants attended the laboratory for three testing sessions, each conducted at the same
time of day. The first session was a 6-n-propylthiouracil (PROP) tasting session to assess
the sensitivity of the participants to the bitter chemical PROP. The next session examined
the subjective and objective responses to rinsing the mouth with a series of quinine
solutions of different concentrations to determine the quinine concentration to be used as
a mouth rinse in the associated performance study. A third session compared the mouth
rinsing protocol adopted in this study and the mouth rinsing plus ingestion protocol
described in the previous study (Chapter 2; Gam et al., 2014). Participants were instructed
to avoid eating or drinking anything other than water for 1 h prior to each testing session.
3.3.1c Session 1 - Assessment of PROP tasting status
Before investigating the dose response to quinine, individual differences in the ability to
taste PROP were determined for each participant as described in Chapter 2 (Gam et al.,
2014). This was undertaken because inter-individual variations have been reported in
bitter tasting sensitivity, with the ability to taste PROP generally adopted to compare
individuals (Tepper et al., 2001). Briefly, this involved measuring the perceived intensity
of PROP compared to a reference sodium chloride (NaCl) solution to allow participants
to be categorised as PROP non-tasters, medium tasters or supertasters (Tepper et al.,
2001; as described in Chapter 2).
3.3.1d Session 2 - Assessment of the dose response relationships between quinine
mouth rinsing and both taste perception and ANS responses
In order to determine the dose response relationships between quinine mouth rinsing and
both taste and ANS responses, each participant was required to sequentially rinse his
mouth and then expel 25 ml of six solutions of increasing concentrations (0, 2, 4, 6, 8,

Chapter Three – Study 2
82
and 10 mM) of quinine (Sigma-Aldrich, St. Louis, MO, USA) and six solutions of a single
NaCl concentration (Sigma-Aldrich). NaCl was presented in a standardised concentration
of 0.1 M to serve as a dishabituator (Epstein et al., 1992). All solutions were prepared
with doubly deionised water (Direct-Q 5 Ultrapure Water System, Millipore, MA, USA).
On the day of testing, all solutions were kept at room temperature (24 C) and placed on
a table in front of the participant in identical plastic cups. At the onset of the test,
participants first tasted one of the NaCl solutions, then alternated quinine and NaCl
solutions. Quinine solutions were presented in order of ascending concentration to
prevent the expected nausea associated with tasting the highest concentration of quinine
from invalidating the assessment of subsequent solutions. Each solution was rinsed in the
mouth for 10-s before being expelled. Immediately following quinine expulsion,
participants gave subjective ratings of taste intensity and unpleasantness using a general
labeled magnitude scale (gLMS; Green et al., 1996; Appendix E), with adjectives altered
to specify either intensity or unpleasantness. Participants also gave ratings of nausea using
a 100 mm visual analog scale bounded by the descriptors “no nausea” and “extreme
nausea” (Muth et al., 1996; Appendix E).
The ANS responses to quinine were continuously assessed indirectly by measuring skin
conductance (SC) amplitude, ohmic perturbation duration (OPD) index, which has been
shown to reflect the emotional load of the stimulus (Vernet-Maury et al., 1995) and
instantaneous heart rate (IHR), as described in Chapter 2 (Gam et al., 2014). The next
solution (either quinine or NaCl) was administered once SC and IHR returned to baseline
levels and were no longer fluctuating (approximately 2-3 min). In the rest period between
solutions, participants rinsed their mouth with water ad libitum. Preliminary work was

Chapter Three – Study 2
83
performed to ensure that the rest period between consecutive quinine exposures at a given
concentration did not result in habituation of taste or ANS responses.
3.3.1e Session 3 – Comparison of the effect of combined mouth rinsing and ingestion
of a 2 mM quinine solution and mouth rinsing a 10 mM quinine solution on taste
perception and ANS responses
In order to compare the subjective and ANS responses between the mouth rinsing protocol
adopted in this study and the mouth rinsing plus ingestion protocol described in Chapter
2 (Gam et al., 2014), the ANS and subjective responses to these two protocols were
assessed and compared as described above.
3.3.1f Data and statistical analysis
Psychophysical curves were graphed for the mean subjective (intensity, unpleasantness
and nausea) and ANS (SC, OPD, IHR) responses across the range of solution
concentrations. One-way repeated measures ANOVA was used to compare the responses
between concentrations followed by Fisher’s LSD post hoc tests, with differences
accepted at p < 0.05 (Statistical Package for the Social Sciences Version 17.0 for
Windows software, Chicago, IL). Participants were then divided into groups based on
their PROP tasting status, with the ANS and subjective responses compared using two-
way mixed-model ANOVA with Fisher’s LSD post hoc tests. The ANS and subjective
responses to mouth rinsing with a 10 mM solution were compared with the responses of
the combined mouth rinsing and ingestion of a 2 mM solution using paired t-tests. All
values, unless otherwise stated, are expressed as mean ± SEM.

Chapter Three – Study 2
84
3.3.2 Study Part 2: Effect of quinine mouth rinsing on sprint performance
3.3.2a Participants
Twelve trained male cyclists (mean ± SD; age: 27 ± 3 yr, height: 180 ± 8 cm, mass: 75.64
± 11.51 kg, V O2peak: 61.30 ± 6.91 ml/kg/min) were recruited for this study. Participants
were fully informed of the testing procedures before their written consent was obtained.
However, in order to minimise the possibility of a placebo effect, they were deceived
about the true purpose of the study, and were instead informed that the aim of the study
was to determine the effect of different taste solutions on the metabolic responses to
maximal exercise. After completing all trials, participants were personally debriefed as to
the true aim of the study. The procedures were approved by the Human Research Ethics
Committee of The University of Western Australia (Appendix A).
3.3.2b Experimental design
Each participant visited the laboratory on five separate occasions, each separated by 7
days and conducted at the same time of day for each participant. The initial visit involved
the assessment of PROP tasting status and V O2peak prior to familiarisation with the mouth
rinsing procedure and sprint protocol to be used in the subsequent experimental trials.
For the following four experimental trials, participants completed a 30-s maximal cycling
sprint immediately after rinsing their mouth and expelling either plain water (WAT), a
sweet glucose solution (GLU), a bitter quinine solution (QUI), or a no-rinse control
(CON) administered in a randomised, counterbalanced order. The glucose solution acted
as an additional placebo solution given that mouth rinsing with such a solution does not
affect sprint performance (Chong et al., 2011).

Chapter Three – Study 2
85
3.3.2c Initial session
Individual differences in bitter taste perception were first taken into account, with
participants’ PROP tasting status determined as described previously. Following the
PROP tasting test, participants completed a V O2peak test on an air-braked cycle ergometer
(Evolution Pty. Ltd., Adelaide) using the protocol described in Chapter 2 (Gam et al.,
2014). Following the V O2peak test, participants completed the sprint cycling protocol to
be used in the subsequent experimental trials preceded by a plain water rinse in order to
become accustomed to the experimental procedures. Before leaving the laboratory,
participants were given a food and physical activity diary, and were asked to record all
food and drink intake and physical activity in the 24 h prior to each experimental trial.
Energy intake (kJ) was quantified from the food diaries using commercially available
software (Foodworks; Xyris Software, Kenmore Hills, QLD, Australia). A copy of the
diary from the first trial was returned to each participant, and they were asked to replicate
the same diet and activity patterns in the 24 h prior to each trial (Jeacocke & Burke, 2010).
Compliance was confirmed upon arrival to the laboratory for each experimental trial by
inspection of food diaries from the previous 24 h. Participants were also instructed to fast
overnight prior to each trial and to avoid strenuous exercise, alcohol and caffeine in the
24 h preceding each testing session.
3.3.2d Experimental sessions
Upon arriving at the lab, participants had their body mass measured and were fitted with
a heart rate monitor (Garmin Ltd., Kansas, USA). They then performed a 4-min light
cycling warm up at 40% of V O2peak followed by a 2 to 3-s practice start to become
accustomed to the amount of force required to start the pedals moving (Exertech EX-10
front access cycle ergometer, Repco Cycle Company, Huntingdale, Victoria). Seat height
was standardised for each participant. After 10 min of rest, participants were given either

Chapter Three – Study 2
86
25 mL of plain water (WAT), 25 mL of a 7.1% glucose solution (GLU; Glucodin, Boots
Healthcare, NSW, Australia), 25 mL of a 10 mM quinine solution (QUI; Sigma-Aldrich),
or they were not given any mouth rinse at all (CON). Participants were instructed to rinse
their mouth for 10-s and then expel the solution into a plastic cup.
Immediately after rinsing and expelling the solution, participants performed a 30-s
maximal sprint effort, initiated in a standing position with the preferred foot starting at
the “2 o’clock” position. The cycle ergometer was interfaced with a customised program
(Cyclemax, School of Sport Science, Exercise and Health, The University of Western
Australia) to allow for the measurement of mean power output over 0-30 s (Pmean), peak
power output (Ppeak), mean power output over 0-10 s (P0-10), 10-20 s (P10-20), and 20-30 s
(P20-30) of the sprint. Participants were instructed to cycle in an “all-out” manner for 30 s
without pacing themselves.
Before the commencement of the mouth rinse protocol and at 0 and 7 min post-sprint,
heart rate (HR) was recorded and each participant provided subjective ratings of
perceived exertion (RPE; Borg 1982; Appendix E) and nausea. Nausea ratings were made
using a 100 mm visual analog scale anchored with the descriptors “No Nausea” and
“Extreme Nausea” (Muth et al., 1996; Appendix E). At the same timepoints, a capillary
blood sample (125 µL) was taken from the fingertip (Clinitubes, Radiometer,
Copenhagen) and analysed immediately for blood lactate and glucose using a blood gas
analyser (ABLTM 725, Radiometer, Copenhagen).
3.3.2e Statistical analysis
The effects of mouth rinse treatment on each performance variable were compared using
one-way repeated measures ANOVA followed by Fisher’s LSD post hoc tests, with

Chapter Three – Study 2
87
differences accepted at p < 0.05 (Statistical Package for the Social Sciences Version 17.0
for Windows software, Chicago, IL). Cohen’s effect size (ES) statistics were also used to
highlight any trends. All values, unless otherwise stated, are expressed as mean ± SEM.
3.4 Results
3.4.1 Study Part 1: Dose response relationship between quinine concentration and
bitter taste perception and ANS responses
3.4.1a Effect of PROP tasting status on the dose response relationship between quinine
concentration and bitter taste perception and ANS responses
Of the 18 participants, 5 were nontasters, 5 were medium tasters, and 8 were supertasters.
When participants were grouped accordingly, there were no significant differences (p >
0.05) between groups for any of the ANS variables examined, or for subjective ratings of
taste intensity, unpleasantness, and nausea level. This indicates that sensitivity to PROP
may not be related to the ANS and perceptual responses to quinine, which is in agreement
with other studies (Delwiche et al., 2001; Keast & Roper, 2007) who have found no
correlation between PROP sensitivity and sensitivity to other bitter compounds, including
quinine.
3.4.1b Taste perception responses
Psychophysical curves for taste intensity, unpleasantness and nausea are shown in Figures
3.1, 3.2 and 3.3, respectively. As the concentration of quinine increased there were
significant increases (p < 0.05) in the perception of taste intensity and unpleasantness
(Figure 3.1, 3.2). The curve for taste intensity plateaued at 6 mM, indicating that an
increase in concentration above 6 mM no longer caused a subsequent increase in the
perception of intensity (Figure 3.1). The unpleasantness curve did not plateau, with

Chapter Three – Study 2
88
significant differences between each successive concentration (p < 0.05, Figure 3.2).
There were no significant differences (p > 0.05) between concentrations for nausea
(Figure 3.3).

Chapter Three – Study 2
89
0
2 0
4 0
6 0
8 0
1 0 0
Tas
te I
nte
nsi
ty (
gLM
S)
0 2 4 6 8 1 00
2 0
4 0
6 0
8 0
1 0 0
Q u in in e C o n c e n tr a tio n (m M )
Tas
te I
nte
nsi
ty (
gLM
S)
a
b
**
##
Figure 3.1 Psychophysical curves in response to mouth rinsing with quinine for
subjective ratings of taste intensity in (a) all participants and (b) participants grouped by
PROP tasting status (PROP supertasters [ ], medium tasters [ ] and non-tasters [ ]).
‘*’ indicates a significant difference from preceding concentration level in all
participants, ‘#’ indicates significant difference from preceding concentration level in all
PROP groups (p < 0.05). Values are expressed as mean ± SEM (n = 18).

Chapter Three – Study 2
90
0
2 0
4 0
6 0
8 0
1 0 0
Un
ple
asan
tnes
s (g
LM
S)
0 2 4 6 8 1 00
2 0
4 0
6 0
8 0
1 0 0
Q u in in e C o n c e n tr a tio n (m M )
Un
ple
asan
tnes
s (g
LM
S)
a
b
# ##
#
** * *
Figure 3.2 Psychophysical curves in response to mouth rinsing with quinine for
subjective ratings of unpleasantness in (a) all participants and (b) participants grouped by
PROP tasting status (PROP supertasters [ ], medium tasters [ ] and non-tasters [ ]).
‘*’ indicates a significant difference from preceding concentration level in all
participants, ‘#’ indicates significant difference from preceding concentration level in all
PROP groups (p < 0.05). Values are expressed as mean ± SEM (n = 18).

Chapter Three – Study 2
91
0
2 0
4 0
6 0
8 0
1 0 0
Nau
sea
(mm
)
0 2 4 6 8 1 00
2 0
4 0
6 0
8 0
1 0 0
Q u in in e C o n c e n tr a tio n (m M )
Nau
sea
(mm
)
b
a
Figure 3.3 Psychophysical curves in response to mouth rinsing with quinine for
subjective ratings of nausea in (a) all participants and (b) participants grouped by PROP
tasting status (PROP supertasters [ ], medium tasters [ ] and non-tasters [ ]). Values
are expressed as mean ± SEM (n = 18).

Chapter Three – Study 2
92
3.4.1c Autonomic nervous system responses
Psychophysical curves for SC amplitude, OPD and IHR amplitude are shown in Figures
3.4, 3.5 and 3.6, respectively. As the concentration of quinine increased, there were
significant increases in ANS responses (p < 0.05) up to a maximum at 4, 6, and 6 mM for
SC amplitude, OPD, and IHR amplitude, respectively (Figure 3.4, 3.5, 3.6).

Chapter Three – Study 2
93
0
1
2
3
4
5
6
SC
am
pli
tud
e
( S
iem
ens)
0 2 4 6 8 1 00
1
2
3
4
5
6
Q u in in e C o n c e n tr a tio n (m M )
SC
am
pli
tud
e
( S
iem
ens)
*a
b #
Figure 3.4 Psychophysical curves in response to mouth rinsing with quinine for the
amplitude of the skin conductance (SC) response in (a) all participants and (b) participants
grouped by PROP tasting status (PROP supertasters [ ], medium tasters [ ] and non-
tasters [ ]). ‘*’ indicates a significant difference from preceding concentration level in
all participants, ‘#’ indicates significant difference from preceding concentration level in
all PROP groups (p < 0.05). Values are expressed as mean ± SEM (n = 18).

Chapter Three – Study 2
94
0
1 0
2 0
3 0
4 0
5 0
6 0
7 0
OP
D (
s)
0 2 4 6 8 1 00
1 0
2 0
3 0
4 0
5 0
6 0
7 0
Q u in in e C o n c e n tr a tio n (m M )
OP
D (
s)
a
b
**
##
Figure 3.5 Psychophysical curves in response to mouth rinsing with quinine for ohmic
perturbation duration (OPD) in (a) all participants and (b) participants grouped by PROP
tasting status (PROP supertasters [ ], medium tasters [ ] and non-tasters [ ]).
‘*’ indicates a significant difference from preceding concentration level in all
participants, ‘#’ indicates significant difference from preceding concentration level in all
PROP groups (p < 0.05). Values are expressed as mean ± SEM (n = 18).

Chapter Three – Study 2
95
0
5
1 0
1 5
2 0
2 5
IHR
am
pli
tud
e (b
pm
)
0 2 4 6 8 1 00
5
1 0
1 5
2 0
2 5
Q u in in e C o n c e n tr a tio n (m M )
IHR
am
pli
tud
e (b
pm
)
a
b
**
##
Figure 3.6 Psychophysical curves in response to mouth rinsing with quinine for the
amplitude of the instantaneous heart rate (IHR) response in (a) all participants and (b)
participants grouped by PROP tasting status (PROP supertasters [ ], medium tasters
[ ] and non-tasters [ ]). ‘*’ indicates a significant difference from preceding
concentration level in all participants, ‘#’ indicates significant difference from preceding
concentration level in all PROP groups (p < 0.05). Values are expressed as mean ± SEM
(n = 18).

Chapter Three – Study 2
96
3.4.1d Comparison of the effect of combined mouth rinsing and ingestion of a 2 mM
quinine solution and mouth rinsing a 10 mM quinine solution on taste perception and
ANS responses
Subjective ratings of taste intensity, unpleasantness, nausea level and all indicators of
ANS responses did not differ between mouth rinsing with a 10 mM quinine solution
compared with the combined mouth rinsing and ingestion of a 2 mM quinine solution (p
> 0.05; Figure 3.7).
3.4.1e Determination of the quinine concentration to be used for study Part 2
A 10 mM quinine solution was adopted for use in Study Part 2 given that participants did
not experience nausea at any of the concentrations tested and to ensure that the solution
evoked a maximal ANS response.

Chapter Three – Study 2
97
I n te n s ity (g L M S )
U n p le a s a n tn e s s(g L M S )
N a u s e a (m m )
0
1 0
2 0
3 0
4 0
5 0
6 0
S C a m p litu d e ( s ie m e n s )
O P D (s ) I H R a m p litu d e (b p m )
0
1 0
2 0
3 0
4 0
5 0
6 0
7 0
a
b
Figure 3.7 Comparison of (a) subjective and (b) autonomic nervous system responses
between mouth rinsing then ingesting a 2 mM quinine solution ( ) and mouth rinsing a
10 mM quinine solution ( ). Values are expressed as mean ± SEM (n = 18).

Chapter Three – Study 2
98
3.4.2 Study Part 2: Effect of quinine mouth rinsing on sprint performance
3.4.2a Nutritional intake and environmental conditions
There was no significant difference in either total energy intake (CON 10,568 ± 224; QUI
9,976 ± 209; WAT 10,723 ± 252; GLU 10,299 ± 229 kJ; p = 0.391) or carbohydrate intake
(CON 324 ± 23; QUI 319 ± 20; WAT 340 ± 27; GLU 331 ± 24 g; p = 0.480) for the 24
h prior to each experimental trial. Laboratory temperature and relative humidity were
similar between trials (p > 0.05).
3.4.2b 30-s Sprint performance
Mean power and peak power were similar between the four treatments (p > 0.05; Table
3.1). In addition, there were no significant differences in P0-10, P10-20 and P20-30 between
treatments (p > 0.05; Table 3.1). Only small/ trivial effect sizes were observed for the
performance variables in the quinine condition compared with the other three conditions
(Table 3.1).

Chapter Three – Study 2
99
Table 3.1 Mean power (Pmean) and peak power output (Ppeak) during a 30-s maximal sprint
and various periods within the sprint (P0-10,10-20,20-30) after mouth rinsing with quinine
(QUI), a no-rinse control (CON), water (WAT) or glucose (GLU) (n = 12; mean ± SEM).
Performance Variable
Treatment
Result
Mean relative change
from QUI (%); ES
p
Mean relative change
from CON (%); ES
p
P Mean (W) QUI 888 ± 38
CON 873 ± 39 -1.6%; 0.30 0.134
WAT 885 ± 37 -0.2%; 0.05 0.877 1.4%; 0.32 0.278
GLU 873 ± 42 -1.6%; 0.29 0.339 0.0%; 0.00 0.981
P Peak (W) QUI 1230 ± 61
CON 1208 ± 65 -1.8%; 0.21 0.478
WAT 1220 ± 70 -0.8%; 0.10 0.726 1.0%; 0.14 0.641
GLU 1202 ± 59 -2.3%; 0.36 0.242 -0.5%; 0.06 0.836
P 0-10 (W) QUI 1040 ± 55
CON 997 ± 64 -4.3%; 0.46 0.142
WAT 1034 ± 59 -0.6%; 0.05 0.854 1.0%; 0.35 0.269
GLU 1004 ± 57 -3.5%; 0.40 0.196 0.7%; 0.07 0.807
P 10-20 (W) QUI 894 ± 35
CON 908 ± 38 1.5%; 0.38 0.238
WAT 899 ± 37 0.6%; 0.14 0.654 -0.9%; 0.16 0.596
GLU 883 ± 48 -1.3%; 0.11 0.714 -2.8%; 0.21 0.508
P 20-30 (W) QUI 721 ± 33
CON 717 ± 27 -0.6%; 0.08 0.786
WAT 714 ± 28 -1.0%; 0.11 0.720 -0.4%; 0.04 0.881
GLU 727 ± 35 0.8%; 0.11 0.701 1.5%; 0.18 0.562

Chapter Three – Study 2
100
3.4.2c PROP tasting and sprint performance
Of the 12 participants, 2 were PROP nontasters, 4 were medium tasters, and 6 were
supertasters. No correlation was found between sensitivity to PROP and any of the
performance measures (r2 = 0.053 – 0.44, p = 0.261 – 0.891). All participants were able
to taste both the QUI and GLU solutions and described them with the appropriate
descriptor (e.g. bitter, sweet).
3.4.2d Heart rate and blood variables
Within each trial, both heart rate and blood lactate increased significantly in response to
the 30-s sprint (p < 0.05), with heart rate decreasing during the 7-min post-sprint period
and blood lactate remaining elevated at 7-min post exercise (Figure 3.8). Heart rate and
blood lactate were similar at all time points between the four experimental treatments (p
> 0.05; Figure 3.8). Likewise, blood glucose concentrations were similar between trials
at all time points (p > 0.05; Figure 3.8).
3.4.2e Subjective ratings
Within each trial, RPE increased significantly in response to the 30-s sprint (p < 0.05).
RPE was similar at all time points between the four experimental treatments (p > 0.05;
Figure 3.9). Likewise, nausea ratings were similar between trials at all time points (p >
0.05; Figure 3.9).

Chapter Three – Study 2
101
Q U I C O N W A T G L U0
2 04 06 08 0
1 0 01 2 01 4 01 6 01 8 02 0 0
Hea
rt
Ra
te (
bp
m)
a
* * * *
Q U I C O N W A T G L U0
2
4
6
8
1 0
1 2
1 4
1 6
Blo
od
la
cta
te (
mM
)
*
**
*
*
*
*
*
b
Q U I C O N W A T G L U0
1
2
3
4
5
6
7
Blo
od
glu
cose
(m
M)
c
Figure 3.8 Effect of mouth rinsing with solutions composed of 10 mM quinine (QUI),
plain water (WAT), 7.1% w/v glucose (GLU), and a no-solution control condition (CON)
on (a) heart rate, (b) blood lactate and (c) blood glucose at 5 min pre ( ), immediately
post ( ), and 7 minutes after ( ) exercise. ‘*’ indicates a significant difference from pre-
exercise (p < 0.05). Values are expressed as mean ± SEM (n = 12).

Chapter Three – Study 2
102
Figure 3.9 Effect of mouth rinsing with solutions composed of 10 mM quinine (QUI),
plain water (WAT), 7.1% w/v glucose (GLU), and a no-solution control condition (CON)
on (a) rating of perceived exertion, (b) nausea score at 5 min pre ( ), immediately post
( ), and 7 minutes after ( ) exercise. ‘*’ indicates a significant difference from pre-
exercise (p < 0.05). Values are expressed as mean ± SEM (n = 12).
Q U I C O N W A T G L U0
5
1 0
1 5
2 0
Rat
ing
of p
erce
ived
exe
rtio
n
* * * *
a
Q U I C O N W A T G L U0
2 0
4 0
6 0
8 0
1 0 0
Nau
sea
scor
e (m
m)
b
***
*
*
* * *

Chapter Three – Study 2
103
3.5 Discussion
It has recently been reported that combining mouth rinsing and the ingestion of a bitter
tasting 2 mM quinine solution significantly improved performance of a 30-s cycling sprint
(Chapter 2; Gam et al., 2014). It was also demonstrated that the strong bitterness of such
a solution produced an unpleasant taste and evoked nausea at higher concentrations, thus
limiting the concentration of quinine that could be tested (Chapter 2; Gam et al., 2014).
Given the possibility that mouth rinsing with quinine without ingesting it may not produce
nausea, a mouth rinse-only protocol may be a more practical approach to administer
quinine for improving exercise performance. The primary purpose of this study was to
determine whether mouth rinsing with a strong quinine concentration improves maximal
cycling sprint performance. In order to meet this objective, the appropriate concentration
of quinine to be used in the mouth rinse was determined as the concentration that
optimised taste intensity and ANS responses while limiting feelings of nausea. It was
found that mouth rinsing with a bitter tasting quinine solution alone does not affect
performance (mean and peak power) of a maximal 30-s cycling sprint and has no effect
on heart rate, RPE, blood variables, or subjective ratings of nausea compared to placebo
and control treatments.
The small effect sizes and lack of statistical significance observed in this study suggests
that quinine mouth rinsing has no effect on cycling sprint performance. Importantly, there
was no order effect of trial administration for any of the performance variables measured
(p > 0.05). In addition, the coefficients of variation between the familiarisation sprint
(which included a water rinse) and the water rinse experimental sprint were 2.5 and 2.8%
for mean and peak power output, respectively, suggesting limited intra-individual
variability of the participants between testing sessions.

Chapter Three – Study 2
104
Since the participants could taste the difference between the mouth rinse solutions tested
here, a number of precautions were taken to avoid any placebo effect. Participants were
deceived about the true purpose of the study, being told that this study was concerned
with examining the effect of different taste solutions on the responses of several blood
variables (i.e. blood glucose and blood lactate) to a maximal sprint effort. In order to
further minimise the possibility of a placebo effect, two placebo treatments were
administered, namely a plain water and a sweet glucose solution, with both known not to
enhance maximal sprint performance (Chong et al., 2011). Overall, the success of the
aforementioned precautions at preventing a placebo effect is suggested by the absence of
significant differences in any of the performance measures between the quinine mouth
rinse treatment and the water, glucose and no-rinse conditions.
It is also unlikely that the lack of ergogenic effect of quinine mouth rinsing in this study
was the result of a suboptimal concentration of quinine solution. A 10 mM concentration
was chosen for the quinine mouth rinsing treatment based on the findings that taste
intensity and ANS responses plateaued at concentrations of approximately 6-8 mM. Since
mouth rinsing with a 10 mM quinine solution did not cause any additional feelings of
nausea, this concentration was chosen to ensure maximal taste perception and ANS
activation occurred prior to the exercise bout. It should be noted that the taste intensity
and ANS responses of the 10 mM mouth rinsing protocol did not differ significantly from
those associated with the combined ingestion and mouth rinsing of the 2 mM quinine
solution adopted in Chapter 2 (Gam et al., 2014; Figure 3.3). However, these results do
not exclude the possibility that mouth rinsing with a higher concentration of quinine may
affect sprint performance.

Chapter Three – Study 2
105
The lack of effect of mouth rinsing with a quinine solution on sprint performance may be
explained on the basis of the location and innervation of the T2Rs stimulated by the mouth
rinse solution. By expelling, rather than swallowing, the quinine solution post-mouth
rinsing, the activation of T2Rs in the posterior oral cavity and remainder of the upper GI
tract was avoided. There is evidence of increased T2R expression on the posterior tongue
compared with the anterior tongue (Behrens et al., 2007), and there are also differences
in T2R innervation within the oral cavity and upper GI tract. T2Rs in the posterior oral
cavity (including the posterior tongue) and remainder of the upper GI tract (soft palate,
pharynx and upper esophagus) are innervated by the glossopharyngeal and vagus nerves,
respectively, while those in the anterior oral cavity are innervated by the chorda tympani
branch of the facial nerve (Behrens & Meyerhof, 2006). There is evidence that the
glossopharyngeal nerve is selectively tuned to detect bitterness (Frank, 1991; Danilova &
Hellekant, 2003; Geran & Travers, 2006; 2011). Given these differences in T2R
expression and innervation, perhaps the activation of T2Rs in the posterior oral cavity
and upper GI tract is related to the previously observed ergogenic benefit of ingesting
quinine, and that the lack of activation of these T2Rs in the present study may have
contributed to the absence of an ergogenic effect. It is important to note, however, that
this interpretation must be taken with caution given that it is based on the results of two
different studies performed on different participants exposed to different concentrations
of quinine.
In conclusion, the present study shows that quinine mouth rinsing does not affect 30-s
cycling sprint performance. It remains unclear whether quinine mouth rinsing (or the
administration of other bitter tastants) can improve the performance of other modes of
exercise.

106
Chapter Four Mouth rinsing and ingestion of a bitter tasting solution increases corticomotor excitability in male competitive cyclists
Based on a manuscript published in the European Journal of Applied
Physiology:
Gam, S., Guelfi, K. J., Hammond, G., & Fournier, P. A. (2015). Mouth
rinsing and ingestion of a bitter-tasting solution increases corticomotor
excitability in male competitive cyclists. European Journal of Applied
Physiology, doi: 10.1007/s00421-015-3200-2.

Chapter Four – Study 3
107
4.1 Abstract
Purpose: Recently it has been demonstrated that the combination of mouth rinsing and
ingesting a bitter tasting quinine solution immediately prior to the performance of a
maximal 30-s cycling sprint significantly improves mean and peak power output. This
ergogenic effect may be related to the activation of the corticomotor pathway by afferent
taste signals originating from bitter taste receptors in the oral cavity. The aim of the
present study was to use single-pulse transcranial magnetic stimulation (TMS) to
investigate whether mouth rinsing and ingestion of a bitter quinine solution increases
corticomotor excitability. Methods: A series of 10 motor evoked potentials (MEPs) were
recorded from the relaxed first dorsal interosseous muscle in 16 male competitive cyclists
immediately before and after they rinsed their mouth for 10-s and then ingested either a
2 mM bitter quinine solution or plain water. Results: Mean MEP amplitude was
significantly increased in response to quinine administration by 16% (p < 0.05), with no
evidence of a time-dependent effect over the 10 pulses. Conclusions: The activation of
bitter taste receptors in the oral cavity and upper gastrointestinal tract has the capacity to
increase corticomotor excitability in male competitive cyclists.
Keywords: Bitter taste, quinine, motor cortex, motor-evoked potential facilitation,
transcranial magnetic stimulation

Chapter Four – Study 3
108
4.2 Introduction
Recently, it has been demonstrated that the combination of mouth rinsing and ingestion
of a bitter tasting quinine solution immediately before a maximal 30-s cycling sprint
significantly improves mean and peak power output (Chapter 2; Gam et al., 2014). Given
that the ergogenic effect of quinine was observed immediately after the ingestion of the
quinine solution (Chapter 2, Gam et al., 2014) the underlying mechanism for this effect
is likely to be of a neural origin. Mouth rinsing with a quinine solution, without ingesting
it, does not improve sprint performance (Chapter 3, Gam et al., 2015), suggesting that
ingestion (and therefore the activation of bitter taste receptors in the oral cavity as well as
in the upper gastrointestinal [GI] tract) is important in eliciting an ergogenic effect. While
the specific mechanism underlying the ergogenic effect of quinine is unknown, it may be
related to the activation of several brain areas by afferent taste signals (Zald et al., 2002;
Small et al., 2003), which may affect corticomotor excitability and thereby influence
performance (Critchley, 2005; Kelley et al., 2005).
One way to test the hypothesis that quinine administration impacts corticomotor
excitability is with the use of transcranial magnetic stimulation (TMS), a non-invasive
method commonly used to investigate the physiological state of neural networks between
the motor cortex and skeletal muscles. Single-pulse TMS over the primary motor cortex
produces motor evoked potentials (MEPs) in the electromyographic (EMG) recording of
a target muscle, with the amplitude of MEPs reflecting the excitability of neurons in the
corticomotor pathway (Anand & Hotson, 2002).
Evidence that taste may influence corticomotor excitability comes from the work of Gant
and colleagues (2010), who observed a 9% increase in MEP amplitude in the first dorsal
interosseous (FDI) muscle in response to rinsing the mouth with a carbohydrate (CHO)

Chapter Four – Study 3
109
solution. While CHO and bitter tastants are sensed by different classes of taste receptors,
they appear to elicit a similar pattern of central activation (Zald et al., 2002; Small et al.,
2003), raising the possibility that bitter taste may also affect corticomotor excitability.
Since the immediate effect of a bitter tastant on the corticomotor pathway has never
before been investigated, the purpose of this study was to determine whether combined
mouth rinsing and ingestion of a bitter quinine solution increases corticomotor
excitability assessed using single-pulse TMS.
4.3 Methods
4.3.1 Participants
Sixteen healthy, right-handed male competitive cyclists (mean ± SD age: 32 ± 4 yr; mass:
77.64 ± 7.53 kg; V O2peak: 56.37 ± 7.10 ml/kg/min) provided written informed consent to
participate in this study. Volunteers were excluded if they reported any contraindication
to TMS. No participants reported any adverse effects of TMS. Ethical clearance was
obtained from the Human Research Ethics Committee of The University of Western
Australia (Appendix A).
4.3.2 Experimental design
Participants attended the laboratory for two sessions, each conducted at the same time of
morning following an overnight fast. Participants were asked to fast overnight in order to
replicate the nutritional status of the participants in Chapter 2 (Gam et al., 2014), since it
is possible that nutritional status may affect the brain responses to taste stimuli
(Kringelbach et al., 2003). A quinine solution and plain water (to serve as a control) were
administered in each session in a counterbalanced order between participants. Participants
were divided into two independent groups on the basis of the order of solution
administration in each session to account for any possible order effect in treatment

Chapter Four – Study 3
110
administration. Group 1 received quinine followed by water in session 1 and water
followed by quinine in session 2, while Group 2 received water first in session 1 and
quinine first in session 2. In each session, participants rinsed their mouth for 10-s with
either quinine or plain water before ingesting the solution. Ten TMS pulses, each
separated by 5 s, were administered immediately before mouth rinsing and another 10
TMS pulses were administered immediately after ingestion. After a 5-min rest during
which participants were allowed to drink water ad libitum, the procedure was repeated
with the remaining solution.
The quinine solution was composed of 2 mM quinine hydrochloride (Sigma-Aldrich, St.
Louis, MO, USA) prepared with doubly deionised water (Direct-Q 5 Ultrapure Water
System, Millipore, MA, USA). A combined mouth rinse and ingestion protocol with this
solution and specific concentration was chosen based on the previous observation that it
significantly improves mean and peak power output during a maximal 30-s cycling sprint
(Chapter 2; Gam et al., 2014) while mouth rinsing alone (without ingestion) of a quinine
solution does not improve performance (Chapter 3; Gam et al., 2015). Solutions were
presented in a volume of 25 mL at room temperature in identical plastic cups.
4.3.3 Assessment of PROP tasting status
After the second session, participants completed a PROP tasting test in order to assess
their sensitivity to the bitter tastant PROP. This is because interindividual variations have
been reported in bitter tasting sensitivity, with the ability to taste PROP generally adopted
to compare individuals (Tepper et al., 2001). The PROP tasting status of each participant
was assessed by measuring the perceived intensity of PROP compared to a reference
sodium chloride (NaCl) solution using the three solution test (Tepper et al., 2001) as

Chapter Four – Study 3
111
described in Chapter 2. Participants were categorised as PROP non-tasters, medium
tasters or supertasters.
4.3.4 Transcranial magnetic stimulation
On arrival at the laboratory, each participant was seated comfortably with their right arm
supported by a pillow and their head positioned on a headrest. Electromyographic (EMG)
activity was recorded from the relaxed right FDI muscle using two Ag-AgCl electrodes
placed in a standard belly-tendon montage (Zipp, 1982). In addition, a ground electrode
was placed over the lateral posterior tubercle of the radius. All electrode sites were
cleaned and lightly abraded prior to electrode placement.
Next, a cap with pre-marked spacing was placed on the participants head to guide
positioning of the TMS stimulating coil. Participants were instructed to keep their right
hand relaxed and their hand, arm and head still throughout the experiment. Single-pulse
TMS was delivered by a Magstim 2002 BiStim system (Magstim Co., Whitland, U.K.)
with a figure-8-shaped coil (90 mm in diameter) held tangentially to the scalp at a 45
degree angle away from the midline with the handle pointing backward to induce a current
in a posterior-to-anterior direction. The optimal stimulation site was identified as the site
where the largest mean MEP amplitude was measured in the FDI in a sequence of five
moderately suprathreshold pulses. Resting motor threshold (rMT) was then determined
at the optimal stimulation site and was calculated as the minimum stimulus intensity
required to elicit MEPs greater than 50 µV in at least five of ten successive single TMS
pulses (Rossini et al., 1999). Mean rMT expressed as a percentage of maximal stimulator
output was 52 ± 7%. The TMS stimulus intensity for the experimental sessions was set at
120% of individual rMT, corresponding to a mean stimulus intensity of 62 ± 8% of
maximal stimulator output.

Chapter Four – Study 3
112
4.3.5 Data and statistical analysis
EMG signals from the FDI were amplified, bandpass filtered (10–1000 Hz), and digitised
at 4000 Hz with a 14-bit analog-to-digital converter. The peak-to-peak MEP amplitude
was calculated as the maximum EMG signal minus the minimum EMG signal during the
10–50 ms period after each TMS pulse. Trials were eliminated if voluntary activity was
evident in the EMG recording in the 50 ms before TMS. Peak-to-peak MEP amplitudes
from each set of 10 TMS pulses were averaged to obtain a mean MEP amplitude for each
participant (Kiers et al., 1993; McDonnell et al., 2004). Each participant’s mean MEP
amplitude obtained after solution administration (POST) was expressed relative to that
participant’s mean MEP amplitude obtained prior to mouth rinsing (PRE; [POST-
PRE]/PRE). Ratios were log transformed prior to analysis to normalise the distributions
(Wassermann, 2002), and back-transformed percentages ([POST-PRE]/PRE x 100) are
reported.
The effect of quinine and water administration on MEP amplitude relative to baseline was
assessed using one-sample t-tests in which the log transformed ratios were compared with
zero (baseline). To investigate whether there were differences between the two solutions
and whether the order of solution administration within sessions affected the results, log
transformed ratios were analysed using a mixed repeated measures ANOVA on solution
type (Quinine, Water) and order of administration within each session (First, Second) as
repeated measures and group (1, 2) as a between subjects factor. To test for a time-
dependent effect, log transformed ratios were compared for each of the 10 TMS pulses
using a mixed repeated measures ANOVA on TMS trial (1-10) and solution type
(Quinine, Water) as repeated measures and group (1, 2) as a between subjects factor. For
all tests, differences were accepted at p < 0.05 (Statistical Package for the Social Sciences

Chapter Four – Study 3
113
Version 17.0 for Windows software, Chicago, IL). Cohen’s effect size (ES) values were
calculated to highlight any trends.
4.4 Results
4.4.1 Effect of order of solution administration and participant group on MEP
amplitude
There was no significant main effect of the order of solution administration within each
session on MEP amplitude (p = 0.164). The interaction of order of administration and
solution type was also not significant (p = 0.072), nor was the interaction effect of group
and solution type (p = 0.924) or group and order (p = 0.653). Given the lack of effect of
these factors on MEP amplitude, results were combined across groups and are expressed
as an overall mean percent change in MEP amplitude for quinine and water, respectively.
4.4.2 Effect of quinine and water administration on mean MEP amplitude
Figure 4.1 shows EMG activity from a representative participant immediately before and
after the combined mouth rinsing and ingestion of either quinine or water. The mean
percent change in MEP amplitude immediately following the combined mouth rinsing
and ingestion of quinine or water are presented in Figure 4.2. There was a significant
main effect of solution type, with quinine evoking a significantly larger increase in MEP
amplitude compared with water (p = 0.004, ES = 0.82). Quinine significantly increased
MEP amplitudes by 16% relative to baseline (p < 0.001, ES = 0.99), while water also
increased MEP amplitudes by 10% relative to baseline (p = 0.003, ES = 0.70).

Chapter Four – Study 3
114
-2 .0
0 .0
2 .0
4 .0
W a te r P R E
EM
G A
ctiv
ity
(mV
)
W a te r P O S T
-2 .0
0 .0
2 .0
4 .0
Q u in in e P R E
EM
G A
ctiv
ity
(mV
)
Q u in in e P O S T
Figure 4.1 EMG traces from a representative participant showing 10 raw MEPs recorded
from the dominant first dorsal interosseous muscle before (PRE) and after (POST) the
combined mouth rinsing and ingestion of either a 2 mM bitter quinine solution or plain
water.

Chapter Four – Study 3
115
Q u in in e W a te r
01 09 0
9 5
1 0 0
1 0 5
1 1 0
1 1 5
1 2 0
1 2 5
1 3 0%
Ch
ange
in
ME
Pam
pli
tud
e*
*
#
Figure 4.2 Mean normalised percent change in MEP amplitude immediately after the
combined mouth rinsing and ingestion of either a 2 mM bitter quinine solution or plain
water. The broken line shows a baseline MEP amplitude of 100%. ‘*’indicates a
significant difference from baseline, ‘#’ indicate a significant difference between the
responses to quinine and water. Values are expressed as mean ± SEM (n = 16).

Chapter Four – Study 3
116
4.4.3 Effect of quinine and water administration on MEP amplitude over time
The mean percent change in MEP amplitude evoked by each of the 10 TMS stimuli in the
quinine and water conditions are shown in Figure 4.3. There was a significant main effect
of solution on MEP amplitude over time (p = 0.024), with quinine evoking larger
responses across the 10 TMS stimuli compared with water. There was no significant main
effect of Trial on MEP amplitude (p = 0.441), and the interaction of Trial and Solution
was not significant (p = 0.224), with similar MEP amplitudes across all 10 TMS stimuli
in both the quinine and water conditions.

Chapter Four – Study 3
117
0 1 2 3 4 5 6 7 8 9 1 00
1 09 0
9 5
1 0 0
1 0 5
1 1 0
1 1 5
1 2 0
1 2 5
1 3 0
% C
hang
e in
ME
Pam
plit
ude
T M S T ria l
Figure 4.3 Mean normalised percent change in MEP amplitude for each single TMS
pulse immediately after the combined mouth rinsing and ingestion of either a 2 mM bitter
quinine solution (dark circles) or plain water (light circles). The broken line shows a
baseline MEP amplitude of 100%. Values are expressed as mean ± SEM (n = 16).

Chapter Four – Study 3
118
4.4.4 PROP tasting and MEP amplitude
4 participants were classified as nontasters, 7 were medium tasters, and 5 were
supertasters. When divided by PROP tasting status, there were no significant differences
in MEP amplitude between groups for either quinine (p = 0.954) or water (p = 0.770).
This indicates that PROP sensitivity is not related to motor cortical responses to tasting
quinine, which is in agreement with other studies which have found no correlation
between PROP sensitivity and the sensitivity to other bitter tastants, including quinine
(Delwiche et al., 2001; Keast & Roper, 2007).
4.5 Discussion
It has recently been demonstrated that the combination of mouth rinsing and ingestion of
a 2 mM bitter quinine solution before a maximal 30-s cycling sprint can significantly
improve mean and peak power output (Chapter 2; Gam et al., 2014). Since the sprint in
that study was performed immediately after the ingestion of quinine, the ergogenic effect
was attributed to central activation by afferent taste signals. The finding that mouth
rinsing a quinine solution without ingesting it did not improve sprint performance
(Chapter 3; Gam e al., 2015) indicates that the activation of bitter taste receptors in the
back of the oral cavity and upper GI tract may be important in eliciting an effect. Given
that taste signals are known to activate several brain areas which may have the capacity
to affect the corticomotor pathway (Zald et al., 1998; Zald et al., 2002; Small et al., 2003),
the purpose of the present study was to examine whether the administration of quinine
affects corticomotor excitability. This study shows, for the first time, that mouth rinsing
and ingesting a quinine solution facilitates corticomotor excitability, with an immediate
16% increase in MEP amplitude in the resting FDI muscle of male competitive cyclists.
This increase in MEP amplitude was significantly greater than the increase observed in
response to water.

Chapter Four – Study 3
119
The observation that mouth rinsing and ingestion of a 2 mM quinine solution increases
corticomotor excitability may, at least partially, explain the previously observed
ergogenic effect of combining mouth rinsing and ingestion of the same quinine solution
on 30-s sprint cycling performance (Chapter 2; Gam et al., 2014). It is possible that the
increase in corticomotor excitability elicited by quinine may enhance motor output,
thereby allowing for improved performance during a maximal cycling sprint. Similarly,
other interventions which cause a temporary increase in corticomotor excitability such as
iTMS (paired pulse TMS which enhances I-wave dynamics) and transcranial direct
current stimulation have been shown to improve the subsequent performance of fatiguing
motor tasks (Benwell et al., 2006; Cogiamanian et al., 2007; Teo et al., 2012), although
not all studies have observed changes in motor performance following such interventions
(Muellbacher et al., 2000; Rossi et al., 2000). It should be noted that although participants
in both the previous exercise study (Chapter 2; Gam et al., 2015) and the present study
were male competitive cyclists, the present study investigated the FDI muscle, and not
the lower limb muscles involved in the performance of a cycling sprint. The FDI was
chosen because of the relative ease of eliciting MEPs in this muscle, as well as the lower
motor thresholds reported for the intrinsic hand muscles compared with lower limb
muscles including the quadriceps (Chen et al., 1998).
A similar effect to that seen here has been reported by Gant et al. (2010) who found a 9%
increase in MEP amplitude in the FDI muscle after mouth rinsing with a CHO solution.
These responses were attributed to the activation of CHO-sensitive taste receptors in the
oral cavity. Following a similar reasoning, it is possible that the facilitation of
corticomotor excitability by quinine is likely a result of afferent signals arising from the
activation of quinine-sensitive receptors in the oral cavity and upper GI tract, in turn
activating the chorda tympani branch of the facial nerve, as well as the glossopharyngeal

Chapter Four – Study 3
120
and vagus nerves (Kinnamon, 2012). Signals from these cranial nerves converge in the
nucleus of the solitary tract in the medulla. The medulla then projects to the thalamus,
which relays information to several brain areas including the primary and secondary
gustatory cortices (de Araujo & Simon, 2009), as well as limbic structures including the
amygdala, striatum and anterior cingulate cortex (Zald et al., 1998). These limbic areas
are known to function in the translation of emotional signals into action readiness and/or
behavior (Critchley, 2005; Kelley et al., 2005) and have the capacity to influence motor
cortical regions through basal ganglia circuits (Haber, 2003). Given that the perception
of bitterness evolved as a protective mechanism against the ingestion of potentially toxic
or harmful substances (Meyerhof, 2005), the brain may respond to the taste and ingestion
of a bitter quinine solution by increasing the general excitability of neurons in the
corticomotor pathway in preparation for a possible homeostatic threat. This general effect
on neural excitability may assist in explaining the findings that a bitter quinine solution
has the capacity to improve sprint performance, as well as facilitate MEP amplitude in
the resting FDI muscle.
An unexpected finding of this study was that rinsing the mouth with plain water followed
by its ingestion also increased corticomotor excitability. This is consistent with reports
that tasting and swallowing water activates several areas of the brain including
somatosensory and nearby gustatory cortices, as well as some limbic structures (Zald &
Pardo, 2000). It is possible that the activation of these areas may have modified
corticomotor excitability in response to water. The effect of water on MEP amplitude
was, however, significantly smaller than the effect of quinine.
This study shows that corticomotor excitability, as measured by MEP amplitude in the
resting FDI muscle, increases immediately after mouth rinsing and ingesting a bitter

Chapter Four – Study 3
121
tasting quinine solution. This finding that afferent taste signals have the capacity to
influence the corticomotor pathway may help explain the previous finding that combined
mouth rinsing and ingestion of quinine has an immediate ergogenic effect on maximal
sprint cycling.
122
Chapter Five General Discussion

Chapter Five – General Discussion
123
5.1 Summary
In recent years, several studies have reported that carbohydrate (CHO) mouth rinsing has
the capacity to improve exercise performance (Carter et al., 2004b; Rollo et al., 2008;
2010; Chambers et al., 2009; Pottier et al., 2010; Fares & Kayser, 2011; Lane et al., 2013;
Muhamed et al., 2014; Sinclair et al., 2014) through the activation of several areas of the
brain by afferent taste signals (Chambers et al., 2009; Turner et al., 2014). These findings
raise the possibility that the stimulation of different taste receptors by other types of
tastants, specifically bitter tastants, may also affect performance. This possibility is
supported by studies which have reported the activation of similar brain areas (including
structures involved in emotional processing and motor control) in response to both sweet
CHO and bitter tasting quinine (Zald et al., 2002; Small et al., 2003). Further support is
provided by the observation that tasting an unpleasant bitter quinine solution evokes the
largest and most long lasting autonomic nervous system (ANS) responses compared with
four other tastants (sweet, sour, salty and water), while pleasant, sweet tasting sucrose
produces the smallest and shortest responses (Rousmans et al., 2000; Robin et al., 2003).
This difference in ANS activation as a function of perceived pleasantness may be
explained on the basis of the negative brain theory, which contends that the brain is
preferentially geared towards rapidly processing and responding to negative or unpleasant
stimuli compared with pleasant or neutral stimuli, since the consequences of encountering
unpleasant stimuli may be severe (Carretie et al., 2009). This may be especially relevant
in the context of bitter taste given that bitterness evolved as a protective mechanism to
prevent the ingestion of potentially toxic or harmful substances (Meyerhof, 2005).
Together, these studies suggest that the administration of a bitter solution may activate
emotional and motor areas of the brain, as well as the ANS, which may have implications
for maximal sprint performance. Therefore, the aim of this thesis was to explore the effect
of a bitter tasting solution composed of quinine on maximal cycling sprint performance.

Chapter Five – General Discussion
124
Quinine was the chosen bitter tastant since it is safe for human consumption (it is
commonly used at the bittering agent in tonic water; Drewitt et al., 1993), it is not a
banned substance for athletes, and it is commonly used in taste perception studies (Keast
& Roper, 2007).
The first study of this thesis (Chapter 2) investigated whether the combined mouth rinsing
and ingestion of a 2 mM bitter quinine solution immediately before a maximal 30-s
cycling sprint could improve performance in male competitive cyclists A 2 mM quinine
solution was chosen based on the results of the first part of this study which showed that
mouth rinsing and ingesting quinine at this concentration optimally activated different
measures of ANS function such as skin conductance amplitude, ohmic perturbation
duration, and heart rate amplitude without causing significant feelings of nausea. The
solution was administered in a combined mouth rinse and ingestion protocol in order to
activate as many bitter taste receptors (T2Rs) throughout the oral cavity, soft palate,
epiglottis and upper esophagus as possible, since there is evidence that the greatest
concentration of T2Rs and sensation of bitterness occur at the back of the tongue and oral
cavity (Behrens et al., 2007). This study showed that the bitter quinine solution
significantly improved mean power output during the sprint by 2.4, 3.9 and 3.9%
compared with a sweet aspartame placebo, plain water and a no-rinse control condition,
respectively. Peak power output during the sprint was also improved by 1.9, 3.7 and 3.5%
compared with aspartame, water and control, respectively. Since the sprint was performed
immediately after ingesting the solution, thus not allowing time for its absorption, the
ergogenic effect of the quinine solution was likely mediated by afferent taste signals
originating from T2Rs. These signals are known to elicit the activation of several areas
of the brain, including those associated with emotional processing as well as motor areas,
Chapter Five – General Discussion
125
which may improve exercise performance by increasing arousal, motivation and/or motor
output.
The novel finding that combining mouth rinsing with the ingestion of a quinine solution
immediately before a maximal 30-s sprint can improve mean and peak power output may
have implications for sprinters or power athletes involved in short duration events.
However, ingesting high concentrations of a strong bitter quinine solution (> 2 mM) is
perceived as very unpleasant and may cause feelings of nausea. On the other hand, mouth
rinsing with quinine, without ingesting it, did not induce nausea, even at high
concentrations (up to 10 mM). This raised the question of whether a mouth-rinse only
protocol may be a more practical way to administer the bitter solution. However, given
the differences in T2R expression and innervation within the oral cavity and upper
gastrointestinal (GI) tract, it was unclear whether mouth rinsing alone would be sufficient
to improve exercise performance. For this reason, the second study of this thesis (Chapter
3) examined whether mouth rinsing a 10 mM bitter quinine solution, without ingesting it,
could improve maximal 30-s cycling sprint performance in competitive male cyclists. The
optimal concentration of quinine to be used with a mouth-rinse only protocol was
identified as 10 mM since it evoked maximal ANS activation with no reports of nausea.
It was found that mouth rinsing a bitter solution without ingesting it had no effect on any
indicators of maximal sprint performance compared with a sweet glucose placebo, plain
water and a no-rinse control condition. The lack of ergogenic effect was attributed to the
location of T2Rs activated by the bitter solution, with the highest concentration of T2Rs
in the circumvallate papillae at the back of the oral cavity, as well as T2Rs in the soft
palate, epiglottis and upper esophagus unlikely to be adequately activated with mouth
rinsing alone. It is possible that without the stimulation of T2Rs in these areas, afferent
taste signals may not have produced a sufficient stimulus to induce an ergogenic effect.

Chapter Five – General Discussion
126
In order to investigate a possible mechanism responsible for the ergogenic effect of
combined bitter mouth rinsing and ingestion, the final study of this thesis (Chapter 4) was
performed to determine if mouth rinsing plus ingestion of the same 2 mM quinine solution
used in the first study (Chapter 2) could increase corticomotor excitability measured using
single-pulse transcranial magnetic stimulation (TMS) in male competitive cyclists. Ten
TMS pulses were administered immediately before (baseline) and after participants
mouth rinsed and ingested either the quinine solution or water (control), with motor-
evoked potentials (MEPs) recorded from the relaxed first dorsal interosseous (FDI)
muscle of the dominant hand. MEP amplitude was significantly increased by 16%
immediately after ingesting the quinine solution compared with baseline. This indicates
that afferent signals from T2Rs can enhance the excitability of corticomotor neurons,
which may contribute to the ergogenic effect on maximal sprint performance observed in
Chapter 2 by facilitating an increase in motor output to the muscles.
In addition to the effect of quinine on corticomotor excitability, it is possible that other
underlying mechanisms also contributed to the ergogenic effect of a bitter solution.
Specifically, the ANS activation observed in Chapters 2 and 3 in response to quinine
administration may have improved performance by allowing for an increase in the
mobilisation of resources to the exercising muscles immediately prior to the exercise bout,
which is especially relevant in the case of a maximal sprint exercise. It should be noted
that ANS activation in Chapters 2 and 3 was measured with participants at rest, leaving
unanswered questions as to whether a similar increase in ANS activation would have been
observed immediately prior to an exercise bout and whether this ANS activation would
be sufficient to induce an ergogenic effect. It is also possible that, given the similarities
in the areas of the brain activated by CHO and quinine, that quinine and CHO may

Chapter Five – General Discussion
127
improve performance in a similar way, specifically by increasing motivation and/or
decreasing the perception of effort of the exercise bout. These possibilities have not been
directly investigated.
5.2 Implications
The novel demonstration that the combined mouth rinsing and ingestion of a bitter quinine
solution is effective in improving maximal sprint performance may be of interest to
athletes, especially those competing in events requiring maximal power and strength.
While it may not be convenient for athletes to utilise a bitter solution in competition
(although future research could investigate methods of administration which would be
appropriate for use during an event), mouth rinsing and ingesting a bitter solution may be
useful during training, allowing for an increase in training intensity which may translate
to longer term performance gains and thereby improve performance in competition.
Furthermore, the finding that a bitter solution improves performance of a single maximal
cycling sprint effort raises the possibility that this solution may also have the potential to
improve other types of maximal exercise such as those activities requiring maximal force
production (e.g. power lifting), the performance of repeated maximal sprints (e.g. during
a team sport event), as well as high intensity periods within longer endurance exercise
bouts (e.g. hill climbs, periods of acceleration within a road race or the final sprint to the
finish), although these possibilities have not yet been tested.
Participants in the studies involved in this thesis were fasted overnight prior to the
performance of each maximal sprint effort, however in a competitive situation athletes
would likely have consumed a CHO-rich meal prior to an event. While, as described
below, it remains to be determined whether a similar effect on performance would be
observed with participants in a post-prandial state, this does not necessarily limit the

Chapter Five – General Discussion
128
usefulness of a bitter solution. The ergogenic use of a bitter solution may be especially
relevant in situations in which it is not appropriate for athletes to take in fuel in the form
of CHO prior to a maximal exercise bout. For example, there is evidence that training in
a state of low muscle glycogen availability (termed “training low”) may promote
exercise-induced training adaptations to a greater extent than training with normal or
elevated glycogen stores (Hawley & Burke, 2010; Hawley et al., 2011). However, athletes
commencing exercise in this state are often unable to perform at a high intensity (Yeo et
al., 2008). The use of a bitter solution during this type of training may compensate for
this drop in performance, allowing them to take advantage of increased training
adaptations without sacrificing training intensity. Similarly, the administration of a bitter
solution may improve performance in athletes who experience GI distress when ingesting
CHO, or athletes who are trying to maintain or lose weight and therefore would not want
to ingest the additional calories associated with fuel supplementation but still need to train
at a high intensity. Future research should examine these possibilities.
5.3 Limitations
There are a few limitations with the studies described in this thesis which need to be
addressed before promoting the use of a bitter solution to improve exercise performance.
Firstly, it is important to note that the ingestion of quinine has systemic effects and has
been known to cause side effects such as headaches, dizziness, blurred vision, impaired
hearing and GI distress when administered in large doses (e.g. when treating a patient for
malaria; approximately 600-900 mg quinine per day; Vieira & Midio, 2001). While the
very small one-off dose (20 mg quinine in 25 mL of solution) administered in the present
studies should not be enough to cause any side effects, athletes should be careful not to
ingest too much quinine on a regular basis.

Chapter Five – General Discussion
129
Furthermore, the fact that participants fasted overnight prior to each exercise session
leaves questions as to whether similar results would have been observed with participants
in a post-prandial state. It should be noted that while Beelen et al. (2009) found no
ergogenic effect of CHO mouth rinsing after participants were given a standardised
breakfast, other studies have found an ergogenic effect with participants in both a fasted
and fed state (Fares & Kayser, 2011; Lane et al., 2013), although the performance
improvement was smaller in the fed state. Whether a bitter solution may also be effective
in improving performance in athletes in a post-prandial state remains to be tested.
Another issue relates to the effectiveness of other bitter tastants. Since the pattern of T2R
stimulation can differ markedly between bitter tastants (Meyerhof et al., 2010), it is
possible that these tastants affect sprint performance differently. For this reason, it would
be premature to conclude that the effect of quinine on sprint performance is typical of
bitter tastants in general. Until different bitter tastants are compared, one would have to
conclude that the findings of this thesis are about the benefits of quinine rather than of
bitter tastants in general.
Another limitation with the studies described in this thesis is that they were performed
exclusively with male competitive athletes, leaving unanswered questions as to whether
similar effects would be observed in females or less trained individuals. In addition, the
effect of quinine on corticomotor excitability was investigated in Chapter 4 with
participants at rest because of methodological difficulty associated with the use of TMS
in active participants. It is therefore unclear if a similar increase in corticomotor
excitability would have been observed if exercising or contracted muscles had been
investigated.

Chapter Five – General Discussion
130
5.4 Directions for future research
The studies described in this thesis are the first ones investigating the effect of a bitter
tastant on exercise performance, and as such there are numerous directions for future
research. For instance, it remains to be determined whether quinine can improve the
performance of other exercise tasks such as those involving a maximal strength effort,
repeated sprints and endurance exercise. In addition, it is unclear whether different
concentrations of quinine, or bitter tastants other than quinine, may also improve exercise
performance. Another interesting avenue for future research would be to investigate the
effect of bitter taste on reaction time and choice reaction time, which may have
implications for team sport activities. Given the findings of Turner et al. (2014) that CHO
mouth rinsing activates brain areas involved in visual processing, and the suggestion by
these researchers that this activation may facilitate early visual processing during a motor
task, a bitter tastant may have a similar effect. Finally, future research could be undertaken
to investigate some of the potential mechanisms underlying the ergogenic effect of
quinine as outlined previously, including the issues of whether increases in corticomotor
excitability, ANS arousal, and the activation of certain brain areas directly contribute to
the improvement in exercise performance.
5.5 Conclusions
In conclusion, this thesis shows for the first time that although mouth rinsing alone with
a bitter quinine solution does not affect sprint performance, the combination of mouth
rinsing and ingestion of a bitter tasting quinine solution significantly improves mean and
peak power output during a maximal cycling sprint effort. The combined mouth rinsing
and ingestion of a bitter quinine solution also activates the ANS and increases
corticomotor excitability measured with single-pulse TMS in the resting FDI muscle.

Chapter Five – General Discussion
131
These findings may have practical implications for power and strength athletes, as well
as for endurance athletes who could make use of a bitter solution during high intensity
portions of their events. Although this thesis suggests that the ergogenic effect of quinine
is related to brain activation (particularly in emotional and motor areas), elicited by the
stimulation of bitter taste receptors in the oral cavity and upper GI tract, the exact
mechanisms by which this activation may improve exercise performance remains to be
determined. Whether there are other mechanisms contributing to this ergogenic effect also
remains to be determined. Overall, these findings suggest a novel strategy for improving
exercise performance and provide further evidence that taste has the capacity to influence
motor output from the brain. More studies are needed to corroborate these findings and
to determine whether the use of a bitter solution may be useful in improving other types
of exercise performance.

132
Chapter Six References

Chapter Six – References
133
Adler, E., Hoon, M. A., Mueller, K. L., Chandrashekar, J., Ryba, N. J. P., & Zuker,
C. S. (2000). A novel family of mammalian taste receptors. Cell, 100(6), 693-
702.
Agostino, R., Lezzi, E., Dinapoli, L., Gilio, F., Conte, A., Mari, F., & Berardelli, A.
(2007). Effects of 5 Hz subthreshold magnetic stimulation of primary motor
cortex on fast finger movements in normal subjects. Experimental Brain
Research, 180(1), 105-111.
Ahtiainen, J. P., & Hakkinen, K. (2009). Strength athletes are capable to produce
greater muscle activation and neural fatigue during high-intensity resistance
exercise than nonathletes. Journal of Strength and Conditioning Research,
23(4), 1129-1134.
Anand, S., & Hotson, J. (2002). Transcranial Magnetic Stimulation:
Neurophysiological applications and safety. Brain and Cognition, 50(3),
366-386.
Arkinstall, M. J., Bruce, C. R., Nikolopoulos, V., Garnham, A. P., & Hawley, J. A.
(2001). Effect of carbohydrate ingestion on metabolism during running and
cycling. Journal of Applied Physiology, 91, 2125-2134.
Baumert, A., Sinclair, C., Macleod, C., & Hammond, G. (2011). Negative emotional
processing induced by spoken scenarios modulates corticospinal excitability.
Cognitive Affective & Behavioral Neuroscience, 11(3), 404-412.
Baumgartner, T., Willi, M., & Jancke, L. (2007). Modulation of corticospinal activity
by strong emotions evoked by pictures and classical music: a transcranial
magnetic stimulation study. Neuroreport, 18(3), 261-265.
Beaven, M. C., Maulder, P., Pooley, A., Kilduff, L., & Cook, C. (2013). Effects of
caffeine and carbohydrate mouth rinses on repeated sprint performance.
Applied Physiology Nutrition and Metabolism, 38(6), 633-637.

Chapter Six – References
134
Beelen, M., Berghuis, J., Bonaparte, B., Ballak, S. B., Jeukendrup, A. E., & van Loon,
L. J. C. (2009). Carbohydrate mouth rinsing in the fed state: Lack of
enhancement of time-trial performance International Journal of Sport
Nutrition and Exercise Metabolism, 19(4), 400-409.
Behrens, M., & Meyerhof, W. (2006). Bitter taste receptors and human bitter taste
perception. Cellular and Molecular Life Sciences, 63(13), 1501-1509.
Behrens, M., Foerster, S., Staehler, F., Raguse, J. D., & Meyerhof, W. (2007).
Gustatory expression pattern of the human Tas2R bitter receptor gene family
reveals a heterogenous population of bitter responsive taste receptor cells.
Journal of Neuroscience, 27(46), 12630-12640.
Benwell, N. M., Mastaglia, F. L., & Thickbroom, G. W. (2006). Paired-pulse rTMS
at trans-synaptic intervals increases corticomotor excitability and reduces the
rate of force loss during a fatiguing exercise of the hand Experimental Brain
Research, 175, 626-632.
Benwell, N. M., Mastaglia, F. L., & Thickbroom, G. W. (2007). Changes in functional
MR signal in motor and non-motor areas during intermittent fatiguing hand
exercise. Experimental Brain Research, 182(1), 93-97.
Borg, G. (1982). Psychophysical bases of perceived exertion. Medicine and Science
in Sports and Exercise, 14(5), 377-381.
Bortolotti, H., Pereira, L. A., Oliveira, R. S., Cyrino, E. S., & Altimari, L. R. (2013).
Carbohydrate mouth rinse does not improve repeated sprint performance.
Revista Brasileira de Cineantropometria & Desempenho Humano, 15(6),
639-645.
Bosch, A. N., Weltan, S. M., Dennis, S. C., & Noakes, T. D. (1996). Fuel substrate
turnover and oxidation and glycogen sparing with carbohydrate ingestion in

Chapter Six – References
135
non-carbohydrate-loaded cyclists. European Journal of Physiology, 432,
1003-1010.
Brockhoff, A., Behrens, M., Niv, M. Y., & Meyerhof, W. (2010). Structural
requirements of bitter taste receptor activation. Proceedings of the National
Academy of Sciences of the United States of America, 107(24), 11110-11115.
Buijs, R. M., & van Eden, C. G. (2000). The integration of stress by the hypothalamus,
amygdala and prefrontal cortex: balance between the autonomic nervous
system and the neuroendocrine system. Progress in Brain Research, 126,
117-132.
Bush, G., Luu, P., & Posner, M. I. (2000). Cognitive and emotional influences in
anterior cingulate cortex. Trends in Cognitive Sciences, 4(6), 215-222.
Caicedo, A., Pereira, L. A., Margolskee, R. F., & Roper, S. D. (2003). Role of the G-
protein subunit alpha-gustducin in taste cell responses to bitter stimuli.
Journal of Neuroscience, 23(30), 9947-9952.
Carter, J. M., Jeukendrup, A. E., Mann, C. H., & Jones, D. A. (2004a). The effect of
glucose infusion on glucose kinetics during a 1-h time trial. Medicine and
Science in Sports and Exercise, 36, 1543-1550.
Carter, J. M., Jeukendrup, A. E., & Jones, D. A. (2004b). The effect of carbohydrate
mouth rinse on 1-h cycle time trial performance. Medicine and Science in
Sports and Exercise, 36(12), 2107-2111.
Carretie, L., Martin-Loeches, M., Hinojosa, J. A., & Mercado, F. (2001). Emotion and
attention interaction studied through event-related potentials. Journal of
Cognitive Neuroscience, 13(8), 1109-1128.
Carretie, L., Hinojosa, J. A., & Mercado, F. (2003). Cerebral patterns of attentional
habituation to emotional visual stimuli. Psychophysiology, 40(3), 381-388.

Chapter Six – References
136
Carretie, L., Hinojosa, J. A., Albert, J., & Mercado, F. (2006). Neural response to
sustained affective visual stimulation using an indirect task. Experimental
Brain Research, 174(4), 630-637.
Carretie, L., Albert, J., Lopez-Martin, S., & Tapia, M. (2009). Negative brain: An
integrative review on the neural processes activated by unpleasant stimuli.
International Journal of Psychophysiology, 71(1), 57-63.
Cermak, N. M. & van Loon, L. J. C. (2013). The use of carbohydrates during exercise
as an ergogenic aid. Sports Medicine, 43(11), 1139-1155.
Chambers, E. S., Bridge, M. W., & Jones, D. A. (2009). Carbohydrate sensing in the
human mouth: effects on exercise performance and brain activity. Journal of
Physiology - London, 587(8), 1779-1794.
Chandrashekar, J., Mueller, K. L., Hoon, M. A., Adler, E., Feng, L. X., Guo, W.,
Zuker, C. S., & Ryba, N. J. P. (2000). T2Rs function as bitter taste receptors.
Cell, 100(6), 703-711.
Chen, R., Tam, A., Butefisch, C., Corwell, B., Ziemann, U., Rothwell, J. C., & Cohen,
L. G. (1998). Intracortical inhibition and facilitation in different
representations of the human motor cortex. Journal of Neurophysiology,
80(6), 2870-2881.
Chen, M. C., Wu, S. V., Reeve, J. R., & Rozengurt, E. (2006). Bitter stimuli induce
Ca2+ signalling and CCK release in enteroendocrine STC-1 cells: role of L-
type voltage-sensitive Ca2+ channels. American Journal of Physiology-Cell
Physiology, 291(4), C726-C739.
Chong, E., Guelfi, K. J., & Fournier, P. A. (2011). Effect of a carbohydrate mouth
rinse on maximal sprint performance in competitive male cyclists. Journal of
Science and Medicine in Sport, 14(2), 162-167.

Chapter Six – References
137
Chong, E., Guelfi, K. J., & Fournier, P. A. (2014). Combined glucose ingestion and
mouth rinsing improves sprint cycling performance. International Journal of
Sport Nutrition and Exercise Metabolism, E-published ahead of print.
Coelho, C. M., Lipp, O. V., Marinovic, W., Wallis, G., & Riek, S. (2010). Increased
corticospinal excitability induced by unpleasant visual stimuli. Neuroscience
Letters, 481(3), 135-138.
Coggan, A. R., & Coyle, E. F. (1991). Carbohydrate ingestion during prolonged
exercise: effects on metabolism and performance. Exercise and Sport
Sciences Reviews, 19, 1-40.
Cogiamanian, F., Marceglia, S., Ardolino, G., Barbieri, S., & Priori, A. (2007).
Improved isometric force endurance after transcranial direct current
stimulation over the human motor cortical areas. European Journal of
Neuroscience, 26, 242-249.
Coombes, S. A., Janelle, C. M., & Duley, A. R. (2005). Emotion and motor control:
Movement attributes following affective picture processing. Journal of Motor
Behavior, 37(6), 425-436.
Coombes, S. A., Cauraugh, J. H., & Janelle, C. M. (2006). Emotion and movement:
Activation of defensive circuitry alters the magnitude of a sustained muscle
contraction. Neuroscience Letters, 396(3), 192-196.
Coombes, S. A., Cauraugh, J. H., & Janelle, C. M. (2007). Emotional state and
initiating cue alter central and peripheral motor processes. Emotion, 7(2),
275-284.
Coombes, S. A., Tandonnet, C., Fujiyama, H., Janelle, C. M., Cauraugh, J. H., &
Summers, J. J. (2009). Emotion and motor preparation: A transcranial
magnetic stimulation study of corticospinal motor tract excitability. Cognitive
Affective & Behavioral Neuroscience, 9(4), 380-388.

Chapter Six – References
138
Coppin, E., Heath, E. M., Bressel, E., & Wagner, D. R. (2012). Wingate anaerobic
test reference values for male power athletes. International Journal of Sports
Physiology and Performance, 7(3), 232-236.
Critchley, H. D., Mathias, C. J., Josephs, O., O'Doherty, J., Zanini, S., Dewar, B. K.,
Cipolotti, L., Shallice, T., & Dolan, R. J. (2003). Human cingulate cortex and
autonomic control: converging neuroimaging and clinical evidence. Brain,
126, 2139-2152.
Critchley, H. D. (2005). Neural mechanisms of autonomic, affective, and cognitive
integration. The Journal of Comparative Neurology, 493, 154-166.
Dai, T. H., Liu, J. Z., Sahgal, V., Brown, R. W., & Yue, G. H. (2001). Relationship
between muscle output and functional MRI-measured brain activation.
Experimental Brain Research, 140(3), 290-300.
Danilova, V., & Hellekant, G. (2003). Comparison of the responses of the chorda
tympani and glossopharyngeal nerves to taste stimuli in C57BL/6J mice.
BMC Neuroscience, 4. doi: 10.1186/1471-2202-4-5
de Araujo, I. E., & Simon, S. A. (2009). The gustatory cortex and multisensory
integration. International Journal of Obesity, 33, S34-S43.
Delay, E. R., Hernandez, N. P., Bromley, K., & Margolskee, R. F. (2006). Sucrose
and monosodium glutamate taste thresholds and discrimination ability of
T1R3 knockout mice. Chemical Senses, 31(4), 351-357.
Delwiche, J. F., Buletic, Z., & Breslin, P. A. S. (2001). Covariation in individuals'
sensitivities to bitter compounds: Evidence supporting multiple
receptor/transduction mechanisms. Perception & Psychophysics, 63(5), 761-
776.
Di Lazzaro, V., Ziemann, U., & Lemon, R. N. (2008). State of the art: Physiology of
transcranial motor cortex stimulation Brain Stimulation, 1(4), 345-362.

Chapter Six – References
139
Dorling, J. L., & Earnest, C. P. (2013). Effect of carbohydrate mouth rinsing on
multiple sprint performance. Journal of the International Society of Sports
Nutrition, 10. doi: 10.1186/1550-2783-10-41.
Drewitt, P. N., Butterworth, K. R., Springall, C. D., Walters, D. G., & Raglan, E. M.
(1993). Toxicity threshold of quinine hydrochloride following low-level
repeated dosing in healthy volunteers. Food and Chemical Toxicology, 31(4),
235-245.
Drewnowski, A., Henderson, S. A., & Shore, A. B. (1997). Genetic sensitivity to 6-
n-proplythiouracil (PROP) and hedonic responses to sweet and bitter tastes.
Chemical Senses, 22(1), 27-37.
Duffy, V. B., & Bartoshuk, L. (2000). Food acceptance and genetic variation in taste.
Journal of the American Dietetic Association, 100(6), 647-655.
Epstein, L. H., Rodefer, J. S., Wisniewski, L., & Caggiula, A. R. (1992). Habituation
and dishabituation of human salivary response. Physiology and Behavior, 51,
945-950.
Fares, E. J. M., & Kayser, B. (2011). Carbohydrate mouth rinse effects on exercise
capacity in pre- and post-prandial states. Journal of Nutrition and
Metabolism, doi:10.1155/2011/385962.
Frank, M. E. (1991). Taste-responsive neurons of the glossopharyngeal nerve of the
rat. Journal of Neurophysiology, 65(6), 1452-1463.
Gam, S., Guelfi, K. J., & Fournier, P. A. (2013). Opposition of carbohydrate in a
mouth-rinse solution to the detrimental effect of mouth rinsing during cycling
time trials. International Journal of Sport Nutrition and Exercise Metabolism,
23(1), 48-56.

Chapter Six – References
140
Gam, S., Guelfi, K. J., & Fournier, P. A. (2014). Mouth rinsing and ingesting a bitter
solution improves sprint cycling performance. Medicine and Science in
Sports and Exercise, 46(8), 1648-1657.
Gam, S., Tan, M., Guelfi, K. J., & Fournier, P. A. (2015). Mouth rinsing with a bitter
solution without ingestion does not improve sprint cycling performance.
European Journal of Applied Physiology, 115(1), 129-138.
Gant, N., Stinear, C. M., & Byblow, W. D. (2010). Carbohydrate in the mouth
immediately facilitates motor output. Brain Research, 1350, 151-158.
Gent, J. F., & Bartoshuk, L. (1983). Sweetness of sucrose, neohesperidin
dihydrochalcone, and saccharin is related to genetic ability to taste the bitter
substance 6-n-propylthiouracil. Chemical Senses, 7, 265-272.
Geran, L. C., & Travers, S. P. (2006). Single neurons in the nucleus of the solitary
tract respond selectively to bitter taste stimuli. Journal of Neurophysiology,
95(6), 2513-2527.
Geran, L. C., & Travers, S. P. (2011). Glossopharyngeal nerve transection impairs
unconditioned avoidance of diverse bitter stimuli in rats. Behavioral
Neuroscience, 125(4), 519-528.
Green, B. G., Dalton, P., Cowart, B., Shaffer, G. S., Rankin, K., & Higgins, J. (1996).
Evaluating the 'labeled magnitude scale' for measuring sensations of taste and
smell. Chemical Senses, 21(3), 323-334.
Haber, S. N. (2003). The primate basal ganglia: parallel and integrative networks.
Journal of Chemical Neuroanatomy, 26(4), 317-330.
Hall, M. J., Bartoshuk, L., Cain, W. S., & Stevens, J. C. (1975). PTC taste blindness
and the taste of caffeine. Nature, 253(5491), 442-443.

Chapter Six – References
141
Hansen, J. L., Reed, D. R., Wright, M. J., Martin, N. G., & Breslin, P. A. S. (2006).
Heritability and genetic covariation of sensitivity to PROP, SOA, quinine
HCL and caffeine. Chemical Senses, 31(5), 403-413.
Hajcak, G., Molnar, C., George, M. S., Bolger, K., Koola, J., & Nahas, Z. (2007).
Emotion facilitates action: A transcranial magnetic stimulation study of motor
cortex excitability during picture viewing. Psychophysiology, 44(1), 91-97.
Hawley, J. A., Palmer, G. S., & Noakes, T. D. (1997). Effects of 3 days of
carbohydrate supplementation on muscle glycogen content and utilization
during a 1-h cycling performance. European Journal of Applied Physiology
and Occupational Physiology, 75, 407-412.
Hawley, J. A., & Burke, L. M. (2010). Carbohydrate availability and training
adaptation: Effects on cell metabolism. Exercise and Sport Sciences Reviews,
38(4), 152-160.
Hawley, J. A., Burke, L. M., Phillips, S. M., & Spriet, L. L. (2011). Nutritional
modulation of training-induced skeletal muscle adaptations. Journal of
Applied Physiology, 110(3), 834-845.
Hellekant, G., Danilova, V., & Ninomiya, Y. (1997). Primate sense of taste:
Behavioral and single chorda tympani and glossopharyngeal nerve fiber
recordings in the rhesus monkey, Macaca mulatta. Journal of
Neurophysiology, 77(2), 978-993.
Horio, T. (2000). Effects of various taste stimuli on heart rate in humans. Chemical
Senses, 25(2), 149-153.
Jeacocke, N. A., & Burke, L. M. (2010). Methods to standarize dietary intake before
performance testing. International Journal of Sport Nutrition and Exercise
Metabolism, 20, 87-103.

Chapter Six – References
142
Jeukendrup, A. E., Brouns, F., Wagenmakers, A. J., & Saris, W. H. (1997).
Carbohydrate-electrolyte feedings improve 1 h time trial cycling
performance. International Journal of Sports Medicine, 18, 125-129.
Jeukendrup, A. E., & Chambers, E. S. (2010). Oral carbohydrate sensing and exercise
performance. Current Opinion in Clinical Nutrition and Metabolic Care,
13(4), 447-451.
Jensen, J., McIntosh, A. R., Crawley, A. P., Mikulis, D. J., Remington, G., & Kapur,
S. (2003). Direct activation of the ventral striatum in anticipation of aversive
stimuli. Neuron, 40(6), 1251-1257.
Jeon, T. I., Zhu, B., Larson, J. L., & Osborne, T. F. (2008). SREBP-2 regulates gut
peptide secretion through intestinal bitter taste receptor signaling in mice.
Journal of Clinical Investigation, 118(11), 3693-3700.
Jeon, T. I., Seo, Y. K., & Osborne, T. F. (2011). Gut bitter taste receptor signaling
induces ABCB1 through a mechanism involving CCK. Biochemical Journal,
438, 33-37.
Kaji, I., Karaki, S., Fukami, Y., Terasaki, M., & Kuwahara, A. (2009). Secretory
effects of a luminal bitter tastant and expressions of bitter taste receptors,
T2Rs, in the human and rat large intestine. American Journal of Physiology -
Gastrointestinal and Liver Physiology, 296(5), G971-G981.
Kamen, G. (2004). Reliability of motor-evoked potentials during resting and active
contraction conditions. Medicine and Science in Sports and Exercise, 36(9),
1574-1579.
Kawasaki, H., Adolphs, R., Oya, H., Kovach, C., Damasio, H., Kaufman, O., &
Howard, M. (2005). Analysis of single-unit responses to emotional scenes in
human ventromedial prefrontal cortex. Journal of Cognitive Neuroscience,
17(10), 1509-1518.

Chapter Six – References
143
Keast, R. S. J., & Roper, J. (2007). A complex relationship among chemical
concentration, detection threshold, and suprathreshold intensity of bitter
compounds. Chemical Senses, 32(3), 245-253.
Kelley, A. E., Baldo, B. A., Pratt, W. E., & Will, M. J. (2005). Corticostriatal-
hypothalamic circuitry and food motivation: Integration of energy, action and
reward. Physiology and Behavior, 86(5), 773-795.
Kiers, L., Cros, D., Chiappa, K. H., & Fang, J. (1993). Variability of motor potentials
evoked by transcranial magnetic stimulation Electroencephalography and
Clinical Neurophysiology, 89(6), 415-423.
Kinnamon, S. C. (2012). Taste receptor signaling - from tongues to lungs. Acta
Physiologica, 204(2 ), 158-168.
Koganemaru, S., Domen, K., Fukuyama, H., & Mima, T. (2012). Negative emotion
can enhance human motor cortical plasticity. European Journal of
Neuroscience, 35(10), 1637-1645.
Komeilipoor, N., Pizzolato, F., Daffertshofer, A., & Cesari, P. (2013). Excitability of
motor cortices as a function of emotional sounds. PLOS One, 8(5).
Kramer, J. M., Plowey, E. D., Beatty, J. A., Little, H. R., & Waldrop, T. G. (2000).
Hypothalamus, hypertension and exercise. Brain Research Bulletin, 53(1),
77-85.
Kringelbach, M. L., O'Doherty, J., Rolls, E. T., & Andrews, C. (2003). Activation of
the human orbitofrontal cortex to a liquid food stimulus is correlated with its
subjective pleasantness. Cerebral Cortex, 13(10), 1064-1071.
Kringelbach, M. L., de Araujo, I. E., & Rolls, E. T. (2004). Taste-related activity in
the dorsolateral prefrontal cortex. Neuroimage, 21(2), 781-788.
Kyrou, I., & Tsigos, C. (2009). Stress hormones: physiological stress and regulation
of metabolism. Current Opinion in Pharmacology, 9(6), 787-793.
Chapter Six – References
144
Lambert, E. V., St Clair Gibson, A., & Noakes, T. D. (2005). Complex systems model
of fatigue: integrative homeostatic control of peripheral physiological
systems during exercise in humans. British Journal of Sports Medicine, 39(1),
52-62.
Lane, S. C., Bird, S. R., Burke, L. M., & Hawley, J. A. (2013). Effect of a
carbohydrate mouth rinse on simulated cycling time-trial performance
commenced in a fed or fasted state. Applied Physiology Nutrition and
Metabolism, 38(2), 134-139.
Lang, P. J. (2000). Emotion and motivation: Attention, perception, and action.
Journal of Sport and Exercise Psychology, 22, S122-S140.
Lim, J., Urban, L., & Green, B. G. (2008). Measures of individual differences in taste
and creaminess perception. Chemical Senses, 33(6), 493-501.
Lindemann, B. (2001). Receptors and transduction in taste. Nature, 413, 219-225.
Ly, A., & Drewnowski, A. (2001). PROP (6-n-propylthiouracil) tasting and sensory
responses to caffeine, sucrose, neohesperidin dihydrochalcone and chocolate.
Chemical Senses, 26(1), 41-47.
McDonnell, M. N., Ridding, M. C., & Miles, T. S. (2004). Do alternate methods of
analysing motor evoked potentials give comparable results? Journal of
Neuroscience Methods, 136, 63-67.
Mela, D. J. (1989). Bitter taste intensity - The effect of tastant and thiourea taster
status. Chemical Senses, 14(1), 131-135.
Mennella, J. A., Pepino, Y., & Reed, D. R. (2005). Genetic and environmental
determinants of bitter perception and sweet preferences. Pediatrics, 115(2),
E216-E222.
Meyerhof, W. (2005). Elucidation of mammalian bitter taste. Reviews of Physiology
Biochemistry and Pharmacology, 154, 37-72.

Chapter Six – References
145
Meyerhof, W., Batram, C., Kuhn, C., Brockhoff, A., Chudoba, E., Bufe, B.,
Appendino, G. & Behrens, M. (2010). The molecular receptive ranges of
human Tas2R bitter taste receptors. Chemical Senses, 35(2), 157-170.
Meyerhof, W., Born, S., Brockhoff, A., & Behrens, M. (2011). Molecular biology of
mammalian bitter taste receptors. A review. Flavour and Fragrance Journal,
26(4), 260-268.
Mogenson, G. J., Jones, D. L., & Yim, C. Y. (1980). From motivation to action -
Functional interface between the limbic system and motor system. Progress
in Neurobiology, 14(2-3), 69-97.
Morecraft, R. J., & Van Hoesen, G. W. (1992). Cingulate input to the primary and
supplementary motor cortices in the rhesus monkey - evidence for
somatotopy in areas 24c and 23c. Journal of Comparative Neurology, 322(4),
471-489.
Muhamed, A. M. C., Mohamed, N. G., Ismail, N., Aziz, A. R., & Singh, R. (2014).
Mouth rinsing improves cycling endurance performance during Ramadan
fasting in a hot humid environment. Applied Physiology Nutrition and
Metabolism, 39(4), 458-464.
Muellbacher, W., Ziemann, U., Boroojerdi, B., & Hallett, M. (2000). Effects of low-
frequency transcranial magnetic stimulation on motor excitability and basic
motor behavior. Clinical Neurophysiology, 111(6), 1002-1007.
Muth, E. R., Stern, R. M., Thayer, J. F., & Koch, K. L. (1996). Assessment of the
multiple dimensions of nausea: The nausea profile (NP). Journal of
Psychosomatic Research, 40(5), 511-520.
Nachev, P., Kennard, C., & Husain, M. (2008). Functional role of the supplementary
and pre-supplementary motor areas. Nature Reviews Neuroscience, 9(11),
856-869.

Chapter Six – References
146
Naugle, K. M., Coombes, S. A., Cauraugh, J. H., & Janelle, C. M. (2012). Influence
of emotion on the control of low-level force production. Research Quarterly
for Exercise and Sport, 83(2), 353-358.
Niki, M., Yoshida, R., Takai, S., & Ninomiya, Y. (2010). Gustatory signaling in the
periphery: detection, transmission, and modulation of taste information.
Biological and Pharmaceutical Bulletin, 33(11), 1772-1777.
Nitsche, M. A., Fricke, K., Henschke, U., Schlitterlau, A., Liebetanz, D., Lang, N.,
Henning, S., Tergau, F., & Paulus, W. (2003). Pharmacological modulation
of cortical excitability shifts induced by transcranial direct current stimulation
in humans. Journal of Physiology - London, 553(1), 293-301.
O'Doherty, J., Rolls, E. T., Francis, S., Bowtell, R., & McGlone, F. (2001).
Representation of pleasant and aversive taste in the human brain. Journal of
Neurophysiology, 85(3), 1315-1321.
Oliveri, M., Babiloni, C., Filippi, M. M., Caltagirone, C., Babiloni, F., Cicinelli, P.,
Traversa, R., Palmieri, M. G. & Rossini, P. M. (2010). Influence of the
supplementary motor area on primary motor cortex excitability during
movements triggered by neutral or emotionally unpleasant visual cues
Experimental Brain Research, 149(2), 214-221.
Painelli, V. S., Roschel, H., Gualano, B., Del-Favero, S., Benatti, F. B., Ugrinowitsch,
C., Tricoli, V., & Lancha, A. H., Jr. (2011). The effect of carbohydrate mouth
rinse on maximal strength and strength endurance. European Journal of
Applied Physiology, 111(9), 2381-2386.
Pasvol, G. (2006). The treatment of complicated and severe malaria. British Medical
Bulletin, 75-76, 29-47.
Paton, C. D., & Hopkins, W. G. (2001). Tests of cycling performance. Sports
Medicine, 31(7), 489-496.

Chapter Six – References
147
Paton, C. D., Lowe, T., & Irvine, A. (2010). Caffeinated chewing gum increases
repeated sprint performance and augments increases in testosterone in
competitive cyclists. European Journal of Applied Physiology, 110(6), 1243-
1250.
Palkovits, M. (1999). Interconnections between the neuroendocrine hypothalamus
and the central autonomic system. Frontiers in Neuroendocrinology, 20(4),
270-295.
Peyrot de Gachons, C., Beauchamp, G. K., Stern, R. M., Koch, K. L., & Breslin, Paul
A. S. (2011). Bitter taste induces nausea. Current Biology, 21(7), R247-248.
Phillips, S. M., Findlay, S., Kavaliauskas, M., & Grant, M. C. (2014). The influence
of serial carbohydrate mouth rinsing on power output during a cycle sprint.
Journal of Sports Science and Medicine, 13(2), 252-258.
Pottier, A., Bouckaert, J., Gilis, W., Roels, T., & Derave, W. (2010). Mouth rinse but
not ingestion of a carbohydrate solution improves 1-h cycle time trial
performance. Scandinavian Journal of Medicine and Science in Sports, 20,
105-111.
Reed, D. R., Zhu, G., Breslin, P. A. S., Duke, F. F., Henders, A. K., Campbell, M. J.,
Montgomery, G. W., Medland, S. E., Martin, N.G., & Wright, M. J. (2010).
The perception of quinine taste intensity is associated with common genetic
variants in a bitter receptor cluster on chromosome 12. Human Molecular
Genetics, 19(21), 4278-4285.
Reis, J., Swayne, O. B., Vandermeeren, Y., Camus, M., Dimyan, M. A., Harris-Love,
M., Perez, M. A., Ragert, P., Rothwell, J. C., & Cohen, L. G. (2008).
Contribution of transcranial magnetic stimulation to the understanding of
cortical mechanisms involved in motor control Journal of Physiology -
London, 586(2), 325-351.

Chapter Six – References
148
Robin, O., Rousmans, S., Dittmar, A., & Vernet-Maury, E. (2003). Gender influence
on emotional responses to primary tastes. Physiology and Behavior, 78(3),
385-393.
Roitman, M. F., Wheeler, R. A., & Carelli, R. M. (2005). Nucleus accumbens neurons
are innately tuned for rewarding and aversive taste stimuli, encode their
predictors, and are linked to motor output. Neuron, 45(4), 587-597.
Rollo, I., Williams, C., Gant, N., & Nute, M. (2008). The influence of carbohydrate
mouth rinse on self-selected speeds during a 30-min treadmill run.
International Journal of Sport Nutrition and Exercise Metabolism, 18(6),
585-600.
Rollo, I., Cole, M., Miller, R., & Williams, C. (2010). Influence of mouth rinsing a
carbohydrate solution on 1-h running performance. Medicine and Science in
Sports and Exercise, 42(4), 798-804.
Rollo, I., Williams, C., & Nevill, M. (2011). Influence of ingesting versus mouth
rinsing a carbohydrate solution during a 1-h run. Medicine and Science in
Sports and Exercise, 43(3), 468-475.
Rolls, E. T, Critchley, H. D., Verhagen, J. V., & Kadohisa, M. (2010). The
representation of information about taste and odor in the orbitofrontal cortex.
Chemosensory Perception, 3(1), 16-33.
Rosler, K. M., Roth, D. M., & Magistris, M. R. (2008). Trial-to-trial size variability
of motor-evoked potentials. A study using the triple stimulation technique
Experimental Brain Research, 187(1), 51-59.
Rossi, S., Pasqualetti, P., Rossini, P. M., Feige, B., Ulivelli, M., Glocker, F. X.,
Battistini, N., Lucking, C. H., & Kristeva-Feige, R. (2000). Effects of
repetitive transcranial magnetic stimulation on movement-related cortical
activity in humans. Cerebral Cortex, 10(8), 802-808.
Chapter Six – References
149
Rossini, P. M., Pauri, F., Cicinelli, P., Pasqualetti, P., Traversa, R., & Tecchio, F.
(1999). Neuromagnetic recordings and magnetic brain stimulation in the
evaluation of sensorimotor hand area interhemispheric differences:
normative, experimental and patients' data. Clinical Neurophysiology: From
Receptors to Perception, 50, 210-220.
Rousmans, S., Robin, O., Dittmar, A., & Vernet-Maury, E. (2000). Autonomic
nervous system responses associated with primary tastes. Chemical Senses,
25(6), 709-718.
Rozengurt, E., & Sternini, C. (2007). Taste receptor cell signaling in the mammalian
gut. Current Opinion in Pharmacology, 7(6), 557-562.
Rozengurt, E. (2006). Taste receptors in the gastrointestinal tract. Bitter taste
receptors and alpha-gustducin in the mammalian gut. American Journal of
Physiology - Gastrointestinal and liver physiology, 291(2), G171-G177.
Scott, T. R. (2010). Taste, reward and physiology. Chemosensory Perception, 3(1),
3-15.
Schmidt, L., Clery-Melin, M. L., Lafargue, G., Valabregue, R., Fossati, P., Dubois,
B., & Pessiglione, M. (2009). Get aroused and be stronger: Emotional
facilitation of physical effort in the human brain. Journal of Neuroscience,
29(30), 9450-9457.
Schifferstein, H., & Frijters, J. (1991). The perception of the taste of KCL, NACL and
quinine HCL is not related to PROP-sensitivity. Chemical Senses, 16(4), 303-
317.
Sinclair, J., Bottoms, L., Flynn, C., Bradley, E., Alexander, G., McCullagh, S., Finn,
T., & Hurst, H. T. (2014). The effect of different durations of carbohydrate
mouth rinse on cycling performance. European Journal of Sport Science,
14(3), 259-264.

Chapter Six – References
150
Small, D. M., Gregory, M. D., Mak, Y. E., Gitelman, D., Mesulam, M. M., & Parrish,
T. (2003). Dissociation of neural representation of intensity and affective
valuation in human gustation. Neuron, 39(4), 701-711.
Smith, O. A., DeVito, J. L., & Astley, C. A. (1990). Neurons controlling
cardiovascular responses to emotion are located in lateral hypothalamus-
perifornical region. American Journal of Physiology, 259(5), R943-R954.
Sugita, M., & Shiba, Y. (2005). Genetic tracing shows segregation of taste neuronal
circuitries for bitter and sweet. Science, 309(5735), 781-785.
Taylor, J. L., Butler, J. E., & Gandevia, S. C. (2000). Changes in muscle afferents,
motoneurons and motor drive during muscle fatigue. European Journal of
Applied Physiology, 83, 106-115.
Teo, W. P., Rodrigues, J. P., Mastaglia, F. L., & Thickbroom, G. W. (2012).
Breakdown in central motor control can be attenuated by motor practice and
neuro-modulation of the primary motor cortex. Neuroscience, 220, 11-18.
Tepper, B. J., Christensen, C. M., & Cao, J. (2001). Development of brief methods to
classify individuals by PROP taster status. Physiology and Behavior, 73(4),
571-577.
Tepper, B. J. (2008). Nutritional implications of genetic taste variation: The role of
PROP sensitivity and other taste phenotypes. Annual Review of Nutrition, 28,
367-388.
Thickbroom, G. W., Byrnes, M. L., Edwards, D. J., & Mastaglia, F. L. (2006).
Repetitive paired-pulse TMS at I-wave periodicity markedly increases
corticospinal excitability: A new technique for modulating synaptic plasticity.
Clinical Neurophysiology, 117(1), 61-66.
Travers, S. P., & Geran, L. C. (2009). Bitter-responsive brainstem neurons:
Characteristics and functions. Physiology and Behavior, 97, 592-603.

Chapter Six – References
151
Tsigos, C., & Chrousos, G. P. (2002). Hypothalamic-pituitary-adrenal axis,
neuroendocrine factors and stress. Journal of Psychosomatic Research, 53(4),
865-871.
Turner, C. E., Byblow, W. D., Stinear, C. M., & Gant, N. (2014). Carbohydrate in the
mouth enhances activation of brain circuitry involved in motor performance
and sensory perception. Appetite, 80, 212-219.
van Duinen, H., Renken, R., Maurits, N. M., & Zijdewind, I. (2008). Relation between
muscle and brain activity during isometric contractions of the first dorsal
interosseous muscle. Human Brain Mapping, 29(3), 281-299.
van Loon, A. M., van den Wildenberg, W. P. M., van Stergen, A. H., Hajcak, G., &
Ridderinkhof, K. R. (2010). Emotional stimuli modulate readiness for action:
a transcranial magnetic stimulation study. Cognitive Affective & Behavioral
Neuroscience, 10(2), 174-181.
Vernet-Maury, E., Robin, O., & Dittmar, A. (1995). The ohmic perturbation duration,
an original temporal index to quantify electrodermal responses. Behavioral
Brain Research 67, 103-107.
Vieira, J. L. F., & Midio, A. F. (2001). Drug monitoring of quinine in men with
nonsevere falciparum malaria: Study in the Amazon region of Brazil.
Therapeutic Drug Monitoring, 23(6), 612-615.
Wassermann, E. M. (2002). Variation in the response to transcranial magnetic brain
stimulation in the general population. Clinical Neurophysiology, 113(7),
1165-1171.
Whitham, M., & McKinney, J. (2007). Effect of a carbohydrate mouthwash on
running time-trial performance. Journal of Sports Sciences, 25(12), 1385-
1392.

Chapter Six – References
152
Wicks, D., Wright, J., Rayment, P., & Spiller, R. (2005). Impact of bitter taste on
gastric motility. European Journal of Gastroenterology and Hepatology,
17(9), 961-965.
Yeo, W. K., Paton, C. D., Garnham, A. P., Burke, L. M., Carey, A. L., & Hawley, J.
A. (2008). Skeletal muscle adaptation and performance responses to once a
day versus twice every second day endurance training regimens. Journal of
Applied Physiology, 105(5), 1462-1470.
Zald, D. H., Lee, J. T., Fluegel, K. W., & Pardo, J. V. (1998). Aversive gustatory
stimulation activates limbic circuits in humans. Brain, 121(6), 1143-1154.
Zald, D. H., & Pardo, J. V. (2000). Cortical activation induced by intraoral stimulation
with water in humans. Chemical Senses, 25(3), 267-275.
Zald, D. H., Hagen, M. C., & Pardo, J. V. (2002). Neural correlates of tasting
concentrated quinine and sugar solutions. Journal of Neurophysiology, 87(2),
1068-1075.
Zipp, P. (1982). Recommendations for the standardization of lead positions in surface
electromyography. European Journal of Applied Physiology, 50, 41-54.

153
Appendix A Human Ethics Approval
Forms

154
Research Ethics and Biosafety Office Research Services Phone: +61 8 6488 1610 Fax: +61 8 6488 8775 email:[email protected] MBDP: M459
Our Ref: RA/4/1/5124 15 March 2012 Professor Paul Fournier Sport Science, Exercise & Health (School of) MBDP: M408 Dear Professor Fournier HUMAN RESEARCH ETHICS APPROVAL - THE UNIVERSITY OF WESTERN AUSTRALIA ERGOGENIC EFFECT OF BITTER TASTING SOLUTIONS ON EXERCISE PERFORMANCE Student(s): Sharon Gam - PhD - 10755788 Ethics approval for the above project has been granted in accordance with the requirements of the National Statement on Ethical Conduct in Human Research (National Statement) and the policies and procedures of The University of Western Australia. Please note that the period of ethics approval for this project is five (5) years from the date of this notification. However, ethics approval is conditional upon the submission of satisfactory progress reports by the designated renewal date. Therefore initial approval has been granted from 29 February 2012 to 01 March 2013. You are reminded of the following requirements:
1. The application and all supporting documentation form the basis of the ethics approval and you must not depart from the research protocol that has been approved.
2. The Human Research Ethics Office must be approached for approval in
advance for any requested amendments to the approved research protocol.
3. The Chief Investigator is required to report immediately to the Human Research Ethics Office any adverse or unexpected event or any other event that may impact on the ethics approval for the project.
4. The Chief Investigator must inform the Human Research Ethics Office as
soon as practicable if a research project is discontinued before the expected

155
date of completion, providing reasons. Any conditions of ethics approval that have been imposed are listed below: Special Conditions
None specified The University of Western Australia is bound by the National Statement to monitor the progress of all approved projects until completion to ensure continued compliance with ethical standards and requirements. The Human Research Ethics Office will forward a request for a Progress Report approximately 60 days before the due date. A further reminder will be forwarded approximately 30 days before the due date. If your progress report is not received by the due date for renewal of ethics approval, your ethics approval will expire, requiring that all research activities involving human participants cease immediately. If you have any queries please do not hesitate to contact the Human Research Ethics Office (HREO) at [email protected] or on (08) 6488 3703. Please ensure that you quote the file reference – RA/4/1/5124 – and the associated project title in all future correspondence. Yours sincerely
Peter Johnstone Manager

156
Research Ethics and Biosafety Office
Research Services Phone: +61 8 6488 4703 Fax: +61 8 6488 8775 email: [email protected] MBDP:
M459
Our Ref: RA/4/1/6443 31 October 2013 Professor Paul Fournier School of Sport Science, Exercise & Health MBDP: M408 Dear Professor Fournier HUMAN RESEARCH ETHICS APPROVAL - THE UNIVERSITY OF WESTERN AUSTRALIA Effect of quinine on corticomotor excitability Student(s): Sharon Gam - PhD - 10755788 Ethics approval for the above project has been granted in accordance with the requirements of the National Statement on Ethical Conduct in Human Research (National Statement) and the policies and procedures of The University of Western Australia. Please note that the period of ethics approval for this project is five (5) years from the date of this notification. However, ethics approval is conditional upon the submission of satisfactory progress reports by the designated renewal date. Therefore initial approval has been granted from 31 October 2013 to 01 November 2014. You are reminded of the following requirements:
5. The application and all supporting documentation form the basis of the ethics approval and you must not depart from the research protocol that has been approved.
6. The Human Research Ethics Office must be approached for approval in
advance for any requested amendments to the approved research protocol.
7. The Chief Investigator is required to report immediately to the Human Research Ethics Office any adverse or unexpected event or any other event that may impact on the ethics approval for the project.
8. The Chief Investigator must inform the Human Research Ethics Office as
soon as practicable if a research project is discontinued before the expected date of completion, providing reasons.

157
Any conditions of ethics approval that have been imposed are listed below: Special Conditions
1. The Participant Information Sheet and Participant Consent Form both need to have the updated ‘standard paragraph’; "Approval to conduct this research has been provided by The University of Western Australia, in accordance with its ethics review and approval procedures. Any person considering participation in this research project, or agreeing to participate, may raise any questions or issues with the researchers at any time. In addition, any person not satisfied with the response of researchers may raise ethics issues or concerns, and may make any complaints about this research project by contacting the Human Research Ethics Office at The University of Western Australia on (08) 6488 3703 or by emailing to [email protected] All research participants are entitled to retain a copy of any Participant Information Form and/or Participant Consent Form relating to this research project."
The University of Western Australia is bound by the National Statement to monitor the progress of all approved projects until completion to ensure continued compliance with ethical standards and requirements. The Human Research Ethics Office will forward a request for a Progress Report approximately 60 days before the due date. A further reminder will be forwarded approximately 30 days before the due date. If your progress report is not received by the due date for renewal of ethics approval, your ethics approval will expire, requiring that all research activities involving human participants cease immediately. If you have any queries please contact the HREO at [email protected]. Please ensure that you quote the file reference – RA/4/1/6443 – and the associated project title in all future correspondence. Yours sincerely Dr Mark Dixon Associate Director, Research Ethics and Biosafety

158
Appendix B Information Sheets and
Consent Forms – Study One
159
Effect of Bitter Taste Solutions on Autonomic Nervous System Activity
-Participant Information Sheet-
Purpose of this study:
The process of tasting causes physiological responses in the brain and body which can be
measured using non-invasive sensors on the skin. This study aims to investigate the
responses to bitter taste solutions at varying concentrations.
Procedures:
You will be asked to attend the Exercise Physiology Laboratory at the School of Sport
Science, Exercise and Health at UWA on three separate occasions, each lasting
approximately one hour. Each will be conducted at the same time of the day, following a
one hour fast (no eating or drinking anything other than water for one hour prior to the
session).
For this study we need to group participants based on their ability to taste a bitter chemical
called PROP. To screen for tasting status, you will rinse your mouth (swish the solution
around your mouth the way you would with mouthwash) with six solutions. Three will
contain salt (NaCl) dissolved in water, and the other three will contain PROP dissolved
in water. You will rate each solution according to its intensity on a written scale.
At the beginning of each session, you will be seated comfortably and fitted with several
sensors which will measure your nervous system activation. These non-invasive sensors
will be secured with tape to your fingers, the palm of your hand and your chest. They will
not cause any harm or discomfort and will be removed immediately after each testing
session, however the area directly under the electrodes must be cleaned with alcohol and
lightly scrubbed to minimise interference. After the sensors are in place, you will be asked
to rinse your mouth for 10 seconds with several bitter tasting solutions before either
swallowing or spitting them out, depending on the session.
Between each mouth rinse you will be given water with which to rinse your mouth as
much as you like. During and after each mouth rinse, you will rate the taste of the solution
according to its intensity and unpleasantness on a written scale. You will also be asked to
rate your nausea level at these times. Meanwhile, the responses of your nervous system

160
to each mouth rinse will be monitored. Specifically, we will be measuring skin
conductance and heart rate.
Risks:
The taste solutions will vary in concentration from weak to very strong tasting. Some of
the strong solutions may taste unpleasant. However, none of the solutions (at any of the
concentrations that will be tested), are harmful and all have been used in many other taste
studies.
Confidentiality:
Your confidentiality will be maintained throughout the study through random assignment
of a number to de-identify your data. All data collected will be securely stored in a locked
filing cabinet and password-protected computer assessable only to the chief investigator
and PhD student (Sharon Gam). The findings of this study may be published, however all
information used will be non-identifiable.
Your Rights:
Participation in this research is voluntary and you are free to withdraw from the study at
any time without prejudice. You can withdraw for any reason and you do not need to
justify your decision. If you withdraw from the study and you are an employee or student
at the University of Western Australia (UWA) this will not prejudice your status and
rights as employee or student of UWA. If you do withdraw we may wish to retain the data
that we have recorded from you but only if you agree, otherwise your records will be
destroyed. Your participation in this study does not prejudice any right to compensation
that you may have under statute of common law. If you have any questions concerning
the research at any time please feel free to ask the researcher who has contacted you about
your concerns. Further information regarding this study may be obtained from Dr Kym
Guelfi on 6488 2602, Dr Paul Fournier on 6488 1356 or Sharon Gam on 0412 366 041 or
Approval to conduct this research has been provided by The University of Western
Australia, in accordance with its ethics review and approval procedures. Any person
considering participation in this research project, or agreeing to participate, may raise
any questions or issues with the researchers at any time. In addition, any person not
satisfied with the response of researchers may raise ethics issues or concerns, and may
161
make any complaints about this research project by contacting the Human Research
Ethics Office at The University of Western Australia on (08) 6488 3703 or by emailing to
[email protected] All research participants are entitled to retain a copy of any
Participant Information Form and/or Participant Consent Form relating to this research
project.

162
Effect of Bitter Taste Solutions on Autonomic Nervous System Activity
— Consent Form —
I ___________________________ have read the information provided and any
questions I have asked have been answered to my satisfaction. I agree to participate in
this activity, realising that I may withdraw at any time without reason and without
prejudice.
I understand that all information provided is treated as strictly confidential and will not
be released by the investigator unless required to by law. I have been advised as to what
data is being collected, what the purpose is, and what will be done with the data upon
completion of the research.
I agree that research data gathered for the study may be published provided my name or
other identifying information is not used.
______________________ __________________
Signature Date
Approval to conduct this research has been provided by The University of Western
Australia, in accordance with its ethics review and approval procedures. Any person
considering participation in this research project, or agreeing to participate, may raise
any questions or issues with the researchers at any time. In addition, any person not
satisfied with the response of researchers may raise ethics issues or concerns, and may
make any complaints about this research project by contacting the Human Research
Ethics Office at The University of Western Australia on (08) 6488 3703 or by emailing to
[email protected] All research participants are entitled to retain a copy of any
Participant Information Form and/or Participant Consent Form relating to this research
project.

163
Effect of Mouth Rinsing and Ingestion of Taste Solutions on the Metabolic
Responses to Maximal Exercise Performance
-Participant Information Sheet-
Purpose of this study:
Rinsing the mouth and ingesting different taste solutions may cause changes in muscle
performance at a metabolic level. The aim of this study is to investigate whether rinsing
the mouth and ingesting the solutions will cause different changes in blood variables,
including blood glucose and lactate, during a maximal cycling sprint.
Procedures:
Pre-screening:
For this study we need to group participants based on their ability to taste a bitter chemical
called PROP. To screen for tasting status, you will rinse your mouth (swish the solution
in your mouth the way you would with mouthwash) with six solutions. Three will contain
salt (NaCl) dissolved in water, and the other three will contain PROP dissolved in water.
You will rate each solution according to its intensity on a written scale.
You will be asked to attend the Exercise Physiology Laboratory at the School of Sport
Science, Exercise and Health at UWA on five separate occasions, each lasting
approximately half an hour. Each session will be separated by seven days and will be
conducted at the same time of morning after an overnight fast (i.e. no food or drink except
water for 10 hours prior to each session). You will also be required to record all meals
consumed, including their timing, for the 24 hours before each testing session and
replicate this diet before each subsequent session. You should wear your usual cycling
clothing, including cycling shoes. Please wear the same clothing for each experimental
trial.
On arrival at the lab, you will be asked to perform a light warm-up on the stationary bike
followed by a 10- minute rest. During the rest period, you will be asked to fill out a short
questionnaire to assess feelings of nausea and perceived exertion and have a small blood
sample will be taken from the fingertip. Briefly, this involves a small prick on the
fingertip with a sterile lancet device. It is possible that slight discomfort may be felt with
the procedure, however this is only temporary. At the end of the rest period, you will be
given a taste solution and asked to rinse the solution in your mouth for 10 seconds before

164
ingesting it. The solutions will either have a bitter taste, a sweet taste, or will be tasteless.
The bitter solution is composed of Quinine HCL, which is found in tonic water. The sweet
solution is composed of the artificial sweetener Aspartame, and the tasteless solution is
water. All of these solutions have been commonly used in taste tests and are safe for
consumption, especially in the small amounts used in this study.
Immediately after the mouth rinse, you will be asked to perform a 30-second maximal
sprint on the bike. It is important that you cycle as hard as you can for the duration of the
sprint, since we are interested in investigating how the mouth rinse solutions affect the
response of blood variables to maximal exercise. Seven minutes after the sprint protocol,
another small blood sample will be taken from the fingertip.
Benefits:
You will be given a free VO2max test for your participation in this study. This is an
expensive test usually given to elite athletes to measure cardiovascular fitness. The results
of this test can assist in your training.
Risks:
The blood sampling procedure may cause some mild discomfort and may leave a small
bruise at the sampling site. This procedure is used often in our lab and causes no long-
term harm. Finally, the bitter taste solution may be perceived as unpleasant, but it is not
harmful and its taste should disappear in a matter of seconds. All of the chemicals and
procedures used in this study have been previously tested and have been found to be safe
for use with human participants.
Confidentiality:
Your confidentiality will be maintained throughout the study through random assignment
of a number to de-identify your data. All data collected will be securely stored in a locked
filing cabinet and password-protected computer assessable only to the chief investigator
and PhD student (Sharon Gam). The findings of this study may be published, however all
information used will be non-identifiable.
Your Rights:
Participation in this research is voluntary and you are free to withdraw from the study at
any time without prejudice. You can withdraw for any reason and you do not need to
justify your decision. If you withdraw from the study and you are an employee or student

165
at the University of Western Australia (UWA) this will not prejudice your status and
rights as employee or student of UWA. If you do withdraw we may wish to retain the data
that we have recorded from you but only if you agree, otherwise your records will be
destroyed. Your participation in this study does not prejudice any right to compensation
that you may have under statute of common law. If you have any questions concerning
the research at any time please feel free to ask the researcher who has contacted you about
your concerns. Further information regarding this study may be obtained from Sharon
Gam on 0412 366 041 or [email protected], Dr Kym Guelfi on 6488 2602, Dr
Paul Fournier on 6488 1356.
Approval to conduct this research has been provided by The University of Western
Australia, in accordance with its ethics review and approval procedures. Any person
considering participation in this research project, or agreeing to participate, may raise
any questions or issues with the researchers at any time. In addition, any person not
satisfied with the response of researchers may raise ethics issues or concerns, and may
make any complaints about this research project by contacting the Human Research
Ethics Office at The University of Western Australia on (08) 6488 3703 or by emailing to
[email protected] All research participants are entitled to retain a copy of any
Participant Information Form and/or Participant Consent Form relating to this research
project.

166
Effect of Mouth Rinsing and Ingestion of Taste Solutions on the Metabolic
Response to Maximal Exercise Performance
— Consent Form —
I ___________________________ have read the information provided and any
questions I have asked have been answered to my satisfaction. I agree to participate in
this activity, realising that I may withdraw at any time without reason and without
prejudice.
I understand that all information provided is treated as strictly confidential and will not
be released by the investigator unless required to by law. I have been advised as to what
data is being collected, what the purpose is, and what will be done with the data upon
completion of the research.
I agree that research data gathered for the study may be published provided my name or
other identifying information is not used.
______________________ __________________
Signature Date
Approval to conduct this research has been provided by The University of Western
Australia, in accordance with its ethics review and approval procedures. Any person
considering participation in this research project, or agreeing to participate, may raise
any questions or issues with the researchers at any time. In addition, any person not
satisfied with the response of researchers may raise ethics issues or concerns, and may
make any complaints about this research project by contacting the Human Research
Ethics Office at The University of Western Australia on (08) 6488 3703 or by emailing to
[email protected] All research participants are entitled to retain a copy of any
Participant Information Form and/or Participant Consent Form relating to this research
project.

167
Appendix C Information Sheets and
Consent Forms – Study Two

168
Effect of Bitter Taste Solutions on Autonomic Nervous System Activity
-Participant Information Sheet-
Purpose of this study:
The process of tasting causes physiological responses in the brain and body which can be
measured using non-invasive sensors on the skin. This study aims to investigate the
responses to bitter taste solutions at varying concentrations.
Procedures:
You will be asked to attend the Exercise Physiology Laboratory at the School of Sport
Science, Exercise and Health at UWA on three separate occasions, each lasting
approximately one hour. Each will be conducted at the same time of the day, following a
one hour fast (no eating or drinking anything other than water for one hour prior to the
session).
For this study we need to group participants based on their ability to taste a bitter chemical
called PROP. To screen for tasting status, you will rinse your mouth (swish the solution
around your mouth the way you would with mouthwash) with six solutions. Three will
contain salt (NaCl) dissolved in water, and the other three will contain PROP dissolved
in water. You will rate each solution according to its intensity on a written scale.
At the beginning of each session, you will be seated comfortably and fitted with several
sensors which will measure your nervous system activation. These non-invasive sensors
will be secured with tape to your fingers, the palm of your hand and your chest. They will
not cause any harm or discomfort and will be removed immediately after each testing
session, however the area directly under the electrodes must be cleaned with alcohol and
lightly scrubbed to minimise interference. After the sensors are in place, you will be asked
to rinse your mouth for 10 seconds with several bitter tasting solutions before either
swallowing or spitting them out, depending on the session.
Between each mouth rinse you will be given water with which to rinse your mouth as
much as you like. During and after each mouth rinse, you will rate the taste of the solution

169
according to its intensity and unpleasantness on a written scale. You will also be asked to
rate your nausea level at these times. Meanwhile, the responses of your nervous system
to each mouth rinse will be monitored. Specifically, we will be measuring skin
conductance and heart rate.
Risks:
The taste solutions will vary in concentration from weak to very strong tasting. Some of
the strong solutions may taste unpleasant. However, none of the solutions (at any of the
concentrations that will be tested), are harmful and all have been used in many other taste
studies.
Confidentiality:
Your confidentiality will be maintained throughout the study through random assignment
of a number to de-identify your data. All data collected will be securely stored in a locked
filing cabinet and password-protected computer assessable only to the chief investigator
and PhD student (Sharon Gam). The findings of this study may be published, however all
information used will be non-identifiable.
Your Rights:
Participation in this research is voluntary and you are free to withdraw from the study at
any time without prejudice. You can withdraw for any reason and you do not need to
justify your decision. If you withdraw from the study and you are an employee or student
at the University of Western Australia (UWA) this will not prejudice your status and
rights as employee or student of UWA. If you do withdraw we may wish to retain the data
that we have recorded from you but only if you agree, otherwise your records will be
destroyed. Your participation in this study does not prejudice any right to compensation
that you may have under statute of common law. If you have any questions concerning
the research at any time please feel free to ask the researcher who has contacted you about
your concerns. Further information regarding this study may be obtained from Dr Kym
Guelfi on 6488 2602, Dr Paul Fournier on 6488 1356 or Sharon Gam on 0412 366 041 or
Approval to conduct this research has been provided by The University of Western
Australia, in accordance with its ethics review and approval procedures. Any person
considering participation in this research project, or agreeing to participate, may raise

170
any questions or issues with the researchers at any time. In addition, any person not
satisfied with the response of researchers may raise ethics issues or concerns, and may
make any complaints about this research project by contacting the Human Research
Ethics Office at The University of Western Australia on (08) 6488 3703 or by emailing to
[email protected] All research participants are entitled to retain a copy of any
Participant Information Form and/or Participant Consent Form relating to this research
project.

171
Effect of Bitter Taste Solutions on Autonomic Nervous System Activity
— Consent Form —
I ___________________________ have read the information provided and any
questions I have asked have been answered to my satisfaction. I agree to participate in
this activity, realising that I may withdraw at any time without reason and without
prejudice.
I understand that all information provided is treated as strictly confidential and will not
be released by the investigator unless required to by law. I have been advised as to what
data is being collected, what the purpose is, and what will be done with the data upon
completion of the research.
I agree that research data gathered for the study may be published provided my name or
other identifying information is not used.
______________________ __________________
Signature Date
Approval to conduct this research has been provided by The University of Western
Australia, in accordance with its ethics review and approval procedures. Any person
considering participation in this research project, or agreeing to participate, may raise
any questions or issues with the researchers at any time. In addition, any person not
satisfied with the response of researchers may raise ethics issues or concerns, and may
make any complaints about this research project by contacting the Human Research
Ethics Office at The University of Western Australia on (08) 6488 3703 or by emailing to
[email protected] All research participants are entitled to retain a copy of any
Participant Information Form and/or Participant Consent Form relating to this research
project.

172
Effect of Mouth Rinse Solutions on the Metabolic Responses to Maximal Exercise
Performance
-Participant Information Sheet-
Purpose of this study:
Rinsing the mouth with a taste solution may cause changes in muscle performance at a
metabolic level. The aim of this study is to investigate whether these changes are reflected
in blood variables, including blood glucose and lactate, during a maximal cycling sprint.
Procedures:
Pre-screening:
For this study we need to group participants based on their ability to taste a bitter chemical
called PROP. To screen for tasting status, you will rinse your mouth (swish the solution
in your mouth the way you would with mouthwash) with six solutions. Three will contain
salt (NaCl) dissolved in water, and the other three will contain PROP dissolved in water.
You will rate each solution according to its intensity on a written scale.
You will be asked to attend the Exercise Physiology Laboratory at the School of Sport
Science, Exercise and Health at UWA on five separate occasions, each lasting
approximately half an hour. Each session will be separated by seven days and will be
conducted at the same time of morning after an overnight fast (i.e. no food or drink except
water for 10 hours prior to each session). You will also be required to record all meals
consumed, including their timing, for the 24 hours before each testing session and
replicate this diet before each subsequent session. You should wear your usual cycling
clothing, including cycling shoes. Please wear the same clothing for each experimental
trial.
On arrival at the lab, you will be asked to perform a light 4-minute warm-up on a
stationary bike followed by a 10-minute rest. During this rest period, you will be asked
to fill out a short questionnaire to assess feelings of nausea and perceived exertion and
have a small capillary blood sample taken from your fingertip (approximately 7 drops of
blood per sample which equates to less than 1/5th of a milliliter). Briefly, this involves a
small prick on the fingertip with a sterile lancet device. It is possible that slight discomfort
may be felt with the procedure, however this is only temporary.

173
At the end of the rest period, you will be given a taste solution and asked to rinse the
solution in your mouth for 10 seconds before spitting it out. The solutions will either have
a bitter taste, a sweet taste, or will be tasteless. The bitter solution is composed of Quinine
HCL, which is found in tonic water. The sweet solution is composed of Glucose, and the
tasteless solution is water. All of these solutions have been commonly used in taste tests
and are safe for consumption, especially in the small amounts used in this study.
Immediately after the mouth rinse, you will be asked to perform a 30-second maximal
sprint on the bike. It is important that you cycle as hard as you can for the duration of the
sprint, since we are interested in investigating how the mouth rinse solutions affect the
response of blood variables to maximal exercise. Another small capillary blood sample
will be taken immediately after the sprint is completed, and you will be asked to fill out
another short questionnaire. Seven minutes after the sprint protocol, a final capillary
blood sample will be taken from the fingertip.
Benefits:
You will be given a free VO2max test for your participation in this study. This is an
expensive test usually given to elite athletes to measure cardiovascular fitness. The results
of this test can assist in your training.
Risks:
The blood sampling procedure may cause some mild discomfort and may leave a small
bruise at the sampling site. This procedure is used often in our lab and causes no long-
term harm. In addition, some of the taste solutions may be perceived as unpleasant, but
they are also not harmful and their taste should disappear in a matter of minutes. All of
the chemicals and procedures used in this study have been previously tested and have
been found to be safe for use with human participants.
Confidentiality:
Your confidentiality will be maintained throughout the study through random assignment
of a number to de-identify your data. All data collected will be securely stored in a locked
filing cabinet and password-protected computer assessable only to the chief investigator
and PhD student (Sharon Gam). The findings of this study may be published, however all
information used will be non-identifiable.

174
Your Rights:
Participation in this research is voluntary and you are free to withdraw from the study at
any time without prejudice. You can withdraw for any reason and you do not need to
justify your decision. If you withdraw from the study and you are an employee or student
at the University of Western Australia (UWA) this will not prejudice your status and
rights as employee or student of UWA. If you do withdraw we may wish to retain the data
that we have recorded from you but only if you agree, otherwise your records will be
destroyed. Your participation in this study does not prejudice any right to compensation
that you may have under statute of common law. If you have any questions concerning
the research at any time please feel free to ask the researcher who has contacted you about
your concerns. Further information regarding this study may be obtained from Sharon
Gam on 0412 366 041 or [email protected], Dr Kym Guelfi on 6488 2602, Dr
Paul Fournier on 6488 1356.
Approval to conduct this research has been provided by The University of Western Australia, in
accordance with its ethics review and approval procedures. Any person considering participation
in this research project, or agreeing to participate, may raise any questions or issues with the
researchers at any time. In addition, any person not satisfied with the response of researchers
may raise ethics issues or concerns, and may make any complaints about this research project by
contacting the Human Research Ethics Office at The University of Western Australia on (08) 6488
3703 or by emailing to [email protected] All research participants are entitled to retain
a copy of any Participant Information Form and/or Participant Consent Form relating to this
research project.

175
Effect of Mouth Rinse Solutions on the Metabolic Responses to Maximal Exercise
Performance
— Consent Form —
I ___________________________ have read the information provided and any
questions I have asked have been answered to my satisfaction. I agree to participate in
this activity, realising that I may withdraw at any time without reason and without
prejudice.
I understand that all information provided is treated as strictly confidential and will not
be released by the investigator unless required to by law. I have been advised as to what
data is being collected, what the purpose is, and what will be done with the data upon
completion of the research.
I agree that research data gathered for the study may be published provided my name or
other identifying information is not used.
______________________ __________________
Signature Date
Approval to conduct this research has been provided by The University of Western
Australia, in accordance with its ethics review and approval procedures. Any person
considering participation in this research project, or agreeing to participate, may raise
any questions or issues with the researchers at any time. In addition, any person not
satisfied with the response of researchers may raise ethics issues or concerns, and may
make any complaints about this research project by contacting the Human Research
Ethics Office at The University of Western Australia on (08) 6488 3703 or by emailing to
[email protected] All research participants are entitled to retain a copy of any
Participant Information Form and/or Participant Consent Form relating to this research
project.

176
Appendix D Information Sheets and Consent Forms – Study
Three

177
Effect of a Bitter Tasting Quinine Solution on Corticomotor Excitability in Male
Cyclists
-Participant Information Sheet-
Purpose of this study:
The presence of taste in the mouth activates areas of the brain which may have the
capacity to influence motor signals being sent from the brain to the muscles. The aim of
this study is to investigate how these taste signals affect the properties of the motor cortex.
This will be investigated using transcranial magnetic stimulation (TMS), which is a non-
invasive method for studying the excitability of the cortical motor system.
Procedures:
Pre-screening:
For this study we need to group participants based on their ability to taste a bitter chemical
called PROP. To screen for tasting status, you will rinse your mouth (swish the solution
in your mouth the way you would with mouthwash) with six solutions. Three will contain
salt (NaCl) dissolved in water, and the other three will contain PROP dissolved in water.
You will rate each solution according to its intensity on a written scale.
You will be asked to attend the Transcranial Magnetic Stimulation Laboratory at the
School of Psychology at UWA on two separate occasions, each lasting approximately 45
minutes. Each session will be conducted at the same time of morning after an overnight
fast (no food or drink other than water for 10 hours prior to each session). You will be
seated comfortably with your dominant arm resting on a table. Surface electrodes will be
attached to your hand with tape, which will measure electrical activity from your muscle.
They will not cause any harm or discomfort and will be removed immediately after each
testing session, however the area directly under the electrodes must be cleaned with
alcohol and lightly scrubbed to minimise interference.
A TMS coil will be positioned over your scalp with reference to a plastic cap with pre-
marked spacings. TMS is a non-invasive procedure in which a brief magnetic pulse is

178
discharged through an insulated coil held over the scalp. The magnetic pulse passes
through the scalp and the skull and excites nerve cells in the cortex of the brain underlying
the coil. The stimuli are not painful and will be felt as brief mechanical ‘taps’ on your
scalp. You will also hear a click when the pulse is discharged through the coil.
The session will start by determining the level of TMS to be used by starting with very
low level TMS pulses which are gradually increased until they produce a muscle twitch.
This pulse is not painful, but will produce a very brief involuntary contraction in the finger
(very similar to the contraction produced when a doctor taps your kneecap to test your
reflexes). Once this level is determined, a set of 10 TMS pulses will be applied with 5
seconds between each pulse. Next you will be given a solution and asked to rinse it in
your mouth for 10 seconds before swallowing it. The solution will either taste bitter or
will be tasteless. The bitter solution is composed of Quinine HCL which is found in tonic
water. Immediately after swallowing the solution, another set of 10 TMS pulses will be
delivered. You will be asked to remain as still as possible while the TMS pulses are
delivered.
Benefits:
You will be given a free VO2max test for your participation in this study. This is an
expensive test usually given to elite athletes to measure cardiovascular fitness. The results
of this test can assist in your training.
Risks:
There are no known adverse side effects of TMS in the majority of individuals. In some
rare cases susceptible individuals have experienced a temporary feeling of faintness or
dizziness which may last a few minutes before returning to normal. If you have a prior
history of faintness or dizziness it is recommended that you do not participate. Since the
procedure uses a magnetic pulse, there are various factors which will exclude you from
participating in the study. These include having a pacemaker or metal object (such as a
surgical clip or dental braces) inside your body and a history of an epileptic condition.
You will be asked a series of questions on a ‘medical history’ form to determine if there
are any factors that prevent you from participating in this study. If you choose not to
complete this form the experiment will terminate and no TMS will be given.

179
The bitter taste solution may be perceived as unpleasant, but it is not harmful and its taste
should disappear in a matter of seconds. All of the chemicals and procedures used in this
study have been previously tested and have been found to be safe for use with human
participants.
Confidentiality:
Your confidentiality will be maintained throughout the study through random assignment
of a number to de-identify your data. All data collected will be securely stored in a locked
filing cabinet and password-protected computer assessable only to the chief investigator
and PhD student (Sharon Gam). The findings of this study may be published, however all
information used will be non-identifiable.
Your Rights:
Participation in this research is voluntary and you are free to withdraw from the study at
any time without prejudice. You can withdraw for any reason and you do not need to
justify your decision. If you withdraw from the study and you are an employee or student
at the University of Western Australia (UWA) this will not prejudice your status and
rights as employee or student of UWA. If you do withdraw we may wish to retain the data
that we have recorded from you but only if you agree, otherwise your records will be
destroyed. Your participation in this study does not prejudice any right to compensation
that you may have under statute of common law. If you have any questions concerning
the research at any time please feel free to ask the researcher who has contacted you about
your concerns. Further information regarding this study may be obtained from Sharon
Gam on 0412 366 041 or [email protected], Dr Kym Guelfi on 6488 2602, Dr
Paul Fournier on 6488 1356.
Approval to conduct this research has been provided by The University of Western
Australia, in accordance with its ethics review and approval procedures. Any person
considering participation in this research project, or agreeing to participate, may raise
any questions or issues with the researchers at any time. In addition, any person not
satisfied with the response of researchers may raise ethics issues or concerns, and may
make any complaints about this research project by contacting the Human Research

180
Ethics Office at The University of Western Australia on (08) 6488 3703 or by emailing to
[email protected] All research participants are entitled to retain a copy of any
Participant Information Form and/or Participant Consent Form relating to this research
project.

181
Effect of a Bitter Tasting Quinine Solution on Corticomotor Excitability in Male
Cyclists
— Consent Form —
I ___________________________ have read the information provided and any
questions I have asked have been answered to my satisfaction. I agree to participate in
this activity, realising that I may withdraw at any time without reason and without
prejudice. I have been informed about the transcranial magnetic stimulation (TMS)
procedure, and have been told about the possible advantages and risks associated with
participating in this study. I have understood and completed the medical checklist and
have no condition that prevents me from participating in this experiment.
Medical Exclusion Criteria
You cannot participate in this research project if you have had any of the following
procedures or if any of the following conditions apply to you:
Brain surgery
Cardiac surgery
Ear surgery
Epilepsy
Migraine
Episodes of faintness
Peripheral nerve disease or abnormality
Metal implants in your head
Metal implants or devices in your body (e.g. surgical clip, coronary stent)
(Note: metal dental fillings and metal dental braces will not exclude you from
participating)
Currently taking psycho-active medication
Currently using a hearing aid
Please indicate whether any of the above exclusion criteria apply to you: YES NO

182
I understand that all information provided is treated as strictly confidential and will not
be released by the investigator unless required to by law. I have been advised as to what
data is being collected, what the purpose is, and what will be done with the data upon
completion of the research.
I agree that research data gathered for the study may be published provided my name or
other identifying information is not used.
______________________ __________________
Signature Date
Approval to conduct this research has been provided by The University of Western
Australia, in accordance with its ethics review and approval procedures. Any person
considering participation in this research project, or agreeing to participate, may raise
any questions or issues with the researchers at any time. In addition, any person not
satisfied with the response of researchers may raise ethics issues or concerns, and may
make any complaints about this research project by contacting the Human Research
Ethics Office at The University of Western Australia on (08) 6488 3703 or by emailing to
[email protected] All research participants are entitled to retain a copy of any
Participant Information Form and/or Participant Consent Form relating to this research
project.

183
Appendix E Perceptual Scales and
Instructions

184
General Labeled Magnitude Scale (gLMS) (Green et al., 1996)
Strongest Imaginable Sensation of Any Kind
Very Strong
Strong
Moderate
Weak
Barely Detectable

185
gLMS Instructions:
(Green et al., 1996)
Taste Intensity:
Please rate the intensity of each solution by placing a horizontal line across the scale at
the point that best describes what you are experiencing. You can use any part of the line
scale that seems appropriate for judging intensity. In making your judgments of
intensity, you should rate the solution relative to the strength of all sensations you have
experienced in your mouth in everyday life. Thus, “strongest imaginable” refers to the
most intense sensation you have ever experienced putting food and non-food items in
your mouth. This includes such varied taste and mouth-feel sensations that come from
hot and cold foods and beverages, spices and spicy foods, toothpaste, mouthwash,
medicines, etc.
Unpleasantness:
Please rate the unpleasantness of each solution by placing a horizontal line across the
scale at the point that best describes what you are experiencing. You can use any part of
the line scale that seems appropriate for judging unpleasantness. In making your
judgments of unpleasantness, you should rate the solution relative to the unpleasantness
of all sensations you have experienced in your mouth in everyday life. Thus, “strongest
imaginable” refers to the most unpleasant sensation you have ever experienced putting
food and non-food items in your mouth. This includes such varied taste and mouth-feel
sensations that come from hot and cold foods and beverages, spices and spicy foods,
toothpaste, mouthwash, medicines, etc.

186
Ratings of Perceived Exertion
(Borg, 1982)
Please rate your perception of exertion during the exercise. This feeling should reflect
how heavy and strenuous the exercise feels to you, combining all sensations and feelings
of physical stress, effort, and fatigue.
6
7 Very, Very Light
8
9 Very Light
10
11 Fairly Light
12
13 Somewhat Hard
14
15 Hard
16
17 Very Hard
18
19 Very, Very Hard
20

187
Nausea Scale
(Muth et al., 1996)
Please place a vertical mark across the line below to indicate how intensely you feel
nausea.
No nausea Extreme nausea


