
The 5 Styles of Business Intelligence:
INDUSTRIAL-STRENGTH BUSINESS INTELLIGENCE

The 5 Styles of Business Intelligence:INDUSTRIAL-STRENGTH BUSINESS INTELLIGENCE
A White Paper Prepared by MicroStrategy, Inc.

TABLE OF CONTENTS

1 EXECUTIVE SUMMARY
2 THE 5 STYLES OF BUSINESS INTELLIGENCE2.1 The 5 Styles of Business Intelligence in an Enterprise Application Scenario2.2 Industrial-Strength Business Intelligence Technology is Needed to Meet
Companies’ Growing Requirements for Business Intelligence
3 ENTERPRISE REPORTING3.1 Support for All Forms of Enterprise Reports3.2 User-defined Web Reporting3.3 High Throughput Report Production and Distribution3.4 Pixel-perfect and Print-perfect Design Without Any Programming3.5 Enterprise Reporting Summary
4 CUBE ANALYSIS4.1 Speed-of-Thought Report Analysis and Manipulations4.2 Cube Sharing with Personalized Views and Security4.3 Automatic Synchronization of Intelligent Cubes’ Data `4.4 Ad Hoc Drilling from Summary Data to Transactional Details4.5 Cube Summary Analysis
5 AD HOC QUERY AND ANALYSIS5.1 Parameter-driven Reporting and Guided Analysis5.2 Drill Anywhere Allows Users to Surf the Entire Database, Creating New
Ad Hoc Reports Dynamically Through the Drilling Process5.3 OLAP Analysis Against the Entire Database – On the Fly Report Manipulations5.4 Filtering Data Using the Power of Sets 5.5 User-defined Data Grouping5.6 Ad Hoc Query and Analysis Summary
6 STATISTICAL ANALYSIS AND DATA MINING6.1 Applying Statistics and Data Mining Against the Entire Database and
for All Users 6.2 Plug-and-Play Architecture for Custom Analytical Functions6.3 Seamless Integration with Data Mining Tools6.4 Sophisticated Analytic Collaboration with the Relational Databases6.5 Multi-pass SQL Produces Calculations Not Otherwise Possible6.6 Statistical Analysis and Data Mining Summary
7 REPORT DELIVERY AND ALERTING7.1 Report Distribution Through Any Touchpoint7.2 Self-subscription as well as Administrator-based Distribution7.3 Delivery On-demand, On-schedule or On-event7.4 Automatic Content Personalization7.5 Report Delivery and Alerting Summary
8 UNIFIED USER INTERFACE AND UNIFIED BACKPLANE ARCHITECTURE8.1 Single Unified User Interface8.2 Single Unified Backplane
5
911
13
192023283032
353740414142
4546
4849515253
57
586062636465
696970717274
777981

The purpose of this paper is to provide a framework for understanding the diverse range of business intel-
ligence (BI) functionality that has evolved in the market over the past 15 years. It is also intended to show
that there is a fundamental shortcoming in most BI tools today because they cannot support the full range
of BI functionality within a single architecture – leading to excessive costs, excessive delays and excessive
user dissatisfaction. Finally, this paper describes the MicroStrategy architecture as being the only BI archi-
tecture capable of delivering all of the functionality requirements within a single architecture.
This paper looks at the historical development of BI applications and BI technology, and concludes that
five common Styles of BI have evolved during the past decade – each style representing a certain charac-
teristic usage and function by end users. These 5 Styles of BI are:
1. Enterprise Reporting – Broadly deployed pixel-perfect report formats for operational reporting
and scorecards/dashboards targeted at information consumers and executives.
2. Cube Analysis – OLAP slice-and-dice analysis of limited data sets, targeted at managers and oth-
ers who need a safe and simple environment for basic data exploration within a limited range of data.
3. Ad Hoc Query and Analysis – Full investigative query into all data, as well as automated slice-
and-dice OLAP analysis of the entire database – down to the transaction level of detail if necessary.
Targeted at information explorers and power users.
4. Statistical Analysis and Data Mining – Full mathematical, financial, and statistical treatment
of data for purposes of correlation analysis, trend analysis, financial analysis and projections.
Targeted at the professional information analysts.
5. Alerting and Report Delivery – Proactive report delivery and alerting to very large populations
based on schedules or event triggers in the database. Targeted at very large user populations of
information consumers, both internal and external to the enterprise.
This paper shows that most BI technologies today can deliver only a single Style of BI. It shows that com-
panies are increasingly dissatisfied with this limitation because it perpetuates a multiplicity of BI technolo-
gies within the enterprise that increases costs of ownership, decreases user acceptance and limits the
richness of each BI application.
5
1EXECUTIVE SUMMARY

This paper shows that enterprises today need a BI technology that can support any or all of the 5 Styles
of BI in any combination for any given BI application. Moreover, it argues that the only good architec-
ture for delivering all 5 Styles of BI is one where each Style of BI can be:
1. Mixed-and-matched seamlessly for users, where the addition of each new BI Style adds function-
ality to the users’ existing reports
2. Expressed through a single unified user interface to maximize ease of use and user acceptance
3. Delivered on top of a single integrated backplane that unifies the metadata, security and user
profiles, ensuring a single version of the truth throughout the enterprise and thus minimizing
administration and maintenance efforts by IT
Finally, it shows that MicroStrategy delivers each Style of BI uniquely well and that only the
MicroStrategy architecture can deliver all 5 Styles of BI on a single unified backplane and through a sin-
gle unified user interface. It shows that all other BI technologies are fragmented along Styles of BI, such
that they impose different user interfaces, different metadata and different security for each Style of BI.
CHAPTER 1
Executive Summary
6
Since the early 1990s, BI applications have evolved dramatically and in many directions as companies’
access to, and appetite for, information grew exponentially. From operational “green-bar” reports gener-
ated by mainframes, to statistical modeling of marketing campaigns, to multi-dimensional OLAP environ-
ments for analysts, to dashboards and scorecards for executives – companies began to demand more ways
to report on and analyze data. The dramatic expansion of data warehousing combined with the wide-
spread adoption of enterprise applications, such as Enterprise Resource Planning (ERP) and Customer
Relationship Management (CRM), and the overall increase in computer literacy, fueled this exponential
demand for BI reporting and analysis applications.
During this formative period, companies actively discovered many new ways to use their data assets for
decision support, operational reporting and process optimization. And during this era of invention, BI
technology vendors reacted the way software vendors always react to new evolving markets – that is, by
building niche software to implement each new pattern of application that companies invented. These
patterns of applications resulted in software products centered exclusively on one Style of BI, as follows:
1. Enterprise Reporting – Report writers were used to generate highly formatted static reports
destined for broad distribution to many people.
2. Cube Analysis – Cube-based BI tools were used to provide simple slice-and-dice analytical
capabilities to business managers.
3. Ad Hoc Query and Analysis – Relational OLAP tools were used to allow power users to query
the database for any answer, slice-and-dice the entire database and surf down to the lowest level
of transactional information.
4. Statistical Analysis and Data Mining – Statistical and data mining tools were used to perform
predictive modeling or to discover the cause-and-effect correlation between two metrics.
5. Report Delivery and Alerting – Report Distribution engines were used to send full reports or
alerts to large user populations based on subscriptions, schedules or threshold events in the databases.
9
2THE 5 STYLES OF BUSINESS INTELLIGENCE

At this point in time, most leading enterprises have purchased many different BI tool sets from many dif-
ferent vendors – with each tool targeted at a new BI application and each tool delivering user functional-
ity focused on only one of the Styles of BI.
One way to look at these different Styles of BI is to place them in a two-dimensional space (Fig. 1) where
the vertical axes represents the sophistication and interactivity of the analytical processes and the horizon-
tal axis represents scale, or the size of the user population. We can then locate each of the 5 Styles of BI
in a region on the grid, as we see in the figure below.
The most sophisticated and interactive Styles of BI are used by relatively small groups of users consisting
of information analysts and power users, for whom data and analysis are their primary jobs. Less inter-
active Styles of BI deliver basic data and results that are applicable to very large user populations ranging
from senior executives all the way to staff personnel.
Leading organizations have recognized the benefits of putting information into the hands of all their
employees, regardless of job title or function. Only the MicroStrategy architecture can deliver all 5 Styles
of BI functionality to each and every user within an enterprise, offering different functionality levels with-
in the 5 Styles of BI tailored for each user.
CHAPTER 2
The 5 Styles of Business Intelligence
10
Statistics & Data Mining
Advanced AnalysesHypothesis TestingPredictive Analysis
•••
Ad-Hoc Query & Analysis
Canned and Parameterized ReportsAd Hoc Query Generation and Drill AnywhereOLAP Functionality Against the Entire Database
•••
Cube Analysis
OLAP Functionality Against a Data Subset (cube)Pre-defined Analytical ViewsSpeed-of-Thought Slice and Dice Analysis
•••
Enterprise Reporting
Batch Production of Printed and Web ReportsPixel-Level Control of Field PlacementMulti-Report Scorecards and Dashboards
•••
Report Delivery & Alerting
Report Subscription and DeliveryException-based AlertingInformation Delivery Services
•••
INCR
EASI
NG
AN
ALYT
IC S
OPH
ISTI
CATI
ON
& U
SER
INTE
RACT
IVIT
Y
INCREASING NUMBER AND RANGE OF USERS
Information Analysts Business Managers All Workers Extranets Consumers
Figure 1 – The 5 Styles of Business Intelligence have evolved to support different needs, from advanced professional analysis to basic information consumption.
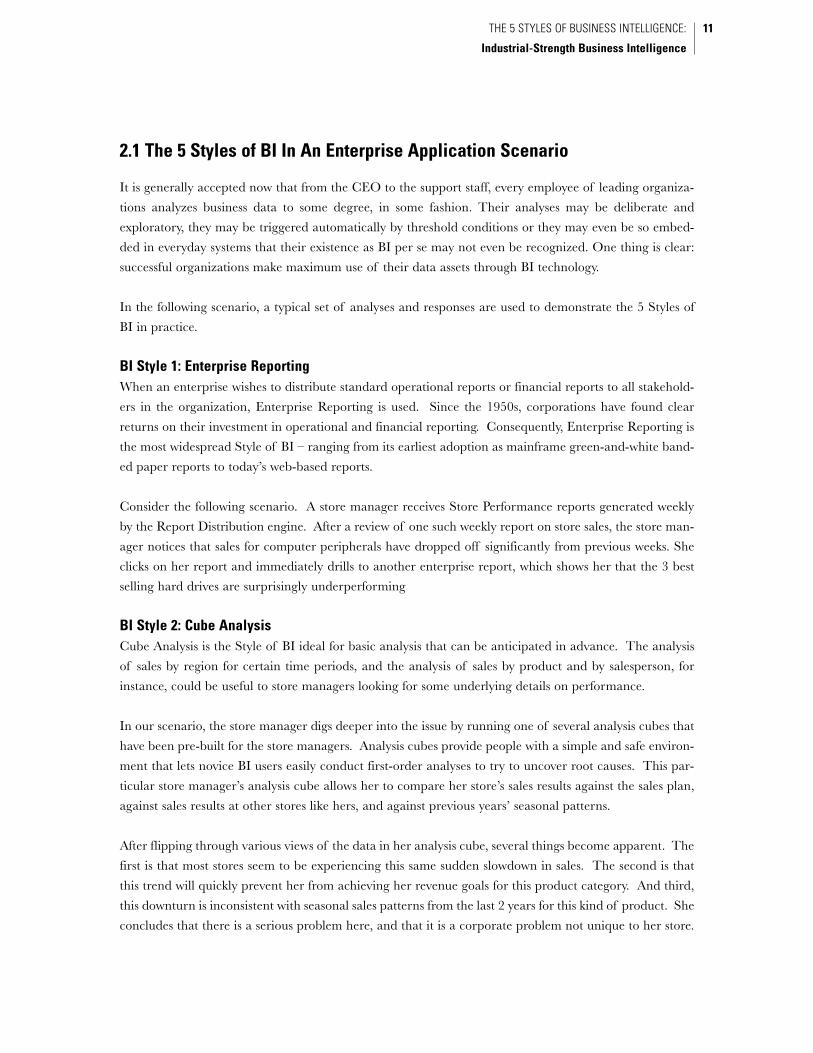
2.1 The 5 Styles of BI In An Enterprise Application Scenario
It is generally accepted now that from the CEO to the support staff, every employee of leading organiza-
tions analyzes business data to some degree, in some fashion. Their analyses may be deliberate and
exploratory, they may be triggered automatically by threshold conditions or they may even be so embed-
ded in everyday systems that their existence as BI per se may not even be recognized. One thing is clear:
successful organizations make maximum use of their data assets through BI technology.
In the following scenario, a typical set of analyses and responses are used to demonstrate the 5 Styles of
BI in practice.
BI Style 1: Enterprise ReportingWhen an enterprise wishes to distribute standard operational reports or financial reports to all stakehold-
ers in the organization, Enterprise Reporting is used. Since the 1950s, corporations have found clear
returns on their investment in operational and financial reporting. Consequently, Enterprise Reporting is
the most widespread Style of BI – ranging from its earliest adoption as mainframe green-and-white band-
ed paper reports to today’s web-based reports.
Consider the following scenario. A store manager receives Store Performance reports generated weekly
by the Report Distribution engine. After a review of one such weekly report on store sales, the store man-
ager notices that sales for computer peripherals have dropped off significantly from previous weeks. She
clicks on her report and immediately drills to another enterprise report, which shows her that the 3 best
selling hard drives are surprisingly underperforming
BI Style 2: Cube AnalysisCube Analysis is the Style of BI ideal for basic analysis that can be anticipated in advance. The analysis
of sales by region for certain time periods, and the analysis of sales by product and by salesperson, for
instance, could be useful to store managers looking for some underlying details on performance.
In our scenario, the store manager digs deeper into the issue by running one of several analysis cubes that
have been pre-built for the store managers. Analysis cubes provide people with a simple and safe environ-
ment that lets novice BI users easily conduct first-order analyses to try to uncover root causes. This par-
ticular store manager’s analysis cube allows her to compare her store’s sales results against the sales plan,
against sales results at other stores like hers, and against previous years’ seasonal patterns.
After flipping through various views of the data in her analysis cube, several things become apparent. The
first is that most stores seem to be experiencing this same sudden slowdown in sales. The second is that
this trend will quickly prevent her from achieving her revenue goals for this product category. And third,
this downturn is inconsistent with seasonal sales patterns from the last 2 years for this kind of product. She
concludes that there is a serious problem here, and that it is a corporate problem not unique to her store.
11THE 5 STYLES OF BUSINESS INTELLIGENCE:
Industrial-Strength Business Intelligence

CHAPTER 2
The 5 Styles of Business Intelligence
12
She forwards a link to this analysis cube to a buyer at HQ , so they can see exactly what she has seen and
delve deeper into the problem.
BI Style 3: Ad Hoc Query and AnalysisAd Hoc Query and Analysis is the Style of BI that enables true investigative analysis of enterprise data,
down to the transaction level of detail.
The buyer at HQ accesses the analysis cube but cannot determine what is happening based solely on pre-
defined comparisons within the cube. The buyer needs to probe many more areas of the database to
determine what is going on, and uses Ad Hoc Query and Analysis techniques to accomplish this.
In our scenario, the buyer runs a parameterized, or prompted, report that lets him create an ad hoc report
simply by answering some initial questions. His prompt answers automatically generate a report of inven-
tory data for North America for the previous 2 months for the specific SKUs in question.
He sees that there has been a steady stream of shipments from the warehouses to the stores, but also that
a stoppage in warehouse replenishment has caused a depletion of inventory in the warehouses. He con-
cludes that the problem lies somewhere further back in the supply chain. Next, he drills down from the
inventory report to a shipping report that indicates all seaborne shipments from Taiwan have been
delayed, affecting the SKUs in question, as well as some other SKUs. He determines that the other SKUs
likewise will soon experience a shortfall in sales.
He informs the VP of Sales and all store managers of the results of his analysis, and sends the reports to
the marketing department to determine the significance of the shipment delays on the company’s revenue
and profits for the quarter.
BI Style 4: Statistics and Data MiningStatistics & Data Mining is the Style of BI used to uncover subtle relationships (e.g. price elasticity) and
forecast projections (e.g. sales trends), using set theory techniques, statistical treatment and other advanced
mathematical functions.
In our scenario, an analyst in the marketing department builds a model of the product line’s revenue and
gross margins for the quarter as a function of shipment times, pricing and demand. After estimating the
financial impact of the delayed shipments, the analyst recommends raising the price on the remaining
items in stock to help cover the lost margins. She also recommends some new promotional spending to
substitute alternative hard drives through a combination of in-store marketing and advertising.
BI Style 5: Report Delivery & AlertingA Report Delivery and Alerting engine allows enterprises to distribute vast numbers of reports or mes-
sages on a proactive and centralized basis, as well as allowing users to self-subscribe to report distributions.

13THE 5 STYLES OF BUSINESS INTELLIGENCE:
Industrial-Strength Business Intelligence
Report distribution can be initiated on a scheduled basis, as well as on an event-triggered basis, such as a
metric’s value falling below a target threshold.
In our scenario, a task force continuously monitors the progress of new sales programs by subscribing to
a distribution service that continuously measures sales performance of relevant SKUs, their margin per-
formance and the costs for the new promotions. The service also continuously monitors the inventory lev-
els in the warehouses and alerts all stakeholders as soon as the shipment delays are over, signaling that pric-
ing and promotion should return to normal. Together, the team is able to make intelligent decisions,
respond quickly to changing events, and preserve the company’s exceptional level of performance.
2.2 Industrial-Strength BI Technology Is Needed To Meet Companies’Growing Requirements for Business Intelligence
BI Tools Have Proliferated Out of Control within CompaniesToday, most large companies have over a dozen different BI technologies installed and in use somewhere
in their organizations. There are two reasons for this gross proliferation of diverse technologies. The first
is because the vast majority of BI tools only support a single Style of BI at a time. If a company needed
Ad Hoc Query and Analysis capabilities as well as Enterprise Reporting capabilities, then at least two tools
would have been purchased. The second reason is because the vast majority of BI technology was
designed in such a way that it could only support small department-scale applications. As a result, BI
Scorecards & Enterprise Reports
Cube Analysis
Ad Hoc Analysis(Drill Anywhere)
Statistics & Data Mining
Report Delivery & Alerting
DataWarehouse
DataMart
OperationalDatabase
EventBased
ScheduleBased
ThresholdBased
Σ{Rank}
Figure 2 – Only the MicroStrategy architecture allows users to move seamlessly from basic operational reports and score-cards, to ever increasing levels of analysis and back again – all through a single unified user interface.

applications were deployed in isolation and ultimately individual departments felt empowered to choose
whatever BI technology they wanted.
Departmental BI Technology Will Be Replaced by Industrial-Strength BI TechnologyMost BI technology vendors reacted to this purchasing behavior by developing departmental BI products
– that is, BI technology focused on a single Style of BI, with limited user scalability, limited data scalabil-
ity and operational characteristics more attuned to casual small-scale operation, rather than the 24x7 mis-
sion critical operation expected of real enterprise-caliber systems. (Fig. 3)
The end result of departmental BI tool limitations and departmental BI purchasing has been the massive
proliferation of islands of BI that we see today. We’ve seen this kind of proliferation of isolated IT islands
before. We saw it with departmental email systems, with departmental PC/Macintosh purchases, with
departmental client-server applications, with departmental office automation systems and with depart-
mental web sites. In all of these prior cases, the departmental aspirations gave way to enterprise aspira-
tions, and the departmental technology gave way to industrial-strength technology. The same will be true
of BI. In technology-forward companies, departmental BI tools are giving way to the only industrial-
strength BI platform – MicroStrategy is the only BI architecture that delivers all 5 Styles of BI.
The Problem with Multiple BI Tools for Different Styles of BIThere are five macro forces that are obsolescing the “strategy” of isolated departmental islands of BI and
the use of disparate departmental BI tools.
Problem 1.
Enterprise BI Applications Need to Access More Data and Support More Users –
Departmental BI Lacks User and Data Scalability. Most companies have captured the low-hanging
CHAPTER 2
The 5 Styles of Business Intelligence
14
DEPARTMENTAL BI ENTERPRISE BI
BI Tool SuitesBusiness Objects, Cognos, Crystal, Actuate
BI PlatformMicroStrategy
Industrial-StrengthBusiness Intelligence
All 5 Styles of BI
User Scale
Data Scale
Enterprise-caliber IT
1 2 3 4 5 Single Style BI Application
100s Users
10s GB
Departmental-Caliber IT
1,000s Users
100s GB
24 x 7 OperationsMaintainable at Scale
All 5 Styles, Single Platform,Single Interface
1 2 3 4 5
MicroStrategy 7i
Figure 3 – Only the MicroStrategy architecture was completely rebuilt as an industrial-strength BI architecture designed specifically to serve enterpriseBI requirements.

ROI fruit with their current array of depart-
mental BI applications. Based on the almost
universal success of these applications, compa-
nies are now emboldened to take it to the next
level. And that means delivering much richer
reports and analysis, from much larger pools of
data and delivered to many more users.
Unfortunately, departmental BI tools today
cannot scale to these new levels (Fig. 4). The
very nature of their underlying architecture
prohibits them from analyzing terabytes of
data and delivering to expanding user bases.
Companies need an industrial-strength BI plat-
form designed for scale to replace departmen-
tal BI tools designed solely for interface functionality. MicroStrategy is the only server-centric BI architec-
ture that can analyze terabytes of data and support hundreds of thousands of users easily.
Problem 2.
Inconsistent Versions of the Truth Are Propagating Through the Enterprise – Multiple
Islands of BI Result In Multiple Inconsistent Metadata Repositories. Multiple independent
islands of departmental BI applications work fine when the number of applications is small. When there
are few applications, there is little overlap in analytical or reporting domains; inconsistencies in data defi-
nitions, in metric usage and business model are not readily evident. However when the number of BI
applications achieves a certain critical mass within the enterprise, there is an inevitable overlap in analyt-
ical and reporting domains. It becomes inevitable that multiple reports from multiple independent BI
applications present inconsistent information, preventing a consistent version of the truth. As the num-
ber of applications increases, these inconsistencies undermine the integrity of all the BI applications.
Companies need a BI technology that is built on one central, unified metadata that ensures consistency
across hundreds of BI applications and the thousands of metrics, attributes and filters that make them up.
Only the MicroStrategy architecture can deliver a single metadata across all 5 Styles of BI.
Problem 3.
Users Are Increasingly Dissatisfied About Being Forced to Use Multiple BI Tools – Multiple
User Interfaces Are Problematic. When the number of BI applications is few, any given person only
uses one of those applications, and hence only uses the one BI technology associated with that applica-
tion. As the number of BI applications increases, more and more people will be accessing multiple BI
applications, and hence using multiple different BI user interfaces to view reports and manipulate those
reports. This means that BI users need to learn different ways to do everything, including such common
15THE 5 STYLES OF BUSINESS INTELLIGENCE:
Industrial-Strength Business Intelligence
MICROSTRATEGYEnterprise BI
Lowe's
Discover
GM
Hudson's Bay
Best Buy
Lexmark
AstraZeneca
British TelcomDepartmental BI
Dat
a Vo
lum
e
250 Users User Population
Figure 4 – Companies are refocusing their aspirations from departmental BIapplications in favor of achieving greater impact with enterprise BI applications.
actions as finding reports, running reports, scheduling reports, editing reports, saving reports, sharing
reports, answering prompts, sorting the data and pivoting the data. With two different tools, users will face
challenges. With three different tools, users will be reluctant or unable to use the multiple applications.
With four or five different tools, this becomes a valid reason for user rebellion. Nonetheless, this is the sit-
uation in which most companies are now finding themselves. With the MicroStrategy architecture, all
Styles of BI use the same user interface with consistent paradigms for all user actions. There is no addi-
tional user training required as people expand their horizons to use more and more Styles of BI.
Problem 4.
Enterprise BI Applications Require a Richer User Experience Encompassing Multiple Styles
of Business Intelligence – Single-purpose BI Tools Are Unable to Mix-and-Match Styles of BI.
Most departmental BI applications employ a single Style of BI. Enterprise Reporting applications are
focused on the distribution of static, data-packed reports. Cube-based BI applications are focused on
OLAP slicing-and-dicing of small data sets as with Cube Analysis. Other applications provide free form
analysis of the entire database as with Ad Hoc Reporting and Analysis. However, the scenario described
in this chapter shows that there is really a natural user flow starting with information presentation, to prob-
lem isolation, to full investigation, to advanced analysis, to proactive tracking and alerting.
Technical boundaries that isolate the Styles of BI are purely artifacts of single purpose Style of BI soft-
ware technology, and have nothing to do with user preferences or natural application boundaries. Only
the MicroStrategy BI architecture allows companies to deploy any or all Styles of BI – exactly what they
need, efficiently when they need it and precisely to the appropriate users.
Problem 5.
IT Organizations Cannot Afford the Excessive Cost of Managing Multiple BI Technologies
–Disparate BI Technologies for Multiple BI Applications Are Burdensome. Finally, IT organi-
zations suffer excessive redundant costs in managing many diverse BI technologies. With multiple BI tools,
companies need to train people in the development and operational intricacies of each BI technology.
Companies must establish technical support teams to specialize in each capability. Companies must man-
age contracts with each BI vendor. Companies must go to conferences, user groups and support forums
for each BI vendor. Companies must coordinate new version upgrades with their versions of database
software, server operating systems, workstation operating systems, browsers, web servers and firewalls.
Companies must manually synchronize metadata overlaps between multiple BI technologies – such as
security, business definitions, metric definitions and user profiles.
Only with a single BI architecture can a company avoid all of these redundant costs and efforts. Only the
MicroStrategy architecture can deliver all 5 Styles of BI with the enterprise scale of data and user popu-
lations, in turn freeing up time, effort and money.
The Ideal Architecture for Delivering All 5 Styles of BIThe ideal architecture for delivering all 5 Styles of BI is one that can deliver:
CHAPTER 2
The 5 Styles of Business Intelligence
16

1. Any or all Styles of BI which can be mixed-and-matched seamlessly for the end users,
where the addition of each new BI Style adds functionality to the users’ existing reports
2. All expressed through a single unified user interface to maximize ease of use and user acceptance
3. All delivered on top of a single integrated backplane that unifies the metadata, security and
user profiles, ensuring a single version of the truth throughout the enterprise and thus minimizing
administration and maintenance efforts by IT
The MicroStrategy architecture was completely rebuilt from the ground up from 1996 through 2000 to
achieve precisely this range of flexibility, along with unparalleled scalability – all the things that compa-
nies need for industrial-strength BI.
Other BI vendors may appear to offer integrated products because they are bundled under common
names and marketing umbrellas. These product collections are cleverly marketed as integrated suites,
which mislead organizations into believing that they are implementing a single architecture. Only later do
the companies learn that they have purchased a set of disjointed tools of mainly piecemeal acquisitions,
which are in fact just “integrated” through a patchwork of bridges, gateways and portals.
The MicroStrategy architecture stands alone in the BI market space as the one integrated architecture,
built from the ground up to deliver all 5 Styles of BI with the level of scalability and manageability suit-
able for enterprise BI applications and capabilities.
17THE 5 STYLES OF BUSINESS INTELLIGENCE:
Industrial-Strength Business Intelligence
THE MICROSTRATEGY INDUSTRIAL-STRENGTH BI PLATFORM
MicroStrategy Intelligence ServerMicroStrategyOLAP Services
MicroStrategyReport Services
MicroStrategyNarrowcast Server
RelationalOLAP
AnalyticalEngine
Email / Printers /File Servers
Pixel-PerfectReporting
IntelligentCubes
Ente
rpri
seR
epo
rtin
g
Cu
be
An
alys
is
Stat
isti
cs &
Dat
a M
inin
g
Rep
ort
Del
iver
y&
Ale
rtin
g
Ad
Ho
c Q
uer
y&
An
alys
is
Integrated Backplane
Scalable Server-Centric Architecture
U N I F I E D W E B I N T E R F A C E
U N I F I E D M E T A D A T A A N D S E C U R I T Y
Unified User Interface• No disorientation caused by multiple UIs
• Only one BI paradigm for users to learn
Unified 5 Styles of BI• BI applications can exhibit any or all styles of BI
• All applications behave the same way
Unified Services Backplane• Common Metadata
• Common Security
• Common Prompting
• Common Scheduling
• Common Privilege Control
• Common Administration
• Common Governing
Figure 5 – The MicroStrategy architecture delivers any or all Styles of BI through a unified user interface and leverages an integrated backplane of uni-fied services.

Enterprise Reporting is designed for information consumers; individuals at all organizational levels and
across all job functions in the enterprise and also include supply chain partners and even customers.
Enterprise Reporting, in essence, provides business intelligence to the masses. As a result, it is the most
prevalent Style of BI, encompassing a vast array of operational reporting directly from ERP and CRM
systems, as well as scorecards and dashboards of overall business performance.
The single most dominant characteristic of any Enterprise Reporting system is its ability to produce high-
ly flexible report formats, so that data can be presented in whatever form is most consumable to a wide
range of information consumers. These individuals get their reports by accessing them on-demand
through their Web browsers (web-based reporting), as well as by receiving distributions that are pushed to
them via email or print delivery.
Beyond the baseline Enterprise Reporting characteristics listed above, what truly differentiates Enterprise
Reporting technologies revolve around the following four key areas:
1. Support For All Forms of Enterprise Reports – From scorecards and dashboards at one
extreme, all the way to operational reports at the other extreme, and the many variations in between.
2. User-defined Web Reporting – Making enterprise reports more compelling, personalized and
relevant for each individual.
3. High Throughput Report Production and Distribution – Reaching all users through the
touchpoints of their choice and making reporting ubiquitous and convenient throughout the
enterprise.
4. Pixel-perfect and Print-perfect Design Without Any Programming – Making desktop
publishing quality reports available without any programming.
The remainder of this chapter discusses each of these areas in detail.
19
3ENTERPRISE REPORTING
3.1 Support For All Forms of Enterprise Reports
Report writing products typically either can deliver operational reports well or can deliver scorecards and
dashboards well – but not both. MicroStrategy’s advanced architecture is designed to deliver both oper-
ational reports and scorecards and dashboards easily from a single platform. In fact, MicroStrategy allows
users easily to develop the five common forms of enterprise reports that range from highly graphical
Scorecards and Dashboards for executives to densely populated tabular Operational Reports for all per-
sonnel. In between these extremes are Classic Business Reports for business unit managers, Managed
Metrics reports for business unit leaders and Invoices and Statements for customers and partners.
Delivering The Five Common Forms of Enterprise Reports – Ranging from Scorecards andDashboards to Operational Reports
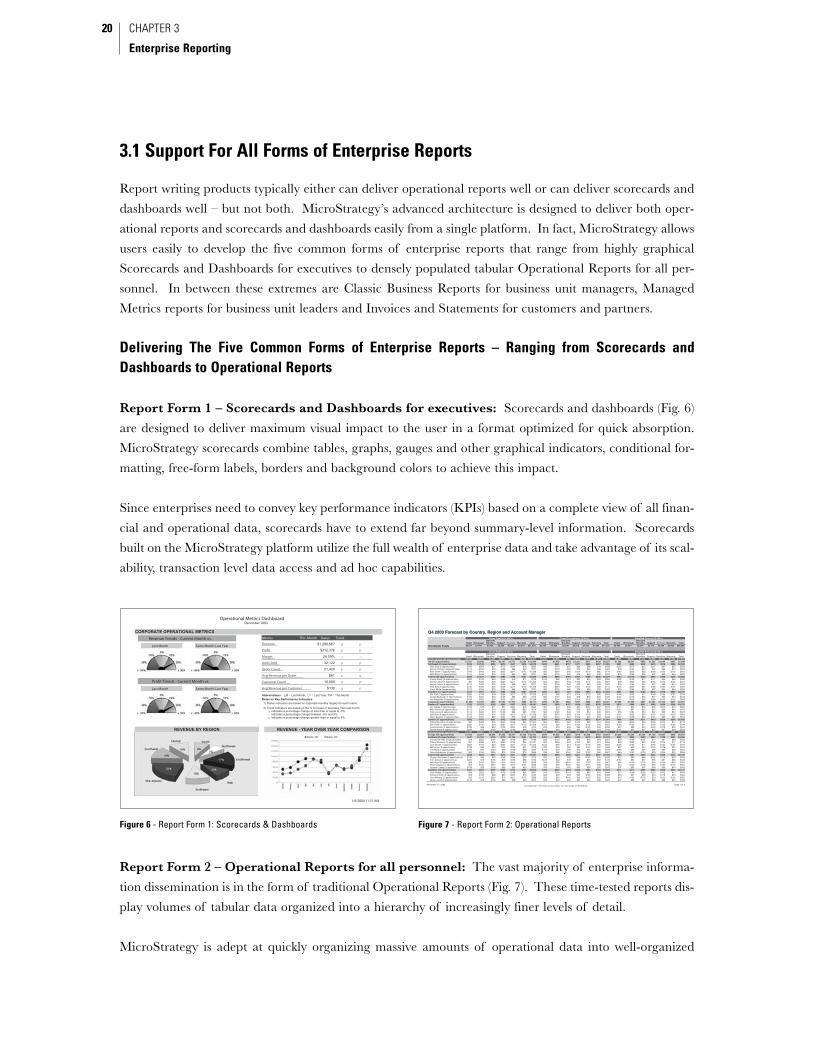
Report Form 1 – Scorecards and Dashboards for executives: Scorecards and dashboards (Fig. 6)
are designed to deliver maximum visual impact to the user in a format optimized for quick absorption.
MicroStrategy scorecards combine tables, graphs, gauges and other graphical indicators, conditional for-
matting, free-form labels, borders and background colors to achieve this impact.
Since enterprises need to convey key performance indicators (KPIs) based on a complete view of all finan-
cial and operational data, scorecards have to extend far beyond summary-level information. Scorecards
built on the MicroStrategy platform utilize the full wealth of enterprise data and take advantage of its scal-
ability, transaction level data access and ad hoc capabilities.
Report Form 2 – Operational Reports for all personnel: The vast majority of enterprise informa-
tion dissemination is in the form of traditional Operational Reports (Fig. 7). These time-tested reports dis-
play volumes of tabular data organized into a hierarchy of increasingly finer levels of detail.
MicroStrategy is adept at quickly organizing massive amounts of operational data into well-organized
CHAPTER 3
Enterprise Reporting
20
Figure 6 - Report Form 1: Scorecards & Dashboards
Gross Pipeline ($ 000's) Closed Transactions ($ 000's) Weighted Forecast ($ 000's)
Retail WholesaleDiscount Bundles Support Warranty Total Retail Wholesale
Discount Bundles Support Services Warranty Total Retail Wholesale
Discount Bundles Support Warranty Total
Worldwide Totals $4,917 $7,796 $3,702 $5,306 $6,263 $3,570 $31,554 $2,704 $4,288 $2,036 $2,918 $3,445 $1,964 $17,355 $3,442 $5,457 $2,591 $3,714 $4,384 $2,499 $22,088
Gross Pipeline ($ 000's) Closed Transactions ($ 000's) Weighted Forecast ($ 000's)
Q4 2003 Forecast by Country, Region and Account ManagerQ4 2003 Forecast by Country, Region and Account Manager
Retail WholesaleDiscount Bundles Support Warranty Total Retail Wholesale
Discount Bundles Support Services Warranty Total Retail Wholesale
Discount Bundles Support Warranty Total
North America (99 opportunities) $3,149 $5,515 $1,448 $3,651 $3,482 $2,206 $19,451 $1,732 $3,033 $796 $2,008 $1,915 $1,213 $10,698 $2,204 $3,861 $1,014 $2,556 $2,437 $1,544 $13,616US (55 opportunities) $1,721 $3,582 $789 $2,147 $1,777 $1,324 $11,340 $947 $1,970 $434 $1,181 $977 $728 $6,237 $1,205 $2,507 $552 $1,503 $1,244 $927 $7,938Northeast (20 opportunities) $516 $1,184 $285 $674 $537 $376 $3,572 $284 $651 $157 $371 $295 $207 $1,965 $361 $829 $200 $472 $376 $263 $2,500
Alec Berg (6 opportunities) $146 $254 $57 $173 $124 $78 $832 $80 $140 $31 $95 $68 $43 $458 $102 $178 $40 $121 $87 $55 $582Bonnie Zastrow (4opportunities) $112 $234 $76 $138 $98 $63 $721 $62 $129 $42 $76 $54 $35 $397 $78 $164 $53 $97 $69 $44 $505Alex Smith (7 opportunities) $146 $462 $76 $225 $217 $172 $1,298 $80 $254 $42 $124 $119 $95 $714 $102 $323 $53 $158 $152 $120 $909Beth Brown (3 opportunities) $112 $234 $76 $138 $98 $63 $721 $62 $129 $42 $76 $54 $35 $397 $78 $164 $53 $97 $69 $44 $505
Central (24 opportunities) $690 $1,537 $328 $885 $708 $541 $4,689 $380 $845 $180 $487 $389 $298 $2,579 $483 $1,076 $230 $620 $496 $379 $3,282Carole Alaniz (2 opportunities) $223 $145 $24 $159 $78 $71 $700 $123 $80 $13 $87 $43 $39 $385 $156 $102 $17 $111 $55 $50 $490Danny Leavitt (6 opportunities) $97 $462 $76 $225 $217 $172 $1,249 $53 $254 $42 $124 $119 $95 $687 $68 $323 $53 $158 $152 $120 $874Bonnie Jones (3 opportunities) $112 $234 $76 $138 $98 $63 $721 $62 $129 $42 $76 $54 $35 $397 $78 $164 $53 $97 $69 $44 $505Alex Burk (5 opportunities) $146 $462 $76 $225 $217 $172 $1,298 $80 $254 $42 $124 $119 $95 $714 $102 $323 $53 $158 $152 $120 $909Carol White (8opportunities) $112 $234 $76 $138 $98 $63 $721 $62 $129 $42 $76 $54 $35 $397 $78 $164 $53 $97 $69 $44 $505
Southern (11 opportunities) $515 $861 $176 $588 $532 $407 $3,079 $283 $474 $97 $323 $293 $224 $1,693 $361 $603 $123 $412 $372 $285 $2,155Erin Dull (3 opportunities) $223 $145 $24 $225 $217 $172 $1,006 $123 $80 $13 $124 $119 $95 $553 $156 $102 $17 $158 $152 $120 $704Gerald Blubaugh (2 opportunities) $146 $254 $76 $138 $98 $63 $775 $80 $140 $42 $76 $54 $35 $426 $102 $178 $53 $97 $69 $44 $543Jim Alexander (6 opportunities) $146 $462 $76 $225 $217 $172 $1,298 $80 $254 $42 $124 $119 $95 $714 $102 $323 $53 $158 $152 $120 $909
Canada (44 opportunities) $1,428 $1,933 $659 $1,504 $1,705 $882 $8,111 $785 $1,063 $362 $827 $938 $485 $4,461 $1,000 $1,353 $461 $1,053 $1,194 $617 $5,678Quebec (27 opportunities) $736 $1,152 $358 $832 $951 $512 $4,541 $405 $634 $197 $458 $523 $282 $2,498 $515 $806 $251 $582 $666 $358 $3,179
Jori Oakes (5 opportunities) $159 $78 $71 $97 $462 $76 $943 $87 $43 $39 $53 $254 $42 $519 $111 $55 $50 $68 $323 $53 $660Miko Kemna (6 opportunities) $173 $124 $78 $138 $98 $63 $674 $95 $68 $43 $76 $54 $35 $371 $121 $87 $55 $97 $69 $44 $472Sally Jones (9 opportunities) $112 $234 $76 $138 $98 $63 $721 $62 $129 $42 $76 $54 $35 $397 $78 $164 $53 $97 $69 $44 $505Bob Burk (5 opportunities) $146 $462 $76 $225 $217 $172 $1,298 $80 $254 $42 $124 $119 $95 $714 $102 $323 $53 $158 $152 $120 $909Steve Beason (2 opportunities) $146 $254 $57 $234 $76 $138 $905 $80 $140 $31 $129 $42 $76 $498 $102 $178 $40 $164 $53 $97 $634
Ontario (17 opportunities) $692 $781 $301 $672 $754 $370 $3,570 $381 $430 $166 $370 $415 $204 $1,964 $484 $547 $211 $470 $528 $259 $2,499Palmer Buzzerio (3 opportunities) $97 $462 $76 $223 $145 $24 $1,027 $53 $254 $42 $123 $80 $13 $565 $68 $323 $53 $156 $102 $17 $719Erin Smith (7 opportunities) $223 $145 $24 $225 $217 $172 $1,006 $123 $80 $13 $124 $119 $95 $553 $156 $102 $17 $158 $152 $120 $704Anany Harlan (4 opportunities) $138 $98 $63 $146 $254 $76 $775 $76 $54 $35 $80 $140 $42 $426 $97 $69 $44 $102 $178 $53 $543Benoit Ward (3 opportunities) $234 $76 $138 $78 $138 $98 $762 $129 $42 $76 $43 $76 $54 $419 $164 $53 $97 $55 $97 $69 $533
International (55 opportunities) $1,768 $2,281 $2,254 $1,655 $2,781 $1,364 $12,103 $972 $1,255 $1,240 $910 $1,530 $750 $6,657 $1,238 $1,597 $1,578 $1,159 $1,947 $955 $8,472Europe (55 opportunities) $1,768 $2,281 $2,254 $1,655 $2,781 $1,364 $12,103 $972 $1,255 $1,240 $910 $1,530 $750 $6,657 $1,238 $1,597 $1,578 $1,159 $1,947 $955 $8,472Northern (25 opportunities) $831 $1,150 $700 $772 $1,126 $544 $5,123 $457 $633 $385 $425 $619 $299 $2,818 $582 $805 $490 $540 $788 $381 $3,586
Constance Imes (2 opportunities) $76 $223 $145 $24 $138 $98 $704 $42 $123 $80 $13 $76 $54 $387 $53 $156 $102 $17 $97 $69 $493Palmer Buzzerio (3 opportunities) $97 $462 $76 $223 $145 $24 $1,027 $53 $254 $42 $123 $80 $13 $565 $68 $323 $53 $156 $102 $17 $719Jane Brown (7 opportunities) $223 $145 $24 $225 $217 $172 $1,006 $123 $80 $13 $124 $119 $95 $553 $156 $102 $17 $158 $152 $120 $704Will Jones (3 opportunities) $138 $98 $63 $146 $254 $76 $775 $76 $54 $35 $80 $140 $42 $426 $97 $69 $44 $102 $178 $53 $543Tim Ward (4 opportunities) $234 $76 $138 $78 $138 $98 $762 $129 $42 $76 $43 $76 $54 $419 $164 $53 $97 $55 $97 $69 $533Dome Bachmeier (6 opportunities) $63 $146 $254 $76 $234 $76 $849 $35 $80 $140 $42 $129 $42 $467 $44 $102 $178 $53 $164 $53 $594
Central (20 opportunities) $636 $544 $847 $474 $941 $485 $3,927 $350 $299 $466 $261 $518 $267 $2,160 $445 $381 $593 $332 $659 $340 $2,749Sharon Alexander (5 opportunities) $138 $98 $63 $146 $254 $76 $775 $76 $54 $35 $80 $140 $42 $426 $97 $69 $44 $102 $178 $53 $543Tom Oakes (4 opportunities) $234 $76 $138 $78 $138 $98 $762 $129 $42 $76 $43 $76 $54 $419 $164 $53 $97 $55 $97 $69 $533Bob Ward (6 opportunities) $63 $146 $254 $76 $234 $76 $849 $35 $80 $140 $42 $129 $42 $467 $44 $102 $178 $53 $164 $53 $594Enzo Kellaway (2 opportunities) $63 $146 $254 $76 $217 $172 $928 $35 $80 $140 $42 $119 $95 $510 $44 $102 $178 $53 $152 $120 $650Gordon Cutting (3 opportunities) $138 $78 $138 $98 $98 $63 $613 $76 $43 $76 $54 $54 $35 $337 $97 $55 $97 $69 $69 $44 $429
Southern (10 opportunities) $301 $587 $707 $409 $714 $335 $3,053 $166 $323 $389 $225 $393 $184 $1,679 $211 $411 $495 $286 $500 $235 $2,137Josh Hadley (1 opportunities) $24 $225 $217 $172 $145 $24 $807 $13 $124 $119 $95 $80 $13 $444 $17 $158 $152 $120 $102 $17 $565Anthony Smith (3 opportunities) $76 $138 $98 $63 $254 $76 $705 $42 $76 $54 $35 $140 $42 $388 $53 $97 $69 $44 $178 $53 $494Curt Anthony (2 opportunities) $63 $146 $254 $76 $217 $172 $928 $35 $80 $140 $42 $119 $95 $510 $44 $102 $178 $53 $152 $120 $650Greg Leavitt (4 opportunities) $138 $78 $138 $98 $98 $63 $613 $76 $43 $76 $54 $54 $35 $337 $97 $55 $97 $69 $69 $44 $429
Confidential - For Internal Use Only - Do Not Copy or DistributeNovember 17, 2003 Page 1 of 3
ServicesServices
ServicesServices
Figure 7 - Report Form 2: Operational Reports

repeating sections that might span many pages. Each page can include labels, headers and footers and
page break logic that are the hallmarks of an effective operational reporting system.
Report Form 3 – Classic Business Reports for business managers: MicroStrategy’s free-form
layout may be used to create popular business reports, such as P&L reports, performance reports and
statutory reports. These reports are usually optimized for on-screen viewing and allow the user to drill to
deeper details and related reports. Classic Business Reports (Fig. 8) easily combine tables, graphs and free-
form field layout to create unique presentations of summary and detailed data.
Report Form 4 – Managed Metrics Reports for business unit leaders: The drive to manage busi-
ness “by the numbers” and deliver predictable results has lead to a renewed interest in Corporate
Performance Management, or CPM. The cornerstone of CPM is the Managed Metrics Report (Fig. 9),
which allows managers to track continually the status of business performance, including actual-to-
planned comparisons, time series projections and process flow analyses.
With MicroStrategy, this is achieved using thresholds and
graphical indicators to show attainment of performance
goals, trends over time and status checks to manage to the
metrics or targets. By incorporating predictive analysis
native to the MicroStrategy platform, these reports can also
display correlations and projections to help anticipate future
business performance.
Report Form 5 – Invoices and Statements for customers
and partners: Invoices and Statements (Fig. 10) contain
detailed transactional data and summarized information for any
number of customers and partners. This enterprise report form
is designed with page layout precisely defined and report elements
precisely formatted and positioned to ensure proper printing
across multiple sheets and with pre-printed corporate stationery.
21THE 5 STYLES OF BUSINESS INTELLIGENCE:
Industrial-Strength Business Intelligence
Page 1 of 111/5/2003 3:39:17 PM
Shipping Timeliness Analysis The Shipping Timeliness report focuses on the effectiveness of the Distribution Centers infulfilling orders. Weeks to Ship represents the number of seven day intervals (0-6, 7-13,14-20, 21-27, and 28+) between an Order's Order Date and Ship Date.Confidential - For Internal Use Only
27,775 $2,334,864Northeast Total Orders = Total Revenue =
15,545 $1,325,448Boston Total Revenue =Total Orders =
Weeks to
Ship
Order
Count
Revenue Pct
Running
Total DC
0
1
2
3
4
4,126 $350,212 27%
3,754 $341,155 51%
3,532 $297,582 73%
3,639 $295,483 97%
494 $41,016 100%
Weeks to Ship Number ofOrders
Order Totals inDollars
Percent ofOrders Shipped
Percent of Orders Shipped By Weeks to ShipOrder Fulfilment by Weeks to Ship
12,230 $1,009,416New York Total Revenue =Total Orders =
Weeks to
Ship
Order
Count
Revenue Pct
Running
Total DC
0
1
2
3
4
4,126 $350,212 27%
3,754 $341,155 51%
3,532 $297,582 73%
3,639 $295,483 97%
494 $41,016 100%
Weeks to Ship Number ofOrders
Order Totals inDollars
Percent ofOrders Shipped
Percent of Orders Shipped By Weeks to ShipOrder Fulfilment by Weeks to Ship
23,678 $2,016,186Southeast Total Orders = Total Revenue =
10,796 $933,170Miami Total Revenue =Total Orders =
Weeks to
Ship
Order
Count
Revenue Pct
Running
Total DC
0
1
2
3
4
4,126 $350,212 27%
3,754 $341,155 51%
3,532 $297,582 73%
3,639 $295,483 97%
494 $41,016 100%
Weeks to Ship Number ofOrders
Order Totals inDollars
Percent ofOrders Shipped
Percent of Orders Shipped By Weeks to ShipOrder Fulfilment by Weeks to Ship
Weeks to
Ship
Order
Count
Revenue Pct
Running
Total DC
0
1
2
3
4
4,126 $350,212 27%
3,754 $341,155 51%
3,532 $297,582 73%
3,639 $295,483 97%
494 $41,016 100%
Weeks to Ship Number ofOrders
Order Totals inDollars
Percent ofOrders Shipped
Weeks to
Ship
Order
Count
Revenue Pct
Running
Total DC
0
1
2
3
4
4,126 $350,212 27%
3,754 $341,155 51%
3,532 $297,582 73%
3,639 $295,483 97%
494 $41,016 100%
Weeks to Ship Number ofOrders
Order Totals inDollars
Percent ofOrders Shipped
Weeks to
Ship
Order
Count
Revenue Pct
Running
Total DC
0
1
2
3
4
4,126 $350,212 27%
3,754 $341,155 51%
3,532 $297,582 73%
3,639 $295,483 97%
494 $41,016 100%
Weeks to Ship Number ofOrders
Order Totals inDollars
Percent ofOrders Shipped
Figure 8 - Report Form 3: Classic Business Reports Figure 9 - Report Form 4: Managed Metrics Reports
Figure 10 - Report Form 5: Invoices & Statements

To generate Invoices and Statements, MicroStrategy uses the same exacting page layout techniques as
those used by desktop publishing packages.
Where other vendors require companies to purchase multiple different technologies, each targeted for a
different form of enterprise report, MicroStrategy can deliver all five common forms of enterprise reports,
all with uniform ease.
Uniquely Combining Zone-based Layout with Traditional Banded Report Layout Only MicroStrategy can deliver all five forms of enterprise reports by uniquely combining zone-based lay-
out with traditional banded report layout.
Banded Layout is the most familiar report layout technique today because it is the predominant vehicle
for operational reporting. It has been the cornerstone of all leading report writers for years. The reason
for the long-term popularity for Operational Reporting is because banded layout can very rapidly organ-
ize lots of data into a natural hierarchy of information that users can easily navigate.
The term “banded” refers to specific horizontal bands superimposed on the report layout screen that dic-
tate where data should be automatically summarized for page headers and footers, report headers and
footers, and within user-defined groupings or hierarchies that map to the business organization. For exam-
ple, a banded report is the natural structure for describing product sales, when that sales information needs
to be presented for every product, grouped by product category, and delineated for every store, within
every region, for every month in a time period. Grouping and summarizing techniques come automati-
cally with banded layouts.
Banded report layout is truly optimized for traditional operational reporting with its dense hierarchical
information presentation, multi-page repeating sections that cover entire ranges of enterprise operations,
and bias for fine printing optimization. MicroStrategy offers pure banded layout following the same visu-
al paradigms that are now well understood by and familiar to any person who has created enterprise
reports using any of the common report writing products available today.
Zone-based Layout, on the other hand, is optimized for the creation of Scorecards and Dashboards.
The term “zone” refers to the graphical building block technique that allows users to layout entire tables
and graphs onto a page or screen, where each of these tables or graphs has a presentation behavior of its
own. Zone-based layout is optimized for displaying graphical content (as opposed to tabular information).
Zone-based layout is further optimized for on-screen display, where users have scroll bars to move around
the report and desktop publishing quality printing is not a requirement.
MicroStrategy users can build Scorecards and Dashboards on the fly using simple drag-and-drop tech-
niques to insert multiple reports, graphs, text, hyperlinks, and images onto the report layout screen. These
objects may also be arranged anywhere in the layout and automatically adapt to the size and shape of their
content, moving other objects dynamically to fit.
CHAPTER 3
Enterprise Reporting
22

Zone-based Layout Within Traditional
Banded Reports.
One of the most important and unique aspects
of MicroStrategy’s Enterprise Reporting capa-
bilities is the ability to freely combine powerful
graphical zone-based objects within the power-
fully organized banded report structure (Fig. 11).
When zone-based objects, like full cross-tabu-
lar tables or graphs are dragged and dropped
within the grouping bands, the contents of
those grids and graphs automatically adopt the
level of aggregations dictated by the bands just
as individual field layout would in a strictly
banded report. This allows MicroStrategy
users to develop truly unique report layouts of
dynamic tables and graphs, interleaved and
organized by classic repeating banded sections
with very little effort and expertise.
3.2 User-defined Web Reporting
The goal of every Enterprise Reporting project is to inspire people to use information in their day-to-day
work activities. However, most projects fail to achieve this goal because the reports are not immediately
relevant to each recipient user – that is, a user must sift through reams of numbers to find just the few sec-
tions that directly relate to his or her area of responsibility. The other reason reporting efforts fail to
achieve their goals is because the Enterprise Reporting environment is not easily tuned to the diverse skills
of a wide population of users – that is, the user interface is either too simple and appeals only to the most
novice users, or it is too “feature-rich” and overpowers the novice users.
This is a very difficult technical challenge and most BI products fail miserably because they do not give
the people enough control over the report contents and their Enterprise Reporting environment, nor do
these products automatically tailor report content to fit the users interests and skill. MicroStrategy was
designed specifically to solve this problem through four personalization levers:
1. Parameterized Reporting
2. Automatically Customized Content
3. Personalized User Interface Based On User Profile
4. Multi-lingual Support
23THE 5 STYLES OF BUSINESS INTELLIGENCE:
Industrial-Strength Business Intelligence
OPTIMIZED FOR:
OPTIMIZED FOR:
Combing Zones within Bands
Delivering Greater Flexibility
than Either Layout Individualy
BandedLayout
• Scorecards &
Dashboards
• Graphical Content
• Multiple Tables
& Graphs
• On Screen Display
• Operational Reports
• Densely Populated Data
• Multi-Page Repeating Sections
• Print Production
Zone-based
Figure 11 - MicroStrategy combines Banded and Zone-based layout to deliverthe most flexible reporting environment
Parameterized Reporting – Letting the User Define the Report ContentsParameter-driven reports allow the user to answer a number of questions prior to running a report, and
those answers dictate what content will be displayed in the report. It allows a user to generate just the data
they are interested in seeing at that moment. For example, users may answer prompt questions such as
“Which product would you like to analyze,” and “Over what period of time,” and “In which geographi-
cal areas,” and “For which customers.” This is the basic idea behind parameterized reporting, and many
report writing products offer this basic level of user control. MicroStrategy has taken the basic idea of
parameterized reporting and user prompting – and elevated it to new levels of user control.
MicroStrategy revolutionized parameterized reporting by being the first technology to implement
advanced prompting based on a Prompt Engine. The MicroStrategy Prompt Engine lets users pick and
choose report content completely independent of the report design. This unique prompting capability
allows MicroStrategy users to create and use incredibly rich prompting functionality, and much more sim-
ply than users of any other BI software.
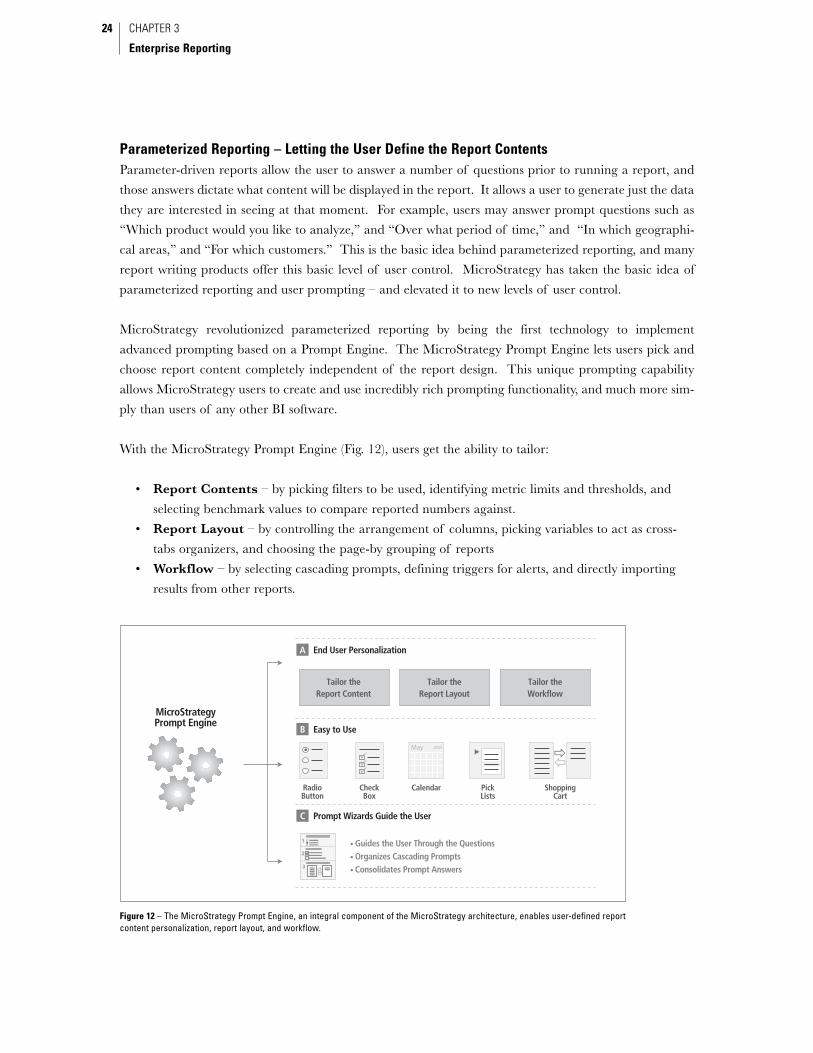
With the MicroStrategy Prompt Engine (Fig. 12), users get the ability to tailor:
• Report Contents – by picking filters to be used, identifying metric limits and thresholds, and
selecting benchmark values to compare reported numbers against.
• Report Layout – by controlling the arrangement of columns, picking variables to act as cross-
tabs organizers, and choosing the page-by grouping of reports
• Workflow – by selecting cascading prompts, defining triggers for alerts, and directly importing
results from other reports.
CHAPTER 3
Enterprise Reporting
24
MicroStrategyPrompt Engine
• Guides the User Through the Questions• Organizes Cascading Prompts• Consolidates Prompt Answers
A
B
C
End User Personalization
Easy to Use
Prompt Wizards Guide the User
May 2004
1
2
3
Tailor theReport Content
Tailor theReport Layout
Tailor theWorkflow
RadioButton
CheckBox
Calendar PickLists
ShoppingCart
Figure 12 – The MicroStrategy Prompt Engine, an integral component of the MicroStrategy architecture, enables user-defined reportcontent personalization, report layout, and workflow.
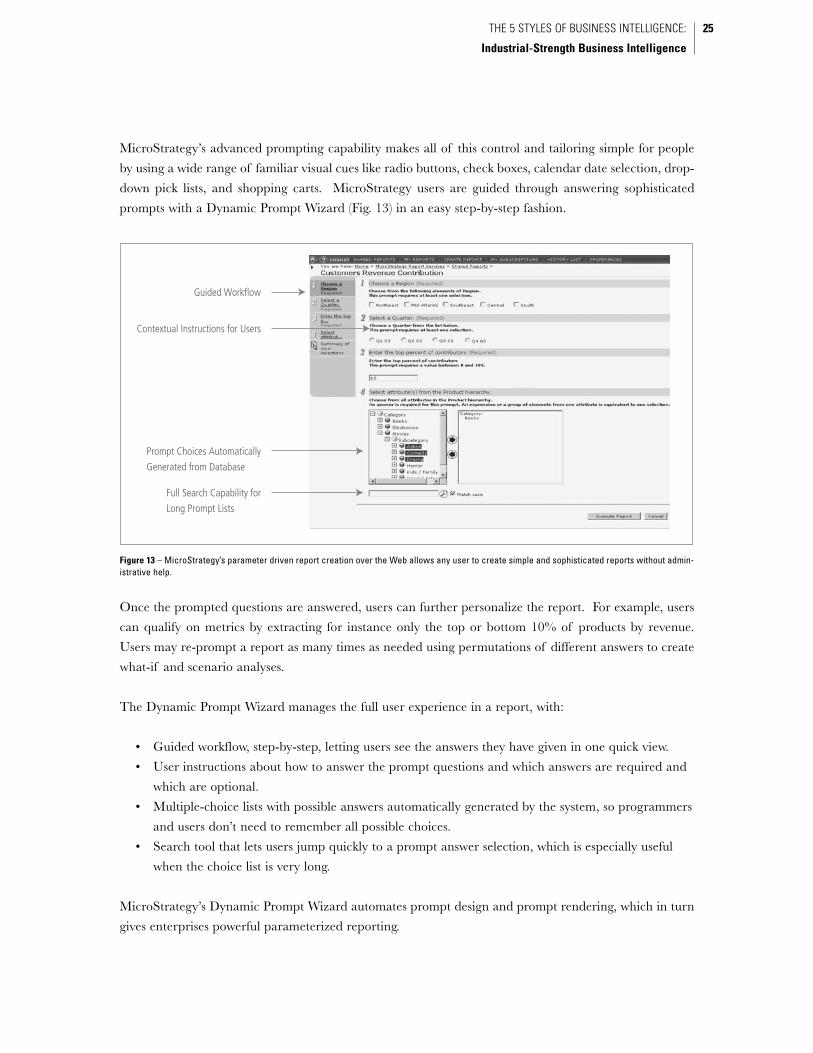
MicroStrategy’s advanced prompting capability makes all of this control and tailoring simple for people
by using a wide range of familiar visual cues like radio buttons, check boxes, calendar date selection, drop-
down pick lists, and shopping carts. MicroStrategy users are guided through answering sophisticated
prompts with a Dynamic Prompt Wizard (Fig. 13) in an easy step-by-step fashion.
Once the prompted questions are answered, users can further personalize the report. For example, users
can qualify on metrics by extracting for instance only the top or bottom 10% of products by revenue.
Users may re-prompt a report as many times as needed using permutations of different answers to create
what-if and scenario analyses.
The Dynamic Prompt Wizard manages the full user experience in a report, with:
• Guided workflow, step-by-step, letting users see the answers they have given in one quick view.
• User instructions about how to answer the prompt questions and which answers are required and
which are optional.
• Multiple-choice lists with possible answers automatically generated by the system, so programmers
and users don’t need to remember all possible choices.
• Search tool that lets users jump quickly to a prompt answer selection, which is especially useful
when the choice list is very long.
MicroStrategy’s Dynamic Prompt Wizard automates prompt design and prompt rendering, which in turn
gives enterprises powerful parameterized reporting.
25THE 5 STYLES OF BUSINESS INTELLIGENCE:
Industrial-Strength Business Intelligence
Guided Workflow
Contextual Instructions for Users
Prompt Choices Automatically
Generated from Database
Full Search Capability for
Long Prompt Lists
Figure 13 – MicroStrategy’s parameter driven report creation over the Web allows any user to create simple and sophisticated reports without admin-istrative help.

Automatically Customized Content – Allowing One Report to Serve The Needs Of Thousands OfUsers Automatically Through Role-based Content A common challenge in Enterprise Reporting is how to deliver similar information to very large popula-
tions of users economically, where each user needs to see a different slice of the data. The traditional solu-
tion is to provide each user with a custom-designed report. Clearly this is a nightmare for the report
designers because one small change needs to ripple through many renditions of the report.
With MicroStrategy, IT administrators only need to create one report that the system automatically
slices into the different views appropriate for each individual user. In addition, MicroStrategy content
slicing takes place along any number of business attributes based automatically on each user’s role and
group affiliations.
The MicroStrategy architecture automatically creates personalized variations of any report definition
based on the group affiliation and role of every report user (Fig. 14). With MicroStrategy, any report
can be sliced along many dimensions automatically to make the report content immediately relevant to
the recipient users.
CHAPTER 3
Enterprise Reporting
26
Transaction-Level Detail
Directorate
Department
Group
Content Sliced Along Organizational BoundariesOne
ReportDefinition
Division
Cont
ent S
liced
By
Aggr
egat
ion
Leve
l
GM
VP
Dir
Mgr
Staff Staff Staff Staff
Mgr Mgr Mgr Mgr Mgr Mgr Mgr
Dir Dir Dir
VP
Figure 14 - One MicroStrategy report can serve many users because MicroStrategy automatically slices the report based on each user’s role and groupaffiliations.

Personalized User Interface Based on User Profile – Matching User Interface FunctionalityLevel With User Skill Level Enterprises face a challenge when striking a balance between exposing rich functionality to power users,
while at the same time giving novice users a simple Enterprise Reporting environment that will not over-
power them.
MicroStrategy is designed to solve this problem elegantly through the user of user profiles. User profiles
automatically adjust the Web interface to accommodate users with different skill levels. User profiles deter-
mine exactly what functionality will be exposed to each user or user group (Fig. 15). So it’s easy in
MicroStrategy to give report designers a user profile with maximum functionality, while the report con-
sumers receive a user profile with just enough functionality to do their jobs easily.
MicroStrategy can support any number of finely tuned user profiles to accommodate the huge diversity of
real people in real organizations. What’s even more important is that as user skill levels increase, an IT
administrator can easily turn on more power for any given user in a centralized fashion with the simple
check of a box in the MicroStrategy platform.
27THE 5 STYLES OF BUSINESS INTELLIGENCE:
Industrial-Strength Business Intelligence
Report Developers
Power Users
Analysts
Info Explorers
Info ConsumersSK
ILL
LEVE
L
ROLE
-BA
SED
USE
R PR
OFI
LE D
EFIN
ITIO
NS
Figure 15 – MicroStrategy matches user profiles with user skill levels to expose functionality in an elegant fashion.

Multi-lingual SupportEnterprise Reporting must span the globe with reports personalized to the local languages in which they
are accessed. With MicroStrategy, users can access their Enterprise Reporting environment in twelve dif-
ferent languages out-of-the-box: American English, British English, Chinese (Traditional), Chinese
(Simplified), French, German, Italian, Japanese, Korean, Portuguese, Spanish, and Swedish.
MicroStrategy report translation includes all of the interface items like menu bars and online help. It also
includes character sets, currency formats, time and date formats, and even business attributes and metrics
in the report (Fig. 16).
3.3 High Throughput Report Production and Distribution
Information consumers are everywhere. They are in executive offices, in office cubicles, on warehouse
floors, at loading docks, at customer sites, at suppliers’ offices, and at customers’ homes. Effective
Enterprise Reporting systems must be able to reach all of these users, wherever they are and with suffi-
cient power to generate tens of thousands of reports per hour if needed.
The MicroStrategy architecture sets the standard for high volume, high flexibility report distribution.
MicroStrategy reports can be automatically distributed to the widest range of user touchpoints on the
market, including Web browsers, networked printers, email, networked file servers, and corporate portals
(Fig. 17).
CHAPTER 3
Enterprise Reporting
28
Online HelpInterface Items
Metrics
Attributes
Character Sets
Currency Format
Date & Time Formats
Number Formats
Figure 16 – MicroStrategy automatically translates reports into the appropriate language.

MicroStrategy reports can be delivered directly to any Web browser, both inside and outside the corporate
firewalls because MicroStrategy is the only vendor employing a true zero footprint Web architecture, which
requires no downloads, ActiveX, or cookies. MicroStrategy’s unified Web interface is proven efficient and
effective with user populations in excess of 100,000 individuals internal and external to the enterprise.
MicroStrategy reports can also be printed in a batch production mode. This is a mode where every indi-
vidual print job might be directed to a different networked printer that is associated with each recipient
user. And, the content will be automatically personalized to each recipient on his or her printer.
MicroStrategy reports can be delivered through any email system either:
• On-demand – where users immediately email the report to an individual or group.
• On-schedule – where users set up subscriptions to receive reports on a periodic basis, such as
every Monday morning.
• On-event – where event-driven email report alerts are sent to users based on metrics or KPIs
reaching certain threshold conditions within the database.
MicroStrategy can automatically distribute reports directly to networked file servers, creating new
archive folders for each new batch of reports. Additionally, MicroStrategy can automatically post reports
directly to corporate portals to allow one-stop shopping for all corporate information assets. Users can
access MicroStrategy reports directly from a Windows desktop or Web, providing the highest fidelity
design precision available.
29THE 5 STYLES OF BUSINESS INTELLIGENCE:
Industrial-Strength Business Intelligence
72,000 Reports / Hour
Web NetworkedPrinters
E-mail File Servers Portals WindowsDesktop
ZeroFootprint
PersonalizedPrint
On-Demand,On-Scheule,
On-Event
AutomaticArchiving
One-stopShopping withFull Security
PrecisionDesign
Figure 17 – MicroStrategy’s report distribution capabilities allow enterprises to reach every user through the touchpoint of his/her choice.

3.4 Pixel-perfect and Print-perfect Design Without Any Programming
Typical report writing products are optimized for either on-screen presentation or for print generation, but
not both. Moreover, many of these report writers require extensive programming to deliver all but the
most rudimentary reports.
Page Layout Paradigm Delivers Pixel-perfect and Print-perfect DesignsMicroStrategy is different. MicroStrategy can deliver pixel-perfect reports for on-screen presentation, as
well as print-perfect reports for physical distribution, letting users create desktop publishing quality docu-
ments for either media (Fig. 18). What’s even more important is that MicroStrategy users can do this with-
out the need for any programming or outside help – it is all drag-and-drop.
MicroStrategy uses a page layout paradigm as its design model (as opposed to the HTML layout paradigm
used by some report writing tools). Page layout is the same design paradigm employed by desktop pub-
lishing packages and used for the most demanding information publishing tasks. It is the only layout par-
adigm that gives the report designer full and absolute control over the placement and sizing of all objects,
whether users ultimately will be viewing on-screen or on paper.
Sophisticated Report Design Without Any ProgrammingMicroStrategy’s Report Design Screen (Fig. 19) presents default sections or bands that immediately help
users to layout document headers/footers, page headers/footers, summarization groupings, and all the
CHAPTER 3
Enterprise Reporting
30
Page-layout withMicroStrategy Report Services
Page LayoutParadigm
• Unrestricted Object Placement
• Absolute & Relative Object Sizing
• Absolute & Relative Object Positioning
= Pixel-perfect Over the Web
= Print-perfect at Your Printer
2.1234 in
2.34 in
0.54 in
5.9676 in
Figure 18 – MicroStrategy uses a page layout paradigm just like the desktop publishing packages. This guarantees the highest resolution for pixel-per-fect on-screen reports, as well as most exacting placement for print-perfect physical reports.
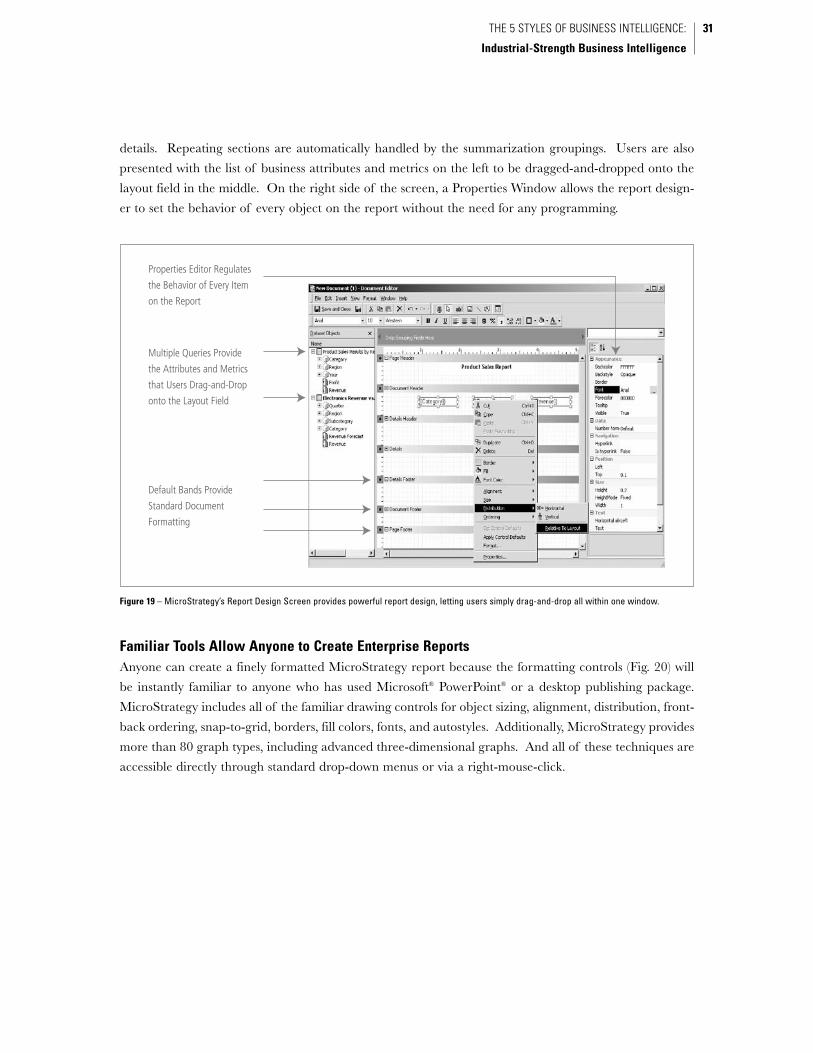
details. Repeating sections are automatically handled by the summarization groupings. Users are also
presented with the list of business attributes and metrics on the left to be dragged-and-dropped onto the
layout field in the middle. On the right side of the screen, a Properties Window allows the report design-
er to set the behavior of every object on the report without the need for any programming.
Familiar Tools Allow Anyone to Create Enterprise ReportsAnyone can create a finely formatted MicroStrategy report because the formatting controls (Fig. 20) will
be instantly familiar to anyone who has used Microsoft® PowerPoint® or a desktop publishing package.
MicroStrategy includes all of the familiar drawing controls for object sizing, alignment, distribution, front-
back ordering, snap-to-grid, borders, fill colors, fonts, and autostyles. Additionally, MicroStrategy provides
more than 80 graph types, including advanced three-dimensional graphs. And all of these techniques are
accessible directly through standard drop-down menus or via a right-mouse-click.
31THE 5 STYLES OF BUSINESS INTELLIGENCE:
Industrial-Strength Business Intelligence
Properties Editor Regulates
the Behavior of Every Item
on the Report
Multiple Queries Provide
the Attributes and Metrics
that Users Drag-and-Drop
onto the Layout Field
Default Bands Provide
Standard Document
Formatting
Figure 19 – MicroStrategy’s Report Design Screen provides powerful report design, letting users simply drag-and-drop all within one window.

3.5 Enterprise Reporting Summary
MicroStrategy’s Enterprise Reporting technology provides the most comprehensive and flexible reporting
capabilities available to deliver:
• Highly Compelling Reports – by combining traditional banded layouts with zone-based
layouts to produce the full range of common enterprise report forms – from scorecards and
dashboards to operational reports.
• Highly Consumable and Personal Reports – by catering to an individual’s needs in terms of
report content and user interface environment – through prompting, user profiles, role-based
content, and multi-lingual support.
• Pervasive and Convenient Reports for All People – making reporting ubiquitous through-
out the enterprise and externally by delivering reports to every user conveniently through all
touchpoints of their choice.
• Pixel-perfect and Print-perfect Reports – Simple-to-build using precision page layout tech-
niques and without the need for any programming.
All of these Enterprise Reporting capabilities are available within the MicroStrategy architecture, which
delivers all 5 Styles of BI, allowing users to move fluidly from scorecarding and basic operational report-
ing to ever increasing levels of analysis.
CHAPTER 3
Enterprise Reporting
32
Formatting Toolbar
Offers Borders, Font
Colors, Fill Colors, etc.
• Ruler
• Snap-to-Grid
• Front-Back Ordering
• Alignment
• Size
• Object Auto Spacing
Right Mouse Click
Presents Context-
Senstive Formatting
Options for Every Item
Figure 20 – MicroStrategy users are able to format reports intuitively. All of the formatting controls will be instantly familiar to all users ofMicrosoft PowerPoint, drawing programs and desktop publishing programs.

Cube Analysis delivers the simplest form of analysis, allowing anybody to analyze data. Cube Analysis is
used most often by people like managers who have a deep interest in understanding the root causes under-
lying the data in reports, but do not possess skills for full ad hoc investigation of the databases.
Cube Analysis lets people flip through a series of report views, using the now standard OLAP features of:
page-by, pivot, sort, filter, and drill up/down. These OLAP features, which were first introduced in the
early 1990s, allow users to slice-and-dice a cube of data, or analysis cube, using simple mouse-clicks. The
term “cube” refers to a subset of highly interrelated data that is pre-organized to allow users to combine
any attributes in the cube (e.g. stores, products, customers, suppliers) with any metrics in the cube (e.g.
sales, profit, units, age) to create various 2-dimensional views, or slices, that can be displayed on a com-
puter screen (Fig. 21).
35
4CUBE ANALYSIS
Business Unit
Ass
ets Time Inventory
Dis
trib
utor Supplier Product
Cust
omer Region
• Investment in Asset
as % Revenue
• Operating Cash by BU
• Working Capital LQ/TQ
• Actual vs. Plan
• Actual vs. Forecast
• Actual vs. Budget
• Holding Trends by Season
• Performance by Product
• Performance by Region
• Sales by Customer
• Return Trends by Store
Slice & Dice Views
Analysis Cubes
Figure 21 – OLAP features such as page-by, pivot, sort, filter, and drill, allow users to slice-and-dice domain-specific data subsets, and view the datafrom many different perspectives.

To implement Cube Analysis functionality, most OLAP vendors use custom-made proprietary cube data-
bases. This technique is known as Multidimensional OLAP or MOLAP. Unfortunately, the cube data-
bases have very small data capacities – less than 0.01% of real relational databases – because they don’t
have the technical underpinnings of real relational databases. Nonetheless, this capacity limitation was
not initially perceived as a problem because most early departmental BI applications only needed between
10MB and 100MB of detailed and summary data. Problems due to limited cube data capacities began
occurring when companies found they needed to deploy hundreds of overlapping cube databases to cover
all the combinations of data subsets, summarization levels, and security privileges for different user groups
across multiple applications. These ever-growing collections of cubes have become known as “cube
farms.” Cube farms create an immense burden on the IT groups that have to generate the cubes, pre-cal-
culate the summarizations, distribute them to users, and retire them when their data become outdated.
By contrast, MicroStrategy implemented its OLAP functionality by modeling the relational database as a
“virtual multidimensional cube” with a technique known as Relational OLAP or ROLAP. MicroStrategy
users have the same OLAP functionality of page-by, pivot, sort, filter, and drill, but can do so against the
entire relational database. With ROLAP, the data is always the very latest data – there is no limitation of
what data can be analyzed, and all users and security work uniformly against the database (Fig. 22). The
tradeoff that early MicroStrategy users paid for the vastly greater range of data access was somewhat slow-
er response-times and the potential for overwhelming novice users by allowing them to analyze the entire
database, rather than a simple subset. That’s why MicroStrategy introduced Intelligent CubesTM.
MicroStrategy’s Intelligent Cubes provide all of the same OLAP functionality that small-scale MOLAP cubes
provide, but with significant enhancements available only with a ROLAP underlying architecture.
CHAPTER 4
Cube Analysis
36
vs.
Limited Amount of Data
Proprietary Cube DBMS
Summary Information Only
Data Latency in Cube Building
Security Problems with Cube Distribution
Accelerating Maintenance Burden with Cubes
x
x
x
x
x
x
Unlimited Database Size
State-of-the-Art RDBMS Technology
Access Full Depth and Breadth of Database
Real-time Data, On Demand
Complete Centralized Security
Centralized Reports and Shared Metadata
CUBE FARMS MICROSTRATEGY RELATIONAL OLAP
Cubes for Each Application
Cubes for Increasing Data Depth
Cubes for Varying Levels of Security Relational Database
Figure 22 – MicroStrategy was designed to take complete advantage of the full power of database platform technology and avoid the burden of cube farms.

1. Speed-of-Thought Report Analysis and Manipulations – Analysis of cubes with speed-of-
thought performance and powerful slice-and-dice capabilities.
2. Ad Hoc Drilling from Summary Data to Transactional Details – Seamless drilling
capabilities outside the cube domain to anywhere in the data warehouse.
3. Cube Sharing with Personalized Views and Security – Transparent and secure sharing
across the enterprise of cubes with personalized views.
4. Automatic Creation and Synchronization of Cubes – Creating cubes on the fly with
automatic refresh of data for real-time analysis.
The remainder of this chapter discusses each of these areas in detail.
4.1 Speed-of-Thought Report Analysis and Manipulations
MicroStrategy’s Intelligent Cube technology lets users perform report manipulations on a multi-dimen-
sional cache of data rather than a limited, proprietary cube database. These caches are instantly popu-
lated by the simple action of “running a cube” and remain in shared cache for as long as the data is valid
and people are using it. This eliminates the entire IT overhead imposed by managing cube farms.
Intelligent Cubes Provide Speed-of-Thought User InformationIntelligent Cubes give users a much greater range of functionality. With Intelligent Cubes, people can
quickly add or remove report objects and modify report-filtering criteria with drag-and-drop actions in the
Web interface. Additionally, users can add new calculations or modify existing calculations on the fly with
an Excel-like formula bar, utilizing the full power of MicroStrategy’s Library of Statistical and
Mathematical Functions.1 All of these convenient user actions – adding/removing objects to/from a
report, filtering a report with new criteria, and creating new metrics – do not require going back to the
database and are performed with speed-of-thought response time (Fig. 23).
37THE 5 STYLES OF BUSINESS INTELLIGENCE:
Industrial-Strength Business Intelligence
Figure 23 – MicroStrategy users create business metrics on the fly with simple drag-and-drop of base metrics or by simply typ-ing the equation in the formula toolbar.
1 Refer to Chapter 6 (Section 6.1) for information on the MicroStrategy Library of Statistical and Mathematical Functions

For example, a user who wants to augment or modify a report to support an investigative analysis can drag-
and-drop metrics onto the report or create a new metric (Fig. 24). As a simple example, on a report with
revenue and cost metrics, a user can calculate a new profit metric on the fly by subtracting the cost metric
from the revenue metric, even though the profit metric in this case did not exist in the initial report cube.
In addition, users can apply new filtering criteria on the fly (Fig. 25). For example, a user can filter a prod-
uct profitability report to view only the products that make up the top 10% of profits – this calculation is
performed within the Intelligent Cube itself.
Furthermore, users can dynamically page-by business attributes and pivot the rows and columns of an
Intelligent Cube.2 For example, when reports display a large number of rows for regional sales, users can
CHAPTER 4
Cube Analysis
38
New Name Metric Define New Measurewith Drag-and-Drop
Figure 24 – MicroStrategy users create business metrics on the fly with simple drag-and-drop of base metrics or bysimply typing the equation in the formula toolbar.
Filter on Multiple Conditions
Filter on User-Defined Values
Instantaneous New View
Electronics Revenue vs. Forecast 2003 -> Item
Figure 25 – MicroStrategy users may easily view and edit filtering for rapid, iterative result refinement on the fly.
2 Refer to Chapter 5, Ad Hoc Query and Analysis, to see how easily MicroStrategy users can rearrange report data by business attributes with drag-and-drop and right-clickactions to Page By and Multi-Key Sort.
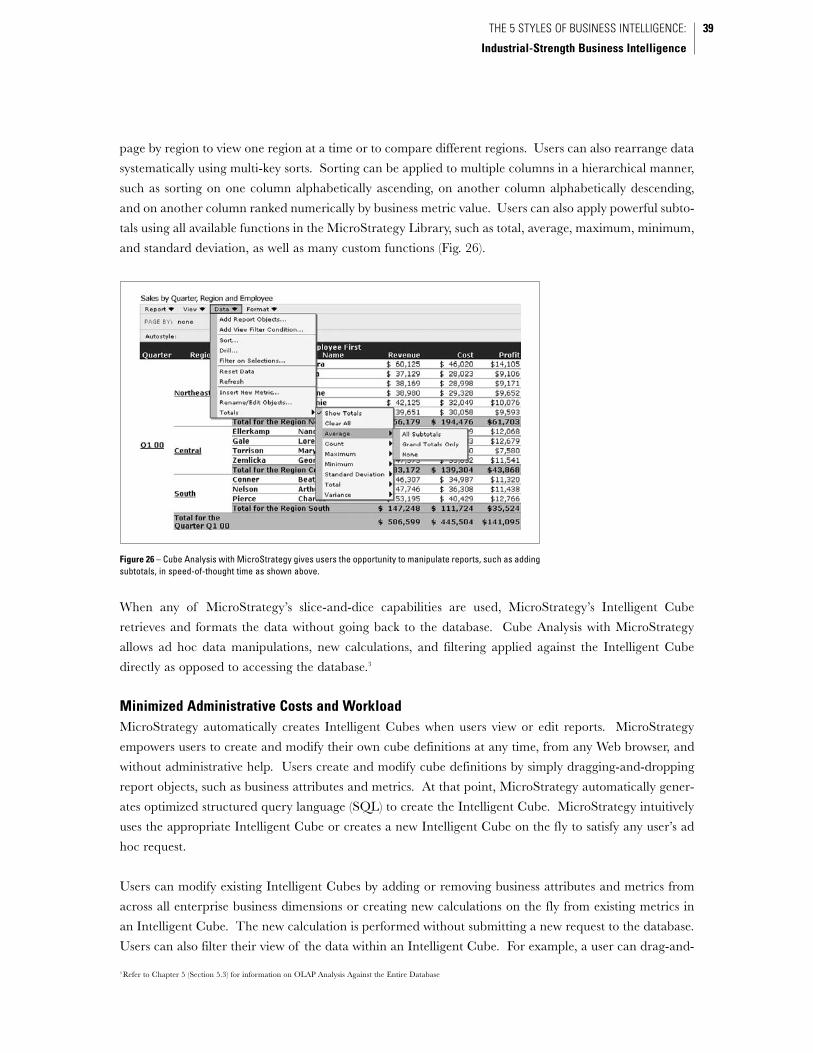
page by region to view one region at a time or to compare different regions. Users can also rearrange data
systematically using multi-key sorts. Sorting can be applied to multiple columns in a hierarchical manner,
such as sorting on one column alphabetically ascending, on another column alphabetically descending,
and on another column ranked numerically by business metric value. Users can also apply powerful subto-
tals using all available functions in the MicroStrategy Library, such as total, average, maximum, minimum,
and standard deviation, as well as many custom functions (Fig. 26).
When any of MicroStrategy’s slice-and-dice capabilities are used, MicroStrategy’s Intelligent Cube
retrieves and formats the data without going back to the database. Cube Analysis with MicroStrategy
allows ad hoc data manipulations, new calculations, and filtering applied against the Intelligent Cube
directly as opposed to accessing the database.3
Minimized Administrative Costs and Workload MicroStrategy automatically creates Intelligent Cubes when users view or edit reports. MicroStrategy
empowers users to create and modify their own cube definitions at any time, from any Web browser, and
without administrative help. Users create and modify cube definitions by simply dragging-and-dropping
report objects, such as business attributes and metrics. At that point, MicroStrategy automatically gener-
ates optimized structured query language (SQL) to create the Intelligent Cube. MicroStrategy intuitively
uses the appropriate Intelligent Cube or creates a new Intelligent Cube on the fly to satisfy any user’s ad
hoc request.
Users can modify existing Intelligent Cubes by adding or removing business attributes and metrics from
across all enterprise business dimensions or creating new calculations on the fly from existing metrics in
an Intelligent Cube. The new calculation is performed without submitting a new request to the database.
Users can also filter their view of the data within an Intelligent Cube. For example, a user can drag-and-
39THE 5 STYLES OF BUSINESS INTELLIGENCE:
Industrial-Strength Business Intelligence
Figure 26 – Cube Analysis with MicroStrategy gives users the opportunity to manipulate reports, such as addingsubtotals, in speed-of-thought time as shown above.
3 Refer to Chapter 5 (Section 5.3) for information on OLAP Analysis Against the Entire Database
drop the business attributes region, month, and product as well as the metrics revenue and cost to create a
cube that shows product sales within specific regions at a specific time. The user might then calculate a new
profit metric on the fly derived from revenue and cost, and then filter only the products with more than 5%
profitability. The user could also calculate percentage increase in sales for these products by dynamically
subtracting the current month’s sales from last month’s sales and applying appropriate arithmetic operators.
4.2 Cube Sharing with Personalized Views and Security
IT administrators struggle with maintaining and managing multiple cubes with duplicated data across user
desktops, Web servers, file servers and other locations. The architectures of other BI software spread data
across multiple systems within the enterprise. Consequently, users are at risk of analyzing outdated data on
their desktops and using different analytical definitions of the same business terms due to decentralization
of information across physical cubes of data. Thus, cube-based BI users cannot reliably share insights
because dissimilar numbers can show up on the same report definitions.
Easy Sharing Of Intelligent Cubes Data With Centralized Metadata and Server Architecture Only the MicroStrategy architecture is structured on a centralized and unified metadata that stores all business
terms and data warehouse object definitions in one location. All information about reporting and analysis
applications, users, reports, metrics and filters are stored in the metadata and can be shared by all users through
the MicroStrategy architecture’s centralized server. When an administrator creates a new Intelligent Cube, all
users can access it instantaneously. Business terms and definitions are standardized across the enterprise. When
multiple users with the same security levels run the same report, they get the same data. These users can also
share this information easily with other internal and external users simply by saving the reports in a shared fold-
er. Since these shared folders are also stored in a central location, all system users can easily access saved reports
over the Web or on the Windows desktop. Additionally, users can email reports directly from the Web.
Sharing Intelligent Cubes Data With Personalized Views When analyzing Intelligent Cube data, users can add, edit and remove business attributes and metrics.
These actions result in various personalized views of the same Intelligent Cube. Users can then save these
views so that the next time they run the Intelligent Cube, it will reflect their personal view. Thus, a report
designer can deploy one Intelligent Cube shared by all users, each with a personalized view. Hence, all per-
sonalized views are logically linked to the single published report; and, regardless of the view, all users are
accessing the same up-to-date data.
Secure Sharing of Intelligent Cubes IT administrators can be assured that Intelligent Cubes are shared securely because they use MicroStrategy’s
same multi-tiered security that applies to all Styles of BI with MicroStrategy. As a simplified example, an
administrator can design a report with ten business attributes and metrics. Both John and Martha can
share the same Intelligent Cube data, but Martha can view all ten objects and John can view only six of the
ten since his security profile denies him access to the additional four objects to which Martha has access.
CHAPTER 4
Cube Analysis
40
4 Refer to Chapter 5 (Section 5.2) for complete information on MicroStrategy’s Drill Anywhere capabilities.5 Refer to Chapter 6 (Section 6.5) for complete information on MicroStrategy’s unique multi-pass SQL generation capability.

4.3 Automatic Synchronization of Intelligent Cubes’ Data
IT administrators of other BI software spend most of their time managing and updating cubes based on
business users’ requirements. In those cases, administrators maintain multiple cubes in different locations,
such as user desktops, Web servers and file servers. Cube data must be duplicated across these various
locations and can quickly become a nightmare to manage and keep synchronized with the latest data. By
contrast, the MicroStrategy architecture delivers MOLAP by automatically creating and populating
Intelligent Cubes in the centralized metadata for use across the entire enterprise. Intelligent Cubes are
automatically managed – with cube data always up-to-date and synchronized – without an administra-
tor’s involvement.
MicroStrategy administrators have the option of configuring Intelligent Cube data to expire or refresh
automatically, using time-based schedules or event-based triggers such as data loads or table modifications.
Because of this automatic refresh, business users can be confident that Intelligent Cube data is always up-
to-date for accurate decision-making. For instance, an administrator can schedule Intelligent Cubes to be
refreshed every evening at 10:00 PM so that users access up-to-date data everyday. When a table column
in the database is updated, the data of the Intelligent Cubes affected by the change is automatically
refreshed. In addition, administrators can use text-based commands and scripts, custom, or third-party
tools to further automate treatment of Intelligent Cube data.
4.4 Ad Hoc Drilling from Summary Data to Transactional Details
With MicroStrategy, executives and managers can quickly assess summary level KPIs on scorecards or
other reports before drilling to analyze detailed and even transaction level information. This drilling from
KPIs to detailed level information generates the most valuable insight – for example, finding the root prob-
lem of a specific product’s declining sales. Drilling from a summary level KPI to transaction level details
is effortless with the MicroStrategy architecture. Other BI software fails to achieve transaction level analy-
sis without intensive IT administrative assistance – for this reason, other BI software frequently restricts
users to very basic summary analysis and static drill paths at best.
MicroStrategy enables powerful Drill Anywhere, letting users freely drill beyond Intelligent Cubes to the
full breadth of their enterprise data warehouse.4 These user actions are possible because of the combina-
tion of Intelligent Cube technology with the industry’s only multi-pass SQL generation.5 Users do not
have to think about how to create a cube or run queries against the database – they can intuitively per-
form speed-of-thought analysis using MicroStrategy, moving seamlessly from Cube Analysis to Ad Hoc
Query and Analysis. MicroStrategy automatically handles the cube creation and drill actions behind the
scenes, without interrupting a user’s workflow. For example, at a leading telecommunications company,
analysts needed a revolutionary method to analyze customer call logs, contributions and profits that would
go beyond summary level reports such as Top 100 gainers or decliners by product or geography. Using
MicroStrategy, the analysts were armed with the ability to drill through the summary level numbers to the
41THE 5 STYLES OF BUSINESS INTELLIGENCE:
Industrial-Strength Business Intelligence

detailed call logs and answer questions such as, “Which customers have the greatest gaps and what are the
root causes? Is a product change or rate-per-minute change driving this gap?” In addition, as users per-
form their analyses, they can save the new report results for future use and for sharing with other
MicroStrategy users.
4.5 Cube Analysis Summary
While traditional MOLAP is often sufficient for limited departmental analysis domains, it fails to provide
the power and flexibility required for true speed-of-thought analysis. MicroStrategy places analytic flexi-
bility in the hands of business users – and frees up the IT department from creating and maintaining the
cube data. With MicroStrategy, users can quickly add or remove report objects, modify report-filtering
criteria, and create new metrics – all with easy drag-and-drop actions from any Web browser.
MicroStrategy’s Intelligent Cubes let users perform report manipulations on cached data without access-
ing the database.
MicroStrategy delivers Cube Analysis by offering the new and revolutionary cube architectural paradigm
of Intelligent Cubes, an analysis environment that is simple enough for novice users, yet powerful enough
for power users wishing to perform transaction level analysis. In turn, the MicroStrategy architecture min-
imizes IT administrators’ workloads by eliminating the need to manage multiple cubes for different types
of users, with varying security privileges and analysis environments. The MicroStrategy architecture auto-
matically creates Intelligent Cubes that are built once and shared across the enterprise using the
MicroStrategy architecture’s centralized metadata. Other BI software architecture is constrained by phys-
ical cube generation – and therefore cannot meet the demands of enterprise-class Cube Analysis.
MicroStrategy Intelligent Cubes do not inherit the disadvantages of pure MOLAP, cube-based BI tools.
Cube-based BI tools offer limited data scalability, limited scope of analysis, and poor drill through to trans-
action level data. By contrast, MicroStrategy users performing Cube Analysis can analyze the full breadth
of available data and are not limited by cube sizes. Through MicroStrategy Intelligent Cubes, companies
can provide users with quick performance and full analytical power, while retaining the ability to report
against terabytes of data at transaction level detail. With the cube-based architecture of other BI software,
IT administrators must pre-calculate and pre-build the cubes prior to end-user access, resulting in cube
storage in multiple, unlinked locations, requiring duplication of data for each location. With the
MicroStrategy architecture, Intelligent Cubes are created automatically without IT assistance when users
run a report – and are stored in the unified metadata on the centralized server.
MicroStrategy Intelligent Cubes save IT administrators’ time and hardware costs. Enterprises can consol-
idate separate cube, reporting and analysis systems into one integrated, scalable platform, and can distrib-
ute report and Intelligent Cube creation to power users, thus eliminating unnecessary maintenance work.
With other BI architectures, administrators spend a substantial amount of time building and administer-
ing cubes because they must manually create, expire and refresh cubes constantly. With MicroStrategy,
CHAPTER 4
Cube Analysis
42

Intelligent Cubes are automatically expired and refreshed on event- and time-based schedules.
MicroStrategy combines the speed and interactivity of MOLAP analysis with the analytical power and
depth of ROLAP analysis. The following chapter explores ROLAP in the context of Ad Hoc Query and
Analysis.
43THE 5 STYLES OF BUSINESS INTELLIGENCE:
Industrial-Strength Business Intelligence

Ad Hoc Query and Analysis is the Style of BI designed for information explorers and power users who
need full investigative power against all enterprise data. These users require the ability to see any possi-
ble combination of data. If it were feasible to pre-design reports that covered every possible combination
of data, then Ad Hoc Query and Analysis would not be needed. Practically speaking, this is impossible.
Pre-defining reports with all possible permutations would require the design tens of thousands and even
millions of reports depending on the extent of the database. It would also require the addition of hun-
dreds or thousands of new reports each time a new attribute is added to the database.
The most basic way to support Ad Hoc Query and Analysis is to give users the ability to create brand new
reports, allowing them to assemble any possible combination of data into a report. In that way, compa-
nies don’t have to pre-design all possible report combinations. This is the basic definition of Ad Hoc
Query and Analysis, and it is the method employed by most BI vendors. However, it is important to note
that cube-based BI vendors only allow users to create ad hoc reports against the small subsets of data avail-
able in their proprietary cube databases. While this technically is an ad hoc report, it does not fulfill the
requirements for full investigative analysis of the entire relational database.
The MicroStrategy architecture was designed from its very roots to provide the most robust Ad Hoc Query
and Analysis capability in the industry. The MicroStrategy architecture allows users to create their own
new ad hoc reports using the entire relational database as the source. MicroStrategy is founded on the
Relational OLAP technology that allows users to perform full OLAP analysis against the entire relational
database. The MicroStrategy architecture distinguishes itself from all other BI architectures in six key
areas of Ad Hoc Query and Analysis application:
1. Parameter-driven Reporting With Guided Analysis – Allows users to create radically dif-
ferent reports simply by answering a series of questions (or prompts) just prior to running the report.
2. Drill Anywhere – Allows users to surf to any place in the database by using OLAP functionality
and following the business model of the data warehouse.
3. OLAP Analysis Against the Entire Database – Allow users to conduct report manipulations.
4. Sophisticated Filtering With Power of Sets – Allows users to segment data according to
45
5AD HOC QUERY AND ANALYSIS

different business criteria in order to refine the data set.
5. User-defined Data Grouping – Allows users to refine the business model without causing any
changes to the database or the overall business model.
The remainder of this chapter discusses each of these areas in detail.
5.1 Parameter-driven Reporting and Guided Analysis
Parameter-driven reporting functionality allows people to customize the content and layout of any given
report within a range of variations defined by certain factors or parameters. The MicroStrategy architec-
ture provides the richest range of parameterization available, allowing one report design to manifest itself
in more variations than with any other BI technology.
Customizing Report Content Based on User Input at Run-timeWith MicroStrategy, novice users can create sophisticated custom reports on the fly, defining report con-
tent by selecting metrics and business criteria at run time – simply by answering prompted questions. This
allows enterprises to translate complex database query parameters into a set of simple questions that guide
users (Fig. 27). For instance, users can select simple report elements such as a period of time equal to last
quarter or a geographical area equal to the northeast.
MicroStrategy parameterization, however, can be even more sophisticated. With MicroStrategy, users can
request complex elements such as a “time period 90 days following a purchase” or a “geographical region
CHAPTER 5
Ad Hoc Query and Analysis
46
Guided Workflow
Contextual Instructions for Users
Prompt Choices Automatically
Generated from Database
Full Search Capability for
Long Prompt Lists
Figure 27 – MicroStrategy’s parameterized reporting allows users to re-run the same report with different parameter combinations, or inputs, as theyrefine their analysis and then save their sequenced answers for future use.

where market share growth is greater than industry average.” They can even customize the metrics with-
in that data set. For example, MicroStrategy users can request the top 10% most profitable products by
revenue or the routes with the highest standard deviation in total cycle time. The important thing to notice
is that these requests refer to real business questions, not limited by database tables and keys and joins like
other BI vendors’ technologies. This makes it easy and quick for users to customize report content.6
Ad Hoc Report Permutations By Varying User InputsWhat makes parameterized reporting truly useful is when the users have the ability to iterate quickly
through many parameter sequences and to save their sequenced answers for future use. Users can re-run
the same report with different parameter combinations as they refine their analysis. Furthermore, the
basic analytical workflow is embedded in the parameter sequence as a series of hierarchical questions.
Once a user has identified a truly useful report based on a set of specific prompt answers, he or she can
save that report with the prompts already answered in exactly the same way, thus generating a new ad hoc
report. This lets each user save a full set of new reports that are simply useful pre-defined combinations
of one parameterized report. Ultimately, through this process, the users get to decide which parameter
combinations are useful through their actual day-to-day work, and can save the most useful combinations
for future use and sharing across a workgroup or the enterprise.
Widest Range of Prompt Types Deliver Most Comprehensive Parameterization MicroStrategy delivers the widest range of types of questions, or prompt types, which in turn give
MicroStrategy parameterized reports the widest range of customizability at run time. There are four
main types of prompts that can be used to create reports with MicroStrategy:
1. Filter prompts let users fine-tune the range of data set retrieved from the database and included
in the report results. Filters can limit the range of business attributes and metrics, such as a filter
that limits a report to sales greater than $100 for the stores only in the northeast region. Filters
can be created dynamically, saved, shared and reused in an almost infinite variety of ways, giving
tremendous control to users in the form of filter prompts.
2. Object prompts let users select which fundamental elements will show up on a report. Thus,
users can select the metrics, business attributes or Custom Group to be included in a report.7 This
is an incredibly powerful prompt type: the list of possible metrics and attributes could be the full
range of the data warehouse, giving a user the ability to create virtually any report. Object
prompts can be even more complex than simply selecting metrics or attributes. For instance, an
object prompt can include a choice of analytical functions, such as standard deviation, maximum,
or average, and can be used in combination with another prompt that selects metrics to be com-
bined with this function.
3. Value prompts allow users to input numbers, date values or text strings to be used within a
report as part of a calculation, or as a threshold test, or simply as part of a title. The ability to
input numbers is very useful for what-if analyses, in which users can change parameters at report
run time and save the different reports as different scenarios, such as Best Case, Expected Case,
47THE 5 STYLES OF BUSINESS INTELLIGENCE:
Industrial-Strength Business Intelligence
6 Refer to Chapter 3 (Section 3.2) for more information on MicroStrategy’s parameterized reporting capabilities. Figure 13 shows how MicroStrategy users answer prompts todefine report contents from any Web browser.7 Refer to Chapter 5 (Section 5.5) for information on Custom Groups and other User-Defined Data Groupings.

and Worst Case.
4. Level prompts allow users to control the aggregation level of the metrics on a report. For example,
a user can choose at run time to calculate a product sales metric as a percent of total sales within a
store, total sales within a region of many stores, or total sales of a country comprised of many
regions – simply by setting the level prompt to be store, region, or country.
Minimizing the Total Number of Reports NeededThe flexibility of prompts significantly reduces the total number of reports necessary to develop and
administer. MicroStrategy's advanced prompting capability allows a single report definition to be used by
an unlimited number of users, with each user able to specify the exact data and format at report run time.
For example, without MicroStrategy, reports of geographical sales data by region would need to be gen-
erated separately to satisfy different users. With MicroStrategy, report designers create one report that
prompts the user at run time to choose report contents, such as quota performance below 50%.
5.2 Drill Anywhere Allows Users to Surf the Entire Database, Creating NewAd Hoc Reports Dynamically Through the Drilling Process
The MicroStrategy architecture is unique in the industry in its ability to Drill Anywhere in the entire data-
base (data warehouse, datamart, or operational database). Only the MicroStrategy architecture, with its
robust Relational OLAP foundation, makes the Drill Anywhere capability possible. Where other BI soft-
ware limits users to drill up and down the hierarchies within their limited cube databases, MicroStrategy’s
unique ROLAP modeling of relational databases allows users to drill up, drill down, and drill across hier-
archies anywhere in the entire database. Each drilling action creates a new report dynamically for the user.
In essence, Drill Anywhere in the database gives users the ability to surf to the set of data that gives them
the answers they are looking for without the need to
manually create any ad hoc reports. This drilling
and dynamic report generation is no less revolu-
tionary than the Internet’s ability to allow people to
surf to any dynamically-generated Web page
through hyperlinks, versus the pre-Internet manual
method of explicit addressing and file transfers.
MicroStrategy users can surf the full range of
enterprise data with an intuitive right-click drilling
menu (Fig. 28). For example, they can drill from the
quarterly regional sales to the customers’ daily
transactions at individual stores. From there, users
can drill to the most profitable customers who shop
in that particular store and to the products pur-
chased by these profitable customers for cross-selling
CHAPTER 5
Ad Hoc Query and Analysis
48
Figure 28 – Users can Drill Anywhere in the database with a simple right-click menu that allows you to drill up, drill down, or drill across to anyother business attribute. A new report is dynamically generated as partof each drill operation.

opportunities. The process for moving down or up a hierarchy to more- or less-detailed data is commonly
called drill down and drill up, respectively. The capability to shift to other hierarchies – for example, replac-
ing customer with supplier – is called drill across. Collectively, the ability to perform any one or combina-
tion of drill down, drill up, and drill across actions – at any level of detail, anywhere in the database – is
referred to as Drill Anywhere.
Guided Analysis with Drill Paths MicroStrategy drilling also can be configured in such as way as to guide users along customized drill paths.
These pre-designed drill paths lead users through a sequence of analysis, traversing along specific business
attributes, business hierarchies, or to an entirely new report template altogether. The initial report can be
used as a filter for a subsequent report in the drill path. For example, in a marketing campaign, a user can
drill directly from a report that shows the list of customers who bought the twenty most profitable prod-
ucts to a new report that includes detailed contact and purchasing information for just these customers.
Minimizing the Total Number of Reports Needed MicroStrategy’s sophisticated Drill Anywhere minimizes the number of reports that need to be pre-
designed. With MicroStrategy, users can dynamically drill beyond their initial report to a wholly new
report, which they can then save as a new standard report.
5.3 OLAP Analysis Against the Entire Database – On the Fly ReportManipulations
MicroStrategy users have the flexibility to modify reports on the fly by adding powerful subtotals, sorting
on multiple values, paging by report attributes, pivoting the report axes, building new calculations or new
derived metrics, applying sophisticated filtering criteria, using thresholds, and exporting data.
49THE 5 STYLES OF BUSINESS INTELLIGENCE:
Industrial-Strength Business Intelligence
Figure 29 – MicroStrategy users can apply different types of totals and subtotals of at levels of areport, using any analytical function from the MicroStrategy Library of functions.
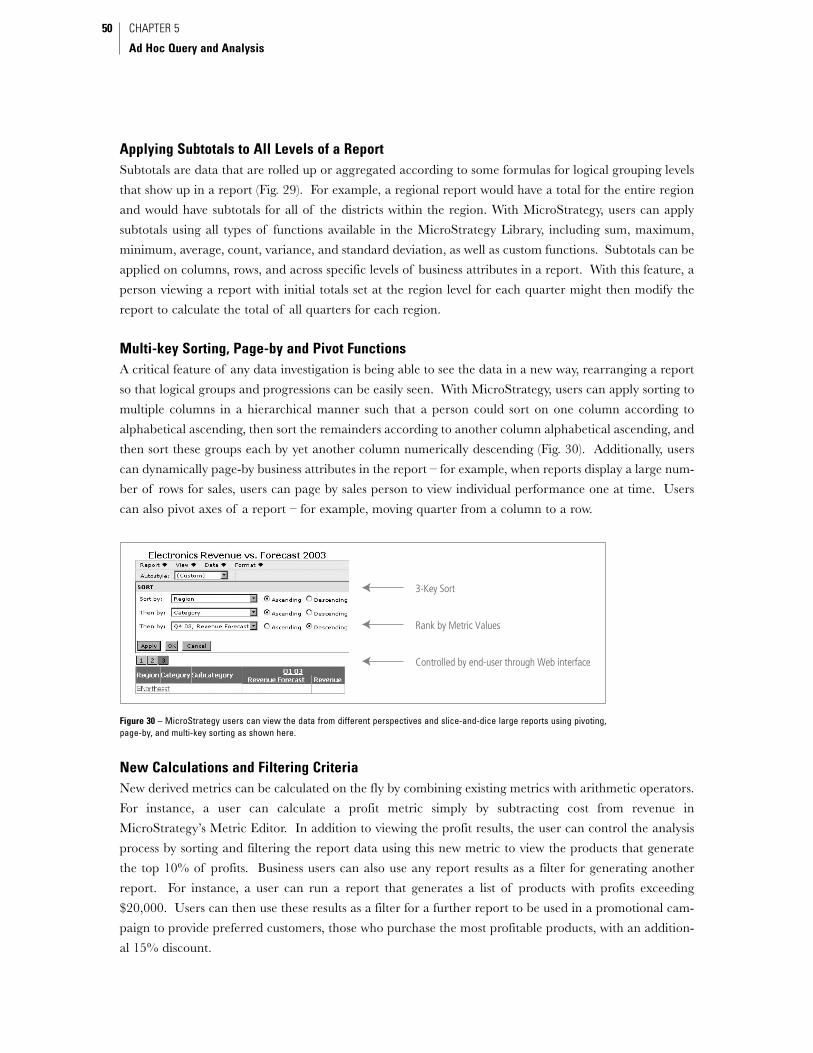
Applying Subtotals to All Levels of a ReportSubtotals are data that are rolled up or aggregated according to some formulas for logical grouping levels
that show up in a report (Fig. 29). For example, a regional report would have a total for the entire region
and would have subtotals for all of the districts within the region. With MicroStrategy, users can apply
subtotals using all types of functions available in the MicroStrategy Library, including sum, maximum,
minimum, average, count, variance, and standard deviation, as well as custom functions. Subtotals can be
applied on columns, rows, and across specific levels of business attributes in a report. With this feature, a
person viewing a report with initial totals set at the region level for each quarter might then modify the
report to calculate the total of all quarters for each region.
Multi-key Sorting, Page-by and Pivot FunctionsA critical feature of any data investigation is being able to see the data in a new way, rearranging a report
so that logical groups and progressions can be easily seen. With MicroStrategy, users can apply sorting to
multiple columns in a hierarchical manner such that a person could sort on one column according to
alphabetical ascending, then sort the remainders according to another column alphabetical ascending, and
then sort these groups each by yet another column numerically descending (Fig. 30). Additionally, users
can dynamically page-by business attributes in the report – for example, when reports display a large num-
ber of rows for sales, users can page by sales person to view individual performance one at time. Users
can also pivot axes of a report – for example, moving quarter from a column to a row.
New Calculations and Filtering Criteria New derived metrics can be calculated on the fly by combining existing metrics with arithmetic operators.
For instance, a user can calculate a profit metric simply by subtracting cost from revenue in
MicroStrategy’s Metric Editor. In addition to viewing the profit results, the user can control the analysis
process by sorting and filtering the report data using this new metric to view the products that generate
the top 10% of profits. Business users can also use any report results as a filter for generating another
report. For instance, a user can run a report that generates a list of products with profits exceeding
$20,000. Users can then use these results as a filter for a further report to be used in a promotional cam-
paign to provide preferred customers, those who purchase the most profitable products, with an addition-
al 15% discount.
CHAPTER 5
Ad Hoc Query and Analysis
50
3-Key Sort
Rank by Metric Values
Controlled by end-user through Web interface
Figure 30 – MicroStrategy users can view the data from different perspectives and slice-and-dice large reports using pivoting,page-by, and multi-key sorting as shown here.

5.4 Filtering Data Using the Power of Sets
Set analysis, also known as segmentation analysis, is effective across many business disciplines. It is par-
ticularly popular in marketing, where it generally takes the form of customer segmentation, through which
an enterprise will segment the customer base according to different business criteria in order to find the
right customers for certain products (Fig. 31). Set analysis is the process in which data sets are manipulat-
ed and combined to obtain a refined data set for further analysis. Set analysis functionality is a core
strength of MicroStrategy, which takes advantage of all MicroStrategy platform capabilities and can be
applied against the entire enterprise data warehouse.
Flexible Data Set Creation Users can use set analysis to segment data into sets that reflect their particular business needs. This func-
tionality creates a link between multiple business attributes and places a filter on that relationship. For
example, users can identify customers who are over 50 years old, earn more than $150,000 per year, and
live in the northeast region but not in New York. Users can also create a report that compares the values
of two metrics and then limit the set of data, for example, to view only products that have revenue greater
than the previous year. Data sets can be personalized per user or shared with other users.
MicroStrategy’s filtering capability is not limited to existing data definitions. It can be applied to new met-
rics created by users on the fly. For example, instead of filtering on the top sales representatives by dollars
of sales, the user could use a filter that looked for the number of times they were in the top 10% of sales
representatives over a period of time.
Integrated Set Analysis Functionality Uses Platform Benefits Such as Data Scalability andAnalytical RichnessOther BI software may offer set analysis functionality, but only as a stand-alone tool. By contrast,
MicroStrategy's set analysis functionality is fully integrated across all 5 Styles of BI. MicroStrategy users
create data sets that are based on the full wealth of the enterprise data warehouse, querying and report-
ing on the data with all 5 Styles of BI. In addition, data sets can be extremely large in size. Only
MicroStrategy sets can work against the entire database for the most accurate and insightful analysis.
51THE 5 STYLES OF BUSINESS INTELLIGENCE:
Industrial-Strength Business Intelligence
Income>70K
NY
Age >50 Years
Show people over 50 years old earning less than $70K and not living in NY
Income>70K
NY
Age >50 Years
Show people over 50 years old living in NY and with income larger than 70K
Figure 31 – MicroStrategy's set analysis functionality allows users to easily segment data based ontheir specific business requirements and using any analytical function.

5.5 User-defined Data Grouping
A data warehouse is organized in a structure that reflects the business model of an enterprise, but the
structure does not always reflect the business needs of individual departments, teams and decision mak-
ers. As a result, users can have difficulty consolidating data into one report that meets their specific busi-
ness needs.
MicroStrategy solves this problem with the unique features of Custom Groups and Consolidations. These
are user-defined groupings of data that make sense to the users for a specific analysis or unique view of a
problem. Custom Groups and Consolidations allow MicroStrategy users to define reports on a row-by-
row basis (Fig. 32). Custom Groups and Consolidations provide tremendous flexibility to every depart-
ment or individual to refine the business model. And because MicroStrategy shields the database from
these user-specific and department-specific variations, there is no need to impose any changes to the cor-
porate data model and business model.
Combining Multiple User-defined Groups With Varying Business Conditions In One ReportCustom Groups are made of business elements that make up the rows of a report. Users can define each
report element separately from the other elements – each Custom Group element can act as a separate
report with its own set of criteria, such as business attribute qualifications, metric qualifications, and band-
ing qualifications. For example, users can define separate elements in a store inventory report. The first
element includes stores with sales of less than $50,000 and inventory of less than 100 products. The sec-
ond element includes stores with sales of more than $200,000 and inventory of more than 300 products.
Users can also create a report that includes groups of stores based on the total profit they generate. For
example, the first group includes the top 10% most profitable stores, the second group includes the top 11
to 20%, the third includes the top 21 to 30% and so on, with each group including a list of stores and their
individual contributions.
CHAPTER 5
Ad Hoc Query and Analysis
52
Products on Sale This Week
Top 3 Brands
Figure 32 – MicroStrategy users can group unrelated items, with varying business conditions and levels of analysis,intoa single report line. This is particularly useful for P&L-type reports where many line items are not at the same hierar-chical level.

Applying Arithmetic Calculations Between User-defined Groups of a Report MicroStrategy allows users to create virtual business attributes, known as Consolidations, which do not
exist in the database and are specific to the business needs of the decision maker. Consolidations allow
users to group different business attributes together in one row of a report and apply arithmetic calcula-
tions between these elements. For example, a user needs to calculate sales by season. However, the data-
base does not include the business attribute season. With Consolidations, a person can group the various
months that make up a season into four separate groups for the four seasons of the year. The summer sea-
son will include June, July and August; the fall will include September, October and November. In addi-
tion, users can perform row level math in any consolidation report such as multiplying or subtracting rows
of a report. A user can create a new row that shows the difference between the top two most profitable
months in spring. Consolidations can also include elements from different levels within the business hier-
archy, such as item and subcategory in the products hierarchy, or from different business hierarchies, such
as month and region in the time and geographic hierarchies. MicroStrategy’s user-defined data groupings
exist exclusively in the centralized metadata and therefore are centrally administered and secure.
Other BI software require the user to export a report to a spreadsheet, write a macro to sift through the
data then group and band the report. This exporting approach may work for a single user, but the con-
sistency of the results can’t be guaranteed anywhere else across the enterprise. In addition, it has been
shown again and again that off-line programming of spreadsheets and databases can have a severe, neg-
ative impact on job learning, as new employees have difficulty finding and understanding all of the hand-
made and often idiosyncratic mechanisms for analyzing and reporting data.
By contrast, MicroStrategy’s user-defined groupings satisfy specific users needs and do not change the
database structure or business model. Users can create their own groupings of data regardless of the data-
base structure and without assistance from report designers or administrators. This greatly minimizes the
maintenance work of administrators, ensures the consistency in database structure and data, and satisfies
the needs of end-users. MicroStrategy's user-defined data groupings are yet another way to reduce the
effort and cost of BI while making people more effective, better able to respond to one-off situations and
quicker to adapt to new business situations.
5.6 Ad Hoc Query and Analysis Summary
Ad Hoc Query and Analysis – the ability to ask questions about the data underlying a standard report
– is an important capability that allows users to explore their data without administrative intervention. In an
Ad Hoc Query and Analysis environment, business users can generate new or modified reports with control
over content, layout and calculations. MicroStrategy provides users with an abstraction layer that allows them
to investigate raw enterprise data in business terms they understand. The users do not need to understand
databases, table structures, or query languages – they only need to know how to point and click. They can
drill into their data to access detailed information guided by their business model, not their database model.
By contrast, BI software that requires knowledge of query languages or the structure of databases never
53THE 5 STYLES OF BUSINESS INTELLIGENCE:
Industrial-Strength Business Intelligence

proliferates in an organization because only very few users ever become proficient with them.
MicroStrategy uniquely provides a centralized abstraction layer coupled with powerful multi-pass SQL
generation. The MicroStrategy architecture provides the conduit between the information needs of busi-
ness users and the underlying power and scale of relational databases.
With MicroStrategy, users have complete Ad Hoc Query and Analysis capabilities – from parameter-driv-
en reporting, to Drill Anywhere, to OLAP analysis against the entire database, to set analysis, to user-
defined groupings. MicroStrategy users with little or no training build reports simply by answering
straightforward business questions. They perform ad hoc analysis, drilling down to the deepest level of
information or drilling across to new hierarchies anywhere within the enterprise database. Using any Web
browser, MicroStrategy users can slice-and-dice data, page by business attributes, pivot data between
columns and rows, filter data on the fly to refine the data set, and sort and rank data to arrange it in a for-
mat that yields the most insight. Additionally, business users can calculate new ratios, determine variances,
and create user-defined groupings that do not exist in the database. The ad hoc reports can be saved for
future use or for sharing with other users internal and external to the enterprise.
Giving end-users this level of control over their data minimizes the administrative workload and reduces
costs. With the MicroStrategy architecture, administrators can build once and deploy throughout the
entire enterprise, enabling users to then build exactly what they want when they need it.
CHAPTER 5
Ad Hoc Query and Analysis
54

Statistical Analysis and Data Mining is targeted at professional information analysts, individuals who reg-
ularly perform correlation analysis, trend analysis, and projections. This advanced Style of BI is achieved
by applying mathematical, financial and statistical functions against enterprise data.
The business insight derived from Statistical Analysis and Data Mining is critical for every enterprise.
However, specialized data mining tools are difficult to use – only statisticians with technical training are
able to use them. Instead, MicroStrategy’s BI technology was designed specifically to deliver much of the
common functionality of data mining tools – and to deliver it in a way that is familiar and consistent with
everyday business intelligence usage.
MicroStrategy’s Statistical Analysis and Data Mining features include the following five key areas:
1. Applying Statistics and Data Mining Against The Entire Database – Allows users to pick
from more than 200 mathematical, OLAP, financial, and statistical functions to apply against the
entire database for more accurate results.
2. Plug-and-Play Architecture for Custom Analytical Functions – Allows companies to
extend the analysis with calculations that are customized to its business.
3. Seamless Integration with Data Mining Tools – Allows the melding of mainstream BI with
the more arcane science of data mining.
4. Sophisticated Collaboration Technology – Leverages analytic functions of relational data-
base management system when present and otherwise supplements with analytic functions of
MicroStrategy Analytic Engine.
5. Multi-pass SQL – Lets users perform any type of analysis – from pricing optimization to rankings
and contributions – not possible with single-pass SQL.
The remainder of this chapter discusses each of these areas in detail.
57
6STATISTICAL ANALYSIS AND DATA MINING

6.1 Applying Statistics and Data Mining Against the Entire Database and forAll Users – Using MicroStrategy’s Comprehensive Library of Statistical andMathematical Functions
The application of more advanced analytical functions is too often a disconnected process and usually
applied to only subsets or summaries of data. With other BI software, business users depend on an admin-
istrator or a developer to apply the analytical function or model against their specific set of data. Users
then frequently have to ask to have new functions applied to further clarify and analyze data. This process
is slow and inefficient for both users and administrators.
The quality of the insights gained from a Statistical Analysis or Data Mining application is directly relat-
ed to the quality and completeness of the underlying data. If the application is not able to access all of
the data needed to build a model, then even the most complex mathematical model will give misleading
or incorrect results. This issue is made more difficult given that database sizes have been growing expo-
nentially over the last decade, and valuable information is buried within this growing mass of data.
MicroStrategy users can apply any of over 200 mathematical, OLAP, financial, and statistical functions
against the entire volume of data collected in the enterprise data warehouse. The MicroStrategy archi-
tecture accomplishes this through its highly sophisticated SQL Generation Engine as well as by its special-
ized Analytic Engine that supplements the database’s calculation capabilities.
By contrast, other BI technologies have far fewer native functions than MicroStrategy, and those functions
can only be applied to the limited data volumes present in proprietary cube databases. Due to their inher-
ent data limitations, cube-based BI architectures are incapable of providing a comprehensive picture of
the inter-relationships of data across the enterprise.
For example, telecommunications and financial services enterprises log millions of records every day.
These enterprises can only gain insight into their records if they can directly access the transaction level
data. One MicroStrategy telecommunications customer discovered new insights into customer calling pat-
terns, resulting in cost savings of tens of thousands of dollars every month. This level of analysis and sub-
tlety of insight could not be detected in the usual aggregated monthly analysis typical of cube-based BI tools.
More than 200 Analytical Functions Available Out-of-the-Box in the MicroStrategy Library toSupport All Types of AnalysisWith MicroStrategy, users can pick from more than 200 mathematical, OLAP, financial, and statistical
functions (Fig. 33). Users then can apply these functions on the fly to any set of enterprise data without
any administrative help. These functions range from simple database concepts such as running totals, to
full Mathematical functions such as sum, count, average, correlation, slope, and standard deviation; to
OLAP functions such as rank, running sum, and exponential moving average; to Financial functions
such as internal rate of return and accrued interest; and to Statistical functions such as chi-squared
and exponential distributions, kurtosis, skew, and t-tests, among a host of others.
CHAPTER 6
Statistical Analysis and Data Mining
58
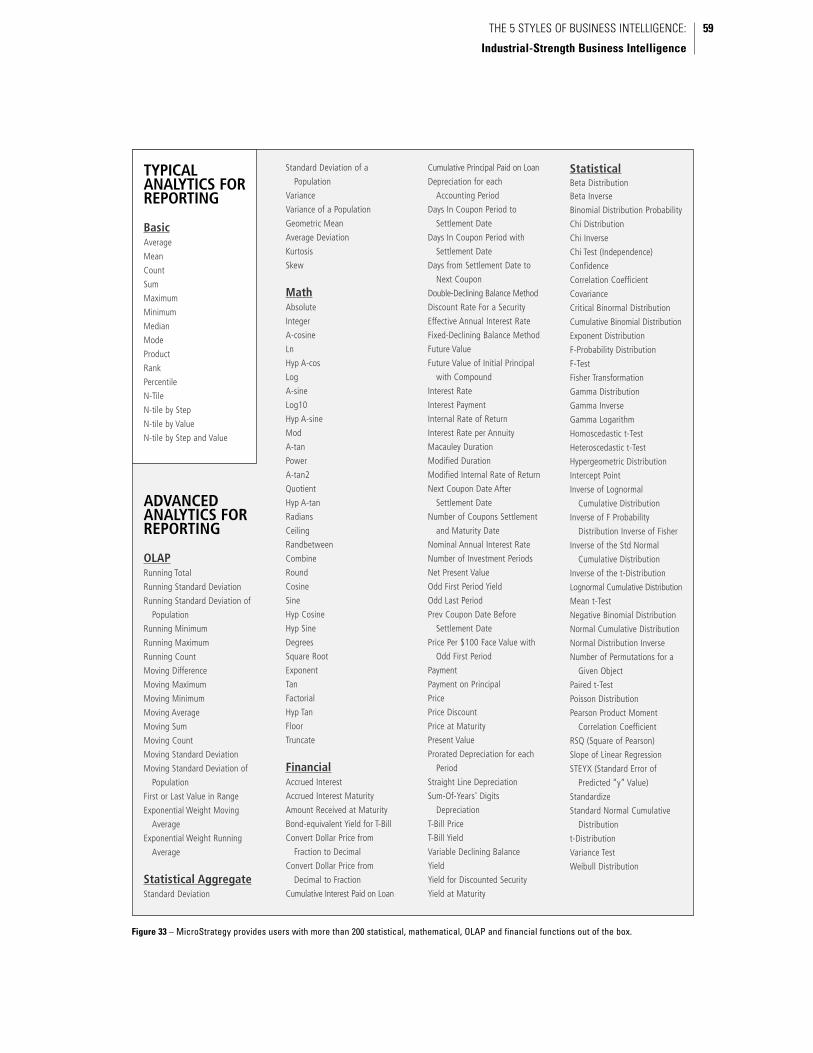
59THE 5 STYLES OF BUSINESS INTELLIGENCE:
Industrial-Strength Business Intelligence
Figure 33 – MicroStrategy provides users with more than 200 statistical, mathematical, OLAP and financial functions out of the box.
TYPICALANALYTICS FORREPORTING
BasicAverage
Mean
Count
Sum
Maximum
Minimum
Median
Mode
Product
Rank
Percentile
N-Tile
N-tile by Step
N-tile by Value
N-tile by Step and Value
ADVANCEDANALYTICS FORREPORTING
OLAPRunning Total
Running Standard Deviation
Running Standard Deviation of
Population
Running Minimum
Running Maximum
Running Count
Moving Difference
Moving Maximum
Moving Minimum
Moving Average
Moving Sum
Moving Count
Moving Standard Deviation
Moving Standard Deviation of
Population
First or Last Value in Range
Exponential Weight Moving
Average
Exponential Weight Running
Average
Statistical AggregateStandard Deviation
Standard Deviation of a
Population
Variance
Variance of a Population
Geometric Mean
Average Deviation
Kurtosis
Skew
MathAbsolute
Integer
A-cosine
Ln
Hyp A-cos
Log
A-sine
Log10
Hyp A-sine
Mod
A-tan
Power
A-tan2
Quotient
Hyp A-tan
Radians
Ceiling
Randbetween
Combine
Round
Cosine
Sine
Hyp Cosine
Hyp Sine
Degrees
Square Root
Exponent
Tan
Factorial
Hyp Tan
Floor
Truncate
FinancialAccrued Interest
Accrued Interest Maturity
Amount Received at Maturity
Bond-equivalent Yield for T-Bill
Convert Dollar Price from
Fraction to Decimal
Convert Dollar Price from
Decimal to Fraction
Cumulative Interest Paid on Loan
Cumulative Principal Paid on Loan
Depreciation for each
Accounting Period
Days In Coupon Period to
Settlement Date
Days In Coupon Period with
Settlement Date
Days from Settlement Date to
Next Coupon
Double-Declining Balance Method
Discount Rate For a Security
Effective Annual Interest Rate
Fixed-Declining Balance Method
Future Value
Future Value of Initial Principal
with Compound
Interest Rate
Interest Payment
Internal Rate of Return
Interest Rate per Annuity
Macauley Duration
Modified Duration
Modified Internal Rate of Return
Next Coupon Date After
Settlement Date
Number of Coupons Settlement
and Maturity Date
Nominal Annual Interest Rate
Number of Investment Periods
Net Present Value
Odd First Period Yield
Odd Last Period
Prev Coupon Date Before
Settlement Date
Price Per $100 Face Value with
Odd First Period
Payment
Payment on Principal
Price
Price Discount
Price at Maturity
Present Value
Prorated Depreciation for each
Period
Straight Line Depreciation
Sum-Of-Years' Digits
Depreciation
T-Bill Price
T-Bill Yield
Variable Declining Balance
Yield
Yield for Discounted Security
Yield at Maturity
StatisticalBeta DistributionBeta Inverse
Binomial Distribution Probability
Chi Distribution
Chi Inverse
Chi Test (Independence)
Confidence
Correlation Coefficient
Covariance
Critical Binormal Distribution
Cumulative Binomial Distribution
Exponent Distribution
F-Probability Distribution
F-Test
Fisher Transformation
Gamma Distribution
Gamma Inverse
Gamma Logarithm
Homoscedastic t-Test
Heteroscedastic t-Test
Hypergeometric Distribution
Intercept Point
Inverse of Lognormal
Cumulative Distribution
Inverse of F Probability
Distribution Inverse of Fisher
Inverse of the Std Normal
Cumulative Distribution
Inverse of the t-Distribution
Lognormal Cumulative Distribution
Mean t-Test
Negative Binomial Distribution
Normal Cumulative Distribution
Normal Distribution Inverse
Number of Permutations for a
Given Object
Paired t-Test
Poisson Distribution
Pearson Product Moment
Correlation Coefficient
RSQ (Square of Pearson)
Slope of Linear Regression
STEYX (Standard Error of
Predicted “y” Value)
Standardize
Standard Normal Cumulative
Distribution
t-Distribution
Variance Test
Weibull Distribution

MicroStrategy users can perform analysis ranging from the simple to the advanced. For example, users
can better understand how customers spend their money by answering questions such as “What is the
median spending of customers in each customer region?” and “What is the standard deviation of all cus-
tomers’ spending in each region?” or “What is our market share growth this year by store, for those stores
where actual sales exceeded target sales by more than 15%?”
The ability for any user to perform these analyses on the full range of enterprise data is critical. Other BI
software allows only limited analysis on extracted subsets of data in cubes. With MicroStrategy, users
themselves can choose to subset data using filters and then perform further analysis by applying mathe-
matical, OLAP, financial, and statistical functions from the MicroStrategy Library. Using these functions,
MicroStrategy users can perform market basket analysis, churn prediction, retention, risk, deciling, and
hypothesis testing, as well as data mining techniques such as forecasting and clustering.
Consistent Analytical Power in the Hands of All Users and Against the Full Wealth of EnterpriseDataMicroStrategy allows all users to drag-and-drop any analytical function onto any enterprise data set. With
other BI software products, which have cube-based architectures, users access data on their desktops – this
data can become outdated and often differs from user to user, department to department, and server to
server. Calculations based on data stored in cubes are inaccurate and incomplete since they are applied
only on a subset of the enterprise data. By contrast, the MicroStrategy architecture allows users to apply
analytical functions or hypothesis testing to any data set in the enterprise data warehouse, with calcula-
tions defined and stored centrally in the metadata – ensuring consistency, accuracy of calculations and
easy access by disparate users. Consequently, MicroStrategy users can rely on their data and focus on their
creativity and job expertise to unlock value for the enterprise. The MicroStrategy architecture uses a cen-
tralized abstraction layer – a unified metadata across all 5 Styles of BI – that guarantees consistent func-
tion and metric definitions across the enterprise.
6.2 Plug-and-Play Architecture for Custom Analytical Functions
Many enterprises have unique and proprietary calculations that are needed because of the unique and
proprietary character of their business model. Whether it’s some unique calculation of productivity, or
a unique correlation formula relating sales to promotions, or heuristic price elasticity coefficients, or some
unique predictor of fraud probability, all companies have some business calculations that are not simply
standard mathematical functions. Interestingly, these also tend to be some of the most critical business
questions that a BI system should be able to address. This is where custom analytic functions become
very important.
MicroStrategy’s Extensible Architecture For Plugging in Custom-built Functions The MicroStrategy architecture is open and extensible, allowing enterprises to create their own custom
analytic functions, and embed those functions in any BI report or analysis (Fig. 34). MicroStrategy accom-
CHAPTER 6
Statistical Analysis and Data Mining
60
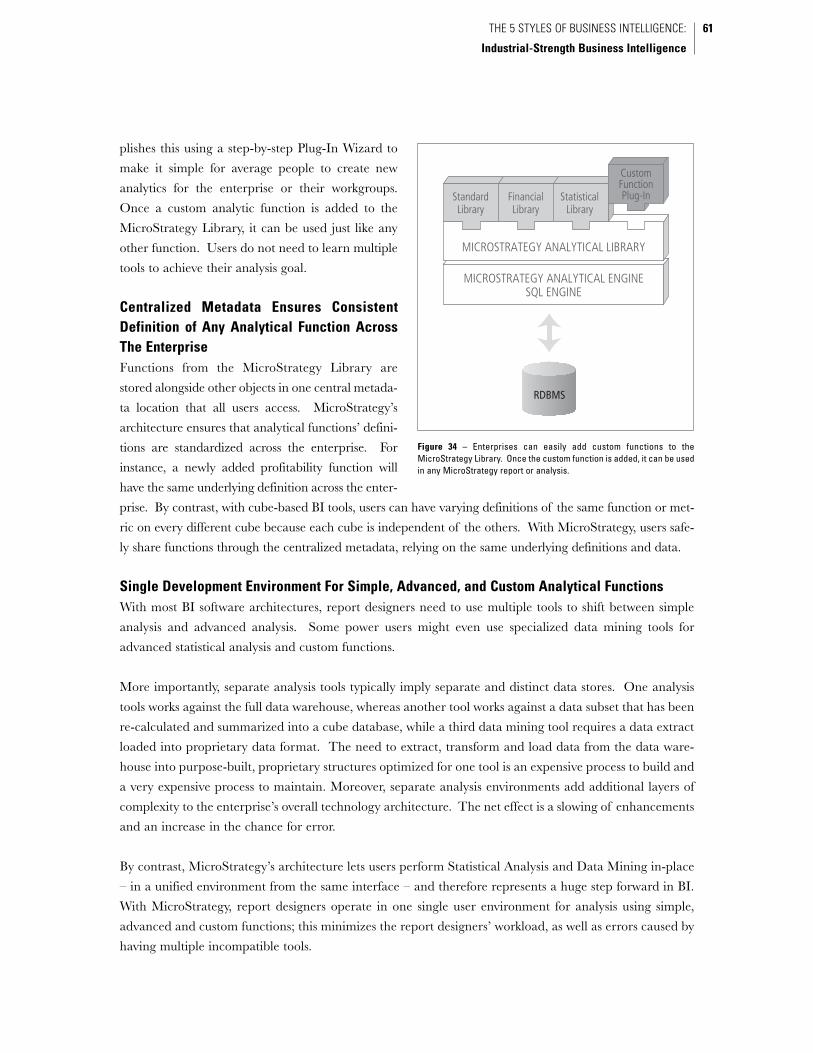
plishes this using a step-by-step Plug-In Wizard to
make it simple for average people to create new
analytics for the enterprise or their workgroups.
Once a custom analytic function is added to the
MicroStrategy Library, it can be used just like any
other function. Users do not need to learn multiple
tools to achieve their analysis goal.
Centralized Metadata Ensures ConsistentDefinition of Any Analytical Function AcrossThe Enterprise Functions from the MicroStrategy Library are
stored alongside other objects in one central metada-
ta location that all users access. MicroStrategy’s
architecture ensures that analytical functions’ defini-
tions are standardized across the enterprise. For
instance, a newly added profitability function will
have the same underlying definition across the enter-
prise. By contrast, with cube-based BI tools, users can have varying definitions of the same function or met-
ric on every different cube because each cube is independent of the others. With MicroStrategy, users safe-
ly share functions through the centralized metadata, relying on the same underlying definitions and data.
Single Development Environment For Simple, Advanced, and Custom Analytical FunctionsWith most BI software architectures, report designers need to use multiple tools to shift between simple
analysis and advanced analysis. Some power users might even use specialized data mining tools for
advanced statistical analysis and custom functions.
More importantly, separate analysis tools typically imply separate and distinct data stores. One analysis
tools works against the full data warehouse, whereas another tool works against a data subset that has been
re-calculated and summarized into a cube database, while a third data mining tool requires a data extract
loaded into proprietary data format. The need to extract, transform and load data from the data ware-
house into purpose-built, proprietary structures optimized for one tool is an expensive process to build and
a very expensive process to maintain. Moreover, separate analysis environments add additional layers of
complexity to the enterprise’s overall technology architecture. The net effect is a slowing of enhancements
and an increase in the chance for error.
By contrast, MicroStrategy’s architecture lets users perform Statistical Analysis and Data Mining in-place
– in a unified environment from the same interface – and therefore represents a huge step forward in BI.
With MicroStrategy, report designers operate in one single user environment for analysis using simple,
advanced and custom functions; this minimizes the report designers’ workload, as well as errors caused by
having multiple incompatible tools.
61THE 5 STYLES OF BUSINESS INTELLIGENCE:
Industrial-Strength Business Intelligence
StandardLibrary
FinancialLibrary
StatisticalLibrary
CustomFunctionPlug-In
MICROSTRATEGY ANALYTICAL LIBRARY
MICROSTRATEGY ANALYTICAL ENGINESQL ENGINE
RDBMS
Figure 34 – Enterprises can easily add custom functions to theMicroStrategy Library. Once the custom function is added, it can be usedin any MicroStrategy report or analysis.

6.3 Seamless Integration with Data Mining Tools
The main purpose of data mining is to discover patterns and algorithms in the existing data that can be
used to predict future outcomes. This includes analysis techniques such as regression, segmentation, clus-
tering, and forecasting. Typically, whenever business users need sophisticated predictive functionality, they
must contact a highly skilled developer to assist with their request using a formal data-mining tool.
Mathematicians, statisticians and administrators then “discover” the appropriate algorithms using data-
mining tools along with a subset of the actual data by “training” the data-mining tool. Unfortunately, a
recurring problem with this basic model is that each analysis tends to be a one-time event. That is, the
new algorithms are not generally available to all users through their standard BI reporting or analysis sys-
tem – instead the separate data mining processes delivers a series of one-time answers to the requester.
Integration With Existing Best-of-Breed Data Mining Technologies Because the MicroStrategy architecture supports customized analytic functions to be inserted into the
standard MicroStrategy Library, it can easily incorporate the highly specialized data-mining algorithms
generated by best-of-breed data mining products (Fig. 35). The diagram below shows how this works with
MicroStrategy and any data-mining product that adheres to the new Predicative Modeling Markup
Language (PMML). In this scenario, the MicroStrategy architecture delivers a subset of data to the data-
mining tool to perform its algorithm creation process. Once complete, the algorithm is shipped back to
MicroStrategy to be inserted directly into the MicroStrategy Library. At that time, it is available to any
report or user who wants to use it. If the algorithm exceeds the capabilities of MicroStrategy’s Analytic
Engine, as in the case of neural network algorithms, then MicroStrategy calls the best-of-breed data min-
ing tool to assist in the calculations.
In this way, highly specialized algorithm developers can develop reusable libraries of data mining func-
tions that are accessible to everyday MicroStrategy reports.
CHAPTER 6
Statistical Analysis and Data Mining
62
MICROSTRATEGY INTELLIGENCE SERVER DATA MINING PRODUCT
Training & Validation Data
Function Plug-in
“Scoring” Metric
New Analysis UsingScoring Metric
f Apply (x)
PMML
Data-mart
Data Mining tool uses data sets
defined in MicroStrategy to
develop the predictive model
The predictive function is
imported into the MicroStrategy
project and is used as a metric
in analyses and reports
Figure 35 – MicroStrategy Intelligence Server integrates seamlessly with best-of-breed data mining products by importing the data mining algorithmsdirectly into the MicroStrategy Library, so that the data mining analysis capabilities can be incorporated into any MicroStrategy report.
All Users Can Take Advantage of Data Mining Models Without Learning Their Complexities
With data mining algorithms integrated in the MicroStrategy architecture, business users can access data
mining calculations for everyday business analysis. Users can use these models to answer questions like,
“Which customers are likely to switch to the competition in the next 6 months,” without needing to learn
the complexities of the models.
One illustrative example of optimal integration of BI and data mining is in the area of marketing cam-
paign management. In this example, a business user creates a report with pertinent customer demograph-
ics such as age, gender, income, education, household size and success rates with prior marketing cam-
paigns, using Ad Hoc Query and Analysis, and sends that data to the data mining tool as a small data-
mart. The data mining tool identifies a predictive algorithm that indicates the likelihood of various cus-
tomer profiles to respond positively to various marketing campaigns. This predictive algorithm is insert-
ed into the MicroStrategy platform and is applied to the entire database of customers to determine pre-
cisely whom to include in the marketing campaign and the expected results.
6.4 Sophisticated Analytic Collaboration with Relational Databases
The MicroStrategy Analytic Engine operates collaboratively with the calculation engines embedded in the
relational database management system (RDBMS). Not all databases have the same calculation capabil-
ities. There are some important analytical functions that some databases simply do not support and other
analytic functions that database systems cannot do quickly. To overcome this, the MicroStrategy Analytic
Engine automatically compensates for variations in calculation capabilities of the different database sys-
tems – allocating calculation responsibilities to the database system when it can be best done in there, and
reserving the calculation for MicroStrategy when the database system can not accomplish it quickly.
Proprietary Collaboration That Answers Users Requests Not Otherwise Possible The MicroStrategy architecture collaborates with database technology in an intelligent and proprietary
multi-step interaction process. The main benefit of this multi-step process is that it can provide answers
to queries that cannot be answered by the database itself, such as user-defined groupings, Custom Groups,
Consolidations and other analytical functions not supported by the database. Complex questions that can-
not be answered with other approaches or that require multiple BI tools can be answered quickly and eas-
ily with MicroStrategy. With most BI software, administrators have to perform a manual process to answer
user requests when the database does not support the required analytical function. By contrast,
MicroStrategy users’ requests are answered automatically, without an IT administrator’s intervention. For
example, MicroStrategy users can use functions like Chi-squared distribution even if the database does not
support it.
Support For All Available Functions Regardless Of Database Platform When connected to database platforms such as Oracle, IBM, Teradata or SQL Server, MicroStrategy
automatically recognizes the database type and loads the appropriate list of supported functions. When
63THE 5 STYLES OF BUSINESS INTELLIGENCE:
Industrial-Strength Business Intelligence

users run analytical reports, MicroStrategy automatically calculates the results either inside or outside of
the database, depending on the list of supported functions. Market basket or product affinity questions,
for instance, are natural inquiries in a business setting, but extremely difficult to support with other BI soft-
ware. A question like, “For all customers who bought the roadside assistance plan, what are the five other
options most likely to be purchased for the same vehicle,” simply cannot be handled by a cube-based BI
tool. MicroStrategy makes use of automatic collaboration to overcome database limitations, easily con-
structing the analysis at the moment it is requested, with whatever variations are desired. An inquiry like,
“For any car dealers that belong in the top three deciles in sales any month in the last year, return the con-
tact information for those who fell out of the top three deciles last month,” is answered automatically by
MicroStrategy.
The MicroStrategy architecture allows for seamless collaboration between the enterprise data warehouse
and the MicroStrategy platform, taking into account not only the specific database platform, but also its
version. MicroStrategy uses native database functions where they exist and supplements with functions
native to or plugged into the MicroStrategy platform, thereby allowing the most complicated analyses to
be constructed and executed with ease.
6.5 Multi-pass SQL Produces Calculations Not Otherwise Possible
Many normal business questions – those that any business user would likely ask if not constrained by the
limits of a tool – simply cannot be answered with single-pass SQL. That’s why the MicroStrategy SQL
Generation Engine is optimized for multi-pass operation.
Most people would agree that there are sophisticated questions that imply complicated kinds of analysis
requiring multi-pass SQL, like dynamic pricing decisions or logistics optimization problems. However, it
is surprising to many people that there are many cases of business questions that are deceptively easy to
ask, but which can be extremely difficult or impossible to answer without the use of multi-pass SQL.
Take, for example, ranking and contributions. There are two ways to accomplish these simple-to-ask
queries; either by bringing all data back to a cube database in an offline data aggregation process, or by
generating multi-pass SQL that bring the results immediately to the user. The former method, employed
by other BI software, can have severe consequences in terms of query latency and network traffic. The
latter method, employed by MicroStrategy, is optimal. MicroStrategy generates multi-pass SQL, break-
ing the user’s query down into a number of simple queries that are processed separately by the database
and then automatically grouping the results of the separate queries. This multi-step processing can even
be performed in parallel, to the extent that the database is configured to optimize and parallelize these
queries as they arrive.
Multi-pass SQL is the only way to derive answers to questions that involve rankings and contributions. To
identify the relative rankings in a campaign of the top ten salespeople in the northeast region, for exam-
CHAPTER 6
Statistical Analysis and Data Mining
64

ple, the multiple SQL passes are: compute the performance of every salesperson in the campaign, com-
pute the year-to-date sales of every salesperson in the northeast region, rank the salespeople, filter out all
but the top ten, and then rank them relative to the campaign.
Calculations such as product affinity or market basket analysis are very difficult or impossible to do using
other BI software. Cube-based BI architectures are limited in their analytical reach by their inability to
create multi-pass SQL. For example, cube-based BI tools would solve the simple question, “Show me all
the customers and their sales transactions for customers who spent more than $1,000 last year,” with
administrators pre-building cubes grouped by the criterion “$1,000 last year,” thus hard-coding the time
period and amount and vastly limiting the range of analysis. Most BI software cannot calculate market
basket analysis, such as, “Show me the top 10% most profitable customers who bought televisions but did
not buy a DVD player.”
Answers to a broad range of seemingly innocent queries can only be achieved with multi-pass SQL, where
each pass represents a sub-query necessary to calculate the final result. Cube-based BI tools lack the abil-
ity to generate multiple passes of SQL and therefore either cannot support the calculations or must apply
calculations after all the data is returned to the user’s desktop. This limits not only the types of analyses,
but also the size of data sets and the number of columns used in the calculations. By contrast,
MicroStrategy generates optimized multi-pass SQL to perform these calculations in the quickest and most
effective way possible by taking advantage of the database’s strengths.
Automatic and Optimized Generation of Multi-pass SQL MicroStrategy generates multi-pass SQL that is optimized for the specific database being used, enabling
the use of all of the database-supported analytical functions and algorithms. MicroStrategy’s unique
multi-pass SQL generation capability can produce thousands of lines of perfect code in under a second.
The volumes of data in today's data warehouses are too great to be examined directly. For decision-mak-
ers to draw valuable insights, or business intelligence, as they develop new business strategies and imple-
ment them, the information has to be culled and manipulated in various ways. Looking at summaries and
drilling within data subsets or cubes are sufficient for some analyses, but cannot bring the same level of
insight and exposure of certain truths yielded from tapping into the entire database. These hidden or
latent truths can take the form of trends, patterns, and anomalies in the data.
6.6 Statistical Analysis and Data Mining Summary
In the past, organizations used specialized data mining tools to supplement other BI software. Cube-based
BI tools not only lack the advanced analysis capabilities necessary to support Statistical Analysis and Data
Mining, they are not architected to address very large data volumes at all. In addition, few statisticians are
trained to use data mining tools, forcing the majority of business users to wait for assistance to answer their
questions. This process is both inefficient and costly, requiring two different software products – BI and data
65THE 5 STYLES OF BUSINESS INTELLIGENCE:
Industrial-Strength Business Intelligence

mining. BI tools and data mining tools typically are not compatible, access different data sets, and can only
be used by a handful of very skilled users. In addition, the results cannot be consistent if they come from
tool sets with separate business definitions, independent ETL processes, or different data structures.
The MicroStrategy architecture is unique in its ability to overcome these problems, supporting a full range
of Statistical Analysis and Data Mining techniques accessible to all users from the unified Web interface.
Both advanced and novice users can use the comprehensive MicroStrategy Library and benefit immedi-
ately from MicroStrategy’s unique multi-pass SQL generation. Enterprises can also plug in their own cus-
tom-built functions to extend the advanced analysis range of MicroStrategy. Additionally, MicroStrategy
allows enterprises to fully integrate with existing third-party data mining tools. Furthermore, the Micro-
Strategy architecture allows users to apply Statistical Analysis and Data Mining techniques on the fly
against the entire enterprise data warehouse.
CHAPTER 6
Statistical Analysis and Data Mining
66

Report Delivery and Alerting is the Style of BI designed to proactively distribute large numbers of
reports and alerts to potentially very large populations of information consumers – both internal and
external to the enterprise. With such a broad mandate, Report Delivery and Alerting must be highly flex-
ible and functional.
Most BI vendors offer products that support a minimal form of Report Delivery and Alerting. That is,
most BI vendors offer products that can centrally distribute emails to large user populations, with report
enclosures, and on a scheduled basis. The MicroStrategy architecture also supports this minimal function-
ality, but further distinguishes itself by supporting an additional four key areas:
1. Report Distribution Through Any Touchpoint – Email, Printers, File Servers, and Portals
Using HTML, Excel, RTF, PDF, and ZIP containers to carry the report content.
2. Self-subscription as well as Administrator-based Distribution – Allowing companies to
mix centrally-mandated report distributions with individually-driven information needs.
3. Delivery On-demand, On-schedule, or On-event – Triggering the report distribution
through whatever means are most appropriate to the user.
4. Automatic Content Personalization – Making the report more relevant and secure for all users.
The remainder of this chapter discusses each of these areas in detail.
7.1 Report Distribution Through Any Touchpoint
MicroStrategy reports can be automatically distributed through the widest range of user touchpoints on
the market, including email, Web browsers, networked printers, networked file servers, and corporate
portals.
With email distribution, MicroStrategy can display the report contents directly in HTML, or can
enclose the report as an attachment in the form of an Excel, Rich Text Format (RTF), or Portable
69
7REPORT DELIVERY AND ALERTING
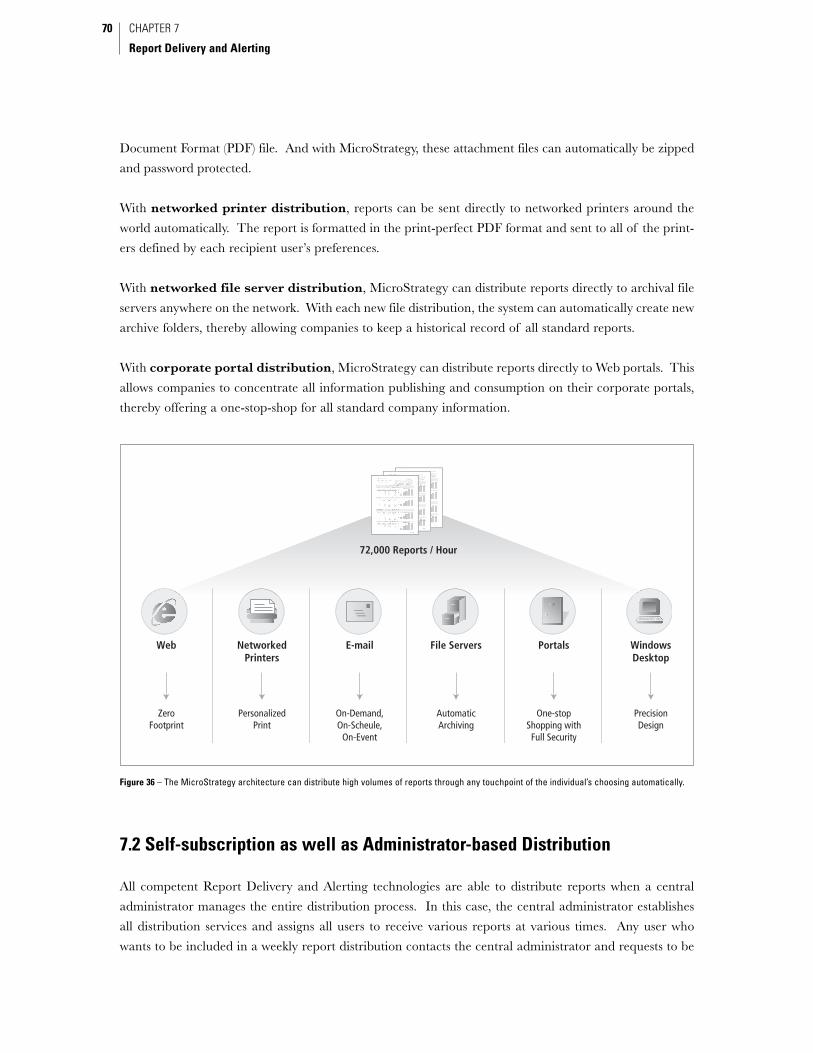
Document Format (PDF) file. And with MicroStrategy, these attachment files can automatically be zipped
and password protected.
With networked printer distribution, reports can be sent directly to networked printers around the
world automatically. The report is formatted in the print-perfect PDF format and sent to all of the print-
ers defined by each recipient user’s preferences.
With networked file server distribution, MicroStrategy can distribute reports directly to archival file
servers anywhere on the network. With each new file distribution, the system can automatically create new
archive folders, thereby allowing companies to keep a historical record of all standard reports.
With corporate portal distribution, MicroStrategy can distribute reports directly to Web portals. This
allows companies to concentrate all information publishing and consumption on their corporate portals,
thereby offering a one-stop-shop for all standard company information.
7.2 Self-subscription as well as Administrator-based Distribution
All competent Report Delivery and Alerting technologies are able to distribute reports when a central
administrator manages the entire distribution process. In this case, the central administrator establishes
all distribution services and assigns all users to receive various reports at various times. Any user who
wants to be included in a weekly report distribution contacts the central administrator and requests to be
CHAPTER 7
Report Delivery and Alerting
70
72,000 Reports / Hour
Web NetworkedPrinters
E-mail File Servers Portals WindowsDesktop
ZeroFootprint
PersonalizedPrint
On-Demand,On-Scheule,
On-Event
AutomaticArchiving
One-stopShopping withFull Security
PrecisionDesign
Figure 36 – The MicroStrategy architecture can distribute high volumes of reports through any touchpoint of the individual’s choosing automatically.
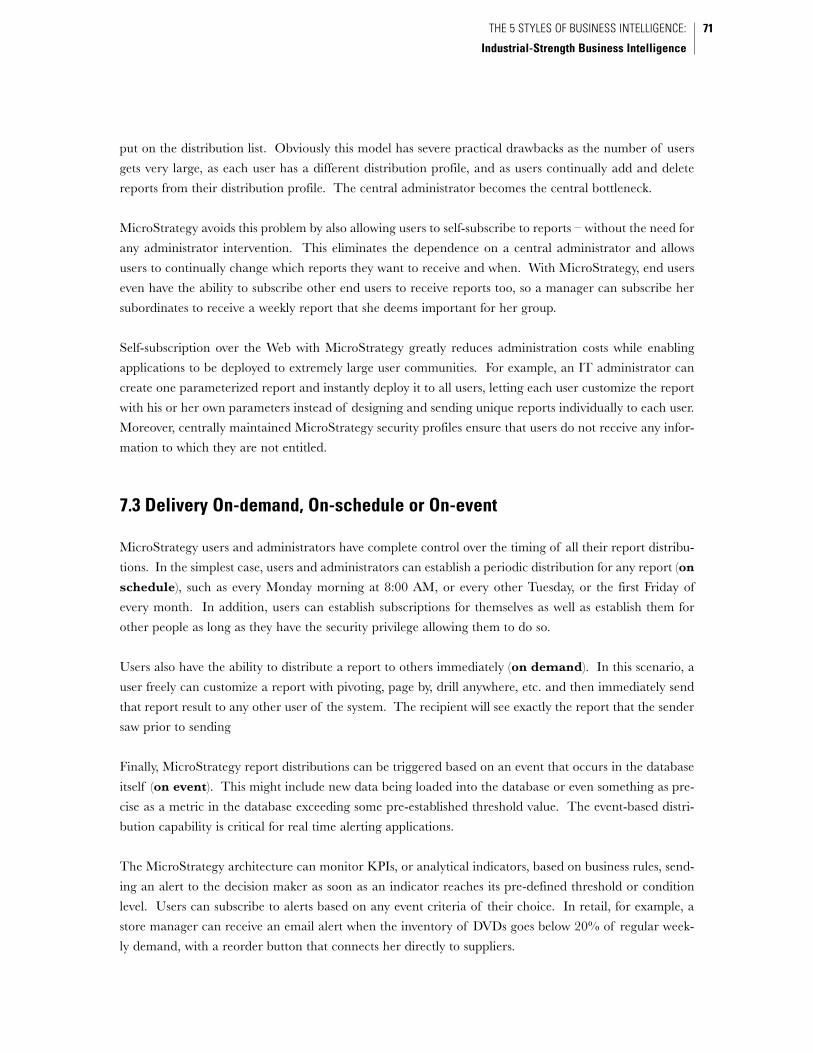
put on the distribution list. Obviously this model has severe practical drawbacks as the number of users
gets very large, as each user has a different distribution profile, and as users continually add and delete
reports from their distribution profile. The central administrator becomes the central bottleneck.
MicroStrategy avoids this problem by also allowing users to self-subscribe to reports – without the need for
any administrator intervention. This eliminates the dependence on a central administrator and allows
users to continually change which reports they want to receive and when. With MicroStrategy, end users
even have the ability to subscribe other end users to receive reports too, so a manager can subscribe her
subordinates to receive a weekly report that she deems important for her group.
Self-subscription over the Web with MicroStrategy greatly reduces administration costs while enabling
applications to be deployed to extremely large user communities. For example, an IT administrator can
create one parameterized report and instantly deploy it to all users, letting each user customize the report
with his or her own parameters instead of designing and sending unique reports individually to each user.
Moreover, centrally maintained MicroStrategy security profiles ensure that users do not receive any infor-
mation to which they are not entitled.
7.3 Delivery On-demand, On-schedule or On-event
MicroStrategy users and administrators have complete control over the timing of all their report distribu-
tions. In the simplest case, users and administrators can establish a periodic distribution for any report (on
schedule), such as every Monday morning at 8:00 AM, or every other Tuesday, or the first Friday of
every month. In addition, users can establish subscriptions for themselves as well as establish them for
other people as long as they have the security privilege allowing them to do so.
Users also have the ability to distribute a report to others immediately (on demand). In this scenario, a
user freely can customize a report with pivoting, page by, drill anywhere, etc. and then immediately send
that report result to any other user of the system. The recipient will see exactly the report that the sender
saw prior to sending
Finally, MicroStrategy report distributions can be triggered based on an event that occurs in the database
itself (on event). This might include new data being loaded into the database or even something as pre-
cise as a metric in the database exceeding some pre-established threshold value. The event-based distri-
bution capability is critical for real time alerting applications.
The MicroStrategy architecture can monitor KPIs, or analytical indicators, based on business rules, send-
ing an alert to the decision maker as soon as an indicator reaches its pre-defined threshold or condition
level. Users can subscribe to alerts based on any event criteria of their choice. In retail, for example, a
store manager can receive an email alert when the inventory of DVDs goes below 20% of regular week-
ly demand, with a reorder button that connects her directly to suppliers.
71THE 5 STYLES OF BUSINESS INTELLIGENCE:
Industrial-Strength Business Intelligence

The Alerting functionality is crucial for uncovering problems with high impact risk but low probability of
occurrence. For instance, in a manufacturing process, defects caused by malfunctioning components can
occur anywhere in the assembly line. As soon as the quality system locates a defective component, the
floor manager gets an alert with the details and a set of actions to fix it. This eliminates the enormous
costs of recall and reassembly, not to mention improved customer satisfaction. The Alerting capability
allows decision makers to fix small issues before they become major problems for the enterprise.
One of the top financial companies in the United States uses MicroStrategy to alert their Client
Relationship managers via email when their clients have made a large deposit. This enables them to get
in touch with individual clients in a timely manner and offer financial services before that money is spent
elsewhere. In another application, one of the world’s leading disk-drive manufacturers uses MicroStrategy
to alert the appropriate plant manager if one of the parts they use to build disk drives is faulty. This min-
imizes the length of the affected run and allows plant managers quickly to choose an alternative, thereby
preventing the production of drives that would need to be fixed or recalled from customers.
In all cases, MicroStrategy users manage their distribution profiles and preferences directly from the Web
interface (Fig. 37). Users can define distribution triggers and delivery touchpoints for any given report dis-
tribution service. Additionally, users can specify their language of choice, time zone, and currency setting.
7.4 Automatic Content Personalization
One of the biggest problems with any report distribution system is making large amounts of general infor-
mation relevant to all recipients. Most people are only interested in a small slice of data contained with-
CHAPTER 7
Report Delivery and Alerting
72
Select the schedule, address, delivery
format, title and personal message,
from the Web and for any report
Monthly Revenue Growth by Distribution Center
Figure 37 – From any Web browser, MicroStrategy users can self-subscribe to receive and send any report based on time and event triggers.
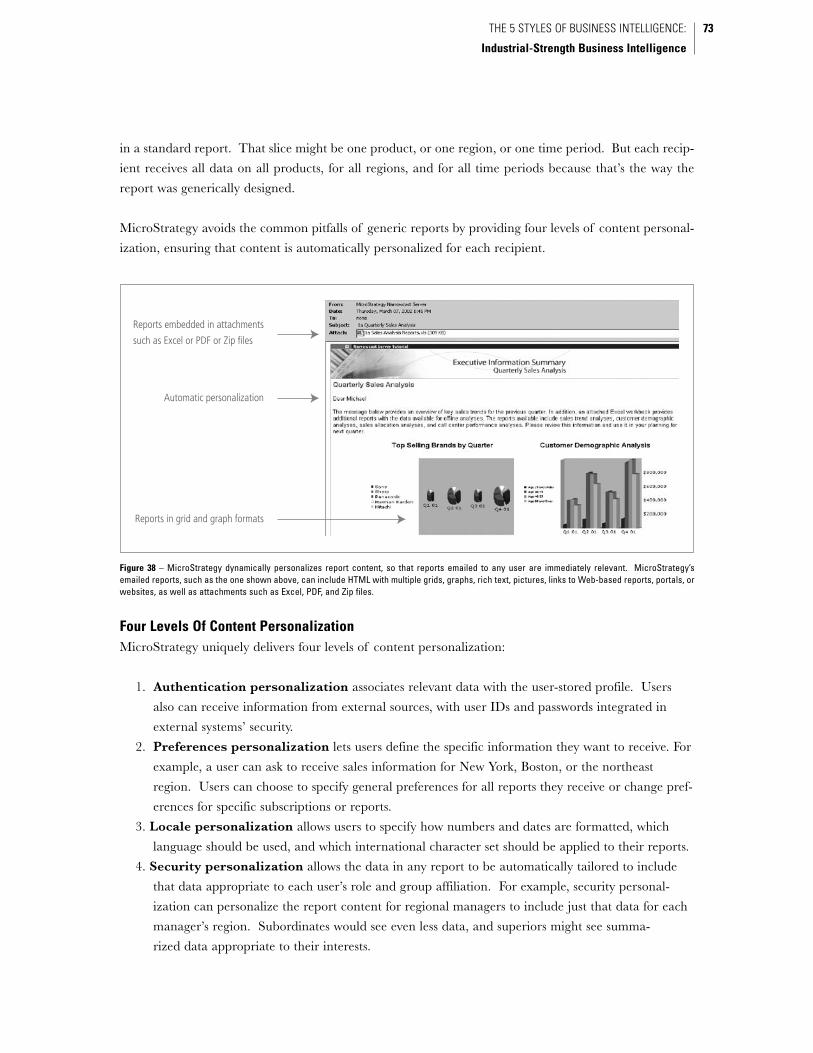
in a standard report. That slice might be one product, or one region, or one time period. But each recip-
ient receives all data on all products, for all regions, and for all time periods because that’s the way the
report was generically designed.
MicroStrategy avoids the common pitfalls of generic reports by providing four levels of content personal-
ization, ensuring that content is automatically personalized for each recipient.
Four Levels Of Content Personalization MicroStrategy uniquely delivers four levels of content personalization:
1. Authentication personalization associates relevant data with the user-stored profile. Users
also can receive information from external sources, with user IDs and passwords integrated in
external systems’ security.
2. Preferences personalization lets users define the specific information they want to receive. For
example, a user can ask to receive sales information for New York, Boston, or the northeast
region. Users can choose to specify general preferences for all reports they receive or change pref-
erences for specific subscriptions or reports.
3. Locale personalization allows users to specify how numbers and dates are formatted, which
language should be used, and which international character set should be applied to their reports.
4. Security personalization allows the data in any report to be automatically tailored to include
that data appropriate to each user’s role and group affiliation. For example, security personal-
ization can personalize the report content for regional managers to include just that data for each
manager’s region. Subordinates would see even less data, and superiors might see summa-
rized data appropriate to their interests.
73THE 5 STYLES OF BUSINESS INTELLIGENCE:
Industrial-Strength Business Intelligence
Reports embedded in attachments
such as Excel or PDF or Zip files
Automatic personalization
Reports in grid and graph formats
Figure 38 – MicroStrategy dynamically personalizes report content, so that reports emailed to any user are immediately relevant. MicroStrategy’semailed reports, such as the one shown above, can include HTML with multiple grids, graphs, rich text, pictures, links to Web-based reports, portals, orwebsites, as well as attachments such as Excel, PDF, and Zip files.

Personalization Minimizes IT CostsIT administrators can choose to secure data
for all reports by individual recipient or to
limit an individual’s data access to specific
reports and objects. With MicroStrategy, pro-
files are dynamically applied to every report
distribution. IT workloads and development
time are greatly reduced because report
designers can build one report that can be
shared by all users, with the assurance that
data will automatically be protected based on
each user’s different security settings (Fig. 39).
For example, a report designer may create a
report with sales data of all regions in the U.S.; this report will show only northeast data when sent to the
northeast manager and only northwest data when sent to the northwest manager.
7.5 Report Delivery and Alerting Summary
Business intelligence should be pervasive throughout an enterprise. Companies need the ability to proac-
tively push information into the hands of users wherever they might be, and through whatever interface is
most appropriate to each person’s usage. To meet this need, MicroStrategy’s Report Delivery and Alerting
style uniquely delivers several critical features:
• Delivered to any user touchpoint – Web, email, printers, file archives, and portals
• Distributions managed by a central administrator
• Distributions managed by end users themselves, based on subscription
• Reports delivered immediately (on demand)
• Reports delivered periodically (on schedule)
• Reports delivered based on a triggering event (on event)
• Reports that are personalized to each user automatically.
MicroStrategy technology accomplishes these extensive capabilities with the highest report throughputs
available today, exceeding 70,000 reports per hour with minimal hardware.
CHAPTER 7
Report Delivery and Alerting
74
Figure 39 – MicroStrategy users can personalize further the content of anyreport by simply answering business questions using parameterized reporting.9
9 Refer to Chapter 3 (Section 3.2) for more information on User-Defined Web Reporting.

MicroStrategy is the only architecture that can deliver all 5 Styles of BI to all users through a single uni-
fied user interface. It is also the only architecture that can deliver all 5 Styles of BI on a unified serv-
ices-oriented backplane.
Single Purpose Style of BI Tools Are Incompatible With Enterprise Strategies Other vendors have distinct and separate software products that singularly provide a Style of BI. Those
single purpose Style of BI tools suffer from isolated development and incompatible platforms, often result-
ing from acquisition of other companies. As a result, tools from one vendor all have distinctly different
user interfaces, as well as a completely different infrastructure for metadata, security, performance man-
agement, and administration.
Is this important? Initially, it’s not important; but it grows to great importance as BI begins to take hold
within an organization. By now, most companies have over a dozen different BI technologies running
within their enterprises. Each technology was originally purchased independently to support a single user
constituency, with a single BI application, and focused on a single Style of BI. At the start, when there is
only a single BI application, users are all working from the same page and talking the same language; and
they only need to learn only one BI interface paradigm.
However, it never stays this clean. It is inevitable that these successful BI applications expand to more
users – as people share the output of their BI application, more and more people want access to that same
power. Furthermore, every successful enterprise is continually deploying more and more BI applications
every day. Eventually, enterprises find themselves in the situation where they no longer have clean islands
of isolated BI. Instead they have large and growing user populations that access multiple BI applications,
and each of those users is dealing with a disorienting array of disparate BI interfaces on their desktops.
They have BI applications with overlapping reporting domains, with each application producing similar
but inconsistent calculations from the others. And they have a large amount of replicated data being
moved into each of these BI applications over and over again.
77
8UNIFIED USER INTERFACE AND UNIFIEDBACKPLANE ARCHITECTURE

Ultimately, the users are frustrated by:
• Complete lack of uniformity of their BI experiences
• Excessive time and effort incurred in training on so many tools
• Varying levels of help they get from IT for their different BI tools
• Inability to compare or combine the results of one report in one application with the results in
another application.
IT is frustrated by:
• Continual complaints about inconsistent reports being generated by multiple tools caused by the
disparate metadata
• Excessive costs and effort to maintain user profiles and adequate security levels consistent across all d
disparate BI technologies
• Excessive cost and effort to manage a multiplicity of vendors – maintenance update deployments,
contracting, technical support
• Excessive effort to manage performance consistently across diverse technologies
• Excessive costs to maintain experts in each of the diverse technologies
• Excessive costs to move the replicated data into each of these disparate systems
The Business is frustrated by:
• All of the above
• Inability to deploy newer BI applications that span multiple Styles of BI
CHAPTER 8
Unified User Interface and Unified Backplane Architecture
78
THE MICROSTRATEGY INDUSTRIAL-STRENGTH BI PLATFORM
MicroStrategy Intelligence ServerMicroStrategyOLAP Services
MicroStrategyReport Services
MicroStrategyNarrowcast Server
RelationalOLAP
AnalyticalEngine
Email / Printers /File Servers
Pixel-PerfectReporting
IntelligentCubes
Ente
rpri
seR
epo
rtin
g
Cu
be
An
alys
is
Stat
isti
cs &
Dat
a M
inin
g
Rep
ort
Del
iver
y&
Ale
rtin
g
Ad
Ho
c Q
uer
y&
An
alys
is
Integrated Backplane
Scalable Server-Centric Architecture
U N I F I E D W E B I N T E R F A C E
U N I F I E D M E T A D A T A A N D S E C U R I T Y
Unified User Interface• No disorientation caused by multiple UIs
• Only one BI paradigm for users to learn
Unified 5 Styles of BI• BI applications can exhibit any or all styles of BI
• All applications behave the same way
Unified Services Backplane• Common Metadata
• Common Security
• Common Prompting
• Common Scheduling
• Common Privilege Control
• Common Administration
• Common Governing
Figure 40 - Only the MicroStrategy architecture supports all 5 Styles of BI, on a single unified backplane, and presented through a single unified user interface.
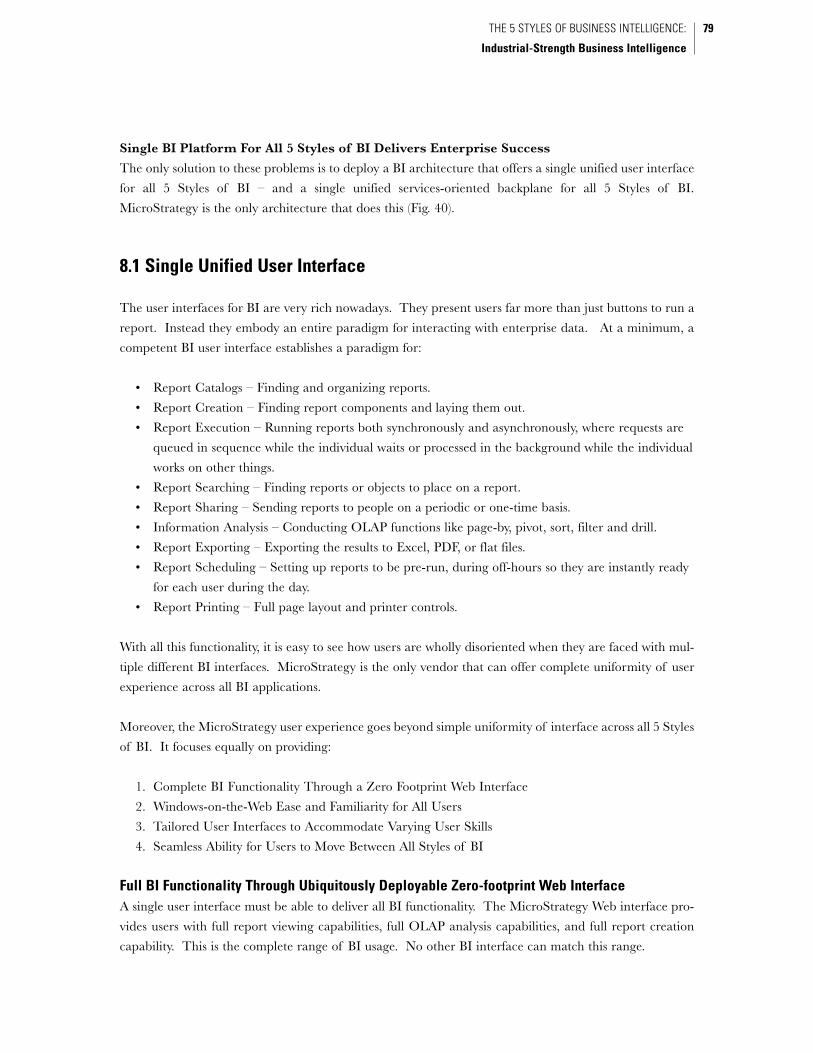
Single BI Platform For All 5 Styles of BI Delivers Enterprise Success
The only solution to these problems is to deploy a BI architecture that offers a single unified user interface
for all 5 Styles of BI – and a single unified services-oriented backplane for all 5 Styles of BI.
MicroStrategy is the only architecture that does this (Fig. 40).
8.1 Single Unified User Interface
The user interfaces for BI are very rich nowadays. They present users far more than just buttons to run a
report. Instead they embody an entire paradigm for interacting with enterprise data. At a minimum, a
competent BI user interface establishes a paradigm for:
• Report Catalogs – Finding and organizing reports.
• Report Creation – Finding report components and laying them out.
• Report Execution – Running reports both synchronously and asynchronously, where requests are
queued in sequence while the individual waits or processed in the background while the individual
works on other things.
• Report Searching – Finding reports or objects to place on a report.
• Report Sharing – Sending reports to people on a periodic or one-time basis.
• Information Analysis – Conducting OLAP functions like page-by, pivot, sort, filter and drill.
• Report Exporting – Exporting the results to Excel, PDF, or flat files.
• Report Scheduling – Setting up reports to be pre-run, during off-hours so they are instantly ready
for each user during the day.
• Report Printing – Full page layout and printer controls.
With all this functionality, it is easy to see how users are wholly disoriented when they are faced with mul-
tiple different BI interfaces. MicroStrategy is the only vendor that can offer complete uniformity of user
experience across all BI applications.
Moreover, the MicroStrategy user experience goes beyond simple uniformity of interface across all 5 Styles
of BI. It focuses equally on providing:
1. Complete BI Functionality Through a Zero Footprint Web Interface
2. Windows-on-the-Web Ease and Familiarity for All Users
3. Tailored User Interfaces to Accommodate Varying User Skills
4. Seamless Ability for Users to Move Between All Styles of BI
Full BI Functionality Through Ubiquitously Deployable Zero-footprint Web InterfaceA single user interface must be able to deliver all BI functionality. The MicroStrategy Web interface pro-
vides users with full report viewing capabilities, full OLAP analysis capabilities, and full report creation
capability. This is the complete range of BI usage. No other BI interface can match this range.
79THE 5 STYLES OF BUSINESS INTELLIGENCE:
Industrial-Strength Business Intelligence

Moreover, the MicroStrategy Web interface accomplishes all of this functionality through a “zero foot-
print” on the web browser. That means the MicroStrategy Web interface avoids JAVA applets and
ActiveX that present dangerous security holes to enterprises. It even avoids the dependency on browser
cookies that are prevalent in all other BI interfaces and are becoming a privacy issue in many countries.
All of this means that the MicroStrategy Web interface can be deployed to anyone, inside the corporate
firewall or outside, without concern about security or concern about which Web browser is being used.
Windows-on-the-Web Interface Is Intuitive and EasyEase of use is paramount in deployments to large user populations. Actions need to be only one click away
– and that one click needs to be in an intuitive place. No help desk can educate thousands of users on
basic BI tasks. MicroStrategy’s Web interface was designed around the idea of providing a Windows-on-
the-Web experience that would be immediately familiar to any user.
Windows-on-the-Web means using the full set of familiar Windows cues and techniques – through the zero
footprint Web interface. That means that users get full use of drag-and-drop mechanics, drop down
menus, context sensitive menus, mouse-over pop-up hints, and right-click options under every element on
a report. All of these things are designed to allow users to easily find the function they need, in ways to
which they are now accustomed from their Windows interface. At the same time, the MicroStrategy Web
interface fully embraces the newer and widely understood Web-centric elements such as navigation bars,
search boxes, and paging increments that can be found in popular Web sites such as Yahoo. If a user
knows how to use Windows and knows how to surf Yahoo, they will know how to use MicroStrategy.
Tailored User Interface Accommodates Varying User Skill LevelsThe MicroStrategy Web interface can be quickly configured to provide just the right set of functionality for
each individual user. Application privileges, such as report creation, drilling, and subscription, can be set on a
per-user or user-group level. This is done easily through role-based user profiles that are established on a cen-
tralized console for all users and groups. As users’ skill levels increase, the central administrator can add more
functionality to individual and group profiles with the simple click of a checkbox on the central console.
Users’ Ability to Seamlessly Move Between All 5 Styles of BIThe MicroStrategy architecture has the ability to mix-and-match Styles of BI in any combination in any
BI application. This means, for example, that a BI application could include scorecards, analysis cubes,
and offer full ad hoc drilling anywhere in the database. Other vendors’ architectures are typically limited
to a single Style of BI, or at most, two Styles of BI.
What this means to the end user is a seamless user experience for all their BI interests (Fig. 41). It means
that users can start in business intelligence by simply consuming enterprise reports, such as a departmen-
tal or individual scorecards. As they gain confidence with the system, and want to explore the informa-
tion more, they can click down to a full pre-defined analysis cube and easily analyze the results from many
different pre-defined directions. It’s still a simple safe environment for novice users, but now with a dis-
tinct ability to sift through the information. As their needs become greater, users can click and seamless-
CHAPTER 8
Unified User Interface and Unified Backplane Architecture
80

ly drill down to surf through the entire data warehouse, down to the transaction level of detail if neces-
sary. Users can apply full statistical treatment to the results using the MicroStrategy Analytic Engine. And
at any time, users can set themselves up to receive alerts for any reports, cubes, and scorecards on a peri-
odic basis or if thresholds are being exceeded.
8.2 Single Unified Backplane
The MicroStrategy architecture supports all 5 Styles of BI on a single integrated and unified services-ori-
ented backplane. This characteristic is unique to the MicroStrategy architecture. No other vendor’s archi-
tecture can offer it.
The hallmarks of this unified backplane architecture are:
1. Mix-and-Match Styles of BI – So that each new Style of BI that is added to the system auto-
matically adds functionality and value to all previously installed Styles of BI, and all previously
built reports and applications.
2. Integrated Services – To achieve great efficiencies and consistency in report design, report
maintenance, user administration, and security administration across all 5 Styles of BI through
use of one unified metadata within the services-oriented architecture.
3. Server-centric Architecture – To achieve high scale and consistently high performance with
great resource efficiencies.
81THE 5 STYLES OF BUSINESS INTELLIGENCE:
Industrial-Strength Business Intelligence
Scorecards & Enterprise Reports
Cube Analysis
Ad Hoc Analysis(Drill Anywhere)
Statistics & Data Mining
Report Delivery & Alerting
DataWarehouse
DataMart
OperationalDatabase
EventBased
ScheduleBased
ThresholdBased
Σ{Rank}
Figure 41 - With the MicroStrategy architecture, users can move seamlessly between all 5 Styles of BI as their needs dictate.

The idea of a common backplane, offering services and integration for independent engines is not new.
The term “backplane” originates in electronics, where backplanes are circuit boards that contain circuit-
ry, sockets, and a communication bus into which additional electronic boards can be plugged to create a
new fully synchronized product. In a BI system, the backplane serves as the common platform into which
enterprises can plug new Styles of BI. It’s this unified backplane that (1) allows users to move freely
between Styles of BI, (2) ensures a single version of the truth with centralized metadata, and (3) supports
very high performance with efficient management.
With MicroStrategy, the Styles of BI are designed as plug-and-play modules. This way, enterprises can
deploy only the Styles of BI they need, when they need them; and those enterprises can expand with addi-
tional Styles of BI over time as the applications grow and users’ skills are ready for it.
Mix and Match All Styles of BIMicroStrategy’s unified backplane design ensures that the new functionality embodied in each added Style
of BI enhances the capabilities of all existing Styles of BI in use, adding functionality to all reports and
applications that are currently being used. For example, when the Report Delivery and Alerting style is
added to the backplane, users can immediately begin scheduling, subscribing, and emailing any existing
report in the system. When the Cube Analysis style is added, any existing report can immediately behave
like a full analysis cube with full cube functionality.
Enterprises can start with one Style of BI and then, as users need them, add new Styles of BI, at any time
CHAPTER 8
Unified User Interface and Unified Backplane Architecture
82
INTEGRATED SERVICES
MIX-AND-MATCH ALL 5 STYLES OF BI
SERVER-CENTRIC ARCHITECTURE
Common MetadataCommon PromptingCommon Scheduling
Common SecurityCommon Administration
Common Privileges
ClusteringHot Failover
Auto Resource Allocation
Database GoverningVLDB Optimization
Multi-pass SQL Engine
Multi-level CacheLoad-Leveling
Multi-threading
Statistics &Data Mining
AnalyticEngine
∑
U N I F I E D W E B I N T E R F A C E
Delivery &Alerting
NarrowcastServices
CubeAnalysis
OLAPServices
Ad HocAnalysis
ROLAPEngine
EnterpriseReporting
ReportServices
Figure 42 - MicroStrategy’s unified services-oriented backplane allows complete mixing and match-ing of any and all Styles of BI.
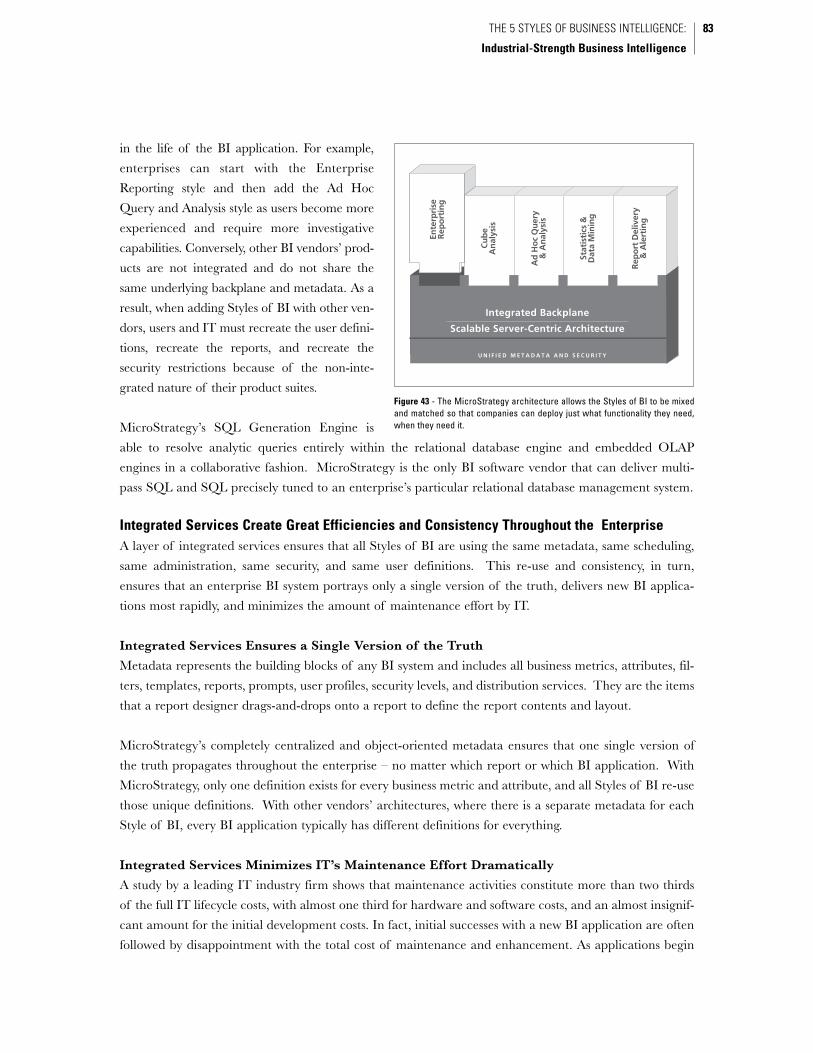
in the life of the BI application. For example,
enterprises can start with the Enterprise
Reporting style and then add the Ad Hoc
Query and Analysis style as users become more
experienced and require more investigative
capabilities. Conversely, other BI vendors’ prod-
ucts are not integrated and do not share the
same underlying backplane and metadata. As a
result, when adding Styles of BI with other ven-
dors, users and IT must recreate the user defini-
tions, recreate the reports, and recreate the
security restrictions because of the non-inte-
grated nature of their product suites.
MicroStrategy’s SQL Generation Engine is
able to resolve analytic queries entirely within the relational database engine and embedded OLAP
engines in a collaborative fashion. MicroStrategy is the only BI software vendor that can deliver multi-
pass SQL and SQL precisely tuned to an enterprise’s particular relational database management system.
Integrated Services Create Great Efficiencies and Consistency Throughout the EnterpriseA layer of integrated services ensures that all Styles of BI are using the same metadata, same scheduling,
same administration, same security, and same user definitions. This re-use and consistency, in turn,
ensures that an enterprise BI system portrays only a single version of the truth, delivers new BI applica-
tions most rapidly, and minimizes the amount of maintenance effort by IT.
Integrated Services Ensures a Single Version of the Truth
Metadata represents the building blocks of any BI system and includes all business metrics, attributes, fil-
ters, templates, reports, prompts, user profiles, security levels, and distribution services. They are the items
that a report designer drags-and-drops onto a report to define the report contents and layout.
MicroStrategy’s completely centralized and object-oriented metadata ensures that one single version of
the truth propagates throughout the enterprise – no matter which report or which BI application. With
MicroStrategy, only one definition exists for every business metric and attribute, and all Styles of BI re-use
those unique definitions. With other vendors’ architectures, where there is a separate metadata for each
Style of BI, every BI application typically has different definitions for everything.
Integrated Services Minimizes IT’s Maintenance Effort Dramatically
A study by a leading IT industry firm shows that maintenance activities constitute more than two thirds
of the full IT lifecycle costs, with almost one third for hardware and software costs, and an almost insignif-
cant amount for the initial development costs. In fact, initial successes with a new BI application are often
followed by disappointment with the total cost of maintenance and enhancement. As applications begin
83THE 5 STYLES OF BUSINESS INTELLIGENCE:
Industrial-Strength Business Intelligence
Integrated Backplane
Scalable Server-Centric Architecture
U N I F I E D M E T A D A T A A N D S E C U R I T Y
Cu
be
An
alys
is
Ad
Ho
c Q
uer
y&
An
alys
is
Stat
isti
cs &
Dat
a M
inin
g
Rep
ort
Del
iver
y&
Ale
rtin
g
Ente
rpri
seR
epo
rtin
g
Figure 43 - The MicroStrategy architecture allows the Styles of BI to be mixedand matched so that companies can deploy just what functionality they need,when they need it.

to grow to hundreds or thousands of users, and incorporate ever-greater numbers of reports, the difficul-
ty of maintaining these proliferating applications becomes complex, overwhelming and expensive. This is
typical of single purpose Style of BI tool kits with multiple metadata for each different Style of BI. In time,
the multiple applications with multiple metadata can act like a barrier to further innovation out of fear of
disrupting what is in place.
MicroStrategy’s metadata is fully object oriented so that every object inherits the characteristics of the
object embedded into it. This allows MicroStrategy users to build otherwise complex objects by using
smaller simpler objects. If any object definition changes, then every object dependent on that simpler
object will automatically change as well. For example, if the definition of the profit metric includes a fil-
ter object, which in turn includes a sales metric object, then any change to the sales metric object will auto-
matically ripple through the filter object and the profit metric. This is a huge benefit to IT organizations
who are tasked with maintaining the internal consistency and integrity of so many business definitions.
For example, the Top Stores Filter (Fig. 44) includes the set of all stores whose sales exceed average store
sales by two standard deviations. This filter can be used with any other object within the MicroStrategy
platform, such as within a report, within a business metric definition, within another filter, and within a
user prompt. This greatly minimizes the workload of administrators since they only create an object once
and can use it as many times as needed with other metadata objects.
Integrated Services Speeds Application Development Times
The ability to re-use any object or service within the integrated services architecture ensures that each new
CHAPTER 8
Unified User Interface and Unified Backplane Architecture
84
Selection on a Report Prompt
GraphCriterion
ReportCriterion
Part of Security Profile
Embedded in Another Filter... and then...Top Stores Filter
Part of Subscription Preference
Embedded in aBusiness Metric Σ (1/x)
1
8
Figure 44 - MicroStrategy’s metadata is fully object oriented allowing complex objects to be made of smaller simpler objects in an arbitrarily flexible way.If any object definition changes, then all objects dependent on the changed object will also be changed automatically.

application requires less time and less effort to assemble than the previous ones. Each new application can
re-use the attribute definitions, user profiles, filters, prompts, metrics, and security from all prior applica-
tions to speed along the development. The more applications a company has with MicroStrategy, the
faster each new application is to develop.
Server-centric Architecture – Achieves the High Scale with Consistently High Performance andGreat Resource EfficienciesAs enterprise BI applications become more popular and successful, the number of users can easily increase
to thousands, with large numbers of reports and data volumes. As a result, single purpose Style of BI tool
kits, which were designed for small number of users, typically face rapidly deteriorating performance. In
addition, the stability of the system is greatly affected, and hence the availability of the overall BI system.
The MicroStrategy architecture is server-centric – it is designed to solve these performance and availabil-
ity problems and support all 5 Styles of BI. By providing rock-solid services across all Styles of BI,
MicroStrategy has been able to perfect the operational characteristics of an enterprise-caliber BI system
with capabilities like native clustering, multi-level caching, load balancing, performance governing and pri-
oritization, optimized SQL generation, and fail-over capabilities.
All of these add up to a superior ability to support consistently high performance of mission-critical 24 x
7 operation at any scale.
Server-centric Backplane Delivers Superior Load Balancing For Increased Performance and
Stability
An important benefit of built-in clustering in the MicroStrategy architecture is the ability to spread the load
of all users across the available hardware servers. Rather than purchasing dedicated hardware infrastruc-
ture for each of the Styles of BI, a unified BI backplane allows the efficient use of hardware investments.
MicroStrategy’s load balancing ensures that user sessions are automatically distributed across multiple
85THE 5 STYLES OF BUSINESS INTELLIGENCE:
Industrial-Strength Business Intelligence
MicroStrategy Integrated ApproachDeclining Investment for each BI Application
No User Training Costs
Reuse Logical Model, Metris, Attributes
Reuse Security Profiles
No Additional Software Acquisition
No Additional IT Staff
Incr
emen
tal C
ost
Per
Pro
ject
SalesAnalysis
FincancialReporting
ProductAnalysis
HRAnalysis
CRMAnalytics
SupplyChain
Seperate Technology for Each BI ApplicationFixed Investment for each BI Application
Incr
emen
tal C
ost
Per
Pro
ject
# Applications
SalesAnalysis
FincancialReporting
ProductAnalysis
HRAnalysis
CRMAnalytics
SupplyChain
User Training
ETL & LogicalModel Setup
Security Setup
Hardware &Sofware Costs
Deployment &Maintenence
Figure 45 - Each new BI application takes less time, less effort, and less cost with MicroStrategy because of MicroStrategy’s ability to reuse all previ-ously-built components, such as metrics and security profiles.

servers, allowing the processing to be carried
out by multiple servers simultaneously (Fig.
46). In addition, clustering allows enterprises
to preserve their investment by starting with a
small server implementation and adding hard-
ware incrementally as the number of users
increases. As a result, the initial investment in
hardware is always preserved and perform-
ance is always optimum.
Server Centric Backplane Delivers Automatic Fail-over for 24x7 Operations
Providing high availability and maximum reliability is a crucial requirement when implementing enter-
prise-class BI systems for day-to-day business decision-making (Fig. 47). The failover system must work the
same for all Styles of BI to ensure 24x7 operations for all BI applications.
MicroStrategy has a history of supporting enterprise requirements, and was the first to deliver a high avail-
ability, fault-tolerant BI architecture. Armed with an infrastructure that provides support for hot standby,
automatic fail-over, and clustering, MicroStrategy customers enjoy uninterrupted BI operations. In the
event of a hardware or software failure, users are automatically routed to available hardware or software
in the cluster. These capabilities are integrated in the server-centric MicroStrategy architecture and avail-
able out of the box.
Server-centric Backplane Supports Shared Caching Across All BI Styles For Fastest
Performance
As the number of queries processed by the system grows over time, the likelihood that the same slice of
information is requested more than once increases rapidly. A very effective way to increase the query per-
formance, while reducing overall system usage, is to use caches. A cache is merely a piece of data that, in
order to be quickly retrieved, is stored in a more readily used format than its source.
MicroStrategy caching let users perform speed-of-thought analysis since the report data is automatically
retrieved from the central cache, without the need to access the database. Furthermore, all cached data is
CHAPTER 8
Unified User Interface and Unified Backplane Architecture
86
33% 33%
SynchSynch
33% 50% 50%
Synch
Figure 47 – Workload is automatically transferred from a failed cluster node to another to ensure 24x7 operations.
33% 17%
SynchSynch
50%
Figure 46 – The workload is automatically distributed across clusters based onthe hardware processing power.

automatically synched with the database. Caches can be refreshed based on time-schedules, alert triggers,
such as a data warehouse load, or manually. Additionally, MicroStrategy uses a smart 4-level caching
architecture shared across all BI styles: caching of reports, caching of business attribute elements, XML
caching, and BI objects caching. This caching architecture has the counter-intuitive effect of improving
performance with more users that access the system. No other BI tool in the industry currently provides
this advanced capability. Since caches can be shared between all the clustered servers, any request for data
from any server can be matched against available caches in the cluster, making performance even faster.
Server Centric Backplane Delivers Streamlined Centralized Administration
With MicroStrategy, companies can manage all of their BI applications, regardless of style, from a single
centralized console. MicroStrategy administrators can monitor and analyze the real-time use and per-
formance of the BI system, tune the system appropriately, deploy new projects rapidly and easily manage
large BI implementations with scripts, all from a central location.
MicroStrategy lets administrators determine how the application is being used, application performance
and report usage. MicroStrategy provides real-time information that displays statistics about key activities
and usage data for all applications. Leveraging these statistics with rich historical views of the system,
administrators can quickly distinguish temporary anomalies in usage and performance, that are of mini-
mal importance from trends that may have a wider impact on the system. These statistics include infor-
mation on all BI objects, number of users logged to the system, their detailed actions, current executing
queries, scheduled reports, caches, queries with errors, database connections and more. For example, with
this information administrators can understand which reports are most frequently run, what caches are
most frequently hit, and execution times of reports. Administrators can then determine which reports
need to be cached or where Intelligent Cubes can most effectively be used. Running a real enterprise-cal-
iber BI system is more complex than populating and distributing cubes as with departmental-caliber tools;
it requires the same kind of coordination from an administrator's console as other enterprise applications.
ConclusionThe MicroStrategy architecture is unique in the BI industry.
• It is the only architecture that supports all 5 Styles of BI in a mix and match fashion, allowing
customers to implement just the functionality they need, whenever they need it.
• It is the only architecture that delivers all 5 Styles of BI through a unified user interface that is
simple enough for novice users, and powerful enough for the most advanced users.
• It is the only architecture that delivers all 5 Styles of BI on a single unified backplane that
ensures rapid development time, minimum maintenance effort, a single version of the truth
throughout the enterprise, and 24 x 7 operation.
Ultimately, the MicroStrategy architecture is future-proof. Companies can start small with limited func-
tionality and limited scale, but can grow to include all BI functionality, with the highest scalability, highest
performance and best reliability.
87THE 5 STYLES OF BUSINESS INTELLIGENCE:
Industrial-Strength Business Intelligence

COPYRIGHT NOTICE Copyright ©2002 MicroStrategy Incorporated, 1861 International Drive, McLean, Virginia, 22102 U.S.A. All rights reserved.
The material presented herein is based on information we consider reliable. We do not represent that it is accurate and complete. No person should consider our distribution of this material as mak-ing any representation or warranty with respect to such material and should not rely upon it as such.
TRADEMARKS: MICROSTRATEGY, STRATEGY.COM, INTELLIGENT E-BUSINESS, MICROSTRATEGY WEB BUSINESS ANALYZER, MICROSTRATEGY ECRM 7, MICROSTRATEGY WEB, MICROSTRATEGY TELE-CASTER, MICROSTRATEGY AGENT, MICROSTRATEGY WORLD, MICROSTRATEGY INTELLIGENCE SERVER, MICROSTRATEGY BROADCASTER, MICROSTRATEGY ARCHITECT, MICROSTRATEGY ADMINIS-TRATOR, MICROSTRATEGY INFOCENTER, MICROSTRATEGY SDK, MICROSTRATEGY TRANSACTOR, MICROSTRATEGY 7, MICROSTRATEGY 7i, BEST IN BUSINESS INTELLIGENCE, THE SCALABLE BUSINESSINTELLIGENCE PLATFORM BUILT FOR THE INTERNET, THE INTEGRATED BUSINESS INTELLIGENCE PLATFORM BUILT FOR THE ENTERPRISE, MICROSTRATEGY BUSINESS INTELLIGENCE PLATFORM, THEPLATFORM FOR INTELLIGENT E-BUSINESS, THE POWER OF INTELLIGENT E-BUSINESS, THE FOUNDATION FOR INTELLIGENT E-BUSINESS, INTELLIGENCE THROUGH EVERY PHONE, PERSONALIZED INTEL-LIGENCE PORTAL, INTELLIGENCE TO EVERY DECISION MAKER, APPLICATION DEVELOPMENT AND SOPHISTICATED ANALYSIS, CENTRALIZED APPLICATION MANAGEMENT, RAPID APPLICATION DEVEL-OPMENT, PERSONAL INTELLIGENCE NETWORK, MICROSTRATEGY 6, MICROSTRATEGY CONSULTING, MICROSTRATEGY EDUCATION, MICROSTRATEGY SUPPORT, DSS BROADCASTER, ESTRATEGY, ETELE-CASTER, EBROADCASTER, THE INTELLIGENCE COMPANY, THE E-BUSINESS INTELLIGENCE PLATFORM, CHANGING THE WAY GOVERNMENT LOOKS AT INFORMATION, DSS TELECASTER, THE POWER OFINTELLIGENT E BUSINESS, DSS BROADCASTER SERVER, DSS SUBSCRIBER, INFORMATION LIKE WATER, DSS AGENT, DSS ARCHITECT, DSS WEB, DSS SERVER, DSS OFFICE, QUERY TONE, QUICKSTRIKE,INSIGHT IS EVERYTHING, ALARM, ALARM.COM, ANGEL, ANGEL.COM, TELEPATH INTELLIGENCE, TELEPATH INTELLIGENCE, TELEPATH, ECASTER, ALERT.COM AND IWAPU ARE EITHER TRADEMARKS ORREGISTERED TRADEMARKS OF MICROSTRATEGY INCORPORATED IN THE UNITED STATES AND CERTAIN COUNTRIES. OTHER PRODUCT AND COMPANY NAMES MENTIONED HEREIN MAY BE THE TRADE-MARKS OF THEIR RESPECTIVE OWNERS.
COLL-0526


