
3
THE 2001 CENSUS IN WESTMINSTER
INTERIM REPORT
Statistics Commission Report No 15October 2003

Statistics Commission
THE 2001 CENSUS IN WESTMINSTER
INTERIM REPORT
October 2003
Statistics Commission 10 Great George Street London SW1P 3AE 020 7273 8008 www.statscom.org.uk © Crown Copyright 2003

This page is blank
ii

FOREWORD BY THE CHAIRMAN OF THE STATISTICS COMMISSION This interim report touches on an issue of fundamental importance to the future of official statistics. We know that conducting surveys in many countries – and certainly in Britain – is proving harder as society changes. People seemingly feel less inclined to co-operate or are more difficult to access. In these circumstances, a modern, survey-based Census, using the latest methods, may not be able to cope with the challenge of enumerating the most ‘hard to count’ areas of England and Wales. That has important implications. The 2001 Census was in many respects the most sophisticated ever conducted. Yet evidence we have examined on the use of One Number Census methodology in 2001 indicates that, when the initial enumeration misses as much of the resident population as it did in Westminster, even sophisticated estimation techniques may not entirely compensate for the initial absence of reliable data. In simple terms, there is too much uncertainty about the final results in the ‘most hard to count’ areas. The work undertaken by, and on behalf of, the Statistics Commission leads us to the conclusion that the results of the 2001 Census in Westminster City Council’s area are substantially less reliable than implied by the published confidence intervals. These ranges only capture the uncertainty associated with the sampling involved in the process. Many other sources of uncertainty are present but are much less readily quantified. The Office for National Statistics did not have enough reliable information available to provide a confident estimate in this case. We believe that the problems of estimation were compounded by the fact that the concept of ‘usually resident population’ is particularly difficult to measure in the centre of one of the world’s major cities. Some of the organisations most concerned about this problem, notably Westminster City Council, are convinced that the official estimates for their areas are too low. Because of the uncertainties in the estimates, we cannot say whether or not they are right. The published estimates for Westminster remain possible, though they are towards the bottom of a wide range of plausible estimates. Further research which is now being undertaken may throw more light on this question in the coming months. However, we can now make several important recommendations for the future and these are set out in the report. They are not just recommendations for the Office for National Statistics. They require a concerted effort across central and local government and we believe they should be given urgent attention.
Professor David Rhind Chairman, Statistics Commission
iii

Statistics Commission
THE 2001 CENSUS IN WESTMINSTER – INTERIM REPORT
Summary of Conclusions 1. The 2001 Census was conducted according to the best methodology
available for a conventional Census; but the method failed to cope adequately with the most extreme circumstances.
2. There is greater uncertainty about the Westminster results than is
reflected in the published confidence intervals. 3. Some of the judgements made in advance of the Census about dealing
with ‘hard to count’ areas are open to question. 4. A more multi-lateral approach to population estimates is needed in future.
Summary of Recommendations 1. ONS should revisit the Westminster population estimates. 2. A 2006 population count should be pursued, at least for the areas that
proved most difficult to count in the 2001 Census. In practice this likely to mean some areas of inner London.
3. The quality of migration data should be addressed with urgency. 4. A national address register should be a priority for government. 5. ONS should do more to explain their methods. 6. Government should address its data requirements more systematically. 7. Other measures of population should be developed as alternatives to
‘usually resident’ population.
Introduction The 2001 Census estimated the population of Westminster at 181,286. Westminster
City Council has argued that this figure is substantially too low and has presented
various evidence to support its case. The Statistics Commission has undertaken a
review of the issues, the evidence and the research undertaken by other parties.
1

This is an interim report. Set out below are the Commission’s initial conclusions and
recommendations. We will publish a final report once we have considered the results of
further research currently being undertaken under the joint sponsorship of Westminster
City Council and the Office for National Statistics. This research involves the systematic
matching of addresses used in the Census enumeration with those from local
administrative sources and examination of the reasons for any ‘unmatched’ addresses.
The results are expected to be available in January or February 2004.
Whilst the ongoing research may lead to some strengthening of our conclusions and
recommendations, the Commission believes it will be helpful to the interested parties to
set out our interim conclusions at this time because:
• a considerable period has passed and there would be little benefit in further delay
• other than the address-matching study, we believe that virtually all that can be
known is now known about the way in which the Census was conducted
• one of our main recommendations – relating to the need for a 2006 population
count – will be facilitated by preparatory actions taken regardless of the outcome.
Of the hundreds of local authority areas covered by the Census in England and Wales,
only the results for Westminster have been examined in detail by the Commission. We
decided to look closely at this case both because Westminster approached the
Commission for advice and because it is the extreme case when the difference between
the previously published estimates of population (the Mid-Year Estimates) and the 2001
Census figures are compared (see Figure 1).
Westminster was also one of the local authority areas with the lowest coverage in the
initial Census count (Figure 2) and this characteristic – as we show in Paper 1 – has an
important influence on the calculations needed to estimate the missing population.
However, although the focus of the report is on Westminster, our recommendations take
account of the possibility that results for some other local authority areas may have been
subject to similar difficulties. In practice, the problems of large disparities between
Census and previously predicted populations, and of low Census response rates are
largely concentrated on certain London boroughs. The lowest 14 response rates in
England and Wales were in London boroughs.
2

Figure 1. This chart gives percentage differences comparing 2001 Census results with 2000 Mid Year Estimates for English local authorities. The differences are ranked from those where the
Census results were most below the MYE to the converse.
Percentage Population Change 2001 Census vs Original 2000 Mid Year Estimates English Local Authorities
-30
-25
-20
-15
-10
-5
0
5
10
15
Local Authority
% C
hang
e
Source ONS: www.statistics.gov.uk/census2001/downloads/Comparison_ONC2001_MYE2000.xls
City of London
12.8
West-minster
-25.9
Figure 2: Local authority areas with the lowest Census response rates – England & Wales 2001
KenHacCityWeTowHamCamSouIslinLamBreNewLewHarSloEalGreCerLutoBarRedCroRusWaMerLiveWaEnf
Source ONS: www.statisti
Local authority area response rate
sington and Chelsea 64% kney 72% of London 74% stminster 74% er Hamlets 76% mersmith and Fulham 76% den 77%
thwark 77% gton 78% beth 79%
nt 79% ham 80% isham 81% ingey 83% ugh UA 85% ing 85% enwich 86% edigion 86% n UA 86%
king & Dagenham 86% bridge 87% ydon 87% hmoor 88% ltham Forest 88% ton 88% rpool 89%
ndsworth 89% ield 89%
cs.gov.uk/census2001/downloads/responserates.xls
3

Conclusions
1. The 2001 Census was conducted according to the best methodology available for
a conventional Census; but the method failed to cope adequately with the most
extreme of circumstances
The Statistics Commission has concluded that the One Number Census (ONC) methodology
was the best available at that time for a conventional Census. No alternative approach, that
would have been viable in 2001, would have produced more reliable results overall. Indeed,
it seems likely that – in more difficult circumstances for field work than ever before – the
2001 Census overall was significantly better than its most recent predecessors.
A substantial effort was made by the Office for National Statistics to predict difficulties in
advance and take precautionary measures to limit their impact. In the case of Westminster
there were however some greater than foreseen problems with the fieldwork which
contributed to low coverage in the initial count and uncertainty in the final estimates.
The Census figures are not straightforward counts. The initial Census counts, made during
the enumeration process, were augmented by estimates of the number of people missed in
the initial count. These estimates were derived mainly from a separate Census Coverage
Survey (CCS) conducted a few weeks after the Census itself. The CCS was one of the
largest sample surveys ever conducted in the UK.
Further adjustments were then made to the resulting estimates to compensate for lack of
statistical independence between the Census and CCS. In the case of Westminster the
controversy surrounding the population estimates centres mainly on this second set of
adjustments. Paper 1 discusses the calculations for Westminster and explains the nature of
the adjustments.
In publishing the Census population figures, the Office for National Statistics gave statistical
confidence intervals for its estimates. It is important to understand that a confidence interval
does not represent the upper and lower limits for the estimate. It is rather a range which will
include the true value in about 19 cases out of 20, on the basis of probability. In the case of
Westminster the published confidence interval was between 173,000 and 190,000. This
range does not take into account factors other than statistical variation due to the sample
nature of the Census Coverage Survey. Consideration of these other factors suggests that
4

the possible ‘true range’ within which the Westminster population falls is larger – and this
leads to the next conclusion.
2. There is greater uncertainty about the Westminster results than is reflected in the
published confidence intervals
It is impossible to know the population of Westminster on Census night in 2001 with
certainty. The accuracy of all estimates depends on the methods used and the local
circumstances. The evidence we have seen convinces us that the One Number Census
methodology, and indeed any such survey-based census methodology, is liable to work
imperfectly in the most extreme circumstances.
The analysis of the calculations for Westminster set out in Paper 1 shows that the process of
adjusting the initial Census count involved steps that relied on uncertain information, and
that the level of uncertainty was substantially amplified due to Westminster’s low response in
the initial enumeration. Because of the nature of assumptions made in the calculation, the
estimate is much more likely to be too low than too high. The range of plausible alternative
estimates includes values substantially above the published estimate. However, in the
absence of persuasive evidence to support any particular alternative figure, the Statistics
Commission is not able to identify any one figure as being preferable to the published
estimate.
The Commission has considered carefully the arguments put forward by Westminster City
Council to suggest that the true figure lies above the published range, and the arguments put
forward by the Office for National Statistics for assuming that the true figure is within the
range. It has been suggested, for example, that ONS used an incomplete list of residential
addresses for the Census enumeration in Westminster and that this led to too low an
estimate. However, an incomplete address list would not necessarily have this effect as long
as the rest of the Census methodology correctly captured the problem and corrected for it –
and there is no simple way of knowing whether this happened. The extent to which
weaknesses of this kind were present in the case of Westminster, and then not corrected for
appropriately in the later stages of estimation, is the subject of the address-matching study.
As a footnote to this conclusion, it is a fact that whatever the true population in Westminster
on Census night, the population now – 2 years later – could be significantly different. The
churn in population in inner urban areas, and especially in Westminster, is high, with up to a
5
quarter of the electorate on the electoral register changing annually. We know that methods
currently used for measuring migration into and out of the UK, and between local authority
areas, are unreliable. Particularly unreliable are the estimates of international emigration
and immigration into and out of Central London. Without improved methods, up-dating
population census figures is liable to error. Add to this the difficulty of measuring ‘the usually
resident population’ in such areas and the merits of seeking other ways to complement the
Census becomes evident. It is also questionable whether ‘usually resident population’
actually measures an appropriate population base to inform certain key decisions, such as
the allocation of local government funding or health needs-related expenditure.
3. Some of the judgements made in advance of the Census about dealing with ‘hard
to count’ areas are open to question
The Commission has some reservations about the judgements made in advance of the
Census on the special measures to be taken to cope with the hardest to count areas such as
Westminster. Though several London boroughs offered help to carry out the Census based
on their local knowledge, the Office for National Statistics took the view that this would not
be appropriate because local authorities had a vested financial interest in the population
count. Whilst statistical work must not be open to influence by anyone likely to benefit, or
lose out, depending on the results, the loss of local knowledge was – as it transpired – a
high price to pay.
It would be wrong, though, to give the impression that there was no co-operation.
Westminster offered paid leave to Council staff to work as enumerators after discussion with
ONS. Despite this degree of co-operation, the Commission believes that discussions
between ONS, the Local Government Association and local authorities, and actions arising
from these discussions, could have gone further and the most hard to count local authority
areas could have had their own samples in the Census Coverage Survey. Addressing these
points would not necessarily have led to different estimates, but it might very well have lent
greater authority to the estimates.
4. A more multi-lateral approach to population estimates is needed in future
The Statistics Commission has concluded that the practice of conducting a Census
according to rules that severely restrict the involvement of outside agencies and alternative
information sources should in future be modified. A more multi-lateral approach should draw
on as much relevant evidence as possible, but with strict controls to prevent partisan
6

interests affecting the results. We recognise that this may require legislative changes and
may not have been an option for the 2001 Census.
We also believe that ONS did not communicate with interested parties as effectively as it
might have. Though there was much consultation prior to the Census and numerous
documents available on the ONS website, many of these were highly technical and, in some
respects, incomplete. The considerable efforts ONS made to validate the population
estimates in each local authority area against diagnostic ranges – that is, to check Census
results against alternative information sources such as administrative records – were not
described in written form until a year after the first results were released.
We understand the scale of the efforts made to carry out the Census, but we believe that
ONS should in future devote more resources to dealing with non-expert representatives of
local authorities and other public bodies and see the job of developing wide understanding of
the methods to be used as an essential element in the preparations for a Census. There is
however also an obligation upon the user community, including local authorities, to ensure
that they understand what is proposed and that this understanding extends to elected
members as well as technical staff.
Recommendations
1. ONS should revisit the Westminster population estimates
The Office for National Statistics should revisit the Westminster population estimates when
the results of the further research are known (about January 2004) and consider the
implications of this work for the estimates for other local authority areas. We do not expect
ONS to negotiate a revised figure with Westminster City Council but would expect the parties
to continue to try to reach agreement on the implications of the research findings. Revised
mid-2001 population estimates were released on 26 September resulting in the mid-year
estimate for Westminster being increased by 4,700, but these adjustments are not directly
related to the issues we raise about the estimation of the odds ratio (see Paper 1).
We are concerned that revisions to the Mid-Year Estimates for 2001 and subsequent years
may further distance these figures from the published Census figures, and thus lead to
undermining both the value of Census figures and public confidence in the more recent
7

estimates. We ask ONS to review their decision not to adjust the Census figures in the most
difficult to estimate areas.
2. A 2006 population count should be pursued, at least for the areas that proved
most difficult to count in the 2001 Census. In practice this is likely to mean some
areas of inner London
The Statistics Commission recommends that further survey work should be undertaken, at
least in those areas of the country that presented the greatest difficulties, using updated
methodology which exploits lessons learned from the 2001 Census. In practice this largely
relates to certain parts of London. We recommend that the National Statistician should
propose a way forward after consulting local authorities and other key interests. Whilst the
National Statistician must make the final decision on questions of methodology and timing,
we believe this would be most appropriately carried out in 2006 ie half-way through the
normal inter-censal period. The results could not give any certain indication of the true 2001
situation but could address the need for robust population estimates for resource allocation
and other purposes. We would expect any such count to take advantage of the local
knowledge of local authorities.
3. The quality of migration data should be addressed with urgency
Government should take urgent steps to enhance the quality of migration information –
which is presently wholly inadequate. We believe proposals recently made by ONS on this
front, and in relation to improving demographic information, have much to commend them.
This may involve major changes in administrative practice, not just in statistical systems. To
generate reliable international migration estimates might require new administrative records
of change of address when people move to or from the UK. There are no easy solutions.
Statistical surveys are not likely to be adequate.
4. A national address register should be a priority for government
Central to the taking of almost any form of count of the population is a definitive and
frequently up-dated national address register. The quality of the address lists used in the
2001 Census was a material contribution to the low response rates in certain areas. Thus a
single definitive national address database used by all public authorities would be a major
step forward. Attempts to achieve this over the last decade have been bedevilled by the
number of government departments and other bodies involved; those involved include the
8

local authority community, the Post Office, Ordnance Survey, HM Land Registry, ONS and
private sector bodies. There is currently confusion about where authority lies and there is
now a need for leadership. The present situation is unacceptable and must be resolved.
Clear responsibility for the task needs to be assigned.
We understand that ONS proposes to develop in collaboration with other parties a
comprehensive Address Register, agreed as a national standard. This would build on
existing registers and the collaborative project that has enhanced the national postcode
directory. We see this as a very positive step as long as it gets the support across
government needed to make it a success.
5. ONS should do more to explain their methods
ONS should make renewed efforts to explain in simple terms to all interested parties the
complex methods used within the One Number Census and those to be used in any future
exercises. Public confidence in statistics depends in part on finding effective ways to
explain matters of this kind.
6. Government must address its data requirements more systematically
Those government departments that rely on Census results to guide the allocation of public
funding, or other key decisions, should address formally the level of accuracy they require
and the cost-benefit implications of achieving that level. The primary responsibility for this
rests with these departments rather than ONS. ONS does however have a responsibility to
make clear any concerns it has about the feasibility of collecting information to these defined
accuracies and the suitability of the data for these key uses. The relevant government
departments should engage with ONS more directly in discussing these matters.
7. Other measures of population need to be developed as alternatives to ‘usually
resident’ population
Because of the variety of indicators of demand for public services required across the UK,
alternatives to the single concept of ‘usually resident’ population should be developed. The
Statistics Commission welcomes the fact that ONS is now considering the scope for
alternative population estimates – such as the ‘working day population’ which would be
much higher than the usually resident population for areas such as Westminster. The recent
ONS report A Demographic Statistics Service for the 21st Century considers alternative
measures that may prove valuable for resource allocation and other purposes.
9

The background to our conclusions is explained in the papers that follow the report:
• Paper 1: A simplified explanation of the calculation of the Census estimate for
Westminster
• Paper 2: The population of Westminster in 2001: A Review of the Evidence
Submitted to the Statistics Commission in 2003 by the City of Westminster, the Office
for National Statistics and Other Parties, by Professor Philip Rees FBA.
• Paper 3: Reports and evidence considered by the Statistics Commission.
In making this report, we have sought to explain what we have found in language
understandable by non-experts in population matters. The report is however based on
discussions with many experts and a study of all of the voluminous information now
available. The factual basis of this report has been checked with the Office for National
Statistics. Matters of judgement are however solely the responsibility of the Commission.
The Statistics Commission wishes to acknowledge the assistance of many individuals and
organisations in the preparation of this report. It is particularly indebted to Professor Phillip
Rees of Leeds University who prepared Paper 2 and advised on the evidence more
generally; Professor Bernard Silverman, Master of St Peter's College Oxford, who advised
the Commission on the statistical methods employed; officials from the Office for National
Statistics and all who gave evidence.
10

PAPER 1
A SIMPLIFIED EXPLANATION OF THE CALCULATION OF THE CENSUS ESTIMATE FOR WESTMINSTER
2001 Census estimate of the
population of Westminster (29 April 2001) ......... 181,286
Number actually counted in the Census
as usually resident in Westminster ......... 134,212
The number of people missed but
added through estimation ........ 47,074
Westminster had one of the lowest response rates among local authority areas and thus one
of the largest proportions that had to be estimated. This paper sets out in simplified terms
how the estimate of over 47,000 missed people was derived and considers the level of
uncertainty associated with the process.
The essence of the Census Coverage Survey (CCS) is to estimate the proportion of people
missed in the Census enumeration and increase the total count accordingly – referred to
below as STAGE 1. There is then a second set of adjustments to deal with lack of
independence between the Census and CCS – STAGE 2 below.
STAGE 1 – the CCS-based adjustment The part of the CCS that is relevant to the Westminster estimate relates to the Central
London Estimation Area (an area including Westminster but also City of London, Camden
and Kensington and Chelsea). A random sample of Post-Code Areas across this Estimation
Area – containing about 2% of the population – were visited in the CCS.
The Central London part of the CCS was not designed specifically to be representative of
Westminster. This introduces a degree of uncertainty. If those areas of Westminster that
were included in the CCS tended to have household characteristics untypical of Westminster
as a whole, then the resulting population estimate could have been affected.
11

The CCS for Central London identified 8,686 residents, of whom 3,292 lived in Westminster.
The details for these individuals were then matched against Census records to see which of
them had been found in the Census enumeration and which had not. The Census
enumeration records for people in the selected post-code areas were also checked to see
which had been interviewed in the CCS and which had not. Thus individuals were identified
as either having been counted in both the Census and the CCS, or just in the Census, or just
in the CCS.
The results:
• Westminster residents counted in the CCS 3292 (100.00%) - of which also counted in Census 2478 ( 75.27%) - of which not counted in Census 814 ( 24.73%)
• Westminster residents counted in the Census
(in the CCS area) 3336 (100.00%) - of which also counted in the CCS 2478 ( 74.28%) - of which not counted in the CCS 858 ( 25.72%)
From these results, a formula can be used to derive an estimate of the total population in
the Westminster CCS area – including estimated numbers that were missed by both the
Census and CCS. This is called the Dual System Estimator (DSE) and is calculated as:
3336 x 3292 = 4432 (estimated total population 2478 in these postcode areas) The following sum gives the estimated number missed in both the Census and CCS
4432 – 2478 – 814 – 858 = 282 (missed in both)
In practice, the Office for National Statistics used a more sophisticated approach that doesn’t
use the aggregate figures, as here, but rather works with more detailed figures for individual
age and sex bands in each of the individual post-code areas. However the principle is
essentially the same. The ONS approach resulted in slightly lower figures for the total
numbers and the number missed: 4416 total, 266 missed in both Census and CCS.
From the results above, it can be seen that an estimate of the coverage of the Census is
3336 ÷ 4416 = 75.54% (using the ONS figures). We have quoted this figure with two
decimal places simply to make it easy to recognise later; it is not likely to be accurate to that
level.
Applying that assumption to the Census count for the whole of Westminster (134,212
counted residents less 6172 in communal establishments who are not affected by this
12

calculation, leading to 128,040 people) gives an estimate for the total of Westminster
residents of:
128,040 x 100 + 6172 = 175,672
75.54 Again ONS used a more sophisticated method of making this calculation and got a slightly
higher result: 178,750. (The ONS approach involved fitting a regression model to the values
for those post-code areas for which there were both Census and CCS counts and then
applying that regression model to the post-code areas from which there were only Census
counts. This makes best use of the available data).
Up to this point in the calculations, a very important assumption is made: that the
probability of being counted in the CCS is the same whether or not the household was
counted in the Census. This assumption is called ‘independence’. In reality, the assumption
of independence is unlikely to be justified. People who are not counted in the Census are
generally more likely to be missed by the CCS than people who were counted in the Census.
The estimation of the amount of dependence in an area is a critical step for those areas
where Census coverage was low. It is much less critical elsewhere.
It may help in understanding dependence to think of the CCS as a thorough house-to-house
search to identify people who live in an area. If this search finds everyone, then the
assumption of independence holds – because their chances of being in the CCS are not
affected by what happened in the Census. If the CCS misses some people but there is no
particular tendency for these to have been people who were missed in the Census, then still
independence holds. If however the people missed are disproportionately the same people
as missed in the Census, then the independence assumption is invalid. Intuitively, it seems
likely that some of those missed by the Census – those who wanted to avoid being identified
for example – had more than an average chance of being missed by the CCS. So
independence is not likely to be a totally valid assumption.
STAGE 2 – the dependency adjustment The scale of correction needed to allow for lack of independence is difficult to estimate but in
practice it is not a major effect in most local authority areas. However, the correction
13

becomes very much more important when, as in the case of Westminster, the estimated
Census coverage is so low.
To correct for the lack of independence, statistical methods dictate that a further adjustment
should be made to the total calculated so far (ie 178,750). The adjustment by which the total
will be multiplied is calculated as follows (using the Westminster figures cited above): 1 +
(b – 1) x (1 – 0.7527) x (1 – 0.7428)
which is the same as 1 + 0.064(b -1) where b, called the odds-ratio, is an estimate of how much more likely a person is to be
counted in the CCS if he or she is also counted in the Census, compared with the case
where the person was missed in the Census. The lowest meaningful value of b is 1, which
would mean that the chances of being counted in the CCS are not affected by whether the
person was counted in the Census – ie complete independence. A value of 2 would mean
that a person missed in the Census would be twice as likely to be missed in the CCS as
other people who had been counted in the Census …and so on.
Note: ONS calculated both household level odds-ratios and person level ones and these do
show some differences. This paper does not discuss this aspect as it is not directly relevant
to the issues being considered. However, the step from household to person level ratios
does involve another set of assumptions.
How the odds-ratio is calculated The formula for calculating the odds-ratio b is easiest to follow if the figures computed above
for Westminster are used to illustrate it – but it should be noted that this is just for illustration.
The approach actually used in the Census did not involve this particular calculation – as
explained further later. Using the Westminster figures to illustrate the formula it is:
b = 2478 x (T - 2478 – 814 – 858) 814 x 858 T is a separate estimate of the population in the area – called the ‘third estimate’. In practice
this process has two steps; the first operates at the level of numbers of households and the
second operates at the level of individual people. But the sum above illustrates the concept.
Now T is, by definition, difficult to estimate reliably. It is one of the quantities that the Census
itself is intended to measure – so obviously it isn’t known in advance. The way it was
estimated for Census purposes was to take the average of two quantities – the number of
14

residential addresses held by the Post Office (adjusted by a factor to convert from addresses
to households) and the number of households identified in the Census by the enumerators –
and then adjust the figure to give an estimate in terms of people rather than households.
It is clear that the odds-ratio b is difficult to estimate and introduces further uncertainty. It
appears to the Statistics Commission that the difficulty of estimating b accurately tends to
increase for the areas of the country where the Census coverage tends to be low. The
reason for this is essentially that the circumstances which make an area ‘hard to count’ –
such as unwilling households – also make it hard to be sure about the level of dependence.
These areas are also precisely the ones in which the dependency adjustment will have the
greatest effect on the final total. So not only is the calculation more uncertain in these areas,
it is more important too.
To illustrate how problematic the estimation of the odds-ratios can be, ONS provided the
Commission with some data for the Central London areas defined as ‘most hard to count’.
These data were not in fact used in producing the Census estimates but are nonetheless
informative. They show that the calculation of b for this area ‘goes wrong’ (due to the
estimate of T being lower than the total to be subtracted from it) and thus b would be set to
1.0 because there is no basis for any other value. What makes this striking is that for the
‘middling hard to count’ parts of Central London, the value of b calculated in the same way
comes out at 7.2. It seems highly improbable to the Commission that the level of
dependence genuinely swaps over from an extreme low value to a very high one just
between the two levels on the ‘hard to count’ index.
It would be wrong to assume however that a high odds-ratio automatically leads to a large
adjustment in terms of numbers of people added. A lot depends on the coverage in the
initial enumeration. If the initial coverage is high, the odds-ratio will not have a large impact
on the final estimate.
In practice, the odds-ratios used for the Central London Estimation Area were actually the
values of b derived for the larger ‘Inner London’ area – on the grounds that the latter
estimates would be more robust (the values used were 1.6 for the ‘most hard to count’ areas
and 3.7 for the ‘middling hard to count’ areas when measured at the household level). This
15

is a defensible step but, to the extent that Westminster is untypical of Inner London, it
introduces still more uncertainty. Having calculated the necessary adjustments for the
Central London Area as a whole, the ‘extra population’ was then allocated to the different
local authority areas in proportion to the estimated amount of undercounting in the Census in
each area. Thus there was never a specific value of b for Westminster as a whole. But the
net effect of these various steps was to produce an adjustment for Westminster which
equated to a value of b of about 1.22 (measured at the person level) – that is to say a value
near the bottom of the plausible range. Use of this dependency adjustment added some
2,500 people to the Westminster total. This took the 178,750 figure derived under the Stage
1 adjustments to 181,286.
Conclusions The odds-ratio b is a measure of the extent to which an individual who was missed in the
Census count was more likely to be missed in the Census Coverage Survey than someone
who was counted in the Census. For those areas of England and Wales that had a high
coverage in the initial Census count, the value of b did not make much difference to the final
estimate. However in the Westminster case, where the coverage was exceptionally low, the
estimated value of b was critical.
This is illustrated below by looking at the effect of setting b to alternative values. The last
two columns give the level of response in the Census and CCS implied by the values of b.
As b increases these figures start to become increasingly unrealistic, so a very high value of
b is improbable.
b
extra people in Westminster
total estimated for Westminster to
the nearest thousand
percent response in enumeration
(people)
percent response in CCS of
people missed
from Census
1 0 179,000 75 75 1.22 3,000 181,000 74 70
2 11,000 190,000 71 59 3 23,000 201,000 67 49 4 34,000 213,000 63 42 5 45,000 224,000 60 37 6 57,000 236,000 57 33 7 68,000 247,000 54 29
16

The estimation of b is problematic, requiring a separate ‘third estimate’ of the resident
population. This approach does not always produce sensible results. Much depends on the
robustness of the various estimates that come into play in the calculations. The value of b
for Westminster implied by the final Census estimate was towards the bottom of the range of
the plausible values and the evidence to support use of this specific value appears to be
very slim – although it was consistent with such evidence as there was within the Census
data itself.
The analysis in this paper suggests that a wide range of possible outcomes – nearly all
higher than the published estimate – would have been at least plausible using the data
available.
Uncertainty about the value of b, and about other steps in the process, is not taken into
account in the published confidence intervals and this lends an unjustified impression of
precision to the official estimates.
17

This page is blank
18

PAPER 2
THE POPULATION OF WESTMINSTER IN 2001: A REVIEW OF THE EVIDENCE SUBMITTED TO THE STATISTICS COMMISSION
IN 2003 BY THE CITY OF WESTMINSTER, THE OFFICE FOR NATIONAL STATISTICS AND OTHER PARTIES
Philip Rees1
September, 2003; revised October 2003
The Problem
The Office for National Statistics (ONS) undertook a full census of the population of England
and Wales in 2001, published the first results on 30 September 2002 (age-sex tables and
associated mid-2001 population estimates) and has since been rolling out a huge volume of
outputs from the 2001 Census. ONS has used the 2001 Census statistics to revise radically
the mid-year population estimates (MYEs) by age and sex for local authorities. For the City
of Westminster the 2001 MYE population was 26% lower than the previous mid-2000
estimate. Such a reduction had a drastic impact on the allocation of central government
revenues for Westminster services.
The City of Westminster made strong representations to ONS for revision of the 2001
estimate, assembling a variety of evidence to support their claim that the population of the
Borough had grown throughout the 1991-2001 decade, rather than declined to 1995 and
grown since then (as indicated by the ONS revised MYE series). They took their complaints
to the Statistics Commission in December 2002. Westminster commissioned work on the
borough’s population estimate by MORI survey company and from a group of academic
experts. They continued a vigorous dialogue with ONS.
ONS have responded through letter, by meeting with Westminster representatives and by
producing a report explaining how the Westminster census count and mid-year estimates
were produced. They have continued to produce reports explaining the One Number
Census methods, including a very recent paper on the allowances made for dependency in
the Dual System Estimator (DSE) method. ONS have argued strongly for the robustness of
their census count and their revision of Local Authority (LA) and Unitary Authority (UA)
MYEs.
1 School of Geography, University of Leeds, Leeds LS2 9JT, UK Tel 0113 343 3341, Fax 0113 343 3308, Email [email protected]
19

Westminster and ONS are collaborating on an investigation of one aspect of the census
process: the possibility that substantial numbers of residential addresses were omitted from
the census enumeration in Westminster. ONS and Westminster have jointly funded and
commissioned an address matching analysis by Manchester Geomatics. The census
address list is being matched against a master file constructed from eight address datasets.
The files being used are AddressPoint™ (August 2000 and ONS 1998), Post Office Address
Files (PAF 2001 release 4), Communal Establishments (LA records), Council Housing (LA
records), Council Tax (LA records), Registered Social Landlords (LA records), Electoral Roll
(LA records) and ONS Census additional records (confidential). The report is due for
completion in December 2003.
This reports reviews the arguments marshalled by the Local Authority and the Office for
National Statistics, using documentation submitted to the Statistics Commission by the
interested parties and other organisations.
Summary of actions taken
The key actions taken by the City of Westminster were to protest about the 2001 Census
count and the 2001 MYE for the Borough (City of Westminster 2002, Milton 2003, Rogers
2003a), to commission a MORI survey based population estimate (MORI 2003), to secure a
MORI critique of the ONC (Mortimore 2002), to request a review of the issues from an expert
panel (City of Westminster 2002b, Hobcraft et al. 2003) and to enter into a dialogue through
meetings and correspondence with the Office for National Statistics (Wilson 2003a, 2003b,
2003c; Rogers 2003b).
The key actions taken by ONS were to prepare responses to the Westminster protest
document in the form of letters (Pullinger 2003a, Pullinger 2003b, ONS 2003d, ONS 2003f)
and The Westminster Report (ONS 2003c), seeking to explain why ONS felt that the ONC
and revised MYEs were robust. They also pointed to the documents pertaining to the ONC,
which have recently been augmented by the publication of the Dependency Method report
(Abbott et al. 2003). ONS has reviewed the need to improve international migration statistics
(Walton 2003, ONS 2003j) and has already carried out revisions (ONS 2003e). ONS has
reviewed its future plans for the development of population statistics (ONS 2003b, 2003c,
2003g, 2003h; Cook 2003a, 2003b, 2003c), which has led already to revisions to the ONC
informed mid-2001 population estimates (ONS 2003i).
20

The key joint actions by the City of Westminster and ONS were to carry out an address
matching exercise, commissioning a trusted third party (Manchester Geomatics) to see if
there was evidence of missing addresses (Pullinger 2003b, ONS 2003a).
The key agreement was an undertaking by ONS to modify the MYE in the light of robustly
identified missing residential addresses. It is important though to be clear what ONS have
proposed. John Pullinger, Director, Economic and Social Reporting at the Office for National
Statistics, writes in his letter of March 2003 to C.T. Wilson, Director of Legal and
Administrative Services, City of Westminster:
‘As I stated during our meeting on 21st March, once the matching exercise is complete we will look at this evidence along with all other evidence available to us and make a judgement on that basis. If we conclude that there is clear evidence that the Census has missed significant numbers of households, and that these have not been adequately accounted for by the One Number Census process, then we would be prepared to make an adjustment to the population estimates.’ (Pullinger 2003b, p.2, para 3)
Note that ONS consider that adjustment of the ONC at this very late stage of output
production is not feasible.
The Statistics Commission has responded to Westminster’s concerns (Statistics
Commission 2003a) by holding a series of meetings with the City of Westminster (Statistics
Commission 2003b), with the Office for National Statistics (Rhind 2003, Statistics
Commission 2003d, 2003e, Diamond 2003), with the Office of Deputy Prime Minister
(Statistics Commission 2003c) and the Greater London Authority (Statistics Commission
2003f, 2003g, 2003h).
Context
The first results of the 2001 Census of Population were published by the Office for National
Statistics on the 30 September 2002 along with the mid-2001 (30 June/1 July) populations of
Local and Unitary Authorities in England and Wales. These results consisted of tables of
counts by age and sex.
The results were a surprise in that they were considerably lower than the users of those
statistics expected on the basis of the Mid-Year Population Estimate series from 1991 to
2000 grounded in the adjusted 1991 Census. The total population of the UK was
58,789 thousand (ONS 2002), whereas the pre-Census population estimates for mid-2000
had been 59,756 thousand with a one year national projection for mid-2001 of
21
59,987 thousand. The difference between the 2001 Census figure and the mid-2001
population was 1,198 thousand.
ONS, together with GROS and NISRA, adopted the 2001 Census as the base upon which to
estimate the mid-2001 population of Local Authorities and Unitary Authorities. They revised
the 1991 mid-year estimates back to a 1991 Census count base and away from the previous
base of a rolled forward estimate based on the 1981 Census. The population estimate
series was then revised between these census dates adjusting for the discrepancy in both
the 1981-1991 decade (one third) and 1991-2001 decade (two-thirds).
The estimated population of every LA and UA in the country was changed, mainly
downwards. The new population estimates are an important part of the method used by the
Office of Deputy Prime Minister (ODPM) to allocate 75% of local government revenues that
come from national taxation. The City of Westminster’s population estimate in 2000 prior to
the 2001 Census was 246 thousand, while its 2001 Census population was 181 thousand,
26% fewer. This had the potential consequence of reducing of Westminster’s local
government annual allocation by around £60m. The reduction in allocation has been
moderated by the floor mechanism used by the Office of the Deputy Prime Minister (ODPM),
which resulted in a minimum increase of 3.5% for Financial Year 2002/3.
The City of Westminster was naturally extremely concerned about the decrease in its
estimated 2001 population. Westminster Council officers and councillors took their concerns
to the Office for National Statistics and have conducted a dialogue with the ONS, asking for
an explanation of the decrease and a revision of the population estimate. The City of
Westminster also approached the Statistics Commission in December 2002 and asked them
to investigate their concerns with the ONS 2001 Census results and 2001 Mid-Year
Population Estimates for Westminster.
The Statistics Commission requested both written documentation and oral evidence from the
City of Westminster and the Office for National Statistics, and received documents and oral
evidence from other parties, including the Greater London Authority, Manchester Geomatics,
MORI polling/survey company and a group of academic experts commissioned by the City of
Westminster to review the problem. Annex A lists the documents submitted in evidence and
provided for this review. They include documents in the public domain and confidential
transcripts and notes of meetings between the Statistics Commission and the parties
22

involved. Annex B provides a glossary of the numerous acronyms and technical terms used
in the report.
Arguments by the City of Westminster
The principal arguments in favour of a higher population estimate for the Borough put
forward by the City of Westminster are as follows (City of Westminster 2002, p1):
• their own estimate, based on Council Tax records and the Electoral Register, gives a
figure of 231 thousand
• the Electoral Roll has increased by 26% since 1991
• the National Health Service (NHS) Patient Register count of patients has increased
by 19%
• between 1991 and 2001 8 thousand new residential properties were built
• the number of domestic dwellings increased by 8.6% between 1991 and 2001
• the primary school roll has increased by 28% and the secondary school roll by 15%
• a survey-based estimate by MORI opinion polling organisation in late 2002, prepared
for Westminster Council, produced a population estimate of 215 thousand.
Further, the City of Westminster identified specific features of their borough’s treatment in
the 2001 Census which meant that the population was not properly counted:
• ONS failed to devote sufficient resources to administering the 2001 Census in the
Borough which has large numbers of houses in multiple occupation, hostels, hotels,
gated buildings or buildings with a concierge, asylum seekers and student halls of
residence
• as a result, many residential addresses were omitted from the 2001 Census with one
estate being completely missed, one MP’s residence being missed and instances
and enumerators failing to list fully all residential addresses in enumeration districts
• the allowance for dependence in the ONS One Number Census (ONC) methodology
was too low for the Central London Estimation Area, and alternative allowances
would have led to higher estimates (Hobcraft et al. 2003, p.8)
• Westminster’s reduction in population from expectation was so extreme that it would
not be expected statistically (MORI report). Westminster had expected a Census
23

population within ±5 percent of 245 thousand (the old mid-2000 estimate) less the
average reduction in the population (about 2%) in the ONC, say 5 thousand. This
would have yielded, at a minimum, a population count for Westminster of about 228
thousand. The ONC number for Westminster was 181 thousand.
In addition, the City of Westminster contended the following about ONS procedures:
• ONS should not have abandoned its own figures, based on the International
Passenger Survey, of immigration to Westminster
• ONS had failed to explain why young men were ‘missing’ from the 1991 and 2001
Censuses in such numbers in young adult ages
• ONS had not taken up offers by the City of Westminster of substantial help in the
enumeration process by council staff (justified by the Borough’s concentration of hard
to enumerate areas and people).
Arguments by the Office for National Statistics
The Office for National Statistics has addressed Westminster’s concerns by engagement
with the City of Westminster either directly through correspondence or meetings or in
evidence to the Statistics Commission responding to the points made by Westminster
Council:
• ONS have used a large number of administrative records in the Quality Assurance
process which compared the One Number Census with a plausible range of
estimates based on these other records, including the previous set of mid-year
estimates and patient registers (used by Westminster).
• ONS point out the Council Tax records do not necessarily provide a good basis for
estimating the number of usual residents because in Westminster many homes are
second homes and the occupants are usually resident elsewhere.
• School rolls do not necessarily reflect the population of children resident in the
Borough when schools draw pupils from both inside and outside the borough.
• The survey based estimate by MORI assumed too high an average household size
for imputed households as these are much more likely to be single person
24

households than responding households. There was a very high 95% confidence
interval about the estimate of ± 60 thousand. The ONC figure fell within the MORI
estimate range of 154 to 274 thousand.
ONS responded in some detail to the issues raised by Westminster Council about the
conduct of the census, the coverage survey and the One Number Census:
• ONS admitted that there had been difficulties in recruiting census enumeration staff
in Central London. They had welcomed Westminster’s initiative to give council staff
three days leave to undertake census officer or enumerator roles, and this
suggestion had been widely used in London. ONS took the view that they could not
accept Westminster’s further offers of involvement in administering the census as this
would lead to claims by other authorities of favoured treatment.
• ONS have agreed to fund, with the City of Westminster, an address matching
exercise by Manchester Geomatics, which is currently proceeding. Address lists
from a variety of sources are being compared with the census enumeration list to
identify gaps. If evidence of missing residential addresses is firmly established, ONS
have agreed to adjust the mid-year estimate population.
• ONS have explained and defended their innovative One Number Census
procedures, designed by Professor Ian Diamond (then of Southampton University,
now Chief Executive Economic and Social Research Council). They have provided,
via the National Statistics website, large numbers of methodological papers including
those of the Quality Assurance stage, in which ONC numbers by age and sex were
checked against a range of plausible prior estimates. Note that these prior estimates
were not used to adjust the ONC result.
• ONS contend that the ONC estimation methods could deal with outliers, when the
response rate was low, through making an allowance for dependence.
ONS reviewed very critically, in the light of ONC results, previous methods of post-census
population estimation:
• ONS now consider the International Passenger Survey (IPS) to be a flawed
instrument for determining the LA destination of an immigrant, and a poor estimation
25

of emigration. Migrants are a small sample within a larger survey focussed on
visitors/tourists. The coding of destination ‘central to London’ to Westminster
exaggerated radically inflows to the Borough.
• ONS are carrying out a review of International Migration statistics which will be
published soon. This review should examine the question of how many young men
emigrated and how the sex ratio in the young adult ages is affected. Evidence from
the censuses of overseas destinations is to be examined. [Note: review published
September 2003]
• ONS contend that they did welcome the Westminster leave for staff to enumerate but
did not wish to extend LA involvement in order to maintain consistency of estimates
across all LAs and UAs.
Strengths and weaknesses of the arguments and what we know about the problem at this stage
The arguments put forward by Westminster and ONS were reviewed by several different
parties.
The City of Westminster commissioned three pieces of work:
• a technical paper by Roger Mortimore, Associate Director, MORI, entitled The 2001
Census in the City of Westminster (Mortimore 2002)
• a research study by MORI on The Population of the City of Westminster (MORI
2003)
• An Interim Report of Independent Panel of Census Experts to Chief Executive, City
of Westminster Council by John Hobcraft and colleagues (Hobcraft et al. 2003).
The Greater London Authority contributed the following:
• extensive oral evidence to The Statistics Commission (Statistics Commission 2003f)
• GLA 2000 Round of Demographic Projections, as used in ‘Towards the London
Plan’, which includes a variety of projections (Greater London Authority 2001).
Members of Parliament (Buck 2003, Flight 2003, Leigh 2003) have also commented on the
conduct of the 2001 Census and the use of census populations in producing the 2001 Mid-
Year and subsequent estimates.
26

It is useful to try to pick out some of the main points made in these additional reports, but in
a generic fashion.
The administration of the 2001 Census
The Census organisations including ONS decided to use enumerator delivery of census
forms and postback procedures for collection. These were tested out in the 1999 census
rehearsal. Postback had been used by other national statistical offices with success. The
cost savings were considerable and enabled ONS to concentrate enumerator staff in hard to
enumerate areas. There were, however, operational problems, some of which might have
been anticipated such as forms and envelopes oversize for the standard UK postbox and
overload at the Royal Mail. However, ONS staff and enumerators made an enormous effort
to get the job done and a 94% response rate was achieved (higher than anticipated).
With hindsight, it is possible to say that more local help should have been accepted from LAs
with lots of hard to count populations. But this could only have been done with full prior
agreement of all LAs, in order to maintain the level playing field of National Statistics.
The argument was also put forward that the Census Coverage Survey (CCS) should have
been larger to cope with anticipated problems such as those that emerged in Westminster.
Then LAs with hard to count areas could have had their own sample. But this is a
conclusion from hindsight. The CCS was already the biggest ever household survey ever
attempted in this country and the most successful in terms of response.
The ONC procedures of ONS and ONS consultation on the procedures
All parties were agreed:
• that the One Number Census procedures were necessary to handle the anticipated
lack of response in the 2001 Census
• that the ONC was statistically robust as long as response rates were reasonably high
• that the matching exercise within the ONC had worked well
• that ONS had been correct to add a final dependence adjustment.
However, there were aspects which deserve some further explanation.
27

ONS has produced a large number of papers on the ONC and makes these available on the
National Statistics website. They have also presented the methodology to census users,
particular LAs, in a large number of meetings. This consultation built solid general
understanding of the method, received some useful feedback and contributed to its widely
perceived success. Even Westminster were supportive but, of course, felt that it had not
coped well with their extreme situation. However, from the Westminster and GLA evidence it
is clear that not everyone understands the details.
The Westminster Expert Panel report (Hobcraft et al. 2003) and the ONS’s document The
Westminster: a Review of the Facts (ONS 2003c) both present simple example
computations of the data capture/recapture technique, while the MORI appendix to the City
of Westminster’s Evaluation of the Accuracy and Reliability of the 2001 Census quotes the
standard formula used to derive the 100% population from the 2001 Census:
E = CS/M
where E = estimated total population, C = population counted in the Census, S = population
counted in the Survey and M = population matched in the Census and Survey. The
derivation of the Dual System Estimator from the Hypothesis of Independence is explained
in Annex C. The Westminster results are reported in Table 1.
Table 1: Results from the Census and the Census Coverage Survey, Westminster, 2001
Coverage Survey Counted Missed Totals Census Counted 2478 858 3336 Missed 814 (266.5) (1080.5) Totals 3292 (1124.5) (4416.5)
Source: ONS (2003) The Westminster Report: a Review of the Facts, p.13. Note: The figures not in brackets are observed counts. The bracketed figures are computed figures.
Now these figures are not simply the result of the application of the Dual System Estimator:
M= 2478, C=3336 and S=3292, because E = (3336) (3292) / 2478 = 4431.8 and the
hypothesis of independence yields a different result for the count of persons missing in both
Census and Survey. That calculation is (1124.5/4416.5) × (1080.5/4416.5) which yields
275.1. There are several reasons for the difference: (1) the DSE is applied to sample
postcodes and aggregated to the Estimation Area, (2) the DSE is applied to age-sex groups,
(3) the DSE is applied to the Estimation Area not the individual LA, which is connected via a
regression model and (4) a dependency adjustment is made, which takes into account
differing response at the LA level. The Final Draft of the report on dependency adjustment
28

has just been released (Abbott, Brown and Diamond 2003) and is under review by the
Statistics Commission.
The main point to make from this discussion is that it is probably essential for the ONC team
in the Office for National Statistics set out all of the algebra and arithmetic of the DSE and
dependency computation for the City of Westminster LA in a completely transparent way.
The chain of arithmetic calculation needs to be seen in its entirety. Now most users will find
such an account challenging but statistically experienced LA officers should be able to follow
the logic and check it using a spreadsheet and relevant supplied parameters. The ONC
process is so important in providing the base for post 2001 MYE populations that such an
extra step should be taken to ensure the trust in ONS’s statistical estimates that Cook
(2003c) rightly stresses is so vital.
Strengths and weaknesses of the various administrative data sources There is a debate between Westminster and its experts on the one hand, and ONS and its
staff on the other, as to the value of the administrative record indicators. Westminster
argues that the chosen indicators show continuous growth through the 1991-2001 period.
ONS argues that many of the indicators are prone to list inflation, mainly because removals
from the lists lag behind additions.
ONS uses the following administrative sources or symptomatic indicators for Quality
Assurance purposes, which are used to set up plausibility ranges for the 2001 ONC:
• previous mid-year estimates
• adjusted patient records
• child benefit records
• pensioner data
• schools Census data
• birth registrations
• extrapolated mid-year estimates.
Westminster uses the following as change indicators:
• original mid-year estimates (same as previous mid-year estimates)
• patient registers (same as adjusted patient records)
• electoral rolls
• Council Tax returns.
29

Let us review the arguments for the common indicators.
Previous/original MYEs
Westminster argues for retention of these, of course. But ONS had to revise the 1981-2001
MYE series as a result of the 2001 Census. That is one of the key purposes of a census – a
reality check on population estimates. The Quality Assurance process led ONS to review
and revise the 1991 MYEs because of the shortfalls in the 30-34 and 35-39 age groups for
men, which had been inflated upwards in the 1991 estimates to agree with the national 1991
MYEs rolled forward from the 1981 Census.
Patient records/registers
The biases of NHS records are well known and include ‘driftwood’, the failure to remove
migrants, ‘dead-wood’, people with duplicate records and ‘ghosts’, people who have died
without being removed from the lists. All parties acknowledge these problems. However,
there has been a programme by health authorities to clean their lists (because of financial
distortions in GP payments) and Register accuracy improved over the 1990s. ONS
reviewed this improvement prior to changing to a radically improved method of measuring
internal migration. The 1997-98 review concluded, however, that the registration counts
were not good enough yet to rely upon for population counts (Scott and Kilbey 1999). The
relationship between the patient register count and the population count differs from place to
place: Westminster houses a military population catered for by the Army Medical Service,
adjusted for by ONS in their Quality Assurance procedures, and is likely to house a small
minority of residents who use private medical services.
Council Tax records
Westminster argues that the council counts residential properties accurately and makes
reasonable estimates of the average household size. A population estimate by Westminster
City Council based on the dwelling count (occupied residences) for 2001 is 231,162. The
MORI survey, which sought a complete enumeration of selected postcodes, produces a
population estimate of 214,605 with a 95% confidence band of 154,383 to 274,827.
ONS points out that the MORI method assumes too high an average household size for non-
responding households. The likelihood of single member households being missed is much
higher than multi-member households.
30

ONS also argue that not all the dwellings in Westminster contain usually resident
households. Many households will occupy more than one residence (first home, second
home). Westminster contains a much higher than average proportion of second homes.
Table KS016 from the 2001 Census Key Statistics for Local Authorities records that 3.2% of
household spaces in England and Wales are vacant and 0.7% are second residences or
holiday accommodation. In Westminster the corresponding percentages are 6.5% and
4.6%.
ONS (2003h) have recognised in the document A Demographic Statistics Service for the 21st
Century (pp. 19-21) that there are a variety of population bases/definitions suited to different
purposes, such as delivery of services to all persons spending residence time in an area.
Development of core population estimates based on a small, manageable set of different
definitions is planned. Council Tax records might provide inputs to one of these alternative
definitions but should not be used, themselves, to estimate usual residents as defined in the
mid-year estimates.
The electoral register/roll (ER)
Again both parties recognise the difficulties in using the ER as a population surrogate.
Westminster argues strongly for its use. ONS did not employ it in their QA. The reason was
that the ER is very variable across LAs in coverage of eligible populations also vary.
Westminster argue that it is still an important indicator of change and show how it has grown
over the 1990s (City of Westminster, 2002, Figure 2.1). The Parliamentary electorate grew
by approximately 10 thousand over the 1991-2001 decade.
It is difficult to judge the merit of the respective arguments without a much deeper study of
the relationship between the ERs and MYEs across the country. In 1995 citizens of EU
countries (other than the UK) resident in the UK became eligible to vote in local and
European elections and were added to the Electoral Registers. A proper comparison would
need to look at the ER estimating the numbers involved.
The immigration issue
One of the justifications for the ONS revision of the 1991-2001 population estimate series
was concern that the volume of immigration to the Borough had been consistently over-
estimated. This view was strongly supported by the evidence presented by the Greater
London Authority (Data Management and Analysis), who had taken the view that the
31

OPCS/ONS estimates for Westminster based on demographic roll forward were consistently
ahead of a housing capacity adjusted, multistate, cohort-component projection.
Immigrants to Westminster were probably over-estimated for two main reasons:
• The International Passenger Survey recorded a large number of intentions to migrate
to central London, many of which were assigned to Westminster. The probability
was that the knowledge of these migrants of the geography of London was vague
and their actual destinations were much more widely spread.
• The method for assigning Asylum Seekers and Visitor Switchers (ASVS) to London
as a whole and to London Boroughs was flimsy. The Home Office estimates that an
arbitrary 85% of ASVS migrants have London destinations on slim precise evidence.
Country of birth data from the 1991 Census for the main ASVS countries is then used
to distribute this 85% to individual London boroughs.
The GLA has carried out a number of London borough projections from 1991 to 2001. The
migration base of these projections is information on internal migration and immigration from
the 1991 Census. Emigration was estimated by applying internal migration out-migration
rates to resident populations and constraining these to gross emigration counts from the IPS.
These inputs coupled with vital statistics over the decade and a housing capacity constraint
produced projections closer to the ONC figure than any City of Westminster estimate (see
Table 2 below). These projections slightly modified (Scenario 8.1) are the ones that the GLA
consider provided the best estimate of Westminster’s population prior to the 2001 Census
and the ONC. Using revised 1991 MYEs would lower the population estimates for 2001
closer to the ONC number.
Table 2: Selected populations for the City of Westminster from the GLA 2000 round projections
Projection 1991 1996 2001
1B –using LPAC Housing Capacity Guidelines 187.7 203.8 212.8
2 – using 1993-98 migration trends after 1999 187.7 203.8 243.6
London Plan – Scenario 8.1 187.7 203.8 215.2
Recommendations
[These are the personal recommendations of Professor Rees to the Statistics Commission.]
32

The following recommendations are put forward for consideration by the Statistics
Commission. They arise from the summary and evaluation of the arguments set out above
and a review of all of the documents presented to the Commission.
1. Publish the body of evidence along with the Statistics Commission report
The Statistics Commission should assemble an edited set of all the materials in one
coherent set of documents (less the confidential transcripts but including the summaries) in
date order with permission of the parties as an archive of documents on the Statistics
Commission website (in scanned PDF format). This evidence can be summarised in the
Statistics Commission report with some editorial comments on the themes and arguments in
each document, a revised version of this review and a set of summary recommendations by
the Statistics Commission.
2. Encourage the parties to come to a sensible agreement on the results of the
address matching exercise and how that might change the Westminster mid-year
population estimate for 2001
The agreement of ONS to adjust the Westminster population estimate in the light of the
address matching exercise should be supported. There is also likely to be a small revision
as a result of the revision of the 2001 and 2002 mid-year population estimates announced in
ONS (2003i).
3. Find that the ONC methods were statistically sound and fit for purpose
This conclusion will need to be confirmed by the additional consultancy on the ONC agreed
by the Statistics Commission. In support of this conclusion, the following arguments can be
advanced. The ONC was thoroughly researched at all stages. Statisticians outside ONS
and users were consulted at every step. The volume of research papers produced and
made available for scrutiny on the National Statistics website (http://www.statistics.gov.uk) is
without precedent. In addition, the methods have been rigorously explained in a set of peer
reviewed journal papers (Brown et al. 1999; Holt et al. 2001). In addition, Hennell (2003)
has recently carried out an independent and rigorous review of the consistency of the
explanations for the 2001 Census results and finds the ONS arguments on over-
compensation for the undercount of young males in 1991 and on the underestimation of their
emigration over the period 1981-2001 generally plausible.
33

4. Ask ONS to prepare a transparent account of the arithmetic of the Westminster ONC population
The principle of the ONC method is widely understood by most knowledgeable census
users. The principle is that an estimate of the full population can be made if two estimators
are available, as long as these estimators are independent. The details of its application to
Estimation Areas and the imputation of adjustments to Local Authorities are probably less
widely understood. Even ONS (2001) misses out crucial details that are needed to
understand exactly what was done. The adjustment for dependency (where independence
does not fully hold) have now been fully explained (Abbott et al. 2003) but probably not
widely understood. There is therefore a need for ONS to prepare a simple but fully explicit
account of how the ONC estimate was achieved for a local authority (e.g. Westminster), in
which the complete of chain of arithmetic is set out.
5. Support the investigation of how alternative population bases can be estimated
and used
Part of the Westminster problem results from the need to support a population active in the
borough that does not match the usually resident (in principal or first home) definition used in
the census. ONS (2003h) proposes a set of alternative measures, the feasibility of which
should be investigated, in conjunction with potential users, ODPM, the LAs, the NHS, for
example.
6. Urge that swift consideration be given to the improvement of international migration estimates
ONS have already put forward a number of possible measures that could be taken (ONS
2003h, p.28). The evaluation of these measures can be done quite swiftly. They include
introduction of landing cards for all incomers and embarkees, a successful practice in many
other countries. This would probably need legislation to enact. Prior to this being passed
the Labour Force Survey and the proposed Integrated Household Survey could be
extended to include questions on emigration (from households that continue to reside in the
UK).
7. Support the proposals for the development of a national address register
34

ONS (Cook 2003c) proposes to develop, in collaboration with other parties (GROS, NISRA,
OSGB, OSNI, Royal Mail, LGA, ODPM, NHS) a comprehensive Address Register, agreed
as the national standard. This would build on existing registers and the collaborative project
that has enhanced the national postcode directory (the All Fields Postcode Directory
enhanced by the Gridlink Project). This address register will help improve the operation of
national surveys or mid-term Censuses and prepare the ground for the creation later in the
decade of a national population register, should Parliament approve the creation of such a
valuable information resource.
8. Support a feasibility study into a mid-term (2006) Census for London or for selected hard to enumerate local authorities
Such a mid-term Census would enable ONS to test the viability of their new population
estimates, their new international migration measures and the utility of the national address
register, well in advance of the next decennial census in 2011.
35

REFERENCES Abbott, O., Brown, J. and Diamond, I. (2003) Dependence in the 2001 One Number Census
project. ONC Paper, Office for National Statistics. August 2003. 21p. Brown, J.J., Diamond, I.D., Chambers, R.L., Buckner, L.J. and Teague, A.D. (1999) ‘A
methodological strategy for a one-number census in the UK’. Journal of the Royal Statistical Society A, (162), pp.247-267.
Buck, K. (2003) ‘Counting the cost of inaccuracy’. The House Magazine, 28 (1040), May 19,
2003. Available at http://www.housemag.co.uk/. 2p. City of Westminster (2002) Evaluation of Accuracy and Reliability of 2001 Census.
Westminster City Council, November 2002. 34p. City of Westminster (no date, probably late 2002) Brief – Co-ordinator for Panel of Census
Experts. Cook, L. (2003a) Measuring the population: a review of our needs for the next decade. Letter
to Recipients of A demographics statistics service for the 21st century. 9 July 2003. 2p. Cook, L. (2003b) A demographic statistics service for the 21st century. Key action points for
ONS. July 2003. 3p. Cook, L. (2003c) The quality and qualities of population statistics and the place of the
census. Paper presented at the Royal Geographical Society-Institute of British Geographers Annual Conference, 3 September 2003, at the Royal Geographical Society, 1 Kensington Gore, London in the Plenary session convened by D. Martin (QMRG) and P. Boyle (PopGRG).
Diamond, I. (2003) Investing in the Future: One Number Census, Evidence to Statistics
Commission. Economic and Social Research Council. Powerpoint slide presentation, 12 June 2003.
Flight, H. (2003) ‘Funding fiasco’. The House Magazine, 28 (1040), May 19, 2003. Available
at http://www.housemag.co.uk/. 2p. Greater London Authority (2001) GLA 2000 Round of Demographic Projections − as used in
‘Towards the London Plan’. Data Management and Analysis Group, Greater London Authority. Contact: John Hollis. 21p.
Hennell, T. (2003) Have we learned to count yet? A Health Services perspective on the 2001
Census. Paper presented at the Royal Geographical Society-Institute of British Geographers Annual Conference, 3-5 September 2003, at the Royal Geographical Society, 1 Kensington Gore, London in the PopGRG/QMRG session on ‘The first results of the 2001 Census’, convened by D. Dorling.
Hobcraft, J., Champion, T., Hepple, L. and King, D. with Morton, N. (2003) Interim Report of
Independent Panel of Census Experts to Chief Executive, City of Westminster Council. (probably) April 2003. 17p.
Holt, T., Diamond, I.D. and Cruddas, M. (2001) ‘Risk in official statistics: a case-study of the
2001 one-number census project’. Journal of the Royal Statistical Society D, 50, pp.441-456.
36

Leigh, E. (2003) ‘Value for money?’ The House Magazine, 28 (1040), May 19, 2003. Available at http://www.housemag.co.uk/. 2p.
McManus, N. (2001) 2001 Census – Progress and Proposed Additional Action. Briefing Note
to Simon Milton, Leader, City of Westminster Council. 2 March 2001. 3p. Milton, S. (2003) 2001 Census Result. Letter to Rt Hon Nick Raynsford MP, Minister of
State, Office of the Deputy Prime Minister, 26 Whitehall, London SW1A 2AU. 14 January 2003. 3p.
Mortimore, R. (2002) ‘The 2001 Census in the City of Westminster’. Annex A in ‘City of
Westminster’ (2002). Annex A, Technical paper by Dr. Roger Mortimore, Associate Director, MORI. 9p.
MORI (2003) The Population of the City of Westminster, Executive Summary – 13 January
2003. Research Study Conducted for Westminster City Council. November 2002-January 2003. 20p.
ONS (2001) Census 2001: A Guide to the One Number Census. Final Version. September
2001. Available via http://www.statistics.gov.uk/. ONS (2003a) Census Matching Project: an Investigation of Discrepancies between Address
Lists. Powerpoint Presentation. No exact date. 20p. ONS (2003b) Population and Migration. Three Year Work Plan 2003/04-2005/06. Draft
Version 3, March 2003. 13p. ONS (2003c) The Westminster Report: a Review of the Facts. Document prepared for the
City of Westminster. Foreword by Len Cook. Supplied as attachment to email from Lucy Baker, Office for National Statistics, 8 May 2003. 32p.
ONS (2003d) Revised diagnostic ranges for the City of Westminster from the Quality
Assurance of the One Number Census. Graphs and accompanying data tables supplied as attachment to email from Lucy Baker, Office for National Statistics, 8 May 2003. 2p.
ONS (2003e) Revised international migration estimates 1992-2001. Press Notice issued by
National Statistics, 1 Drummond Gate, London SW1V 2QQ. 12 June 2003. 5p. ONS (2003f) Letter to Councillor Kit Malthouse, Deputy Leader of the Council, City of
Westminster from Len Cook, National Statistician and Registrar General. 18 August 2003. Letter provides comments on the Hobcraft et al. (2003) report and an Annex: Detailed consideration of report of Hobcraft et al.
ONS (2003g) Demographic statistics fit for the 21st century. Press release. 3p. ONS (2003h) A Demographic Statistics Service for the 21st Century. Office for National
Statistics, London. ISBN 1 85774 554. Available from http://www.statistics.gov.uk/Methodology_by_theme/downloads/Demographic_Statistics_Service.pdf. July 2003. 68p.
ONS (2003i) Operational Note: Population Estimates release. Office for National Statistics,
London. Announces publication of revised 2001 and 2002 population estimates on 19 September 2003. 3 September 2003. 1p.
37

ONS (2003j) International Migration Statistics Quality Review. National Statistics Quality Review, No.23, Office for National Statistics, 2 September 2003. Available at: http://www.statistics.gov.uk/methods_quality/quality_review/population.asp.
Pullinger, J. (2003a) Response to ref LAS/CTW(DBK)/sm/69863. Letter to C.T. Wilson,
Director of Legal and Administrative Services, City of Westminster, Westminster City Hall, 64 Victoria Street, London SW1E 6QP. March 2003 (probably 5 March), receipt stamp 6 March 2003. 6p.
Pullinger, J. (2003b) Response to ref LAS/CTW(DBK)/sm. Letter to C.T. Wilson, Director of
Legal and Administrative Services, City of Westminster, Westminster City Hall, 64 Victoria Street, London SW1E 6QP. Dated March 2003 (probably after 21 March). 5p.
Redfern, P. (2003) An alternative view of the 2001 Census and future census-taking. Paper
presented before the Royal Statistical Society, 12 Errol Street, London on Wednesday 9 July 2003. 16p.
Rhind, D. (2003) Letter to Len Cook, National Statistician, Office for National Statistics
inviting ONS to meet with the Statistics Commission. 11 April 2003. Rogers, P. (2003a) Census 2001 in the City of Westminster. Letter to Professor David
Rhind, Chairman, Statistics Commission, 10 Great George, London SW1P 3AE. 21 May 2003. Covering letter enclosing documents and letters supplementary to the materials discussed at a meeting on 2 May 2003. 2p.
Rogers, P. (2003b) 2001 Census Response and Contact Rate. Letter to Paul Dawson, 2001
Census Regional Manager, Office for National Statistics, Segensworth Road, Titchfield, Hants PO15 5 RR. 31 May 2003. 1p.
Scott, A. and Kilbey, T. (1999) ‘Can patient registers give an improved measure of internal
migration in England and Wales’. Population Trends 96, pp.44-55. Statistics Commission (2003a) Reliability of 2001 Census Figures: Next Steps for
Commission Consideration of Westminster Concerns. Internal Memorandum, April 2003. Statistics Commission (2003b) Transcript of Private Meeting, Westminster City Council and
Statistics Commission. Meeting held on 2 May 2003. Statistics Commission (2003c) Notes on meeting between the Statistics Commission and the
Office of Deputy Prime Minister (ODPM). Meeting held on 13 May 2003. Statistics Commission (2003d) Transcript of Private Meeting, Office for National Statistics
and Statistics Commission. Meeting held on 13 May 2003. Statistics Commission (2003e) Transcript of Private Meeting, Office for National Statistics
and Statistics Commission. Meeting held on 12 June 2003.
Statistics Commission (2003f) Transcript of Private Meeting, Greater London Authority and Statistics Commission. Meeting held on 22 July 2003.
Statistics Commission (2003g) Summary of Private Meeting with GLA on 22 July 2003. Statistics Commission (2003h) Questions for GLA plus Answers from GLA. July 2003.
38

Walton, J. (2003) Revised International Migration Estimates. Email about Population Estimate Definitions to Gill Eastabrook, Statistics Commission. 24 June 2003. Includes Table 1 from forthcoming ONS Migration Volume, also available on the web at http://www.statistics.gov.uk/STATBASE under Migration and Population topics. 6p.
Wilson, C.T. (2003) 2001 Census in Westminster. Letter to John Pullinger, Office for
National Statistics, 1 Drummond Gate, London SW1V 2 QQ. 11 February 2003. 6p. Wilson, C.T. (2003) 2001 Census in Westminster. Letter to John Pullinger, Director,
Economic and Social Reporting, Office for National Statistics. 1 Drummond Gate, London SW1V 2 QQ. 5 March 2003. 3p.
Wilson, C.T. (2003) Inaccuracies in the 2001 Census. Letter to John Pullinger, Director,
Economic and Social Reporting, Office for National Statistics. 1 Drummond Gate, London SW1V 2 QQ. Dated 14 March 2003. 5p.
39

ANNEX A: DOCUMENTS SUBMITTED TO THE STATISTICS COMMISSION The documents are listed in date order and source. In the References list above the document citations are sorted into normal author, date, title order for ease of reference. Documents supplied by the City of Westminster McManus, N. (2001) 2001 Census – Progress and Proposed Additional Action. Briefing Note
to Simon Milton, Leader, City of Westminster Council. 2 March 2001. 3p. City of Westminster (2002) Evaluation of Accuracy and Reliability of 2001 Census.
Westminster City Council. November 2002. 34p.
Mortimore, R. (2002) The 2001 Census in the City of Westminster. Annex A in City of Westminster (2002). Annex A, Technical paper by Dr. Roger Mortimore, Associate Director, MORI. 9p.
City of Westminster (no date, probably late 2002) Brief – Co-ordinator for Panel of Census
Experts. MORI (2003) The Population of the City of Westminster, Executive Summary – 13 January
2003. Research Study Conducted for Westminster City Council. November 2002-January 2003. 20p.
Milton, S. (2003) 2001 Census Result. Letter to Rt Hon Nick Raynsford MP, Minister of
State, Office of the Deputy Prime Minister, 26 Whitehall, London SW1A 2AU. 14 January 2003. 3p.
Wilson, C.T. (2003a) 2001 Census in Westminster. Letter to John Pullinger, Office for
National Statistics, 1 Drummond Gate, London SW1V 2 QQ. 11 February 2003. 6p. Wilson, C.T. (2003b) 2001 Census in Westminster. Letter to John Pullinger, Director,
Economic and Social Reporting, Office for National Statistics. 1 Drummond Gate, London SW1V 2 QQ. 5 March 2003. 3p.
Pullinger, J. (2003a) Response to ref LAS/CTW(DBK)/sm/69863. Letter to C.T. Wilson,
Director of Legal and Administrative Services, City of Westminster, Westminster City Hall, 64 Victoria Street, London SW1E 6QP. March 2003 (probably 5 March), receipt stamp 6 March 2003. 6p.
Wilson, C.T. (2003c) Inaccuracies in the 2001 Census. Letter to John Pullinger, Director,
Economic and Social Reporting, Office for National Statistics. 1 Drummond Gate, London SW1V 2 QQ. 14 March 2003. 5p.
Pullinger, J. (2003b) Response to ref LAS/CTW(DBK)/sm. Letter to C.T. Wilson, Director of
Legal and Administrative Services, City of Westminster, Westminster City Hall, 64 Victoria Street, London SW1E 6QP. March 2003 (probably after 21 March). 5p.
Hobcraft, J., Champion, T., Hepple, L. and King, D. with Morton, N. (2003) Interim Report of
Independent Panel of Census Experts to Chief Executive, City of Westminster Council. (probably) April 2003. 17p.
Rogers, P. (2003a) Census 2001 in the City of Westminster. Letter to Professor David
Rhind, Chairman, Statistics Commission, 10 Great George, London SW1P 3AE. 21 May
40
2003. Covering letter enclosing documents and letters supplementary to the materials discussed at a meeting on 2 May 2003. 2p.
Rogers, P. (2003b) 2001 Census Response and Contact Rate. Letter to Paul Dawson, 2001
Census Regional Manager, Office for National Statistics, Segensworth Road, Titchfield, Hants PO15 5 RR. 31 May 2003. 1p.
Documents supplied by the Office for National Statistics (ONS) ONS (2003a) Census Matching Project: an Investigation of Discrepancies between Address
Lists. Powerpoint Presentation. No exact date. 20p. ONS (2003b) Population and Migration. Three Year Work Plan 2003/04-2005/06. Draft
Version 3, March 2003. 13p. ONS (2003c) The Westminster Report: a Review of the Facts. Document prepared for the
City of Westminster. Foreword by Len Cook. Supplied as attachment to email from Lucy Baker, Office for National Statistics, 8 May 2003. 32p.
ONS (2003d) Revised diagnostic ranges for the City of Westminster from the Quality
Assurance of the One Number Census. Graphs and accompanying data tables supplied as attachment to email from Lucy Baker, Office for National Statistics, 8 May 2003. 2p.
ONS (2003e) Revised international migration estimates 1992-2001. Press Notice issued by
National Statistics, 1 Drummond Gate, London SW1V 2QQ. 12 June 2003. 5p. ONS (2003f) Letter to Councillor Kit Malthouse, Deputy Leader of the Council, City of
Westminster from Len Cook, National Statistician and Registrar General. 18 August 2003. Letter provides comments on the Hobcraft et al. (2003) report and an Annex: Detailed consideration of report of Hobcraft et al.
Walton, J. (2003) Revised International Migration Estimates. Email about Population
Estimate Definitions to Gill Eastabrook, Statistics Commission. Dated 24 June 2003. Includes Table 1 from forthcoming ONS Migration Volume, also available on the web at http://www.statistics.gov.uk/STATBASE under Migration and Population topics. 6p.
Cook, L. (2003a) Measuring the population: a review of our needs for the next decade. Letter
to Recipients of A demographics statistics service for the 21st century. Dated 9 July 2003. 2p.
Cook, L. (2003b) A demographic statistics service for the 21st century. Key action points for
ONS. July 2003. 3p. ONS (2003g) Demographic statistics fit for the 21st century. Press release.. 3p. ONS (2003h) A Demographic Statistics Service for the 21st Century. Office for National
Statistics, London. ISBN 1 85774 554. Available from http://www.statistics.gov.uk/Methodology_by_theme/downloads/Demographic_Statistics_Service.pdf. July 2003. 68p.
Abbott, O., Brown, J. and Diamond, I. (2003) Dependence in the 2001 One Number Census
project. ONC Paper, Office for National Statistics. August 2003. 21p.
41

ONS (2003i) Operational Note: Population Estimates release. Office for National Statistics, London. Announces publication of revised 2001 and 2002 population estimates on 19 September 2003. 3 September 2003. 1p.
ONS (2003j) International Migration Statistics Quality Review. National Statistics Quality
Review, No.23, Office for National Statistics, 2 September 2003. Available at http://www.statistics.gov.uk/methods_quality/quality_review/population.asp.
Transcripts and minutes of meetings of parties with the Statistics Commission Statistics Commission (2003a) Reliability of 2001 Census Figures: Next Steps for
Commission Consideration of Westminster Concerns. Internal Memorandum, April 2003. Rhind, D. (2003) Letter to Len Cook, National Statistician, Office for National Statistics
inviting ONS to meet with the Statistics Commission. 11 April 2003.
Statistics Commission (2003b) Transcript of Private Meeting, Westminster City Council and Statistics Commission. Meeting held on 2 May 2003.
Statistics Commission (2003c) Notes on meeting between the Statistics Commission and the
Office of Deputy Prime Minister (ODPM). Meeting held on 13 May 2003. Statistics Commission (2003d) Transcript of Private Meeting, Office for National Statistics
and Statistics Commission. Meeting held on 13 May 2003. Statistics Commission (2003e) Transcript of Private Meeting, Office for National Statistics
and Statistics Commission. Meeting held on 12 June 2003. Diamond, I. (2003) Investing in the Future: One Number Census, Evidence to Statistics
Commission. Economic and Social Research Council. Powerpoint slide presentation 12 June 2003
Statistics Commission (2003f) Transcript of Private Meeting, Greater London Authority and
Statistics Commission. Meeting held on 22 July 2003. Statistics Commission (2003g) Summary of Private Meeting with GLA on 22 July 2003. Statistics Commission (2003h) Questions for GLA plus Answers from GLA. July 2003. Documents supplied by the Greater London Authority Greater London Authority (2001) GLA 2000 Round of Demographic Projections − as used in
‘Towards the London Plan’. Data Management and Analysis Group, Greater London Authority. Contact: John Hollis. 21p.
Other documents reviewed Scott, A. and Kilbey, T. (1999) ‘Can patient registers give an improved measure of internal
migration in England and Wales’. Population Trends 96, pp.44-55.
42

ONS (2001) Census 2001: A Guide to the One Number Census. Final Version. September 2001. Available via: http://www.statistics.gov.uk/.
Buck, K. (2003) ‘Counting the cost of inaccuracy’. The House Magazine, 28(1040) 19 May
2003. Available at http://www.housemag.co.uk/. 2p. Flight, H. (2003) Funding fiasco. The House Magazine, 28(1040), 19 May 2003. Available
at: http://www.housemag.co.uk/. 2p. Leigh, E. (2003) ‘Value for money?’ The House Magazine, 28(1040), 19 May 2003.
Available at: http://www.housemag.co.uk/. 2p. Hennell, T. (2003) Have we learned to count yet? A Health Services perspective on the 2001
Census. Paper presented at the Royal Geographical Society-Institute of British Geographers Annual Conference, 3 September 2003, at the Royal Geographical Society, 1 Kensington Gore, London in the PopGRG/QMRG session on ‘The first results of the 2001 Census’, convened by Daniel Dorling.
Cook, L. (2003c) The quality and qualities of population statistics and the place of the
census. Paper presented at the Royal Geographical Society-Institute of British Geographers Annual Conference, 3 September 2003, at the Royal Geographical Society, 1 Kensington Gore, London in the Plenary session convened by D. Martin (QMRG) and P. Boyle (PopGRG).
Redfern, P. (2003) An alternative view of the 2001 Census and future census-taking. Paper
presented before the Royal Statistical Society, 12 Errol Street, London on 9 July 2003. 16p.
43

ANNEX B: GLOSSARY OF ABBREVIATIONS USED ASVS Asylum Seekers and Visitor Switchers Important immigrant stream into the country. Visitor switchers are person who enter
the country as visitors but then apply to stay.
CCS Census Coverage Survey Large household survey administered shortly after the 2001 Census in order to
estimate missing households and individuals.
DSE Dual System Estimator The technique that uses two estimators (the Census count and Census Coverage
Survey) to arrive at an estimate of the total population of the country at the time of the 2001 Census.
ER Electoral Register A list of all persons who have the right to vote in one or more types of elections. It
was traditionally a count in mid-October of each year (published the following mid-February) but now electors who have moved can register between the annual electoral enumerations.
ESRC Economic and Social Research Council Funds social science research and postgraduate training in UK universities and
recognized research institutions.
GLA Greater London Authority The upper tier Local Government Authority for London. It has a team of experts who
conduct demographic research on behalf of the GLA and London Boroughs.
GROS General Register Office Scotland The government agency responsible for the population census and demographic
statistics in Scotland. Collaborates closely with ONS and NISRA in the conduct and processing of the census of population.
IPS International Passenger Survey A sample survey of incoming and outgoing passengers at the UK’s principal airports
and seaports. The survey contains a question about migration intention and destination (area within the country for immigrants or country abroad for emigrants).
LA Local Authority The general term for unit of Local Government. The exact title and functions of LAs
differ from one part of the country to another. For details, see “A Beginners’ Guide to UK Geography” on the ONS website (http://www.statistics.gov.uk/.
LGA Local Government Association The organisation that represents the interests of local government.
MORI Market Opinion Research International One of the UK’s largest market research and consultancy firms.
MYE Mid-Year Estimate The estimated population of a territorial unit at midnight on 30 June/1 July.
NHS National Health Service
44

The public body providing health care for most of the UK’s population.
NISRA Northern Ireland Statistics and Research Agency The government agency responsible for the population census and demographic
statistics in Northern Ireland. Collaborates closely with ONS and GROS in the conduct and processing of the census of population.
ODPM Office of the Deputy Prime Minister The central government department responsible for local government in England and
Wales that allocates to Local Authorities the central government grant for support of local services and functions. The MYE is a very important component in the resource allocation formula used to distribute this multi-billion pound grant.
ONC One Number Census The procedures used to produce a robust estimate of the census population and
constituent households and individuals. The procedures are necessary because of the rising level of non-response in the decennial census.
ONS Office for National Statistics The government agency responsible for the population census and demographic
statistics in England and Wales. Collaborates closely with GROS and NISRA in the conduct and processing of the census of population. It also has responsibility for the quality assurance and co-ordination of national statistics for the whole UK and in reporting those statistics to national and international agencies.
OPCS Office of Population Censuses and Surveys The government agency formerly responsible for the population census and
demographic statistics in England and Wales. It was amalgamated with the Central Statistical Office in 1996 to form the Office for National Statistics.
PAF Post Office Address File The database of addresses used by the Post Office/Royal Mail for delivery of mail to
residences, organisations and businesses. Published quarterly and used widely by government agencies, local authorities and academic researchers.
QA Quality Assurance The procedures for checking the validity of population statistics (e.g. from the ONC).
UA Unitary Authority One of the categories of Local Government units.
UK United Kingdom of Great Britain and Northern Ireland
The full name of the country.
45

ANNEX C: DERIVATION OF THE DUAL SYSTEM (DSE) ESTIMATOR The DSE formula is derived from the hypothesis of independence in probability theory. We first develop a notation to represent the estimation problem. Table 1 defines the variables. Table 1: A notation for counts from the full Census and the Census Coverage Survey
Census Coverage Survey Totals Census Counted S Not Counted s Counted C N(C,S) N(C,s) N(C) Not Counted c N(c,S) N(c,s) N(c) Totals N(S) N(s) N(T)
The variables and subscripts in the table are defined as follows:
N = number of people
C = counted in the Census Enumeration
c = not counted (missed) in the Census Enumeration
S = counted in the Census Coverage Survey
s = not counted (missed) in Census Coverage Survey
T = total
The accounting relationships for the row, column and grand totals embedded in the table
are:
N(C) = N(C,S) + N(C, s)
N(c) = N(c,S) + N(C, C)
N(S) = N(C,S) + N(c, S)
N(s) = N(C,s) + N(c, s)
N(T) = N(C) + N(c) = N(S) + N(s)
The Hypothesis of Independence states that the joint probability of two events is the product
of the probability of one event multiplied by the probability of the other event. Under the
hypothesis of independence the joint probability of being missed in the census and in the
census coverage survey is as follows:
P(c,s) = P(c) × P(s) (1)
where P = probability, P(c,s) is the joint probability of being missed in both census and
survey, P(c) is the probability of being missed in the census and P(s) is the probability of
being missed in the survey.
46

The number missed is therefore:
N(c,s) = P(c,s) × N(T) = P(c) × P(s) × N(T) (2)
The dual system estimator can be stated in this notation as: N(T) = N(C) × N(S) / N(C,S) (3). We need to derive equation (3) from equation (1). It is easiest if we observe that the hypothesis of independence also means that we estimate
the probability of being counted in both the Census and the Survey as:
P(C,S) = P(C) × P(S) (4) and that: N(C,S) = P(C,S) × N(T) (5). Substituting the RH side of equation (4) for P(C,S) in equation (5), we obtain
N(C,S) = P(C) × P(S) × N(T) (6). We define the probability of being counted in the Census as: P(C) = N(C)/N(T) (7) and the probability of being counted in the Survey as: P(S) = N(S)/N(T) (8) so that the estimate of the number counted in both Census and Survey is: N(C,S) = [N(C)/N(T)] × [N(S)/N(T)] × N(T) (9). Cancel N(T) on the right hand side, multiply both sides by N(T) and divide both sides by
N(C,S). This yields
N(T) = N(C) × N(S) / N(C,S) (10). This is the Dual System Estimator for the total population of interest.
47

This page is blank
48

PAPER 3
REPORTS AND EVIDENCE CONSIDERED BY THE STATISTICS COMMISSION
Summarised below, in chronological order, are the main reports and evidence considered by the
Commission. This paper does not list more general correspondence, documents or informal
discussions.
Reports
Greater London Assembly, Towards the London Plan. 2001. 21p.
The GLA produces forecasts for individual London boroughs as well as Greater London
as a whole. The forecasts for Greater London are bottom-up, ie there is no constraint on
total. Figures in this report were completed by the GLA in July 2000, and were quoted in
Towards the London Plan.
1991 Census data are central to the projections but a variety of other London data have
been used. The population model in use was similar to the ONS one though there is no
constraint to a previously prepared forecast.
Three different methodologies were used:
Projection 1B – using London Planning Advisory Committee (LPAC) guidelines:
These projections are based upon estimated net migration for 1991-96, and thereafter
use dwelling stock figures. 2001 population in Westminster was estimated as 212,800.
Projection 2 – Migration Trend
Projection is initially constrained by mid-year estimate net migration for the period 1991-
98. An estimate of migration using various sources was made for 1998-1999. Thereafter,
the average migration characteristics are assumed. 2001 population in Westminster was
estimated as 243,600.
Scenario 8.1 Projection 1B was felt to produce a reasonable overall figure for London but it was felt
that estimates of migration into the Central London boroughs were too high. This is
essentially Projection1B with a projection more based on the predicted availability of
housing. 2001 population in Westminster was estimated as 215, 200.
49
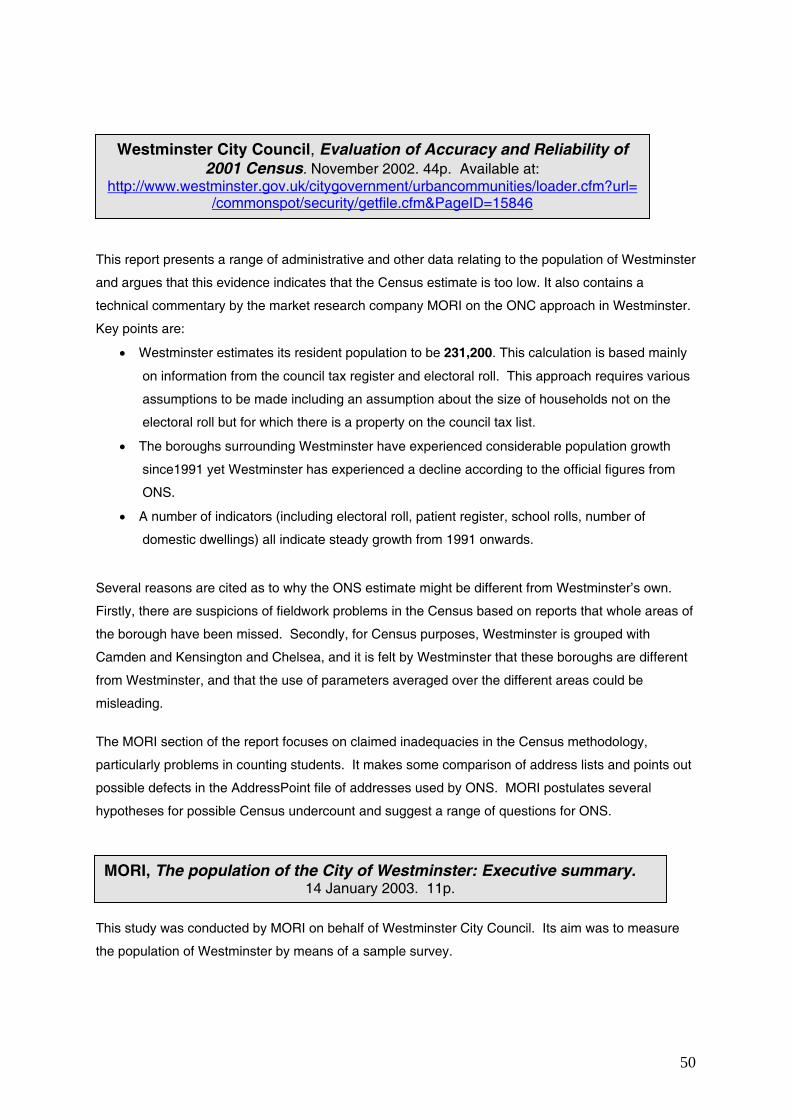
This report presents a range of administrative and other data relating to the population of Westminster
and argues that this evidence indicates that the Census estimate is too low. It also contains a
technical commentary by the market research company MORI on the ONC approach in Westminster.
Key points are:
• Westminster estimates its resident population to be 231,200. This calculation is based mainly
on information from the council tax register and electoral roll. This approach requires various
assumptions to be made including an assumption about the size of households not on the
electoral roll but for which there is a property on the council tax list.
• The boroughs surrounding Westminster have experienced considerable population growth
since1991 yet Westminster has experienced a decline according to the official figures from
ONS.
• A number of indicators (including electoral roll, patient register, school rolls, number of
domestic dwellings) all indicate steady growth from 1991 onwards.
Several reasons are cited as to why the ONS estimate might be different from Westminster’s own.
Firstly, there are suspicions of fieldwork problems in the Census based on reports that whole areas of
the borough have been missed. Secondly, for Census purposes, Westminster is grouped with
Camden and Kensington and Chelsea, and it is felt by Westminster that these boroughs are different
from Westminster, and that the use of parameters averaged over the different areas could be
misleading.
The MORI section of the report focuses on claimed inadequacies in the Census methodology,
particularly problems in counting students. It makes some comparison of address lists and points out
possible defects in the AddressPoint file of addresses used by ONS. MORI postulates several
hypotheses for possible Census undercount and suggest a range of questions for ONS.
Westminster City Council, Evaluation of Accuracy and Reliability of 2001 Census. November 2002. 44p. Available at:
http://www.westminster.gov.uk/citygovernment/urbancommunities/loader.cfm?url=/commonspot/security/getfile.cfm&PageID=15846
MORI, The population of the City of Westminster: Executive summary. 14 January 2003. 11p.
This study was conducted by MORI on behalf of Westminster City Council. Its aim was to measure
the population of Westminster by means of a sample survey.
50

The method involved selecting a random sample of 81 postcodes, and aimed to collect population
information on everyone in the sample postcode areas. Apart from personal interviews, information
was collected by self-completion questionnaires, phone and intercom as well as from neighbours.
Fieldwork took place over two months, 6 November 2002 to 5 January 2003, and a minimum of six
calls were made to each address. Full information was obtained from 60% of addresses, partial
information from 13%, with information on the remainder being imputed. The imputation was based
on using average household size of occupied properties in the same postcode. The study produced
an estimate of the population of 214,605 with a large confidence interval around that figure.
We
con
alte
gro
The
sym
do n
exe
will
Mo
Hobcraft,J. Champion, T., Hepple, L. and King, D., Interim Report ofIndependent Panel of Census Experts to Chief Executive, City of
Westminster Council. April 2003. 18p.
stminster invited a panel of four academic experts to look at the issues independently. The report
cludes that there is a prima facie case that the ONC estimate is too low. They do not suggest an
rnative figure. Their case for not accepting the ONC estimate mainly rests on the following
unds:
• the symptomatic indicators of population available – patient registers, school censuses,
benefit/pension records, electoral rolls and council tax records – all show different patterns
over time that were at odds with those of the revised population estimates
• the rejection of the previous MYE for 2000 requires a fuller explanation
• the panel had compared the Quality Assurance data for Westminster with other LAs, and
showed that Westminster was the most extreme outlier for England and Wales. They felt that
the rejection of the QA evidence was not satisfactorily explained
• the panel had seen evidence from Westminster that suggested significant undercounting in the
north of the borough.
y do calculate estimates of population based upon applying the increases in the
ptomatic indicators of population change to the 1991 population figure, though they
ot advocate a particular number. They believe that the results of the matching
rcise will be needed before an estimate can be made though they believe that this
require careful consideration.
Office for National Statistics, The Westminster report: a review of the facts. ay 2003, minor revision August 2003. 51p. [The report was put on the ONS website
n 9 October. The MORI report on the 2001 Census for Westminster and the ONS response to the MORI Report are included as Annex D. Available at:
http://www.statistics.gov.uk/StatBase/Product.asp?vlnk=10738.]
51

ONS produced this report to address the criticisms that had been made. It contains some detailed
information on the Census in Westminster as well as relevant data relating to Greater London. The
main points are:
• ONS have taken various steps, for example smaller workloads for enumerators
in recognition of potential enumeration problems.
• The ONC approach is a very well researched approach designed to cope with
lower than expected response rates.
• The Quality Assurance programme was rigorous, and was subject to external
observation.
• The size of the difference between the Census estimate, and the 2000 mid-year
estimate is surprising but this discrepancy is ascribed to three factors: 1991 base
was too high, difficulties in estimating migration, over-estimation of proportion of
new migrants staying in the Westminster.
• The MORI survey is challenged on several grounds, including household definition and
assumptions made on size of non-interviewed households.
• The report gives some detailed reasons, based on general observations, as to why the
administrative sources used by Westminster to demonstrate population growth could not be
relied upon.
• The report sets out the revised mid-year estimates. These show a dip from 1991 to 1995 with
a rise onwards from that date. As there was a relatively steady excess of births over deaths
each year, the trend reflects changes in net migration.
• The report seeks to refute the suggestion that Westminster was an extreme outlier by
reworking the diagnostic ranges on the basis of the revised mid-year estimates. This analysis
does then show that Westminster population is on a par with surrounding boroughs in terms of
its relationship with the diagnostic ranges, but it should be noted that the reworked diagnostic
ranges were not derived independently.
Thbeto
House of Commons: ODPM: Housing, Planning, Local Government and the Regions Committee, Reducing Regional Disparities in Prosperity,
Volume I: Report. 4 July 2003. 9p. Available at: http://www.publications.parliament.uk/pa/cm200203/cmselect/cmodpm/492/492.pdf
e report’s emphasis is on the provision of regional economic data but the Census was considered cause of the need for accurate population data. The committee had five recommendations relating the Census which are given below:
• ‘There is an urgent need to improve the alignment between different sources of population data. We recommend that in the small number of authorities where there remains a problem between the Council and ONS about the size of the population, following the 2001 Census, a data matching exercise should be undertaken by an
52

independent third party. This should be completed in time to feed in to next year’s. Local Government Finance settlement and ONS should be bound by the result.
• ‘It is astonishing that the Office of National Statistics does not know how many Census
forms were delivered and it was naïve not to have subjected the system to thorough testing. Data on the number of follow-up visits by enumerators should also be centrally held.
• ‘The ONS assumes that people know that the Census is based on usual residency rather
than where they were on the night. This ignores years of custom and practice and unrealistically supposes that everyone reads their Census form in great detail before completing it. Specific attention needs to be drawn to this issue when the next Census is promoted.
• ‘If inaccuracies are shown to have occurred in the 2001 Census, ODPM should revisit the
Local Government Finance Settlement for 2003/04 so that no council loses out as a result of a badly run Census
• ‘Clear and accurate information is essential for democratic decisions. Rebuilding
confidence in the Office for National Statistics will be a long, slow process. Clear leadership and drive is now needed at the top of the ONS to restore confidence in it.’
Redfern,P., An alternative view of the 2001 Census and future census-taking. (Plus transcript of discussion). Paper presented before the Royal Statistical Society on 9 July 2003. Paper 16p. Transcript 28p. Paper available at: http://www.rss.org.uk/publications/docs/090703a.pdf. Transcript not yet available on
the Web.
The paper’s main thesis is that the 2001 Census results understate the number of young men, and
that the claim that the shortfall is due to emigration cannot be substantiated. This conclusion is based
on demographic analysis of sex ratios, plus an analysis of a sample of Welsh local authorities. The
paper also comments on the definition of residency and proposals for a population register.
In the discussion, the National Statistician refuted the idea that ONS had abandoned demographic
analysis, and said that a fuller analysis of the Welsh authorities gave a different picture.
Finance and Support Services Overview and Scrutiny Committee, Westminster City Council, The 2001 Census in the City of Westminster.
August 2003. 30p.
The report follows a special meeting organised by the committee on 15 April 2003 at which a number
of witnesses gave evidence. It presents previous material in a relatively non-technical form. Its key
conclusions are:
• Westminster’s diverse population/property base made it a difficult area to count
• fieldwork problems impacted severely on the accuracy of the Census
53

• the quality assurance process was highly questionable in Westminster
• ONS only agreed to participate in further investigation after pressure from the City Council.
The report states that the committee will re-examine the Census issue once the results
of the matching exercise are known. It will consider the need for an application under
the Census Act for a rerun of the Census if the matching exercise demonstrates that the
original Census count was understated and the ONS subsequently failed to amend
Westminster’s population.
Office for National Statistics, Detailed Consideration of Report of Hobcraft et al. August 2003. 6p.
The report is an annex to a letter from the National Statistician to the leader of Westminster City
Council. He addresses specific points raised In the Hobcraft report (see Hobcraft et al, Interim Report
of Independent Panel of Census Experts to Chief Executive, City of Westminster Council):
• Census and CCS fieldwork: problems in fieldwork are catered for by the fact that a larger
than average adjustment was made
• Quality Assurance process: a detailed report of the quality assurance process is being
prepared by ONS which will contain specific information on why the results for some local
authorities are accepted despite falling outside the diagnostic ranges
• Mid-year estimates: it is standard practice to revise MYEs after a Census. The panel had
criticised the use of the cohort method for making revisions but this is defended as an
approach that had been approved by methodological experts
• Symptomatic indicators: ONS states that the three comparators used by Westminster show
little growth or show slow growth until the middle of the decade, which ties in with the trend in
the revised Westminster estimates
• Migration: the report announced a migration statistics review [Note: review published
September 2003]
• Dependency adjustment: criticisms are said to be answered in the second dependency
paper.
The report concludes that the Hobcraft report does not provide an analytical basis for concluding that
there has been an undercount in Westminster. ONS does however indicate its willingness to revise
estimates that it judges to be inaccurate once subsequent analyses become available.
Nusup
Abbott, O., Brown, J. and Diamond, I., Dependence in the 2001 One mber Census Project. September 2003 (unpublished draft). 20p. [Revised and
erseded version of a paper original published in December 2002, which is availableat: http://www.statistics.gov.uk/census2001/pdfs/dependency_paper.pdf]
54

The report discusses in detailed technical terms the issues of dependence and testing of
independence between the Census enumeration and the CCS. It also sets out the dependency
adjustments made for each individual local authority area. Information from the two versions of the
report form the basis for Paper 1 in the Statistics Commission report.
Ludi Simpson, Centre for Census and Survey Research, John Hobcraft, London School of Economics, Dave King, Anglia Polytechnic University, One Number Census and its quality assurance: a review. Research briefing 6.03. Produced on behalf of the Local Government Association (LGA). September 2003. 35p.
Available at: http://www.lga.gov.uk/Documents/Publication/onenumbercensus.pdf
In February 2003, the LGA circulated to all local authorities in England and Wales a
series of questions about concerns relating to the 2001 Census. Of the 62 responses
received, the majority expressed concerns; 18 authorities said they had approached
ONS with concerns about estimates for their areas. In the light of these concerns, the
LGA commissioned the review, which was largely completed in April 2003 so does not
cater for developments since then.
The review recommends that local authorities should use the detailed Census results as
published but notes that the concerns expressed demonstrate a lack of confidence in the
ONC and its quality assurance procedures. It makes the following recommendations:
• the evidence and expert judgments involved in the quality assurance of the ONC
should be supported with published analyses
• issues of enumeration that make population sizes hard to estimate should be
tackled in an open and scientific manner
• more use to be made of key administrative sources to measure the population
• developments in population statistics need to maintain confidence of users
• information learnt by ONS in particular on comparator datasets needs to be
disseminated
• population definitions need to be reviewed and agreed.
Of particular relevance were comments in the report on the dependency adjustment
where a number of questions were raised ranging from the claim that there was a lack of
evidence for statistical independence between the Census and the CCS through to
comments on poor quality of explanation. The view was expressed that the overall
adjustment for dependency may be too low.
55

The Census quality assurance programme was criticised on the grounds that the
comparator data were invariably rejected when the ONC estimates fell outside the
diagnostic ranges.
Evidence from meetings
The following table lists the meetings that the Statistics Commission held with interested
parties. Information on the key points discussed is given below the table.
Date
Organisation
Representatives
Documentation produced
2/05/03 Westminster City Council
Peter Rogers, Chief Executive Stephen Fitzgerald, Financial Consultant Nick McManus, Council Lead on Census matters Andrew Harvey, Councillor
Transcript
13/05/03 Office of the Deputy Prime Minister (ODPM)
The Rt. Hon Nick Raynsford, Minister for Local Government and the Regions Peter Capell, Head of Profession for Statistics Anna Wojtowicz, Private Secretary to the Minister
Note of meeting
13/05/03 Office for National Statistics
John Pullinger, Director, Economic & Social Reporting Directorate Lucy Baker, Senior Research Officer, Census Information Team
Transcript
12/06/03 Office for National Statistics
Professor Ian Diamond, Chief Executive ESRC (attending because of his role in 2001 Census) John Pullinger, Director, Economic & Social Reporting Directorate, ONS
Transcript Slide presentation
22/07/03 Greater London Authority
Rob Lewis, Head of Data Management and Analysis John Hollis, Demographic Consultant, Data Management and Analysis
Transcript Note of meeting
The following key points were taken from the meetings. Westminster City Council
• The Mid-Year Estimate prior to the Census was regarded by Westminster as reasonable within
5-8%, so the Census estimate was completely unexpected. There was increasing pressure on
resources – housing, schools, social services.
56

• Westminster flagged up concerns over fieldwork and offered ONS help but this was rejected.
• In some wards Westminster recorded more council housing than ONS had in total for ward.
• Westminster data failed the QA process more than figures for any other area. Westminster felt
that ONS disregarded data without giving adequate reasons.
• Westminster had set up panel of experts to review the position.
• Ten years is too long to calibrate data. Administrative data should be utilised.
Office for National Statistics
• 1991 Census: several releases of the data had undermined confidence. There had been a
small post-enumeration survey and a broad brush approach to adjusting for under-
enumeration.
• Mid-year estimates had been effectively rolled forward from 1981 Census.
• In 1990s ONS had moved to using the NHS register to measure internal migration.
• ONS had relied heavily on the International Passenger Survey to measure migration into the
country and had been slow to pick up that when respondents had said ‘Central London’ this
may well have been only an initial destination.
• There had been limited concerns about the mid-year estimates prior to the Census release. No
one had written in formally though the GLA had produced a lower forecast.
• There had been particular problems in recruiting field staff in London. Westminster had offered
help but this has been rejected because of concerns about fairness and the effect on reliability
of the CCS.
• The Census had followed through the strategy of the Census White Paper.
• The Quality Assessment Panel had up to 12 quality assurance meetings about Central
London.
• Allocation of resources for fieldwork had been based on the ‘hard to count’ index. Ratio of field
staff was 2:1 between hard and easy areas. With the benefit of hindsight, perhaps this should
have been 10:1.
• They had discussed with GLA the possibility of undertaking a data collection exercise between
Censuses.
In the subsequent discussions with Professor Ian Diamond:
• Judgement was used in making adjustment to 1991 Census results for under-enumeration.
ONS now accepts that 1991 basepoint was wrong. Demographic analysis had not been
rejected but more weight was now being given to 2001 Census results.
• Much work had been put into the Quality Assurance programme. There had been much
consultation. It included qualitative data.
• In calculating the dependency adjustment, it was felt that ONS’s alternative estimate of the
number of households had an upwards bias. A judgement was made not to reduce the
Census estimate when the alternative estimate was less than the Census estimate.
57

• The pattern of a shortfall in younger males was exhibited in 80% of estimation areas. The
lesser shortfall in 35-39 old males was believable because experience has shown that by that
age they tended to complete Census forms.
• The decline in Westminster’s mid-year estimates in the early 1990s was consistent with
population decline in surrounding boroughs.
Office of the Deputy Prime Minister
• Census data was very important. It was used extensively in the allocation of £44 billion of
public funds.
• ODPM had not specified a level of accuracy required from the results.
• The Census estimates and resulting mid-year estimates had considerable impact on ODPM
work.
• ODPM recognised the need for a mini-calibration between Censuses.
Greater London Assembly
• They suggested that prior to the Census results, estimates of international migration were
producing figures for some London boroughs that were too high.
• Planning for the 2001 Census had been good. • Conduct of the Census was as planned though the poor pay of field staff could have affected
quality of the enumeration. • The reduction in the mid-year estimate for Westminster looked to be too large. • GLA was in contact with ONS regarding the possibility of a mid-term Census.
Statistics Commission October 2003
58


