
Text Mining
Using HadoopAdam Kuns
&
Steve Jordan
Project Overview
For our project we will use Hadoop components to perform text mining on the
State of the Union Addresses provided at the URL:
http://www.infoplease.com/t/hist/state-of-the-union/
Components that will be used:
Bash Shell to retrieve HTML files and store into Hadoop Distributed File
System(HDFS).
PySpark to preprocess the data in Hadoop and create structured data format.
Hue to perform initial querying and browse HDFS.
Tableau to do data visualizations.
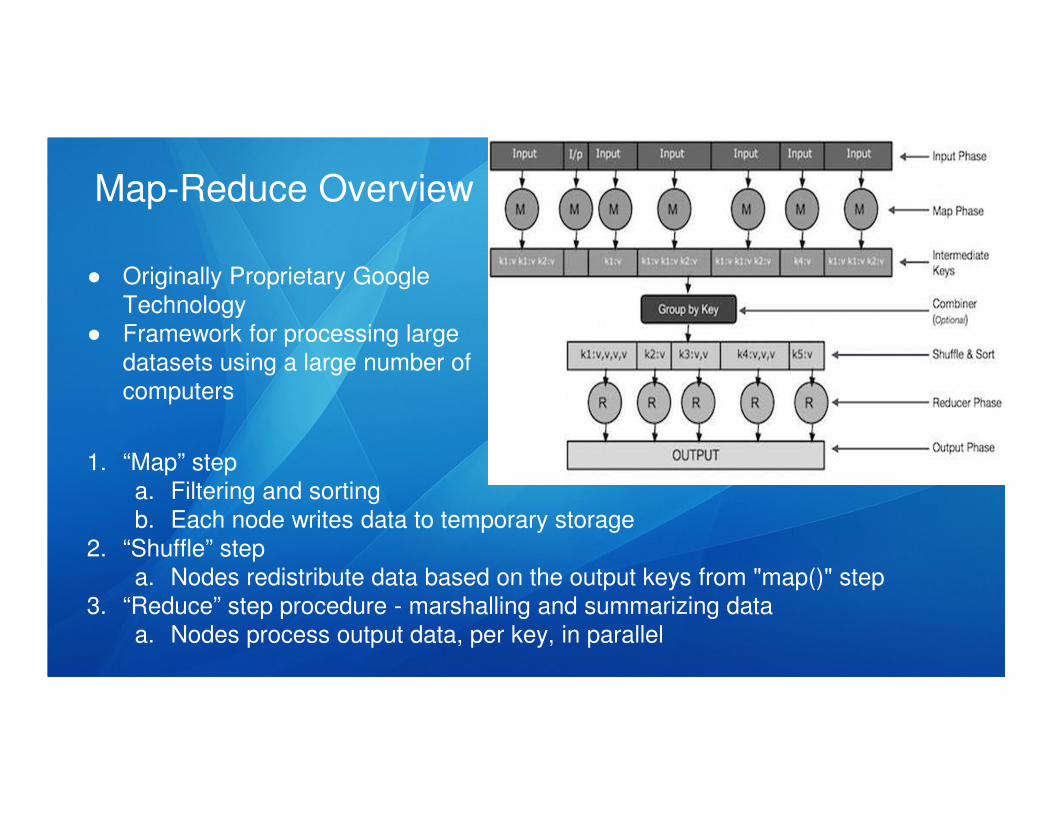
Map-Reduce Overview
● Originally Proprietary Google
Technology
● Framework for processing large
datasets using a large number of
computers
1. “Map” step
a. Filtering and sorting
b. Each node writes data to temporary storage
2. “Shuffle” step
a. Nodes redistribute data based on the output keys from "map()" step
3. “Reduce” step procedure - marshalling and summarizing data
a. Nodes process output data, per key, in parallel
Apache Hadoop Framework
Hadoop is an open-source software framework for distributed storage and
distributed processing
The Hadoop core consists two parts
1. Storage part - Hadoop Distributed File System (HDFS)
a. stores large files (gigabytes to terabytes) across multiple machines
b. replicates data to achieve reliability
2. Processing part - MapReduce Engine
a. JobTracker - client applications submit jobs
Hive Overview
Hive is a Data Warehouse technology developed at to provide an
SQL interface(called HiveQL) for end-user analyst to query data within HDFS, as
opposed to using a language like Java to write Map-Reduce tasks.
Hive compiles the HiveQL statements into Map-Reduce tasks to run on
Hadoop, and then returns the query results
This provides analyst with a familiar query language to utilize and allows them to
provide immediate contributions with little re-training.

Cloudera Impala Overview
Cloudera Impala is Cloudera's open source massively parallel
processing (MPP) SQL query engine for data stored in a computer
cluster running Apache Hadoop.
Provides, on average, faster querying processing than equivalent
Hive queries.
This is due to the fact that Impala:
Daemon services running on the data nodes to avoid startup overhead
Does not require data to be moved or transformed, and does not perform MapReduce
Ideal for data scientist to retrieve results quickly
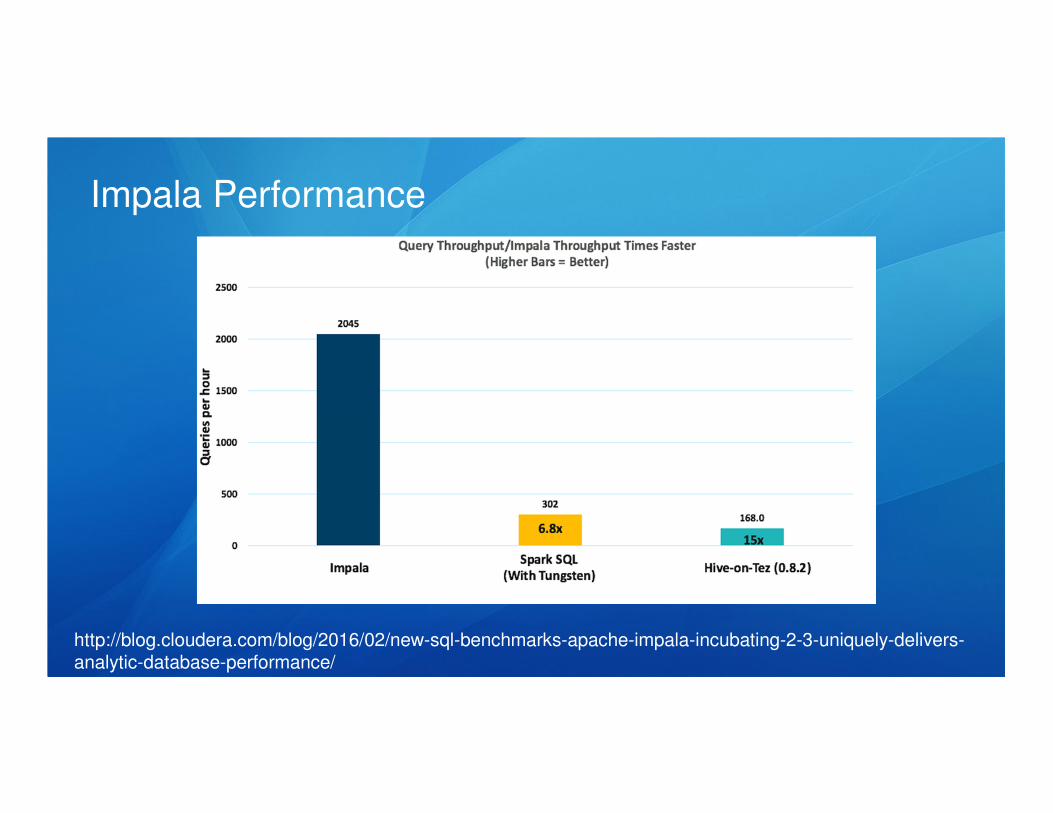
Impala Performance
http://blog.cloudera.com/blog/2016/02/new-sql-benchmarks-apache-impala-incubating-2-3-uniquely-delivers-analytic-database-performance/
Hue Overview
Hue is an open-source web-interface that is used to support the Hadoop
ecosystem and its components.
It provides a graphical user interface for end-users to perform HDFS actions
through File Browser, perform queries using the Hive and Impala Query
Editors, and monitor jobs through Job Browser.
We will be using it explore HDFS and to execute queries.
Spark Overview
Spark is an open source cluster computing framework that provides an api centered around Resilient
Distributed Dataset (RDD).
An RDD is a read-only multiset of data items distributed over a cluster of machines that allows users to
perform Map-Reduce tasks on data without having to write to disk after the reduce step, and allows for
more iterative development of datasets.
Spark usually requires a cluster manager (YARN) and a distributed storage system (HDFS) to operate.
Users can interact with Spark utilizing some well-known languages, mainly Java, Scala, and Python.
Within these languages users create an object called a Spark Context, which lets YARN know to allocate
resources on the Hadoop cluster for Spark.
From there, RDDs can be created using the Spark Context.

Tableau Overview
Tableau is a data visualization software suite that provides users the ability to
connect to multiple data sources, such as Excel, SQL Server, Oracle, Teradata,
Hadoop Hive/Impala, Amazon Aurora, Redshift, EMR, etc.

Tableau
Use Case Demo

Data Retrieval
For retrieving all of the State of the Union addresses, we will use the bash shell
command wget. The URL’s for all of the State Union Addresses are in the
following format:
https://http://www.infoplease.com/t/hist/state-of-the-union/<#>.html
Where <#> is the number of the State of the Union in chronological order, from 1
to 221, i.e.
https://http://www.infoplease.com/t/hist/state-of-the-union/1.html
Would be the first State of the Union address done by George Washington.
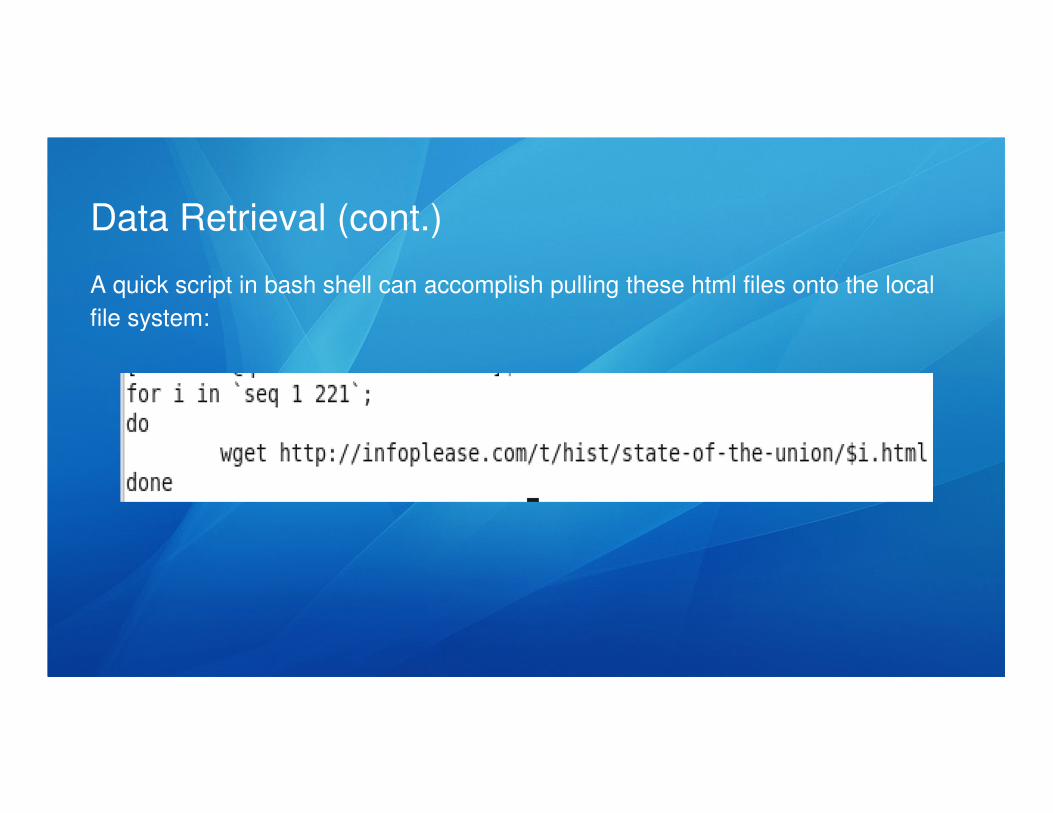
Data Retrieval (cont.)
A quick script in bash shell can accomplish pulling these html files onto the local
file system:
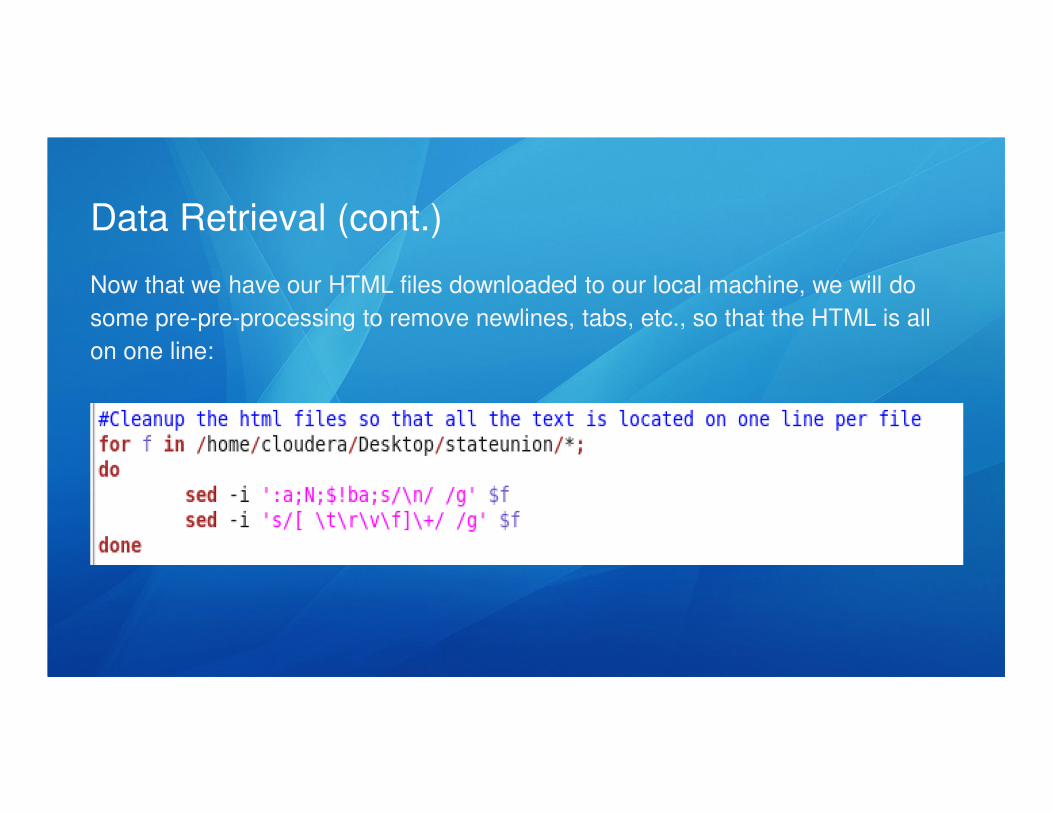
Data Retrieval (cont.)
Now that we have our HTML files downloaded to our local machine, we will do
some pre-pre-processing to remove newlines, tabs, etc., so that the HTML is all
on one line:
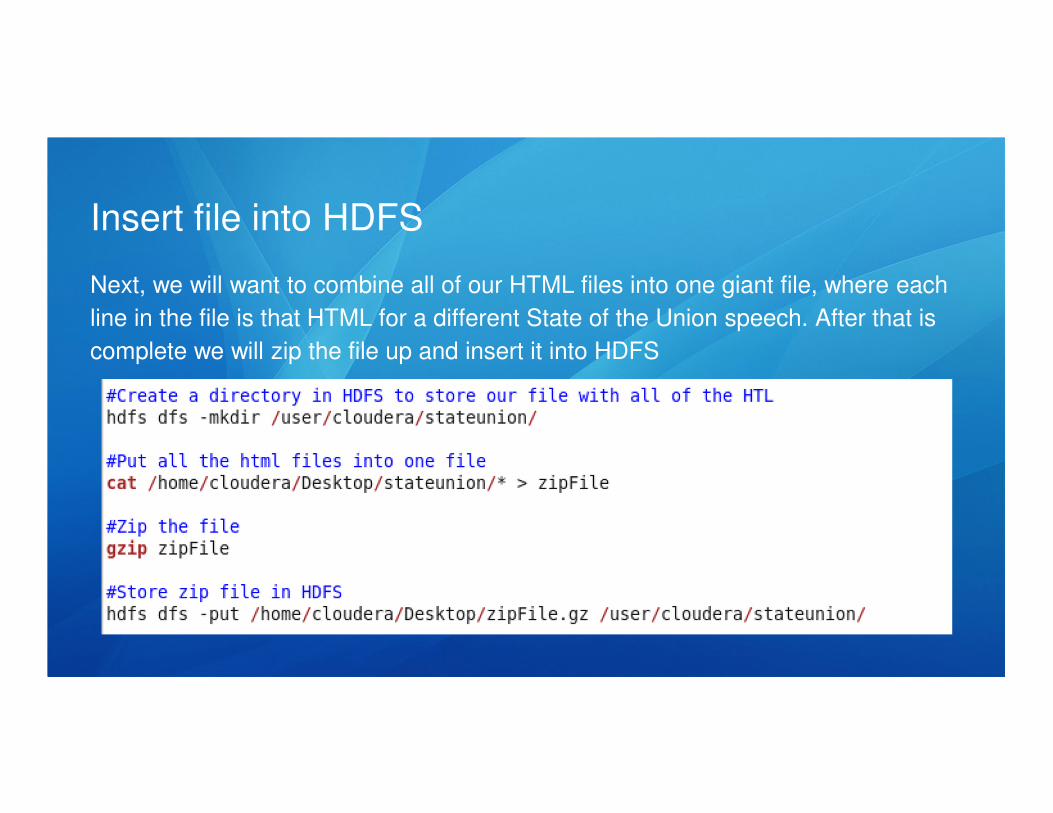
Insert file into HDFS
Next, we will want to combine all of our HTML files into one giant file, where each
line in the file is that HTML for a different State of the Union speech. After that is
complete we will zip the file up and insert it into HDFS
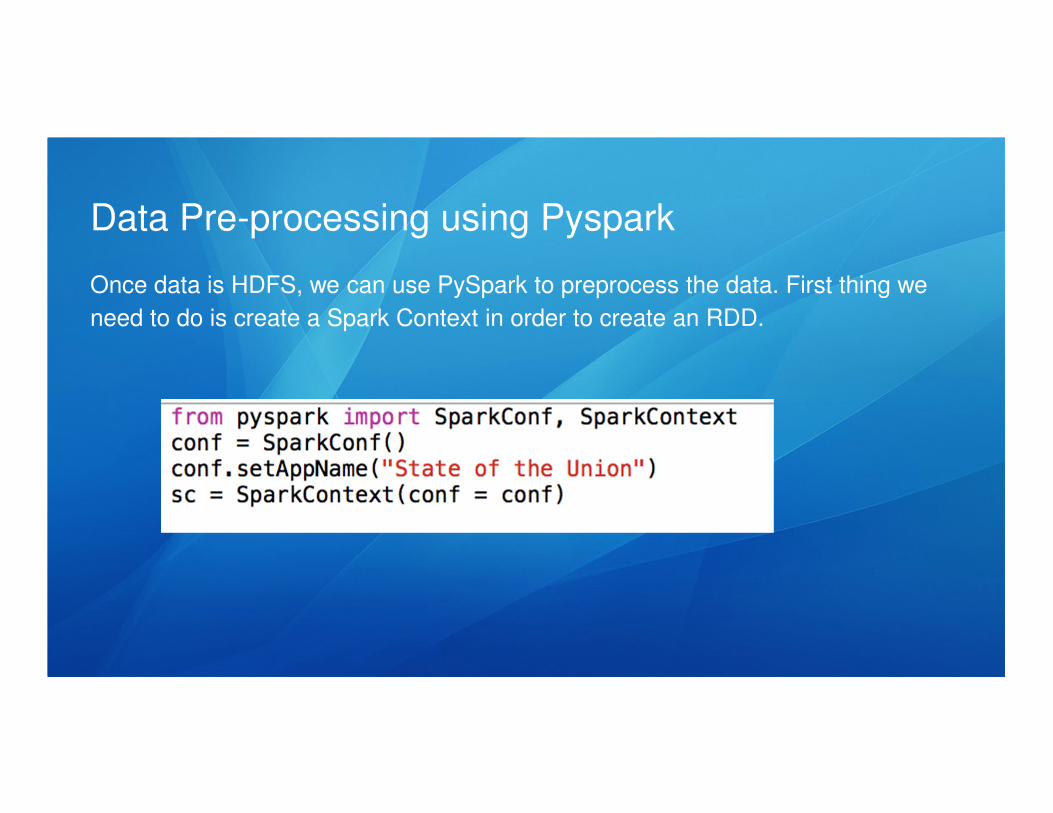
Data Pre-processing using Pyspark
Once data is HDFS, we can use PySpark to preprocess the data. First thing we
need to do is create a Spark Context in order to create an RDD.
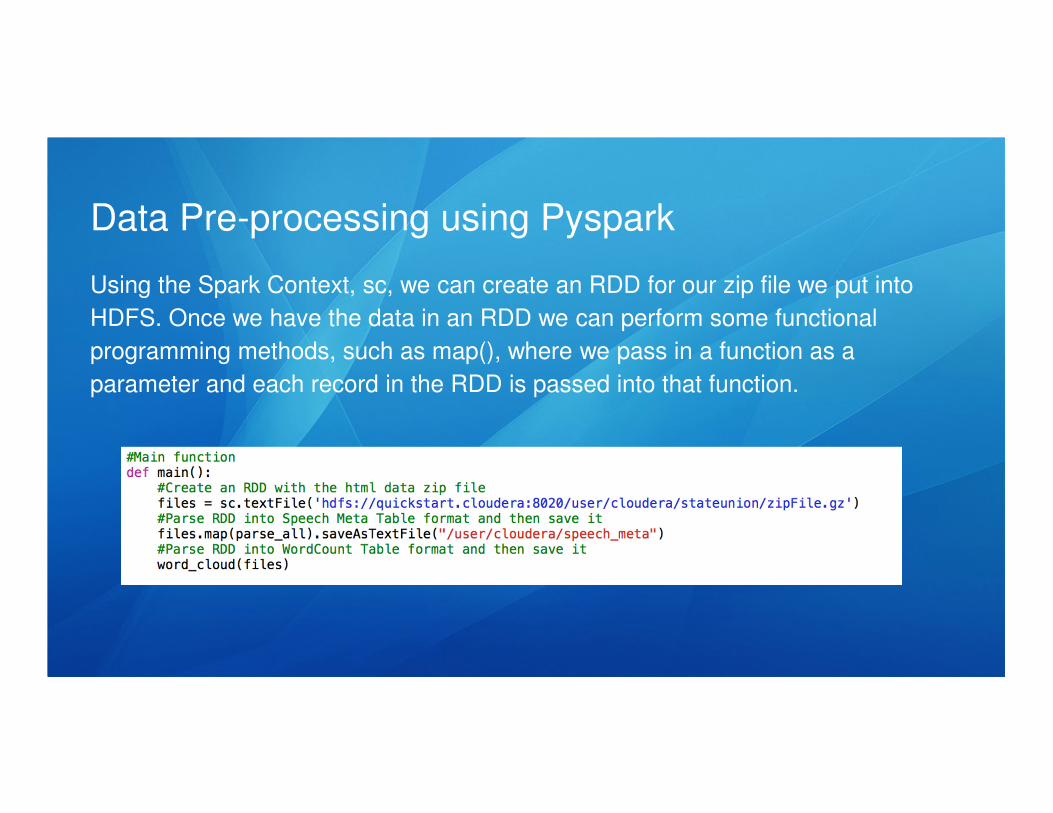
Data Pre-processing using Pyspark
Using the Spark Context, sc, we can create an RDD for our zip file we put into
HDFS. Once we have the data in an RDD we can perform some functional
programming methods, such as map(), where we pass in a function as a
parameter and each record in the RDD is passed into that function.
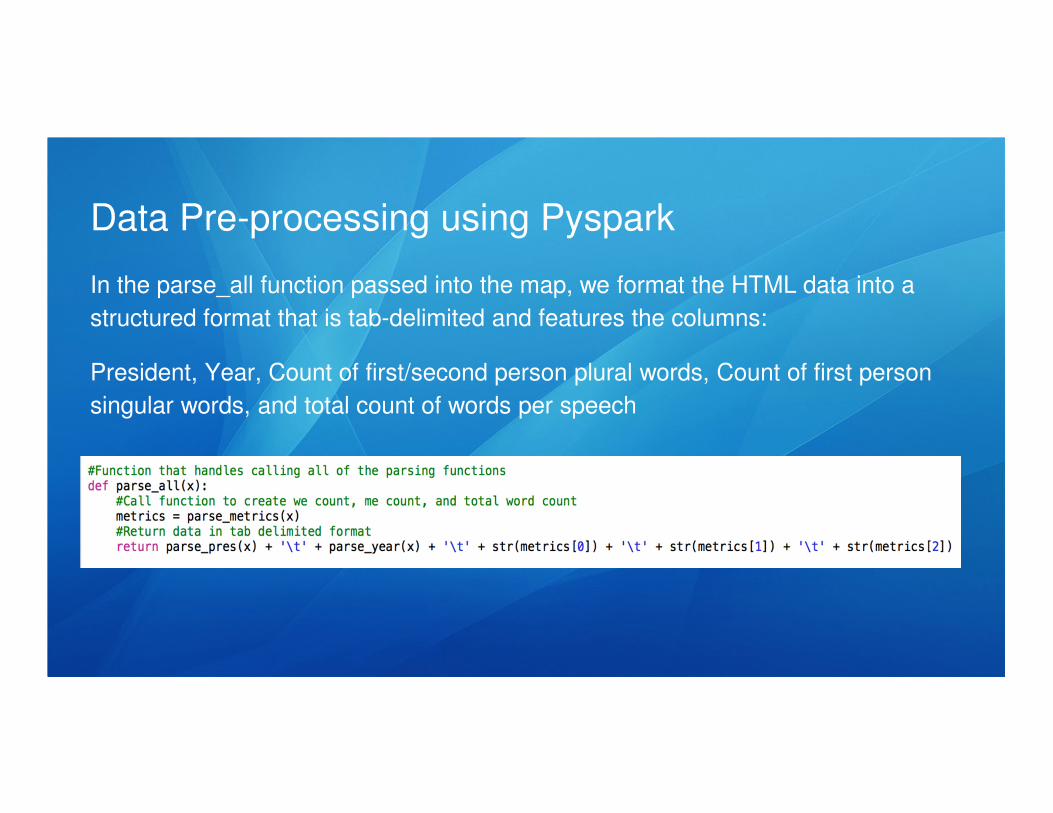
Data Pre-processing using Pyspark
In the parse_all function passed into the map, we format the HTML data into a
structured format that is tab-delimited and features the columns:
President, Year, Count of first/second person plural words, Count of first person
singular words, and total count of words per speech
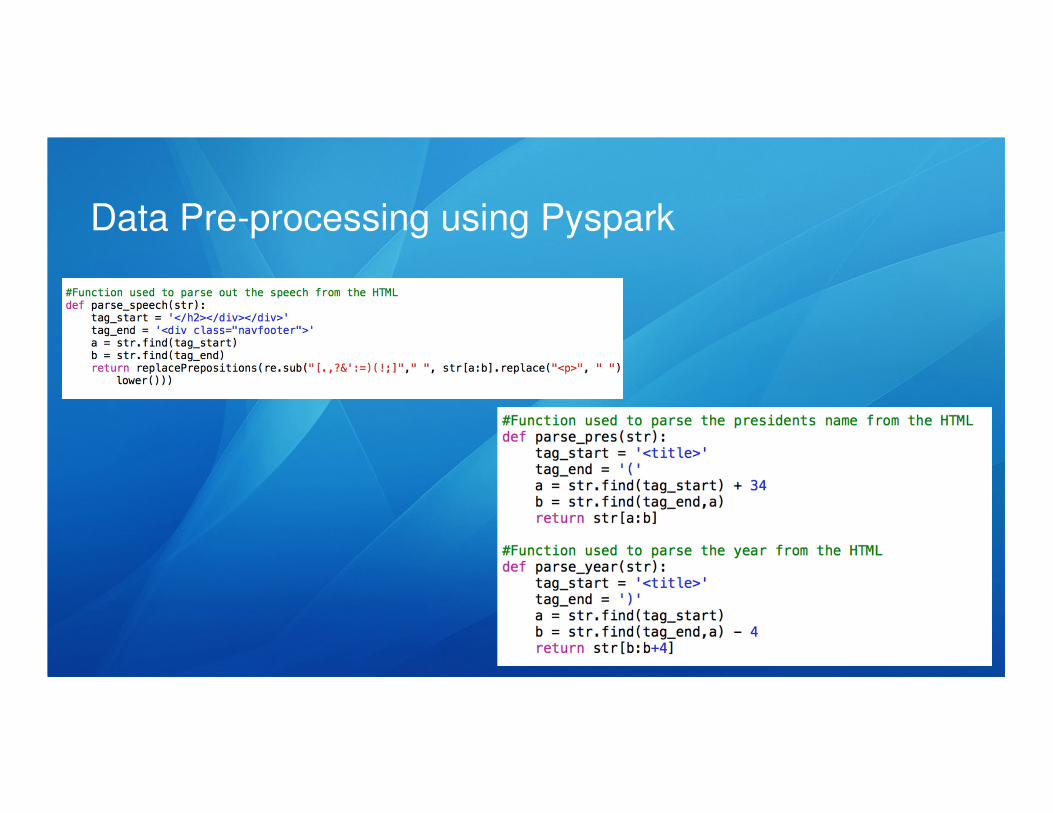
Data Pre-processing using Pyspark
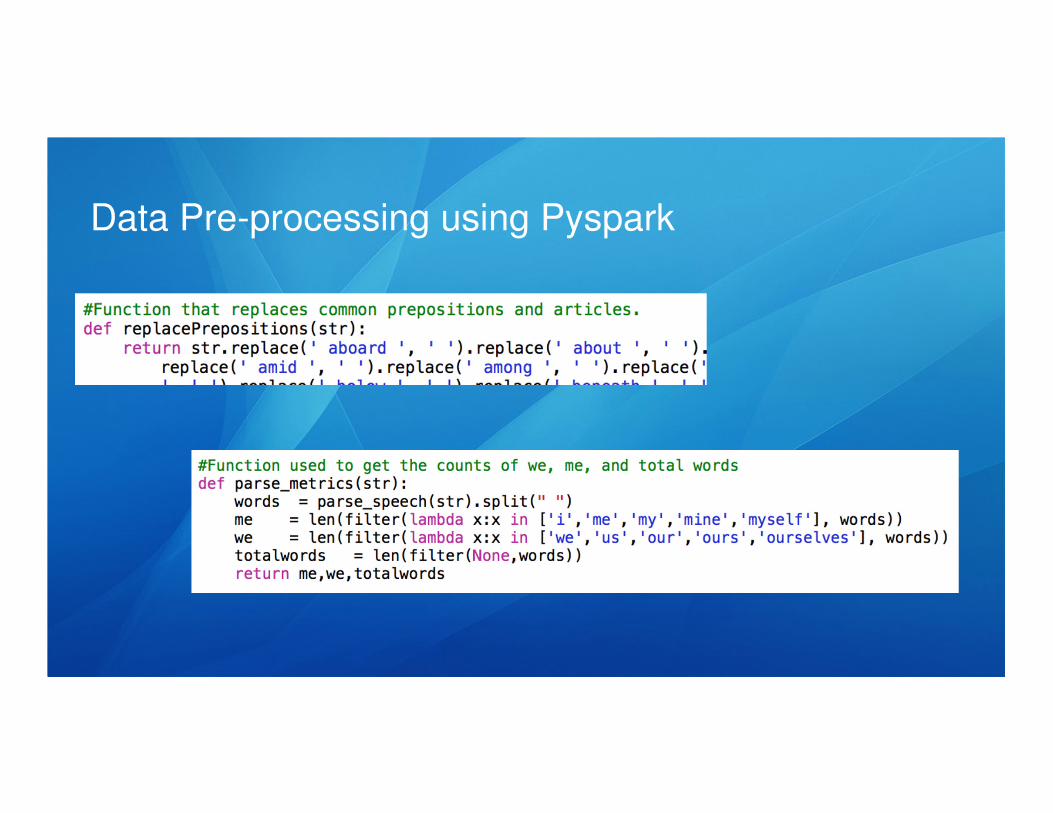
Data Pre-processing using Pyspark
Data Pre-processing using Pyspark
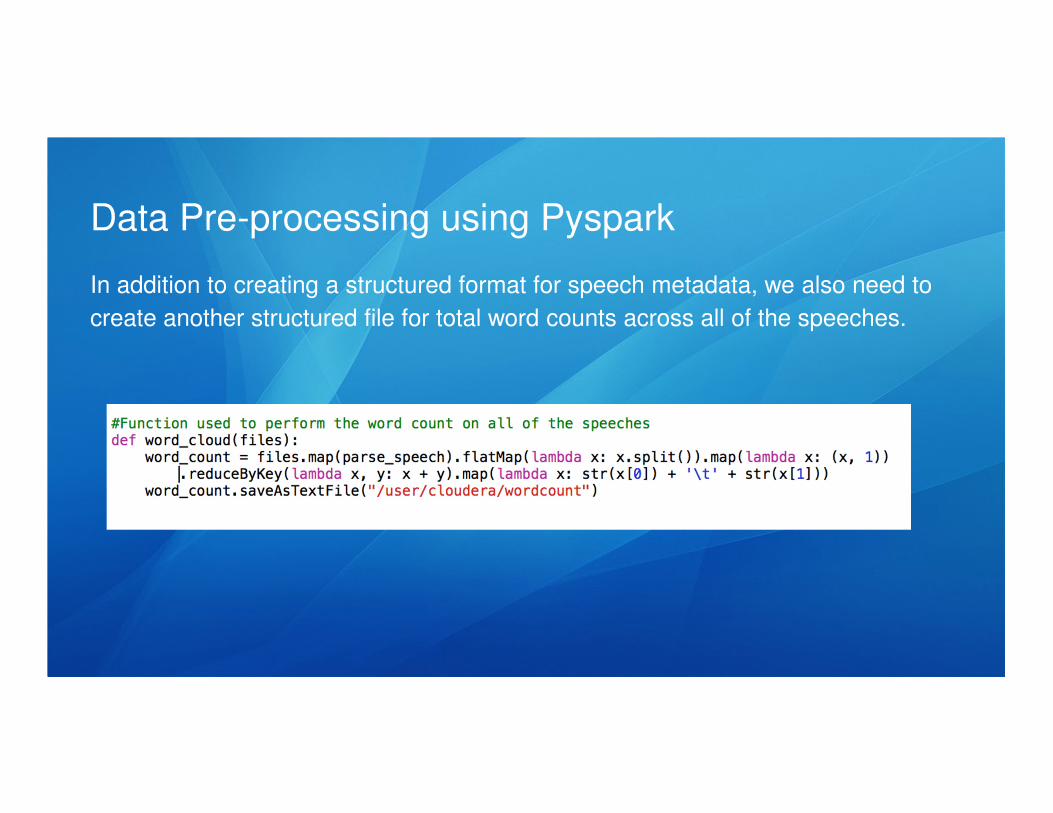
In addition to creating a structured format for speech metadata, we also need to
create another structured file for total word counts across all of the speeches.

Viewing the structured data through Hue
Now that our data is pre-processed, when view the final results through the Hue
web interface

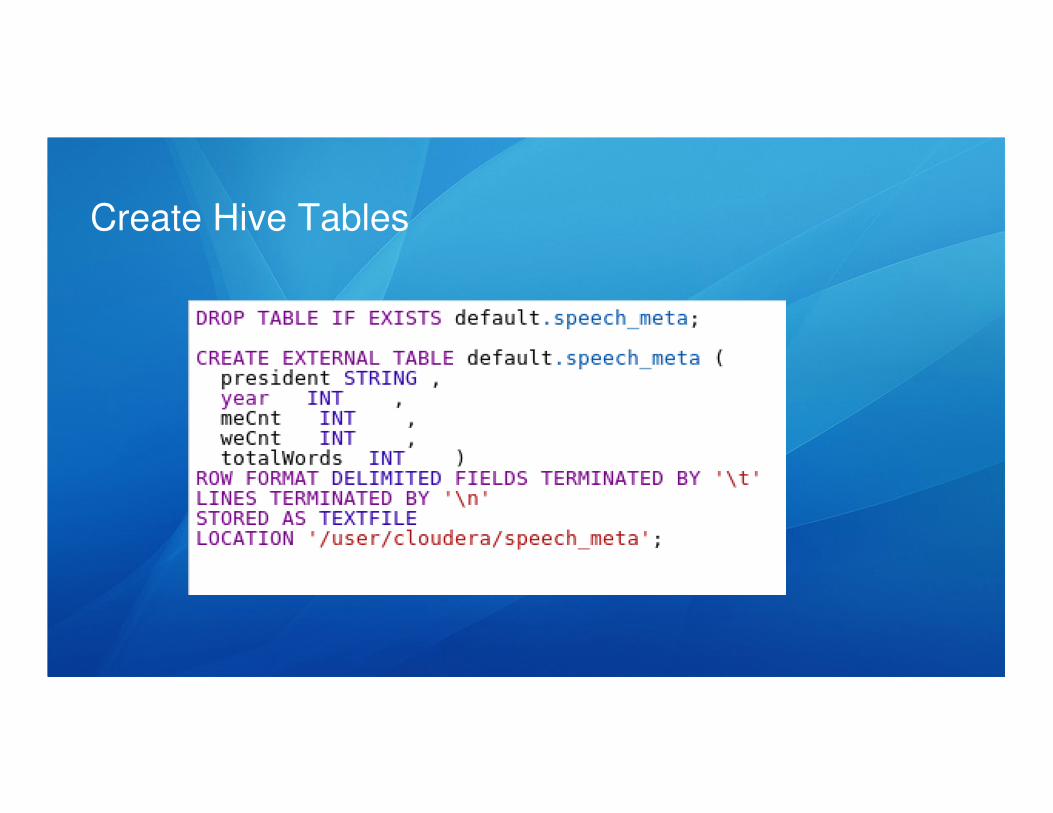
Create Hive Tables
With our data in a delimited format, we can now easily create a Hive table over top
of our two files so that we can easily query them using HiveQL.
Create Hive Tables
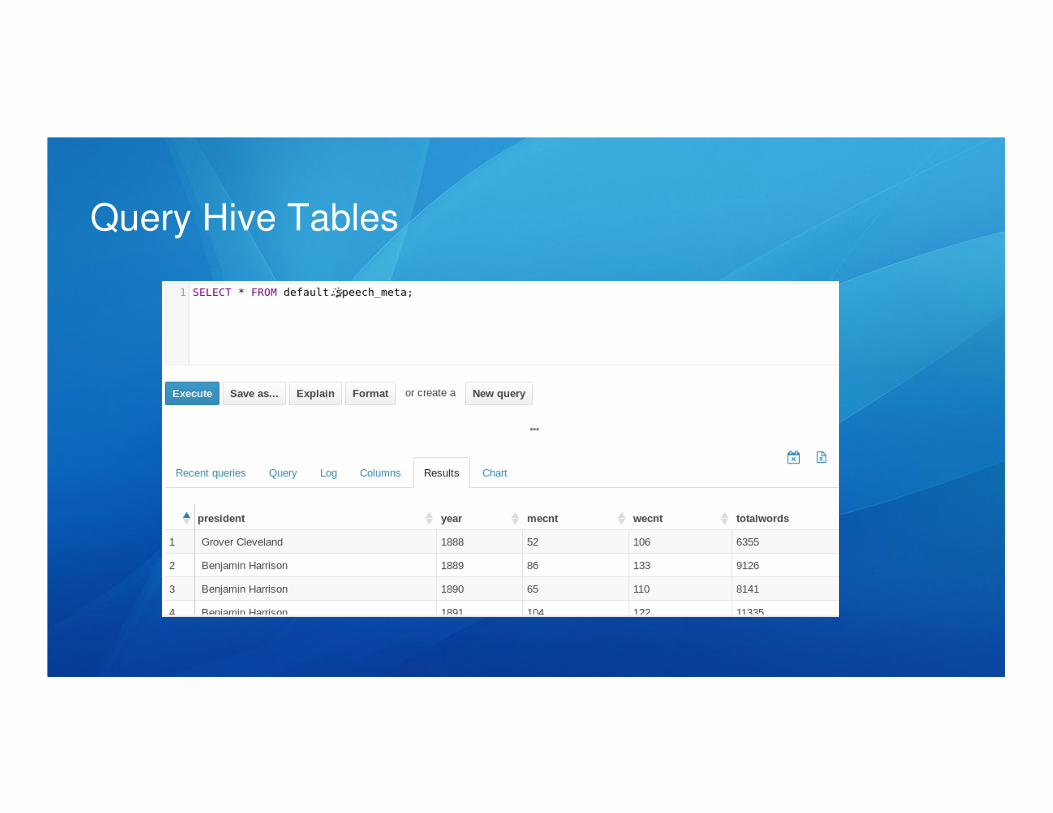
Query Hive Tables

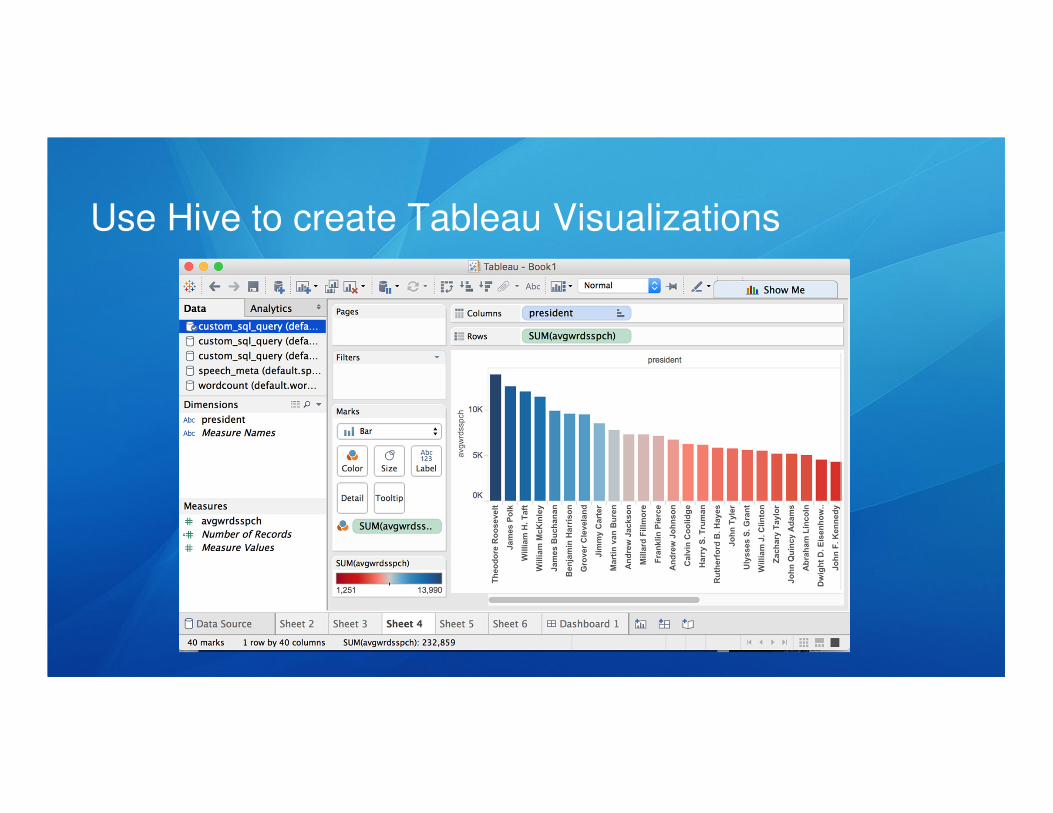
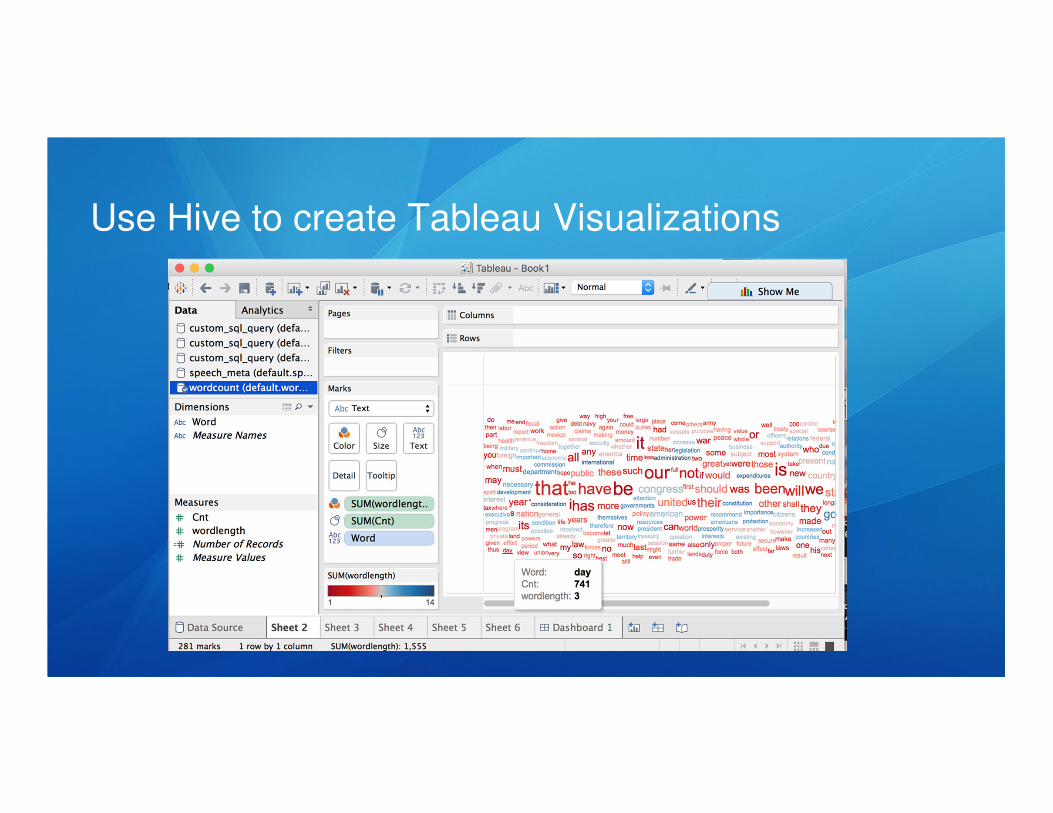
Use Hive to create Tableau Visualizations
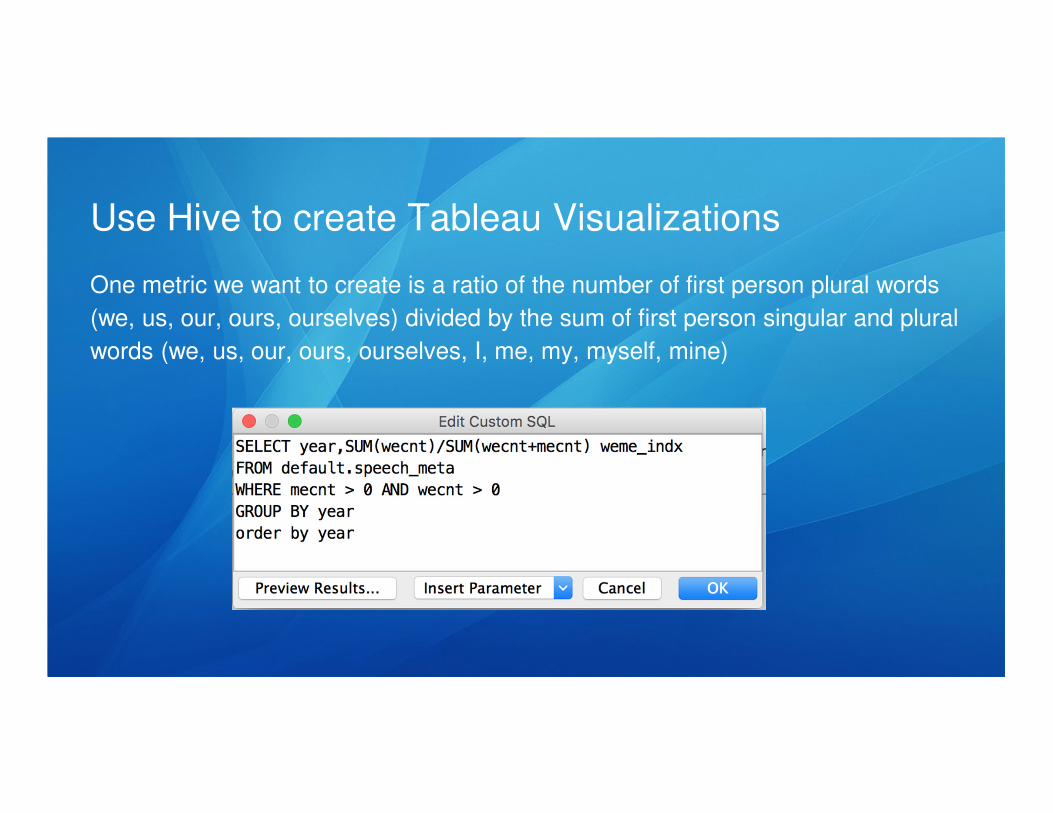
Using those Hive tables, we can connect Tableau to them to create different data
visualizations.
Use Hive to create Tableau Visualizations
One metric we want to create is a ratio of the number of first person plural words
(we, us, our, ours, ourselves) divided by the sum of first person singular and plural
words (we, us, our, ours, ourselves, I, me, my, myself, mine)
Use Hive to create Tableau Visualizations
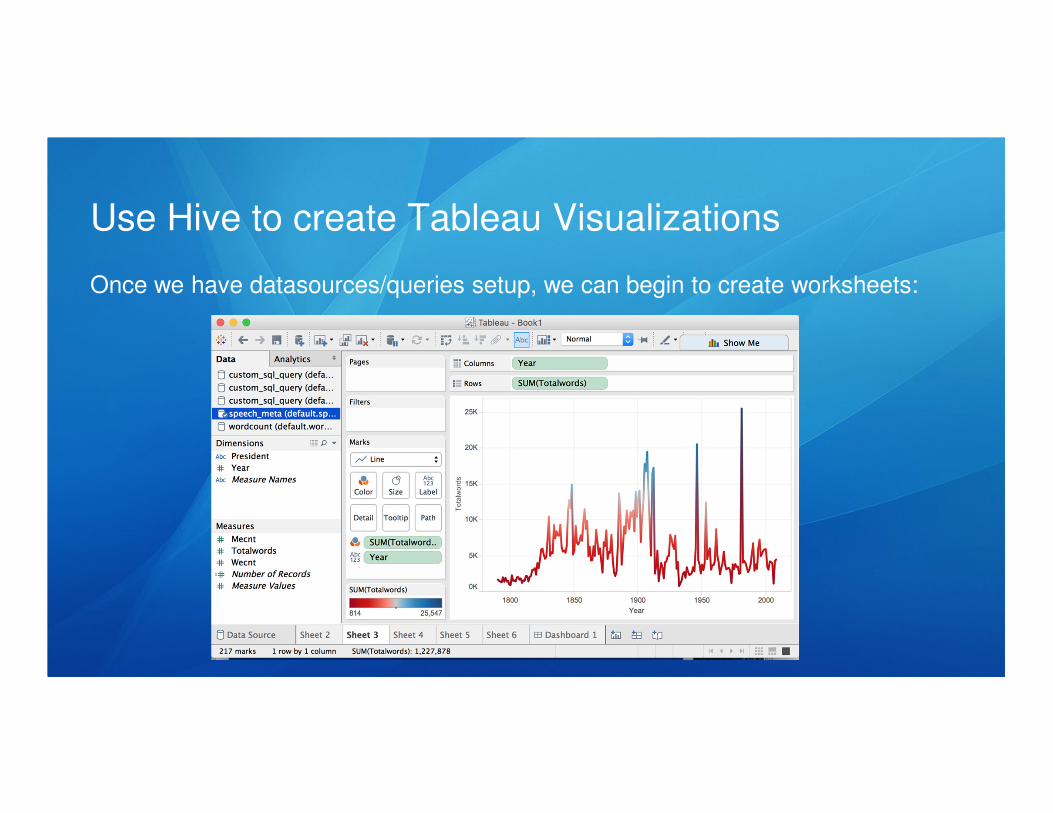
Once we have datasources/queries setup, we can begin to create worksheets:
Use Hive to create Tableau Visualizations
Use Hive to create Tableau Visualizations
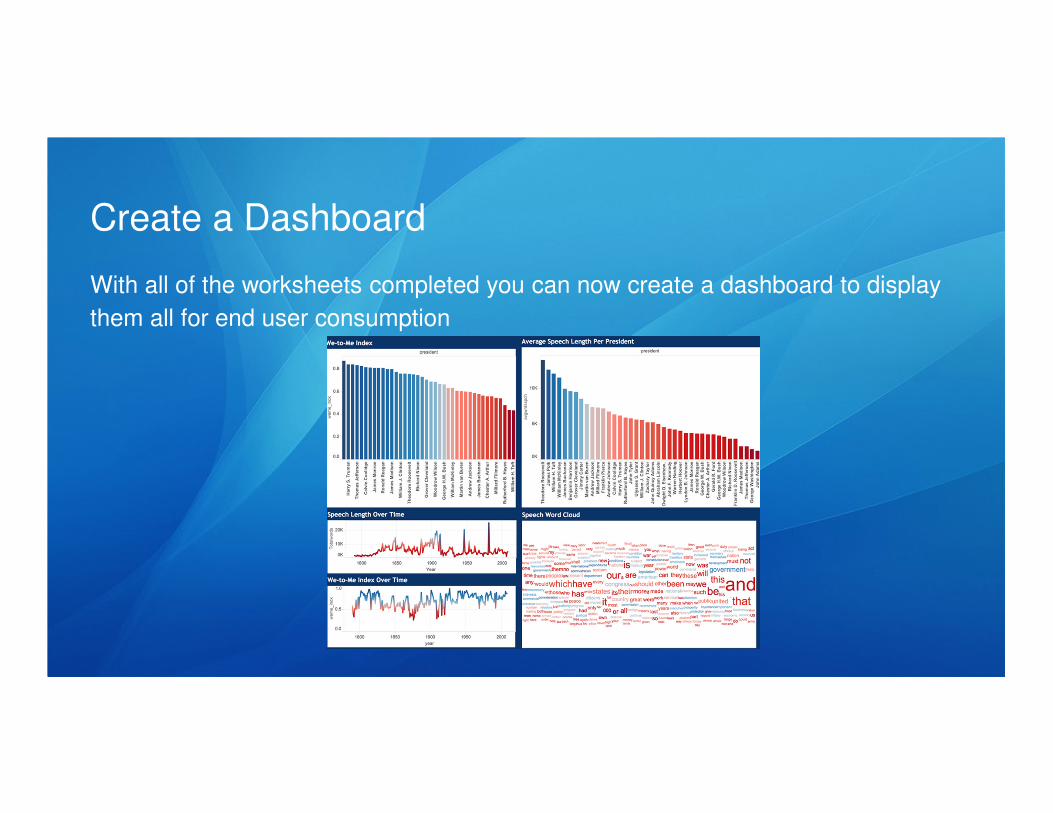
Create a Dashboard
With all of the worksheets completed you can now create a dashboard to display
them all for end user consumption

Additional Work and Future Features
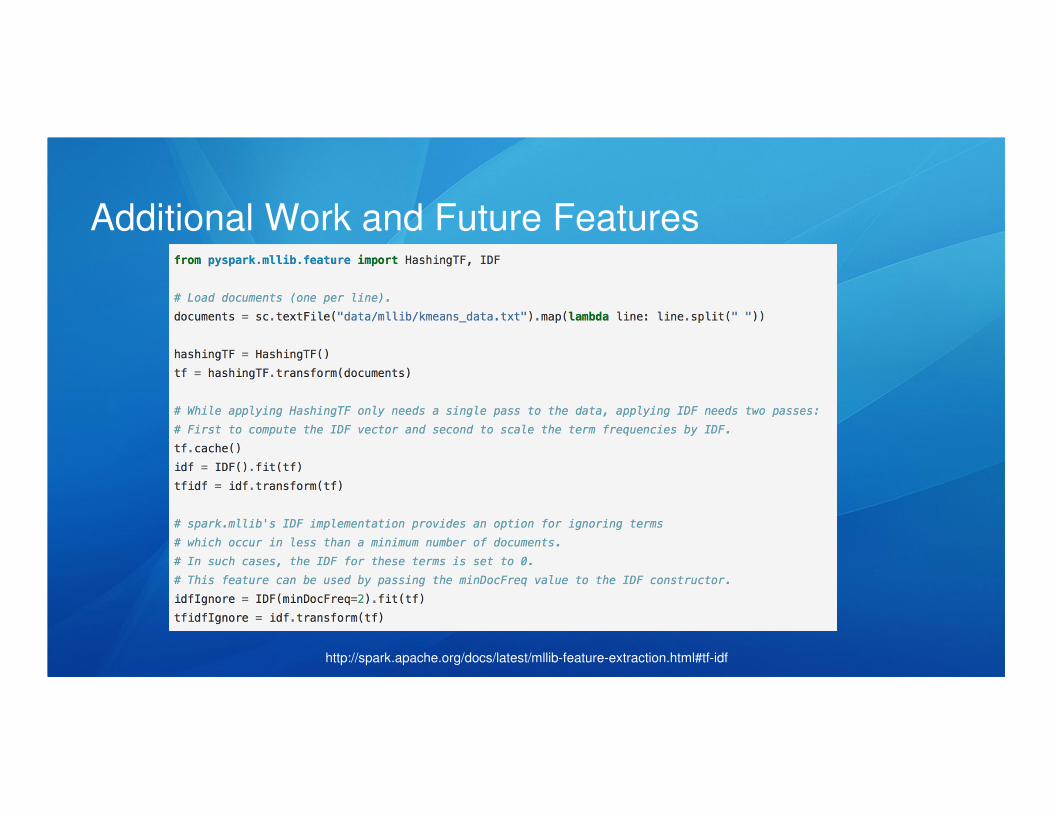
Unfortunately with this project we ran out of time and ran into some errors when
trying to get Numpy to work in PySpark for some additional features.
But eventually we would want to perform some more advanced data mining
techniques, such as Term Frequency-inverse document frequency using
PySpark to determine term importance within the all of the speeches.
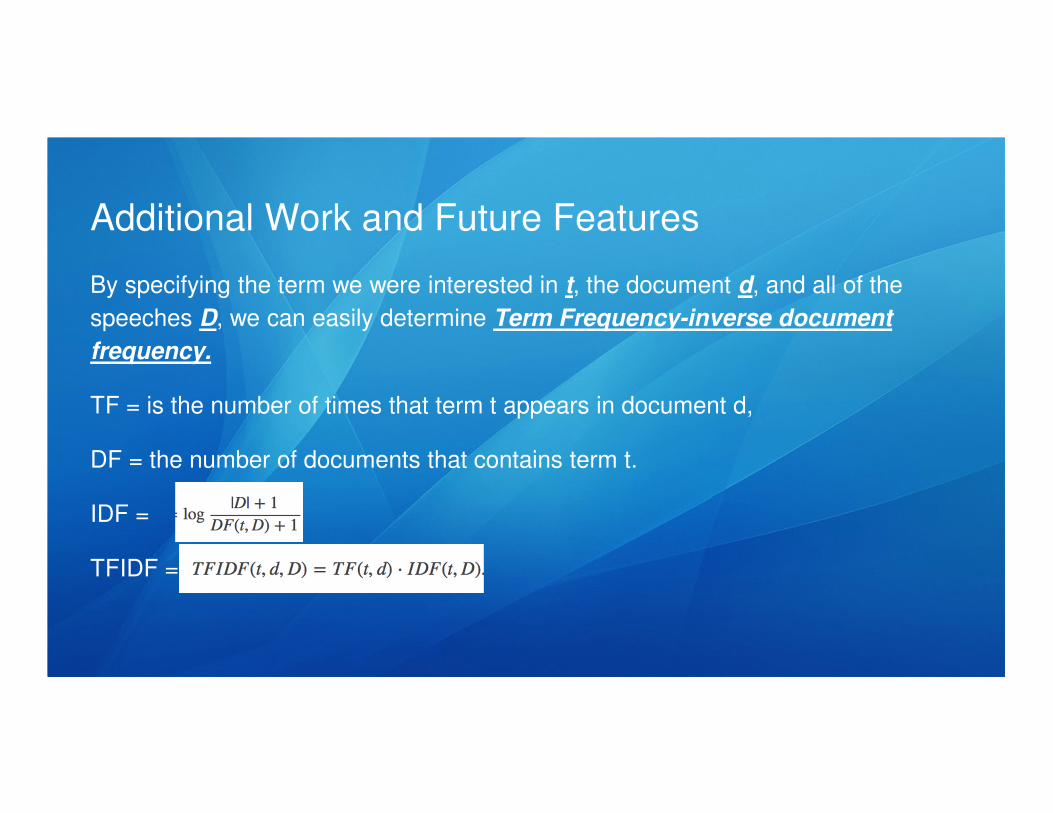
Additional Work and Future Features
By specifying the term we were interested in t, the document d, and all of the
speeches D, we can easily determine Term Frequency-inverse document
frequency.
TF = is the number of times that term t appears in document d,
DF = the number of documents that contains term t.
IDF =
TFIDF =
Additional Work and Future Features
http://spark.apache.org/docs/latest/mllib-feature-extraction.html#tf-idf


