Download - Text categorization as a graph
Text Categorization as a Graph Classification Problem
1
OutlineSection 1 IntroductionSection 2 Review of the related workSection 3 Preliminary conceptsSection 4 Proposed approachesSection 5 Experimental evaluationSection 6 ConclusionReferences
2
1. What is text mining ?
2. Bag-of-words and its issues
3. Graph-of-words - A new approach
Introduction
3

IntroductionWhat is Text mining?
Search engines
Understand user’s queries. E.g. What is Google?
Find matching websites or documents (ranking).
Product recommendation
Understand product description.
Understand product reviews. 4
Introduction
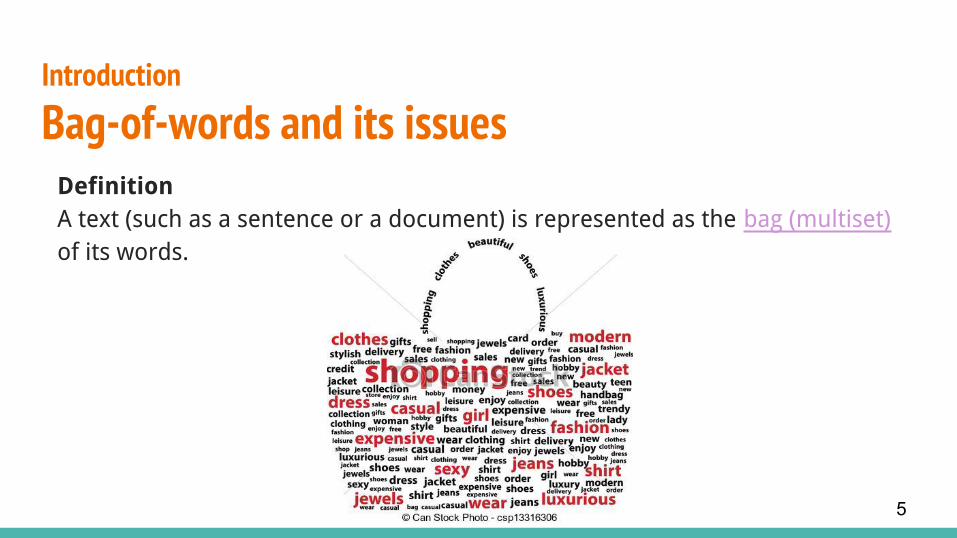
Bag-of-words and its issuesDefinitionA text (such as a sentence or a document) is represented as the bag (multiset) of its words.
5

Introduction
Bag-of-words and its issues
Example
“He likes watching action movies, she likes watching romantic movies”⇒ [ “He”, “likes”, “watching”, “action”, “movies”, “she”, “likes”, “watching”, “romantic”, “movies” ].
The sentence has 10 distinct words, by using indexes of the list, it can be represented by a 10-entry vector: [ 1, 2, 2, 1, 2, 1, 2, 2, 1, 2 ]
6
Introduction
Bag-of-words and its issues
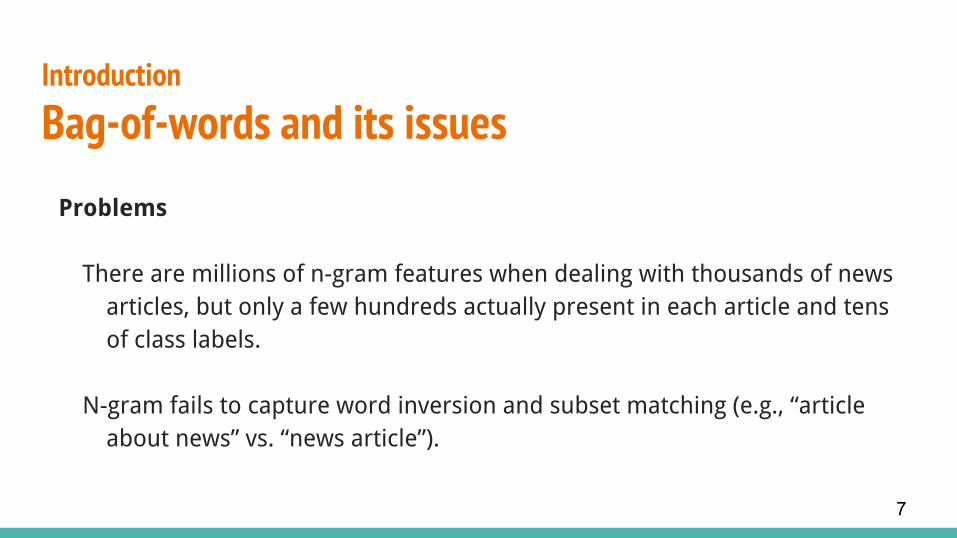
Problems
There are millions of n-gram features when dealing with thousands of news articles, but only a few hundreds actually present in each article and tens of class labels.
N-gram fails to capture word inversion and subset matching (e.g., “article about news” vs. “news article”).
7

Introduction
Graph-of-words - A new approach
8
Consider the task of text categorization as a graph classification problem.
Represent textual documents as graph-of-words instead of traditional n-gram bag-of-words.
Extract more discriminative features that correspond to long-distance n-grams through frequent subgraph mining.

Introduction
Graph-of-words - A new approach
9
Summary:1. Constructs a graph-of-words for each document
in the set2. For each graphs from step 1 , extract its main
core (for cost-effective)3. Find all frequent subgraphs size n in the
obtained set of graphs from step 24. Remove isomorphic subgraphs to reduce the
total number of features5. Finally, extract n-gram features on the
remaining text

● Subgraph feature mining on graph-of-words representations by Markov et al. (2007)
Kudo and Matsumoto (2004), Matsumoto et al. (2005), Jiang et al. (2010) and Arora et al. (2010) suggested using parse and dependency trees representation for text categorization, but the support value (i.e. the total number of features) was not discussed and can potentially lead to millions of subgraphs on standard datasets.
Review of the related works
10

1. Graph-of-words model
2. Subgraph isomorphism
3. K-core and main core
Preliminary Concepts
11

Definition
An undirected graph G = (V, E) , where
V is the set of vertices, which represents unique terms of the document
E is the set of edges, which represents co-occurrences between the terms within a fixed-size sliding window
12
Preliminary Concepts
Graph-of-words model

DefinitionGiven two graphs G and H, an isomorphism of G and H is a bijection between the vertex sets of G and H such that any two vertices u and v of G are adjacent in G if and only if f(u) and f(v) are adjacent in H.
Example
13
Preliminary Concepts
Subgraph isomorphism

Definition
A subgraph H = (V’, E’) induced by the subset of vertices V’ ⊆ V and the subset of edges E’ ⊆ E of graph G = (V, E) is called a k-core, where k is an integer, if and only if: H is the maximal subgraph holds the property ∀ v ∈ V’, deg(v) >= k.
k-core: a maximal connected subgraph whose vertices are at least of degree k within that subgraph.
main core: the k-core with the largest k.
Preliminary Concepts
K-core and main core
14

Example
Fig. Two 3-cores of a graph
Preliminary Concepts
K-core and main core
15
1. Unsupervised feature mining using gSpan2. Find frequent subgraphs using gSpan3. Unsupervised support selection4. Considered classifiers5. Multiclass scenario6. Main core mining using gSpan
Proposed approaches
16

Idea
● Considered the task of text categorization as a graph classification problem
● Representing textual documents as graph-of-words and then extracting subgraph features to train a graph classifier.
● Each document is a separate graph-of-words and the collection of documents thus corresponds to a set of graphs.
Proposed approaches
Unsupervised feature mining using gSpan
17

Given
● D = {G0, G1, G2, ..., GN} a graph dataset● Support(g) the number of graphs (in D) in which g is a subgraph● minSup minimum support threshold
Problem
Find any subgraph so that support(g) >= minSup
Proposed approaches
Find frequent subgraphs using gSpan
18

Frequent subgraph : a subgraph of multiple graph in D
Proposed approaches
Find frequent subgraphs using gSpan
19

Baseline solution
● Enumerate all the subgraphs and testing for isomorphism throughout the collection => very expensive
Propose solution
● Use gSpan (graph-based Substructure pattern mining )
Proposed approaches
Find frequent subgraphs using gSpan
20
gSpan Idea:1. For each graph, build a lexicographic order of all the edges using depth-first-
search (DFS) traversal
2. Assign to each of them a unique minimum DFS code.
3. Based on all these DFS codes, a hierarchical search tree is constructed at the
collection-level.
4. By pre-order traversal of this tree, gSpan discovers all frequent subgraphs
with required support.
Proposed approaches
Find frequent subgraphs using gSpan
21

Note :● Given two graphs G and G’
G is isomorphic to G’ if and only if minDFS(G) = minDFS(G’)
The lower the support will result in:
1. more features
2. longer the mining
3. longer feature vector generation
4. longer learning .
Proposed approaches
Find frequent subgraphs using gSpan
22

GivenD = {G0, G1, G2,... ,GN } a graph dataset
Support(g) denotes the number of graphs (in D) in which g is a subgraph
minSup denotes the minimum support threshold
Proposed approachesUnsupervised support selection (Select best minSup)
23

SituationThe classifier can only improve its goodness of fit with more features
=> It is likely that the lowest support will lead to the best test accuracy
As the support decreases, the number of features increases slightly up until a point where it increases exponentially
=> This makes both the feature vector generation and the learning expensive, especially with multiple classes.
Proposed approachesUnsupervised support selection (Select best minSup)
24
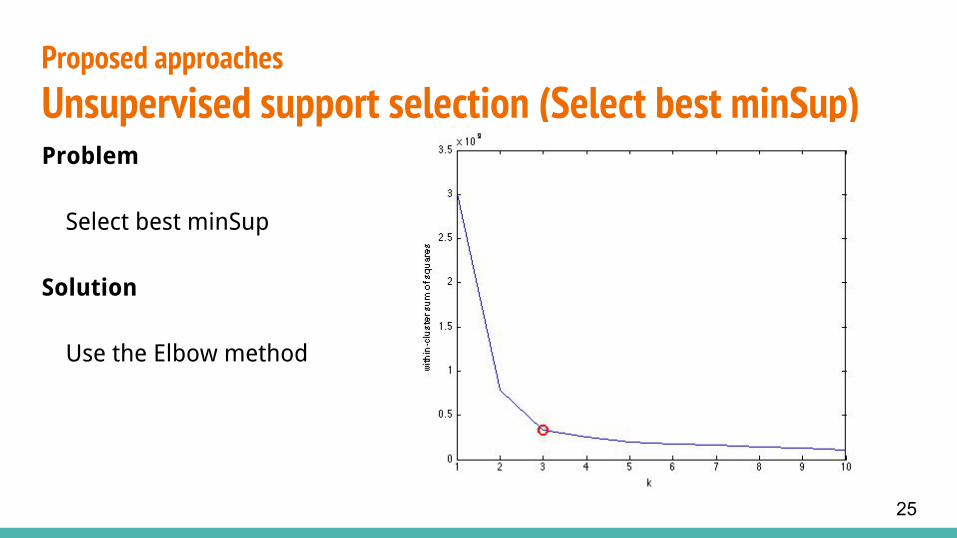
Problem
Select best minSup
Solution
Use the Elbow method
Proposed approachesUnsupervised support selection (Select best minSup)
25

Elbow methodExample: selecting the number of clusters in k-means clusteringChoose a number of clusters so that adding another cluster doesn't give much better modeling of the data
Proposed approachesUnsupervised support selection (Select best minSup)
26

Elbow method
In our case :
Choose a minSup so that decreasing this value by a unit will :
not give much better accuracy
but increase the number of features significantly
Proposed approachesUnsupervised support selection (Select best minSup)
27
Standard baseline classifiers
K-nearest neighbors (kNN) (Larkey and Croft, 1996)
Naive Bayes (NB) (McCallum and Nigam, 1998)
Linear Support Vector Machines (SVM) (Joachims, 1998)
Proposed approaches
Considered classifiers
28

ProblemSingle support value might lead to some classes generating a tremendous number of features ( hundreds of thousands ) and some others only a few (a few hundreds subgraphs)
⇒ Need an extremely low support to include discriminative features for these minority classes
⇒ Resulting in an exponential number of features because of the majority classes.
Proposed approaches
Multiclass scenario
29

Solution
Mine frequent subgraphs per class using the same relative support (in %)
Then aggregate each feature set into a global one at the cost of a supervised process (but still avoids cross validating).
Proposed approaches
Multiclass scenario
30
ProblemThe number of features (subgraphs) to be extracted is very large when mining
frequent subgraphs directly !
How to extract discriminative features while maintaining word dependence and retaining as much classification information as possible ?
SolutionReduce the graphs’ size by keeping the densest subgraphs.
Proposed approaches
Main core using gSpan
31

ImplementationBatagelj-Zaveršnik algorithm, which is optimally implemented (in C++ language) by gSpan.
Proposed approaches
Main core using gSpan
32

1. Datasets2. Results3. Unsupervised support selection4. Distributions of mined n-grams
Experimental evaluation
33
Experimental evaluation
Datasets
34
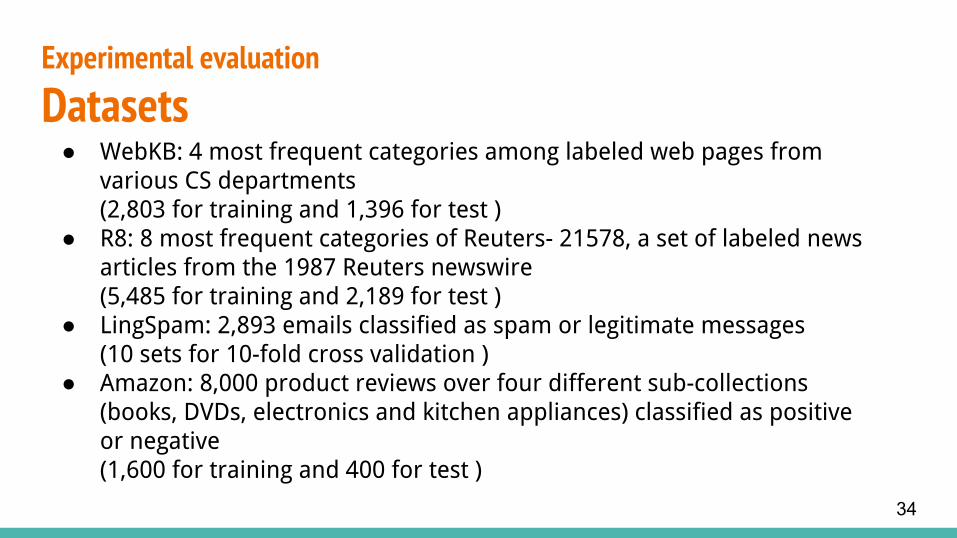
● WebKB: 4 most frequent categories among labeled web pages from various CS departments(2,803 for training and 1,396 for test )
● R8: 8 most frequent categories of Reuters- 21578, a set of labeled news articles from the 1987 Reuters newswire(5,485 for training and 2,189 for test )
● LingSpam: 2,893 emails classified as spam or legitimate messages(10 sets for 10-fold cross validation )
● Amazon: 8,000 product reviews over four different sub-collections (books, DVDs, electronics and kitchen appliances) classified as positive or negative(1,600 for training and 400 for test )

Experimental evaluation
Datasets
35
● Multi-class document categorization : WebKB and R8
● Spam detection (Ling-Spam)
● Opinion mining (Amazon) so as to cover all the main subtasks of text categorization

Table 1: Total number of features (n-grams or subgraphs) vs. number of features present only in main cores along with the reduction of the dimension of the feature space on all four datasets.
36
Experimental evaluation
Results

Table 2: Test accuracy and macro-average F1-score on four standard datasets. Bold font marks the bestperformance in a column * indicates statistical significance at p < 0.05 using micro sign test with regards
to the SVM baseline of the same column. MC corresponds to unsupervised feature selection using themain core of each graph-of-words to extract n-gram and subgraph features. gSpan mining support
values are 1.6% (WebKB), 7% (R8), 4% (LingSpam) and 0.5% (Amazon).
37
Experimental evaluation
Results

Figure 2: Distribution of non-zero n-gram feature values before and after unsupervised feature selection (main core retention) on R8 dataset. 38
Experimental evaluation
Results

Figure 3: Number of subgraph features/accuracy in test per support (%) on WebKB (left) and R8 (right) datasets: in black, the selected support value chosen via the elbow method and in red, the accuracy in
test for the SVM baseline.
Experimental evaluation
Unsupervised support selection
39
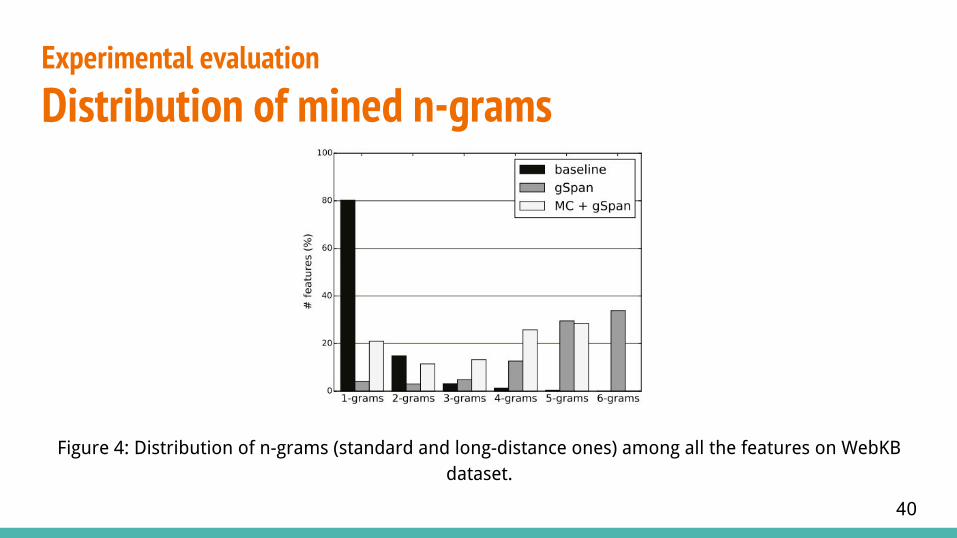
Figure 4: Distribution of n-grams (standard and long-distance ones) among all the features on WebKB dataset.
Experimental evaluation
Distribution of mined n-grams
40

Figure 5: Distribution of n-grams (standard and long-distance ones) among the top 5% most discriminative features for SVM on WebKB dataset.
Experimental evaluation
Distribution of mined n-grams
41
ConclusionNew graph-of-words approach for text mining.
Consider the problem as a graph classification
Achieved:
Extract more discriminative features that correspond to long-distance n-grams through frequent subgraph mining
42

ReferencesText Categorization as a Graph Classification Problem (François Rousseau, Emmanouil Kiagias ,Michalis Vazirgiannis )
http://www.aclweb.org/anthology/P15-1164
gSpan: Graph-Based Substructure Pattern Mining (Xifeng Yan and Jiawei Han )
http://cs.ucsb.edu/~xyan/papers/gSpan-short.pdf
Determining the number of clusters in a data set - The Elbow Method
https://en.wikipedia.org/wiki/Determining_the_number_of_clusters_in_a_data_set
Graph isomorphism
https://en.wikipedia.org/wiki/Graph_isomorphism
43

44


