
Tensile Ductility and Localized Fracture of AHSS
Xin Sun
Pacific Northwest National laboratory
Workshop for Addressing Key Technology Gaps
in Implementing Advanced High-Strength Steels
for Automotive Lightweighting
February 9, 2012
PNNL-SA-85780 1

Ductility under uniform loading:
Macroscopic phenomenological approach
Meso-scale microstructure based approach
Fracture under localized loading:
Occurs in bending (especially under tension)
Edge stretching
Conventional FLD does not apply
Difficult to predict analytically
Key Technology Gaps in Implementing 1st GEN Advanced High Strength Steel – Ductility and Localized Fracture

ASP Meeting, July 22, 2011
Phenomenological
MMC Fracture Model
Plasticity
Model
Isotropic/
Anisotropic
Initial Yield
Associated/
Non-associated
Flow Rule
Isotropic/
Kinematic
Hardening
Partially Coupled
Fracture Prediction
Model
Damage
Evolution
Rule
Post-failure
Softening
MIT’s fracture modeling framework
Fracture
Locus/Envelope

ASP Meeting, July 22, 2011
Fracture calibration tests
Plane strain
Plane stress
Dog-bone
Round bars
Flat grooved
Cruciform
Upsetting
Torsion
Butterfly
-1
-0.5
0
0.5
1
Shear
A complete representation of various stress states and
ranges covered by various tests

ASP Meeting, July 22, 2011
Hybrid experimental-numerical calibration
Various types of fracture specimens
Careful correlation between experiments and FEA ensures accurate local strain and stress state evolution
DIC FEA

ASP Meeting, July 22, 2011
Results: Fracture initiation location
Square punch Failure location shifting is accurately predicted.

Predicting AHSS Ductility under Uniform Deformation – PNNL
Microstructure based finite element analyses developed to predict tensile ductility and FLD of 1st Gen AHSS:
DP980:
Effects of martensite mechanical properties on behavior of DP980
Effects of martensite morphology on forming behavior of DP980
Effects of martensite volume fraction on DP steel properties:
Stress vs. strain behaviors
Failure driving force
TRIP800:
Transformation kinetics under different loading conditions simulated
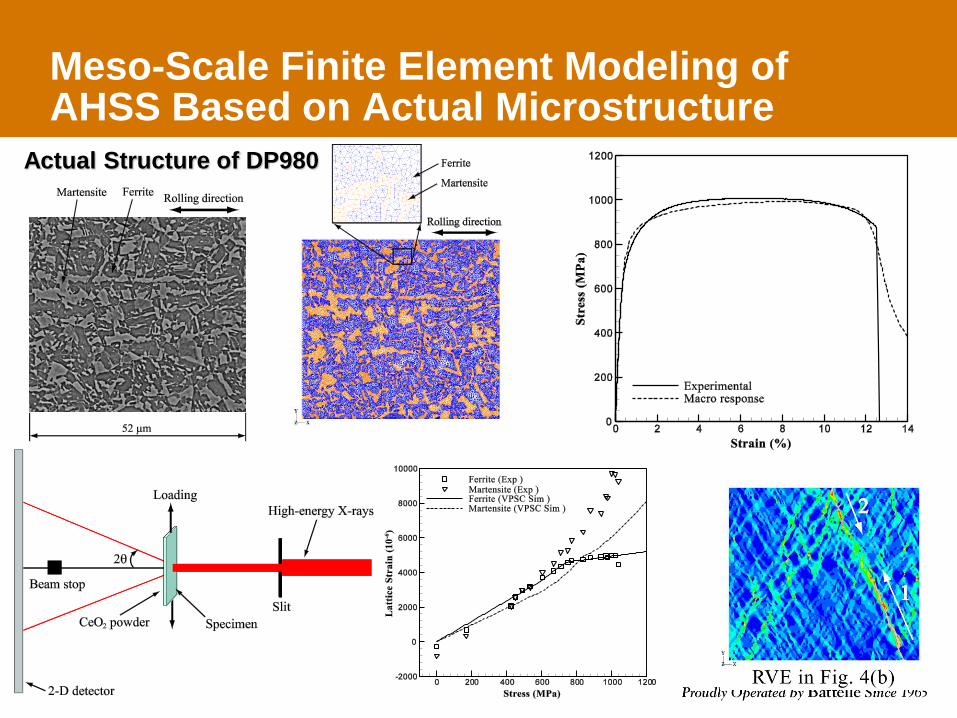
Meso-Scale Finite Element Modeling of AHSS Based on Actual Microstructure
Actual Structure of DP980

Effects of Loading Conditions on the Failure Mode
Case A – Free lateral edges Case B – Constrained lateral edges
Sun et al, Int. J. Plasticity, 2009.

Effects of Martensite Mechanical Properties on Tensile Behavior of DP980
epMy 1740,0 epMK 11800
PS S SD SSC
Choi et al., MMTA,
2009.

Effects of Martensite Volume Fraction and Ferrite Ductility on Ductility of DP Steels

Effects of Martensite Volume Fraction and Voids on Failure of DP Steels
Dual Phase steels
Micrographs from EWI’s A/SP Shear Fracture Project Update 9-10-2008
Sun et al, Mat. Sci.
Eng. A, 2009.

TRIP800 – Modeling of Phase Transformation and Ultimate Ductility Under Different Loading Conditions
313 1
23
2
32
I
J
JkJR
SEM picture
Microstructure-based RVE
Phase properties from HEXRD Overall response
Failure mode (Split-type)
Transformation yield function
Here, Пc =29MPa is used.
Choi, et al., Acta Mater., 57, pp. 2592-2604, 2009.

Modeling of Phase Transformation and Ultimate Ductility for TRIP800 Under Different Loading Conditions
(a) Shear loading (b) Uniaxial tension
(c) Plane strain (d) Equi-biaxial stretching
1. Predicted transformation kinetics and ultimate ductility
(indicated by x) under different loading conditions are in
qualitatively good agreements with experimental
measurements.
Prediction
Plotted
at 7.7%
strain
•M. Radu et al. / Scripta Materialia 52 (2005) 525–530.
•KS. Choi, et al. Acta Mat. 57 (2009) 2592–2604.
Experiment*

Effects of Retained Austenite Stability on Ductility and Formability of TRIP800
Overall response of the RVE Pseudo-forming limit diagram Austenite volume fraction for
different loading conditions
Critical value of Пc was varied to investigate the influence of austenite stability.
Higher austenite stability is beneficial in increasing the ductility of TRIP steels since it delays the martensitic transformation.
In turn, improved ductility results in better formability.
Improvement of formability can be more prominent than shown in the figure below, depending on the phase properties, microstructures, etc.
313 1
23
2
32
I
J
JkJR
Choi, et al., Comp. Mat. Sci., 2011.
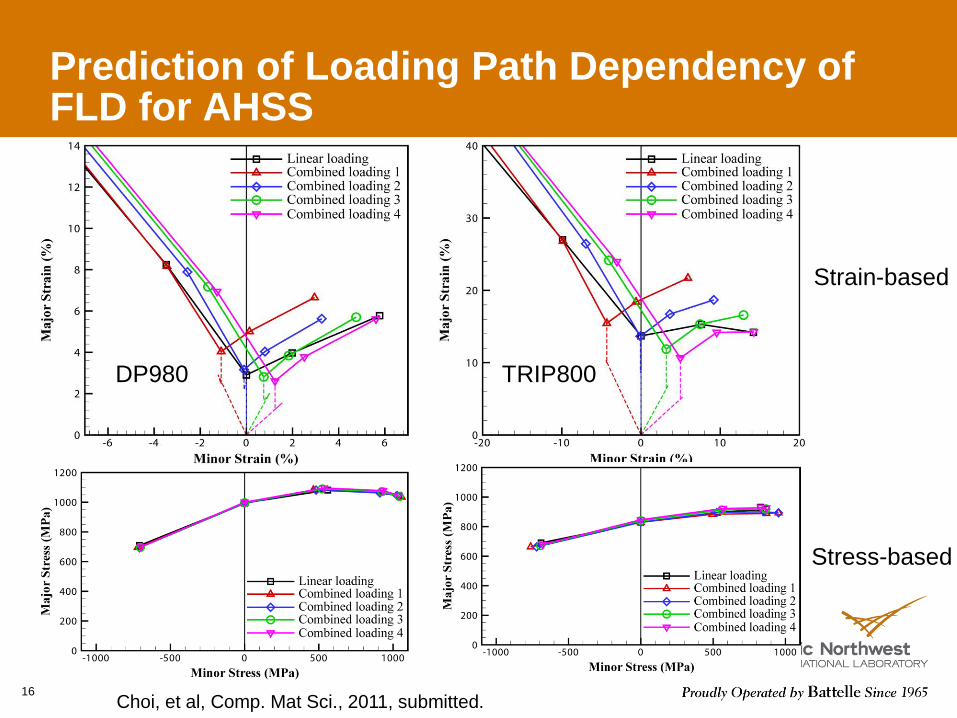
Prediction of Loading Path Dependency of FLD for AHSS
16
DP980 TRIP800
Strain-based
Stress-based
Choi, et al, Comp. Mat Sci., 2011, submitted.

Effects of Loading Rate on Tensile Ductility of TRIP800 Steel
Dynamic stress versus strain curves needed for crash simulations of energy critical parts
Strength
Ductility
Energy absorption
No national or international standards on dynamic tensile test
Set up
Sample design
Data acquisition
Reported inconsistency in open literature, in particular for ductility of AHSS
17

Strain Rate Sensitivity of Ductility for IF Steels
Ductile to brittle transition: Ductility is significantly reduced at high strain rate:
Changes in the mobile dislocation density
Thermal softening 18
Kuroda et al. Int. J. Solid Struct., 2006.
Mirza et al., J. Mat. Sci., 1996.
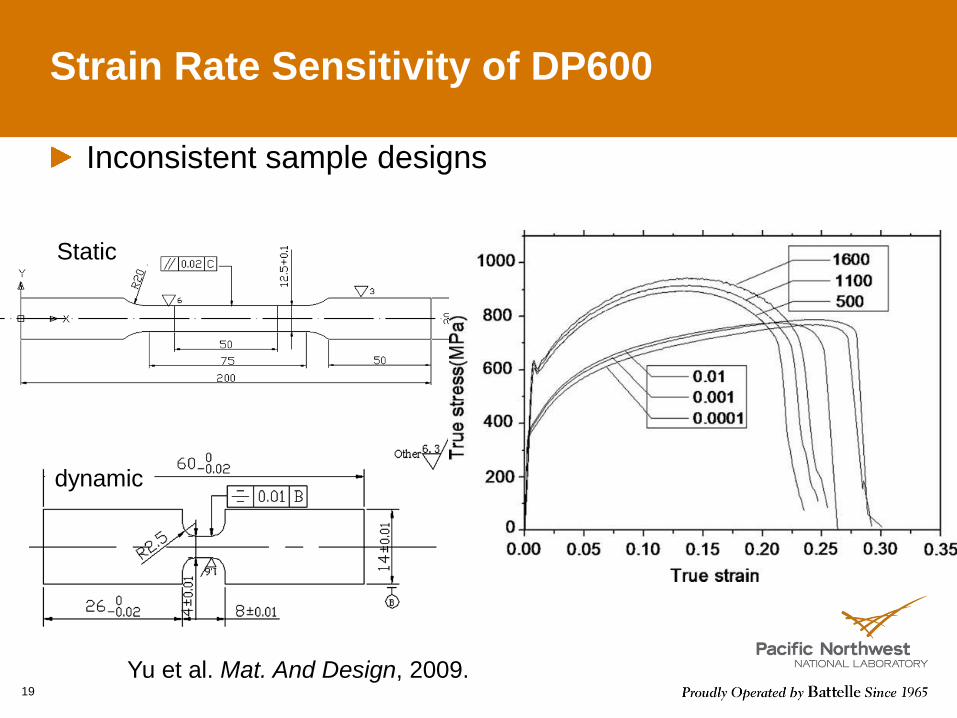
Inconsistent sample designs
Strain Rate Sensitivity of DP600
19
Yu et al. Mat. And Design, 2009.
Static
dynamic

Mostly focused on strength and hardening behaviors
a gauge length of 5mm and a radius of 1mm.
Strain Rate Sensitivity of Ductility on TRIP700
20
Van Slycken et al., Mat Sci Eng A 2007.
25mm6mm
6mm
100 mm
32mm
10mm
30mm30mm
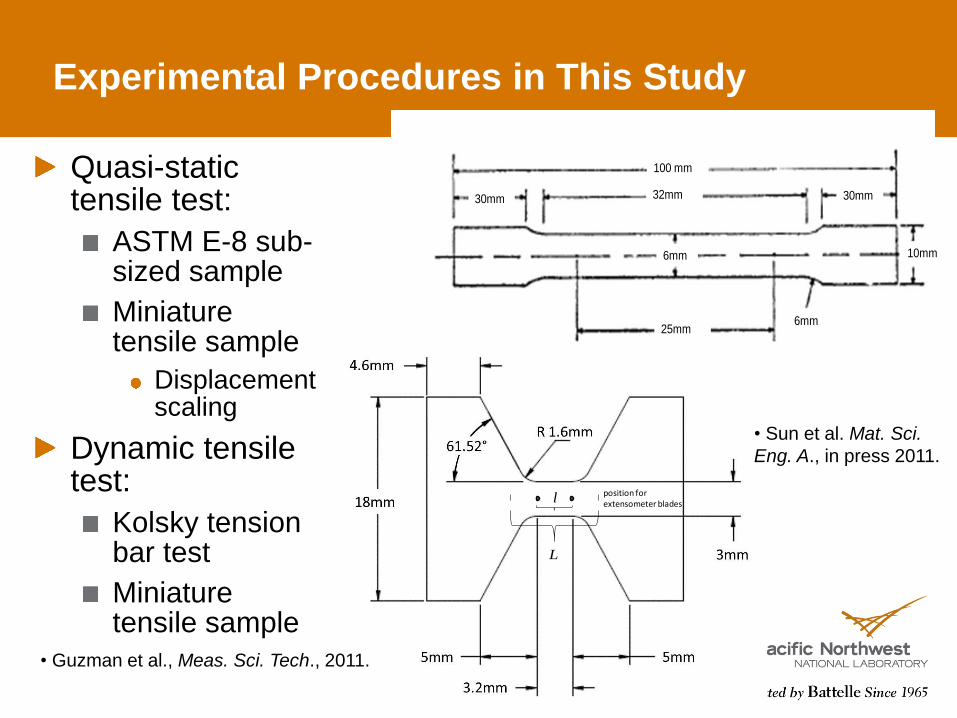
Experimental Procedures in This Study
Quasi-static tensile test:
ASTM E-8 sub-sized sample
Miniature tensile sample
Displacement scaling
Dynamic tensile test:
Kolsky tension bar test
Miniature tensile sample
L
l position forextensometer blades
• Sun et al. Mat. Sci.
Eng. A., in press 2011.
• Guzman et al., Meas. Sci. Tech., 2011.

Results on Geometry and Strain Rate Effects
22
(a) (b) (c)
(a) Undeformed
(b) Quasi-static sample
(c) Dynamic sample
• Sun et al. Mat. Sci. Eng. A., in press 2011.

High Rate Deformation Mode Confirmed with High Speed Camera Images
23
Frame 1: T = 0-microseconds 0% strain Frame 5: T = 105-microseconds 1% strain
(a) (b)
Frame 15: T = 315-microseconds 30% strain Frame 23: T = 480-microseconds 63% strain
(c) (d)
Fig. 4. Snapshots of dynamic deformation mode at different stage for the miniature tensile
sample deformed at 1700/s.

Effects of Strain Rate on Ultimate Ductility
TRIP700
Verleysen et al., Exp. Mech. 2008. TRIP800
Sun et al. Mat Sci. Eng. A, in press 2011

Possible Reasons for Enhanced Ultimate Ductility under High Rate Loading
25
Inertial stabilization theory
Non uniform deformation suppressed by inertia at high strain rate
Shenoy and Freund, 1999
Seth et al., 2005
Why TRIP not IF steel?
Adiabatic heating
Distributed nature of thermal softening
Grain elongation, rotation and alignment
Similar to high strain rate superplasticity of MMC?
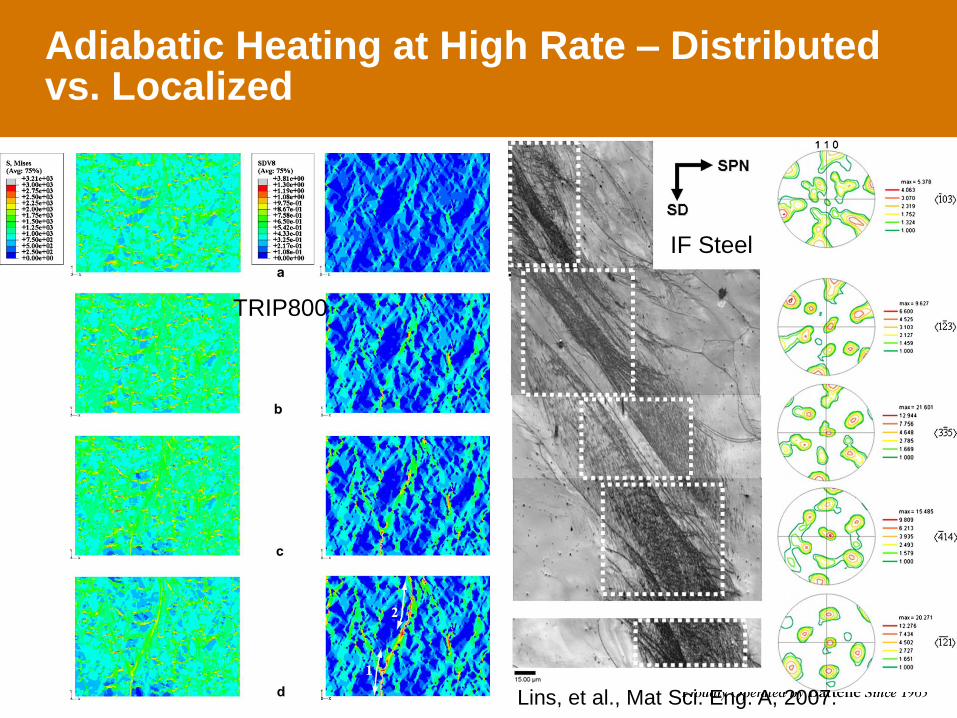
Adiabatic Heating at High Rate – Distributed vs. Localized
26
TRIP800
IF Steel
Lins, et al., Mat Sci. Eng. A, 2007.

Matrix Grain Rotation and Grain Boundary De-cohesion
Quasi-static Dynamic
• Sun et al. Mat. Sci. Eng. A., in press 2011.

High Rate Localized Amorphism in ASB – TWIP
28
Li et al., Acta Mat. 2011. Mabuchi and Higashi, Acta Mat. 1999.

Shear Fracture: Ford and USS
29
Shear fracture limit curves
Shih, et al., MSEC2009-84070.
Zeng, et al., SAE 2009-01-1172.
Shih, et al., SAE 2010-01-0977.
PNNL Work on Local Formability
Objectives
Identify the appropriate mechanical and microstructural properties that have significant influence on the local formability of DP980.
Develop appropriate screening method for local formability to promote wider application of AHSS
Approach
Acquire different DP materials from various suppliers
Perform chemical composition analyses, microstructural analyses and various tests (Tension, HET, B-Pillar in-die stamping…) to obtain the mechanical properties for the obtained DP materials
Develop image analyses tools to quantify the grain size, volume fraction and aspect ratio…
Perform nano-indentation tests to determine the yield strengths of the constituent phases
Perform microstructure-based finite element analyses to gain to fundamental understandings on the key material features to withstand localized deformation
Derive a theoretical microstructure-to-properties correlations based on the results
30

Chemical Compositions
DP980 (t) C (1.0) D (1.2) H (1.0) G (1.4) F (1.4) A (2.0) B (1.7) E (2.0)
Al 0.05 0.05 0.03 0.04 0.04 0.03 0.04 0.03
C 0.11 0.12 0.15 0.08 0.10 0.09 0.09 0.09
Cr 0.26 0.25 0.32 0.47 0.47 0.02 0.20 0.46
Cu 0.01 0.01 0.04 <0.01 <0.01 0.07 0.01 <0.01
Mn 2.38 2.47 1.93 2.08 2.09 2.13 2.16 2.10
Mo 0.20 0.36 0.01 0.28 0.28 0.07 0.27 0.29
Ni 0.01 <0.01 0.04 0.01 0.01 0.01 0.01 0.01
P 0.008 0.014 0.010 0.008 0.007 0.007 0.008 0.008
S 0.003 0.004 <0.001 0.003 0.002 0.002 0.001 0.001
Si 0.08 0.03 0.64 0.18 0.18 0.57 0.31 0.33
Ti 0.04 <0.01 0.13 0.03 0.03 0.02 0.02 0.05
B 0.008 0.010 <0.002 0.008 0.008 0.003 0.008 0.008
Ca <0.004 <0.002 <0.002 <0.002 <0.002 <0.002 <0.002 <0.002
Nb 0.031 0.002 0.003 0.017 0.017 0.009 0.015 0.036
V <0.01 <0.01 <0.01 <0.01 <0.01 <0.01 <0.01 <0.01
Zn <0.01 <0.01 <0.01 <0.01 <0.01 0.02 <0.01 <0.01
N 0.008 0.009 0.005 0.004 0.004 0.006 0.005 0.006
31
Surface coating was removed before test
Used ICP-AES and ASTM E1019-11
Formability ranking
GOOD BAD

Material C S-E
Material G S-E
Tensile Test (1)
Tested ASTM E8 sub-size samples with 𝜀 = 10−4/sec
Samples were cut by EDM from center and edge areas along rolling and transverse directions
3 tests for each condition
32
Sample Locations Comparison of S-E curves of DP980(Center/Rolling Dir.) S-E curves depend on sample location
DP980 steels show large discrepancy in their performances
See SAE 2012-01-0042 for S-E curves of other DP980

Microstructure Analysis (1) - SEM
In-plane/through-thickness SEM pictures were obtained from surface and mid-thickness regions along rolling and transverse directions for center and edge areas
Materials have different microstructures such as different size/shape of martensite grains and different distribution feature of martensite
Different microstructural features were expected to induce different local formability Image analysis
33
Material A Material D Material H
*See SAE 2012-01-0042 for more microstructures of other DP980

Channel Forming Test (1)
Only 5 materials (C,D,F,G,H) were selected due to the allowable thickness limit of the forming die
Square blanks (450mmX450mm) were formed using a straight rail die
Lubricant was applied on the blank surface before forming
Forming test was done both along the rolling and transverse directions
34
Successful forming Fractured Necking failure
Necking
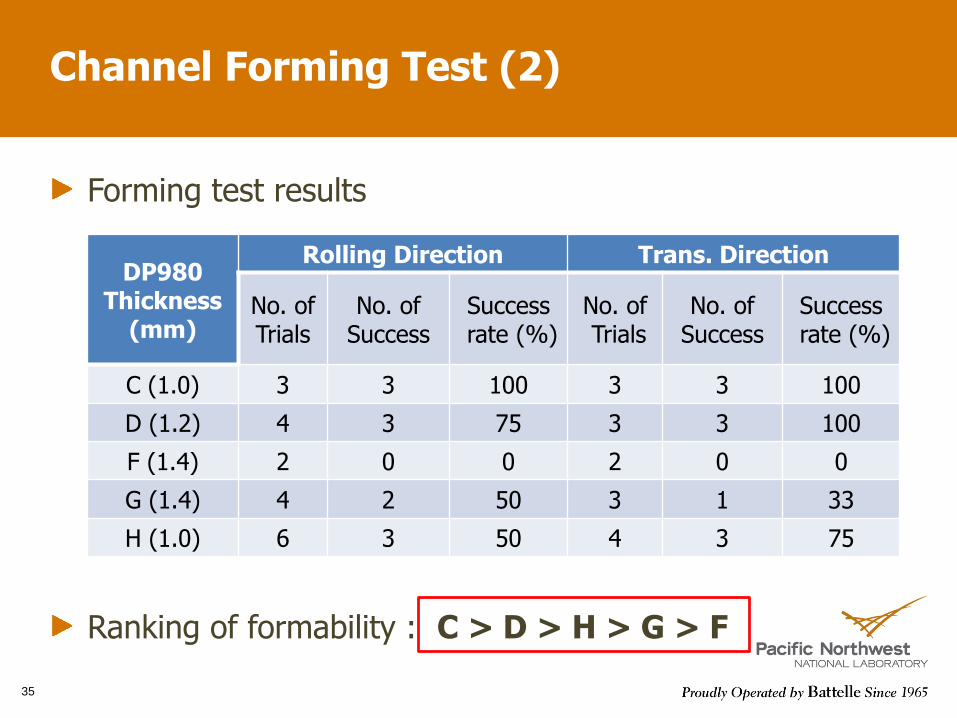
DP980 Thickness
(mm)
Rolling Direction Trans. Direction
No. of Trials
No. of Success
Success rate (%)
No. of Trials
No. of Success
Success rate (%)
C (1.0) 3 3 100 3 3 100
D (1.2) 4 3 75 3 3 100
F (1.4) 2 0 0 2 0 0
G (1.4) 4 2 50 3 1 33
H (1.0) 6 3 50 4 3 75
35
Channel Forming Test (2)
Forming test results
Ranking of formability : C > D > H > G > F

Chemical Compositions
DP980 (t) C (1.0) D (1.2) H (1.0) G (1.4) F (1.4) A (2.0) B (1.7) E (2.0)
Al 0.05 0.05 0.03 0.04 0.04 0.03 0.04 0.03
C 0.11 0.12 0.15 0.08 0.10 0.09 0.09 0.09
Cr 0.26 0.25 0.32 0.47 0.47 0.02 0.20 0.46
Cu 0.01 0.01 0.04 <0.01 <0.01 0.07 0.01 <0.01
Mn 2.38 2.47 1.93 2.08 2.09 2.13 2.16 2.10
Mo 0.20 0.36 0.01 0.28 0.28 0.07 0.27 0.29
Ni 0.01 <0.01 0.04 0.01 0.01 0.01 0.01 0.01
P 0.008 0.014 0.010 0.008 0.007 0.007 0.008 0.008
S 0.003 0.004 <0.001 0.003 0.002 0.002 0.001 0.001
Si 0.08 0.03 0.64 0.18 0.18 0.57 0.31 0.33
Ti 0.04 <0.01 0.13 0.03 0.03 0.02 0.02 0.05
B 0.008 0.010 <0.002 0.008 0.008 0.003 0.008 0.008
Ca <0.004 <0.002 <0.002 <0.002 <0.002 <0.002 <0.002 <0.002
Nb 0.031 0.002 0.003 0.017 0.017 0.009 0.015 0.036
V <0.01 <0.01 <0.01 <0.01 <0.01 <0.01 <0.01 <0.01
Zn <0.01 <0.01 <0.01 <0.01 <0.01 0.02 <0.01 <0.01
N 0.008 0.009 0.005 0.004 0.004 0.006 0.005 0.006
36
Surface coating was removed before test
Used ICP-AES and ASTM E1019-11
Formability ranking
GOOD BAD
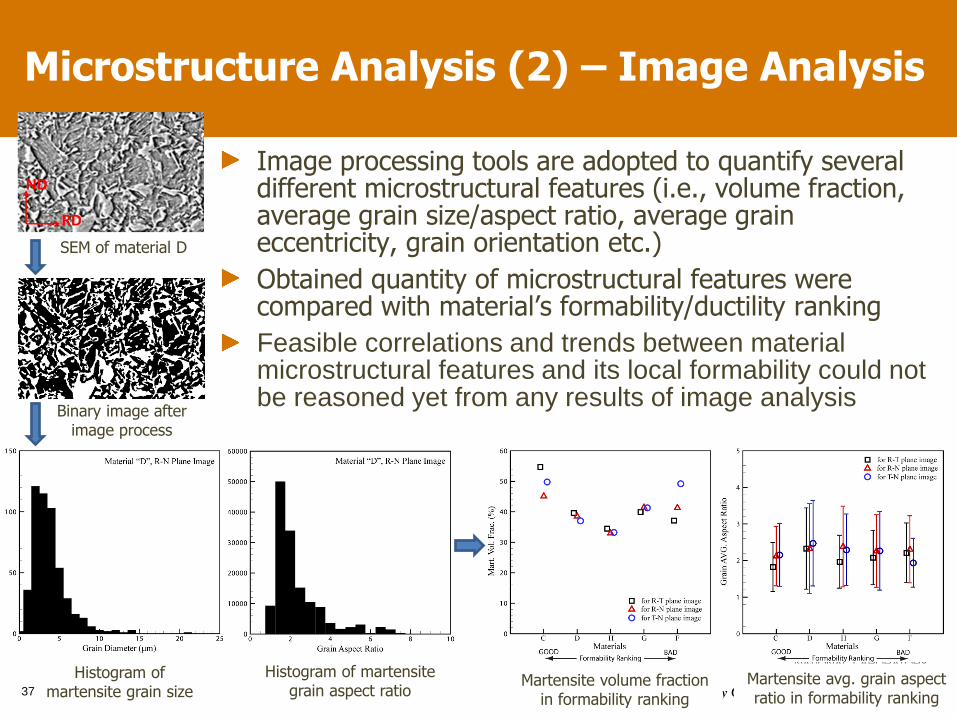
Image processing tools are adopted to quantify several different microstructural features (i.e., volume fraction, average grain size/aspect ratio, average grain eccentricity, grain orientation etc.)
Obtained quantity of microstructural features were compared with material‟s formability/ductility ranking
Feasible correlations and trends between material microstructural features and its local formability could not be reasoned yet from any results of image analysis
37
Microstructure Analysis (2) – Image Analysis
Histogram of martensite grain size
Histogram of martensite grain aspect ratio
Martensite volume fraction in formability ranking
Martensite avg. grain aspect ratio in formability ranking
SEM of material D
Binary image after image process

Some tensile properties (i.e., UTS, uniform elongation, total elongation) obtained from the center area samples were compared with formability ranking
Correlation is not observed between tensile properties and local formability
38
Tensile Test (2)
Formability ranking
GOOD BAD Formability
ranking
GOOD BAD Formability
ranking
GOOD BAD
Average Max
Min
UTS vs formability ranking Uniform elongation vs formability ranking
Total elongation vs formability ranking

Hole Expansion Test (1)
Used square samples (75mmX75mm) with 12mm diameter hole
Punch Dia.:40mm; Punch speed: 20mm/min; Die holding force: 100kN
2~3 tests were done for each material
Holes were made with EDM and punching
39
%1000
0
d
ddHER
Schematic of HET
Mat “C” Mat “G”
EDM hole
Punch hole
Failed samples

Hole Expansion Test (2)
Correlation is not observed between the two different hole preparation methods: hole quality matters!
HER does not necessarily correlate with total elongation (Thicker sheets appear to have higher HER)
Correlation is not observed between HER and formability for both machining methods
40
Average
Min
Max
Comparison of HER for different machining methods
HER
Comparison of HER of EDM sample with total elongation
Formability ranking
GOOD BAD
HER in formability ranking
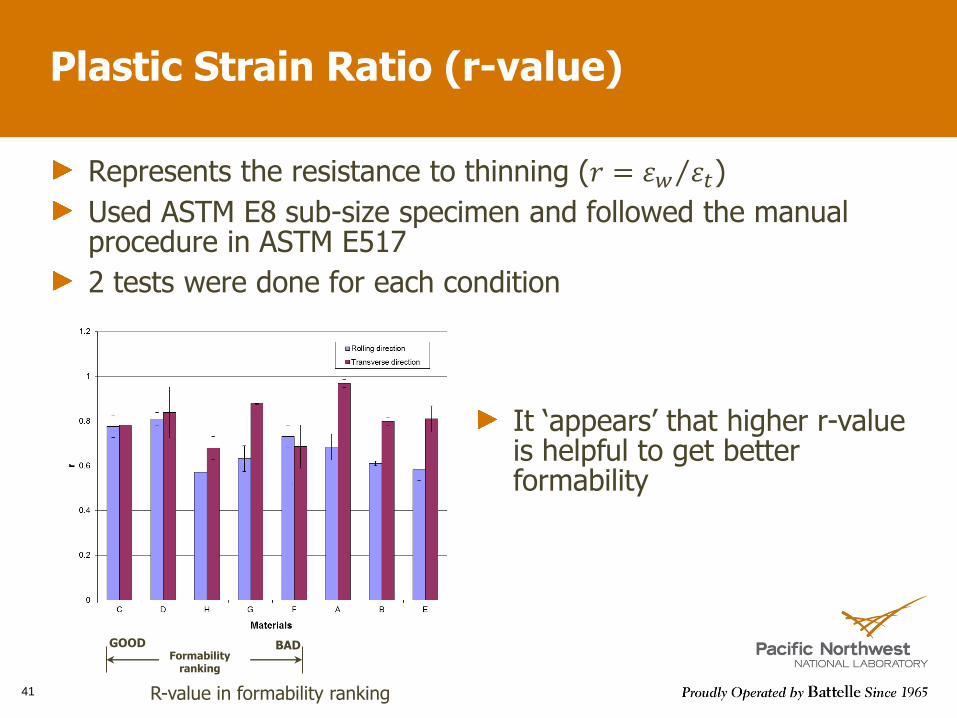
Plastic Strain Ratio (r-value)
Represents the resistance to thinning (𝑟 = 𝜀𝑤 𝜀𝑡 )
Used ASTM E8 sub-size specimen and followed the manual procedure in ASTM E517
2 tests were done for each condition
41
Formability ranking
GOOD BAD
It „appears‟ that higher r-value is helpful to get better formability
R-value in formability ranking

Summary and Challenges
Various tests have been performed with eight different DP980 steels to establish the fundamental understandings on key mechanical properties and the microstructure features influencing the local formability of AHSS
Measured in-plane mechanical properties of these steels do not correlate with their local formability
Image analysis was adopted for the SEM pictures of DP980 steels in order to quantify their various microstructural features
It is not easy to find possible correlations between the microstructural features and the macroscopic deformation behaviors
Nano-indentation test is underway to measure the strength disparity of the constituents
Examinations of micro-damage near the cutting edge, induced from machining, is underway
Larger-area microscopes may also be considered to examine the inhomogeneity of martensite distribution
42
Preliminary nano-indentation test with material B

Can We Use the Micromechanics-Based FEM to Predict Localized Fracture?
Experimental simulation of shear fracture
Stretch bending
Two step plane strain simulation loading:
Stretching
Indentation
Factors considered:
Initial stretching strain
Indenter radii
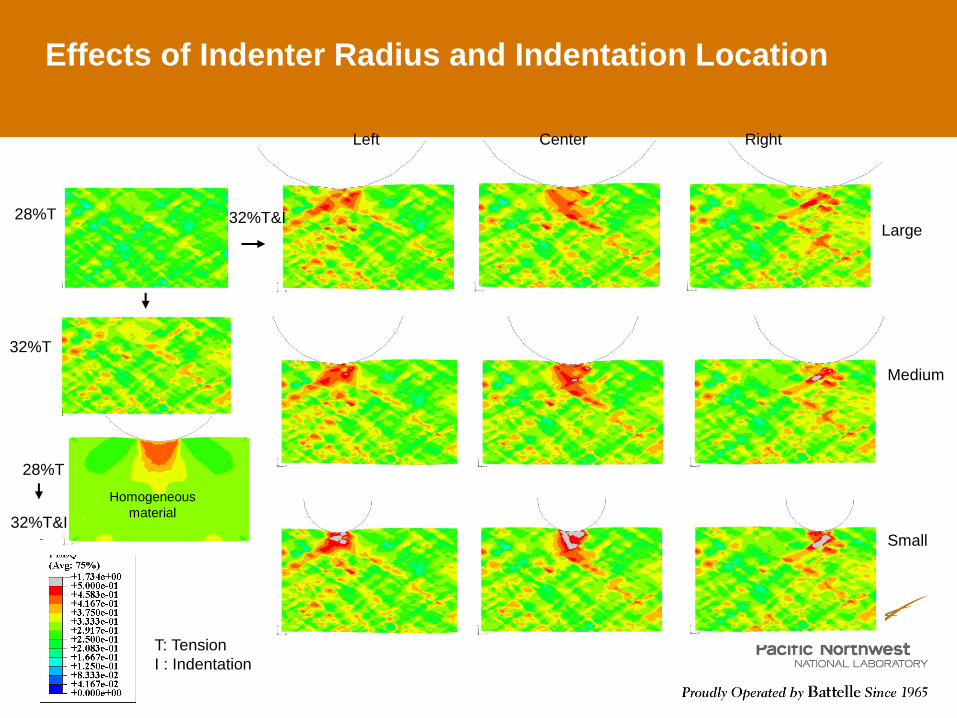
Medium
Small
T: Tension
I : Indentation
Homogeneous
material
Large
Left Center Right
28%T
32%T
28%T
32%T&I
32%T&I
Effects of Indenter Radius and Indentation Location


