
- 1 -
Cable Television: The Industry Today and Its Outlook for the Future
1. Markets for streaming content and triple play service
An important feature of today’s cable television industry is the rapid advancement of
broadcasting services using communications technology. Smart televisions combining video
and internet services and linking television and mobile terminals are growing increasingly
popular in areas where mobile broadband and mobile terminals are in wide use. Firms are
competing to provide the most user-friendly experience in terms of the freedom to choose
viewing time, place, and package, in addition to the upper-layer content which has long been a
major part of cable television’s appeal (Figure 1).
Figure 1 Diversification of Content Audience
Summary
The cable television industry is facing enormous changes in the telecommunications and
broadcasting markets and in the technological landscape as well. Multichannel broadcasters
are experiencing sluggish growth, and even internet operators, which had proved strong until
now, are being forced by fierce competition into exploring new business strategies. Struggling
to cope with the advent of broadband, smart television, and other new services, growing
numbers of cable television firms are turning to alliances to boost their competitiveness. How
these strategic alliances will be implemented, both by firms and communities, is a matter of
keen interest throughout the industry.
This paper is a summary of the report Present State of the Cable Television Industry, FY 2012
Edition (“the FY 2012 Report”).
Source: Development Bank of Japan Inc.
MobileBroadband
(LTE・WiMAX・WiFi)
Television PC
Platform
Transmission
Terminal
STB
Content(Apps)
TabletPC
OSWeb
User
BS,CS
D
T
T
Unidirectional
=Information access, entertainment, etc.
Bidirectional
=Communication
CATV FTTH・DSL
Stick
Wi-Fi
Smartphone

- 2 -
① The multichannel market
IP multicast broadcasting has driven growth in the multichannel market for the past
several years. If IP multicast were omitted, FY 2012 results would be level with those of
the previous year (Figure 2). The number of cable subscribers showed a decline of 0.1%
year-on-year, greatly reducing its contribution to the growth of the multichannel market.
The precipitous fall in cable subscriptions is a trend that bears watching.
Figure 2 Changes in the Multichannel Market (Subscriber Households)
② The broadband market
Fiber-to-the-home (FTTH) drove growth in the broadband market until about 2010. Since
2011, however, a huge increase in subscriptions to 3.9 generation mobile telephone
terminal packets (long-term evolution, or LTE) has brought new growth to the broadband
market (Figure 3). Mobile broadband (such as WiMAX), including broadband wireless
access (BWA), is rapidly becoming the chief driver of growth in this market.
Figure 3 Changes in the Broadband Market (Subscriber Households)
Source: Ministry of Internal Affairs and Communications; Hoso Journal - sha Inc.; Corporate investor relations materials
Source: Ministry of Internal Affairs and Communications
5.5%
-10%
0%
10%
20%
30%
40%
50%
60%
0
10
20
30
40
50
60
70
04 05 06 07 08 09 10 11 12
Million households
3.9-generation mobile telephone packet communication (LTE)BWA (WiMAX, etc.)FTTHDSLCATVFWA (fixed wireless access)Growth rate (right scale)
FY
-2%
0%
2%
4%
6%
8%
10%
12%
14%
16%
0
5
10
15
20
01 02 03 04 05 06 07 08 09 10 11 12
Million households
IP multicastCATVSKY PerfecTVWOWOWMultichannel total (excluding IP multicast)CATV
※Growth rates are comparisons with same month of previous year.
FY

- 3 -
③ The telephone market
The number of landline subscriptions peaked in 1998 and has since been on a gradual
decline (Figure 4). While OABJ-IP subscriptions have increased, the falling number of NTT
subscriptions has kept the number of landline subscribers as a whole on the decline.
Mobile telephone subscriptions, on the other hand, are showing strong and steady
growth, the number reaching 131 million as of the end of fiscal year 2012. Growing
numbers of users are replacing their landlines with mobiles, and signs point to a greater
presence for LTE as a mobile broadband circuit. The spread of smartphones in the past
few years has brought a proliferation of free applications; it will be interesting to see what
kind of impact these will have on the telephone industry.
Figure 4 Changes in Numbers of Landline Subscribers
2. Trends in cable television businesses
① Broadcasting
The FY 2012 Report is based on responses from some 150 cable television operators
across Japan. In FY 2012, the multichannel subscription rate was 20.4% per company,
continuing a year-on-year decline in the number of subscribing households (Figure 5).
The number of households acquiring or cancelling multichannel subscriptions maintained
sluggish growth (for MSOs1) or went into a slight decline (for non-MSOs) (Figure 6). 1
Multiple system operator: A company owning multiple cable systems.
Notes 1. Source: Ministry of Internal Affairs and Communications 2. IP telephone services provided by CATV operators are counted under IP telephones.
56.8
131.7
24.1
0
3
6
9
12
15
0
20
40
60
80
100
120
140
2003 2004 2005 2006 2007 2008 2009 2010 2011 2012
Landline telephone
Mobile telephone
Of which, NTT subscribers
Of which, 0ABJ-IP telephone
Of which, dedicated line (right scale)
Of which, CATV telephone (right scale)
Million Million
FY

- 4 -
Figure 5 Changes in Numbers of Multichannel Subscriber Households
and Subscription Rates, Per Firm (n = 96)
Figure 6 Changes in Multichannel Acquisitions/Cancellations, Per Firm
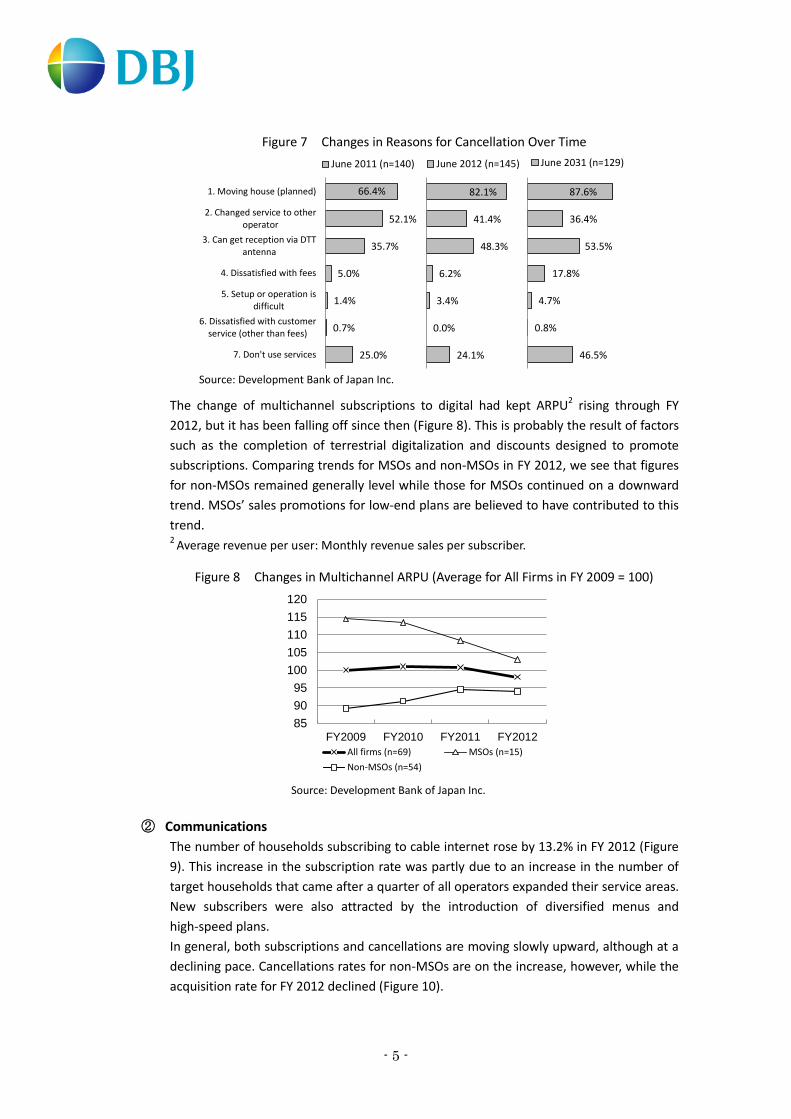
When questioned as to the reasons for the cancellation of services, the greatest number
of respondents replied that it was due to the subscribers’ “moving house.” The
percentage of respondents giving this answer was particularly high among MSOs, which
operate primarily in urban areas (Figure 7). The reason “Don’t use these services” showed
sharp growth in the current fiscal year, probably due at least in part to the diversification
of tastes that has come with the spread of smartphones and similar devices.
Source: Development Bank of Japan Inc.
Source: Development Bank of Japan Inc.
112 118 121 122
24.3 24.6 24.8 24.9
21.6%20.8% 20.5% 20.4%
15%
20%
25%
30%
0
50
100
150
FY2009 FY2010 FY2011 FY2012
Thousand households
Target households Subscriber households Subscription rate (right scale)
18,778 18,934 19,037 19,024
6.3% 7.1% 6.4% 6.9% 4.7% 4.7%
1,185 1,341 +156 1,211 1,314 +103 900 887 -13
10
20
30
FY2009 Cancellations Acquisitions FY2010 Cancellations Acquisitions FY2011 Cancellations Acquisitions FY2012
Thousand households
46,418 47,447 48,256 48,747
12.0% 14.2% 10.8% 12.5% 9.7% 10.7%
5,573 6,602 +1,029 5,134 5,943 +809 4,657 5,148 +491
10
20
30
40
FY2009 Cancellations Acquisitions FY2010 Cancellations Acquisitions FY2011 Cancellations Acquisitions FY2012
Thousand households
Net growth rate+2.2%
Net growth rate+1.7%
Net growth rate+1.0%
Net growth rate+0.8%
Net growth rate+0.5%
Net growth rate-0.0%
MSO (n=19)
Non-MSO (n=77)
- 5 -
Figure 7 Changes in Reasons for Cancellation Over Time
The change of multichannel subscriptions to digital had kept ARPU2 rising through FY
2012, but it has been falling off since then (Figure 8). This is probably the result of factors
such as the completion of terrestrial digitalization and discounts designed to promote
subscriptions. Comparing trends for MSOs and non-MSOs in FY 2012, we see that figures
for non-MSOs remained generally level while those for MSOs continued on a downward
trend. MSOs’ sales promotions for low-end plans are believed to have contributed to this
trend. 2
Average revenue per user: Monthly revenue sales per subscriber.
Figure 8 Changes in Multichannel ARPU (Average for All Firms in FY 2009 = 100)
② Communications
The number of households subscribing to cable internet rose by 13.2% in FY 2012 (Figure
9). This increase in the subscription rate was partly due to an increase in the number of
target households that came after a quarter of all operators expanded their service areas.
New subscribers were also attracted by the introduction of diversified menus and
high-speed plans.
In general, both subscriptions and cancellations are moving slowly upward, although at a
declining pace. Cancellations rates for non-MSOs are on the increase, however, while the
acquisition rate for FY 2012 declined (Figure 10).
85
90
95
100
105
110
115
120
FY2009 FY2010 FY2011 FY2012
All firms (n=69) MSOs (n=15)
Non-MSOs (n=54)
Source: Development Bank of Japan Inc.
Source: Development Bank of Japan Inc.
82.1%
41.4%
48.3%
6.2%
3.4%
0.0%
24.1%
June 2012 (n=145)
66.4%
52.1%
35.7%
5.0%
1.4%
0.7%
25.0%
1. Moving house (planned)
2. Changed service to otheroperator
3. Can get reception via DTTantenna
4. Dissatisfied with fees
5. Setup or operation isdifficult
6. Dissatisfied with customerservice (other than fees)
7. Don't use services
June 2011 (n=140)
87.6%
36.4%
53.5%
17.8%
4.7%
0.8%
46.5%
June 2031 (n=129)

- 6 -
Figure 9 Changes in Numbers of Cable Internet Subscriber Households
and Subscription Rates, Per Firm (n = 102)
Figure 10 Changes in Cable Internet Acquisitions/Cancellations, Per Firm
From FY 2009 through FY 2012, the average ARPU for all firms displayed a downward
trend. The decline was especially large in FY 2012 (Figure 11). Notably, MSO operators
saw their year-on-year ARPU drop steeply that year. The reason is thought to be sales
strategies stressing customer retention, along with intense competition from telecom
operators.
Looking at plans with the greatest number of subscribers over the last five years, we see a
drop in the percentage of operators offering 2Mbps, the slowest speed, combined with a
sustained rise in the percentage of those offering 20Mbps, the fastest speed – both signs
of a general transition from slow- to high-speed plans (Figure 12).
115 117 120 121
13.8 14.6 15.3 15.9
12.0%12.5%
12.8%13.2%
10%
11%
12%
13%
14%
15%
0
50
100
150
FY2009 FY2010 FY2011 FY2012
Thousand households
Target households Subscriber households
Source: Development Bank of Japan Inc.
Source: Development Bank of Japan Inc.
26,875 28,858 30,273 32,254
12.7% 20.1%12.6% 17.5% 12.5% 19.1%
3,422 5,405 +1,983 3,623
5,038 +1,415 3,790 5,771 +1,981
10
20
30
FY2009 Cancellations Acquisitions FY2010 Cancellations Acquisitions FY2011 Cancellations Acquisitions FY2012
Thousand households
10,603 11,157 11,688 11,9238.1% 13.3% 8.9% 13.6% 9.4% 11.4%
857 1,411 +554 990 1,521 +531 1,100 1,335 +235
5
10
15
FY2009 Cancellations Acquisitions FY2010 Cancellations Acquisitions FY2011 Cancellations Acquisitions FY2012
Thousand households
Net growth rate+7.4%
Net growth rate+4.9%
Net growth rate+6.6%
Net growth rate+5.2%
Net growth rate
+4.7%
Net growth rate+2.0%
MSOs (n=20)
Non-MSOs (n=82)

- 7 -
Figure 11 Changes in Cable Internet ARPU
Figure 12 Speed of Most Popular Service of Subscribers with Each Operator
③ Landline services
As landline services have been launched relatively recently, there are many operators with
much room for growth. Subscriber households and subscription rates are increasing
steadily (Figure 13).
Figure 13 Changes in Numbers of Landline Subscriber Households
and Subscription Rates, Per Firm (n = 42)
Source: Development Bank of Japan Inc.
Source: Development Bank of Japan Inc.
85
90
95
100
105
110
115
FY2009 FY2010 FY2011 FY2012
All firms (n=87) MSOs (n=16) Non-MSOs (n=71)
12.9% 10.5% 8.9% 7.3% 4.8%
39.5% 44.4%37.1% 39.5% 38.7%
26.6% 24.2%29.8% 25.8%
24.2%
21.0% 21.0% 24.2% 27.4%32.3%
0%
20%
40%
60%
80%
100%
FY2008 FY2009 FY2010 FY2011 FY2012
2.0Mbps 2.0 10.0Mbps 10.0 20.0Mbps 20.0Mbps
158 161 162 164
12.4 15.7 18.6 21.2
7.8%
9.7%
11.5% 12.9%
0%
5%
10%
15%
20%
0
50
100
150
200
FY2009 FY2010 FY2011 FY2012
Thousand households
Target households Subscriber households Subscription rate (right scale)
Source: Development Bank of Japan Inc.

- 8 -
With MSOs giving precedence to landline services, as of FY 2008 a substantial gap existed
between the ratios of MSOs and non-MSOs. Over the last five years, however, even
non-MSOs have been introducing landline services at a growing rate; over 60% now
handle landline.
Among non-MSOs, subscription rates for landline services are lower than those for
multichannel services. Therefore, non-MSOs hope to sustain their growth trend by
expanding sales to existing subscribers. MSOs cannot expect much more than sluggish
growth in this category, as their subscription rates for landline services already approach
those for multichannel (Figure 14).
Figure 14 Changes in Landline Acquisitions/Cancellations, Per Firm
3. Business conditions
According to the FY 2012 Report, revenue earned by cable television firms in FY 2012 failed to
grow from the previous year’s level. The sluggishness of the year-on-year growth rate was
conspicuous.
An analysis of business earnings shows little change: revenue from broadcasting and other
businesses was essentially flat, even while that from communications business was on the rise
(Figure 15).
24,95729,064
32,28235,646
8.4% 24.8%
7.9% 19.0%
7.5% 17.9%2,092
6,199 +4,107 2,299
5,517 +3,218 2,429
5,793 +3,364
10
20
30
40
FY2009 Cancellations Acquisitions FY2010 Cancellations Acquisitions FY2011 Cancellations Acquisitions FY2012
Thousand households
MSOs (n=16)
Net increase rate+16.4%
Net increase rate+11.1%
4,6097,475
10,23112,274
5.5% 67.7%
6.4% 43.3%
6.6% 26.5%
255
3,121 +2,866 481
3,237 +2,756672
2,715 +2,043
5
10
15
FY2009 Cancellations Acquisitions FY2010 Cancellations Acquisitions FY2011 Cancellations Acquisitions FY2012
Thousand households
Non-MSOs (n=26)
Net increase rate+62.2%
Net increase rate
+36.9%
Net increase rate+19.9%
Net increase rate+10.4%
Source: Development Bank of Japan Inc.

- 9 -
Figure 15 Changes in Earnings for Each Type of Business (Average for DBJ Clients)
The average of total assets for all companies showed a contracting tendency, with a
progressive shrinking of interest-bearing debt over three fiscal years (Figure 16). With
sustained current-term surpluses producing accumulated income, net assets took up a growing
proportion on the creditor side (right-hand side of the figure).
Figure 16 Average Operator’s Balance Sheet
4. Recent activity in communications and broadcasting
① Development of smart televisions by carriers
As smart television enters the realm of commercial viability within the cable television
industry, mobile communications carriers have simultaneously rolled out smart television
services using their own stick terminals. The aim is to expand to home televisions content
that communications carriers have gathered and constructed for smartphones.
3,670
1,471
2,200
FY2010
3,666
1,632
2,034
FY2011
3,577
1,738
1,839
FY2012
Liabilities Liabilities Liabilities
(Interest-bearing liabilities:
1,746)
(Interest-bearing liabilities:
1,604)
(Interest-bearing liabilities:
1,381)
(Capital:1,123)
(Cumulative profit & loss:348)
(Capital:1,123)
(Cumulative profit & loss:509)
(Capital:1,085)
(Cumulative profit & loss:653)
Net assetsNet assets
Net assets
Total assets Total assets Total assets
Source: Development Bank of Japan Inc.
Source: Development Bank of Japan Inc.
1,2301,249(+2%)
1,256(+1%)
1,261(+0%)
681752
(+10%)
805(+7%)
834(+4%)
5189 42 13
2,440
478
2,655(+9%)
565(+18%)
2,684(+1%)
581(+3%)
2,693(+0%)
585(+1%)
0
1,000
2,000
3,000
FY2009 FY2010 FY2011 FY2012
Million yen
Broadcasting revenue Communications revenueRetransmission revenue Other revenue

- 10 -
② Moves toward platform development
With the industry facing difficult circumstances both outside and within, some firms are
moving to establish a “cable platform” aimed at improving the competitiveness of the
industry as a whole. An exploratory committee within the Japan Cable and
Telecommunications Association has focused on developing regional potential. At the
Ministry of Internal Affairs and Communications (MIC), the Study Group for Acceleration
of Broadcasting Services has formed a Cable Platform Working Group to look at ways of
creating a proprietary platform for the cable television industry. In a report issued in May
2013, the MIC set down five capabilities required of such a platform (Figure 17).
Figure 17 Five Functions Required of a Platform, According to MIC
Operators have also been moving ahead with a number of initiatives.
Japan Digital Serve Corporation (JDS), for example, is building a platform involving a tie-up
with IP-based video on demand provided by Jupiter Telecommunications Co., Ltd.
(J:COM).
In another new development, J.COTT Inc., a collaboration among several independent
cable operators, is working with firms including Actvila Corporation to create a platform
that would enable firms throughout Japan to provide VOD and other services.
5. Moves to advance alliances
① The situation in the United States
Like their counterparts in Japan, local independent operators in the U.S. face stiff
competition from rivals in the communications sector. Their difficulties are compounded
by listless regional economies, competition from satellite broadcasters, and repercussions
of government policy. Some independent firms are fighting back by forming alliances
among themselves.
The National Cable Television Cooperative (NCTC) is a partnership of independent
operators. In addition to making joint purchases and handling rights, the NCTC recently
launched the TV Everywhere platform aimed at small and medium-sized firms. The
American Cable Association (ATA) handles office work relating to retransmission
legislation while coordinating with the FCC. The two organizations cooperate in providing
support to independent operators (Figure 18).
Source: Ministry of Internal Affairs and Communications
① IP video transmission capabilities
② Platform for alliances among existing ID operators
③ Monitoring platform
④ AJC-CMS capabilities
⑤Customer management system (SMS) platform
capabiltiies

- 11 -
Figure 18 The Alliance Situation in the United States
A number of consulting services have sprung up to assist independent operators in
introducing Internet Protocol television (IPTV) and over-the-top content (OTT) services by
handling the rights to technology and programs (Figure 19).
The U.S. Midwest is home to the Mid-American Cable Show, an annual gathering of
independent operators from across the region. In 2013 the show was held from
September 4-6 in Springfield, Missouri. Sessions included presentations by the NCTC and
TV Everywhere, an alliance of independent operators, during which they described their
activities and outlined technological road maps (Figure 20). At the exhibition booths
visitors could watch local high school teams compete in football and basketball games in
broadcasts presented on tablets and other devices, showcasing independent operators at
their best (Figure 21).
Individual firms are paying attention to the tie-up trend. Responding to our questionnaire,
one local independent operator said that since TV Everywhere was likely to extend into
outlying regions, independents should facilitate its spread through alliances with ①
MSOs and ② cooperatives of small to medium-sized operators such as the NCTC. Some
firms said they were seeking to expand their business through alliances with nearby
power companies. Some, however, were concerned that tie-ups could cost independents
their individuality, at least to some extent.
Leading MSOs
Independent terrestrial CATV providers
ACANCTC
Satellitecompanies
Telecomcarriers
The cable television industry
TV Everywhere
Alliances among independent operators
Price negotiation &coordination
Rights handlingContent company holding
Price negotiation &coordination
Rights handling
Development &supply of
TV Everywhereplatform
Development ofTV Everywhereplatform (trial)
Triple play
Competition
Cooperative sourcing of content・Economies of scale = power when negotiating with content providers
・Applications to FCC・Legal paperwork
Development ofTV Everywhere platform・Technological development + handling of content rights
Content providers,DTT networks, etc.
Users
Triple play services
IndependentCATV
Source: Development Bank of Japan Inc.

- 12 -
Figure 19 OTT/IPTV Services for Regional Telephone Companies and CATV Operators
(Photo is of Skitter TV)
Figure 20 Figure 21
② Japanese views on alliances
In a climate of intensifying competition and constant technological innovation,
momentum appears to be growing for alliances within the cable television industry. For
the FY 2012 Report, we asked Japanese cable operators about their intentions in regard
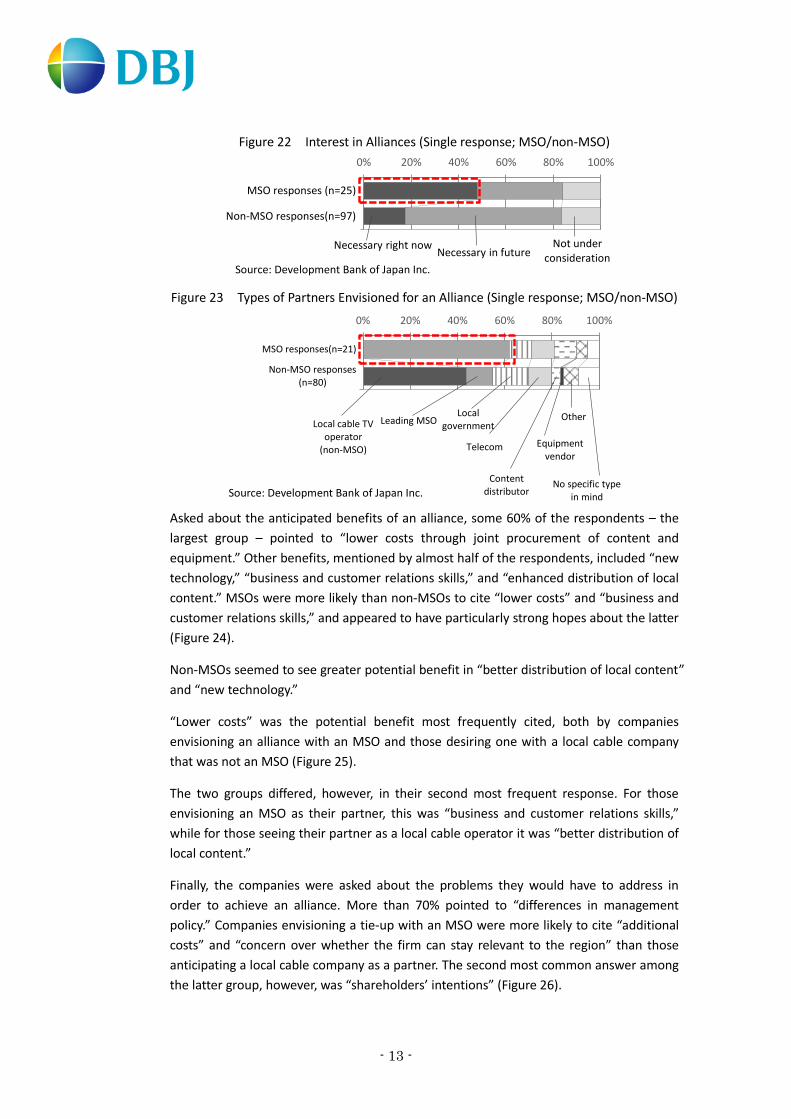
to alliances. More than 80% of the responding firms said that alliances were “necessary.”
MSOs and non-MSOs held differing views on just how necessary, however: While more
than 40% of MSOs said that they were needed “immediately,” less than 20% of non-MSOs
agreed (Figure 22).
Companies that believed alliances were necessary were asked about the kinds of partners
they envisioned having. “Operators other than MSOs” was the most frequent response,
followed by “MSOs.” The composition of the responses differed widely, however,
depending on whether the respondent was an MSO or non-MSO. Among non-MSOs,
“operators other than MSOs” drew the most responses, with “local government” drawing
a fairly large number as well. Among MSOs, however, “operators other than MSOs” did
not draw a single response (Figure 23).
Source: Skitter, Inc.
Source: Development Bank of Japan Inc. Source: Development Bank of Japan Inc.
- 13 -
Figure 22 Interest in Alliances (Single response; MSO/non-MSO)
Figure 23 Types of Partners Envisioned for an Alliance (Single response; MSO/non-MSO)
Asked about the anticipated benefits of an alliance, some 60% of the respondents – the
largest group – pointed to “lower costs through joint procurement of content and
equipment.” Other benefits, mentioned by almost half of the respondents, included “new
technology,” “business and customer relations skills,” and “enhanced distribution of local
content.” MSOs were more likely than non-MSOs to cite “lower costs” and “business and
customer relations skills,” and appeared to have particularly strong hopes about the latter
(Figure 24).
Non-MSOs seemed to see greater potential benefit in “better distribution of local content”
and “new technology.”
“Lower costs” was the potential benefit most frequently cited, both by companies
envisioning an alliance with an MSO and those desiring one with a local cable company
that was not an MSO (Figure 25).
The two groups differed, however, in their second most frequent response. For those
envisioning an MSO as their partner, this was “business and customer relations skills,”
while for those seeing their partner as a local cable operator it was “better distribution of
local content.”
Finally, the companies were asked about the problems they would have to address in
order to achieve an alliance. More than 70% pointed to “differences in management
policy.” Companies envisioning a tie-up with an MSO were more likely to cite “additional
costs” and “concern over whether the firm can stay relevant to the region” than those
anticipating a local cable company as a partner. The second most common answer among
the latter group, however, was “shareholders’ intentions” (Figure 26).
Local cable TV operator
(non-MSO)
Leading MSOLocal
government
Telecom
Content distributor
Equipment vendor
Other
No specific type in mind
0% 20% 40% 60% 80% 100%
MSO responses(n=21)
Non-MSO responses(n=80)
Source: Development Bank of Japan Inc.
Necessary right nowNecessary in future
Not under consideration
0% 20% 40% 60% 80% 100%
MSO responses (n=25)
Non-MSO responses(n=97)
Source: Development Bank of Japan Inc.

- 14 -
Source for Figs.24 through 26:
Development Bank of Japan Inc.
65%
50%
75%
45%
0%
10%
5%
57%
54%
41%
51%
1%
14%
4%
0% 20% 40% 60%
Lower costs through jointprocurement of programs and
equipment
Compatibility with newtechnologies (linkups with
smartphones & tablets; internetvideo transmission, etc.)
Sharing of skills: business,customers relations, etc.
Better distribution of localcontent
Compatibility with landlinetelephone services
Compatibility with wirelessservices (WiMAX, WiFi, etc.)
Other
MSO responses (n=20)
Non-MSO responses (n=74)
82%
55%
73%
32%
0%
5%
0%
74%
43%
49%
66%
0%
6%
3%
0% 20% 40% 60% 80%
Lower costs through jointprocurement of content and
equipment
Compatibility with newtechnology (linkups with
smartphones & tablets; videotransmission on smart TV &
internet; etc.)
Sharing of business skills,customer relations skills, etc.
Better distribution of localcontent
Compatibility with landlinetelephone service
Compatiblity with wirelessservice (WiMAX, Wi-Fi, etc.)
Other
Alliance with MSO(n=22)
Alliance with non-MSO(n=35)
Figure 24 Desired Effects of an Alliance
(Multiple res ponses; MSO/non-MSO)
Figure 25 Desired Effects of an Alliance
(Multiple responses; partner is MSO/non-MSO)
86%
41%
5%
59%
50%
0%
5%
74%
54%
14%
34%
29%
29%
3%
0% 20% 40% 60% 80%
Differences in managementpolicy
Shareholders' intentions
Differences with contentdistributors
Additional costs
Concern over whether firm canstay relevant to the region
Lack of a person or group tolead and coordinate the alliance
Other
Firms responding "MSO" (n=22)
Firms responding "Local cable operator (non-MSO)" (n=35)
Figure 26 Obstacles in the Way of Alliances
(Multiple responses)

- 15 -
③ Alliance strategies
In expectation of further competition with telecoms and a shrinking market, cable
television operators are weighing their options. The survey suggested that they were
leaning towards two broad strategies: “greater ability to compete on cost,” and
“differentiation through services tailored to the locality” (Figure 27). Alliances play a key
role in each. On the vertical axis of the scale, we see that specific steps such as the joint
use of facilities, joint purchasing of terminals and content, and integration of functions
are already producing results for a number of companies.
On the horizontal axis, “differentiation through services tailored to the locality,” through
tie-ups with a variety of local organizations, is shown to resolve local issues and enrich the
lives of local residents.
Figure 27 Effects of Alliances on Competition Strategy
Differentiation from telecoms
Enh
ance
me
nt o
f cost
com
petitive
ne
ss
Lower investmentthrough
shared facilities
Cost reductionthrough
joint purchasing
Better productivitythrough
functional integration
Differentiation throughlocalized services
Cost leadership strategies promoted by MSOs and other leading companiesKey to success: Partnering with other firms in the industry.
Operators seeking strategies to deal with problems such as the ageing and shrinking of Japan's populationKey to success: Partnering with other industries.
Shared headend
Shared telephone center equipment
Joint purchasing of subscriber terminals
Joint purchasing of internet upper network
Joint purchasing of CS programs
Shared program guides
Shared advertising and business functions
Integrated call center
Integration & sharing of production capabilties
Shared service center for clerical work
Collaborative staff training & R&D
Partnership
Retailers, carriers, etc.
Medical & welfare facilities
Schools
Ward offices, town halls
Partnerships withDifferentiation throughlocalized services
Source: Development Bank of Japan Inc.

- 16 -
The FY 2012 Report revealed signs of change in the business environment. Cable
operators must take changing trends into account as they perform the urgent task of
formulate their mid-to-long-term outlooks. As the questions on attitudes toward alliances
made clear, momentum for alliances may be increasing, but companies’ views on such
tie-ups – and what they expect to gain from them – tend to differ. Japan’s cable television
operators must focus on creating alliance strategies that spell out which forms of
cooperation will best suit their corporate needs.
Figure 28 Putting Alliance Strategies into Effect
Hiroyuki Sawada,
Corporate Finance Department, Division 2
Makoto Shimizu,
Economic & Industrial Research Department
Development Bank of Japan Inc.
Source: Development Bank of Japan Inc.
Partners:MSOs, independent operators, telecoms, local
governments …
Scope of alliance:Sharing of facilities, joint purchasing of programs,
compatibility with new technologies …
Expected results and advantages:
Specific economic benefits
Reduction in investment, services benefiting the
general public …
Reduction in costs (approx. --- yen)
Obstacles and disadvantages:
Capital problems, possible loss of independence …
The right alliance for your firm?
Area, scale …

- 17 -
All inquiries should be directed to the Economic & Industrial Research Department,
Development Bank of Japan Inc.
the Economic & Industrial Research Department,
Development Bank of Japan Inc.
Phone: 03-3244-1840 E-mail: [email protected]


