Download - TeleGeography The State of the Network

The
State of the
Network
TeleGeography
2021 EDITION
San Diego, CA, USA
PriMetrica, Inc.Headquarters5927 Priestly Drive, Suite 111Carlsbad, CA 92008-8800United StatesTel: +1 (760) 651 0030Fax: +1 (760) 579 0273
Washington DC, USA
TeleGeographyOne Thomas Circle, N.W.Suite 360Washington, DC 20005United StatesTel: +1 (202) 741 0020Fax: +1 (202) 741 0021
United Kingdom
Primetrica Limited/TeleGeographyThe Station Master’s HouseNew North RoadExeter, Devon. EX4 4HFUnited KingdomTel: +44 (0) 1392 493626Fax: +44 (0) 1392 420126
Singapore
TeleGeography Asia Pte Ltd78B Boat QuaySingapore 049866Tel: +65 6812-5797Fax: +65 6812 5889
Introduction 1
Global Bandwidth 3
Global Internet 11
Data Centers 17
Voice Market 25
Research Catalog 30
This e-book is brought to you by

1
More so than normal, our team is thrilled to usher in a new year.
Sure, that’s in part because a new year signals the release of our
fourth State of the Network Report—and with it a new batch of
data and analysis on the way the world is connecting. But mostly
because 2020 presented a unique set of challenges to the world,
our industry, and our team.
Working remotely since March 2020, TeleGeography analysts
continued to collect information on the way the world
communicates, which was changing in real-time.
We kept tabs on operators racing to keep revenue margins ahead
of eroding prices. We monitored COVID-induced spikes in global
internet traffic.
We queried data center operators about shifts in their day-to-day
operations. And we watched a small rally in international calling
during the early days of the pandemic, only to see the voice industry
return to its formerly scheduled slump.
Our team feels lucky that we were able to continue our research
safely. Our 2021 State of the Network Report—a product that we
think of as an annual snapshot—makes a point to underscore
NEW YEAR, NEW DATA

2
Meet Our ExpertsCOVID-19’s impact across each chapter. Some of these effects are
already proving to be one-off events, while others seem poised to
make a more lasting impact on the market.
Per usual, this analysis was informed by TeleGeography data. It was
collected throughout 2020 and you can find even more of it within
our full suite of research apps.
Thank you for your continued readership and interest in our work.
We can’t wait to take on 2021 and get back to work, together.
— The TeleGeography Team
Paul BrodskySenior Analyst Connect on LinkedIn
Patrick Christian Principal Analyst Connect on LinkedIn
Jon HjemboSenior Manager Connect on LinkedIn
Alan MauldinResearch Director Connect on LinkedIn
Anahí RebattaSenior Analyst Connect on LinkedIn
Tim StrongeVP of Research Connect on LinkedIn

3
This section is brought to you by
The global outbreak of COVID-19—and its associated economic
impact—has amplified the role played by the international telecom-
munications industry and the bandwidth market that underpins it.
The global bandwidth market has always been marked by change
and uncertainty; the current crisis is just an extreme example of this.
Working and learning from home have dramatically altered traffic
patterns, yet the internet has proven remarkably resilient in the face
of these sudden changes. Many network operators are accelerating
plans to add capacity to stay ahead of demand. Local ISPs are
increasing caching capabilities to reduce reliance on international
links. Content providers are reducing bit rates for streaming video
applications in some regions to help alleviate network congestion.
Meanwhile, life—and business—goes on. On the commercial side,
operators race to keep revenue margins ahead of eroding prices,
while bandwidth demand and supply continue to grow across global
routes.
Our Global Bandwidth Research Service assesses the state of the
global telecom transport network industry, evaluates the factors that
shape long-term demand growth and price erosion, and provides
some preliminary thoughts on the impact of COVID-19 on the
industry. We assess market conditions on both a global level and on
a regional level, focusing on critical submarine cable route markets.
GLOBAL BANDWIDTH
MORE BANDWIDTH!
4
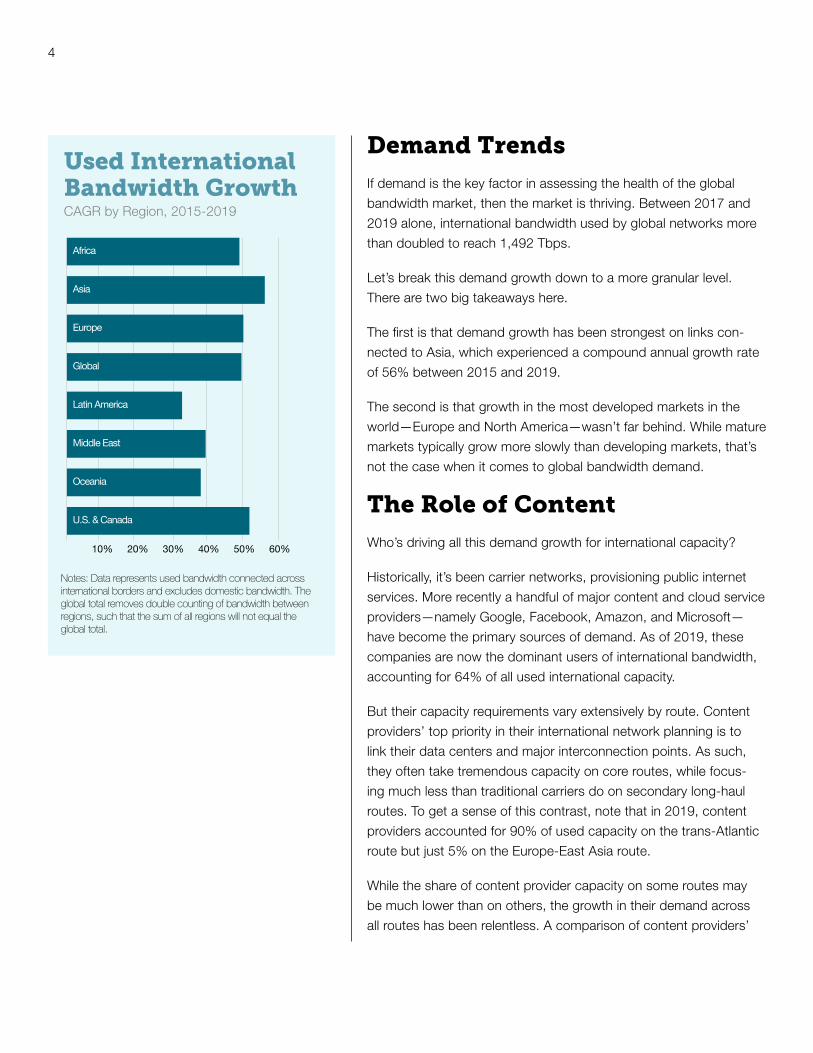
Used International Bandwidth GrowthCAGR by Region, 2015-2019
Notes: Data represents used bandwidth connected across international borders and excludes domestic bandwidth. The global total removes double counting of bandwidth between regions, such that the sum of all regions will not equal the global total.
10% 20% 30% 40% 50% 60%
U.S. & Canada
Oceania
Middle East
Latin America
Global
Europe
Asia
Africa
Demand TrendsIf demand is the key factor in assessing the health of the global
bandwidth market, then the market is thriving. Between 2017 and
2019 alone, international bandwidth used by global networks more
than doubled to reach 1,492 Tbps.
Let’s break this demand growth down to a more granular level.
There are two big takeaways here.
The first is that demand growth has been strongest on links con-
nected to Asia, which experienced a compound annual growth rate
of 56% between 2015 and 2019.
The second is that growth in the most developed markets in the
world—Europe and North America—wasn’t far behind. While mature
markets typically grow more slowly than developing markets, that’s
not the case when it comes to global bandwidth demand.
The Role of ContentWho’s driving all this demand growth for international capacity?
Historically, it’s been carrier networks, provisioning public internet
services. More recently a handful of major content and cloud service
providers—namely Google, Facebook, Amazon, and Microsoft—
have become the primary sources of demand. As of 2019, these
companies are now the dominant users of international bandwidth,
accounting for 64% of all used international capacity.
But their capacity requirements vary extensively by route. Content
providers’ top priority in their international network planning is to
link their data centers and major interconnection points. As such,
they often take tremendous capacity on core routes, while focus-
ing much less than traditional carriers do on secondary long-haul
routes. To get a sense of this contrast, note that in 2019, content
providers accounted for 90% of used capacity on the trans-Atlantic
route but just 5% on the Europe-East Asia route.
While the share of content provider capacity on some routes may
be much lower than on others, the growth in their demand across
all routes has been relentless. A comparison of content providers’
5
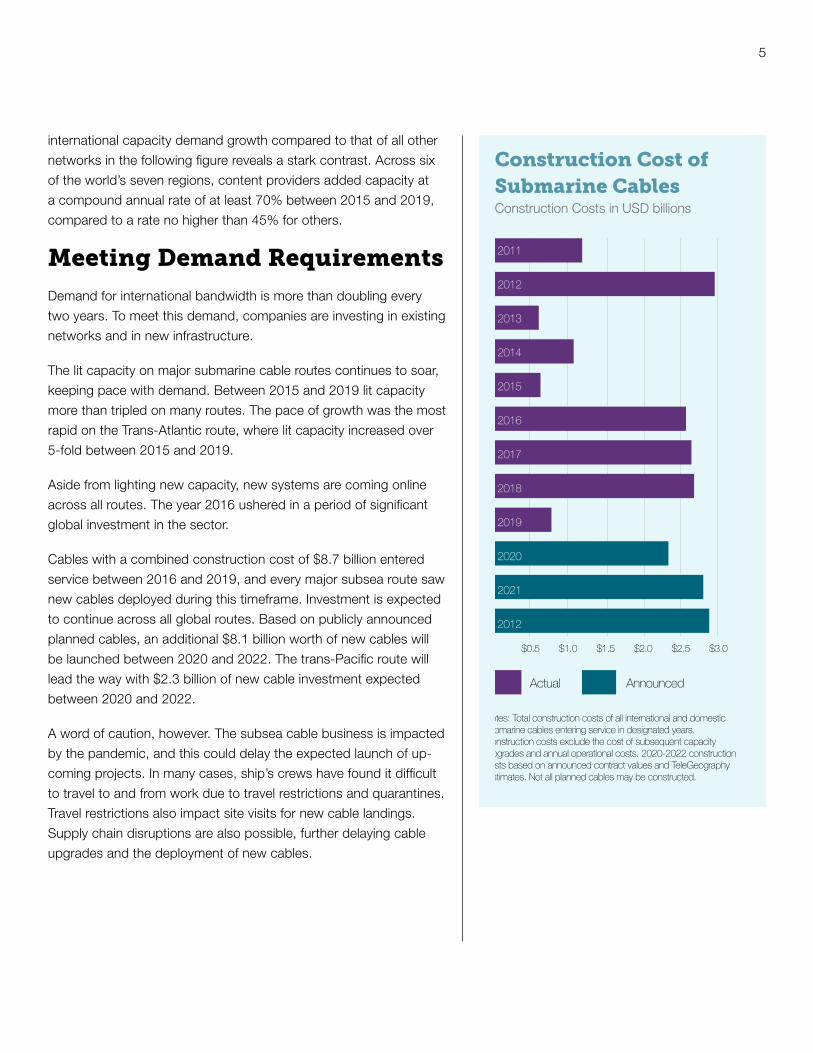
Construction Cost of Submarine Cables
Construction Costs in USD billions
Notes: Total construction costs of all international and domestic submarine cables entering service in designated years. Construction costs exclude the cost of subsequent capacity upgrades and annual operational costs. 2020-2022 construction costs based on announced contract values and TeleGeography estimates. Not all planned cables may be constructed.
$0.5 $1.0 $1.5 $2.0 $2.5 $3.0
Actual Announced
2011
2012
2013
2014
2015
2016
2017
2018
2019
2020
2021
2012
international capacity demand growth compared to that of all other
networks in the following figure reveals a stark contrast. Across six
of the world’s seven regions, content providers added capacity at
a compound annual rate of at least 70% between 2015 and 2019,
compared to a rate no higher than 45% for others.
Meeting Demand RequirementsDemand for international bandwidth is more than doubling every
two years. To meet this demand, companies are investing in existing
networks and in new infrastructure.
The lit capacity on major submarine cable routes continues to soar,
keeping pace with demand. Between 2015 and 2019 lit capacity
more than tripled on many routes. The pace of growth was the most
rapid on the Trans-Atlantic route, where lit capacity increased over
5-fold between 2015 and 2019.
Aside from lighting new capacity, new systems are coming online
across all routes. The year 2016 ushered in a period of significant
global investment in the sector.
Cables with a combined construction cost of $8.7 billion entered
service between 2016 and 2019, and every major subsea route saw
new cables deployed during this timeframe. Investment is expected
to continue across all global routes. Based on publicly announced
planned cables, an additional $8.1 billion worth of new cables will
be launched between 2020 and 2022. The trans-Pacific route will
lead the way with $2.3 billion of new cable investment expected
between 2020 and 2022.
A word of caution, however. The subsea cable business is impacted
by the pandemic, and this could delay the expected launch of up-
coming projects. In many cases, ship’s crews have found it difficult
to travel to and from work due to travel restrictions and quarantines.
Travel restrictions also impact site visits for new cable landings.
Supply chain disruptions are also possible, further delaying cable
upgrades and the deployment of new cables.
6
PricingAbundant supply and increasing competition have led to robust
price erosion throughout the global bandwidth market. New 100
Gbps-equipped submarine cable systems and upgrades to existing
networks have further lowered unit costs. And this has driven down
both 10 Gbps and 100 Gbps wavelength prices. Across critical
global routes, weighted median 10 Gbps and 100 Gbps prices fell
an average of 14% and 23% compounded annually since 2016.
Yes, bandwidth prices decline reliably. But prices are not the same
throughout the world. Our weighted median 10 Gbps lease price
on the Frankfurt-London route comes in at just $724. Compare that
to $18,000 for 10 Gbps between Los Angeles and Sydney. The
cheaper intra-European route is shorter and benefits from more
competition than the Australia-U.S. route. The comparison still
clearly illustrates the range of prices between global hubs.
While differences persist, prices have converged somewhat over
the past few years. Routes with historically high bandwidth prices
are transforming into key inter-regional connectivity points with high
demand growth, new supply, and competition. Price declines in
these locations outpace the market, bringing them more in line with
other core global routes.
With falling prices, the incentive to buy larger versus smaller circuits
increases. In Q4 2019, carriers priced 100 Gbps wavelengths an
average of 4.3 times higher than 10 Gbps for 10 times the capacity.
That’s down from 6.4 times more in 2015. Multiples vary by route,
often corresponding with regional price differences. Shorter, in-
tra-regional terrestrial links exhibit lower price multiples than longer,
transoceanic subsea connections. For example, operators on
Frankfurt-London and Los Angeles-New York report the lowest price
multiples of the group.
We also tend to see low multiples where 100 Gbps adoption is
strong or in markets where 10 Gbps prices stabilize at higher rates.
On the subsea routes of Los Angeles-Tokyo and London–New
York, the low multiples of 4.3 and 4.5 are driven by two factors.
First, increasing demand continues to drive down 100 Gbps prices.
Second, as demand shifts to higher capacities, sales of 10 Gbps
circuits have moderated, resulting in more stable 10 Gbps prices.
7
OutlookWhat does the future hold for the global bandwidth market? The
two most predictable trends are persistent demand growth and
price erosion. Beyond that, operators will have to navigate the major
uncertainties of an evolving sector and a global pandemic. Here are
a few of the key trends, among many, that will affect the long-haul
capacity market in the coming years.
Expanding Frontiers by a Limited Group
Content providers’ cable investments have largely focused on
trans-Atlantic, trans-Pacific, U.S.-Latin American, and intra-Asian
routes thus far. As their demand for capacity continues to grow
across all routes, other paths are likely to draw content provid-
er-backed cable construction in the near future.
Google’s Equiano cable is the first foray into Africa by a content
provider. Content providers already have new investments in the
pipeline focused on India-Singapore and India-Europe.
Will new content providers join the existing few that are investing in
submarine cable systems?
Our assessment is that a very limited group of players will continue
to dominate content and cloud network demand. It seems unlikely
that many more such networks, even the Chinese content providers,
will reach sufficient demand volumes in the near-term to warrant
their emergence as full-fledged owners of subsea cables.
Rising Utilization
Even with the introduction of many new cables and the ability of
older cables to accommodate more capacity, the growth of potential
capacity has failed to outpace that of lit capacity. We can already
see that the percentage of capacity that is lit on major routes has
begun to rise.
The U.S.-Latin America and Europe-Sub-Saharan Africa routes
are exceptions to this trend. On the U.S.-Latin America route,
three high-capacity cables were recently launched, decreasing the
proportion of lit capacity relative to total potential capacity. On the
8
With falling prices, the incentive to buy larger versus smaller circuits increases. In Q4 2019,
carriers priced 100 Gbps wavelengths
an average of 4.3 times higher than 10 Gbps for 10 times the
capacity.
“Europe-Sub-Saharan Africa route, several cables have had major
upgrades, and no additional lit capacity has been required in recent
years. But this situation is only temporary, as operators are now
planning additional upgrades and new cables.
Looming Cable Retirements
Cables are engineered to have a minimum design life of 25 years,
but what really matters is the economic life. The economic life
depends on a cable’s revenue exceeding the costs. If the costs of
operating a cable continually exceed the revenues, an operator may
consider retiring the cable. This could happen well before a cable
runs of out capacity. Many older cables laid in the late 1990s and
early 2000s may soon become candidates for retirement. In fact,
TAT-14, a trans-Atlantic cable laid in 2001, was retired in December
2020.
Addressing the Shannon Limit
In moving beyond 100 Gbps wavelengths, the industry faces a
major challenge in that it will reach the very edge of the Shannon
Limit—the theoretical channel capacity limit given a specified chan-
nel bandwidth and signal-to-noise ratio (SNR).
So how is the industry tackling this problem? By taking a multi-
pronged approach. A few of the major strategies include increasing
the number of fiber pairs, introducing multi-core fiber, and continu-
ing to introduce more powerful processors. The concept of Spatial
Division Multiplexing (SDM) has emerged at the forefront of strate-
gies for increasing subsea cable system throughput moving forward.
SDM simply refers to the use of an increased number of paths in a
cable (either more fiber pairs or more cores per fiber pair).
Current transoceanic systems generally deploy 6 to 8 fiber pairs, but
Dunant, which is slated to launch in 2020, will have 12, and future
systems such at Amitie and Grace Hopper will have 16. As a long-
term growth strategy, adding fiber pairs has limitations, and so the
use of Multi-Core Fiber (MCF) is being explored as a way forward in
the quest for more bandwidth. MCF technology will provide multi-
ple spatial paths within a single fiber using advanced multiplexing
techniques.

9
Wholesale Market Challenges
The rapid expansion of major content providers’ networks has
caused a shift in the global wholesale market. Google, Microsoft,
Facebook, and Amazon are investing in new submarine cable
systems and purchasing fiber pairs. This removes huge sources
of demand from the addressable wholesale market. On the other
hand, it drives scale to establish new submarine cable systems and
lower overall unit costs.
Many submarine cable business models actually rely on this capital
injection, allocating fiber and network shares to the largest consum-
ers to cover initial investment costs, then selling remaining shares of
system capacity as managed wholesale bandwidth.
Unit cost savings of large investments are a great incentive to in-
vestment for operators, but they don’t want to be left with too much
excess bandwidth. It’s often a race to offload wholesale capacity
before a new generation of lower-cost supply emerges. Carriers
most likely to succeed are those with massive internal demand and
less dependence on wholesale market revenues.
Both content and telco network operators are reckoning with
massive bandwidth demand growth, driven by new applications
and greater penetration into emerging markets. The sheer growth
in supply will drive lower unit costs for bandwidth. In the face of
unrelenting price erosion, the challenge for wholesale operators is to
carve out profitable niches where demand trumps competition.
COVID-19’s Impact
With all that said, we have to acknowledge the impact that the
COVID-19 pandemic could have on the future supply of international
capacity.
Temporary cable factory closures combined with delays in permit-
ting and marine installation could hamper the deployment of many
planned cables. In the interim, the existing cables will play a pivotal
role in ensuring resilient global connectivity until more cables can be
added.

10
While facing likely delays in new
cable deployments, operators are also
addressing a surge in network demand in the
midst of the outbreak. Operators have felt this increase most
acutely in the access networks, but all parts
of global networks are experiencing
accelerated growth due to the pandemic.
“While facing likely delays in new cable deployments, operators are
also addressing a surge in network demand in the midst of the out-
break. Operators have felt this increase most acutely in the access
networks (both fixed and mobile), but all parts of global networks
are experiencing accelerated growth due to the pandemic.
Operators are taking steps to respond to this traffic growth by man-
aging traffic throughput, boosting cache deployments, accelerating
capacity upgrades, and addressing network maintenance needs.
The full impact of COVID-19 on networks is evolving rapidly. We will
continue to monitor the developments and provide updates. We
are collating our analysis and news about the pandemic’s impact
on networks on a rolling basis on a dedicated State of the Network:
Updates on COVID-19 site.
11
GLOBAL INTERNET
INTERNETBENDS, DOESN’T BREAK
The global outbreak of COVID-19—and its associated economic
and social impact—has laid bare the crucial, irreplaceable role that
the internet plays in our daily lives.
Starting in March 2020, internet traffic patterns shifted and volumes
surged as students around the world learned from home, adults
worked from home, and everybody did at least something from
home. To its enormous credit, the internet bent but—for the most
part—did not break as network operators scrambled to deal with
the swell in traffic.
In our Global Internet Geography Research Service, we discuss the
impact of COVID-19 within the larger framework of our analysis and
statistics on internet capacity and traffic. We also discuss factors
impacting IP transit pricing, and the role individual backbone opera-
tors play. Based on discussions and surveys with dozens of network
operators around the globe, we tentatively conclude that COVID-re-
lated expansion in internet traffic and bandwidth is largely a one-off
phenomenon, and that the trends we’ve observed in recent years
will largely continue. International internet bandwidth and traffic
growth had been gradually slowing in recent years, but they remain
brisk. IP transit price declines continue globally, but significant
regional differences in prices remain.
This section is brought to you by

12
Measures Taken by Operators Due to COVID-19Percent of Respondents Indicating “Yes”
10% 20% 30% 40% 50% 60% 70% 80%
Increased caching capacity
Increased peering capacity
Increased IP transit purchases
Accelerated international capacity upgrades
Accelerated domestic capacity upgrades
Internet Traffic and CapacityGlobal internet bandwidth rose last year by 35%, a substantial
increase over the previous year’s “modest” 26%. Driven largely by
the response to the COVID-19 pandemic, this represents the largest
one year increase since 2013, and has driven up the most recent
4-year CAGR to 29%. Total international bandwidth now stands at
618 Tbps. The pace of growth had been slowing, but we still see a
near tripling of bandwidth since 2016.
Strong capacity growth is visible across regions. Africa experienced
the most rapid growth of international internet bandwidth, growing
at a compound annual rate of 47% between 2016 and 2020. Asia
sits just behind Africa, rising at a 40% compound annual rate during
the same period.
International internet traffic growth largely mirrors that of internet
capacity. However, traffic and capacity growth seldom move in
perfect tandem. (Network operators will often add capacity in an-
ticipation of traffic growth.) Average and peak international internet
traffic increased at a compound annual rate of 30% between 2016
and 2020, comparable to the 29% compound annual growth rate in
bandwidth.
Let’s take a look at the recent impact that COVID-19 has had on
traffic growth. As you might imagine, all that stay-at-home activity
has had a pronounced impact on traffic. In 2020, average interna-
tional internet traffic increased 48%, while peak traffic rose 47%.
COVID-19 is a global phenomenon, so it’s no surprise that all the
major regions of the world show traffic growth outpacing capacity
growth in 2020. Latin America featured the largest disparity, with
average traffic rising 59% and peak traffic rising 51%, compared to
32% for capacity.
PricesAs network requirements balloon, global IP transit prices continue
to decline. Even in the face of a global pandemic. But the pace of
price erosion over the past three years and the factors driving it
vary throughout the world. Declines have been greatest in emerg-
ing markets, where prices are highest. Increases in volume, local
13
Global internet bandwidth rose last year by 35%, a substantial increase over the previous year’s “modest” 26%.
Driven largely by the response to the COVID-19 pandemic, this represents the largest one year increase since 2013.
“
traffic exchange, and number of suppliers can improve economy of
scale, underlying transport cost, and competition, respectively. In
established global hubs, prices continue to fall at a significant pace,
largely a result of escalating volume and declining unit cost.
Price erosion in global hubs such as London and Miami continues at
a steady clip—25% and 32%, respectively, since 2017. Both cities
house some of the most robust markets and lowest prices for IP
transit. Not only due to regional traffic exchange. They also draw
intercontinental traffic from Africa, the Middle East, and Latin Ameri-
ca, where remote traffic exchange is more cost-effective than buying
transit locally. This further fuels the high-volume market dynamics in
the global hubs.
Similarly, Singapore has cemented itself as a hub for intra-regional
traffic exchange in Asia. Accordingly, it hosts the most competitive
prices in the region. But even with a 25% rate of price erosion since
2017, IP transit in Singapore remains more expensive than western
Europe and the United States.
Since 2017, the price of a 10 GigE port in Singapore has hovered at
about three times the price in London, a reflection of differences in
market participants, underlying costs, as well as continued robust
price declines in the British capital.
The price for a 10 GigE port in Johannesburg dropped 44% over
the past three years. This largely reflects falling transport prices
linking South Africa to Europe. But also, Johannesburg’s position
as a regional market leader in terms of carrier neutral data centers,
localized content, the presence of cloud service providers, and
carrier competition.
Similarly, a majority of international traffic connecting Latin America
and Oceania is intercontinental, transiting undersea cables to the
U.S. to exchange traffic and access content (often more cost effec-
tively than locally). But both regions have seen upgrades to existing
systems and the launch of new regional submarine cables linking
them to global internet hubs in the U.S. This has greatly bolstered
supply and competition, lowering underlying transport costs. As a
result, prices for 10 GigE ports in São Paulo and Sydney fell 38%
and 22% compounded annually over the past three years. Weighted
median prices in the two cities are $1.04 and $3.50 per Mbps.

14
Initial evidence suggests that the
spike in the rate of bandwidth and traffic
growth from the pandemic may be a
one-time event and a return to typical rates of growth could be in
sight.
“In the transit market, 100 GigE ports are starting to gain traction
where 100 Gbps transport is already well entrenched. Some carriers
are considering 400 GigE ports, while others are already looking
forward to another 10x upgrade to 1 Tbps ports. While price multi-
ples between 10 GigE and 100 GigE ports have declined, for many
customers the motivation to upgrade to a larger port is not purely
financial. Ease of management and future proofing the network
have become particularly important in light of recent events. With
the shift to higher capacity ports and increasing localization of traffic
exchange and content hosting, continued price erosion is a safe bet
for the foreseeable future.
Provider ConnectivityOur rankings of provider connectivity includes analysis based on
BGP routing tables, which govern how packets are delivered to their
destinations across myriad networks as defined by autonomous
system numbers (ASNs). Every network must rely on other networks
to reach parts of the internet that it does not itself serve; there is no
such thing as a ubiquitous internet backbone provider.
If you want a single, simple number to identify the best-connected
provider in the world, you may come away disappointed. There are
several ways to measure connectivity, and each highlights different
strengths and weaknesses of a provider’s presence. One basic
metric is to count the number of unique Autonomous Systems (AS)
to which a backbone provider connects, while filtering out internal
company connections. The results are presented in the table below.
We’ve seen little change amongst the top providers based on this
ranking system. Hurricane Electric and CenturyLink have swapped
the top spot for several years. Hurricane edged out then-Level 3 in
2017 as the best-ranked ISP in terms of overall connections, but the
CenturyLink merger with Level 3 moved the combined entity back to
the top in 2018. Hurricane Electric maintains a small lead in 2020.
15
In addition to examining overall number of connections, we also
used our analysis of BGP routing tables to look at the “reach” (a
measure of the number of IP addresses an upstream ASN has been
given access to from downstream ASNs) and “share” (which com-
pares an upstream provider’s reach to all other upstream providers
of a downstream ASN.) The results of this analysis paint a different
picture. In some cases, an ISP might end up high-ranked in terms
of number of connections but low-ranked in terms of share or reach
when the number of IP addresses passed from its customers is
relatively small.
Finally, to focus on which backbone providers best serve the
end-user ISP market and corporations, we compare upstream pro-
vider connections to downstream broadband ISPs, calculated the
top providers to Fortune 500 companies, and examined connectivity
to specific industry sectors such as hosting, medical, and finance.
OutlookThe combined effects of new internet-enabled devices, growing
broadband penetration in developing markets, higher broadband
access rates, and bandwidth-intensive applications will continue to
fuel strong internet traffic growth.
While end-user traffic requirements will continue to rise, not all of
this demand will translate directly into the need for new long-haul
capacity. A variety of factors shape how the global internet will
develop in coming years:
Post-COVID-19 growth trajectory. Initial evidence suggests
that the spike in the rate of bandwidth and traffic growth from the
pandemic may be a one-time event and a return to typical rates
of growth could be in sight. Operators we spoke to indicated they
were not making major upward adjustments to their demand fore-
casts due to COVID-19.
16
IP Transit Price Erosion. It is not a bold prediction that IP transit
prices will continue to fall globally, as they always have. The rate of
decline will be greatest in emerging markets. In these markets, high
prices have greater potential to fall due to increases in volume and
local traffic exchange that improve economy of scale. In established
global hubs, prices will also fall, largely a result of escalating volume
and declining unit cost.
CDNs and Caching. While the increase in broadband users and
access rates will continue to drive traffic growth in access networks,
much of this growth may be managed locally within a network and
may not lead to proportional increases in traffic on international
links. Thus CDNs and caching will continue to have a localizing
effect on traffic patterns and dampen international internet traffic
growth.
Content Providers. Beyond the impacts of CDNs and caching,
the largest content providers’ private networks are having a major
impact on the growth of internet capacity requirements. As the
content providers extend their networks into new locations, the tra-
ditional backbone operators are adjusting the networks in response.
In some cases, backbone operators may reduce capacity on some
routes or shift capacity to new locations.

17
DATA CENTERS
THE CONNECT EFFECT
The COVID ImpactAs we published our 2020 Data Center Research Service update,
the pandemic was truly making its mark in the global marketplace.
Network and data center services have never been more critical to
connect a world in relative isolation. So we supplemented our 2020
data center site survey by asking global data center operators for
their assessment of the pandemic’s effect on their operations as of
September. Here’s what they told us.
Construction projects are moving forward: 65% of respondents
indicated that they have not experienced delays in site construction
or expansion because of the pandemic. While that may come as a
surprise, a significant minority indicated that there were delays or
that the situation varied by market. Project timelines have varied
extensively, continuing apace in some locations, while grinding to a
complete halt in others.
Data center demand is generally strong: About half of respon-
dents (48%) indicated that customer demand was increasing as a
result of the pandemic. A quarter said that demand varied by mar-
ket, while 20% indicated that they had seen no particular change
in demand thus far. Only 7% of respondents reported a decrease in
data center demand as a result of the pandemic.
This section is brought to you by

18
Cloud providers driving demand increase: When asked which
market verticals were driving demand the most, cloud and hyper-
scale were the most ubiquitous responses, although numerous
sectors were noted. Government, carriers, and gaming services
were cited as growth drivers as well.
Enterprise demand is falling: While the data center sector is fairing
better than most in the pandemic, it isn’t immune to the problems
facing the wider market. As enterprises and retail service providers
face tremendous exposure to decreased demand for their own
services, some data center customers from these verticals are
throttling their demand for colocation services as well.
Colocation pricing holds steady: A vast majority of respondents
(83%) stated that they were not altering colocation rates as a result
of the pandemic.
Our September COVID-19 survey largely corroborated outlooks
that operators have shared with us over the course of the last nine
months. Here are a few other observations that have been shared
with us this year.
Demand for colocation and cross-connects are particularly strong
in industries involving video streaming, gaming, and cloud provi-
sioning, as work, education, and entertainment shift heavily online.
Traffic levels within data centers have stretched out to sustained
peak levels that last throughout the day.
Daily operations continue with stringent safety procedures in place.
On-site staff at many data centers are taking on more remote hands
responsibilities as customer representatives forego travel to maintain
equipment. In some cases, this increased demand on data center
staff is causing slight operational delays.
The effect of the pandemic on operator supply chains is decidedly
mixed. Some equipment suppliers and data center customers have
sufficient stock to keep ahead of demand for the time being, but
others have already experienced shortages.
Pricing expectations have held steady throughout the year. Op-
erators have consistently reported little or no change in baseline
colocation rates, most recently affirming this trend in our November
pricing update.
19
PricingIndividual Pricing Components
As of H2 2020, the European average price per kilowatt for a 4-kilo-
watt colocation cabinet remains about 25% higher than the North
American rate. Over the course of 2020, we saw no discernible
COVID effect in the moving averages, with only slight fluctuations in
Asian and European average rates and no change in U.S. rates.
Among mature global markets, Singapore and Hong Kong are
always among the priciest in our survey, but major network conver-
gence points in Europe and North America are also costly places
to rent server space. Frankfurt and Singapore top the list of most
expensive global hubs in our current survey with median rates
around $500 per kilowatt.
Reported per-kilowatt rates for high-density cabinets (cabinets with
10-kilowatt density) are on average just 3% lower than those for
standard 4-kilowatt cabinets, though premiums or discounts can
vary extensively. Among 22 markets reporting high-density prices,
operators in all of the Asian markets indicated the same or higher
prices for high-density colocation, while all North American opera-
tors indicated the same or lower rates per kilowatt for high-density
cabinets. European operator responses were highly mixed.
When observing large-scale retail leases (100 kilowatts), we also see
consistent regional distinctions. The median rates for large-scale
retail leases in each of our APAC markets is the same or higher than
for standard stand-alone cabinet rates. But in Europe and North
America, per-kilowatt rates are almost universally discounted—aver-
aging 10% at the higher scale.
The average price multiple for a North American fiber cross-connect
is just 2.0 times the average European rate—the lowest we’ve seen.
European rates have risen at a steady clip, and now average nearly
$140 per cross-connect. In Asia, cross-connect rates fall between
the European and North American averages.
Historically, operators in North America have charged more for fiber
cross-connects than for Ethernet, whereas European operators
typically charged more for Ethernet cross-connects. Now, most Eu-
20
ropean operators have largely swung in the direction of discounting
Ethernet cross-connect fees relative to the cost of fiber cross-con-
nects, with the exceptions of those in Frankfurt and Amsterdam.
Total Cost Model
Regional differences in base prices per kilowatt and the costs of
cross-connects contribute directly to differences in average TCO.
Among the markets covered in our H2 2020 pricing update, the
average TCO in European markets when one cross-connect is
assumed ($1,923) is about 17% higher than that in North Amer-
ican markets ($1,648). The average Asian TCO exceeds $2,100,
although this would be lower if we had sufficient data to include one
of our lower-cost Asian markets in the full TCO sample. Hong Kong,
Singapore, and Frankfurt are among the more expensive markets in
the survey, with average total costs in excess of $2,000 per month.
When five cross-connects are assumed, the North American av-
erage TCO is about 14% higher than the European average. The
average North American TCO reaches $2,800. The Asian average
TCO is even higher, at nearly $3,000 per month. On the metro
level, Hong Kong remains unchanged as one of the most expensive
markets in the survey–unsurprising considering the fact that both its
base and cross-connect prices are among the highest of all metros
surveyed. Singapore and New York join several other (mostly U.S.)
markets from the survey in an expensive cluster averaging at least
$3,000 per month.
Price Trends
We continue to see stable baseline and cross-connect pricing
across global markets both historically and in forecasted expec-
tations. Both in response to our current pricing update and in
our recent COVID-19 questionnaire over the summer, operators
overwhelmingly indicated that base colocation prices would remain
unchanged in the near term.
Asian hubs remain among the most expensive globally. Given
regulatory and political challenges in Singapore and Hong Kong,
the data center and network industries are searching for alternative
locations to distribute deployments. Few viable options have come
to light, and so continued high demand in Hong Kong and Singa-
pore fuels consistently high prices.
21
Long-term growth across markets tends to be modest in both large and smaller markets. Between 2015 and 2020, the median compound annual growth rate in gross retail colocation capacity among the 49 markets highlighted in the study was just 5%.
“
Capacity and ProvidersMetro Capacity
Tokyo remains the largest retail colocation market in the world, with
10.3 million square feet of gross retail capacity reported in 2020—
but nearly 40% of that is accounted for by the various entities of the
NTT Group.
Washington (really, Northern Virginia) is the second-largest retail
market and arguably the most dynamic. By our measure, Hong
Kong now edges out London as the third-largest global market,
while the New York metropolitan region falls below London and
Dallas in the ranking of largest retail market by gross data center
footprint.
A number of sizable regional markets have cropped up around the
globe in recent years. Madrid, Moscow, and Stockholm in Europe;
Atlanta, Denver, and Montreal in North America; and Osaka and
Mumbai in Asia have become critical secondary markets with
around 1 to 3 million square feet of retail space.
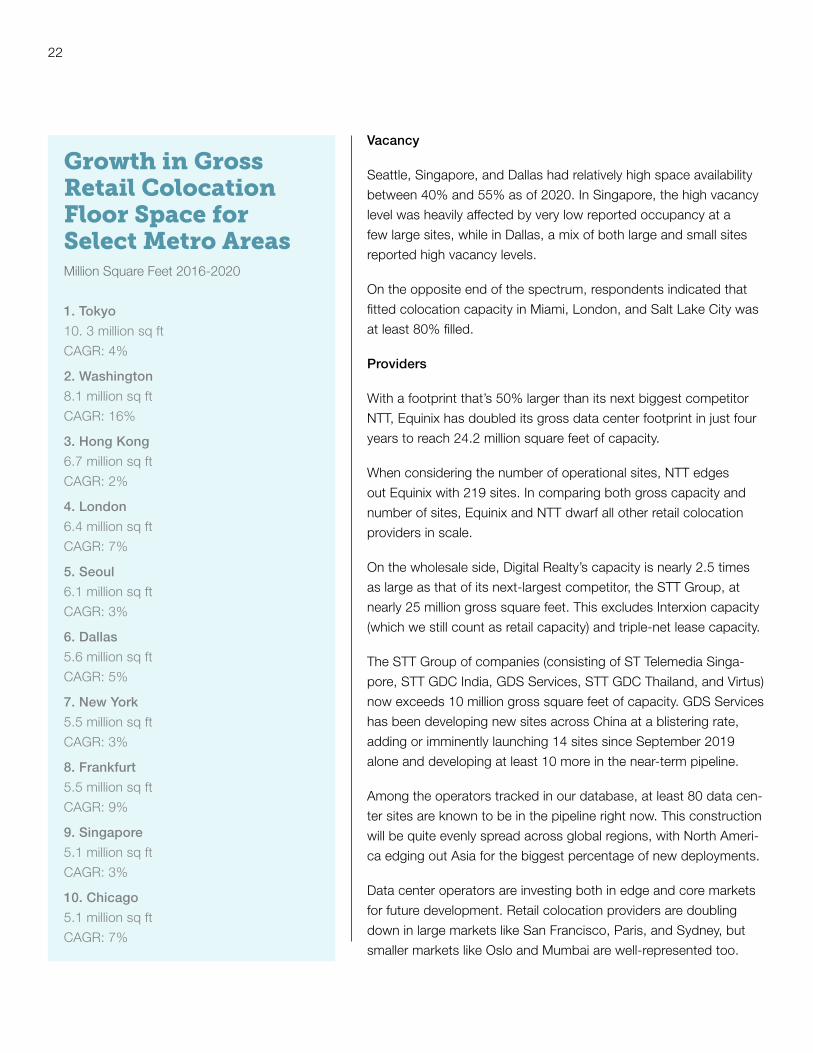
Market Growth
Long-term growth across markets tends to be modest in both
large and smaller markets. Between 2015 and 2020, the median
compound annual growth rate in gross retail colocation capacity
among the 49 markets highlighted in the study was just 5%. That’s
not to say there isn’t growth but that the gross capacity added to
the market on an annual basis doesn’t add tremendously to the
already-substantial established base in many of these locations.
Major hubs outpacing the median growth rate include Amsterdam
and Washington, each with at least 15% compound annual growth
in retail capacity.
On the other end of the spectrum, retail capacity growth has been
essentially flat in Hong Kong, Silicon Valley, and Paris.
22
Growth in Gross Retail Colocation Floor Space for Select Metro Areas Million Square Feet 2016-2020
1. Tokyo
10. 3 million sq ft
CAGR: 4%
2. Washington
8.1 million sq ft
CAGR: 16%
3. Hong Kong
6.7 million sq ft
CAGR: 2%
4. London
6.4 million sq ft
CAGR: 7%
5. Seoul
6.1 million sq ft
CAGR: 3%
6. Dallas
5.6 million sq ft
CAGR: 5%
7. New York
5.5 million sq ft
CAGR: 3%
8. Frankfurt
5.5 million sq ft
CAGR: 9%
9. Singapore
5.1 million sq ft
CAGR: 3%
10. Chicago
5.1 million sq ft
CAGR: 7%
Vacancy
Seattle, Singapore, and Dallas had relatively high space availability
between 40% and 55% as of 2020. In Singapore, the high vacancy
level was heavily affected by very low reported occupancy at a
few large sites, while in Dallas, a mix of both large and small sites
reported high vacancy levels.
On the opposite end of the spectrum, respondents indicated that
fitted colocation capacity in Miami, London, and Salt Lake City was
at least 80% filled.
Providers
With a footprint that’s 50% larger than its next biggest competitor
NTT, Equinix has doubled its gross data center footprint in just four
years to reach 24.2 million square feet of capacity.
When considering the number of operational sites, NTT edges
out Equinix with 219 sites. In comparing both gross capacity and
number of sites, Equinix and NTT dwarf all other retail colocation
providers in scale.
On the wholesale side, Digital Realty’s capacity is nearly 2.5 times
as large as that of its next-largest competitor, the STT Group, at
nearly 25 million gross square feet. This excludes Interxion capacity
(which we still count as retail capacity) and triple-net lease capacity.
The STT Group of companies (consisting of ST Telemedia Singa-
pore, STT GDC India, GDS Services, STT GDC Thailand, and Virtus)
now exceeds 10 million gross square feet of capacity. GDS Services
has been developing new sites across China at a blistering rate,
adding or imminently launching 14 sites since September 2019
alone and developing at least 10 more in the near-term pipeline.
Among the operators tracked in our database, at least 80 data cen-
ter sites are known to be in the pipeline right now. This construction
will be quite evenly spread across global regions, with North Ameri-
ca edging out Asia for the biggest percentage of new deployments.
Data center operators are investing both in edge and core markets
for future development. Retail colocation providers are doubling
down in large markets like San Francisco, Paris, and Sydney, but
smaller markets like Oslo and Mumbai are well-represented too.
23
Planned wholesale construction spans the gamut from the very larg-
est markets like Washington, Singapore, and London, to secondary
Chinese markets and other edge locations like Bangkok and Berlin.
Proprietary Data Centers
Among the proprietary data center operators tracked in the Data
Center Research Service, all are rapidly expanding into new mar-
kets. Collectively, Facebook, Microsoft, Google, and Amazon have
deployed 15 new data centers globally (many of which come in the
form of cloud service availability zones) in the last year alone.
Their growth is expected to accelerate over the near term with at
least 34 more proprietary sites and cloud region deployments in the
immediate pipeline.
Facebook alone currently operates eleven proprietary data center
campuses with 13.3 million square feet of operational capacity and
room for further growth. That’s up more than 45% from their report-
ed operational capacity just one year ago. The company has six
more campuses in the pipeline, with more than 6 million square feet
of capacity in the initial phases alone.
Power
Despite increased interest in high-density service provisioning,
reported density levels haven’t shifted much. At the highest levels
we track, only about 20% of sites currently provision site density
levels exceeding 200 W/sq ft, and that proportion hasn’t dramatical-
ly shifted in at least the last six years.
Operators at most sites (65% of those reporting) support only
density levels of up to 10 kilowatts per rack (kW/rack). The share of
sites offering the highest density levels exceeding 20 kW/rack is just
12%.
The average site density levels in Dallas and Chicago exceed 200
W/sq ft. This puts their average density levels into the very highest
range that we track. Dallas also has an above-average rack density
level of 13 kW/rack. On the other end of the spectrum, Frankfurt
has below average site density levels, and Hong Kong has low rack
density provisioning.

24
10 Highest Capacity International Internet Hub Cities Domestic routes omitted, 2020
Frankfurt, Germany
Bandwidth: 110.6 Tbps
London, U.K.
Bandwidth: 74.8 Tbps
Amsterdam, Netherlands
Bandwidth: 71.2 Tbps
Paris, France
Bandwidth: 67.9 Tbps
Singapore, Singapore
Bandwidth: 56.3 Tbps
Hong Kong, China
Bandwidth: 33.8 Tbps
Stockholm, Sweden
Bandwidth: 32.0 Tbps
Miami, U.S.
Bandwidth: 30.9 Tbps
Marseille, France
Bandwidth: 28.8 Tbps
Los Angeles, U.S.
Bandwidth: 25.2 Tbps
As of 2020, our survey indicates that most sites don’t operate at
a very low PUE level. A significant minority of sites (38%) operate
below 1.5, but that percentage hasn’t shifted over the past three
years.
Connectivity
As in the previous few years, 2020 respondents indicated that
Lumen (formerly CenturyLink), Verizon, and Zayo are the most
prominent carriers in their facilities. These three operators are
especially widespread in North America. AT&T and Cogent are also
common in North American facilities, while Colt, GTT, and BT are
heavily represented in European data centers. Telstra, China Tele-
com, China Unicom, Tata, and NTT are among the most ubiquitous
carriers across Asian sites.
By our estimates, Equinix FR5—the former Ancotel site at Kleyer-
straße 90 in Frankfurt—is the most carrier-dense colocation site
in the world. Critical facilities run by TELEHOUSE in London and
SUNeVision in Hong Kong are also among the most connected sites
globally.
25
This section is brought to you by
VOICE A CONTINUED DECLINE IN CALLING
As our TeleGeography Report and Database illustrates, international
voice market doesn’t bring a lot of joy these days. 2015 marked a
turning point in the international voice market—the first time since
the Great Depression that international call traffic declined, even if
only by one half percent. It’s been downhill ever since, as the slump
in voice traffic has turned into a fact of life. Carriers’ traffic fell a fur-
ther 9% in 2017 and 4% in 2018. The misery continued in 2019, as
traffic dropped another 6%, to 435 billion minutes. The COVID-19
pandemic spurred a short-term rally in international call volumes in
early 2020, but things pretty much returned to normal after that.
The COVID Impact
The global outbreak of COVID-19—and its associated economic
and social impact—has upended the way billions of people live their
lives. Has it had an impact on international calling? We queried a
number of international operators to find out. Only a bare majority of
operators responding to the survey we sent out in late 2020 report-
ed that they had, in fact, seen a jump in international call volumes
as the pandemic tightened its grip in March. (Nearly a third saw a
dip in traffic compared to the year before.) The bump in traffic was
short-lived, however. Only 4% of carrier reported that traffic levels
remained elevated by the second and third quarters of the year.

26
Carriers Reporting Year-on-Year Traffic IncreaseMarch 2020
10% 20% 30% 40% 50% 60%
Decrease in traffic
Traffic same as last year
Increase in traffic
Notes: Original question: "Did you see an increase in international traffic in March 2020 compared to the same period in 2019?"
The OTT Effect
A new market dynamic—social calling that replaced business com-
munications as the primary driver of ILD usage—fueled a long era
of international call traffic growth that began in the 1990s. In 1990,
U.S. international call prices averaged over one dollar per minute(!)
and business users accounted for 67% of ILD revenue.
A wave of market liberalization in the subsequent decade brought
new market entrants, causing prices to tumble, and making interna-
tional calling ever more affordable to consumers. In the early 2000s,
the introduction of low-cost prepaid phones made it possible for
billions of people in developing countries to obtain their own tele-
phones, and to keep in touch with friends and family abroad easily.
Call volumes soared, and by 2015, calls to mobile phones in devel-
oping countries accounted for 65% of global ILD traffic.
The transition to mobile and social calling drove a 20-year boom in
voice traffic, but has also left the industry uniquely vulnerable to the
rise of mobile social media.
While Skype was the dominant communications application for
computers, a veritable menagerie of smartphone-based commu-
nications applications, such as WhatsApp, Facebook Messenger,
WeChat (Weixin), Viber, Line, KakaoTalk, and Apple’s FaceTime,
now pose a greater threat. WhatsApp had about 2 billion monthly
active users in 2020, with Facebook Messenger topping 1.3 billion.
WeChat reported about 1.2 billion active users at the same time.
TeleGeography estimates that seven OTT communications applica-
tions—WhatsApp, Facebook Messenger, WeChat, QQ, Viber, Line,
and KakaoTalk—combined had nearly 6 billion monthly users in
September 2020. These estimates exclude apps for which directly
comparable data is unavailable, including Apple’s FaceTime, Google
Hangouts, and Skype (the latter two of which have over 1 billion
downloads from Google’s App Store).
It’s hard to pin precise numbers on the volume of international OTT
communications. However, a simple thought experiment helps to
illuminate its likely scale. Between 1983 and 2007, international

27
Wholesale carriers terminated approximately 307 billion minutes of traffic in 2019, down 6% from 2018.
“
phone traffic grew at a compounded annual growth rate (CAGR) of
15%, and traffic grew an even faster 21% CAGR between 1927 and
1983.
It’s hard to believe then that the recent decline in traffic means that
people have lost interest in communicating with friends and family
abroad. Rather, it suggests that they are turning to other means of
keeping in touch.
TeleGeography has fairly reliable estimates of Skype’s traffic through
2013, when the company carried 214 billion minutes of on-net
(Skype-to-Skype) international traffic. Telcos terminated 547 billion
minutes of international traffic in 2013, and OTT plus carrier traffic
totaled 761 billion minutes.
If we assume that total international (carrier plus OTT) traffic has
continued to grow at a relatively modest 13% annually since 2013
(with a drop to 9% in 2018 due to texting, video, and email), the
combined volume of carrier and OTT international traffic would
have expanded to 1.47 trillion minutes in 2019, and to 1.61 trillion
minutes in 2020. This calculation suggests that cross-border OTT
traffic overtook international carrier traffic in 2016, and would near
1.2 trillion minutes in 2020, far exceeding the 409 billion minutes of
carrier traffic projected by TeleGeography.
International Wholesale Services
Many retail service providers, such as mobile operators, MVNOs,
and cable broadband providers, rely heavily on wholesale carriers to
transport and terminate their customers’ international calls. Whole-
sale carriers terminated approximately 307 billion minutes of traffic
in 2019, down 6% from 2018.
Even though wholesale traffic declined in 2019, over the last ten
years wholesale traffic grew at a compounded annual rate of 3%
while overall traffic only grew 1% per annum. By 2019, wholesale
carriers terminated more than two-thirds (71%) of international
traffic—up from 59% in 2008. Traffic to mobile phones in emerging
markets has historically spurred expansion of the wholesale market,

28
and that demand continues to drive wholesale’s growth: In 2019
wholesale carriers terminated 86% of traffic to Sub-Saharan Africa
and South America, and 83% to Central Asia. In contrast, only 54%
of traffic to western Europe was terminated by wholesale operators.
Revenues on calls to sub-Saharan Africa grew 20% between 2012
and 2019, $3.1 billion to $3.7 billion.
Declining wholesale prices stabilized in 2015 and have managed
to inch up since. This, combined with recent dips in wholesale
volumes, has resulted in uneven wholesale revenues in recent years.
Revenues were actually up last year to $16 billion.
Wholesale operators make the bulk of their revenues in only a
handful of regional markets. Sub-Saharan Africa, for example,
received 6% of the world’s wholesale traffic, but accounted for 23%
of wholesale revenues ($3.7 billion.) Countries in the Middle East
accounted for 6% of world wholesale traffic, but 11% of wholesale
revenues ($1.8 billion).
Wholesale revenues are bolstered by a select set of low-traffic
routes with stubbornly high prices. For example, the France to
Tunisia accounts for just 0.3% of international traffic, but, at $0.54
per minute, it provides 3% of all revenues. Thanks to low termina-
tion prices in Mexico, the U.S.-Mexico route serves as a converse
example: that massive route represents 9% of all international traffic
in the world, but only 0.5% of wholesale carrier revenues.
Who’s carrying all this traffic? In 2019, seven carriers in TeleGeog-
raphy’s ranking transported more than 20 billion minutes of traffic,
down from 11 in 2015. Among the nine largest carriers in the world,
only one terminated more traffic in 2019 than in 2018.
29
Prices & Revenues
Until 2015, international carrier voice traffic had increased in each
of the previous 60 years. In each of the past four years, paid call
volumes have slumped, with no end in sight. International carriers
had already suffered from revenue stagnation due to slow traffic
growth and falling prices.
The unprecedented occasion of outright traffic decline, however,
marked a new and depressing turning point. In reviewing develop-
ments from the past year, three major trends stand out:
1. Retail international call revenues peaked in 2012, and have been
on the decline ever since. Retail revenues have decreased from $99
billion in 2012 to $64 billion in 2019.
2. Retail prices were essentially unchanged in 2019, at about $0.15
per minute. Unfortunately, we anticipate that traffic loss will over-
whelm this recent price stabilization, and that revenues will decline
by a forecasted 8% in 2020.
3. At current run rates, international service revenues will fall to $50
billion by 2023. If that trend holds true, revenues will have declined
by nearly half of the $99 billion total in the 10 years after 2012.

30
Research CatalogBusiness Broadband Pricing Data
An extensive database of broadband service providers,
plans, and prices.
Cloud and WAN Infrastructure
This tool profiles international WAN services offered by
180 providers and analyzes trends in VPN, Ethernet,
DIA, and IPL availability and pricing, as well as cloud
connectivity services.
Data Center Research Service
A comprehensive online guide for understanding
data centers, network storage, and the nature of
interconnection.
Dedicated Internet Access Pricing Data
TeleGeography’s database of dedicated internet access
price benchmarks for corporate and retail customers
Ethernet Over MPLS Pricing Data
This database presents information on prices
connected to Layer 2, point-to-point Ethernet private
line transport service delivered over an MPLS mesh.
Ethernet Over SDH or SONET Pricing DataIn this module, we track long-haul city-to-city routes
between major global business centers.
Ethernet VPN Pricing Data
TeleGeography’s database of layer 2 Ethernet VPN
or VPLS services targeted at mid-market/enterprise
customers.
Global Bandwidth Forecast Service
Detailed forecasts of international bandwidth supply,
demand, prices, and revenues, updated quarterly.
Global Bandwidth Research Service
The most complete source of data and analysis for
long-haul networks and the undersea cable market.
Global Internet Geography
The most complete source of data and analysis about
international internet capacity, traffic, service providers,
ASN connectivity, and pricing.
GlobalComms Database Service
The most complete source of data about the wireless,
broadband, and fixed-line telecom markets, covering
over 225 countries and 2,900+ service providers.
GlobalComms Forecast ServiceWireless, broadband, and wireline market metrics and
forecasts by country and region.
i3forum InsightsA user-driven voice benchmarking tool for i3forum
consortium members; powered by TeleGeography.
IP Transit Forecast ServiceDetailed historical data and forecasts of IP transit
service volumes, prices, and revenues by country and
region.
IP Transit Pricing DataA database of wholesale internet access price quotes
by port speed and committed data rate from more than
60 carriers in over 100 cities around the world.
Local Access Pricing DataA database of global local access prices, reflecting
actual transaction prices paid by carriers for leased
private lines and Ethernet circuits.

31
MPLS VPN Pricing DataTeleGeography’s price benchmark tracks VPN port and
capacity charges at capacity increments between 128 Kbps
and 10 GigE.
SD-WAN Research ServiceThe only product that catalogs and analyzes the SD-WAN
market so you can find the right fit.
TDM Pricing DataTeleGeography experts routinely survey facilities-based
service providers that offer point-to-point private line TDM.
Both domestic and international routes are covered in our
list of tracked and surveyed routes.
TeleGeography Report and DatabaseThe most comprehensive source of data on international
long-distance carriers, traffic, prices, and revenues.
WAN Cost BenchmarkProvides tailored end-to-end price benchmarks for
enterprise wide area networks, based on the client’s
specified site locations and service requirements.
WAN Geography BenchmarkA WAN Geography benchmark is your personalized cloud
and WAN compass. This bespoke tool helps users optimize
their network architecture for the cloud.
WAN Manager SurveyThis special survey report is a treasure trove of analysis
based on the experiences of WAN managers whose day-
to-day role covers designing, sourcing, and managing U.S.
national, regional, and global corporate wide area computer
networks.
WAN Market Size ReportThis vital report presents individual market sizes for
key elements of the corporate network broken out by
geography.
Wavelengths Pricing DataIn this module, we focus on long-haul city-to-city routes
between major global business centers.


