Investment banking services are provided by Harris Williams LLC, a registered broker-dealer and member of FINRA and SIPC, and Harris Williams & Co. Ltd, which is a private limited company incorporated under English law with its registered office at 5th Floor, 6 St. Andrew Street, London EC4A 3AE, UK, registered with the Registrar of Companies for England and Wales (registration number 7078852). Harris Williams & Co. Ltd is authorized and regulated by the Financial Conduct Authority. Harris Williams & Co. is a trade name under which Harris Williams LLC and Harris Williams & Co. Ltd conduct business.
www.harriswilliams.com
TECHNOLOGY, MEDIA, & TELECOMQUARTERLY SOFTWARE SECTOR REVIEW │ 3Q 2017
PAGE |
TECHNOLOGY, MEDIA, & TELECOM
QUARTERLY SOFTWARE SECTOR REVIEW │ 3Q 2017
CONTENTS
DEAL SPOTLIGHT
M&A TRANSACTIONS – 3Q 2017
SOFTWARE M&A ACTIVITY
SOFTWARE SECTOR OVERVIEWS
SOFTWARE PRIVATE PLACEMENTS
SOFTWARE PUBLIC COMPARABLES
TECHNOLOGY IPOS
DEBT MARKETS
APPENDIX: PUBLIC COMPARABLES DETAIL
TMT CONTACTS
UNITED STATES
Jeff BistrongManaging [email protected]
Sam HendlerManaging [email protected]
Mike WilkinsManaging [email protected]
EUROPE
Thierry MonjauzeManaging [email protected]
TO SUBSCRIBE PLEASE EMAIL:*[email protected]
HARRIS WILLIAMS & CO. OVERVIEW
HARRIS WILLIAMS & CO. (“HW&CO.”) GLOBAL ADVISORY PLATFORM
SOFTWARE / SAAS
Enterprise Software
Data and Analytics
Data Center andManaged Services
Infrastructure andSecurity Software
IT and Tech-EnabledServices
INTERNET & DIGITAL MEDIA
Consumer Internet
Digital Media and Content
eCommerce and Retail
Mobile
Online Marketing
HW&CO. TECHNOLOGY, MEDIA & TELECOM (“TMT”) GROUP FOCUS AREAS
SELECT RECENT HW&CO. TMT TRANSACTIONS
TMT VERTICAL FOCUS AREAS
25+ year history with over 130closed transactions in the last 24months
Approximately 260 professionalsacross eight offices in the U.S. andEurope
Strategic relationships in India andChina
10 industry groups
KEY FACTS
1
HW&Co. OfficeNetwork Office
Education Technology
Engineered SolutionsSoftware
Fintech
Healthcare IT
Professional Services
Supply Chain and LogisticsTechnology
Human CapitalManagement
Member Management andNon-Profit
has received a majority investment from
has received a growth
investment fromhas been acquired by
has received a majorityInvestment from
has acquiredhas been acquired byhas been acquired by has been acquired byhas received an investment from
has been acquired byhas been acquired byhas acquired
Undisclosed
Strategic Buyer
PAGE |
TECHNOLOGY, MEDIA, & TELECOM
QUARTERLY SOFTWARE SECTOR REVIEW │ 3Q 2017
CASE STUDY: RECEIPT BANK LTD.
SECTOR TAILWINDS
Receipt Bank is a leading provider of small business-focusedbookkeeping and accounting software that enables automaticreceipt and invoice information processing, cutting down on timelost due to manual bookkeeping practices.
Receipt Bank’s solutions are used by more than 3,600 accountingbookkeeping partners, from the Big 4 accountants to small firms,and the company has been revolutionizing the bookkeepingprocess by using award-winning AI and automation since 2010.
Insight’s $50 million strategic growth investment will supportcontinued product development and accelerate globalexpansion efforts.
HW&Co.’s TMT Group advised Receipt Bank Ltd. (“Receipt Bank”) on its investment from InsightVenture Partners (“Insight”).
2
DATE CLOSED:
7/26/2017
RELEVANT SECTORS:
Data & Analytics
FinTech
HW&CO. DEAL CONTACTS
SaaS
Jonathan OrganDirector
Office: +44 (20) 7518 - 8909
Thierry MonjauzeManaging Director
Office: +44 (20) 7518 - 8901
Sylvain NobletVice President
Office: +44 (20) 7518 - 8917
As automation technologies and artificial intelligence continue to disrupt the traditional bookkeeping process, Receipt Bank is well-positioned as a pivotal provider bringing the accounting function out of the back office.
has received an investment from
PAGE |
TECHNOLOGY, MEDIA, & TELECOM
QUARTERLY SOFTWARE SECTOR REVIEW │ 3Q 2017
SELECT SOFTWARE M&A TRANSACTIONS – 3Q 2017
3
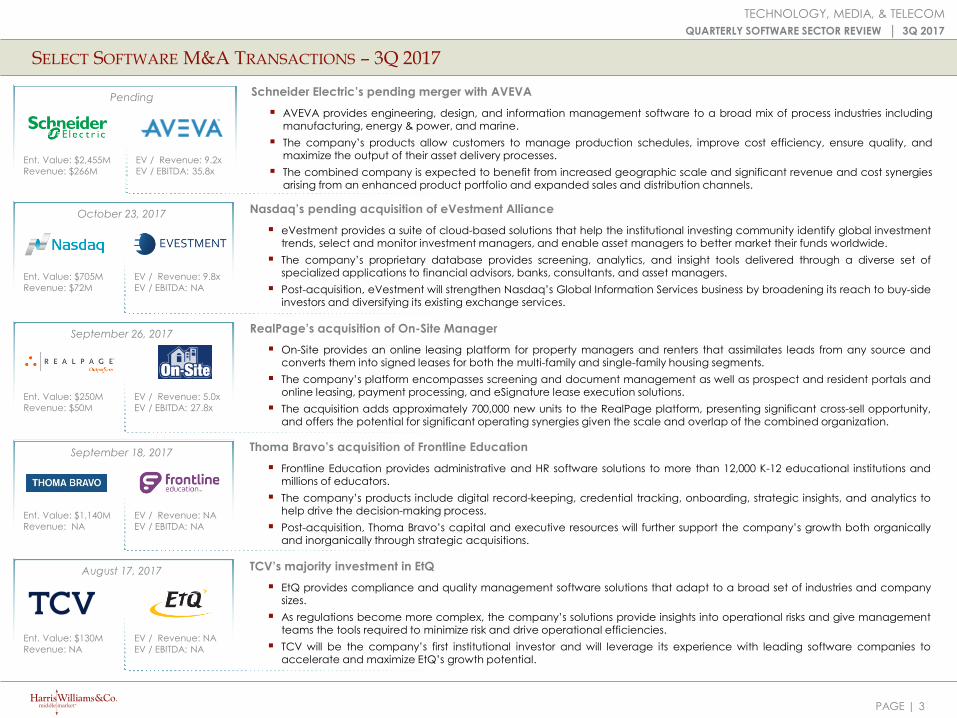
Thoma Bravo’s acquisition of Frontline Education
Frontline Education provides administrative and HR software solutions to more than 12,000 K-12 educational institutions andmillions of educators.
The company’s products include digital record-keeping, credential tracking, onboarding, strategic insights, and analytics tohelp drive the decision-making process.
Post-acquisition, Thoma Bravo’s capital and executive resources will further support the company’s growth both organicallyand inorganically through strategic acquisitions.
September 18, 2017
Ent. Value: $1,140M
Revenue: NA
EV / Revenue: NA
EV / EBITDA: NA
Schneider Electric’s pending merger with AVEVA
AVEVA provides engineering, design, and information management software to a broad mix of process industries includingmanufacturing, energy & power, and marine.
The company’s products allow customers to manage production schedules, improve cost efficiency, ensure quality, andmaximize the output of their asset delivery processes.
The combined company is expected to benefit from increased geographic scale and significant revenue and cost synergiesarising from an enhanced product portfolio and expanded sales and distribution channels.
Ent. Value: $2,455M
Revenue: $266M
EV / Revenue: 9.2x
EV / EBITDA: 35.8x
Pending
Nasdaq’s pending acquisition of eVestment Alliance
eVestment provides a suite of cloud-based solutions that help the institutional investing community identify global investmenttrends, select and monitor investment managers, and enable asset managers to better market their funds worldwide.
The company’s proprietary database provides screening, analytics, and insight tools delivered through a diverse set ofspecialized applications to financial advisors, banks, consultants, and asset managers.
Post-acquisition, eVestment will strengthen Nasdaq’s Global Information Services business by broadening its reach to buy-sideinvestors and diversifying its existing exchange services.
Ent. Value: $705M
Revenue: $72M
EV / Revenue: 9.8x
EV / EBITDA: NA
October 23, 2017
TCV’s majority investment in EtQ
EtQ provides compliance and quality management software solutions that adapt to a broad set of industries and companysizes.
As regulations become more complex, the company’s solutions provide insights into operational risks and give managementteams the tools required to minimize risk and drive operational efficiencies.
TCV will be the company’s first institutional investor and will leverage its experience with leading software companies toaccelerate and maximize EtQ’s growth potential.
Ent. Value: $130M
Revenue: NA
EV / Revenue: NA
EV / EBITDA: NA
August 17, 2017
RealPage’s acquisition of On-Site Manager
On-Site provides an online leasing platform for property managers and renters that assimilates leads from any source andconverts them into signed leases for both the multi-family and single-family housing segments.
The company’s platform encompasses screening and document management as well as prospect and resident portals andonline leasing, payment processing, and eSignature lease execution solutions.
The acquisition adds approximately 700,000 new units to the RealPage platform, presenting significant cross-sell opportunity,and offers the potential for significant operating synergies given the scale and overlap of the combined organization.
Ent. Value: $250M
Revenue: $50M
EV / Revenue: 5.0x
EV / EBITDA: 27.8x
September 26, 2017
PAGE | 4
TECHNOLOGY, MEDIA, & TELECOM
QUARTERLY SOFTWARE SECTOR REVIEW │ 3Q 2017
SOFTWARE ACQUISITION ACTIVITY – STRATEGIC ACQUIRERS
MOST ACTIVE STRATEGIC ACQUIRERS OF SOFTWARE ASSETS BY VOLUME1
GLOBAL STRATEGIC ACQUIRER SOFTWARE M&A ACTIVITY BY VOLUME1
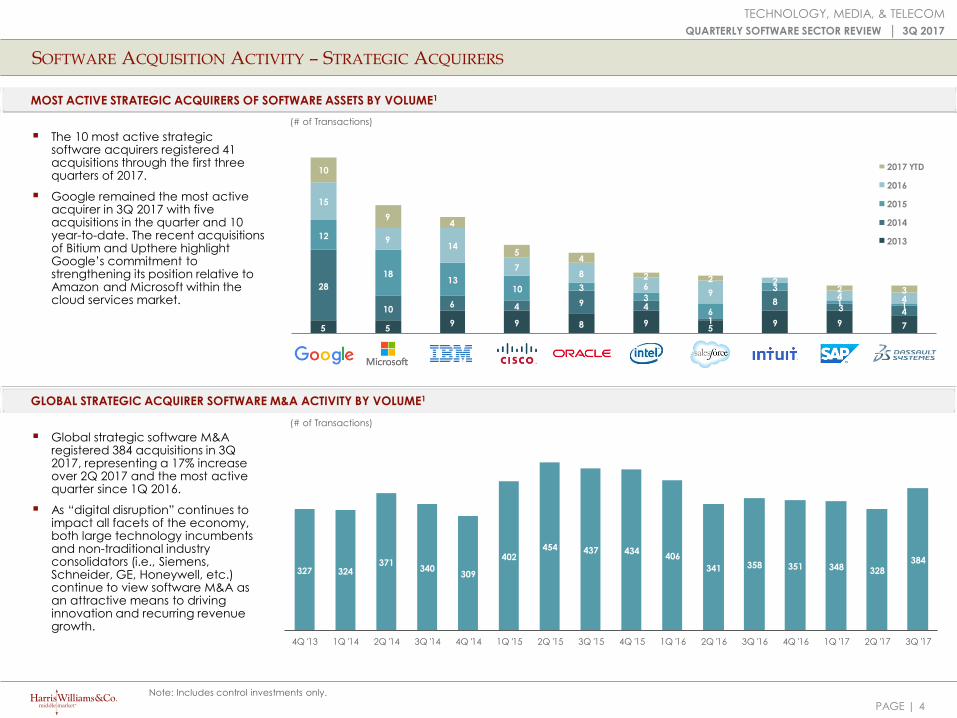
The 10 most active strategicsoftware acquirers registered 41acquisitions through the first threequarters of 2017.
Google remained the most activeacquirer in 3Q 2017 with fiveacquisitions in the quarter and 10year-to-date. The recent acquisitionsof Bitium and Upthere highlightGoogle’s commitment tostrengthening its position relative toAmazon and Microsoft within thecloud services market.
Global strategic software M&A registered 384 acquisitions in 3Q2017, representing a 17% increaseover 2Q 2017 and the most activequarter since 1Q 2016.
As “digital disruption” continues toimpact all facets of the economy,both large technology incumbentsand non-traditional industryconsolidators (i.e., Siemens,Schneider, GE, Honeywell, etc.)continue to view software M&A asan attractive means to drivinginnovation and recurring revenuegrowth.
327 324371
340309
402454 437 434
406
341 358 351 348 328384
4Q '13 1Q '14 2Q '14 3Q '14 4Q '14 1Q '15 2Q '15 3Q '15 4Q '15 1Q '16 2Q '16 3Q '16 4Q '16 1Q '17 2Q '17 3Q '17
5 59 9 8 9
59 9 7
28
106 4 9 4
1
83 4
12
1813
10 33
6
3
1 1
15
914
78
69
2
4 4
10
94
54
2 22 3
2017 YTD
2016
2015
2014
2013
(# of Transactions)
(# of Transactions)
Note: Includes control investments only.
PAGE | 5
TECHNOLOGY, MEDIA, & TELECOM
QUARTERLY SOFTWARE SECTOR REVIEW │ 3Q 2017
SOFTWARE ACQUISITION ACTIVITY – PRIVATE EQUITY
MOST ACTIVE PRIVATE EQUITY BUYERS OF NEW SOFTWARE PLATFORMS BY VOLUME1
GLOBAL NEW PLATFORM PRIVATE EQUITY SOFTWARE M&A ACTIVITY BY VOLUME1
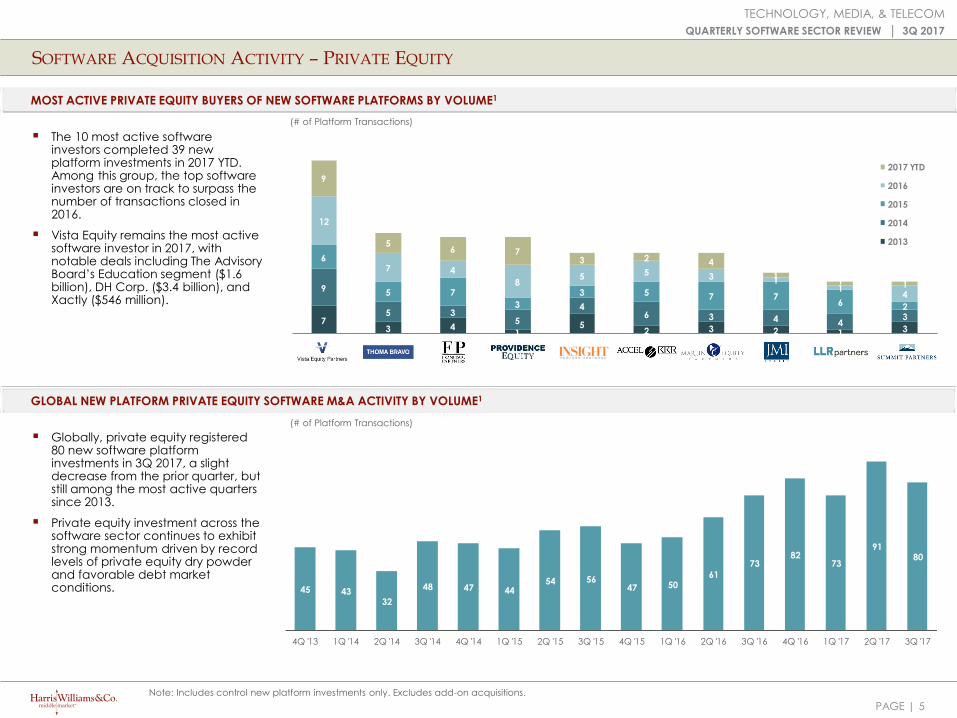
The 10 most active softwareinvestors completed 39 newplatform investments in 2017 YTD.Among this group, the top softwareinvestors are on track to surpass thenumber of transactions closed in2016.
Vista Equity remains the most activesoftware investor in 2017, withnotable deals including The AdvisoryBoard’s Education segment ($1.6billion), DH Corp. ($3.4 billion), andXactly ($546 million).
Globally, private equity registered80 new software platforminvestments in 3Q 2017, a slightdecrease from the prior quarter, butstill among the most active quarterssince 2013.
Private equity investment across thesoftware sector continues to exhibitstrong momentum driven by recordlevels of private equity dry powderand favorable debt marketconditions.
73 4
15
2 3 2 1 3
9
5 35
46 3 4 4
3
6
5 7
3
3 5 7 76 2
12
7 4
85 5 3 1
14
9
56 7
3 2 4
11 1
2017 YTD
2016
2015
2014
2013
45 4332
48 47 4454 56
47 5061
7382
73
9180
4Q '13 1Q '14 2Q '14 3Q '14 4Q '14 1Q '15 2Q '15 3Q '15 4Q '15 1Q '16 2Q '16 3Q '16 4Q '16 1Q '17 2Q '17 3Q '17
(# of Platform Transactions)
(# of Platform Transactions)
Note: Includes control new platform investments only. Excludes add-on acquisitions.
PAGE | 6
TECHNOLOGY, MEDIA, & TELECOM
QUARTERLY SOFTWARE SECTOR REVIEW │ 3Q 2017
DATE
CLOSED ACQUIRER TARGET DESCRIPTION
ENTERPRISE
VALUE (MM)
REVENUE
MULTIPLE
APPLICATION SOFTWARE – M&A MARKET SUMMARY
APPLICATION SOFTWARE M&A VOLUME1 (GLOBAL)
NOTABLE APPLICATION SOFTWARE M&A TRANSACTIONS1,5
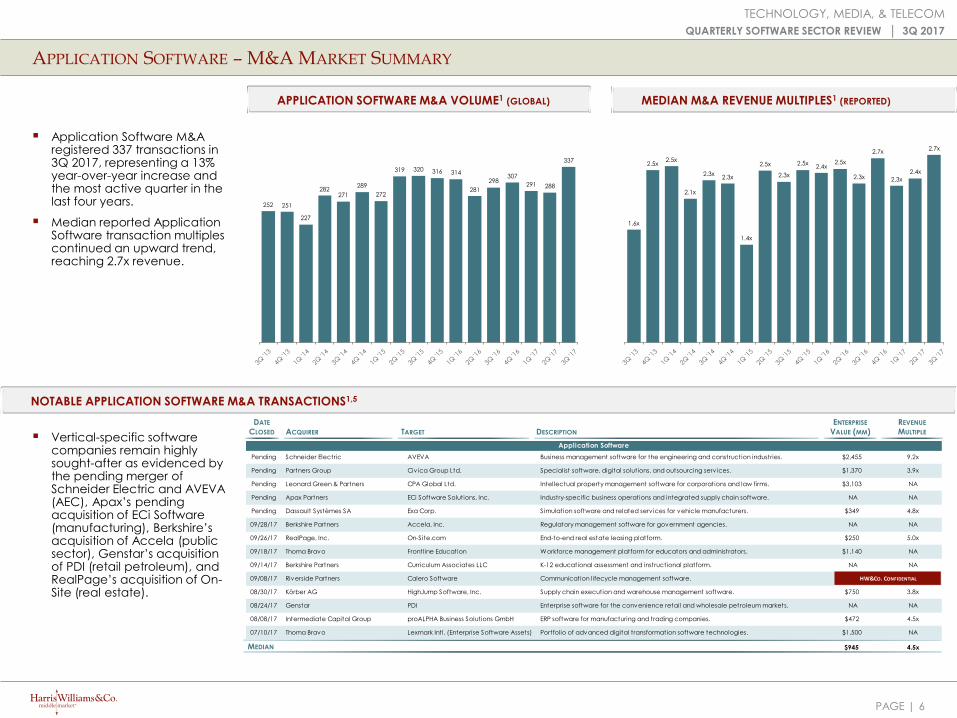
Application Software M&A registered 337 transactions in3Q 2017, representing a 13%year-over-year increase andthe most active quarter in thelast four years.
Median reported ApplicationSoftware transaction multiples continued an upward trend, reaching 2.7x revenue.
MEDIAN M&A REVENUE MULTIPLES1 (REPORTED)
1.6x
2.5x2.5x
2.1x
2.3x2.3x
1.4x
2.5x
2.3x
2.5x2.4x
2.5x
2.3x
2.7x
2.3x
2.4x
2.7x
Vertical-specific softwarecompanies remain highlysought-after as evidenced bythe pending merger ofSchneider Electric and AVEVA(AEC), Apax’s pendingacquisition of ECi Software(manufacturing), Berkshire’sacquisition of Accela (publicsector), Genstar’s acquisitionof PDI (retail petroleum), andRealPage’s acquisition of On-Site (real estate).
252 251
227
282 271
289
272
319 320 316 314
281
298 307
291 288
337
MEDIAN
3Q '1
3
4Q '1
3
1Q '1
4
2Q '1
4
3Q '1
4
4Q '1
4
1Q '1
5
2Q '1
5
3Q '1
5
4Q '1
5
1Q '1
6
2Q '1
6
3Q '1
6
4Q '1
6
1Q '1
7
2Q '1
7
3Q '1
7
3Q '1
3
4Q '1
3
1Q '1
4
2Q '1
4
3Q '1
4
4Q '1
4
1Q '1
5
2Q '1
5
3Q '1
5
4Q '1
5
1Q '1
6
2Q '1
6
3Q '1
6
4Q '1
6
1Q '1
7
2Q '1
7
3Q '1
7
Application Software
Pending Schneider Electric AVEVA Business management software for the engineering and construction industries. $2,455 9.2x
Pending Partners Group Civ ica Group Ltd. Specialist software, digital solutions, and outsourcing serv ices. $1,370 3.9x
Pending Leonard Green & Partners CPA Global Ltd. Intellectual property management software for corporations and law firms. $3,103 NA
Pending Apax Partners ECi Software Solutions, Inc. Industry-specific business operations and integrated supply chain software. NA NA
Pending Dassault Systèmes SA Exa Corp. Simulation software and related serv ices for vehicle manufacturers. $349 4.8x
09/28/17 Berkshire Partners Accela, Inc. Regulatory management software for government agencies. NA NA
09/26/17 RealPage, Inc. On-Site.com End-to-end real estate leasing platform. $250 5.0x
09/18/17 Thoma Bravo Frontline Education Workforce management platform for educators and administrators. $1,140 NA
09/14/17 Berkshire Partners Curriculum Associates LLC K-12 educational assessment and instructional platform. NA NA
09/08/17 Riverside Partners Calero Software Communication lifecycle management software. $100 2.3x
08/30/17 Körber AG HighJump Software, Inc. Supply chain execution and warehouse management software. $750 3.8x
08/24/17 Genstar PDI Enterprise software for the convenience retail and wholesale petroleum markets. NA NA
08/08/17 Intermediate Capital Group proALPHA Business Solutions GmbH ERP software for manufacturing and trading companies. $472 4.5x
07/10/17 Thoma Bravo Lexmark Intl. (Enterprise Software Assets) Portfolio of advanced digital transformation software technologies. $1,500 NA
$945 4.5x
HW&CO. CONFIDENTIAL
PAGE | 7
TECHNOLOGY, MEDIA, & TELECOM
QUARTERLY SOFTWARE SECTOR REVIEW │ 3Q 2017
47 45 46
60
54 53
65
68 70
55
52 51 52 54
48
43
55
NOTABLE SAAS M&A TRANSACTIONS1,5
4.4x
5.3x
5.6x 5.7x
4.4x
3.5x
3.9x
4.4x4.2x
4.6x
4.9x
5.6x5.4x
4.8x4.6x
4.7x4.8x
SAAS – M&A MARKET SUMMARY
SAAS M&A VOLUME1 (GLOBAL)
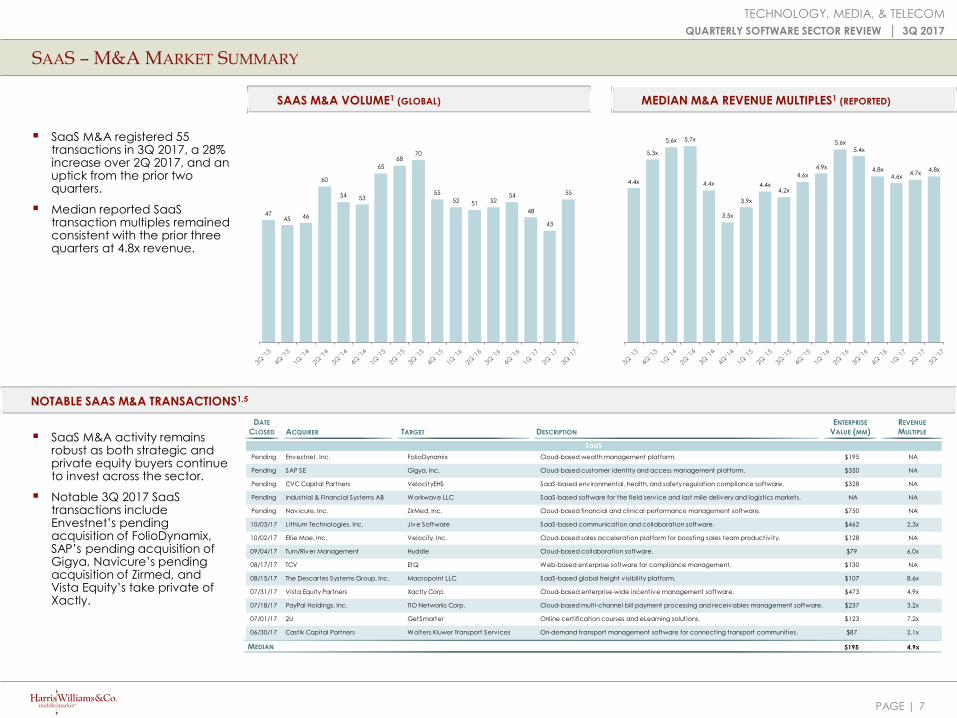
SaaS M&A registered 55transactions in 3Q 2017, a 28%increase over 2Q 2017, and anuptick from the prior twoquarters.
Median reported SaaStransaction multiples remainedconsistent with the prior threequarters at 4.8x revenue.
SaaS M&A activity remainsrobust as both strategic andprivate equity buyers continueto invest across the sector.
Notable 3Q 2017 SaaStransactions includeEnvestnet’s pendingacquisition of FolioDynamix,SAP’s pending acquisition ofGigya, Navicure’s pendingacquisition of Zirmed, andVista Equity’s take private ofXactly.
MEDIAN M&A REVENUE MULTIPLES1 (REPORTED)
DATE
CLOSED ACQUIRER TARGET DESCRIPTION
ENTERPRISE
VALUE (MM)
REVENUE
MULTIPLE
MEDIAN
3Q '1
3
4Q '1
3
1Q '1
4
2Q '1
4
3Q '1
4
4Q '1
4
1Q '1
5
2Q '1
5
3Q '1
5
4Q '1
5
1Q '1
6
2Q '1
6
3Q '1
6
4Q '1
6
1Q '1
7
2Q '1
7
3Q '1
7
3Q '1
3
4Q '1
3
1Q '1
4
2Q '1
4
3Q '1
4
4Q '1
4
1Q '1
5
2Q '1
5
3Q '1
5
4Q '1
5
1Q '1
6
2Q '1
6
3Q '1
6
4Q '1
6
1Q '1
7
2Q '1
7
3Q '1
7
SaaS
Pending Envestnet, Inc. FolioDynamix Cloud-based wealth management platform. $195 NA
Pending SAP SE Gigya, Inc. Cloud-based customer identity and access management platform. $350 NA
Pending CVC Capital Partners VelocityEHS SaaS-based environmental, health, and safety regulation compliance software. $328 NA
Pending Industrial & Financial Systems AB Workwave LLC SaaS-based software for the field serv ice and last mile delivery and logistics markets. NA NA
Pending Navicure, Inc. ZirMed, Inc. Cloud-based financial and clinical performance management software. $750 NA
10/03/17 Lithium Technologies, Inc. Jive Software SaaS-based communication and collaboration software. $462 2.3x
10/02/17 Ellie Mae, Inc. Velocify, Inc. Cloud-based sales acceleration platform for boosting sales team productiv ity. $128 NA
09/04/17 Turn/River Management Huddle Cloud-based collaboration software. $79 6.0x
08/17/17 TCV EtQ Web-based enterprise software for compliance management. $130 NA
08/15/17 The Descartes Systems Group, Inc. Macropoint LLC SaaS-based global freight v isibility platform. $107 8.6x
07/31/17 Vista Equity Partners Xactly Corp. Cloud-based enterprise-wide incentive management software. $473 4.9x
07/18/17 PayPal Holdings, Inc. TIO Networks Corp. Cloud-based multi-channel bill payment processing and receivables management software. $237 3.2x
07/01/17 2U GetSmarter Online certification courses and eLearning solutions. $123 7.2x
06/30/17 Castik Capital Partners Wolters Kluwer Transport Serv ices On-demand transport management software for connecting transport communities. $87 2.1x
$195 4.9x
PAGE | 8
TECHNOLOGY, MEDIA, & TELECOM
QUARTERLY SOFTWARE SECTOR REVIEW │ 3Q 2017
NOTABLE DATA AND ANALYTICS M&A TRANSACTIONS1
74
64 67
72 76
99
89
105
112
102
82
87
97 100
105 106 107
DATA AND ANALYTICS – M&A MARKET SUMMARY
DATA AND ANALYTICS M&A VOLUME1 (GLOBAL)
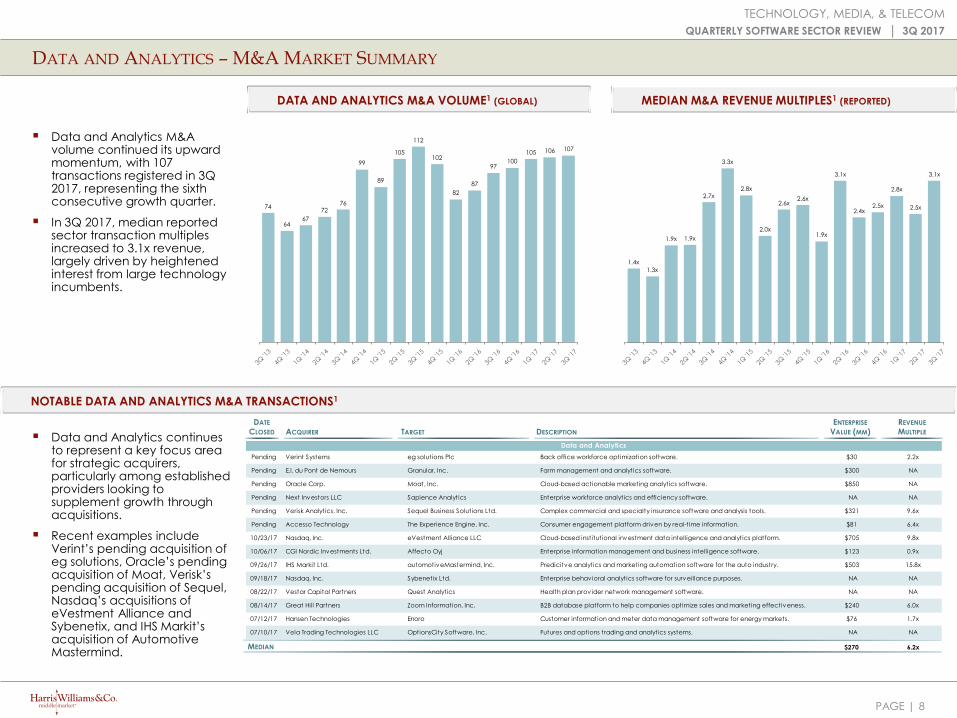
Data and Analytics M&A volume continued its upwardmomentum, with 107transactions registered in 3Q2017, representing the sixthconsecutive growth quarter.
In 3Q 2017, median reportedsector transaction multiples increased to 3.1x revenue, largely driven by heightened interest from large technology incumbents.
Data and Analytics continuesto represent a key focus areafor strategic acquirers,particularly among establishedproviders looking tosupplement growth throughacquisitions.
Recent examples includeVerint’s pending acquisition ofeg solutions, Oracle’s pendingacquisition of Moat, Verisk’spending acquisition of Sequel,Nasdaq’s acquisitions ofeVestment Alliance andSybenetix, and IHS Markit’sacquisition of AutomotiveMastermind.
MEDIAN M&A REVENUE MULTIPLES1 (REPORTED)
1.4x
1.3x
1.9x 1.9x
2.7x
3.3x
2.8x
2.0x
2.6x2.6x
1.9x
3.1x
2.4x2.5x
2.8x
2.5x
3.1x
DATE
CLOSED ACQUIRER TARGET DESCRIPTION
ENTERPRISE
VALUE (MM)
REVENUE
MULTIPLE
MEDIAN
3Q '1
3
4Q '1
3
1Q '1
4
2Q '1
4
3Q '1
4
4Q '1
4
1Q '1
5
2Q '1
5
3Q '1
5
4Q '1
5
1Q '1
6
2Q '1
6
3Q '1
6
4Q '1
6
1Q '1
7
2Q '1
7
3Q '1
7
3Q '1
3
4Q '1
3
1Q '1
4
2Q '1
4
3Q '1
4
4Q '1
4
1Q '1
5
2Q '1
5
3Q '1
5
4Q '1
5
1Q '1
6
2Q '1
6
3Q '1
6
4Q '1
6
1Q '1
7
2Q '1
7
3Q '1
7
Data and Analytics
Pending Verint Systems eg solutions Plc Back office workforce optimization software. $30 2.2x
Pending E.I. du Pont de Nemours Granular, Inc. Farm management and analytics software. $300 NA
Pending Oracle Corp. Moat, Inc. Cloud-based actionable marketing analytics software. $850 NA
Pending Next Investors LLC Sapience Analytics Enterprise workforce analytics and efficiency software. NA NA
Pending Verisk Analytics, Inc. Sequel Business Solutions Ltd. Complex commercial and specialty insurance software and analysis tools. $321 9.6x
Pending Accesso Technology The Experience Engine, Inc. Consumer engagement platform driven by real-time information. $81 6.4x
10/23/17 Nasdaq, Inc. eVestment Alliance LLC Cloud-based institutional investment data intelligence and analytics platform. $705 9.8x
10/06/17 CGI Nordic Investments Ltd. Affecto Oyj Enterprise information management and business intelligence software. $123 0.9x
09/26/17 IHS Markit Ltd. automotiveMastermind, Inc. Predicitve analytics and marketing automation software for the auto industry. $503 15.8x
09/18/17 Nasdaq, Inc. Sybenetix Ltd. Enterprise behavioral analytics software for surveillance purposes. NA NA
08/22/17 Vestar Capital Partners Quest Analytics Health plan provider network management software. NA NA
08/14/17 Great Hill Partners Zoom Information, Inc. B2B database platform to help companies optimize sales and marketing effectiveness. $240 6.0x
07/12/17 Hansen Technologies Enoro Customer information and meter data management software for energy markets. $76 1.7x
07/10/17 Vela Trading Technologies LLC OptionsCity Software, Inc. Futures and options trading and analytics systems. NA NA
$270 6.2x
PAGE | 9
TECHNOLOGY, MEDIA, & TELECOM
QUARTERLY SOFTWARE SECTOR REVIEW │ 3Q 2017
56 55 53
48
56
47 45
50
36
52
44
57 60
75
63 62
77
1.2x
2.4x2.5x
2.9x
2.4x
2.7x
3.0x
3.2x3.3x
2.6x
2.9x
2.6x2.7x
3.1x
2.6x
2.4x
3.0x
NOTABLE INFRASTRUCTURE SOFTWARE M&A TRANSACTIONS1
INFRASTRUCTURE SOFTWARE – M&A MARKET SUMMARY
INFRASTRUCTURE SOFTWARE M&A VOLUME1 (GLOBAL)
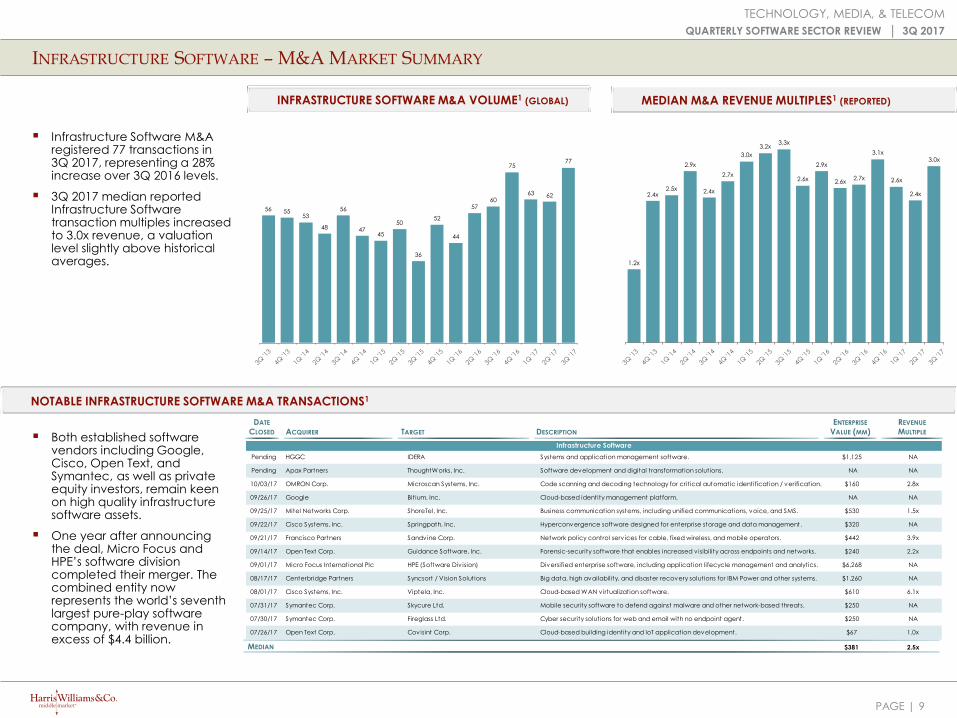
Infrastructure Software M&A registered 77 transactions in3Q 2017, representing a 28%increase over 3Q 2016 levels.
3Q 2017 median reportedInfrastructure Software transaction multiples increased to 3.0x revenue, a valuation level slightly above historical averages.
Both established softwarevendors including Google,Cisco, Open Text, andSymantec, as well as privateequity investors, remain keenon high quality infrastructuresoftware assets.
One year after announcingthe deal, Micro Focus andHPE’s software divisioncompleted their merger. Thecombined entity nowrepresents the world’s seventhlargest pure-play softwarecompany, with revenue inexcess of $4.4 billion.
MEDIAN M&A REVENUE MULTIPLES1 (REPORTED)
DATE
CLOSED ACQUIRER TARGET DESCRIPTION
ENTERPRISE
VALUE (MM)
REVENUE
MULTIPLE
MEDIAN
3Q '1
3
4Q '1
3
1Q '1
4
2Q '1
4
3Q '1
4
4Q '1
4
1Q '1
5
2Q '1
5
3Q '1
5
4Q '1
5
1Q '1
6
2Q '1
6
3Q '1
6
4Q '1
6
1Q '1
7
2Q '1
7
3Q '1
7
3Q '1
3
4Q '1
3
1Q '1
4
2Q '1
4
3Q '1
4
4Q '1
4
1Q '1
5
2Q '1
5
3Q '1
5
4Q '1
5
1Q '1
6
2Q '1
6
3Q '1
6
4Q '1
6
1Q '1
7
2Q '1
7
3Q '1
7
Infrastructure Software
Pending HGGC IDERA Systems and application management software. $1,125 NA
Pending Apax Partners ThoughtWorks, Inc. Software development and digital transformation solutions. NA NA
10/03/17 OMRON Corp. Microscan Systems, Inc. Code scanning and decoding technology for critical automatic identification / verification. $160 2.8x
09/26/17 Google Bitium, Inc. Cloud-based identity management platform. NA NA
09/25/17 Mitel Networks Corp. ShoreTel, Inc. Business communication systems, including unified communications, voice, and SMS. $530 1.5x
09/22/17 Cisco Systems, Inc. Springpath, Inc. Hyperconvergence software designed for enterprise storage and data management. $320 NA
09/21/17 Francisco Partners Sandvine Corp. Network policy control serv ices for cable, fixed wireless, and mobile operators. $442 3.9x
09/14/17 Open Text Corp. Guidance Software, Inc. Forensic-security software that enables increased v isibility across endpoints and networks. $240 2.2x
09/01/17 Micro Focus International Plc HPE (Software Div ision) Diversified enterprise software, including application lifecycle management and analytics. $6,268 NA
08/17/17 Centerbridge Partners Syncsort / Vision Solutions Big data, high availability, and disaster recovery solutions for IBM Power and other systems. $1,260 NA
08/01/17 Cisco Systems, Inc. Viptela, Inc. Cloud-based WAN v irtualization software. $610 6.1x
07/31/17 Symantec Corp. Skycure Ltd. Mobile security software to defend against malware and other network-based threats. $250 NA
07/30/17 Symantec Corp. Fireglass Ltd. Cyber security solutions for web and email with no endpoint agent. $250 NA
07/26/17 Open Text Corp. Covisint Corp. Cloud-based building identity and IoT application development. $67 1.0x
$381 2.5x
PAGE | 10
TECHNOLOGY, MEDIA, & TELECOM
QUARTERLY SOFTWARE SECTOR REVIEW │ 3Q 2017
PRIVATE PLACEMENT CAPITAL RAISED BY ROUND1,4 (AS PERCENTAGE OF TOTAL REPORTED PRIVATE PLACEMENT CAPITAL)
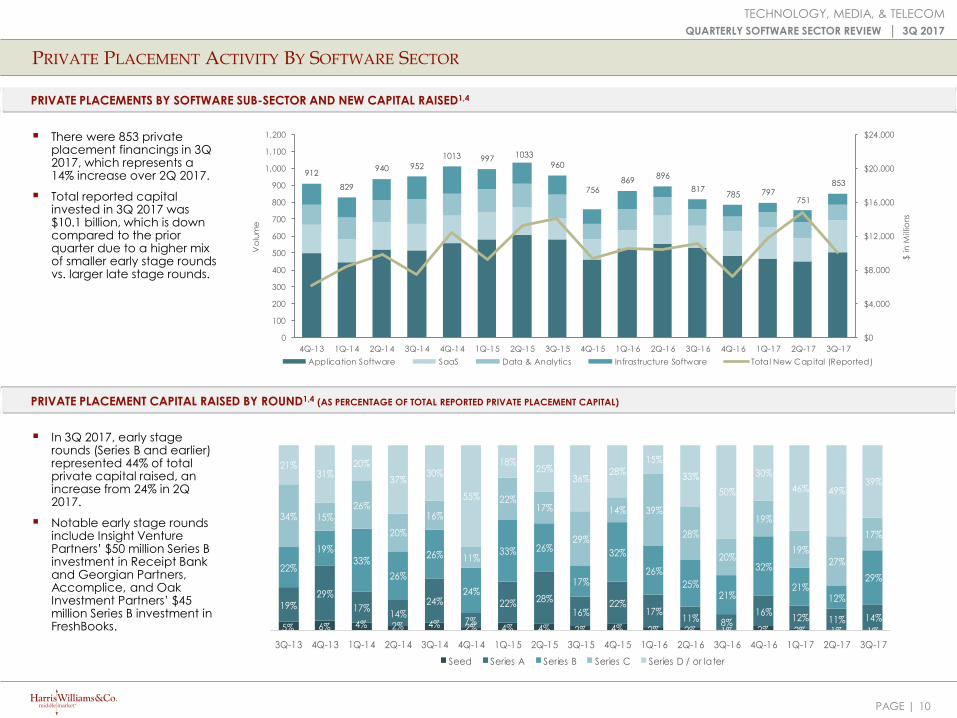
There were 853 privateplacement financings in 3Q2017, which represents a14% increase over 2Q 2017.
Total reported capitalinvested in 3Q 2017 was$10.1 billion, which is downcompared to the priorquarter due to a higher mixof smaller early stage roundsvs. larger late stage rounds.
PRIVATE PLACEMENT ACTIVITY BY SOFTWARE SECTOR
In 3Q 2017, early stagerounds (Series B and earlier)represented 44% of totalprivate capital raised, anincrease from 24% in 2Q2017.
Notable early stage roundsinclude Insight VenturePartners’ $50 million Series Binvestment in Receipt Bankand Georgian Partners,Accomplice, and OakInvestment Partners’ $45million Series B investment inFreshBooks.
PRIVATE PLACEMENTS BY SOFTWARE SUB-SECTOR AND NEW CAPITAL RAISED1,4
912
829
940 952
1013 997 1033
960
756869
896
817785 797
751
853
$0
$4,000
$8,000
$12,000
$16,000
$20,000
$24,000
0
100
200
300
400
500
600
700
800
900
1,000
1,100
1,200
4Q-13 1Q-14 2Q-14 3Q-14 4Q-14 1Q-15 2Q-15 3Q-15 4Q-15 1Q-16 2Q-16 3Q-16 4Q-16 1Q-17 2Q-17 3Q-17
$ in
Mill
ion
s
Vo
lum
e
Application Software SaaS Data & Analytics Infrastructure Software Total New Capital (Reported)
5% 6% 4% 2% 4% 2% 4% 4% 2% 4% 2% 2% 1% 2% 2% 1% 1%
19% 29%
17% 14%
24%
7%
22% 28%
16% 22%
17% 11% 8%
16% 12% 11% 14%
22%
19%
33%
26%
26%
24%
33% 26%
17%
32%
26%
25% 21%
32%
21% 12%
29%
34% 15% 26%
20%
16%
11%
22% 17%
29%
14% 39%
28%
20%
19%
19%
27%
17%
21% 31%
20%
37% 30%
55%
18% 25%
36% 28%
15%
33%
50%
30%
46% 49% 39%
3Q-13 4Q-13 1Q-14 2Q-14 3Q-14 4Q-14 1Q-15 2Q-15 3Q-15 4Q-15 1Q-16 2Q-16 3Q-16 4Q-16 1Q-17 2Q-17 3Q-17
Seed Series A Series B Series C Series D / or later

PAGE | 11
TECHNOLOGY, MEDIA, & TELECOM
QUARTERLY SOFTWARE SECTOR REVIEW │ 3Q 2017
SELECT RECENT SOFTWARE PRIVATE PLACEMENTS1,4
Note: Financial information presented above represents reported capital raised only.
ROUND INVESTORS (CURRENT ROUND) DESCRIPTIONCOMPANYDATEROUND
SIZE ($MM)
SECTORTOTAL RAISED ($MM)
09/27/17 SaaS Growth $45 $158 Sumeru Equity; Bpifrance; Daher Capital; HSBC Innov ation
Inv estments; Iris Capital
Prov ider of cloud treasury and financial management
software.
09/21/17 SaaS C $110 $202 DST GlobalProv ider of freight forwarding and supply chain v isibility
software.
09/20/17 Infrastructure A $29 NA Volition Capital; Eight Road Ventures Prov ider of security analytics software.
09/18/17 SaaS G $250 $790 SoftBank Group; AccelProv ider of team communication and collaboration
software.
09/15/17 SaaS Growth $50 NA Susquehanna Growth EquityProv ider of cloud-based financial supply chain
management software.
09/13/17 SaaS E $55 $329 Premji Inv est; ICONIQ; K1 Capital; Salesforce VenturesProv ider of cloud-based quote-to-cash automation
software solutions.
09/06/17 SaaS Growth $59 NA Silv ersmith CapitalProv ider of cloud-based learning and performance
management software.
08/22/17Data &
Analytics D $140 $247
Andreessen Horowitz; A.Capital Ventures; Battery Ventures;
Geodesic Capital; Green Bay Ventures; New Enterprise
Associates; The Future Fund
Prov ider of a unified analytics platform designed to
simplify big data.
08/15/17Data &
AnalyticsGrowth NA NA Silv er Lake; TriWest Capital Partners; HarbourVest Partners
Prov ider of well data software solutions to the oil and
gas industry.
07/26/17 SaaS B $50 $60 Insight Venture PartnersProv ider of SaaS solutions for accountants and
bookkeepers.
07/18/17 SaaS B $45 $75 Georgian Partners; Accomplice; Oak Inv estment PartnersProv ider of an accounting software platform for small
businesses.
07/12/17 SaaS C $42 $79 New Enterprise Associates; Canv as Ventures; Lerer Hippeau
Ventures
Prov ider of logistics intelligence software and a
truckload marketplace platform.
PAGE | 12
TECHNOLOGY, MEDIA, & TELECOM
QUARTERLY SOFTWARE SECTOR REVIEW │ 3Q 2017
PUBLIC SOFTWARE VALUATION MULTIPLES BY SECTOR1
EBITDA MULTIPLE COMPARISON 3Q 2016 VS. 3Q 2017
7.4x 7.5x 7.6x
4.4x
5.3x 5.1x 5.3x
4.1x4.7x 4.6x 4.6x 4.8x
4.2x
3.8x3.8x 3.5x
1.2x
9.0x 8.8x
6.7x6.3x 6.1x 6.1x
5.4x5.4x 5.4x 5.3x 5.2x 5.1x
4.2x 4.2x
3.5x 3.4x
1.6x
3Q 2016 3Q 2017
61.6x
56.6x
45.6x
57.4x
15.9x
19.4x
35.1x
17.3x17.8x
14.5x
21.0x
15.6x17.8x
14.0x
21.9x
30.4x
12.1x
34.1x
54.2x56.4x
47.0x
17.1x
23.9x
35.4x
18.2x
15.7x16.2x
18.6x 17.1x22.2x
13.4x
17.2x
22.4x
14.6x
3Q 2016 3Q 2017
REVENUE MULTIPLE COMPARISON 3Q 2016 VS. 3Q 2017STOCK PERFORMANCE (1- & 3-YEAR)
2.7%
30.4%
6.7%
31.0%
29.6%
32.6%
31.1%
12.2%
23.2%
21.1%
13.8%
22.0%
15.7%
19.0%
8.2%
16.2%
36.6%
29.5%
78.0%
39.0%
45.0%
86.8%
63.3%
47.6%
7.3%
113.9%
58.1%
46.2%
57.0%
17.9%
49.8%
2.9%
20.9%
69.9%
1 Yr Index Change 3 Yr Index Change
SCM & Logistics
Large-Cap SaaS
HCM
Marketing
Financial
PLM & Engineering
Small-Cap SaaS
Data & Analytics
EdTech / Non-Profit
Bellwethers
IT Security
Enterprise
HCIT
IT Operations Mgmt.
Communication
Data Storage
Energy
PAGE | 13
TECHNOLOGY, MEDIA, & TELECOM
QUARTERLY SOFTWARE SECTOR REVIEW │ 3Q 2017
`
KEY METRICS BY SECTOR – COMPARABLE PUBLIC SOFTWARE COMPANIES1
9.0x
8.8x
6.7x
6.3x
6.1x
6.1x
5.4x
5.4x
5.4x
5.3x
5.2x
5.1x
4.2x
4.2x
3.5x
3.4x
1.6x
SCM & Logistics
Large-Cap SaaS
HCM
Marketing
Financial
PLM & Engineering
Small-Cap SaaS
Data & Analytics
EdTech / Non-Profit
Bellwethers
IT Security
Enterprise
HCIT
IT Operat ions Mgmt.
Communication
Data Storage
Energy
EV / LTM REVENUE MULTIPLE NTM REVENUE GROWTH LTM EBITDA MARGINNTM EBITDA GROWTH NTM REVENUE GROWTH LTM EBITDA MARGINNTM EBITDA GROWTH
COMPARABLE COMPANY SET MEDIANS CORRELATION WITH EV / REVENUE MULTIPLE
18% 64% 23% 75% 68% 28%
27% 104% 16% 44% - 27%
23% 92% 20% 82% 21% -
23% 173% 9% 73% - 81%
11% 16% 35% 62% - 73%
13% 30% 26% 46% - 70%
26% 111% 11% 47% - -
12% 48% 16% 78% 36% 54%
15% 30% 25% 79% 47% 35%
5% 27% 31% 85% 47% 25%
20% 65% 19% 22% - 66%
16% 24% 31% 68% 67% 48%
22% 56% 16% 8% 53% 30%
12% 48% 29% 33% 52% -
20% 145% 17% - - 32%
15% 115% 10% 26% 15% 34%
9% 9% 12% - - 100%
PAGE | 14
TECHNOLOGY, MEDIA, & TELECOM
QUARTERLY SOFTWARE SECTOR REVIEW │ 3Q 2017
SUMMARY OF TECHNOLOGY IPOS
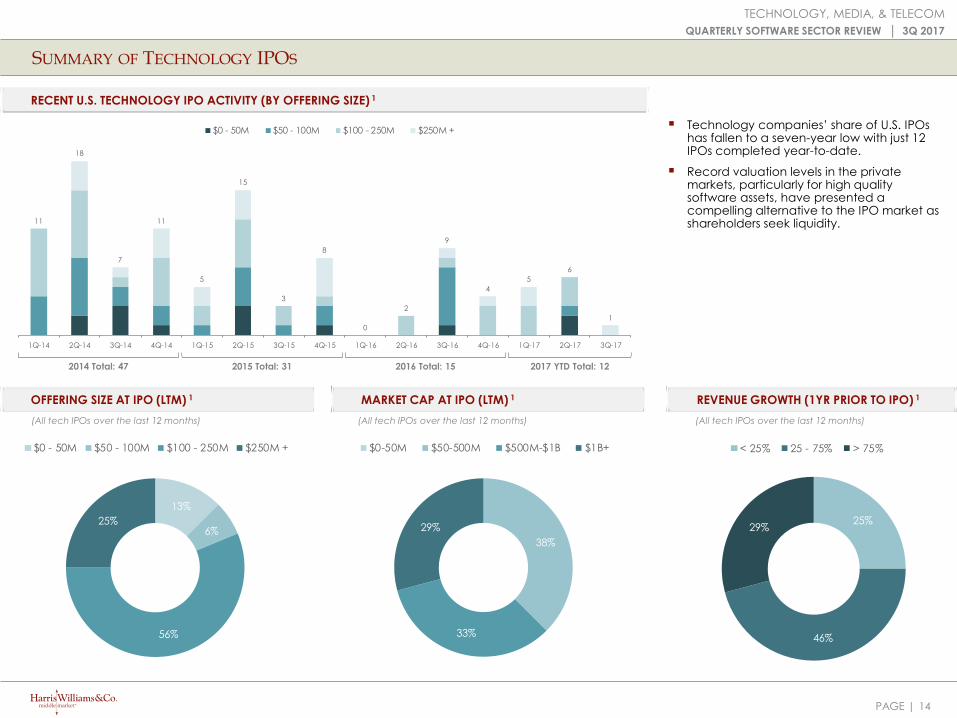
Technology companies’ share of U.S. IPOshas fallen to a seven-year low with just 12IPOs completed year-to-date.
Record valuation levels in the privatemarkets, particularly for high qualitysoftware assets, have presented acompelling alternative to the IPO market asshareholders seek liquidity.
MARKET CAP AT IPO (LTM) 1 REVENUE GROWTH (1YR PRIOR TO IPO) 1OFFERING SIZE AT IPO (LTM) 1
RECENT U.S. TECHNOLOGY IPO ACTIVITY (BY OFFERING SIZE) 1
25%
46%
29%
< 25% 25 - 75% > 75%
38%
33%
29%
$0-50M $50-500M $500M-$1B $1B+
13%
6%
56%
25%
$0 - 50M $50 - 100M $100 - 250M $250M +
(All tech IPOs over the last 12 months) (All tech IPOs over the last 12 months) (All tech IPOs over the last 12 months)
11
18
7
11
5
15
3
8
0
2
9
4
5
6
1
1Q-14 2Q-14 3Q-14 4Q-14 1Q-15 2Q-15 3Q-15 4Q-15 1Q-16 2Q-16 3Q-16 4Q-16 1Q-17 2Q-17 3Q-17
$0 - 50M $50 - 100M $100 - 250M $250M +
2014 Total: 47 2016 Total: 152015 Total: 31 2017 YTD Total: 12
PAGE | 15
TECHNOLOGY, MEDIA, & TELECOM
QUARTERLY SOFTWARE SECTOR REVIEW │ 3Q 2017
(150.0%)
(125.0%)
(100.0%)
(75.0%)
(50.0%)
(25.0%)
0.0%
25.0%
50.0%
75.0%
100.0%
125.0%
150.0%
Circle Size Denotes Revenue ($)
% R
eve
nu
e G
row
thSto
ck
Pe
rfo
rma
nc
e (
Offe
r to
Cu
rre
nt)
KEY PERFORMANCE METRICS FOR RECENT SOFTWARE IPOS1
IPO DATE
OFFER PRICE
OFFERING SIZE ($M)
OFFER TO CURRENT
127.4% 120.2%
15.4%
39.9%
73.1%
100.7%
(1.4%)
1.1%
18.5%
45.5%
65.9%
10.8%
137.2%
22.3%
9.5%
43.2% 33.4% 20.5%
84.3% 115.3%
49.3%
85.7%
17.7% 70.3%
59.4%
86.6%
57.2%
9.1% 31.5%
2.9%
(150.0%)
(50.0%)
50.0%
150.0%
250.0%
7/28/16 9/15/16 9/22/16 9/29/16 10/5/16 10/27/16 12/15/16 3/9/17 3/16/17 3/24/17 4/6/17 4/27/17 5/25/17 6/7/17 10/5/17
$18.0 $12.0 $16.0 $16.0 $18.0 $17.0 $11.0 $14.0 $17.0 $14.0 $17.0 $15.0 $12.0 $11.0 $17.0
$503.5 $323.1 $596.6 $1,958.5 $866.0 $838.6 $330.3 $1,240.6 $2,141.9 $662.5 $1,542.9 $1,921.0 $704.3 $100.2 $2,951.6
$94.5 $90.0 $96.0 $237.9 $133.2 $146.2 $287.2 $233.3 $221.0 $126.0 $187.0 $225.0 $75.0 $30.8 $531.3
127.4% 120.2% 15.4% 39.9% 73.1% 100.7% (1.4%) 1.1% 18.5% 45.5% 65.9% 10.8% 137.2% 22.3% 9.5%
MARKET CAP AT OFFER ($M)
PAGE | 16
TECHNOLOGY, MEDIA, & TELECOM
QUARTERLY SOFTWARE SECTOR REVIEW │ 3Q 2017
13.9%
5.4%
9.0%
9.2%
13.1%
19.0%
30.4%
Other
Restaurants
Services & Leasing
Home Furnishings
Retail
Technology
Healthcare
54% 50%
57% 55% 54%
60% 58%
56%
50%
55%
2008 2009 2010 2011 2012 2013 2014 2015 2016 3Q'17
4.0x
3.4x
3.8x 3.8x
4.3x
4.7x 4.7x
5.6x
4.5x
3.3x
4.2x 4.3x4.5x
4.8x
5.3x 5.3x 5.3x5.5x
2000 2001 2002 2003 2004 2005 2006 2007 2008 2009 2010 2011 2012 2013 2014 2015 2016 3Q'17
FLD/EBITDA SLD/EBITDA Other Sr Debt/EBITDA Sub Debt/EBITDA
LBO LOAN VOLUME BY INDUSTRY2,3 MEDIAN LBO DEBT PERCENTAGES4
DEBT MARKET OVERVIEW
MIDDLE MARKET LBO LOAN MULTIPLES2,3 MIDDLE MARKET LBO VOLUME BY QUARTER2,3
2017 YTD New Issue LBO Loans Percentage of Total Purchase Price
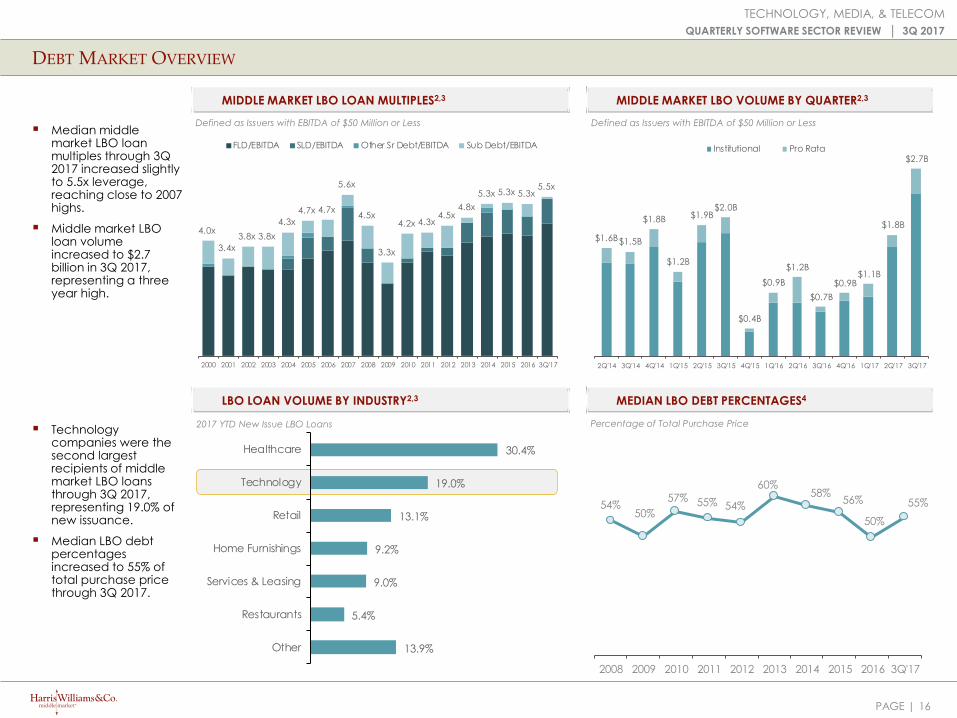
Median middlemarket LBO loanmultiples through 3Q2017 increased slightlyto 5.5x leverage,reaching close to 2007highs.
Middle market LBOloan volumeincreased to $2.7billion in 3Q 2017,representing a threeyear high.
Technologycompanies were the second largest recipients of middle market LBO loans through 3Q 2017, representing 19.0% of new issuance.
Median LBO debtpercentagesincreased to 55% oftotal purchase pricethrough 3Q 2017.
Defined as Issuers with EBITDA of $50 Million or LessDefined as Issuers with EBITDA of $50 Million or Less
$1.6B$1.5B
$1.8B
$1.2B
$1.9B$2.0B
$0.4B
$0.9B
$1.2B
$0.7B
$0.9B$1.1B
$1.8B
$2.7B
2Q'14 3Q'14 4Q'14 1Q'15 2Q'15 3Q'15 4Q'15 1Q'16 2Q'16 3Q'16 4Q'16 1Q'17 2Q'17 3Q'17
Institutional Pro Rata
PAGE | 17
TECHNOLOGY, MEDIA, & TELECOM
QUARTERLY SOFTWARE SECTOR REVIEW │ 3Q 2017
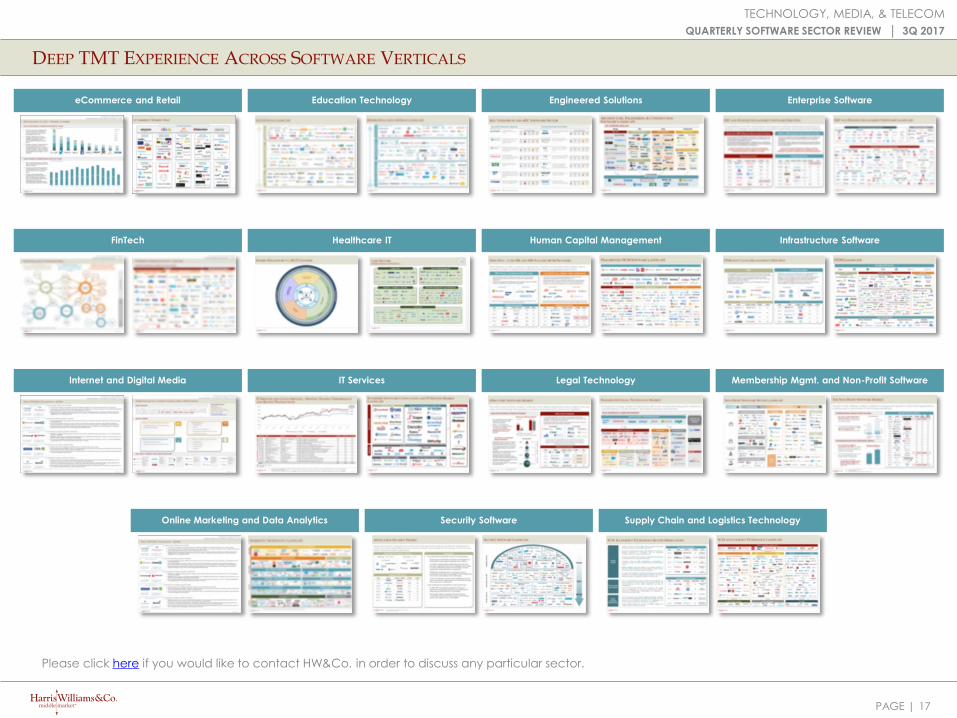
DEEP TMT EXPERIENCE ACROSS SOFTWARE VERTICALS
Education TechnologyeCommerce and Retail Engineered Solutions
FinTech
Enterprise Software
Healthcare IT Human Capital Management Infrastructure Software
Internet and Digital Media Legal TechnologyIT Services
Please click here if you would like to contact HW&Co. in order to discuss any particular sector.
Supply Chain and Logistics TechnologySecurity SoftwareOnline Marketing and Data Analytics
Membership Mgmt. and Non-Profit Software
PAGE | 18
TECHNOLOGY, MEDIA, & TELECOM
QUARTERLY SOFTWARE SECTOR REVIEW │ 3Q 2017
SELECT HW&CO. TMT TRANSACTIONS
strategic investment
fromacquired by acquired by acquired by acquired byacquired byacquired by acquired by
acquired by
and
acquired by acquired by
acquired by
and
acquired by
acquired by acquired by
acquired acquired by acquired by acquired by acquired by recapitalized by acquired by acquired byacquired by acquired byacquired by
B2C
acquired byacquired by
strategic investment
fromacquired by
acquired byacquired by acquired bymajority investment
fromacquired bymerged with
acquired a majority
stake inacquired byacquired by investment from recapitalized by
minority investment
fromacquired by
acquired byacquired
acquired by acquired byacquired byacquired byacquired by majority
recapitalization by
recapitalized by acquired bysignificant equity
investment fromacquired byacquired byacquired by
acquired by
and
acquired by acquired by
merged withsignificant equity
investment fromacquired by acquired by acquired by acquired by acquired byacquired by acquired byacquired by
growth equity
investment fromacquired by
a portfolio company of
recapitalized
by management
acquired byrecapitalized by
acquired byacquired by
acquired by acquired by acquired by acquired byacquired by acquired byacquired byacquired by acquired by
GFI Energy Group
a division of
acquired byminority investment
from
significant equity
investment from
minority investment
from
majority investment
from
majority investment
fromacquired byacquired by
growth Investment
from
majority investment
fromacquiredacquired by acquired byacquired byinvestment from acquired by
Undisclosed
Buyer
acquired by
Undisclosed
Strategic Buyer
acquired byacquired
PAGE | 19
TECHNOLOGY, MEDIA, & TELECOM
QUARTERLY SOFTWARE SECTOR REVIEW │ 3Q 2017
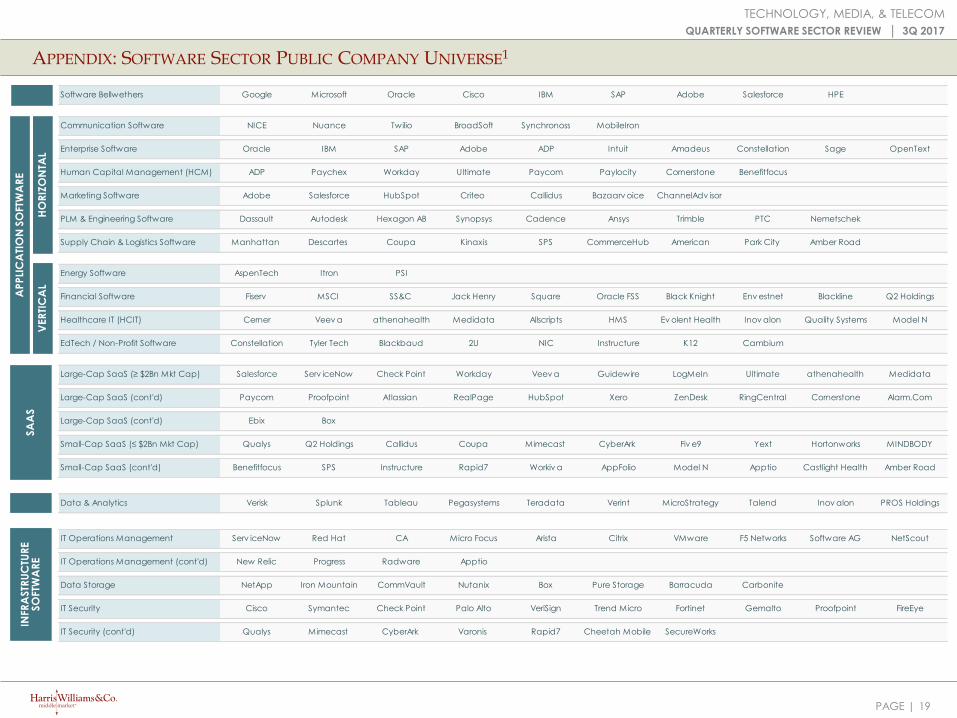
APPENDIX: SOFTWARE SECTOR PUBLIC COMPANY UNIVERSE1
SA
AS
HO
RIZ
ON
TAL
INFR
ASTR
UC
TUR
E
SO
FTW
AR
EV
ER
TIC
AL
AP
PLI
CA
TIO
N S
OFT
WA
RE
Software Bellwethers Google Microsoft Oracle Cisco IBM SAP Adobe Salesforce HPE
Communication Software NICE Nuance Twilio BroadSoft Synchronoss MobileIron
Enterprise Software Oracle IBM SAP Adobe ADP Intuit Amadeus Constellation Sage OpenText
Human Capital Management (HCM) ADP Paychex Workday Ultimate Paycom Paylocity Cornerstone Benefitfocus
Marketing Software Adobe Salesforce HubSpot Criteo Callidus Bazaarv oice ChannelAdv isor
PLM & Engineering Software Dassault Autodesk Hexagon AB Synopsys Cadence Ansys Trimble PTC Nemetschek
Supply Chain & Logistics Software Manhattan Descartes Coupa Kinaxis SPS CommerceHub American Park City Amber Road
Energy Software AspenTech Itron PSI
Financial Software Fiserv MSCI SS&C Jack Henry Square Oracle FSS Black Knight Env estnet Blackline Q2 Holdings
Healthcare IT (HCIT) Cerner Veev a athenahealth Medidata Allscripts HMS Ev olent Health Inov alon Quality Systems Model N
EdTech / Non-Profit Software Constellation Tyler Tech Blackbaud 2U NIC Instructure K12 Cambium
Large-Cap SaaS (≥ $2Bn Mkt Cap) Salesforce Serv iceNow Check Point Workday Veev a Guidewire LogMeIn Ultimate athenahealth Medidata
Large-Cap SaaS (cont'd) Paycom Proofpoint Atlassian RealPage HubSpot Xero ZenDesk RingCentral Cornerstone Alarm.Com
Large-Cap SaaS (cont'd) Ebix Box
Small-Cap SaaS (≤ $2Bn Mkt Cap) Qualys Q2 Holdings Callidus Coupa Mimecast CyberArk Fiv e9 Yext Hortonworks MINDBODY
Small-Cap SaaS (cont'd) Benefitfocus SPS Instructure Rapid7 Workiv a AppFolio Model N Apptio Castlight Health Amber Road
Data & Analytics Verisk Splunk Tableau Pegasystems Teradata Verint MicroStrategy Talend Inov alon PROS Holdings
IT Operations Management Serv iceNow Red Hat CA Micro Focus Arista Citrix VMware F5 Networks Software AG NetScout
IT Operations Management (cont'd) New Relic Progress Radware Apptio
Data Storage NetApp Iron Mountain CommVault Nutanix Box Pure Storage Barracuda Carbonite
IT Security Cisco Symantec Check Point Palo Alto VeriSign Trend Micro Fortinet Gemalto Proofpoint FireEye
IT Security (cont'd) Qualys Mimecast CyberArk Varonis Rapid7 Cheetah Mobile SecureWorks
PAGE | 20
TECHNOLOGY, MEDIA, & TELECOM
QUARTERLY SOFTWARE SECTOR REVIEW │ 3Q 2017
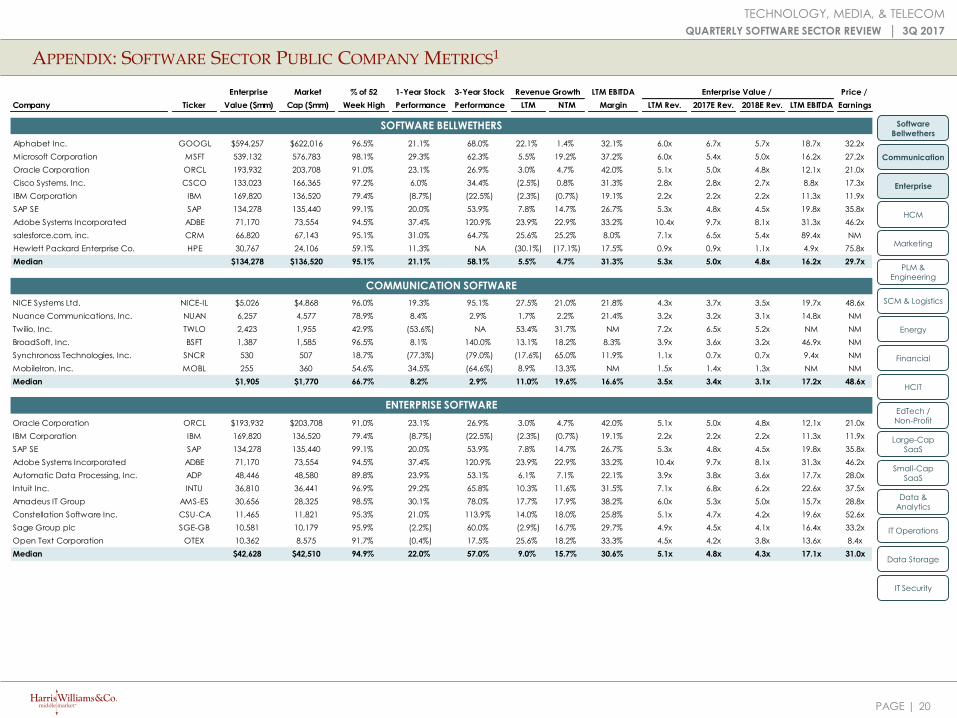
APPENDIX: SOFTWARE SECTOR PUBLIC COMPANY METRICS1
Enterprise Market % of 52 1-Year Stock 3-Year Stock Revenue Growth LTM EBITDA Enterprise Value / Price /
Company Ticker Value ($mm) Cap ($mm) Week High Performance Performance LTM NTM Margin LTM Rev. 2017E Rev. 2018E Rev. LTM EBITDA Earnings
SOFTWARE BELLWETHERS
Alphabet Inc. GOOGL $594,257 $622,016 96.5% 21.1% 68.0% 22.1% 1.4% 32.1% 6.0x 6.7x 5.7x 18.7x 32.2x
Microsoft Corporation MSFT 539,132 576,783 98.1% 29.3% 62.3% 5.5% 19.2% 37.2% 6.0x 5.4x 5.0x 16.2x 27.2x
Oracle Corporation ORCL 193,932 203,708 91.0% 23.1% 26.9% 3.0% 4.7% 42.0% 5.1x 5.0x 4.8x 12.1x 21.0x
Cisco Systems, Inc. CSCO 133,023 166,365 97.2% 6.0% 34.4% (2.5%) 0.8% 31.3% 2.8x 2.8x 2.7x 8.8x 17.3x
IBM Corporation IBM 169,820 136,520 79.4% (8.7%) (22.5%) (2.3%) (0.7%) 19.1% 2.2x 2.2x 2.2x 11.3x 11.9x
SAP SE SAP 134,278 135,440 99.1% 20.0% 53.9% 7.8% 14.7% 26.7% 5.3x 4.8x 4.5x 19.8x 35.8x
Adobe Systems Incorporated ADBE 71,170 73,554 94.5% 37.4% 120.9% 23.9% 22.9% 33.2% 10.4x 9.7x 8.1x 31.3x 46.2x
salesforce.com, inc. CRM 66,820 67,143 95.1% 31.0% 64.7% 25.6% 25.2% 8.0% 7.1x 6.5x 5.4x 89.4x NM
Hewlett Packard Enterprise Co. HPE 30,767 24,106 59.1% 11.3% NA (30.1%) (17.1%) 17.5% 0.9x 0.9x 1.1x 4.9x 75.8x
Median $134,278 $136,520 95.1% 21.1% 58.1% 5.5% 4.7% 31.3% 5.3x 5.0x 4.8x 16.2x 29.7x
COMMUNICATION SOFTWARE
NICE Systems Ltd. NICE-IL $5,026 $4,868 96.0% 19.3% 95.1% 27.5% 21.0% 21.8% 4.3x 3.7x 3.5x 19.7x 48.6x
Nuance Communications, Inc. NUAN 6,257 4,577 78.9% 8.4% 2.9% 1.7% 2.2% 21.4% 3.2x 3.2x 3.1x 14.8x NM
Twilio, Inc. TWLO 2,423 1,955 42.9% (53.6%) NA 53.4% 31.7% NM 7.2x 6.5x 5.2x NM NM
BroadSoft, Inc. BSFT 1,387 1,585 96.5% 8.1% 140.0% 13.1% 18.2% 8.3% 3.9x 3.6x 3.2x 46.9x NM
Synchronoss Technologies, Inc. SNCR 530 507 18.7% (77.3%) (79.0%) (17.6%) 65.0% 11.9% 1.1x 0.7x 0.7x 9.4x NM
MobileIron, Inc. MOBL 255 360 54.6% 34.5% (64.6%) 8.9% 13.3% NM 1.5x 1.4x 1.3x NM NM
Median $1,905 $1,770 66.7% 8.2% 2.9% 11.0% 19.6% 16.6% 3.5x 3.4x 3.1x 17.2x 48.6x
ENTERPRISE SOFTWARE
Oracle Corporation ORCL $193,932 $203,708 91.0% 23.1% 26.9% 3.0% 4.7% 42.0% 5.1x 5.0x 4.8x 12.1x 21.0x
IBM Corporation IBM 169,820 136,520 79.4% (8.7%) (22.5%) (2.3%) (0.7%) 19.1% 2.2x 2.2x 2.2x 11.3x 11.9x
SAP SE SAP 134,278 135,440 99.1% 20.0% 53.9% 7.8% 14.7% 26.7% 5.3x 4.8x 4.5x 19.8x 35.8x
Adobe Systems Incorporated ADBE 71,170 73,554 94.5% 37.4% 120.9% 23.9% 22.9% 33.2% 10.4x 9.7x 8.1x 31.3x 46.2x
Automatic Data Processing, Inc. ADP 48,446 48,580 89.8% 23.9% 53.1% 6.1% 7.1% 22.1% 3.9x 3.8x 3.6x 17.7x 28.0x
Intuit Inc. INTU 36,810 36,441 96.9% 29.2% 65.8% 10.3% 11.6% 31.5% 7.1x 6.8x 6.2x 22.6x 37.5x
Amadeus IT Group AMS-ES 30,656 28,325 98.5% 30.1% 78.0% 17.7% 17.9% 38.2% 6.0x 5.3x 5.0x 15.7x 28.8x
Constellation Software Inc. CSU-CA 11,465 11,821 95.3% 21.0% 113.9% 14.0% 18.0% 25.8% 5.1x 4.7x 4.2x 19.6x 52.6x
Sage Group plc SGE-GB 10,581 10,179 95.9% (2.2%) 60.0% (2.9%) 16.7% 29.7% 4.9x 4.5x 4.1x 16.4x 33.2x
Open Text Corporation OTEX 10,362 8,575 91.7% (0.4%) 17.5% 25.6% 18.2% 33.3% 4.5x 4.2x 3.8x 13.6x 8.4x
Median $42,628 $42,510 94.9% 22.0% 57.0% 9.0% 15.7% 30.6% 5.1x 4.8x 4.3x 17.1x 31.0x
Large-Cap
SaaS
Small-Cap
SaaS
Data &
Analytics
IT Operations
Data Storage
IT Security
Software
Bellwethers
Communication
Enterprise
HCM
Marketing
PLM &
Engineering
SCM & Logistics
Energy
Financial
HCIT
EdTech /
Non-Profit
PAGE | 21
TECHNOLOGY, MEDIA, & TELECOM
QUARTERLY SOFTWARE SECTOR REVIEW │ 3Q 2017
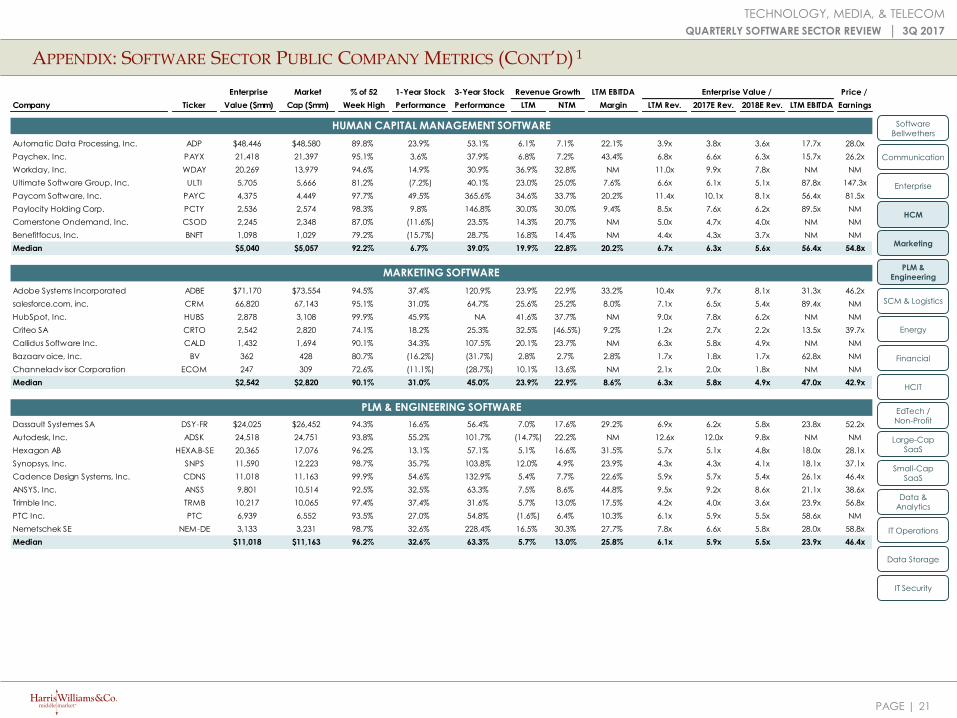
APPENDIX: SOFTWARE SECTOR PUBLIC COMPANY METRICS (CONT’D) 1
HUMAN CAPITAL MANAGEMENT SOFTWARE
Automatic Data Processing, Inc. ADP $48,446 $48,580 89.8% 23.9% 53.1% 6.1% 7.1% 22.1% 3.9x 3.8x 3.6x 17.7x 28.0x
Paychex, Inc. PAYX 21,418 21,397 95.1% 3.6% 37.9% 6.8% 7.2% 43.4% 6.8x 6.6x 6.3x 15.7x 26.2x
Workday, Inc. WDAY 20,269 13,979 94.6% 14.9% 30.9% 36.9% 32.8% NM 11.0x 9.9x 7.8x NM NM
Ultimate Software Group, Inc. ULTI 5,705 5,666 81.2% (7.2%) 40.1% 23.0% 25.0% 7.6% 6.6x 6.1x 5.1x 87.8x 147.3x
Paycom Software, Inc. PAYC 4,375 4,449 97.7% 49.5% 365.6% 34.6% 33.7% 20.2% 11.4x 10.1x 8.1x 56.4x 81.5x
Paylocity Holding Corp. PCTY 2,536 2,574 98.3% 9.8% 146.8% 30.0% 30.0% 9.4% 8.5x 7.6x 6.2x 89.5x NM
Cornerstone Ondemand, Inc. CSOD 2,245 2,348 87.0% (11.6%) 23.5% 14.3% 20.7% NM 5.0x 4.7x 4.0x NM NM
Benefitfocus, Inc. BNFT 1,098 1,029 79.2% (15.7%) 28.7% 16.8% 14.4% NM 4.4x 4.3x 3.7x NM NM
Median $5,040 $5,057 92.2% 6.7% 39.0% 19.9% 22.8% 20.2% 6.7x 6.3x 5.6x 56.4x 54.8x
MARKETING SOFTWARE
Adobe Systems Incorporated ADBE $71,170 $73,554 94.5% 37.4% 120.9% 23.9% 22.9% 33.2% 10.4x 9.7x 8.1x 31.3x 46.2x
salesforce.com, inc. CRM 66,820 67,143 95.1% 31.0% 64.7% 25.6% 25.2% 8.0% 7.1x 6.5x 5.4x 89.4x NM
HubSpot, Inc. HUBS 2,878 3,108 99.9% 45.9% NA 41.6% 37.7% NM 9.0x 7.8x 6.2x NM NM
Criteo SA CRTO 2,542 2,820 74.1% 18.2% 25.3% 32.5% (46.5%) 9.2% 1.2x 2.7x 2.2x 13.5x 39.7x
Callidus Software Inc. CALD 1,432 1,694 90.1% 34.3% 107.5% 20.1% 23.7% NM 6.3x 5.8x 4.9x NM NM
Bazaarv oice, Inc. BV 362 428 80.7% (16.2%) (31.7%) 2.8% 2.7% 2.8% 1.7x 1.8x 1.7x 62.8x NM
Channeladv isor Corporation ECOM 247 309 72.6% (11.1%) (28.7%) 10.1% 13.6% NM 2.1x 2.0x 1.8x NM NM
Median $2,542 $2,820 90.1% 31.0% 45.0% 23.9% 22.9% 8.6% 6.3x 5.8x 4.9x 47.0x 42.9x
PLM & ENGINEERING SOFTWARE
Dassault Systemes SA DSY-FR $24,025 $26,452 94.3% 16.6% 56.4% 7.0% 17.6% 29.2% 6.9x 6.2x 5.8x 23.8x 52.2x
Autodesk, Inc. ADSK 24,518 24,751 93.8% 55.2% 101.7% (14.7%) 22.2% NM 12.6x 12.0x 9.8x NM NM
Hexagon AB HEXA.B-SE 20,365 17,076 96.2% 13.1% 57.1% 5.1% 16.6% 31.5% 5.7x 5.1x 4.8x 18.0x 28.1x
Synopsys, Inc. SNPS 11,590 12,223 98.7% 35.7% 103.8% 12.0% 4.9% 23.9% 4.3x 4.3x 4.1x 18.1x 37.1x
Cadence Design Systems, Inc. CDNS 11,018 11,163 99.9% 54.6% 132.9% 5.4% 7.7% 22.6% 5.9x 5.7x 5.4x 26.1x 46.4x
ANSYS, Inc. ANSS 9,801 10,514 92.5% 32.5% 63.3% 7.5% 8.6% 44.8% 9.5x 9.2x 8.6x 21.1x 38.6x
Trimble Inc. TRMB 10,217 10,065 97.4% 37.4% 31.6% 5.7% 13.0% 17.5% 4.2x 4.0x 3.6x 23.9x 56.8x
PTC Inc. PTC 6,939 6,552 93.5% 27.0% 54.8% (1.6%) 6.4% 10.3% 6.1x 5.9x 5.5x 58.6x NM
Nemetschek SE NEM-DE 3,133 3,231 98.7% 32.6% 228.4% 16.5% 30.3% 27.7% 7.8x 6.6x 5.8x 28.0x 58.8x
Median $11,018 $11,163 96.2% 32.6% 63.3% 5.7% 13.0% 25.8% 6.1x 5.9x 5.5x 23.9x 46.4x
Enterprise Market % of 52 1-Year Stock 3-Year Stock Revenue Growth LTM EBITDA Enterprise Value / Price /
Company Ticker Value ($mm) Cap ($mm) Week High Performance Performance LTM NTM Margin LTM Rev. 2017E Rev. 2018E Rev. LTM EBITDA Earnings
Large-Cap
SaaS
Small-Cap
SaaS
Data &
Analytics
IT Operations
Data Storage
IT Security
Software
Bellwethers
Communication
Enterprise
HCM
Marketing
PLM &
Engineering
SCM & Logistics
Energy
Financial
HCIT
EdTech /
Non-Profit
PAGE | 22
TECHNOLOGY, MEDIA, & TELECOM
QUARTERLY SOFTWARE SECTOR REVIEW │ 3Q 2017
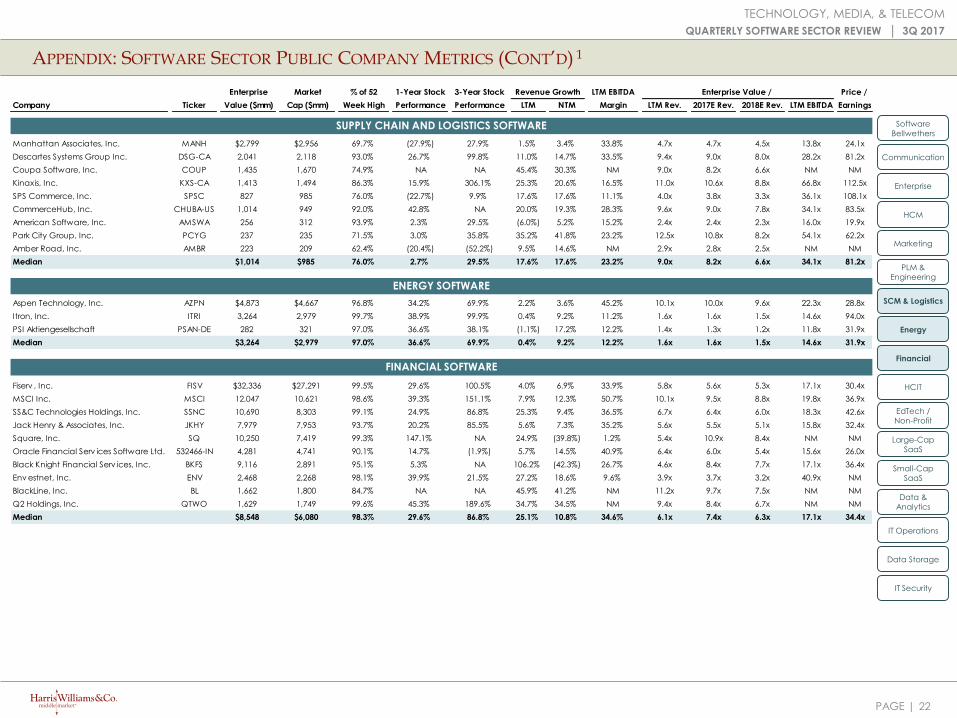
APPENDIX: SOFTWARE SECTOR PUBLIC COMPANY METRICS (CONT’D) 1
SUPPLY CHAIN AND LOGISTICS SOFTWARE
Manhattan Associates, Inc. MANH $2,799 $2,956 69.7% (27.9%) 27.9% 1.5% 3.4% 33.8% 4.7x 4.7x 4.5x 13.8x 24.1x
Descartes Systems Group Inc. DSG-CA 2,041 2,118 93.0% 26.7% 99.8% 11.0% 14.7% 33.5% 9.4x 9.0x 8.0x 28.2x 81.2x
Coupa Software, Inc. COUP 1,435 1,670 74.9% NA NA 45.4% 30.3% NM 9.0x 8.2x 6.6x NM NM
Kinaxis, Inc. KXS-CA 1,413 1,494 86.3% 15.9% 306.1% 25.3% 20.6% 16.5% 11.0x 10.6x 8.8x 66.8x 112.5x
SPS Commerce, Inc. SPSC 827 985 76.0% (22.7%) 9.9% 17.6% 17.6% 11.1% 4.0x 3.8x 3.3x 36.1x 108.1x
CommerceHub, Inc. CHUBA-US 1,014 949 92.0% 42.8% NA 20.0% 19.3% 28.3% 9.6x 9.0x 7.8x 34.1x 83.5x
American Software, Inc. AMSWA 256 312 93.9% 2.3% 29.5% (6.0%) 5.2% 15.2% 2.4x 2.4x 2.3x 16.0x 19.9x
Park City Group, Inc. PCYG 237 235 71.5% 3.0% 35.8% 35.2% 41.8% 23.2% 12.5x 10.8x 8.2x 54.1x 62.2x
Amber Road, Inc. AMBR 223 209 62.4% (20.4%) (52.2%) 9.5% 14.6% NM 2.9x 2.8x 2.5x NM NM
Median $1,014 $985 76.0% 2.7% 29.5% 17.6% 17.6% 23.2% 9.0x 8.2x 6.6x 34.1x 81.2x
ENERGY SOFTWARE
Aspen Technology, Inc. AZPN $4,873 $4,667 96.8% 34.2% 69.9% 2.2% 3.6% 45.2% 10.1x 10.0x 9.6x 22.3x 28.8x
Itron, Inc. ITRI 3,264 2,979 99.7% 38.9% 99.9% 0.4% 9.2% 11.2% 1.6x 1.6x 1.5x 14.6x 94.0x
PSI Aktiengesellschaft PSAN-DE 282 321 97.0% 36.6% 38.1% (1.1%) 17.2% 12.2% 1.4x 1.3x 1.2x 11.8x 31.9x
Median $3,264 $2,979 97.0% 36.6% 69.9% 0.4% 9.2% 12.2% 1.6x 1.6x 1.5x 14.6x 31.9x
FINANCIAL SOFTWARE
Fiserv , Inc. FISV $32,336 $27,291 99.5% 29.6% 100.5% 4.0% 6.9% 33.9% 5.8x 5.6x 5.3x 17.1x 30.4x
MSCI Inc. MSCI 12,047 10,621 98.6% 39.3% 151.1% 7.9% 12.3% 50.7% 10.1x 9.5x 8.8x 19.8x 36.9x
SS&C Technologies Holdings, Inc. SSNC 10,690 8,303 99.1% 24.9% 86.8% 25.3% 9.4% 36.5% 6.7x 6.4x 6.0x 18.3x 42.6x
Jack Henry & Associates, Inc. JKHY 7,979 7,953 93.7% 20.2% 85.5% 5.6% 7.3% 35.2% 5.6x 5.5x 5.1x 15.8x 32.4x
Square, Inc. SQ 10,250 7,419 99.3% 147.1% NA 24.9% (39.8%) 1.2% 5.4x 10.9x 8.4x NM NM
Oracle Financial Serv ices Software Ltd. 532466-IN 4,281 4,741 90.1% 14.7% (1.9%) 5.7% 14.5% 40.9% 6.4x 6.0x 5.4x 15.6x 26.0x
Black Knight Financial Serv ices, Inc. BKFS 9,116 2,891 95.1% 5.3% NA 106.2% (42.3%) 26.7% 4.6x 8.4x 7.7x 17.1x 36.4x
Env estnet, Inc. ENV 2,468 2,268 98.1% 39.9% 21.5% 27.2% 18.6% 9.6% 3.9x 3.7x 3.2x 40.9x NM
BlackLine, Inc. BL 1,662 1,800 84.7% NA NA 45.9% 41.2% NM 11.2x 9.7x 7.5x NM NM
Q2 Holdings, Inc. QTWO 1,629 1,749 99.6% 45.3% 189.6% 34.7% 34.5% NM 9.4x 8.4x 6.7x NM NM
Median $8,548 $6,080 98.3% 29.6% 86.8% 25.1% 10.8% 34.6% 6.1x 7.4x 6.3x 17.1x 34.4x
Enterprise Market % of 52 1-Year Stock 3-Year Stock Revenue Growth LTM EBITDA Enterprise Value / Price /
Company Ticker Value ($mm) Cap ($mm) Week High Performance Performance LTM NTM Margin LTM Rev. 2017E Rev. 2018E Rev. LTM EBITDA Earnings
Large-Cap
SaaS
Small-Cap
SaaS
Data &
Analytics
IT Operations
Data Storage
IT Security
Software
Bellwethers
Communication
Enterprise
HCM
Marketing
PLM &
Engineering
SCM & Logistics
Energy
Financial
HCIT
EdTech /
Non-Profit
PAGE | 23
TECHNOLOGY, MEDIA, & TELECOM
QUARTERLY SOFTWARE SECTOR REVIEW │ 3Q 2017
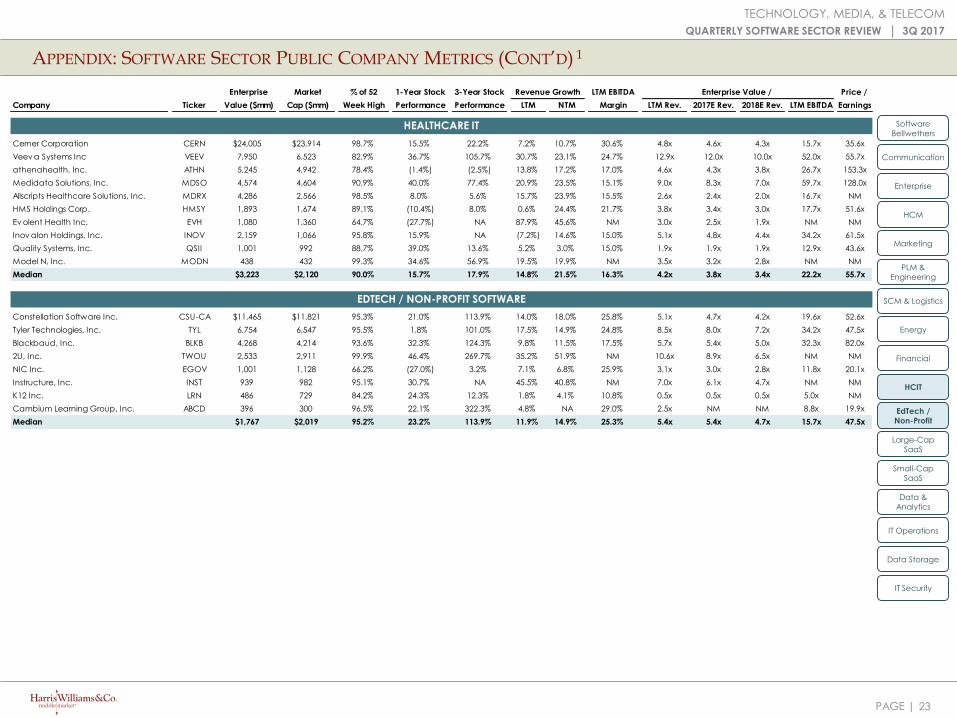
APPENDIX: SOFTWARE SECTOR PUBLIC COMPANY METRICS (CONT’D) 1
HEALTHCARE IT
Cerner Corporation CERN $24,005 $23,914 98.7% 15.5% 22.2% 7.2% 10.7% 30.6% 4.8x 4.6x 4.3x 15.7x 35.6x
Veev a Systems Inc VEEV 7,950 6,523 82.9% 36.7% 105.7% 30.7% 23.1% 24.7% 12.9x 12.0x 10.0x 52.0x 55.7x
athenahealth, Inc. ATHN 5,245 4,942 78.4% (1.4%) (2.5%) 13.8% 17.2% 17.0% 4.6x 4.3x 3.8x 26.7x 153.3x
Medidata Solutions, Inc. MDSO 4,574 4,604 90.9% 40.0% 77.4% 20.9% 23.5% 15.1% 9.0x 8.3x 7.0x 59.7x 128.0x
Allscripts Healthcare Solutions, Inc. MDRX 4,286 2,566 98.5% 8.0% 5.6% 15.7% 23.9% 15.5% 2.6x 2.4x 2.0x 16.7x NM
HMS Holdings Corp. HMSY 1,893 1,674 89.1% (10.4%) 8.0% 0.6% 24.4% 21.7% 3.8x 3.4x 3.0x 17.7x 51.6x
Ev olent Health Inc. EVH 1,080 1,360 64.7% (27.7%) NA 87.9% 45.6% NM 3.0x 2.5x 1.9x NM NM
Inov alon Holdings, Inc. INOV 2,159 1,066 95.8% 15.9% NA (7.2%) 14.6% 15.0% 5.1x 4.8x 4.4x 34.2x 61.5x
Quality Systems, Inc. QSII 1,001 992 88.7% 39.0% 13.6% 5.2% 3.0% 15.0% 1.9x 1.9x 1.9x 12.9x 43.6x
Model N, Inc. MODN 438 432 99.3% 34.6% 56.9% 19.5% 19.9% NM 3.5x 3.2x 2.8x NM NM
Median $3,223 $2,120 90.0% 15.7% 17.9% 14.8% 21.5% 16.3% 4.2x 3.8x 3.4x 22.2x 55.7x
EDTECH / NON-PROFIT SOFTWARE
Constellation Software Inc. CSU-CA $11,465 $11,821 95.3% 21.0% 113.9% 14.0% 18.0% 25.8% 5.1x 4.7x 4.2x 19.6x 52.6x
Tyler Technologies, Inc. TYL 6,754 6,547 95.5% 1.8% 101.0% 17.5% 14.9% 24.8% 8.5x 8.0x 7.2x 34.2x 47.5x
Blackbaud, Inc. BLKB 4,268 4,214 93.6% 32.3% 124.3% 9.8% 11.5% 17.5% 5.7x 5.4x 5.0x 32.3x 82.0x
2U, Inc. TWOU 2,533 2,911 99.9% 46.4% 269.7% 35.2% 51.9% NM 10.6x 8.9x 6.5x NM NM
NIC Inc. EGOV 1,001 1,128 66.2% (27.0%) 3.2% 7.1% 6.8% 25.9% 3.1x 3.0x 2.8x 11.8x 20.1x
Instructure, Inc. INST 939 982 95.1% 30.7% NA 45.5% 40.8% NM 7.0x 6.1x 4.7x NM NM
K12 Inc. LRN 486 729 84.2% 24.3% 12.3% 1.8% 4.1% 10.8% 0.5x 0.5x 0.5x 5.0x NM
Cambium Learning Group, Inc. ABCD 396 300 96.5% 22.1% 322.3% 4.8% NA 29.0% 2.5x NM NM 8.8x 19.9x
Median $1,767 $2,019 95.2% 23.2% 113.9% 11.9% 14.9% 25.3% 5.4x 5.4x 4.7x 15.7x 47.5x
Enterprise Market % of 52 1-Year Stock 3-Year Stock Revenue Growth LTM EBITDA Enterprise Value / Price /
Company Ticker Value ($mm) Cap ($mm) Week High Performance Performance LTM NTM Margin LTM Rev. 2017E Rev. 2018E Rev. LTM EBITDA Earnings
Large-Cap
SaaS
Small-Cap
SaaS
Data &
Analytics
IT Operations
Data Storage
IT Security
Software
Bellwethers
Communication
Enterprise
HCM
Marketing
PLM &
Engineering
SCM & Logistics
Energy
Financial
HCIT
EdTech /
Non-Profit
PAGE | 24
TECHNOLOGY, MEDIA, & TELECOM
QUARTERLY SOFTWARE SECTOR REVIEW │ 3Q 2017
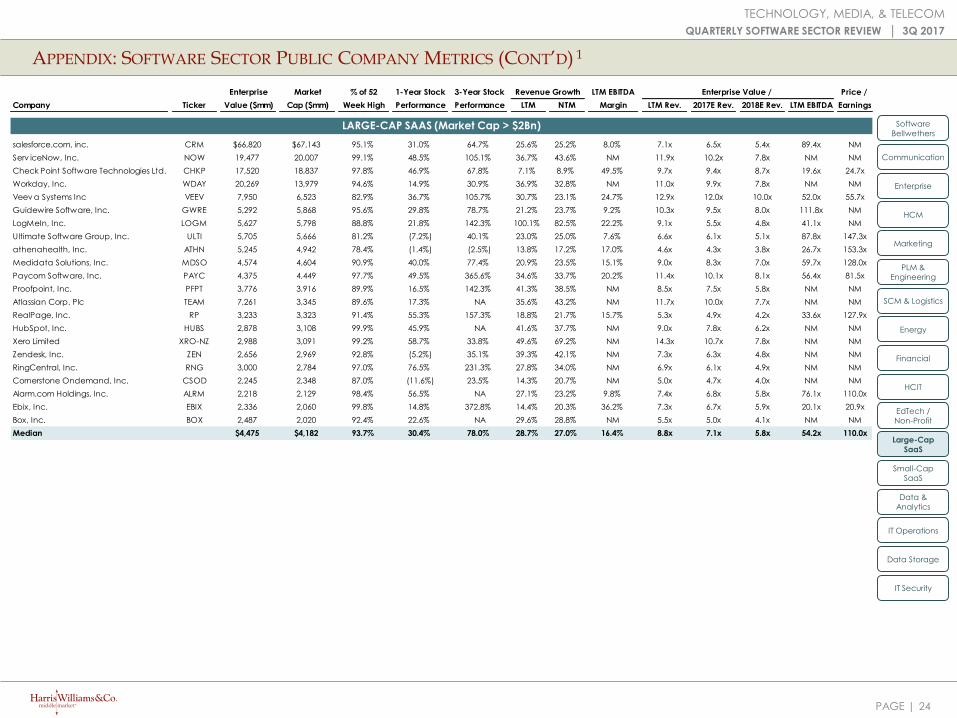
APPENDIX: SOFTWARE SECTOR PUBLIC COMPANY METRICS (CONT’D) 1
LARGE-CAP SAAS (Market Cap > $2Bn)
Enterprise Market % of 52 1-Year Stock 3-Year Stock Revenue Growth LTM EBITDA Enterprise Value / Price /
Company Ticker Value ($mm) Cap ($mm) Week High Performance Performance LTM NTM Margin LTM Rev. 2017E Rev. 2018E Rev. LTM EBITDA Earnings
Large-Cap
SaaS
Small-Cap
SaaS
Data &
Analytics
IT Operations
Data Storage
IT Security
Software
Bellwethers
Communication
Enterprise
HCM
Marketing
PLM &
Engineering
SCM & Logistics
Energy
Financial
HCIT
EdTech /
Non-Profit
salesforce.com, inc. CRM $66,820 $67,143 95.1% 31.0% 64.7% 25.6% 25.2% 8.0% 7.1x 6.5x 5.4x 89.4x NM
Serv iceNow, Inc. NOW 19,477 20,007 99.1% 48.5% 105.1% 36.7% 43.6% NM 11.9x 10.2x 7.8x NM NM
Check Point Software Technologies Ltd. CHKP 17,520 18,837 97.8% 46.9% 67.8% 7.1% 8.9% 49.5% 9.7x 9.4x 8.7x 19.6x 24.7x
Workday, Inc. WDAY 20,269 13,979 94.6% 14.9% 30.9% 36.9% 32.8% NM 11.0x 9.9x 7.8x NM NM
Veev a Systems Inc VEEV 7,950 6,523 82.9% 36.7% 105.7% 30.7% 23.1% 24.7% 12.9x 12.0x 10.0x 52.0x 55.7x
Guidewire Software, Inc. GWRE 5,292 5,868 95.6% 29.8% 78.7% 21.2% 23.7% 9.2% 10.3x 9.5x 8.0x 111.8x NM
LogMeIn, Inc. LOGM 5,627 5,798 88.8% 21.8% 142.3% 100.1% 82.5% 22.2% 9.1x 5.5x 4.8x 41.1x NM
Ultimate Software Group, Inc. ULTI 5,705 5,666 81.2% (7.2%) 40.1% 23.0% 25.0% 7.6% 6.6x 6.1x 5.1x 87.8x 147.3x
athenahealth, Inc. ATHN 5,245 4,942 78.4% (1.4%) (2.5%) 13.8% 17.2% 17.0% 4.6x 4.3x 3.8x 26.7x 153.3x
Medidata Solutions, Inc. MDSO 4,574 4,604 90.9% 40.0% 77.4% 20.9% 23.5% 15.1% 9.0x 8.3x 7.0x 59.7x 128.0x
Paycom Software, Inc. PAYC 4,375 4,449 97.7% 49.5% 365.6% 34.6% 33.7% 20.2% 11.4x 10.1x 8.1x 56.4x 81.5x
Proofpoint, Inc. PFPT 3,776 3,916 89.9% 16.5% 142.3% 41.3% 38.5% NM 8.5x 7.5x 5.8x NM NM
Atlassian Corp. Plc TEAM 7,261 3,345 89.6% 17.3% NA 35.6% 43.2% NM 11.7x 10.0x 7.7x NM NM
RealPage, Inc. RP 3,233 3,323 91.4% 55.3% 157.3% 18.8% 21.7% 15.7% 5.3x 4.9x 4.2x 33.6x 127.9x
HubSpot, Inc. HUBS 2,878 3,108 99.9% 45.9% NA 41.6% 37.7% NM 9.0x 7.8x 6.2x NM NM
Xero Limited XRO-NZ 2,988 3,091 99.2% 58.7% 33.8% 49.6% 69.2% NM 14.3x 10.7x 7.8x NM NM
Zendesk, Inc. ZEN 2,656 2,969 92.8% (5.2%) 35.1% 39.3% 42.1% NM 7.3x 6.3x 4.8x NM NM
RingCentral, Inc. RNG 3,000 2,784 97.0% 76.5% 231.3% 27.8% 34.0% NM 6.9x 6.1x 4.9x NM NM
Cornerstone Ondemand, Inc. CSOD 2,245 2,348 87.0% (11.6%) 23.5% 14.3% 20.7% NM 5.0x 4.7x 4.0x NM NM
Alarm.com Holdings, Inc. ALRM 2,218 2,129 98.4% 56.5% NA 27.1% 23.2% 9.8% 7.4x 6.8x 5.8x 76.1x 110.0x
Ebix, Inc. EBIX 2,336 2,060 99.8% 14.8% 372.8% 14.4% 20.3% 36.2% 7.3x 6.7x 5.9x 20.1x 20.9x
Box, Inc. BOX 2,487 2,020 92.4% 22.6% NA 29.6% 28.8% NM 5.5x 5.0x 4.1x NM NM
Median $4,475 $4,182 93.7% 30.4% 78.0% 28.7% 27.0% 16.4% 8.8x 7.1x 5.8x 54.2x 110.0x
PAGE | 25
TECHNOLOGY, MEDIA, & TELECOM
QUARTERLY SOFTWARE SECTOR REVIEW │ 3Q 2017
APPENDIX: SOFTWARE SECTOR PUBLIC COMPANY METRICS (CONT’D) 1
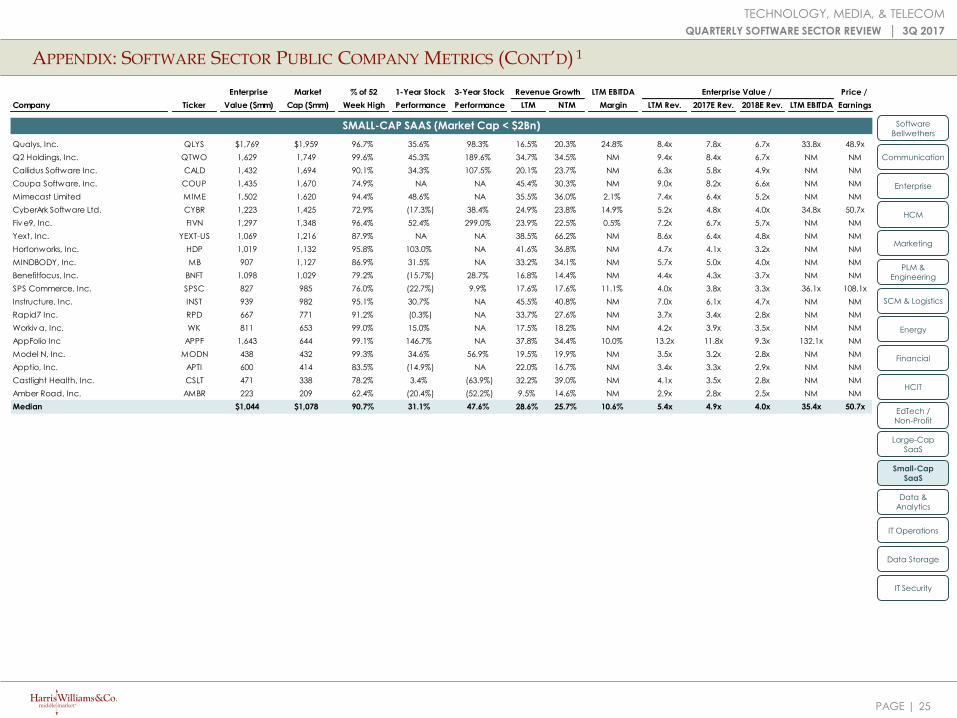
SMALL-CAP SAAS (Market Cap < $2Bn)
Enterprise Market % of 52 1-Year Stock 3-Year Stock Revenue Growth LTM EBITDA Enterprise Value / Price /
Company Ticker Value ($mm) Cap ($mm) Week High Performance Performance LTM NTM Margin LTM Rev. 2017E Rev. 2018E Rev. LTM EBITDA Earnings
Large-Cap
SaaS
Small-Cap
SaaS
Data &
Analytics
IT Operations
Data Storage
IT Security
Software
Bellwethers
Communication
Enterprise
HCM
Marketing
PLM &
Engineering
SCM & Logistics
Energy
Financial
HCIT
EdTech /
Non-Profit
Qualys, Inc. QLYS $1,769 $1,959 96.7% 35.6% 98.3% 16.5% 20.3% 24.8% 8.4x 7.8x 6.7x 33.8x 48.9x
Q2 Holdings, Inc. QTWO 1,629 1,749 99.6% 45.3% 189.6% 34.7% 34.5% NM 9.4x 8.4x 6.7x NM NM
Callidus Software Inc. CALD 1,432 1,694 90.1% 34.3% 107.5% 20.1% 23.7% NM 6.3x 5.8x 4.9x NM NM
Coupa Software, Inc. COUP 1,435 1,670 74.9% NA NA 45.4% 30.3% NM 9.0x 8.2x 6.6x NM NM
Mimecast Limited MIME 1,502 1,620 94.4% 48.6% NA 35.5% 36.0% 2.1% 7.4x 6.4x 5.2x NM NM
CyberArk Software Ltd. CYBR 1,223 1,425 72.9% (17.3%) 38.4% 24.9% 23.8% 14.9% 5.2x 4.8x 4.0x 34.8x 50.7x
Fiv e9, Inc. FIVN 1,297 1,348 96.4% 52.4% 299.0% 23.9% 22.5% 0.5% 7.2x 6.7x 5.7x NM NM
Yext, Inc. YEXT-US 1,069 1,216 87.9% NA NA 38.5% 66.2% NM 8.6x 6.4x 4.8x NM NM
Hortonworks, Inc. HDP 1,019 1,132 95.8% 103.0% NA 41.6% 36.8% NM 4.7x 4.1x 3.2x NM NM
MINDBODY, Inc. MB 907 1,127 86.9% 31.5% NA 33.2% 34.1% NM 5.7x 5.0x 4.0x NM NM
Benefitfocus, Inc. BNFT 1,098 1,029 79.2% (15.7%) 28.7% 16.8% 14.4% NM 4.4x 4.3x 3.7x NM NM
SPS Commerce, Inc. SPSC 827 985 76.0% (22.7%) 9.9% 17.6% 17.6% 11.1% 4.0x 3.8x 3.3x 36.1x 108.1x
Instructure, Inc. INST 939 982 95.1% 30.7% NA 45.5% 40.8% NM 7.0x 6.1x 4.7x NM NM
Rapid7 Inc. RPD 667 771 91.2% (0.3%) NA 33.7% 27.6% NM 3.7x 3.4x 2.8x NM NM
Workiv a, Inc. WK 811 653 99.0% 15.0% NA 17.5% 18.2% NM 4.2x 3.9x 3.5x NM NM
AppFolio Inc APPF 1,643 644 99.1% 146.7% NA 37.8% 34.4% 10.0% 13.2x 11.8x 9.3x 132.1x NM
Model N, Inc. MODN 438 432 99.3% 34.6% 56.9% 19.5% 19.9% NM 3.5x 3.2x 2.8x NM NM
Apptio, Inc. APTI 600 414 83.5% (14.9%) NA 22.0% 16.7% NM 3.4x 3.3x 2.9x NM NM
Castlight Health, Inc. CSLT 471 338 78.2% 3.4% (63.9%) 32.2% 39.0% NM 4.1x 3.5x 2.8x NM NM
Amber Road, Inc. AMBR 223 209 62.4% (20.4%) (52.2%) 9.5% 14.6% NM 2.9x 2.8x 2.5x NM NM
Median $1,044 $1,078 90.7% 31.1% 47.6% 28.6% 25.7% 10.6% 5.4x 4.9x 4.0x 35.4x 50.7x
PAGE | 26
TECHNOLOGY, MEDIA, & TELECOM
QUARTERLY SOFTWARE SECTOR REVIEW │ 3Q 2017
APPENDIX: SOFTWARE SECTOR PUBLIC COMPANY METRICS (CONT’D) 1
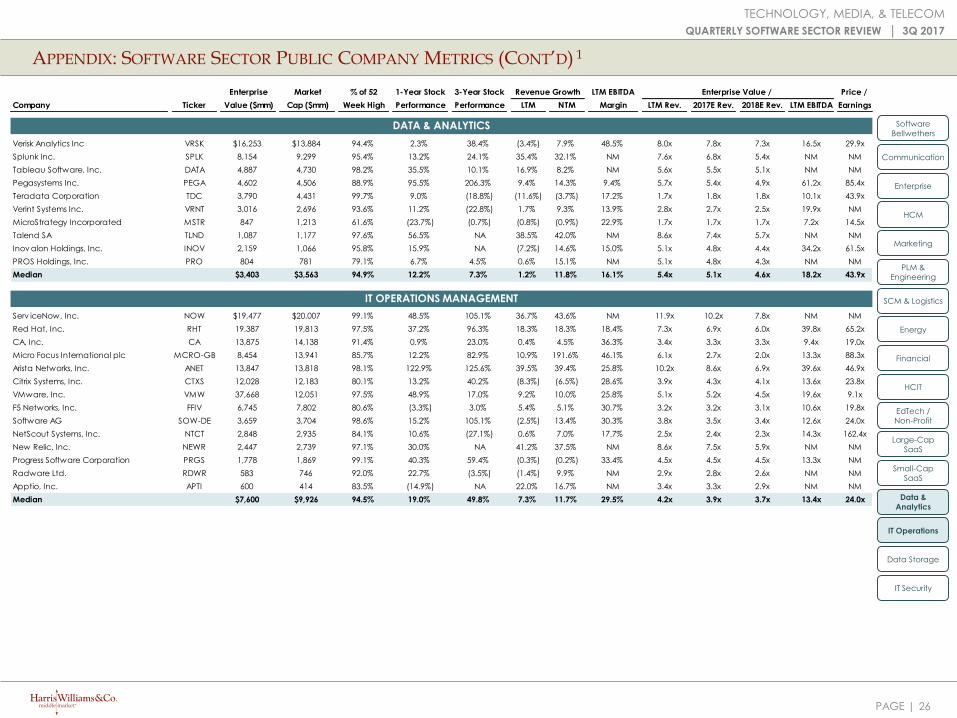
DATA & ANALYTICS
IT OPERATIONS MANAGEMENT
Enterprise Market % of 52 1-Year Stock 3-Year Stock Revenue Growth LTM EBITDA Enterprise Value / Price /
Company Ticker Value ($mm) Cap ($mm) Week High Performance Performance LTM NTM Margin LTM Rev. 2017E Rev. 2018E Rev. LTM EBITDA Earnings
Large-Cap
SaaS
Small-Cap
SaaS
Data &
Analytics
IT Operations
Data Storage
IT Security
Software
Bellwethers
Communication
Enterprise
HCM
Marketing
PLM &
Engineering
SCM & Logistics
Energy
Financial
HCIT
EdTech /
Non-Profit
Verisk Analytics Inc VRSK $16,253 $13,884 94.4% 2.3% 38.4% (3.4%) 7.9% 48.5% 8.0x 7.8x 7.3x 16.5x 29.9x
Splunk Inc. SPLK 8,154 9,299 95.4% 13.2% 24.1% 35.4% 32.1% NM 7.6x 6.8x 5.4x NM NM
Tableau Software, Inc. DATA 4,887 4,730 98.2% 35.5% 10.1% 16.9% 8.2% NM 5.6x 5.5x 5.1x NM NM
Pegasystems Inc. PEGA 4,602 4,506 88.9% 95.5% 206.3% 9.4% 14.3% 9.4% 5.7x 5.4x 4.9x 61.2x 85.4x
Teradata Corporation TDC 3,790 4,431 99.7% 9.0% (18.8%) (11.6%) (3.7%) 17.2% 1.7x 1.8x 1.8x 10.1x 43.9x
Verint Systems Inc. VRNT 3,016 2,696 93.6% 11.2% (22.8%) 1.7% 9.3% 13.9% 2.8x 2.7x 2.5x 19.9x NM
MicroStrategy Incorporated MSTR 847 1,213 61.6% (23.7%) (0.7%) (0.8%) (0.9%) 22.9% 1.7x 1.7x 1.7x 7.2x 14.5x
Talend SA TLND 1,087 1,177 97.6% 56.5% NA 38.5% 42.0% NM 8.6x 7.4x 5.7x NM NM
Inov alon Holdings, Inc. INOV 2,159 1,066 95.8% 15.9% NA (7.2%) 14.6% 15.0% 5.1x 4.8x 4.4x 34.2x 61.5x
PROS Holdings, Inc. PRO 804 781 79.1% 6.7% 4.5% 0.6% 15.1% NM 5.1x 4.8x 4.3x NM NM
Median $3,403 $3,563 94.9% 12.2% 7.3% 1.2% 11.8% 16.1% 5.4x 5.1x 4.6x 18.2x 43.9x
Serv iceNow, Inc. NOW $19,477 $20,007 99.1% 48.5% 105.1% 36.7% 43.6% NM 11.9x 10.2x 7.8x NM NM
Red Hat, Inc. RHT 19,387 19,813 97.5% 37.2% 96.3% 18.3% 18.3% 18.4% 7.3x 6.9x 6.0x 39.8x 65.2x
CA, Inc. CA 13,875 14,138 91.4% 0.9% 23.0% 0.4% 4.5% 36.3% 3.4x 3.3x 3.3x 9.4x 19.0x
Micro Focus International plc MCRO-GB 8,454 13,941 85.7% 12.2% 82.9% 10.9% 191.6% 46.1% 6.1x 2.7x 2.0x 13.3x 88.3x
Arista Networks, Inc. ANET 13,847 13,818 98.1% 122.9% 125.6% 39.5% 39.4% 25.8% 10.2x 8.6x 6.9x 39.6x 46.9x
Citrix Systems, Inc. CTXS 12,028 12,183 80.1% 13.2% 40.2% (8.3%) (6.5%) 28.6% 3.9x 4.3x 4.1x 13.6x 23.8x
VMware, Inc. VMW 37,668 12,051 97.5% 48.9% 17.0% 9.2% 10.0% 25.8% 5.1x 5.2x 4.5x 19.6x 9.1x
F5 Networks, Inc. FFIV 6,745 7,802 80.6% (3.3%) 3.0% 5.4% 5.1% 30.7% 3.2x 3.2x 3.1x 10.6x 19.8x
Software AG SOW-DE 3,659 3,704 98.6% 15.2% 105.1% (2.5%) 13.4% 30.3% 3.8x 3.5x 3.4x 12.6x 24.0x
NetScout Systems, Inc. NTCT 2,848 2,935 84.1% 10.6% (27.1%) 0.6% 7.0% 17.7% 2.5x 2.4x 2.3x 14.3x 162.4x
New Relic, Inc. NEWR 2,447 2,739 97.1% 30.0% NA 41.2% 37.5% NM 8.6x 7.5x 5.9x NM NM
Progress Software Corporation PRGS 1,778 1,869 99.1% 40.3% 59.4% (0.3%) (0.2%) 33.4% 4.5x 4.5x 4.5x 13.3x NM
Radware Ltd. RDWR 583 746 92.0% 22.7% (3.5%) (1.4%) 9.9% NM 2.9x 2.8x 2.6x NM NM
Apptio, Inc. APTI 600 414 83.5% (14.9%) NA 22.0% 16.7% NM 3.4x 3.3x 2.9x NM NM
Median $7,600 $9,926 94.5% 19.0% 49.8% 7.3% 11.7% 29.5% 4.2x 3.9x 3.7x 13.4x 24.0x
PAGE | 27
TECHNOLOGY, MEDIA, & TELECOM
QUARTERLY SOFTWARE SECTOR REVIEW │ 3Q 2017
APPENDIX: SOFTWARE SECTOR PUBLIC COMPANY METRICS (CONT’D) 1
Enterprise Market % of 52 1-Year Stock 3-Year Stock Revenue Growth LTM EBITDA Enterprise Value / Price /
Company Ticker Value ($mm) Cap ($mm) Week High Performance Performance LTM NTM Margin LTM Rev. 2017E Rev. 2018E Rev. LTM EBITDA Earnings
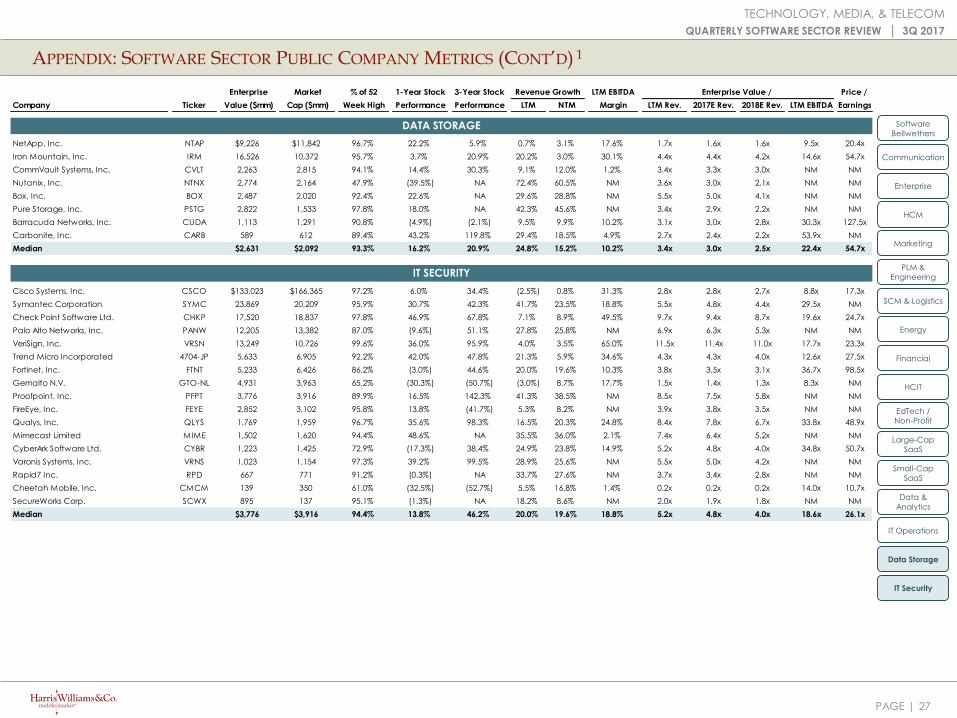
DATA STORAGE
IT SECURITY
Large-Cap
SaaS
Small-Cap
SaaS
Data &
Analytics
IT Operations
Data Storage
IT Security
Software
Bellwethers
Communication
Enterprise
HCM
Marketing
PLM &
Engineering
SCM & Logistics
Energy
Financial
HCIT
EdTech /
Non-Profit
NetApp, Inc. NTAP $9,226 $11,842 96.7% 22.2% 5.9% 0.7% 3.1% 17.6% 1.7x 1.6x 1.6x 9.5x 20.4x
Iron Mountain, Inc. IRM 16,526 10,372 95.7% 3.7% 20.9% 20.2% 3.0% 30.1% 4.4x 4.4x 4.2x 14.6x 54.7x
CommVault Systems, Inc. CVLT 2,263 2,815 94.1% 14.4% 30.3% 9.1% 12.0% 1.2% 3.4x 3.3x 3.0x NM NM
Nutanix, Inc. NTNX 2,774 2,164 47.9% (39.5%) NA 72.4% 60.5% NM 3.6x 3.0x 2.1x NM NM
Box, Inc. BOX 2,487 2,020 92.4% 22.6% NA 29.6% 28.8% NM 5.5x 5.0x 4.1x NM NM
Pure Storage, Inc. PSTG 2,822 1,533 97.8% 18.0% NA 42.3% 45.6% NM 3.4x 2.9x 2.2x NM NM
Barracuda Networks, Inc. CUDA 1,113 1,291 90.8% (4.9%) (2.1%) 9.5% 9.9% 10.2% 3.1x 3.0x 2.8x 30.3x 127.5x
Carbonite, Inc. CARB 589 612 89.4% 43.2% 119.8% 29.4% 18.5% 4.9% 2.7x 2.4x 2.2x 53.9x NM
Median $2,631 $2,092 93.3% 16.2% 20.9% 24.8% 15.2% 10.2% 3.4x 3.0x 2.5x 22.4x 54.7x
Cisco Systems, Inc. CSCO $133,023 $166,365 97.2% 6.0% 34.4% (2.5%) 0.8% 31.3% 2.8x 2.8x 2.7x 8.8x 17.3x
Symantec Corporation SYMC 23,869 20,209 95.9% 30.7% 42.3% 41.7% 23.5% 18.8% 5.5x 4.8x 4.4x 29.5x NM
Check Point Software Ltd. CHKP 17,520 18,837 97.8% 46.9% 67.8% 7.1% 8.9% 49.5% 9.7x 9.4x 8.7x 19.6x 24.7x
Palo Alto Networks, Inc. PANW 12,205 13,382 87.0% (9.6%) 51.1% 27.8% 25.8% NM 6.9x 6.3x 5.3x NM NM
VeriSign, Inc. VRSN 13,249 10,726 99.6% 36.0% 95.9% 4.0% 3.5% 65.0% 11.5x 11.4x 11.0x 17.7x 23.3x
Trend Micro Incorporated 4704-JP 5,633 6,905 92.2% 42.0% 47.8% 21.3% 5.9% 34.6% 4.3x 4.3x 4.0x 12.6x 27.5x
Fortinet, Inc. FTNT 5,233 6,426 86.2% (3.0%) 44.6% 20.0% 19.6% 10.3% 3.8x 3.5x 3.1x 36.7x 98.5x
Gemalto N.V. GTO-NL 4,931 3,963 65.2% (30.3%) (50.7%) (3.0%) 8.7% 17.7% 1.5x 1.4x 1.3x 8.3x NM
Proofpoint, Inc. PFPT 3,776 3,916 89.9% 16.5% 142.3% 41.3% 38.5% NM 8.5x 7.5x 5.8x NM NM
FireEye, Inc. FEYE 2,852 3,102 95.8% 13.8% (41.7%) 5.3% 8.2% NM 3.9x 3.8x 3.5x NM NM
Qualys, Inc. QLYS 1,769 1,959 96.7% 35.6% 98.3% 16.5% 20.3% 24.8% 8.4x 7.8x 6.7x 33.8x 48.9x
Mimecast Limited MIME 1,502 1,620 94.4% 48.6% NA 35.5% 36.0% 2.1% 7.4x 6.4x 5.2x NM NM
CyberArk Software Ltd. CYBR 1,223 1,425 72.9% (17.3%) 38.4% 24.9% 23.8% 14.9% 5.2x 4.8x 4.0x 34.8x 50.7x
Varonis Systems, Inc. VRNS 1,023 1,154 97.3% 39.2% 99.5% 28.9% 25.6% NM 5.5x 5.0x 4.2x NM NM
Rapid7 Inc. RPD 667 771 91.2% (0.3%) NA 33.7% 27.6% NM 3.7x 3.4x 2.8x NM NM
Cheetah Mobile, Inc. CMCM 139 350 61.0% (32.5%) (52.7%) 5.5% 16.8% 1.4% 0.2x 0.2x 0.2x 14.0x 10.7x
SecureWorks Corp. SCWX 895 137 95.1% (1.3%) NA 18.2% 8.6% NM 2.0x 1.9x 1.8x NM NM
Median $3,776 $3,916 94.4% 13.8% 46.2% 20.0% 19.6% 18.8% 5.2x 4.8x 4.0x 18.6x 26.1x

Healthcare & Life Sciences
IndustrialsEnergy, Power & Infrastructure
Industrials
PAGE |
Harris Williams & Co. has a broad range of industry expertise, which create powerful opportunities. Our clients benefit form our deep-sector experience,integrated industry intelligence and collaboration across the firm, and our commitment to learning what makes them unique. For more information,visit our website at www.harriswilliams.com/industries.
HARRIS WILLIAMS & CO. OFFICE LOCATIONS
UNITED STATES EUROPE
NETWORK OFFICES
Beijing
Hong Kong
Mumbai
New Delhi
Shanghai
Aerospace, Defense & Government
Services
Building Products & Materials
Business Services
Consumer Specialty Distribution
Technology, Media & Telecom
Transportation & Logistics
BostonOne International PlaceSuite 2620Boston, Massachusetts 02110Phone: +1 (617) 482-7501
Cleveland1900 East 9th Street20th FloorCleveland, Ohio 44114Phone: +1 (216) 689-2400
Minneapolis222 South 9th StreetSuite 3350Minneapolis, Minnesota 55402Phone: +1 (612) 359-2700
Richmond (Headquarters)1001 Haxall Point9th FloorRichmond, Virginia 23219Phone: +1 (804) 648-0072
San Francisco575 Market Street31st FloorSan Francisco, California 94105Phone: +1 (415) 288-4260
Washington, D.C. 800 17th St. NW2nd FloorWashington, D.C. 20006Phone: +1 (202) 207-2300
FrankfurtBockenheimer Landstrasse 33-3560325 FrankfurtGermanyPhone: +49 069 3650638 00
London63 Brook StreetLondon W1K 4HS, EnglandPhone: +44 (0) 20 7518 8900
TECHNOLOGY, MEDIA, & TELECOM
QUARTERLY SOFTWARE SECTOR REVIEW │ 3Q 2017
Technology, Media & Telecom
OUR FIRM
28
PAGE | 29
TECHNOLOGY, MEDIA, & TELECOM
QUARTERLY SOFTWARE SECTOR REVIEW │ 3Q 2017
Harris Williams & Co. (www.harriswilliams.com) is a preeminent middle market investment bank focused on the advisory needs of clients worldwide. The firm has deep industry knowledge, global transaction expertise, and an unwavering commitment to excellence. Harris Williams & Co. provides sell-side and acquisition advisory, restructuring advisory, board advisory, private placements, and capital markets advisory services.
Investment banking services are provided by Harris Williams LLC, a registered broker-dealer and member of FINRA and SIPC, and Harris Williams & Co. Ltd, which is a private limited company incorporated under English law with its registered office at 5th Floor, 6 St. Andrew Street, London EC4A 3AE, UK, registered with the Registrar of Companies forEngland and Wales (registration number 7078852). Harris Williams & Co. Ltd is authorized and regulated by the Financial Conduct Authority. Harris Williams & Co. is a tradename under which Harris Williams LLC and Harris Williams & Co. Ltd conduct business.
THIS REPORT MAY CONTAIN REFERENCES TO REGISTERED TRADEMARKS, SERVICE MARKS AND COPYRIGHTS OWNED BY THIRD-PARTY INFORMATION PROVIDERS. NONE OF THE THIRD-PARTY INFORMATION PROVIDERS IS ENDORSING THE OFFERING OF, AND SHALL NOT IN ANY WAY BE DEEMED AN ISSUER OR UNDERWRITER OF, THE SECURITIES, FINANCIAL INSTRUMENTS OR OTHER INVESTMENTS DISCUSSED IN THIS REPORT, AND SHALL NOT HAVE ANY LIABILITY OR RESPONSIBILITY FOR ANY STATEMENTS MADE IN THE REPORT OR FOR ANY FINANCIAL STATEMENTS, FINANCIAL PROJECTIONS OR OTHER FINANCIAL INFORMATION CONTAINED OR ATTACHED AS AN EXHIBIT TO THE REPORT. FOR MORE INFORMATION ABOUT THE MATERIALS PROVIDED BY SUCH THIRD PARTIES, PLEASE CONTACT US.
The information and views contained in this report were prepared by Harris Williams & Co. (“Harris Williams”). It is not a research report, as such term is defined by applicable law and regulations, and is provided for informational purposes only. It is not to be construed as an offer to buy or sell or a solicitation of an offer to buy or sell any financial instruments or to participate in any particular trading strategy. The information contained herein is believed by Harris Williams to be reliable, but Harris Williams makes no representation as to the accuracy or completeness of such information. Harris Williams and/or its affiliates may be market makers or specialists in, act as advisers or lenders to, have positions in and effect transactions in securities of companies mentioned herein and also may provide, may have provided, or may seek to provide investment banking services for those companies. In addition, Harris Williams and/or its affiliates or their respective officers, directors and employees may hold long or short positions in the securities, options thereon or other related financial products of companies discussed herein. Opinions, estimates and projections in this report constitute Harris Williams’ judgment and are subject to change without notice. The financial instruments discussed in this report may not be suitable for all investors, and investors must make their own investment decisions using their own independent advisors as they believe necessary and based upon their specific financial situations and investment objectives. Also, past performance is not necessarily indicative of future results. No part of this material may be copied or duplicated in any form or by any means, or redistributed, without Harris Williams’ prior written consent.
Copyright© 2017 Harris Williams & Co., all rights reserved.
HARRIS WILLIAMS & CO.
1. FactSet.
2. PNC Capital Markets.
3. S&P LCD stats.
4. PitchBook.
SOURCES
DISCLOSURES


