
TECHNOLOGY IN THE FOOD SAFETY WORLD: TOOLS SUCH AS WHO GENOME SEQUENCING – FRIEND OR FOE?Room 314 | December 5 2017

CEUs – New ProcessCertified Crop Advisor (CCA)• Sign in and out of each session you attend.
• Pickup verification sheet at conclusion of each session.
• Repeat this process for each session, and each day you wish to receive credits.
Pest Control Advisor (PCA), Qualified Applicator (QA), Private Applicator (PA)• Pickup scantron at the start of the day at first
session you attend; complete form.
• Sign in and out of each session you attend.
• Pickup verification sheet at conclusion of each session.
• Turn in your scantron at the end of the day at the last session you attend.
Sign in sheets and verification sheets are located at the back of each session room.

• Tim Birmingham, Almond Board of California, moderator
• Jesse Miller, NSF International• Maria Hoffmann, FDA Center for
Food Safety and applied Nutrition
3
AGENDA

Next Generation Sequencing –The Technology and its Applications – Friend or Foe?
Jesse D. Miller, Ph.D.Director
Applied Research CenterNSF AuthenTechnologies

Agenda
Next Generation Sequencing
5
Methods
Applications and Examples

6
Next Generation Sequencing
Process of extracting genetic material and reading the “code”.

Lets go Back in Time………….1952.

How do we Analyze DNA? Sequencing Background RNA sequencing was first to be developed (different
methods) 1965: Robert W. Holley sequenced tRNA from Saccharomyces 1976: Walter Fiers’ lab first to complete RNA-based genome
(MS2 bacteriophage) Big breakthrough was DiDeoxy Sequencing (Sanger
Sequencing) 1977: Invented by Fredrick Sanger (Nobel Prize 1958, 1980) 1977: First to sequence DNA-based genome (PhiX
bacteriophage) Termed the “Chain Termination Method”
Di-Deoxy Nucleotides are labeled with fluorophores Used to be radiolabeled. Probably mouth pipetted too!
These Di-Deoxy NTPs (ddNTPs) terminate the extension reaction when incorporated via PCR
The end of each fragment has a fluorescent signal Current method is to run through a capillary gel to size and
orderUsed to be a polyacrylamide gel
Capture the signal sequence and translate to nucleotide bases
What is Next-Gen Sequencing?
Term used for sequencing that has a higher throughput than traditional Sanger sequencing
Now Encompasses many platforms – ThermoFisher, Illumina, Pacific Biosciences, Oxford Nanopore
Can be Whole Genome Sequencing, 16S rRNAMetagenomics, Shotgun Metagenomics, Targeted Gene Sequencing, RNA-SEQ
1st Gen – Sanger, ABI (3130xl) 2nd Gen – 454, Illumina (Solexa) and ThermoFisher
(Massively Paralell Sequencers – Short Read) 3rd Gen – Pacific Biosciences, Oxford (Long Read
Sequencers)
BASES TO BYTES
How is NGS Different than Traditional Sequencing?
Sequencing done on flowcells/chips now. No 2D gels or capillaries required
MUCH more data generated (Terabases now, kilobases then)
Sophisticated BioInformatic programs exist to parse out the data - In some instances, can sequence a sample for around $40 MUCH cheaper than historical
Open source data sharing for massive datasetsCloud computing capabilityMORE DATACHEAPER PER BASEINTERNET MAKES COMMS AND ANALYSIS EASY
11
Methods
Choose the Right “Fit for Purpose”Tool for the Job

Pulse-Field Gel Electrophoresis (PFGE) “Gold Standard” of
bacterial DNA fingerprinting
Restriction enzymes cut bacterial DNA in specific locations
Multi-directional gel electrophoresis produces unique pattern based on the fragment sizes
Allows Comparisons between organisms for ID
Not quantitative $100-260

Polymerase Chain Reaction
Semi Quantitative (With a standard curve)Targets a region of genome for amplification
Positive reaction = gene is present
Can detect several target genes at once (Multiplex)Cheap! $5-10/reactionSeveral hours to run

Immunological MethodsELISALateral FlowCheap ($5-10)FastYes/No answers
ELISA can be quantitative

What is Whole Genome Sequencing? Whole Genome Sequencing is the term used for
extraction of DNA from an organism and the subsequent mapping of its genome.
The genetic code (AGCT) is read on an instrument and written into a digital file.
That digital file can be assembled (like a linear puzzle) to determine the order of the code in the organism.
Once you have the ordered code, you can analyze the data and make comparisons and data-driven decisions about the organism.
Not quantitative
$50/sequence – Up to $500 for assembly/closure (Bacteria)
15
YFB

What is 16S/Shotgun Metagenomics?
16S Sequencing on Next-Gen platforms follows a similar workflow, except that it targets a specific gene (16S Ribosomal RNA) used to identify bacteria
Metagenomics applies this concept to mixed consortia, resulting in a profile of bacteria abundance (e.g., your microbiome)
1. Sequence DNA2. Alignment to reference databases. Classifying
unknown bacteria in to taxonomic groups3. Visualize in phylogenetic trees, pie charts, or other
analyses based on question to be asked
POPULATIONS

NGS Benefits Over Other Methods Moving Forward?
NGS differentiation (resolution) is unmatchedWith high-throughput efficiencies, NGS is cheaper
and faster NGS enables much more in-depth data analysis, such
as functional genes and heredityCost will continue to decrease Database availability and power will continue to
increaseGlobal adoption and data sharing will increase value

18
Applications andExamples

Whole Genome SequencingWhat can I use it for?
EpidemiologyResistance Strain level IDAuthenticity
MUCH deeper look into genome than Pulse Field Gel Electrophoresis or RFLP Looking at every base, not just where enzymes
cut
YFB

Strain Level ID
Is there value in knowing who your resident strains are? Can you eradicate them more easily? Can you modify processes and
cleaning regimens?
Proactivity? Value in transparency and ownership?
Working toward a positive solution
Third Party sequencing Metadata housed by third party

Speciation of Campylobacter
Commensal bacteria on Chicken and other fowlInterventions can knock down numbers, but hard to completely eradicateThree strains under scrutiny
Jejuni
Coli
Lari

Food Pathogen ID – Off the Shelf
Isolate germs from off the shelf meatsAssay for pathogensWhole Genome Sequence for species
Common trends?
Food type
Geography
Intervention method
Preservation method

What is 16S/Shotgun Metagenomics?
16S Sequencing on Next-Gen platforms follows a similar workflow, except that it targets a specific gene (16S Ribosomal RNA) used to identify bacteria
Metagenomics applies this concept to mixed consortia, resulting in a profile of bacteria abundance (e.g., your microbiome)
1. Sequence DNA2. Alignment to reference databases. Classifying
unknown bacteria in to taxonomic groups3. Visualize in phylogenetic trees, pie charts, or other
analyses based on question to be asked
POPULATIONS

Irrigation Water MicrobiomeLooking at changes in water microbiome when E. coli present
Searching for markers of contamination
Almond Harvest Shaking trees to release fruit
Drying for a few days
Harvester
Hulling
Shelling
www.pinterest.com

Hospital MicrobiomeLooking at environment and patient colonization
Searching for correlations to understand flora
Proactive Treatment? Our microbiome protects us – keeps the bad players out
Antibiotics kill our normal flora
Probiotic treatment can prevent undesirable bugs from taking hold
Understanding what is out there allows decision making with more cards in your deck
www.pinterest.com
Epidemiology
Track and trace your strains Look for Single Nucleotide
Polymorphisms These changes happen in an
organism over time Differentiates one bacteria from
another
GenomeTrakr Application A Database of organisms that can
be mined to determine source and tracebackPublicly available!

Authenticity

Next Generation Sequencing – Friend!
Sequencing is the Future of Food Safety and Microbial Science
Not Scary! Just a way to get detailed information about the organism you are analyzing
Can use genomic info to understand Resistances
Phylogeny
Pathogenesis
Epidemiology
AuthenticityMake Data Driven Decisions Sensitivity – Better Decisions, Faster. Saves lives!

Next Generation Sequencing –The Technology and its Applications – Friend!
Jesse D. Miller, [email protected]
734.707.5413

Technology in the Food Safety World: Whole Genome Sequencing—friend or foe?
The Almond Conference Sacramento California
December 5, 2017
Maria Hoffmann, Ph.D.Genomics Research Microbiologist

31
Finished Product Processing Facility Farm
Ecologic ReservoirsImport LinesGlobal Point Source
Tracking contamination down…and FAST!
SAVES LIVES

32
Some perspective on the food supply
• Tracking and Tracing of food pathogens • Almost 200,000 registered food facilities (2/14)
• 81,574 Domestic and 115,753 Foreign• More than 300 ports of entry• More than 130,000 importers and more than 11
million import lines/year• In the US there are more than 2 million farms

33
The Complex Etiology of Foods
Shrimp – IndiaCilantro – MexicoRomaine – Salinas, CACheddar – WisconsinCarrots – IdahoGruyere – SwitzerlandPecans – GeorgiaSprouts – ChicagoRed Cabbage - NY
Shrimp – IndonesiaImitation Crab – AlaskaTuna Scrape – IndiaFish Roe – SeychellesSalmon – Puget SoundSoy Sauce – China Rice – ThailandSeaweed Wrap – CAAvocado – MexicoCucumber – MarylandWasabi – JapanPepper – Vietnam
Watermelon – DelawareBlackberries – GuatemalaBlueberries – New JerseyPineapple – GuamGrapes – CaliforniaKiwi – New ZealandApples – New YorkPears – OregonCantaloupe – Costa RicaHoneydew – ArizonaPapaya – MexicoBanana – Costa Rica
Salad Sushi Fruit platter

34
Gold standard method for pathogen identification
PFGE: banding patterns determine discrimination within serovar.
PulseNet, est. 1996http://www.cdc.gov/pulsenet/

35
• WGS is high resolution ∙3-5 million data points are collected for each isolate
• WGS analyses are statistically robust Unlike PFGE patterns, WGS data can be analyzed in its evolutionary context. Accurate and stable genetic changes within pathogen genomes enable us to pin point specific common sources of outbreak strains (farms, processing plants, food types, and geographic regions)
PFGE v/s WGS
36
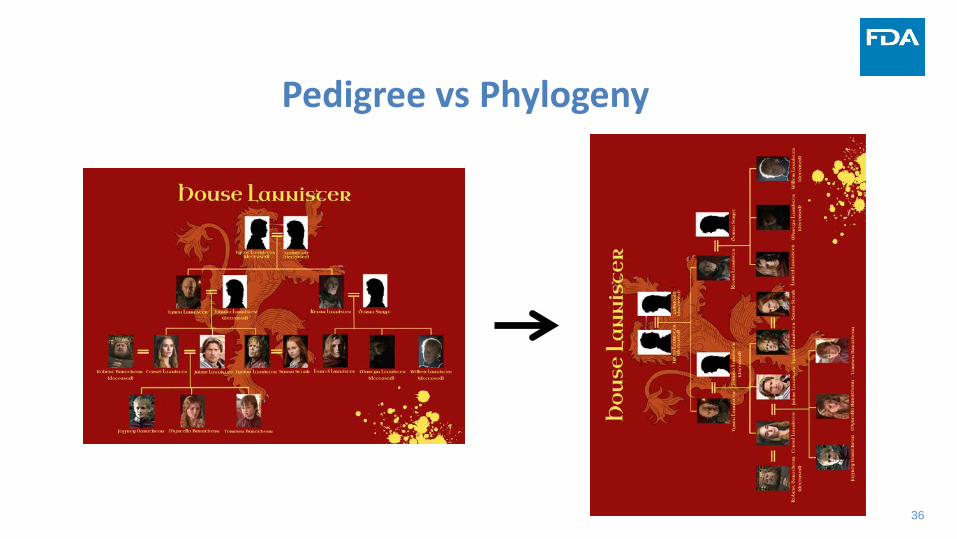
Pedigree vs Phylogeny
37
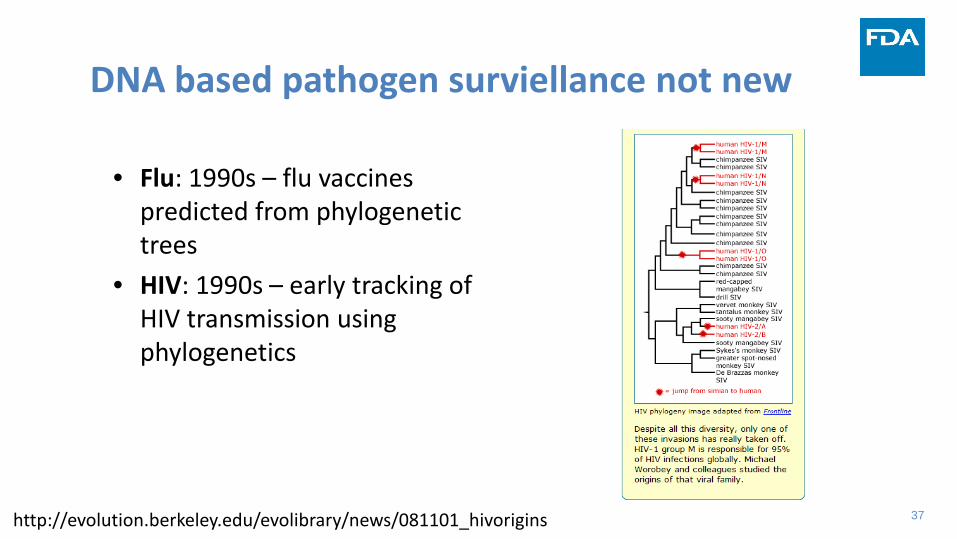
DNA based pathogen surviellance not new
• Flu: 1990s – flu vaccines predicted from phylogenetic trees
• HIV: 1990s – early tracking of HIV transmission using phylogenetics
http://evolution.berkeley.edu/evolibrary/news/081101_hivorigins

38
• CDC investigated a multistate (29 states) outbreak• 410 confirmed cases between January 1st and July 7th, 2012• Among the 326 case patient, 55 (17%) had been hospitalized • Yellowfin tuna was implicated as source of this outbreak• This product had been imported from an Indian corporation and was
used to make spicy tuna sushi for restaurants and grocery stores• At this time no reference genome
was available at NCBI
Salmonella enterica serovar Bareilly
39
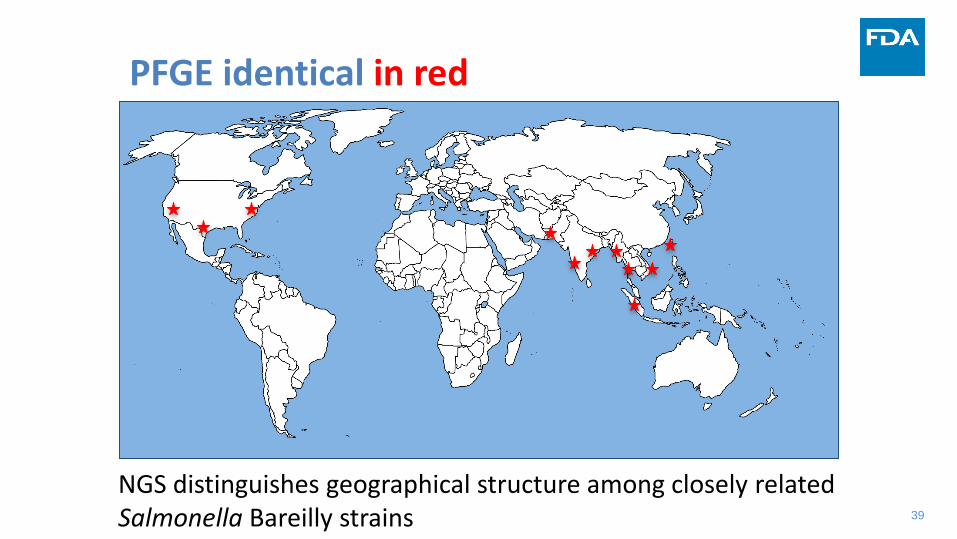
PFGE identical in red
NGS distinguishes geographical structure among closely related Salmonella Bareilly strains

40
11/1
7/10
Shel
l-on
Shrim
p Sr
i Lan
ka
01/1
4/10
Froz
en F
ish
Indi
a
12/0
6/04
Cru
shed
Chi
lis In
dia
10/1
9/07
Cor
iand
er P
owde
r Ind
ia
03/1
2/01
Raw
Shr
imp
Viet
nam
Envi
ronm
enta
l USA
09/1
8/08
Sand
Gob
y Fi
sh V
ietn
am
12/2
7/02
Froz
en S
hrim
p In
dia
11/1
3/09
Bab
glad
eshi
Fres
h W
ater
Fish
(Bac
ha) B
angl
ades
h
Clin
ical
MD
05/0
8/72
Feat
her M
eal U
SA
02/0
8/07
Froz
en B
aila
Bang
lade
sh
07
/12/
02 Fr
ozen
Und
evei
ned
Shrim
p In
dia
03/1
7/08
Cor
iand
er P
owde
r Ind
ia
04/2
2/05
Sesa
me
Seed
Ind
ia
05/0
9/07
Gin
ger P
owde
r Ind
ia
12/2
9/04
Froz
en S
hrim
p In
dia
06/0
1/09
Chi
li Po
wde
r Ind
ia
04/0
6/10
Fish
Sto
mac
h Vi
etna
m
09/1
7/03
Cor
iand
er P
owde
r Ind
ia
Clin
ical
MD
Envi
ronm
enta
l USA
1975
-07-
Frog
Legs
Unk
now
n
02/0
5/08
Khe
er M
ix P
akist
an
11/1
8/05
Cay
enne
Pep
per
Indi
a
08/0
8/05
Froz
en W
hole
Tila
pia
Thai
land
08/1
7/06
Lobs
ter T
ails
Taiw
an
05/0
2/72
Pou
ltry
Mea
l USA
1974
-08-
Non
fat D
ry M
ilk U
nkno
wn
05/1
4/09
Irrig
atio
n W
ater
USA
02/2
6/04
Froz
en R
aw P
eele
d Sh
rimp
Indi
a
ATCC
911
5
12/0
5/05
Froz
en R
ock
Lobs
ter T
ails
Uni
ted
Arab
Em
irate
s
07/0
6/05
Fres
h Ca
nalo
upe
USA
Envi
ronm
enta
l USA
07/0
9/01
Pab
da Fi
sh B
angl
ades
h
03/1
4/05
Cor
iand
er B
angl
ades
h
08/1
8/11
Coc
onut
Indi
a
06/2
6/00
Scal
lops
Indo
nesia
10/1
7/11
Pun
jabi
Che
ole
Spic
e In
dia
05/0
1/72
Pou
ltry
Feat
her M
eal U
SA
02/1
7/11
Red
Chi
li Po
wde
r Pak
istan
04/1
7/08
Fenn
el S
eeds
Uni
ted
Arab
Em
irate
s
07/3
0/01
Whi
sker
Fish
Vie
tnam
11/1
6/05
Hils
a Fi
sh T
haila
nd
09/0
8/08
Chi
li Po
wde
r Tha
iland
1109
/30/
10 Se
sam
e Se
eds I
ndia
11/0
8/02
Cum
in P
owde
r Ind
ia
03/2
7/02
Shrim
p In
dia
12/2
3/02
Froz
en R
aw E
som
us Sw
aiso
n W
hole
Vi
etna
m
10/1
2/01
Froz
en R
ohu
Rish
Indi
a
10/1
7/00
Shrim
p In
dia
09/0
9/10
Chi
li Po
wde
r Ind
ia
02/2
2/10
Gro
und
Red
Pepp
er U
SA
06/2
7/11
Org
anic
Bla
ck P
eppe
r Ind
ia
05/1
3/03
Froz
en R
aw S
hrim
p In
dia
03/0
1/06
Froz
en C
rab
with
Cla
ws
Sri L
anka
Clin
ical
NY
Clin
ical
NY
Clin
ical
MD
Clin
ical
NY
Clin
ical
MD
Clin
ical
NY
Clin
ical
NY
Clin
ical
MD
Clin
ical
NY
Clin
ical
NY
Clin
ical
MD
Clin
ical
NY
Clin
ical
NY
Clin
ical
NY
Clin
ical
NY
Clin
ical
NY
Clin
ical
NY
Clin
ical
NY
Clin
ical
MD
Clin
ical
MD
Clin
ical
NY
Clin
ical
MD
Clin
ical
NY
Clin
ical
NY
Clin
ical
NY
Clin
ical
NY
Clin
ical
NY
03/1
0/10
Cor
iand
er M
exic
o
08/0
1/06
Tur
mer
ic P
owde
r Ind
ia
Different PFGE than the outbreak pattern
Same PFGE but not part of the
outbreak
Outbreak IsolatesMD isolates – in greenNY isolates – in purple
41
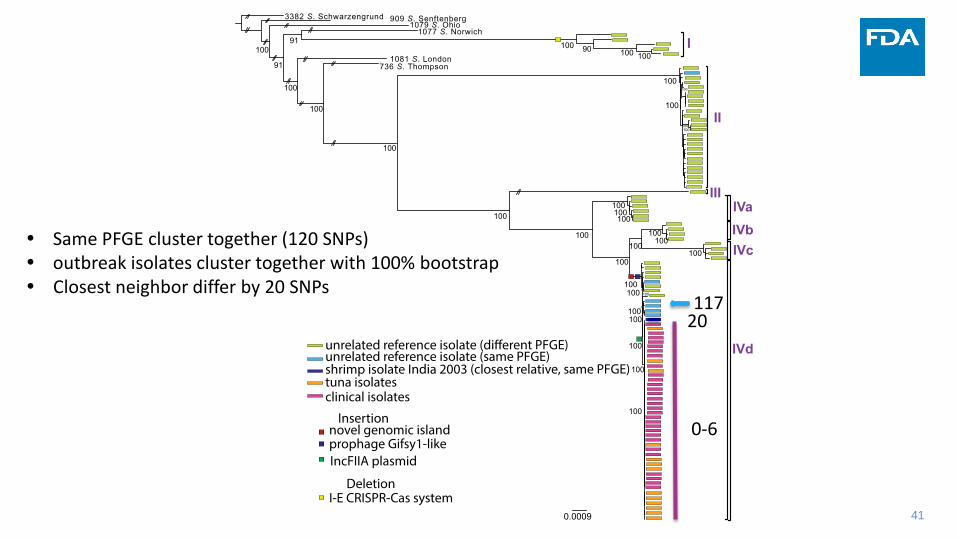
Same PFGE cluster together (120 SNPs) outbreak isolates cluster together with 100% bootstrap Closest neighbor differ by 20 SNPs
0-6
11720

42
2-part paradigm shift
1. Whole genome sequencing∙ High resolution data∙ Harness established field of evolutionary theory
for analyses1. Open data
∙ Raw genome sequences made available to the public 1-2 days after collection
∙ Data made public *before* FDA analyses are preformed

43
Why Develop a WGS Based Network?• Tracking and Tracing of food pathogens
• Insufficient resolution of current tools-matching clinical to environmental
• Faster identification of the food involved in the outbreak
• Limited number of investigators vs. facilities and import lines
• Global travel• Global food supply

45
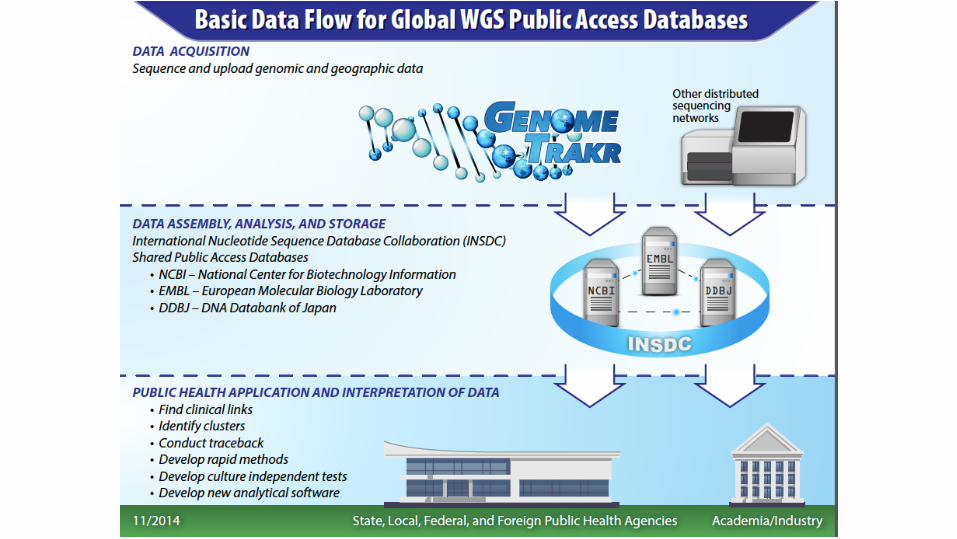
FDA’s GenomeTrakr• Distributed network of labs to use whole genome sequencing• Contributing members:
• 13 FDA labs• 11 PulseNet labs (state public health labs)• 5 Dept. of Agriculture labs• 7 University labs• 1 U.S. hospital lab• 2 international labs (Argentina, Mexico)• 3 private contracting labs
• Data curation and bioinformatic support/analyses provided by National Center for Biotechnology Information (NCBI) and FDA-CFSAN.

46
GenomeTrakr verses PulseNet?
clinicals -> PNfood/env -> GT
clinicals -> PNfood/env -> GT
NCBI

47
Database growth:Currently: over 150,000 genomes (all contributors)
48
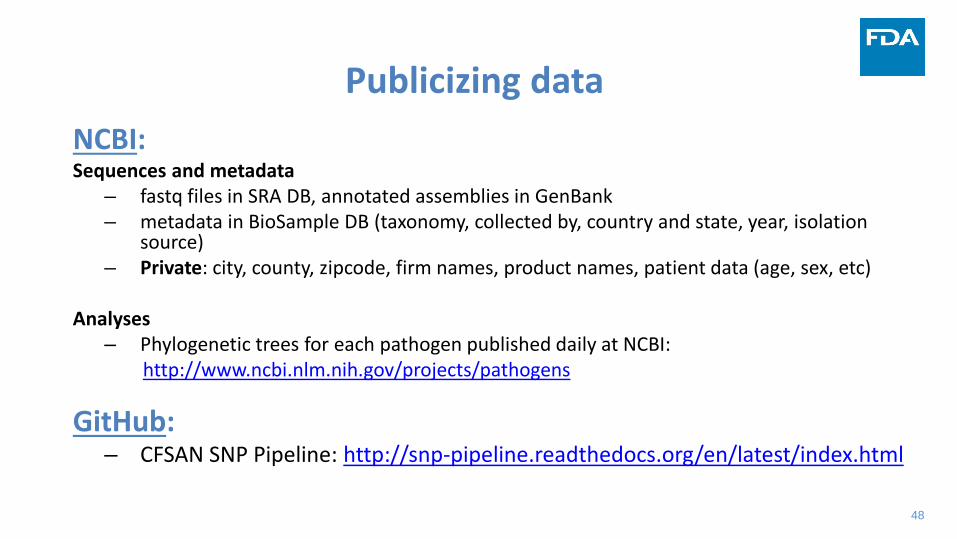
Publicizing dataNCBI:Sequences and metadata
– fastq files in SRA DB, annotated assemblies in GenBank– metadata in BioSample DB (taxonomy, collected by, country and state, year, isolation
source)– Private: city, county, zipcode, firm names, product names, patient data (age, sex, etc)
Analyses– Phylogenetic trees for each pathogen published daily at NCBI:
http://www.ncbi.nlm.nih.gov/projects/pathogens
GitHub:– CFSAN SNP Pipeline: http://snp-pipeline.readthedocs.org/en/latest/index.html
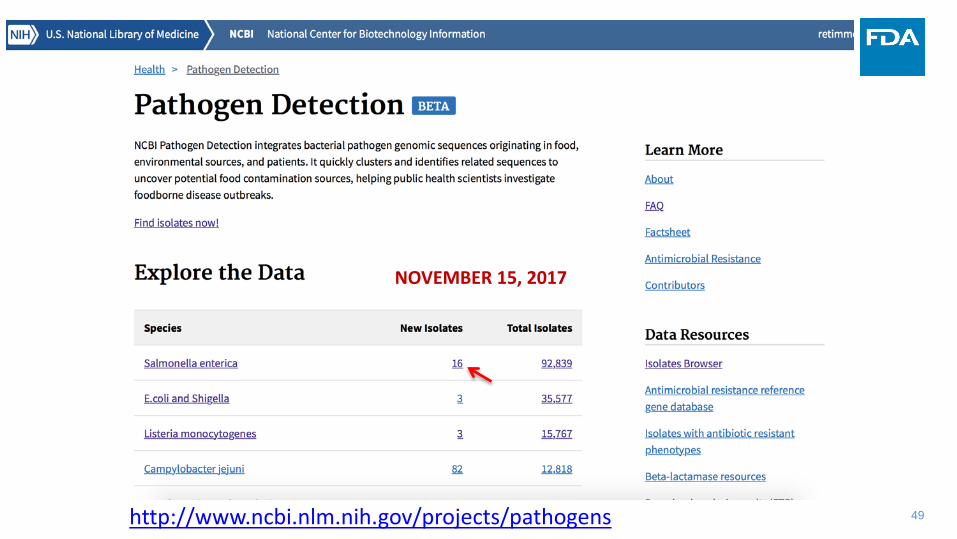
49http://www.ncbi.nlm.nih.gov/projects/pathogens
NOVEMBER 15, 2017

50
New isolate check - Salmonella
SNPs distance to same category
SNPs distance to different category

51
Look at close matches within SNP cluster
52
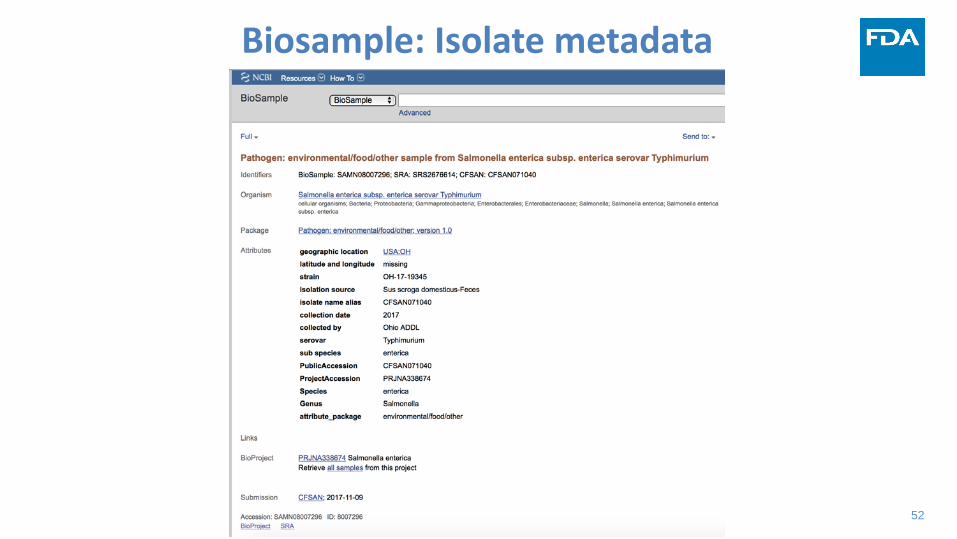
Biosample: Isolate metadata
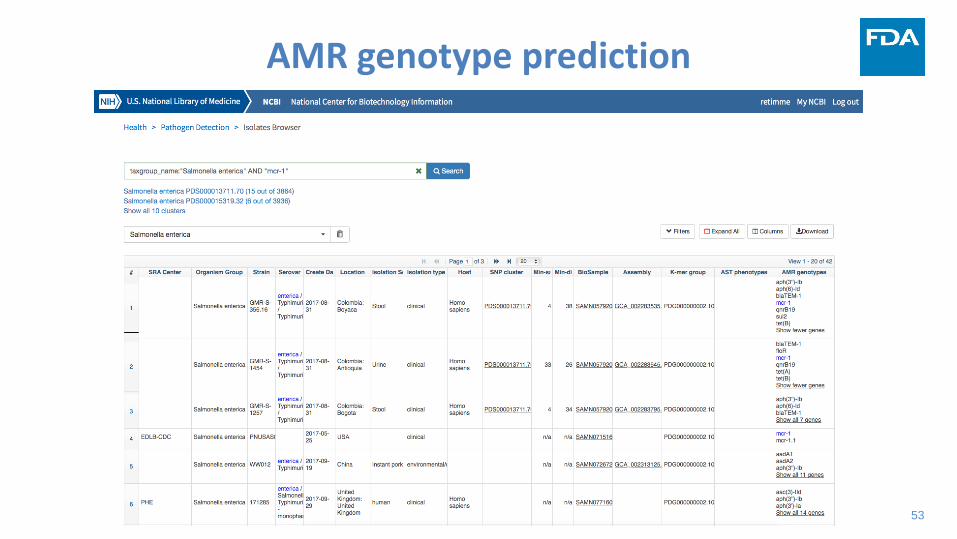
53
AMR genotype prediction

54
How do we use the GenomeTrakr information?• Identify SNP cluster of interest from NCBI• Download raw data AND run CFSAN SNP pipeline inhouse
• Run CFSAN SNP pipeline inhouse

55
What happens with a WGS link between a clinical and environmental sample?
• Likely result in the following steps:
(1) facility/farm inspection and sampling
(2) Pathogen positive samples are sequenced and
submitted to the database
(3) traceback/trace forward of raw materials and finished
product
(4) WGS is powerful tool that supports investigation

56
Salmonella Braenderup 2014 pre-outbreak
• In 2014, FDA conducted baseline environmental sampling in nut butter processing facilities
• A few of the samples tested positive for S. Braenderup and a PFGE pattern matched several cases of recent salmonellosis without a common link
• WGS was performed on both environmental and clinical isolates and found to be extremely close (2 SNP differences)
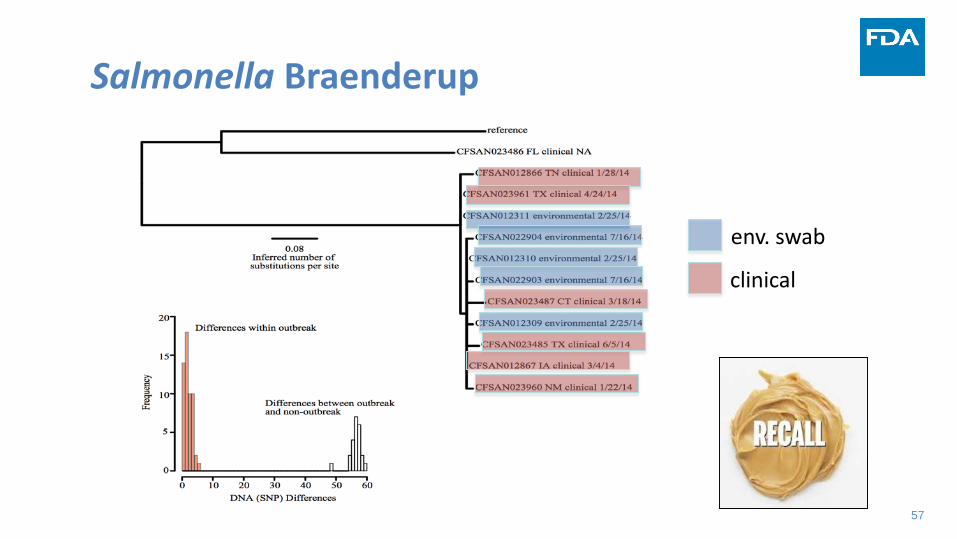
57
Salmonella Braenderup
env. swab
clinical

58
Comparing Traditional and Retrospective Outbreaks in Nut Butters
Salmonella Tennessee (Company A, Brand A Peanut Butter, 2006/2007): 715 cases, 129 hospitalizations, no deaths
Salmonella Typhimurium (Company B, Brand B Peanut butter, 2008/2009): 714 cases, 166 hospitalizations, 9 deaths
Salmonella Bredeney (Company C/Brand C Peanut butter, 2012): 42 cases, 10 hospitalizations, 0 deaths
Retrospective Outbreak InvestigationSalmonella Braenderup (Company D/Brand D nut butter, 2014):
6 cases, 1 hospitalization, no deaths
Traditional Outbreak Investigations

59
0
5
10
15
20
25
30
35
40
4 8 12 16 20 24 28 32 36 40 44 48 52 56 60 64 68
Timeline for Traditional Approach to Foodborne Illness Investigation
Contaminated foodenters commerce
Identify contaminated foodand confirm that product or
environmental samplePFGE pattern matches the clinical
sample pattern
Identify illnesses and get PFGE pattern from
clinical samples
Source of contaminationidentified too late to prevent most illnesses
CDC FDA/FSIS
Num
ber o
f Cas
es
Days

60
0
5
10
15
20
25
30
35
40
4 8 12 16 20 24 28 32 36 40 44 48 52 56 60 64 68
Timeline for Foodborne Illness InvestigationUsing Whole Genome Sequencing
Contaminated food enterscommerce
FDA, CDC, FSIS, and States use WGS in real-time and in parallel on clinical, food,
and environmental samples
Source of contaminationidentified early through WGS combined database queries
Averted Illnesses
Num
ber o
f Cas
es
Days

61
Immediate benefits of WGS to industry, growers, and distributers
• Earlier intervention means: 1) Reduced amount of recalled product; 2) fewer sick patients 3) less impact overall and minimal damage to brand
recognition.

62
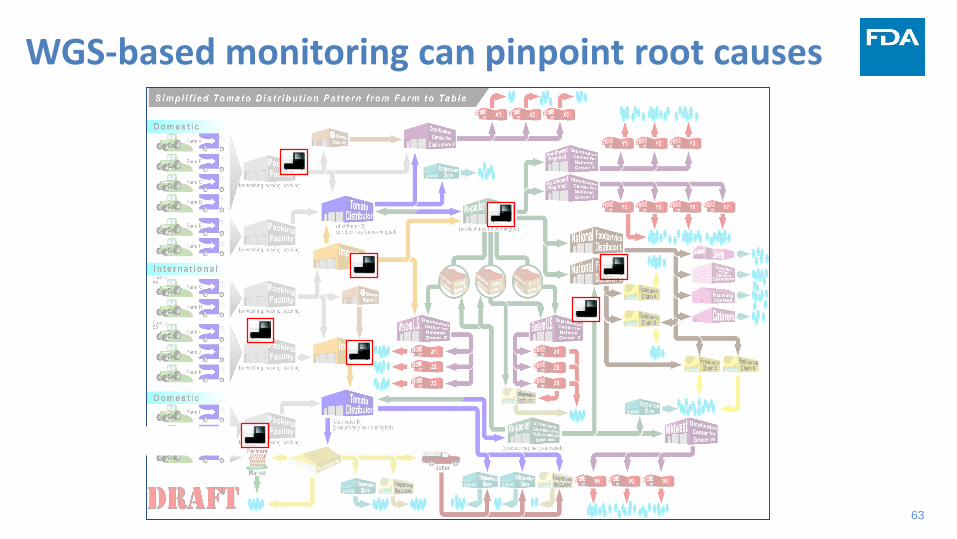
The Fresh-cut Tomato Supply Chain is complex
63
WGS-based monitoring can pinpoint root causes

64
Field 1
Field 2
Processing facility
Example 1
65
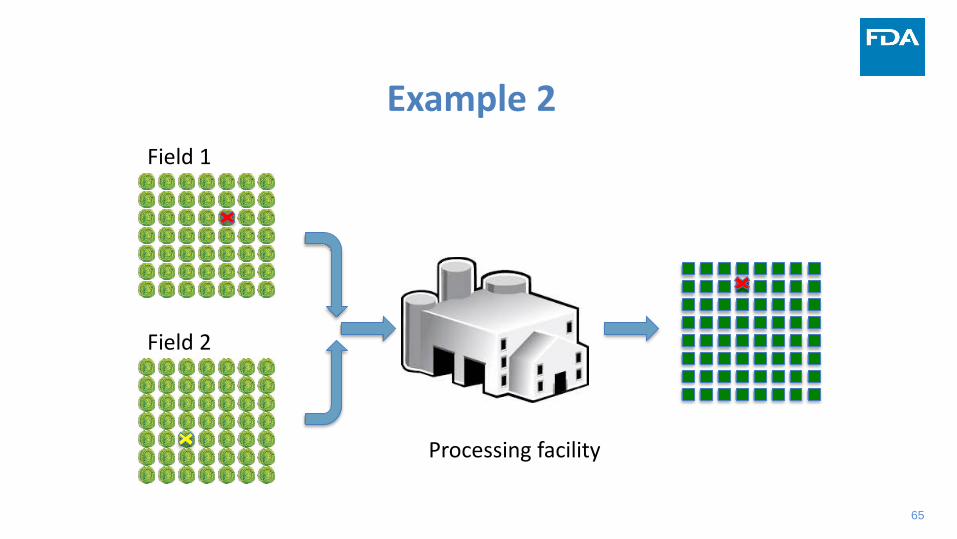
Field 1
Field 2
Processing facility
Example 2
66
• Regular testing throughout network: 1) identifies specific suppliers that are introducing contaminants; 2) identifies whether contaminant is resident to a facility or
transient; 3) knowledge of where contaminant is coming from allows
industry to fix the problem based on scientific evidence.•Shift costs to the supplier who has introduced the contaminant.•How often is the root cause of the problem left unresolved
to occur again at a later date?
Benefits to industry, growers, and distributers (continued)

67
One Data Record - Many Possibilities
…..AAGCTTGGAGATCTACGTGTACCTAGTCGAAGACTGAGGCTCTA….
SNP
Serotype
wgMLST
Markers
Virulence
Resistance (Disinfectant, Heat,Heavy metal…)
Ecological FitnessBiofilm persistence
UnknownAdaptation
68
Improving Food Safety1. Identify source of foodborne outbreaks more quickly
~ WGS provides an integrated food safety surveillance system ~ permits international capacity building through integration of foreign food safety entities into the GT network
2. Transparency of open data gives industry full access ~ Genome data made public in real-time~ Public software and analysis tools readily available to industry for viewing of results
3. Food Safety Modernization Act (2011) – preventive Controls, Improve Industry Practices
~ WGS compliments rapid testing methods with environmental monitoring for repeat positives and problems w/ resident pathogens.

69

70
Acknowledgements• FDA
• Center for Food Safety and Applied Nutrition• Center for Veterinary Medicine• Office of Regulatory Affairs
• State Health and University Labs• Alaska• Arizona• California• Florida• Hawaii• Maryland• Michigan• Minnesota• New Mexico• New York• North Carolina• Ohio• Penn State• South Dakota• Texas• Virginia• Washington
• National Institutes of Health• National Center for Biotechnology
Information
• USDA/FSIS• Eastern Laboratory
• CDC• Enteric Diseases Laboratory
CFSAN contributors:Eric BrownRuth TimmeErrol StrainMarc AllardJames PettengillYan YaoMaria Sanchez-Leon


Thank you!

Use #AlmondConf to be part of the
conversation on Facebook and

What’s NextTuesday, December 5 at 4:15 p.m.• State of the Industry – Hall C
Be sure to join us at 5:30 p.m. in Hall A+B for Dedicate Trade Show Time and Opening Reception, sponsored by The Bank of Stockton


