


Technical Report Documentation Page
1. Report No.
FHWA-NH-RD-12323W
2. Gov. Accession No.
3. Recipient's Catalog No.
4. Title and Subtitle 5. Report Date
September 8, 2012
Ground Vibrations Emanating from Construction Equipment 6. Performing Organization Code
7. Author(s)
Richard Lane and Krystle Pelham
8. Performing Organization Report No.
9. Performing Organization Name and Address
New Hampshire Department of Transportation Bureau of Materials & Research Box 483, 5 Hazen Drive Concord, New Hampshire 03302-0483
10. Work Unit No. (TRAIS)
11. Contract or Grant No.
12323W, SPR-0004(27)
12. Sponsoring Agency Name and Address
New Hampshire Department of Transportation Bureau of Materials & Research Box 483, 5 Hazen Drive Concord, New Hampshire 03302-0483
13. Type of Report and Period Covered
FINAL REPORT
14. Sponsoring Agency Code
15. Supplementary Notes
Prepared in cooperation with the U.S. Department of Transportation, Federal Highway Administration
16. Abstract
The recent trend in highway construction within New Hampshire has been toward reconstruction and rehabilitation projects in congested urban areas. This has resulted in a greater concern for vibrations generated by non-blasting construction activities, a greater potential for complaints, increased potential for damage, and increased need to monitor vibrations during the construction phase of projects. A procedure for assessing the potential impact of non-blasting construction-induced vibrations at a project site has been modeled after the “Rock Fall Hazard Rating System” as published in the Federal Highway Administration’s “Rock Slopes Reference Manual” (FHWA HI-99-007). An impact assessment of construction vibrations can consider each type of vibration producing activity and the potential impact that activity would have on man-made structures and/or vibration sensitive equipment that is in relevant proximity to the project site. A “Construction Vibration Impact Assessment Table” was developed, providing a means of rating the potential impact of a specific construction activity at a given site. This rating will allow comparison of a specific construction activity at different sites, or different construction activities at the same site. The “Construction Vibration Database” was created as part of this research project, with the intent of providing a means of recording information on various types of non-blasting construction vibration activities. It is intended that this database will be continually updated with data submitted by both in-house resources and by vibration consultant subcontractors working on NHDOT projects. This database will provide designers with a means of accessing empirical data to be used for forecasting expected vibration impacts on upcoming construction projects. The “Construction Vibration Assessment Procedure” and “Construction Vibration Database” can be used to develop a preliminary cost estimate for vibration monitoring services and as a resource for decision-making during the design and construction phases of NHDOT projects. Information was collected on a variety of non-blasting construction activities to include vibratory compaction, excavation, splitting of rock with a hoe-ram, sheet pile driving, pavement breaking, demolition, track mounted vehicles and heavy construction traffic at various project sites throughout the state.
17. Key Words
Vibration, Vibration test, Vibratory equipment, Construction management, Evaluation and assessment,
18. Distribution Statement
No Restrictions. This document is available to the public through the National Technical Information Service (NTIS), Springfield, Virginia, 22161
19. Security Classif. (of this report)
UNCLASSIFIED
20. Security Classif. (of this page)
UNCLASSIFIED
21. No. of Pages
68
22. Price

DISCLAIMER
This document is disseminated under the sponsorship of the New Hampshire Department
of Transportation (NHDOT) and the U.S. Department of Transportation Federal Highway
Administration (FHWA) in the interest of information exchange. The NHDOT and
FHWA assume no liability for the use of information contained in this report. The
document does not constitute a standard, specification, or regulation.
ACKNOWLEDGEMENTS
The authors would like to thank Stephen Detrio who developed the computer program for
the construction database and Marc Fish who assisted in some of the data collection.

Ground Vibrations Emanating from Construction Equipment
By
Richard M. Lane, PG, CPG
Engineering Geologist
New Hampshire Department of Transportation
Bureau of Materials and Research
Box 483
5 Hazen Drive
Concord, New Hampshire 03302-0483
Phone (603) 271-3151
Fax (603) 271-8700
E-mail:[email protected]
Krystle Pelham
Research Geologist
New Hampshire Department of Transportation
Bureau of Materials and Research
Box 483
5 Hazen Drive
Concord, New Hampshire 03302-0483
Phone (603) 271-3151
Fax (603) 271-8700
E-mail:[email protected]
September 8, 2012

Table of Contents
EXECUTIVE SUMMARY ................................................................................................ 3
INTRODUCTION .............................................................................................................. 4
OBJECTIVES ..................................................................................................................... 6
BACKGROUND ................................................................................................................ 6
METHODOLOGY ............................................................................................................. 7
RESULTS AND DISCUSSION ......................................................................................... 8
DEVELOPMENT OF A “CONSTRUCTION VIBRATION DATABASE” .................. 15
DEVELOPMENT OF PROCEDURES FOR CONSTRUCTION VIBRATION
ASSESSMENTS AND ESTIMATING VIBRATION MONITORING SERVICES ...... 17
LIMITATIONS ................................................................................................................. 18
REDUCTION OF CONSTRUCTION VIBRATIONS .................................................... 19
CONCLUSIONS AND RECOMMENDATIONS ........................................................... 20
IMPLEMENTATION PLAN ........................................................................................... 21
REFERENCE LIST .......................................................................................................... 23
APPENDIX A - CONSTRUCTION VIBRATION IMPACT ASSESSMENT TABLE . 27
Explanation of Categories for Construction Vibration Impact Assessment ................. 29
APPENDIX B – METHOD FOR ESTIMATING HOURS FOR VIBRATION
SERVICES ........................................................................................................................ 33
Method for Estimating the Hours for Vibrations Services ........................................... 34
Example: Practical Exercise for Estimating Vibration Monitoring Service Hours ..... 35
APPENDIX C - CONSTRUCTION VIBRATION REPORT FORM ............................. 39
APPENDIX D - VIBRATION LEVELS FOR CONSTRUCTION ACTIVITIES .......... 43
Vibration Source Levels for Construction Equipment from the FTA, 2006 Manual on
Transit Noise and Vibration Assessment ...................................................................... 44
2006 Construction Period Vibration Levels vs. Distance from Source for The Preferred
Alternative (in dBA) ..................................................................................................... 44
Vibration Levels Due to Construction Equipment and Traffic at 30M (99 ft) ............. 45
Readings Compiled from Study of Vibrations due to Construction Activities on
Haleakala....................................................................................................................... 45
Approximate Generated Vibration Levels for Various Sources ................................... 46

2
Measured Vibration Parameters for Selected Sources .................................................. 47
NHDOT Modified Formula .......................................................................................... 47
NHDOT Vibration Levels for Construction Activities ................................................. 48
Predicted Peak Particle Velocity on NHDOT Projects ................................................. 48
APPENDIX E - CONSTRUCTION VIBRATION DATABASE USER’S GUIDE........ 49
List of Figures
Figure 1 - Vibration Level Blasting Criteria for Residential Structures from OSM, RI
8507, 1980................................................................................................... 4
Figure 2 - GeoSonics SSU 3000 EZ Seismograph ............................................................. 7 Figure 3 - Vibratory roller compacting base course material ............................................. 8
Figure 4 - Pile driving ......................................................................................................... 8
Figure 5 - Pavement breaker for rubblizing concrete ......................................................... 9 Figure 6 - Vibrating foot on pavement breaker .................................................................. 9 Figure 7 - Hoe-ram breaking up rock ............................................................................... 10
Figure 8 - Construction truck loaded with rock on haul road ........................................... 10 Figure 9 - Bulldozer on rock fill ....................................................................................... 11
Figure 10 - Human Reaction and Effect on Buildings at Different Levels of Continuous
Vibrations (A Survey of Traffic-induced Vibrations, 1971) .................... 12 Figure 11 - Typical Levels of Ground-Borne Vibrations from Transit Noise and Vibration
(Federal Transit Administration, 2006) .................................................... 13 Figure 12 - Typical Vibration Sources and Sensitivities, (Nugent & Amick, 1992) ........ 14
Figure 13 - Construction Vibrations as a Function of Distance, (Wiss, 1981) ................. 15 Figure 14 - Track mounted excavator on pavement ......................................................... 20
Figure 15 - Construction Vibration Impact Assessment Table ......................................... 28


3
EXECUTIVE SUMMARY
The recent trend in highway construction within New Hampshire has been toward
reconstruction and rehabilitation projects in congested urban areas. This has resulted in a
greater concern for vibrations generated by non-blasting construction activities, a greater
potential for complaints, increased potential for damage, and increased need to monitor
vibrations during the construction phase of projects.
A procedure for assessing the potential impact of construction-induced vibrations at a
project site has been modeled after the “Rock Fall Hazard Rating System” (RHRS), as
published in the Federal Highway Administration’s “Rock Slopes Reference Manual”
(FHWA HI-99-007). The RHRS, developed by Pierson et al. (1990), has a rating criteria
and scores for various categories of existing conditions with scores that increase
exponentially from 3 to 81 points. The “Construction Vibration Assessment Process”
utilizes a similar formula.
The “Construction Vibration Assessment Process” can be used to consider each type of
vibration producing activity and evaluate the impact that activity would have on man-
made structures and/or vibration sensitive equipment that is in relevant proximity to the
project site. A “Construction Vibration Impact Assessment Table” (Appendix A, Table
1) was also developed, providing a means of rating the potential impact of a specific
construction activity at a given site. This rating will allow comparison of a specific
construction activity at different sites, or different construction activities at the same site.
In addition, the “Construction Vibration Database” was developed. It is intended that
information on various types of non-blasting construction vibration activities will be
collected, stored, and tracked in this database. As part of this research project,
information has been collected on a variety of non-blasting construction activities
including vibratory compaction, excavation and splitting of rock with a hoe-ram, sheet
pile driving, pavement breaking, demolition, track mounted vehicles, and heavy
construction traffic at various project sites throughout the state. It is intended that this
database will provide designers with a means of accessing empirical data to be used in
predicting expected vibration impacts on upcoming construction projects.
The “Construction Vibration Assessment Process” and “Construction Vibration
Database” can be used to develop a preliminary cost estimate for vibration monitoring
services and as a resource for decision-making during the design and construction phases
of NHDOT projects.

4
INTRODUCTION
Energy from construction activities is transmitted into the ground and radiates out from
the source of the energy in the form of stress waves. These waves move through the
ground similarly to how waves move through a body of water. The potential effects from
vibrations produced by the stress waves moving through the ground can include damage
to structures, settlement of loose soils, liquefaction of sensitive soils, interference with
sensitive equipment/processes, and annoyance of people. Therefore, it is important to
accurately measure the ground motion (vibrations), to develop a vibration prediction
model for a given site and construction activity, and to develop a site-specific plan for
minimizing the construction vibrations. The combined effect of topography and
underlying geology results in a unique vibration pattern at every site (Nutting, 1990).
In 1980, the U.S. Bureau of Mines (USBM) established frequency-based limits on blast-
induced vibrations for building structures (Siskind, 1980). Although these limits (refer to
Figure 1) are known to be conservative, most government agencies have based their
regulations and guidelines for other vibration producing construction activities on the
USBM blasting study (Oriard, 2002). In general, high explosives transfer greater
amounts of energy into the ground than that generated by other types of construction
activities. The methods for predicting the vibrations generated by blasting activities are
well established and supported by numerous studies. With the exception of variations in
the geology and subsurface conditions, vibrations from blasting can often be predicted
with reasonable accuracy.
Figure 1 - Vibration Level Blasting Criteria for Residential Structures from OSM, RI 8507, 1980

5
At present, there are no methods that can consistently and accurately predict vibrations
generated by all types of construction activities. The vibrations produced by construction
activities (i.e. vibratory rollers, pile driving, pavement breakers, heavy construction
equipment, dynamic compaction, track mounted equipment, etc.) are affected by
numerous variables. The variety of construction equipment and procedures make it
difficult to group construction activities by the expected intensity of vibrations (Oriard,
2002). A better approach is to group equipment types and activities by the method in
which the energy is transferred to the ground. There are four mechanisms for transferring
energy (Dowding, 1997) (Oriard, 2002):
Impulse – pavement breaker, blasting with explosives, dynamic compaction, drop ball,
impact pile driving, etc.
Reciprocating – vibratory roller, vibratory pile drivers, compressors, etc.
Rotating – trenchers, tunnel boring machines, etc.
Rolling – trucks, trains, off-road haulers, etc.
It is common practice to measure construction vibrations as velocity vs. time or peak
particle velocity (PPV). The velocity in the soil at a specified distance and direction
away from the vibration producing activity depends on the type of vibration (impact,
steady state, pseudo-steady state, etc.), the mechanism for transferring the energy, the
type of equipment, the equipment’s horsepower, the quantity of energy input, and the
underlying geology (Wiss, 1981) (Dowding, 1996). The intensity of the construction
vibrations and how those vibrations are transmitted throughout a site will depend on the
type of construction activity, the distance from the energy source, and the type of soil
medium between the source and receiver. The geology and subsurface conditions can
vary significantly within the limits of a construction site. This often results in a variation
in the measured vibrations at the same distance, but different direction from an energy
source. Studies conducted by Forsbald (1974), and Steinberg and Lukas (1984) show
that the difference between a loose and stiff soil can affect particle velocities by five to
seven fold. Groundwater and major structural features in the bedrock (i.e. faults, joints,
etc.) can significantly affect the vibration intensity and can cause directional focusing of
vibration energy at a site. All of these factors, along with the duration of the construction
activity; type, age and condition of nearby manmade structures; sensitivity of equipment
and manufacturing processes; and the makeup of the surrounding population must be
considered in determining the potential impact of construction vibrations at a site.
Assessing the potential impact of a construction activity at a site by the type of vibration
generated may be more appropriate. There are two basic types of vibrations generated by
construction activities. The first type is “continuous vibration” generated by equipment
or activities that typically transmit lower levels of energy over longer periods of time
(Jones, 2004). Examples of this type of vibration are:
Excavation equipment
Static compaction equipment
Track mounted equipment
Traffic on roads or haul roads
Vibratory pile drivers
Pile-extraction equipment
Vibratory compaction equipment
6
The second vibration type is “transient vibrations”, which are single-impact or low-rate
impact vibrations generated by construction activities that often transmit high levels of
energy (Jones, 2004). Examples of this type of vibration are:
Impact pile drivers
Dynamic compaction
Blasting (not included in this study)
Drop balls
Some construction equipment and activities, such as pavement breakers, hoe-rams and
jackhammers produce a third type of vibration involving “high-rate repeated impact”
(Jones 2004).
All three types of vibrations can cause problems and provoke complaints. People are
normally more sensitive to continuous vibrations than to transient vibrations. Therefore,
in some circumstances they may be more tolerant of higher levels of transient vibrations.
There is a greater potential for complaints the longer the duration of the vibration
producing activity.
OBJECTIVES
The objectives of this research study are as follows:
1. Provide a method for assessing the potential level of impact from vibrations
generated by a proposed construction activity at a specified site.
2. Establish a database of ground vibrations emanating from various construction
activities that could serve as a tool for decision making during the design and
construction phases of NHDOT projects.
3. Provide guidelines for estimating hours and cost of vibration services, as
described in Section 211 of the NHDOT “Standard Specifications for Road and
Bridge Construction”, for proposed construction projects.
4. Identify the types of equipment and construction activities that could cause
damaging vibrations or complaints.
The methods developed for assessing potential impact of construction vibrations and for
quantifying vibration services should be reviewed periodically and further refined over
time.
BACKGROUND
The trend in highway construction work within New Hampshire has been toward a
greater percentage of reconstruction and rehabilitation projects in more congested urban
areas. This has resulted in a greater concern for vibrations generated by construction
activities, a greater potential for complaints, an increased potential for damage and an
increased need to monitor vibrations during the construction phase of projects. The large
number of variables and unknowns at each site make it difficult to estimate the level of
vibration monitoring services needed for a proposed project. There have been no
established guidelines for assessing the potential impact of vibrations generated by

7
construction activities on NHDOT projects. There has been no consistency in how
specifications have been applied, no analysis of past vibration data and no attempt to
determine reasonable limits based on potential risk factors at a site. A more standardized
approach could potentially save money and make more effective use of limited resources.
METHODOLOGY
Data utilized in this research study comes from published information, data collected by
consultants working on NHDOT construction projects, and vibration monitoring by the
Bureau of Materials & Research on a variety of construction activities. The equipment
used by the NHDOT for monitoring in-house construction vibrations was a GeoSonics
SSU 3000 EZ+ seismograph (Figure 2) and two SSU Micros II seismographs. The SSU
3000 EZ+ unit has a seismic range of 5.120 in/sec, a frequency response range of 2-
250Hz (3dB) and 2-1000 Hz (Nyquist), a sampling rate up to 2000/sec/channel, and a
record time of 1 to 15 seconds. In histogram mode the recording intervals are 1, 2, 5, 10,
15, 30, and 60 seconds. The seismographs measure the three mutually perpendicular
components of particle velocity in directions vertical, radial, and perpendicular to the
vibration source. The equipment measures the corresponding frequency of the maximum
peak particle velocity for each of the mutually perpendicular components. Seismograph
equipment utilized by consultants on NHDOT projects had similar capabilities. NHDOT
specifications require that all vibration monitoring instrumentation used on its projects be
calibrated within the last 12 months and the calibration must be performed to a standard
traceable to the National Institute of Standards and Technology. The NHDOT
seismographs were calibrated annually. All vibration monitoring data was analyzed for
peak particle ground vibrations (in/sec) and frequency (Hz). Whenever possible the
ground vibrations were monitored over a range of distances from the source of the
vibrations and subsurface conditions at the site were verified by referencing geotechnical
reports.
Figure 2 - GeoSonics SSU 3000 EZ Seismograph
8
RESULTS AND DISCUSSION
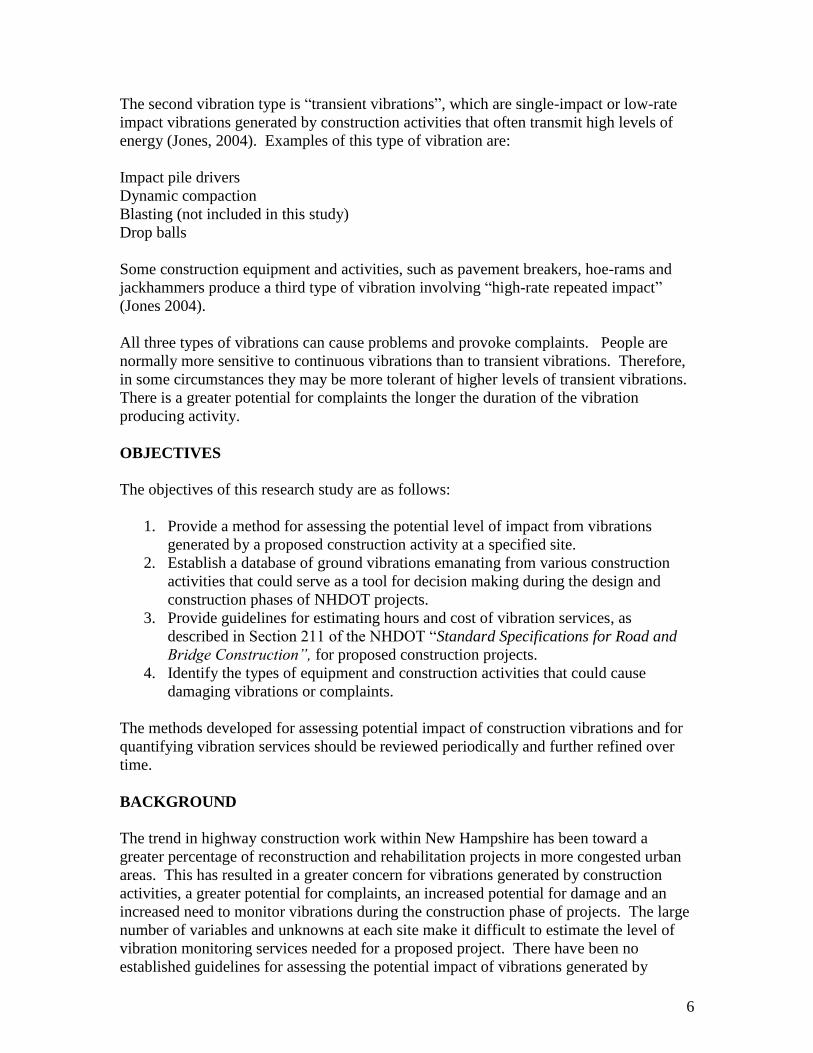
Information was collected on a variety of construction activities including vibratory
compaction (Figure 3), excavation, sheet pile driving (Figure 4), pavement breaking
(Figures 5 and 6), splitting of rock with a hoe-ram (Figure 7), demolition, heavy
construction traffic (Figure 8), and track mounted vehicles (Figure 9) at various project
sites throughout the state. The construction activities that often generate the greatest
number of complaints on NHDOT projects are vibratory compaction (continuous
vibration) and impact pile driving (transient vibration). This may be due in a large part to
the fact that these activities occur regularly on NHDOT projects, while other high level
vibration producing construction activities occur less frequently. Although these
activities sometimes generated complaints, there were no documented cases where
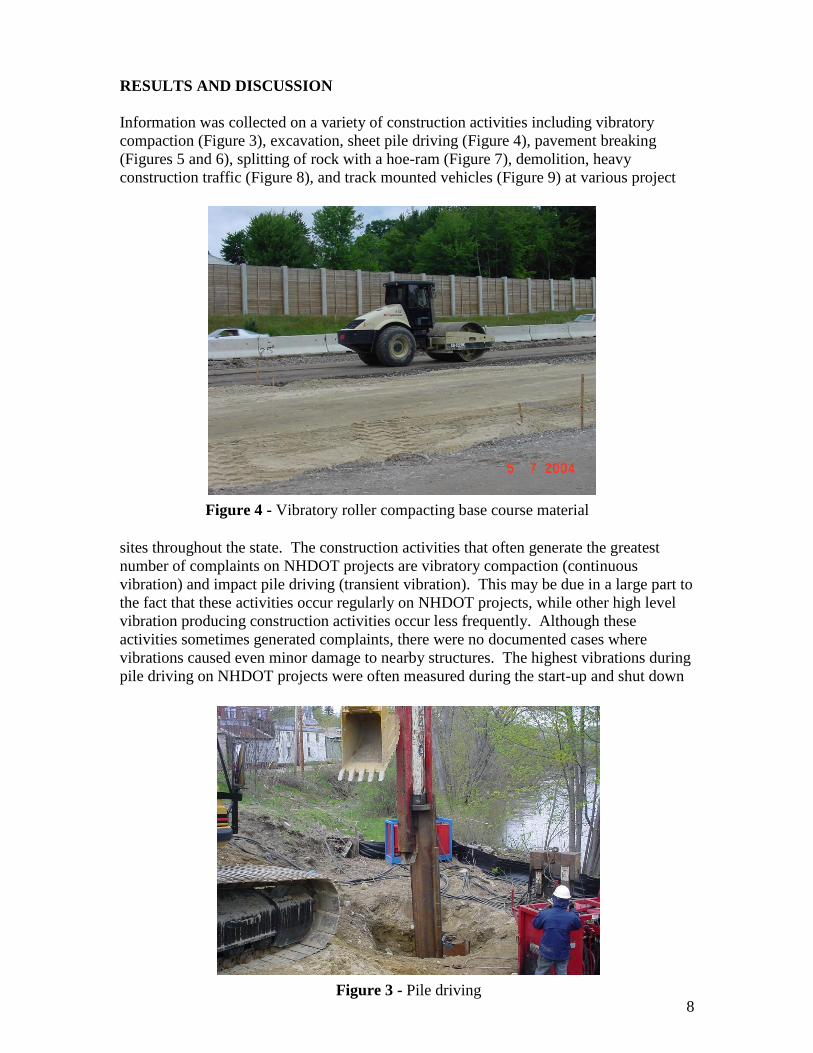
vibrations caused even minor damage to nearby structures. The highest vibrations during
pile driving on NHDOT projects were often measured during the start-up and shut down
Figure 4 - Vibratory roller compacting base course material
Figure 3 - Pile driving
9
of pile driving equipment. This is consistent with observations and measurements made
by others (Woods, 1997). In addition, higher vibrations were sometimes measured
during the extraction of piles compared to the driving of piles. The highest vibrations for
vibratory compaction were often measured when the vibratory roller quickly changed
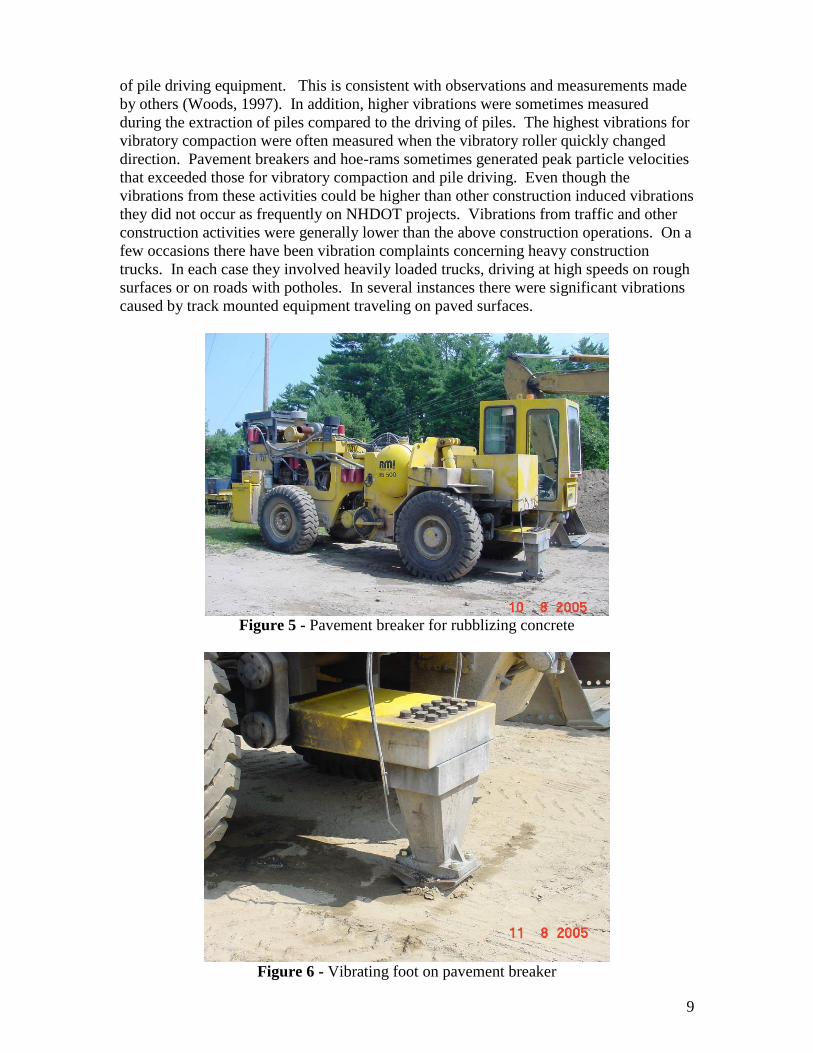
direction. Pavement breakers and hoe-rams sometimes generated peak particle velocities
that exceeded those for vibratory compaction and pile driving. Even though the
vibrations from these activities could be higher than other construction induced vibrations
they did not occur as frequently on NHDOT projects. Vibrations from traffic and other
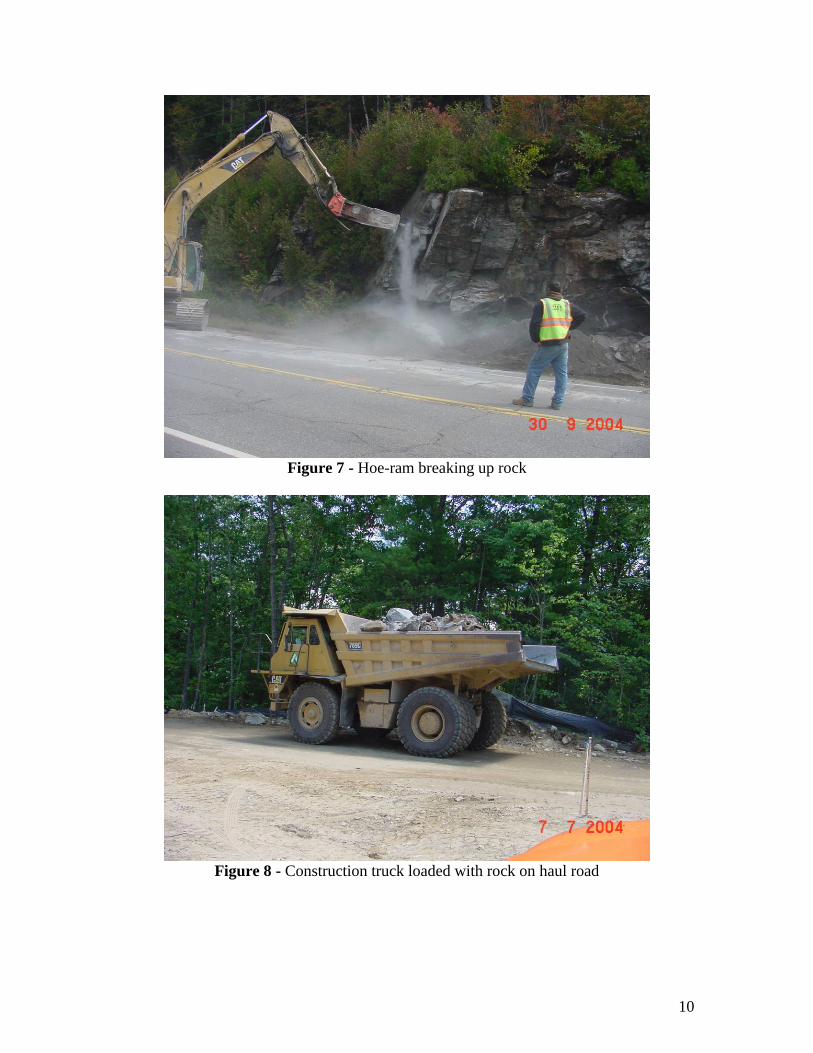
construction activities were generally lower than the above construction operations. On a
few occasions there have been vibration complaints concerning heavy construction
trucks. In each case they involved heavily loaded trucks, driving at high speeds on rough
surfaces or on roads with potholes. In several instances there were significant vibrations
caused by track mounted equipment traveling on paved surfaces.
Figure 5 - Pavement breaker for rubblizing concrete
Figure 6 - Vibrating foot on pavement breaker
10
Figure 7 - Hoe-ram breaking up rock
Figure 8 - Construction truck loaded with rock on haul road
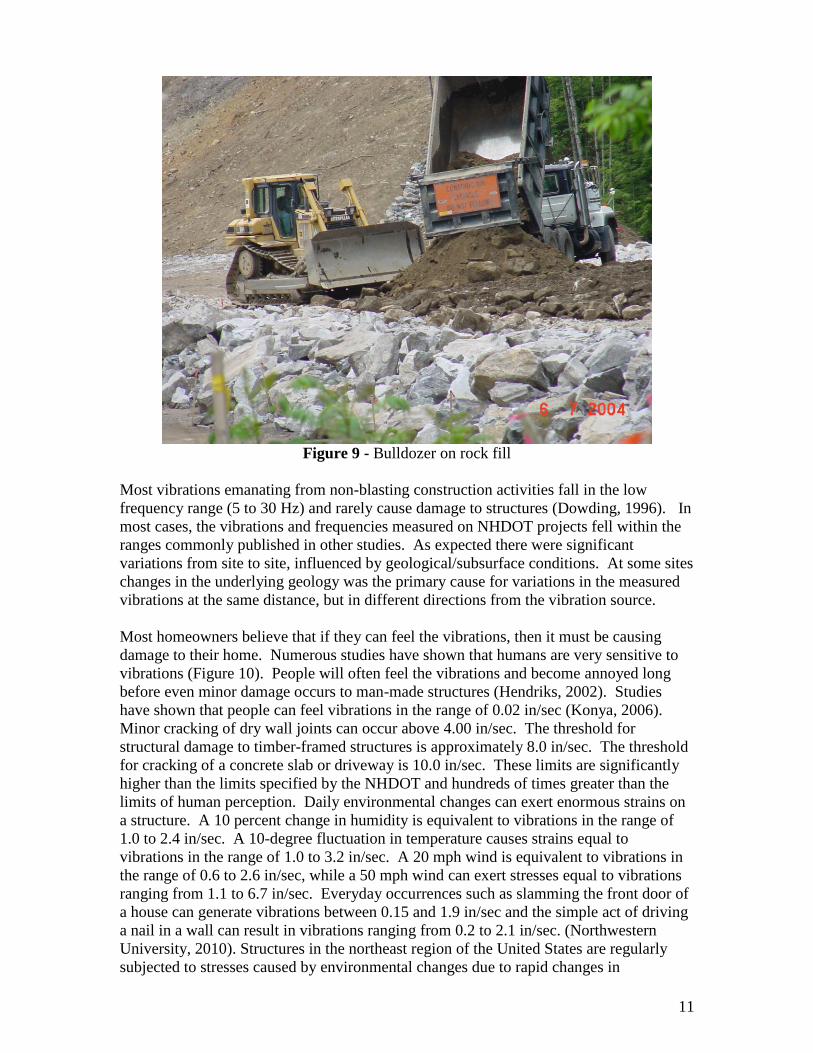
11
Figure 9 - Bulldozer on rock fill
Most vibrations emanating from non-blasting construction activities fall in the low
frequency range (5 to 30 Hz) and rarely cause damage to structures (Dowding, 1996). In
most cases, the vibrations and frequencies measured on NHDOT projects fell within the
ranges commonly published in other studies. As expected there were significant
variations from site to site, influenced by geological/subsurface conditions. At some sites
changes in the underlying geology was the primary cause for variations in the measured
vibrations at the same distance, but in different directions from the vibration source.
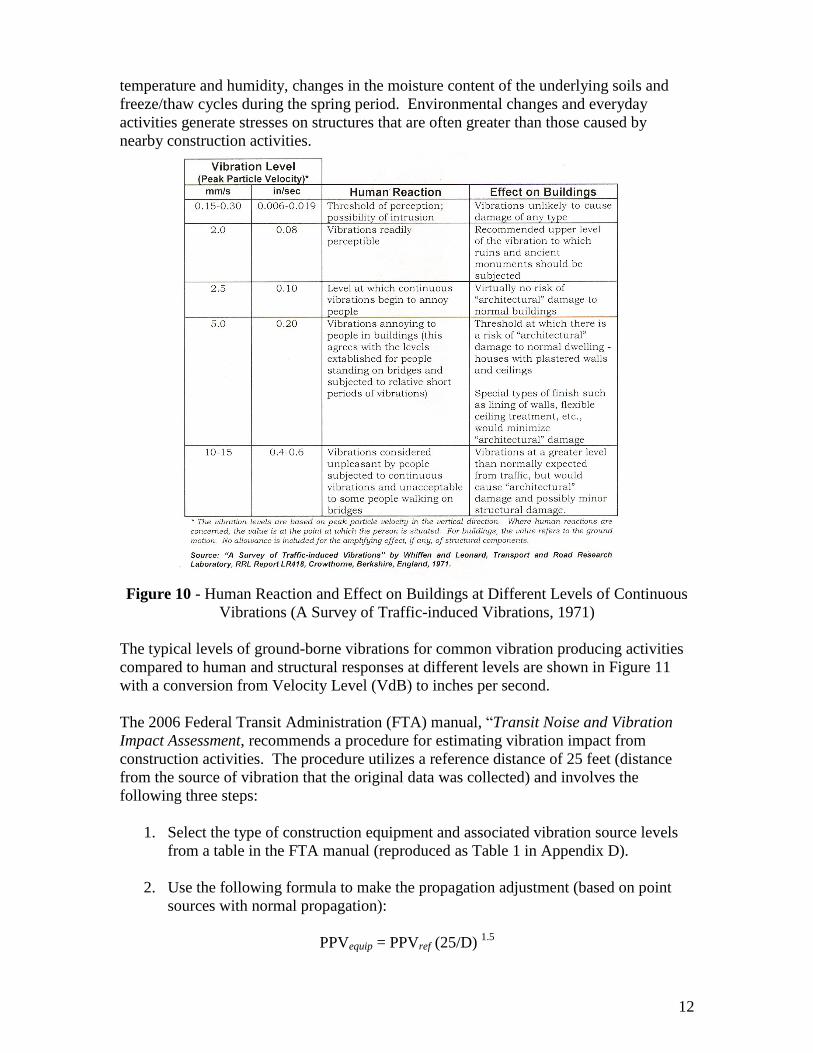
Most homeowners believe that if they can feel the vibrations, then it must be causing
damage to their home. Numerous studies have shown that humans are very sensitive to
vibrations (Figure 10). People will often feel the vibrations and become annoyed long
before even minor damage occurs to man-made structures (Hendriks, 2002). Studies
have shown that people can feel vibrations in the range of 0.02 in/sec (Konya, 2006).
Minor cracking of dry wall joints can occur above 4.00 in/sec. The threshold for
structural damage to timber-framed structures is approximately 8.0 in/sec. The threshold
for cracking of a concrete slab or driveway is 10.0 in/sec. These limits are significantly
higher than the limits specified by the NHDOT and hundreds of times greater than the
limits of human perception. Daily environmental changes can exert enormous strains on
a structure. A 10 percent change in humidity is equivalent to vibrations in the range of
1.0 to 2.4 in/sec. A 10-degree fluctuation in temperature causes strains equal to
vibrations in the range of 1.0 to 3.2 in/sec. A 20 mph wind is equivalent to vibrations in
the range of 0.6 to 2.6 in/sec, while a 50 mph wind can exert stresses equal to vibrations
ranging from 1.1 to 6.7 in/sec. Everyday occurrences such as slamming the front door of
a house can generate vibrations between 0.15 and 1.9 in/sec and the simple act of driving
a nail in a wall can result in vibrations ranging from 0.2 to 2.1 in/sec. (Northwestern
University, 2010). Structures in the northeast region of the United States are regularly
subjected to stresses caused by environmental changes due to rapid changes in
12
temperature and humidity, changes in the moisture content of the underlying soils and
freeze/thaw cycles during the spring period. Environmental changes and everyday
activities generate stresses on structures that are often greater than those caused by
nearby construction activities.
Figure 10 - Human Reaction and Effect on Buildings at Different Levels of Continuous
Vibrations (A Survey of Traffic-induced Vibrations, 1971)
The typical levels of ground-borne vibrations for common vibration producing activities
compared to human and structural responses at different levels are shown in Figure 11
with a conversion from Velocity Level (VdB) to inches per second.
The 2006 Federal Transit Administration (FTA) manual, “Transit Noise and Vibration
Impact Assessment, recommends a procedure for estimating vibration impact from
construction activities. The procedure utilizes a reference distance of 25 feet (distance
from the source of vibration that the original data was collected) and involves the
following three steps:
1. Select the type of construction equipment and associated vibration source levels
from a table in the FTA manual (reproduced as Table 1 in Appendix D).
2. Use the following formula to make the propagation adjustment (based on point
sources with normal propagation):
PPVequip = PPVref (25/D) 1.5

13
Where:
PPVequip is the peak particle velocity (in/sec) of the equipment adjusted
for distance
PPVref is the reference peak particle velocity (in/sec) at 25 feet from the
FTA table (refer to Appendix D, Table 1)
D is the distance from the equipment to the receiver
3. Apply the vibration damage threshold criterion of 0.20 in/sec for fragile buildings,
0.12 in/sec for extremely fragile historic buildings.
The FTA manual states that the peak particle velocity (PPV) for each type of construction
activity listed in their table is a reasonable estimate for a wide range of soil conditions.
We recommend utilizing the FTA formula with a power of 1.1 for estimating vibrations
on NHDOT projects.
PPVequip = PPVref (25/D) 1.1
Solving the equation utilizing a power of 1.1 and a distance (D) greater than 25 feet
results in predictions with higher levels of vibrations (more conservative), which are
closer in agreement with the data collected in the NHDOT study (See Appendix D, Page
45, NHDOT Vibration Levels for Construction Activities).
Inches/Second = VdB
.056 in/sec = 100 VdB
.018 in/sec = 90 VdB
.0056 in/sec = 80 Vdb
.0018 in/sec = 70 VdB
.0006 in/sec = 60 VdB
The VdB is a logarithmic
scaling
of vibration magnitude
Figure 11 - Typical Levels of Ground-Borne Vibrations from Transit Noise and
Vibration (Federal Transit Administration, 2006)
A chart titled “Typical Vibration Sources and Sensitivities” (Figure 12), published by
Nugent & Amick in 1992, depicts various vibration sources and peak ground velocity
(in/sec) verses effects on structures, people and equipment. The chart is a good overview
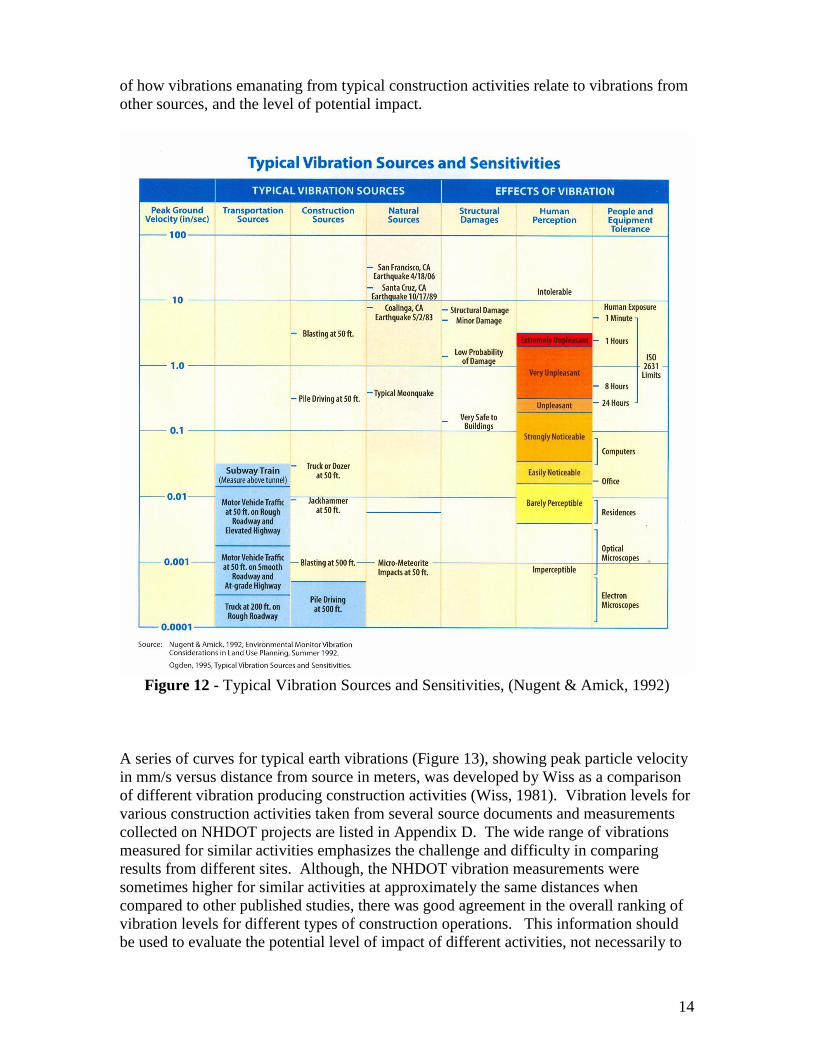
14
of how vibrations emanating from typical construction activities relate to vibrations from
other sources, and the level of potential impact.
Figure 12 - Typical Vibration Sources and Sensitivities, (Nugent & Amick, 1992)
A series of curves for typical earth vibrations (Figure 13), showing peak particle velocity
in mm/s versus distance from source in meters, was developed by Wiss as a comparison
of different vibration producing construction activities (Wiss, 1981). Vibration levels for
various construction activities taken from several source documents and measurements
collected on NHDOT projects are listed in Appendix D. The wide range of vibrations
measured for similar activities emphasizes the challenge and difficulty in comparing
results from different sites. Although, the NHDOT vibration measurements were
sometimes higher for similar activities at approximately the same distances when
compared to other published studies, there was good agreement in the overall ranking of
vibration levels for different types of construction operations. This information should
be used to evaluate the potential level of impact of different activities, not necessarily to

15
predict the actual vibration levels. More accurate predictions can only be made after a
site specific study has been conducted.
Figure 13 - Construction Vibrations as a Function of Distance, (Wiss, 1981)
DEVELOPMENT OF A “CONSTRUCTION VIBRATION DATABASE”
A standard approach for assessing the potential impact of construction vibrations at a
project site and for estimating the level of monitoring services would be helpful to
planners, designers and construction personnel. Collecting and tracking vibration data of
various construction activities on NHDOT projects could be a valuable resource toward
developing and modifying standard specifications, and in making informed decisions
during the design and construction phases of projects. A suitable database would track
vibration events, evaluate the potential impact, determine the variables involved, and
compare different vibration producing activities from site to site. The following
categories of data were identified as crucial in developing the framework for a
construction vibration database:
Project Information – project number, town, project description, person or company
collecting the data
Event Information – vibration activity to include type and model of equipment producing
the vibrations, nearby structure type(s) and condition, population sensitivity, type of
vibration (continuous, single event, high-rate repeated impact)
Seismograph/Sensor Information – Manufacturer and model, last calibration date,
sensor(s) location, distance from vibration source to sensor, monitoring period to include
time and date
Subsurface Conditions – Soil type(s), density and thickness of layers, depth to bedrock,
groundwater depth
Readings – time, velocity (in/sec), frequency (HZ), type (longitudinal, transverse,
vertical)

16
The “Construction Vibration Database” is a relational database that allows stored
information to be sorted based on certain common characteristics. The database serves as
a tool to assess the potential impact that various types of construction activities may have
at a project site based on the surrounding conditions (i.e. population sensitivity, type and
condition of nearby structures), the underlying subsurface materials, and the distance
from a vibration producing event. A “User’s Guide” for this database appears in
Appendix E.
The main menu provides access to the “Vibration Event,” “Reports,” and “Maintenance”
screens. The “Vibration Event” screen is where data on the vibration producing activity
and equipment, nearby structure types and condition, population sensitivity, subsurface
conditions, monitoring equipment, sensor location(s), and vibration readings are entered.
Multiple readings for each event and site can be input into the database. New
information is entered into the database by project, identified by a unique state project
number, city/town, route/road, and description. Navigation buttons are provided to
facilitate movement between records and to find, add, edit, save, delete, and print records.
Drop-down menus are provided for many of the data fields. Many of the drop-down
menus can be modified through the “Maintenance” screen.
The NHDOT also maintains a database of subsurface information that is located by GPS
coordinates and includes elevations, field classification of soil and rock with remarks,
depths of stratum changes, water depth, blows per 0.5 foot of depth, and other supporting
information. The “Construction Vibration Database” will indicate if existing subsurface
information is available for that specific project and provide access to the database
location where it is stored.
The “Reports” screen allows stored data to be sorted by project, vibration activity type,
distance from vibration source, measured vibration (in/sec), frequency (Hz), soil type,
and density. The activity type (vibration producing activity) must be selected to generate
a vibration report. All other fields of information are optional.
The “Maintenance” screen allows for modifications to some of the drop-down menus.
Fields of information that can be modified include activity types, equipment types, soil
types, vibration types, seismographs and inspectors.
The “Construction Vibration Database” will only be a useful tool if information on a
variety of activities over a broad range of conditions is continuously added to the
database. This will require the collection of information, in a standardized format, by
both in-house resources and by vibration consultant subcontractors working on NHDOT
projects. To facilitate this effort, Section 211 of the NHDOT “Standard Specifications
for Road and Bridge Construction” now requires that vibration consultants complete and
submit data for each vibration producing activity, using a standardized form that is
available on the Department’s web site. The form can also be found in Appendix C. The
completed forms are to be submitted to the Department’s Research Geologist at the
Bureau of Materials & Research in Concord, New Hampshire. As the database becomes
populated, direct access (view only) to the information will be provided to designers and
project administrators in the NHDOT.
17
DEVELOPMENT OF PROCEDURES FOR CONSTRUCTION VIBRATION
ASSESSMENTS AND ESTIMATING VIBRATION MONITORING SERVICES
The “Construction Vibration Assessment Table” (Appendix A, Table 1) can be routinely
used by designers for determining if vibration concerns exist and for evaluating the
potential impact on a project. In addition, an analysis can be useful in comparing the
potential impact of a specific construction activity at different sites, , or as a comparison
of different activities at the same site. This information would also be useful in
developing a preliminary cost estimate for vibration monitoring services. The
“Construction Vibration Assessment Process” can be utilized separately as a tool or in
support of developing an estimate for vibration monitoring services.
When estimating the vibration monitoring services required for a project site, all
vibration producing activities and potential impacts need to be considered in the
calculation. When assessing the overall impact of construction vibrations at a site, the
worst-case scenario for each type of construction vibration producing activity should be
considered. The closest, oldest, and worst condition of a particular category of
structures, and the most vibration sensitive operations should be identified. The worst-
case scenario should be the one impacted the most by the construction vibration
producing activities. This will help identify when, where and how the greatest impact
will be experienced. Ultimately, the controlling factor on the potential for complaints, on
the potential for damage to nearby structures, and the effort needed to mitigate vibration
impacts should be directly related to the worst-case scenario.
The proposed system for evaluating the potential impact of construction vibrations at a
project site developed through this research has been modeled after the FHWA Rock
Slope Stability Rating System and the Oregon Department of Transportation Rock Fall
Hazard Rating System, which the NHDOT adopted and modified for its rock slope
database. The assessment matrix described in Appendix A assigns a point score to ten
different categories of data that could potentially influence the impact of construction
vibrations on a NHDOT project. The total point score from adding the ten categories is
used to determine the level of impact at a site from vibrations emanating from a specific
type of construction activity. A construction vibration impact assessment should be
conducted for each type of vibration producing activity, evaluating the potential impact
of that activity on man-made structures (residential, business, apartment building,
industrial, historic structure, etc.) and vibration sensitive equipment within relevant
proximity of the project site. This information can then be used to estimate the cost of
vibration monitoring services for the project as described under Item 211.11, Vibration
Monitoring Services, of the NHDOT Standard Specifications. In addition to the
“Construction Vibration Impact Assessment Table”, Appendix A provides information on
how to conduct a construction vibration impact assessment. Appendix B demonstrates a
step-by-step procedure for estimating the total hours for vibration monitoring services.
The past utilization of Item 211.11, Construction Vibration Monitoring Services, was
reviewed on fifty-three NHDOT projects occurring over a period of ten years. It was
determined that the final pay quantity for Item 211.11 was within the range of 125
percent to 75 percent of the estimated bid quantity on only 1 out of 4 roadway projects.
On one project, the bid quantity was underestimated by more than 650 percent. This
demonstrates the need for implementing a standard and accurate procedure for assessing
18
the potential impact of construction vibrations and for estimating the quantity of vibration
monitoring services.
The ten categories of data used to calculate the “Construction Vibration Impact
Assessment” are combined with the number and types of potentially impacted structures
to calculate the estimated hours of Item 211.11 (Vibration Monitoring Services) required
on a project. Refer to Appendix B for a step-by-step method and practical exercise in
estimating the hours for Vibration Monitoring Services.
LIMITATIONS
The authors understand the difficulty in trying to assess the potential impact of
construction vibrations at a specific site and the nearly impossible challenge of grouping
construction activities/equipment by the intensity of potential vibrations. The variables at
each construction site make this a daunting task at best. This approach is controversial
with the risk of oversimplifying the complexity and variability at a project site. The most
reliable method is to take actual measurements at the project location. Until adequate
vibration data has been collected on a specific piece of equipment or type of activity at a
site, a more accurate assessment is not possible. Therefore, some flexibility is needed in
the contract documents and in the preliminary estimate to provide sufficient funding and
protection for the public. The monitoring data collected during construction, changes in
conditions and the contractor’s method of operation should be reviewed on a continuing
basis. This provides for informed decisions by the Contract Administrator and the
Vibration Consultant.
There was a limited range of equipment and types of vibration producing activities that
were available for study on NHDOT projects during the period of the research. The
database was initially populated with 268 events from 15 projects involving eight
different types of construction vibration producing activities to include vibratory roller,
excavator, hoe ram, pavement breaker, sheet pile driving, heavy truck traffic on gravel
haul road, movement of tracked equipment on paved surface, and small bulldozer. This
necessitated the need to utilize vibration data collected by others or available through
published reports. Measured ground vibrations generated by various types of
construction activities published by the Federal Transit Administration, the U.S.
Department of Transportation, the Port Authority of New York and New Jersey, the City
of Calgary, the LeEllen Phelps Mechanical Engineering Group, Kellogg Brown & Root
Pty Ltd, Geologic and Geophysical Consulting, Central Federal Lands Highway Division,
FHWA, Colorado, and the NHDOT are included in Appendix D. Although conditions
and equipment may vary from site to site, these tables give an approximate range of
vibration levels that can be expected from different construction activities at different
distances on a project.
At present, there is limited information on vibrations from driven piles in the NHDOT
database, but there is an existing Microsoft Access™ vibration database for driven piles
available online at http://www.piledrivers.org/noise-vibration-database.htm. The
database for the installation of driven piles was developed by the Pile Driving
Contractor’s Association (PDCA), in conjunction with the Citadel, and WPC. The
database includes a number of case histories with information on peak particle velocity
(PPV) data, vibration frequency, distance to driven pile, pile type, pre-auger information,

19
impact and vibratory hammer data to include rated energy, measured energy based on
PDA results, soil data, and pre/post condition survey data. The information in the
database can be utilized to develop a preliminary prediction of vibrations from a
proposed pile driving operation.
REDUCTION OF CONSTRUCTION VIBRATIONS
Although construction induced vibrations normally do not cause damage to nearby
structures, construction activities can generate complaints from people and can affect
vibration sensitive operations/equipment. Sometimes the best approach to avoiding or
minimizing problems is to schedule the work when people are not in the area or when the
sensitive equipment/activity is not in operation (Jones, 2004). Education of the public as
to what to expect and good communications are often the most effective way to reduce
complaints. The following steps outlined in the CALTRANS Transportation- and
Construction-Induced Vibration Guidance Manual (prepared by Jones & Stokes, 2004)
can be taken to reduce vibrations from construction activities:
Impact Pile Driving – Jetting, pre-drilling, auger cast piles, non-displacement
piles, using pile cushioning between the driving hammer and the pile, non-impact
pile drivers with a vibratory pile driver, use resonance-free vibrator.
Hydraulic Breakers – use hydraulic crusher, saws, rotary-cutting heads, hydraulic
splitters, expansive chemicals to split rock or concrete.
Vibratory Rollers - shut off vibrator when reversing direction (highest level of
vibrations are often generated when quickly stopping and changing direction),
utilize a vibrating roller that has the ability to adjust the impulse energy and
frequency, compact soil with static method (no vibrations); oscillation compaction
in place of conventional vibratory action.
Track Mounted Equipment – minimize traveling over paved surfaces with steel
cleats (Oriard, 2002), rubber pads can reduce vibrations, use rubber tired vehicles
in place of tracked vehicles.
Heavy Trucks – fill in pot-holes and eliminate pavement discontinuities, keep
haul roads smooth by periodic grading; pave existing roads to provide a smooth
traveling surface, reduce speed of vehicles; weight reduction of vehicles.
Methods for reducing construction vibrations should be considered on a case-by-case
basis. Trenches and sheet pile walls have been used as wave barriers to reduce the
amplitude of vibrations with limited success. This method of mitigating ground
vibrations can be expensive, may not be practical for the site conditions and is often
ineffective (Woods, 1997). It is important to monitor vibrations and frequencies during
different phases of the construction and during different construction activities at
numerous locations on the project. This approach will help identify any vibration
patterns and directional focusing caused by a variation in geology and subsurface
conditions at a site (Nutting, 1990).

20
Figure 14 - Track mounted excavator on pavement
CONCLUSIONS AND RECOMMENDATIONS
Although non-blasting construction-induced activities rarely cause damage, they can be a
source of annoyance and can generate complaints. The potential impact of vibrations
emanating from construction activities should be assessed prior to the start of a project to
identify the level of vibration monitoring services required and to develop a plan for
minimizing damage and complaints. Through this research, a proposed procedure for
assessing the potential impact of construction vibrations and estimating quantities for
vibration monitoring services was developed. In addition, a database to document the
actual vibrations measured at construction sites in New Hampshire was created and will
provide increased value as more data is added. Education of people and good
communications are the best and most proactive approach to avoiding problems.
Every construction site is unique with the potential for a wide range of conditions and
variables (Svinkin, 2001). Therefore, it is important to follow a standardized process for
evaluating the potential impact of construction related vibrations. Collecting, storing and
tracking key information in a database on vibrations produced by different non-blasting
construction activities can be a resource for decision making during the design and
construction phases of projects.
In several instances, steps have been taken on NHDOT construction projects to assess
and minimize the impact of vibrations on archaeological sites, on geological features and
on wildlife. Examples include a roadway project in close proximity to the remains of an
old stone foundation for a historic gristmill, the construction of the Franconia Notch
Parkway below the Old Man of the Mountain and road construction through Franconia
Notch during the nesting of the Peregrine Falcons. These are unique circumstances
requiring special considerations, collection of background data and input from vibration
experts.
It is important to periodically review both the method for assessing the potential impact
of construction vibrations and the procedure for estimating the level of vibration

21
monitoring services. Data collected from a variety of construction activities with a broad
range of site conditions can be used to modify and refine the accuracy of these methods
over time.
It is recommended that multiple seismographs be set-up initially at a site at a range of
distances and in different directions away from the vibration source. This will help
identify patterns in the transmission of vibrations in the project area. Measuring
background vibrations prior to the start of construction activities at a project site and
conducting pre-construction surveys to determine the condition of surrounding structures
are crucial. Sensitive operations/manufacturing processes, historic structures and
structures in fragile condition should be identified during the planning phase of the
project. Special conditions and other concerns should be stated in the project Prosecution
of Work, so that contractors can submit reasonable bids, and modify schedules and
activities appropriately. Very sensitive equipment and manufacturing processes often
present the greatest challenges. These can potentially have a significant impact on the
construction schedule and overall project costs. In many instances, companies do not
know the existing background vibrations at their location or the level of vibrations that
can be tolerated by their equipment and/or operation. Establishing good public relations
through education, communication and coordination with nearby landowners and
businesses is the key to minimizing problems during the construction phase.
A distance of 300 feet was arbitrarily chosen as the radius within which pre-construction
surveys and monitoring for non-blasting construction-induced vibration activities should
occur. A minimum 500-foot radius for blasting induced vibrations is required under
Section 203 of the NHDOT Standard Specifications for Road and Bridge Construction.
Although, Section 211 of the NHDOT Standard Specification for non-blasting
construction activities references the requirements in Section 203, it does allow the
Vibration Consultant (with adequate justification and documentation) to set revised limits
based on conditions at the project site. Some references recommend distances of up to
1300+ feet or more. The 300-foot distance is reasonable and manageable for most
NHDOT projects in urban areas. However, every project site is different and there may
be extenuating circumstances, such as liquefiable soils, very sensitive manufacturing
processes or very fragile structures that would justify increasing the 300-foot radius.
Pile driving can generate low-frequency ground vibrations in the range of 3-12 Hz at
distances of 600 feet or greater, which can trigger potentially damaging resonant
structural vibrations (Svinkin, 2001). Dynamic vibration sources cause densification of
sand at short distances, while settlements can extend out to distances of 1300 feet
(Woods, 1997). The Vibration Consultant (qualified third party hired by the Contractor)
should determine the structures, the vibration sensitive activities, and the types of
construction operations that will be surveyed and monitored in the project area. This
information along with recommended vibration limits shall be included in a Vibration
Monitoring Plan and submitted to the NHDOT for approval (refer to the NHDOT
Standard Specifications).
IMPLEMENTATION PLAN
It is expected that the Bureaus of Design, Construction and Materials & Research will
utilize the information in the database and the “Construction Vibration Impact
Assessment Table” to assess the potential level of impact from vibrations generated by a

22
proposed construction activity at a specified site, to estimate the cost of vibration
monitoring services and as a resource for decision making during the design and
construction phases of NHDOT projects. Information will continue to be added to the
“Construction Vibration Database” by personnel at the Bureau of Materials & Research.
The process for conducting the construction vibration impact assessments and for
estimating the vibration monitoring services should be modified and refined as more
information becomes available. Equipment purchased under this research study will need
to be maintained, upgraded and calibrated periodically (annual).
A change has been made to Section 211 – Vibration Monitoring, NHDOT Standard
Specification, requiring the contractor’s Vibration Consultant to complete a “Contractor
Vibration Report Form” per day, per vibration producing activity. Copies of the
completed forms shall be submitted to the Project Contractor Administrator and the
Research Geologist at the Bureau of Materials & Research. The form will facilitate the
collection and transfer of vibration data into the NHDOT database. The required form
can be found at http://www.nh.gov/dot/business/contractors.htm.
A “Guidance Manual for Non-Blasting Construction Vibrations” will be published. This
manual is intended to provide a reference source that can help designers determine when
it is appropriate to include vibration monitoring, as described in Section 211.11 of the
NHDOT “Standard Specifications for Road and Bridge Construction,” in a given
project. The guideline will provide a systematic method for determining a quantity of
hours for that item. The guideline will be a living document, subject to revision from
actual experience with the vibration monitoring item.

23
REFERENCE LIST
American Association of State Highway and Transportation Officials (AASHTO),
Standard Specifications for Transportation Materials and Methods of sampling and
Testing, 28th
Edition – 2008, Part 1B: Specifications, Miscellaneous, R 8-96 (2004),
Evaluation of Transportation – Related Earthborne Vibrations.
Dowding, Charles. 1996. Construction Vibrations. Prentice Hall, Englewood Cliffs, New
Jersey.
Federal Transit Administration. 2006, Transit noise and vibration impact assessment.
FTA-VA-90-1003-06. Office of Planning and Environment, Washington, D.C., Prepared
by Harris Miller & Hanson, Inc., Burlington, MA.
Forsbald. L. 1974, Markskakningar och deras Skadeverkan, Inverkan av Vibrerande
Jordpackningamaskiner, Skadlig Inverkan av Vibrationer, Symposium Anordnat av
Svenska Geotekniska Foreningen, Rapporter 56, May, 25 pp.
Hajduk, Ledford & Wright. 2004. Construction Vibration Monitoring In The
Charlestown, South Carolina Area. Proceedings: Fifth International Conference on Case
Histories in Geotechnical Engineering, New York, NY.
Hendricks, Rudy, 2002, Transportation Related Earthborne Vibrations (Caltrans
Experiences), Technical Advisory, Vibration, TAV-02-01-R9601, California Department
of Transportation, Noise, Vibration, and Hazardous Waste Management Office,
Sacramento, CA.
Hendricks, Rudy, 2004. Transportation Related Earthborne Vibrations (Caltrans
experience), Technical Advisory, Vibration, TAV-04-01-R0201, California Department
of Transportation, Noise, Vibration, and Hazardous Waste Management Office,
Sacramento, CA.
Jones & Stokes. 2004. Transportation- and construction-induced vibration guidance
manual. June. (J&S 02-039.) Sacramento, CA. Prepared for California Department of
Transportation, Noise, Vibration, and Hazardous Waste Management Office,
Sacramento, CA.
King, Ken and DeMarco, Matthew, 2004, Impacts of Construction Vibrations on Rock
Pinnacles and Natural Bridges, General Hitchcock Highway, Tucson, AZ., Geologic and
Geophysical Consulting and Central Federal Lands Highway Division, FHWA, Denver,
CO.
Longinow, Anatol. 1999. Monitoring Construction Vibrations. Civil Engineering
Magazine, ASCA, Volume 69, Number 2, Reston, VA.
Northwestern University Autonomous Crack Measurement, Video on Background and
Frequently Asked Questions About Blasting from the Florida Lake Belt Project, Miami-
24
Dade, Limestone Products Association, Miami-Dade County, Vibrations FAQ,
www.iti.northwestern.edu/acm/background.html. Accessed March 22, 2010.
Nugent & Amick, 1992. Environmental Monitor Vibration Considerations in Land Use
Planning, Ogden, 1995. Typical Vibration Sources and Sensitivities. Typical Vibration
Sources and Sensitivities, Foothill Parkway Westerly Extension, Draft EIR, RBF
Consulting, August 2008.
Nutting, Michael & Froedge. 1990. The Mapping of Vibration Patterns Around a Blast.
16th
Annual Conferences on Explosives and Blasting Technique and the 6th
Annual
Research Symposium, Orlando, Florida.
Oriard, Lewis. 2002. Explosives Engineering, Construction Vibrations and
Geotechnology. International Society of Explosives Engineers, Cleveland, OH.
Phelps, LeEllen Mechanical Engineering Group, July 8, 2009, Study of Vibrations due to
Construction Activities on Haleakala, Document TN-0113, Revision A, ATST
(Advanced Technology Solar Telescope, Appendix Q: Vibration Study, Tucson, AZ).
Pile Driving Contractor’s Association (PDCA), Citadel and WPC, Noise & Vibration
Database, Pile Driving Contractors Association, http://www.piledrivers.org/noise-
vibration-database.htm, Accessed April 4, 2010.
Siskind, D.E., Stagg, M.S., Kopp, J.W., and Dowding, C.H. 1980 Structure response and
damage produced by ground vibrations from surface blasting, PI 8507, U.S, Bureau of
Mines, Washington, D.C.
Steinberg, S.B., and Lukas, R.G. 1984, Densifying a Landfill for Commercial
Development, International Conference on Case Histories in Geotechnical Engineering,
University of Missouri-Rolla, May, Vol. 3, pp 1195-1200.
Svinkin, Mark. 2001. Advantages in Instrumentation of Construction Vibrations,
Transportation Research Board, 80th
Annual Meeting, Washington, D.C.
Svinkin, M.R. Environmental vibration problems during construction, VibraConsults.
www.vulcanhammer.net/svinkin/. Accessed Jan. 2, 2008.
Svinkin, M.R. Minimizing Construction Vibration Effects, Practice Periodical on
Structural Design and Construction, ASCE, May 2004.
U.S. Department of Transportation, Federal Highway Administration, 2006, Rock
Blasting and Overbreak Control, National Highway Institute, Third Edition, Calvin J.
Konya.
U.S. Department of Transportation, Federal Transit Administration and the Port
Authority of New York and New Jersey, Final Environmental Impact Statement,
Permanent WTC Path Terminal in Borough of Manhattan, New York County, Chapter 10:
Noise and Vibration, May 2005.

25
Vibration Study Appendix C, 1986, Report on the Pre-design Studies of Noise and
Ground Vibration For N.W.L.R.S., City of Calgary, Antelope Valley Roadway Project,
University of Nebraska, Lincoln, Nebraska.
Wiss, J.F. 1981, Construction vibrations: State-of the-art, Journal of Geotechnical
Engineering Division, ASCE, 107(2), 167-181.
Woods, R.D. 1997. Dynamic Effects of Pile Installations on Adjacent Structures, NCHRP
Synthesis 253, TRB, National Research Council, Washington, D.C.

26
This page intentionally left blank

27
APPENDIX A - CONSTRUCTION VIBRATION IMPACT ASSESSMENT TABLE

28
Figure 15 - Construction Vibration Impact Assessment Table
Points 1 Points 3 Points 9 Points 27 Points 81
Type of Construction
Activity/Equipment/
Energy Input from
Activity
Hand tools; small plate
compactors; tampers; jack
hammer
Excavation with
backhoe; heavy
wheeled
construction
vehicles
Vibratory roller;
tracked mounted
equipment on
pavement; hoe
ramming
Pile driving;
pavement breaker
Dynamic
compaction; drop ball
Attenuation (decay) of
peak particle velocity
Cohesive Soils Very soft to soft
(0 –4 blows/ft)
Non-cohesive soils Very loose
(0 – 4 blows/ft)
Cohesive
Soils Medium Stiff
(5 – 8 blows/ft)
Non-cohesive
soils Loose
(5 – 10 blows/ft)
Cohesive
Soils Stiff
(9 – 15 blows/ft)
Non-cohesive
soils Medium dense
(11 – 24 blows/ft)
Cohesive
Soils Very Stiff
(16 – 30 blows/ft)
Non-cohesive
soils Dense
(25 – 50 blows/ft)
Cohesive Soils Hard to very hard
(30+ blows/ft)
Non-cohesive
soils Very dense
(50+ blows/ft)
Displacement;
Densification &
Settlement
Very dense
soil or bedrock
Dense soil Medium dense
soil
Loose soil Soft, very loose,
saturated soil;
cohesionless soils
Distance from Vibration
Source
Greater than 400 ft 201 – 400 ft 101 –200 ft 51 – 100 ft 50 ft or less
Type of Vibration Single isolated event Intermittent and
random impact
Steady state;
continuous,
harmonic
Numerous
multiple impact
Continuous impact
Duration of Construction
Activity
5 minutes or less Longer than 5
minutes to 1
hour
Longer than 1
hour to one day
Longer than one
day to one week
Longer than one
week
Type of Structure Reinforced concrete
structure (i.e. bridge);
structures w/ deep
foundation
Concrete w/
shallow
foundation
Private
residence(s) or
commercial
structure w/
drywall
Private
residence(s) or
commercial
structure w/
plaster walls
Historic or fragile
structures
Condition/Age of
Structure
Excellent condition,
less than 10 years old,
no visible cracks
Good condition;
minor hairline
cracks; 10 to 20
Years Old
Fair condition;
many cracks;
structure
constructed after
1950
Fair condition;
many cracks;
structure
constructed prior
to 1950
Poor condition;
over 100 years old
Vibration Sensitive
Equipment/Vibration
Sensitive Manufacturing
Process
No vibration sensitive
equipment
or processes; private
residence
Home office Small business,
bank or store w/
computers
Large business
w/ sensitive
equipment,
dentist or
doctor’s office
Medical/ research
labs, hospital,
computer chip
manufacturing,
other sensitive
manufacturing
processes or
equipment
Sensitivity of Population Rural area/single family
residence
Urban area w/
multiple single
family
residences
Urban area w/
apartment
house(s)
Business/ store
Hospital/
nursing home
Construction Vibration Impact Point Total
Very High Impact 400 or greater
High Impact 300 to <400
Moderate Impact 200 to <300
Low Impact 100 to <200
Very Low Impact Less than 100

29
Explanation of Categories for Construction Vibration Impact Assessment
Notes for Construction Vibration Impact Assessment Matrix: The primary purpose
of this table is not to quantify all the variables that contribute to the impact of
construction vibrations at a site, but to provide a systematic procedure for vibration
assessment during project planning. A vibration assessment can be useful in comparing
the potential impact of a specific construction activity at a site versus the same activity at
another site or a comparison of different activities at the same site. This information can
be useful in developing a preliminary cost estimate for vibration monitoring services.
Determining the level of construction vibration impact at a site should be based on the
worst-case scenario for each type of construction vibration producing activity. The
assessment should identify the closest, the oldest or worst condition of a particular
category of structures and/or the most vibration sensitive operation.
1. Type of construction activity/Equipment/Energy input from activity - The
type of equipment and/or construction activity, the energy output and how that
energy is transferred to the ground are all major factors in the intensity of the
vibrations. Since there is such a wide range of equipment sizes and construction
activities, the order of placement in the table is based on our experience with
NHDOT construction projects. Valid arguments can be made for different point
rankings of construction equipment/activities.
2. Attenuation of peak particle velocity - Attenuation (decay) of peak particle
velocity is based on the frequency of the motions, the damping provided by the
material through which the stress waves (ground motion) travel and the type of
stress wave generated. Higher frequency motions have shorter wavelengths than
lower frequency motions. A high frequency wave will have a greater number of
cycles of motion to travel the same distance as a low frequency wave (Dowding,
1996). Therefore, higher frequency waves (shorter the wavelength) interact more
with the ground material over the same distance, resulting in greater damping
(Dowding, 1996). The U.S. Bureau of Mines R.I. 8507 report on surface mine
blasting established limits for safe vibration levels for residential structures based
on frequency (Siskind, 1980). The recommended safe vibration levels measured
in inches/second (Peak Particle Velocity) decreases below a frequency of 40 Hz.
This is the most widely used vibration criteria for either blast-induced or
construction equipment-induced vibrations. Vibrations emanating from most
construction equipment fall in the lower frequency range of 5 to 30 Hz (Dowding,
1996).
Ground motions with the same initial dominant frequency will have longer
wavelengths and higher propagation velocity in stiffer soils. The result is less
decay and greater particle velocities in stiffer material as compared to softer
material at the same distance from the energy source (Dowding, 1996). The
difference between a loose and stiff soil can influence particle velocities by five to
seven fold (Forsbald, 1974) (Steinberg and Lukas, 1984). In general, a clay soil
will have a higher damping effect than sandy soils, wet sand attenuates less than
dry sand, and frozen soil attenuates less than thawed soil (Dowding, 1996).

30
Vibrations generated by construction equipment produce two types of stress
waves, body waves and surface waves. Body waves decay more rapidly due to
greater damping and confinement. Surface waves (Rayleigh waves) travel along
the ground surface, tend to travel long distances with minimal decay and are often
more damaging to nearby structures. Almost two-thirds of the energy applied to
the ground surface is transmitted in the form of surface waves (Dowding, 1996).
3. Displacements; Densification & Settlement – Construction vibrations could
potentially cause displacement, densification and settlement of the material
underlying or adjacent to a structure. An impulsive energy source at a particular
level is more likely to generate stress waves of lower frequency and larger
displacements in softer, looser or more saturated soil (Dowding, 1996) (Oriard,
2002). The greatest densification will occur in loose saturated sands that are low
density, low blow count and fully saturated (Oriard, 2002). Steady vibrations of
longer duration have a greater potential to cause densification, or even
liquefaction if the soils are saturated and subjected to high strains (Oriard, 2002).
Lateral displacement can occur when driving piles or compacting soils in close
proximity to walls, structures and utilities. This type of direct mechanical damage
should not be confused with vibration-induced damage (Oriard, 2002). As a
general rule, most damage from pile driving activities occurs within a distance
equal to or less than the length of a pile. There have been exceptions. Damage
from settlement or liquefaction of soils resulting from vibrations emanating from
pile driving have occurred at greater distances.
4. Distance from Vibration Source - Distance from the source of energy is an
important factor in the intensity of vibrations. Vibrations would theoretically be
the same intensity at a given distance in all directions from the energy source, if
the transmission medium is uniform and homogenous throughout. In reality, the
conditions at a site are variable both laterally and vertically, encountering
materials of different composition, density, water content, layering, etc. A
general rule is that if the distance is reduced by half, the intensity of vibration
should increase approximately by three times (Oriard, 2002). This relationship is
very dependent on the conditions at the site. Vibration intensities at the ground
surface are higher than those below ground. In general, the vibration intensity
would decrease to approximately 50% of the surface value within 10 to 20 feet
below the ground (Oriard, 2002). This is important when assessing the potential
impact of vibrations on buried utilities. Buried utilities in good condition and
properly installed are not only more confined and more resistant to vibration
damage, but will likely experience less vibration intensity than that measured at
the surface.
5. Type of Vibration - The type of vibration can be linked to the energy transfer
mechanism or equipment type/construction activity. Impact vibrations (impulsive
energy) generated by dynamic compaction, impact pile driving and pavement
breakers tend to deliver high levels of energy. Steady-state vibrations
(reciprocating energy) such as vibratory rollers tend to generate complaints even
when the measured vibration intensity is low. Rotating energy transfer (trencher,
tunnel boring machine) and rolling energy transfer (heavy vehicles, railroads) are
pseudo-steady vibrations, which can generate a large range of vibration intensities

31
(Wiss, 1981), but typically have not been a problem on NHDOT projects.
Heavily loaded ledge trucks traveling at a high rate of speed on a very rough road
could potentially generate high vibrations. Some subjective judgment is required
when rating this category.
6. Duration of Construction Activity - The duration is the total time period during
which the construction-induced vibration activity will occur. A longer duration
provides a longer complaint period, a greater potential for annoyance and
disturbance, and increased opportunities to generate damaging vibrations. A
longer duration would require more vibration monitoring services. Some
vibration activities could extend over several years through different seasons
resulting in significant changes to site conditions. This increases the exposure to
a broader range of environmental changes (temperature, humidity, fluctuation in
moisture content of soils, etc.) over time. Settlement and cracking of structures
due to environmental factors such as frost action, erosion of soil, natural cyclic
changes in expansive soils, drainage problems, decomposition of underlying
organic deposits are common (Oriard, 2002). Vibrations generated by
construction activities are often blamed for damage, which in reality was caused
by natural environmental changes that occurred over time.
7. Type of Structure - The amount of reinforcement and bracing in a structure
relates directly to its ability to withstand vibrations. Concrete structures and deep
foundations are particularly resistant to damage. Plaster on wood lath for interior
walls will experience cosmetic cracks at lower vibrations than drywall interior
construction. Multi-level structures may experience greater movement in the
upper levels than a single story structure. Historic structures and older buildings
with shallow stone foundations may be fragile.
8. Condition/Age of Structure – A variety of stronger and longer lasting building
materials have been developed during the last twenty years. Building
construction methods have improved significantly during the last 50 years
(Hajduk, 2004). Newer buildings and structures have been subjected to less
damage and deterioration caused by natural environmental factors.
9. Vibration Sensitive Equipment/Vibration Sensitive Manufacturing Process –
Some manufacturers of sensitive equipment provide vibration criteria, but it often
covers continuous vibrations not transient vibration sources. Types of sensitive
operations may include medical research facilities, hospitals, computerized
industries, banks, industrial machinery, computer chip companies, equipment with
sensitive switches and other sensitive manufacturing processes. Sensitive
equipment could include optical microscopes, magnetic resonance imaging (MRI)
machines, scanning electron microscopes, micro-lathes, and precision milling
equipment. It is important to determine the background vibrations that typically
occur in the vicinity of the sensitive equipment and its support structure.
10. Sensitivity of Population – Humans are very sensitive to vibrations. People
experience vibrations in their daily life to include riding in an automobile or on
commercial transportation (bus, train or airplane), vibrations at home and in the
work environment. These types of vibrations are familiar to the individuals and
32
often go unnoticed. Vibrations generated by construction activities are unfamiliar
and often disturbing to people, causing concern, annoyance and fear (Siskind,
1980) (Dowding, 1996). These types of vibrations often trigger an adverse
response from people long before they reach a level that could potentially cause
even minor cosmetic damage. The response from people is often dependent on
the makeup of the nearby population, the type of vibration (transient or
continuous), the vibration intensity, frequency and duration. The ability of
people to perceive motion and vibrations can vary significantly between
individuals. In general, people are more sensitive to continuous vibrations than
vibrations of short duration. If the vibration is accompanied by sound it is often
perceived to be more annoying (Oriard, 2002).
While ground-borne vibrations emanating from construction activities rarely
cause structural damage, annoyance of the occupants and disturbance of vibration
sensitive equipment/manufacturing processes can occur. Effects from ground-
borne vibrations can include movement of the building floors and walls, rattling
of windows, shaking of items on shelves and hanging on the walls, and rumbling
sounds. Vibrations from construction activities are transmitted as vibration waves
that move through the ground medium into the foundation of a structure.
Vibrations in the foundation propagate throughout the structure causing
movement of internal floors and walls. Depending on resonance frequencies,
vibrations inside the structure may provoke an adverse human reaction. Ground-
borne vibrations caused by the same activity may not be perceived as
objectionable to people who are outside the building (FTA, 2006). It may be
necessary to measure vibrations at different locations from inside a structure to
evaluate the actual vibration impact from a construction activity.

33
APPENDIX B – METHOD FOR ESTIMATING HOURS FOR VIBRATION
SERVICES

34
Method for Estimating the Hours for Vibrations Services
1. Identify the number of structures, the types of structures and man-made features,
and the vibration sensitive operations/equipment that could be potentially
impacted by vibrations from construction activities. The structures, man-made
features and vibration sensitive operations/equipment should include everything
within a 300-foot radius and any others (beyond 300 feet) specifically identified
as a concern during the planning phase.
2. Assume approximately two (2) hours for pre-construction surveys for residential
structures, four (4) hours for small stores/businesses, six (6) hours for apartment
buildings, and eight (8) hours for historic structures, vibration sensitive processes
and industrial facilities. Estimate sixteen (16) hours for pre-construction surveys
when working in close proximity to extremely fragile structures or highly
sensitive operations.
3. Estimate the “uncorrected” vibration monitoring time (hours) needed for each
type of vibration construction activity identified in step 1. For construction
activities where the vibration source (vibratory rollers, pavement breakers,
excavation equipment, construction vehicles, etc.) is moving throughout the
project, assume four (4) hours of monitoring for each residential structure, six (6)
hours for other types of structures and eight (8) hours for historic structures. For
construction activities where the vibration source (pile driving, drop ball,
demolition, etc.) is stationary or stays in the same general area, assume ten (10)
hours of monitoring time at each potentially impacted structure/operation for each
type of construction-induced vibration activity. Estimate twenty (20) hours of
vibration monitoring time for extremely fragile structures or highly sensitive
operations.
4. Calculate the “corrected” vibration monitoring hours required by applying a
correction factor(s) to the hours estimated in Step 3. The basis for determining
the correction factor(s) is the “Construction Vibration Impact Assessment Table”
(Figure 15, page 25). The table provides a way of scoring the potential impact of a
vibration producing activity on each type of structure or vibration sensitive
equipment. The correction factor for a vibration producing activity is based on the
point total for all impacted structures and/or vibration sensitive operations.
Correction factors to be used are as follows:
Factor of 1 for very low to low impact (0 to 199 total points)
Factor of 1.5 for moderate to high impact (200 to 399 total points)
Factor of 2 for very high impact (400 or greater total points)
5. Add the corrected vibration monitoring hours for each type of activity verses type
of man-made structure/vibration sensitive operation to the hours for the pre-
construction surveys to determine the hours of vibration monitoring services. To
provide a contingency for conducting post-construction surveys, add 10% of the
hours for vibration monitoring services to obtain the total hours for the vibration
monitoring services.

35
Example: Practical Exercise for Estimating Vibration Monitoring Service Hours
The proposed project involves widening a 2500-foot long section of state roadway
and the replacement of a bridge structure over a stream. The project site is located in
an urban area that includes 10 private homes with dry wall construction (most are in
fair condition and constructed prior to 1950). In addition, there is a small country
store (good condition and built 15 years ago), a historic church (poor condition and
over 200 years old) and a two-story apartment house (good condition and 10 years
old) within the limits of the proposed construction. Four of the residential structures,
the store, the historic church and the apartment house are in close proximity to the
proposed bridge construction. The vibration producing construction activities are
expected to include vibratory compaction of the base course materials for the
roadway widening and pile driving for the bridge replacement. Based on
geotechnical borings taken for the project, the underlying soil between the source of
the construction vibrations and the surrounding structures is expected to be a very
loose sand with a high water table (2 to 3 feet in depth). The only exception is a
roadway boring taken in the vicinity of the country store that encountered a medium
dense glacial till. A day care center is located in the basement of the church. There is
no known vibration sensitive equipment located in any of the surrounding structures.
The project is expected to take two construction seasons to complete.
Step 1 – Identify the number and type of structures
Step 2 – Estimate pre-construction survey hours
Type of Structure Pre-construction survey hours
10 – Residential structures 10 structures x 2 hrs 20 hrs
1 – Apartment building 1 structure x 6 hrs. 6 hrs.
1 – Business 1 structure x 4 hrs. 4 hrs.
1 – Historic building 1 structure x 8 hrs. 8 hrs.
Total pre-construction survey hours 38 hrs.
Step 3 – Calculate the estimated uncorrected vibration monitoring hours for each
activity
Vibration Producing
Activity
Structure Type
Number of
Structures
Uncorrected
Vibration Monitoring
(Hours)
Vibratory Roller Residential 10 10 X 4 hrs. = 40
Vibratory Roller Business 1 1 X 6 hrs. = 6
Vibratory Roller Apartment Building 1 1 X 6 hrs. = 6
Vibratory Roller Historic Building 1 1 X 8 hrs. = 8
Pile Driving Residential 4 4 X 10 hrs. = 40
Pile Driving Business 1 1 X 10 hrs. = 10
Pile Driving Apartment Building 1 1 X 10 hrs. = 10
Pile Driving Historic Building 1 1 X 10 hrs. = 10
Total Monitoring Hours 130 hours

36
Step 4 – Calculate the corrected vibration monitoring hours.
(Refer to Table 15, page 25)
VIBRATORY ROLLER
Category Residential
Structure (points)
Country Store
(points)
Apartment
Building
(points)
Historic
Church
(points) Type of
Construction
9 (vibratory roller) 9 (vibratory roller) 9 (vibratory roller 9 (vibratory roller
Attenuation 1 (very loose sand/ 4
blows per foot)
9 (medium dense till
in area of store/ 15
blows per foot)
1 (very loose sand/ 4
blows per foot)
1 (very loose sand/ 4
blows per foot)
Displacement
Densification
81 (Very loose sands
with high water table)
9 (medium dense till) 81 (Very loose sands
with high water table
81 (Very loose sands
with high water table
Distance from
Vibration
Source
27 (less than 100 ft from
roadway to most
residential structures)
9 (150 ft from
roadway)
3 (210 ft from
roadway)
27 (75 feet from
roadway)
Type of
Vibration
9 (Continuous vibration) 9 (Continuous vibration)
9 (Continuous vibration)
9 (Continuous vibration)
Duration of
Construction
81 (longer than one week; two construction seasons)
81 (longer than one week)
81 (longer than one week)
81 (longer than one wee);
Type of
Structure
9 (Private residential structures with dry wall)
9 (Commercial with dry wall)
9 (Private residential structures with dry
wall
81 (Historic Structure)
Condition/Age 27 (Most of the homes are
in fair condition and constructed prior to 1950)
3 (Good condition/
15 years old)
3 (good condition/10
years old)
81 (poor
condition/over 200 years old)
Vibration
Sensitive
Equipment
1 (Private residence/ no
vibration sensitive equipment)
9 (Small store) 1 (No vibration
sensitive equipment)
1 (No vibration
sensitive equipment)
Sensitivity of
Population
3 (Urban area with
multiple single family
homes)
27 (Small store) 9 (Apartment in urban
area)
27 (Day care in
basement of church)
Vibratory Roller (Residential Structure) = 248 points
Vibration Roller (Country Store) = 120 points
Vibratory Roller (Apartment Building) = 152 points
Vibratory Roller (Historic Church) = 344 points

37
Step 4 (continued)
PILE DRIVING FOR BRIDGE STRUCTURE
Category Residential
Structure (points)
Country Store
(points)
Apartment
Building
(points)
Historic
Church
(points) Type of
Construction
27 (Pile driving) 27 (Pile driving) 27 (Pile driving) 27 (Pile driving)
Attenuation 1 (very loose sand/ 4
blows per foot)
9 (medium dense till
in area of store/ 15
blows per foot)
1 (very loose sand/ 4
blows per foot)
1 (very loose sand/ 4
blows per foot)
Displacement
Densification
81 (Very loose sands
with high water table)
9 (medium dense till) 81 (Very loose sands
with high water table
81 (Very loose sands
with high water table
Distance from
Vibration
Source
27 (Closest residential
structure is 100 ft from
bridge)
81 (50 ft from bridge) 27 (95 ft from bridge) 81 (50 feet from
bridge)
Type of
Vibration
27 (Multiple impact) 27 (Multiple impact) 27 (Multiple impact) 27 (Multiple impact)
Duration of
Construction
81 (longer than one week; two construction seasons)
27 (longer than one day)
27 (longer than one day)
27 (longer than one day)
Type of
Structure
9 (Private residential structures with dry wall)
9 (Commercial with dry wall)
9 (Private residential structures with dry
wall
81 (Historic Structure)
Condition/Age 27 (Most of the homes are
in fair condition and constructed prior to 1950)
3 (Good condition/
15 years old)
3 (good condition/10
years old)
81 (poor
condition/over 200 years old)
Vibration
Sensitive
Equipment
1 (Private residence/ no
vibration sensitive equipment)
9 (Small store) 1 (No vibration
sensitive equipment)
1 (No vibration
sensitive equipment)
Sensitivity of
Population
3 (Urban area with
multiple single family
homes)
27 (Small store) 9 (Apartment in urban
area)
27 (Day care in
basement of church)
Pile Driving (Residential Structure) = 284 points
Pile Driving (Country Store) = 228 points
Pile Driving (Apartment Building) = 212 points
Pile Driving (Historic Church) = 434 points
Multiply the total hours for each construction activity and structure type by one of the
following correction factors based on the level of construction vibration impact:
Factor of 1 for very low to low impact (0 to 199)
Factor of 1.5 for moderate to high impact (200 to 399)
Factor of 2 for very high impact (400 or greater)
CORRECTION FACTOR FOR EACH COMBINATION OF ACTIVITY AND
TYPE OF STRUCTURE
Residential
Structure
Business Apartment
House
Historic
Structure
Vibratory
Roller
248 points
(factor 1.5)
120 points
(factor 1.0)
152 points
(factor 1.0)
344 points
(factor 1.5)
Pile Driving 284 points
(factor 1.5)
228 points
(factor 1.5)
212 points
(factor 1.5)
434 points
(factor 2.0)

38
Multiply the computed uncorrected vibration monitoring hours from Step 3 by the
correction factors from Step 4 to determine the corrected vibration monitoring hours. Vibration
Producing
Activity
Structure
Type
Number of
Structures
Uncorrected
Vibration
Monitoring
(Hours)
Corrected Vibration
Monitoring Hours
(Correction Factor X
Monitoring hours)
Vibratory Roller Residential 10 10 X 4 hrs. = 40 40 X 1.5 = 60 hrs.
Vibratory Roller Business 1 1 X 6 hrs. = 6 6 X 1.0 = 6 hrs.
Vibratory Roller Apartment
Building
1 1 X 6 hrs. = 6 6 X 1.0 = 6 hrs.
Vibratory Roller Historic
Building
1 1 X 8 hrs. = 8 8 X 2.0 = 16 hrs.
Pile Driving Residential 4 4 X 10 hrs. = 40 40 X 1.5 = 60 hrs.
Pile Driving Business 1 1 X 10 hrs. = 10 10 X 1.5 = 15 hrs.
Pile Driving Apartment
Building
1 1 X 10 hrs. = 10 10 X 1.5 = 15 hrs.
Pile Driving Historic
Building
1 1 X 10 hrs. = 10 10 X 2.0 = 20 hrs.
Total Monitoring Hours (corrected) 198 hrs.
Step 5 – Summarize the total estimated hours of vibration monitoring services and add
10% for post-construction surveys.
TOTAL ESTIMATED HOURS FOR VIBRATION MONITORING SERVICES
Vibration
Service
Residential Business
(small
business)
Apartment
Building
Historic
Structure
Vibration
Services
(hours)
Pre-
Construction
Survey (hrs.)
2 X 10 = 20
hrs.
1 X 4 = 4 hrs. 1 X 6 = 6 hrs. 1 X 8 = 8 hrs. 20+4+6+8 = 38
Vibration
Monitoring
(Vibratory
Roller)
60 hrs.
(corrected)
6 hrs.
(corrected)
6 hrs. (corrected) 16 hours
(corrected)
60+6+6+16 = 88
Vibration
Monitoring
(Pile Driving)
60 hrs.
(corrected)
15 hrs.
(corrected)
15 hrs. (corrected) 20 hours
(corrected)
60+15+15+20
=110
Vibration
Services
(hours)
140 hours 25 hours 27 hours 44 hours 236 hours
10% for Post-
construction
Surveys
(.10) X (hours of vibration services) = hours
(.10) X (140+25+27+44) = 23.6 hours
Estimated hours for Item 211.11 Vibration Monitoring Services (140+25+27+44+24) = 260 hours

39
APPENDIX C - CONSTRUCTION VIBRATION REPORT FORM

40
This page intentionally left blank

41
Contractor Vibration Report Form
State Project #: __________ Federal Project #: ________ Event Date: ____________________
City/Town: __________ Route/Road: _______________________________________
Name & Company Conducting Vibration Monitoring: ______________________________
Event Information
Vibration Producing Activity: (circle one)
Vibratory Roller Excavating Hoe Ram Pavement Breaker Sheet Pile Driving
Traffic Vibratory Compaction
Other (explain): _______________________________________________________________
Type and Model of Equipment Producing Vibrations:
________________________________
Structure Type: (circle one or more)
Reinforced concrete structure with deep foundation Concrete structure with shallow
foundation Private residence(s) or commercial structure with drywall
Private residence(s) or commercial structure with plaster walls Historic or fragile structure
Other (explain) ________________________________________________________________
Structure Condition: (circle one or more)
Excellent - < 10 years with no visible cracks Good – 10 to 20 years with minor hairline cracks
Fair – built after 1950 with many cracks Poor – over 100 years old
Other (explain): ________________________________________________________________
Population Sensitivity: (circle one or more)
No vibration sensitive equipment/or processes Private residence Small business
Bank or store with computers Large business with sensitive equipment
Dentist or doctor’s office Medical research labs Hospital or nursing home
Vibration sensitive manufacturing process or equipment
Other (explain) __________________________________________________________________
Seismograph/Sensor Information
Seismograph (make & model): _________________ Calibration Date:
___________________
Sensor Location (brief description):
________________________________________________________________________
________________________________________________________________________ Sensor Distance from Vibration Source (ft): ________________________________________________
Readings
Reading Date Reading Time Max PPV (in/sec) Corresponding Type
Frequency (HZ) (long., trans. or vert.)
Continuation Sheet - Contractor Vibration Report Form

42
Reading Date Reading Time Max PPV (in/sec) Corresponding Type
Frequency (HZ) (long., trans. or vert.)

43
APPENDIX D - VIBRATION LEVELS FOR CONSTRUCTION ACTIVITIES
(NHDOT STUDY AND OTHER PUBLISHED DATA)

44
Vibration Source Levels for Construction Equipment from the FTA, 2006 Manual
on Transit Noise and Vibration Assessment
Equipment PPV (in/sec.) at 25 feet Pile driver (impact) upper range 1.518
typical 0.644
Pile Driver (sonic) upper range 0.734
typical 0.170
Clam shovel drop (slurry wall) 0.202
Hydromill (slurry wall) in soil 0.008
in rock 0.017
Vibratory Roller 0.210
Hoe Ram 0.089
Large bulldozer 0.089
Caisson drilling 0.089
Loaded trucks 0.076
Jackhammer 0.035
Small bulldozer 0.003
Source: Information from Vibration Source Levels for Construction Equipment, Federal Transit
Administration. 2006, Transit noise and vibration impact assessment. FTA-VA-90-1003-06. Office of
Planning and Environment, Washington, D.C., Prepared by Harris Miller & Hanson, Inc., Burlington, MA.
Vibrations are measured data from the following sources:
D.J. Martin, “Ground Vibrations from Impact Pile Driving during Road Construction,” Supplementary Report 544, United Kingdom
Department of the Environment, Department of Transport, Transport and Road Research Laboratory, 1980.
J.F. Wiss, “Vibrations During Construction Operations,” Journal of Construction Division, Proc. American Society of Civil Engineers,
100, No. CO3, pp. 239 –246, September 1974.
J.F. Wiss, “Damage Effects of Pile Driving Vibrations,” Highway Research Record, No. 155, Highway Research Board, 1967.
D.A. Towers, “Ground-borne Vibrations from Slurry Wall Trench Excavation for the Central Artery/Tunnel Project Using Hydromill
Technology, “Proceedings of Inter-Noise 95, Newport Beach, CA, July 1995, pp. 227 – 232.
2006 Construction Period Vibration Levels vs. Distance from Source for The
Preferred Alternative (in dBA)
Source: Final Environmental Impact Statement by the U.S. Department of Transportation, Federal Transit
Administration and the Port Authority of New York and New Jersey, Permanent WTC Path Terminal in
Borough of Manhattan, New York County, Chapter 10: Noise and Vibration, May 2005.

45
Vibration Levels Due to Construction Equipment and Traffic at 30M (99 ft)
Converted to English
units
Peak Particle Velocity
(in/sec) 0.2 in/sec
0.148 in/sec
0.029 in/sec
0.049 in/sec
0.011 in/sec
0.010 in/sec
0.003 in/sec
0.49 in/sec
0.295 in/sec
0.118 – 0.197 in/sec
Source: Report on the Pre-Design Studies of Noise and Ground Vibration For N.W.L.R.S., City of Calgary
(Oct. 1986), Appendix C, Vibration Study, Antelope Valley Roadway Project, University of Nebraska,
Lincoln, Nebraska
Readings Compiled from Study of Vibrations due to Construction Activities on
Haleakala
Type of
Construction
Activity
Max. PPV (in/sec) at 25 ft
Max. PPV (in/sec) at 50 ft
Max. PPV (in/sec) at 75 ft
Max. PPV (in/sec) at 100 ft
Max. PPV (in/sec) at 150 ft
Excavator 0.175 0.109 0.0425 0.065 0.0488
Backhoe 0.028 0.015 -------- -------- ---------
Loader 0.0263 ------- -------- -------- ---------
Vehicle (large semi-
truck)
--------- 0.010 0.0475 --------- 0.010
Backhoe with hammer 0.120 0.0438 --------- 0.019 --------
Excavator with hammer 0.325 0.070 0.050 0.0325 --------
_ Source: Readings compiled from Study of Vibrations due to Construction Activities on Haleakala, LeEllen
Phelps, Mechanical Engineering Group, Document TN-0113, Revision A, ATST (Advanced Technology
Solar Telescope), Appendix Q: Vibration Study, July 8, 2009.

46
Approximate Generated Vibration Levels for Various Sources Note: Equivalent English measurements included
1 mm = 0.03937 inches
1 meter = 3.2808 feet
Activity Typical levels of ground vibrations Vibratory rollers Up to 1.5 mm/s (.059 in/sec) at distances of 25 m (82 ft)
Higher levels could occur at closer distances; however, no damage would be
expected for any building at distances greater than approximately 12 m (39.4 ft)
(for a medium to heavy roller)
Hydraulic rock breakers
(levels typical of a large rock
breaker operating in hard
sandstone)
mm/s (.177 in/sec) at 5 m (16.4 ft)
1.30 mm/s (.051 in/sec) at 10 m (32.8 ft)
0.4 mm/s (.0157 in/sec) at 20 m 65.6 ft)
0.10 mm/s (.0039 in/sec) at 50 m (164 ft)
Compactor 20 mm/s (0.787 in/sec) at distances of approximately 5 m (16.4 ft), 2 mm/s
(.0787 in/sec) at distances of 15 m (49.2 ft). At distances greater than 30 m
(98.4 ft), vibrations is usually below 0.3 mm/s (.0118 in/sec)
Pile driving/removal 1 mm/s (.0394 in/sec) to 3 mm/s 0.118 in/sec) at distances of 25 m (82 ft) to 50
m (164 ft) depending on soil conditions and the energy of the pile driving
hammer
Theses levels are well below the threshold of any possibility of damage to
structures in the vicinity of these works. At closer distances to the piling
operations, some compaction of loose fill would occur due to vibratory
effects
Bulldozers 1 mm/s (.0394 in/sec) to 2 mm/s (.0787 in/sec) at distances of approximately 5
m (16.4 ft). At distances greater than 20 m (65.6 ft), vibration is usually below
0.2 mm/s (.00787 in/sec).
Air track drill 4 mm/s (.157 in/sec) to 5 mm/s (.197 in/sec) at a distance of approximately 5 m
(16.4 ft) , and 1.5 mm/s (.059 in/sec) at 10 m (32.8 ft). At distances greater than
25 m (82 ft) vibration is usually below 0.6 mm/s (.0236 in/sec), and at 50 m
(164 ft) or more, vibration is usually below 0.1 mm/s (.00394 in/sec).
Truck traffic - over normal
(smooth)
road surfaces
0.01 mm/s (.0039 in/sec) to 0.2 mm/s (.00787 in/sec) at the footings of buildings
located 10 (32.8 ft) to 20 m (65.6 ft) from a roadway
Truck traffic
(over irregular surfaces)
0.1 mm/s (.00394 in/sec) to 2.0 mm/s (.0787 in/sec) at the footings of buildings
located 10 m (32.8 ft) to 20 m (65.6 ft) from a roadway
Source: Northern Expressway Environmental Report, Volume 2, Vibrations, prepared by Kellogg Brown
& Root Pty. Ltd., Sinclair Knight Merz Pty. Ltd., QED Pty. Ltd., Department for Transport Energy and
Infrastructure, Government of South Australia, March 2007.

47
Measured Vibration Parameters for Selected Sources
in/sec
.126
.083
.020
.0039 - .0079
.0039
.0039
.727
N/A
.205
.150
.0079
.0039
15 meters equals 49.2 feet
Source: Impacts of Construction Vibrations on Rock Pinnacles and Natural Bridges,
General Hitchcock Highway, Tucson, AZ, Ken W. King of Geologic and Geophysical
Consulting, Lakewood, CO and Matthew J. DeMarco of Central Federal Lands Highway
Division, FHWA, Denver Federal Center, Denver, CO.
NHDOT Modified Formula
Predicting PPV (in/sec) based on distance from vibration source for
NHDOT projects (The Federal Transit Administration equation has been
revised based on NHDOT measured vibration levels)
1.1
FTA Equation PPV equip = PPV ref X (25/D)
Note: Solving the Federal Transit Administration (FTA, 2006 Manual on Transit Noise and Vibration Assessment)
equation for predicting vibration levels of construction equipment utilizing a power of 1.1 at distances (D) greater than
25 feet results in closer agreement with the data collected in the NHDOT investigation. The FTA utilizes a power of
1.5.
Where: PPV (equip) is the peak particle velocity (in/sec) of the equipment
adjusted for distance
PPV (ref) is the reference peak particle velocity (in/sec) at 25 feet from
the FTA table (refer to Appendix D)
D is the distance from the equipment to the receiver

48
NHDOT Vibration Levels for Construction Activities
Measured Range of PPV (in/sec.) on NHDOT Projects at a Distance of 50 feet or less
Equipment PPV (in/sec.) at 50 feet or less Sheet Pile Driver (impact) 0.10 to 0.36
Pavement Breaker 0.28 to 0.49
Vibratory Roller 0.11 to 0.78
Hoe Ram 0.07 to 0.49
Excavator 0.02 to 0.06
Loaded Dump Body Trucks on gravel haul road 0.010 to 0.03
Tracked Equipment on pavement 0.095 to 0.328
Small Dozer 0.03 to 0.11
Source: Vibrations measured on NHDOT projects
Note: These limits will change as additional information is collected on a variety of construction activities
at numerous sites with a broad range of conditions. A significant variation in ground vibration levels can
be measured from construction activities.
Predicted Peak Particle Velocity on NHDOT Projects
Predicted Peak Particle Velocity (PPV) on NHDOT Projects at a distance of 50 ft., 75 ft.,
100 ft. (use average PPV of measured range from table above as the reference peak
particle velocity at 25 feet; calculate peak particle velocity utilizing FTA formula at a
power of 1.1)
Equipment Reference PPV
at 25 ft.
Estimated PPV
at 50 ft.
Estimated PPV
at 75 ft.
Estimated PPV
at 100 ft.
Sheet Pile Driver (impact) .23 .107 .068 .050
Pavement Breaker .39 .182 .115 .085
Vibratory Roller .45 .210 .133 .098
Hoe Ram .28 .131 .083 .061
Excavator .04 .019 .012 .009
Loaded Dump Body
Trucks on gravel haul road
.02 .009 .006 .004
Tracked Equipment on
pavement
.21 .016 .062 .046
Small Dozer .07 .033 .021 .015

49
APPENDIX E - CONSTRUCTION VIBRATION DATABASE USER’S GUIDE

50
This page intentionally left blank

VIBRATIONS
USER’S GUIDE
Developed and maintained by DoIT-ASD-SMD
Last changed: 10/27/2008

2
VIBRATIONS – Table of Contents Page
Main Menu 3
Vibration Events Screen 4
Navigation Buttons 5
Searching 6
Entering Event, Soil And Sensor Information 7
GINT Information 8
Deleting Records 9
Reports 10
Maintenance Menu 12

3
VIBRATIONS APPLICATION
The Vibrations application was developed October 2008 in MS Access 2000 for the
NHDOT Bureau of Materials and Research, Geotechnical Section for Krystle Pelham.
The application’s production location:
\\Hzndotfile1\SB42\Vibrations\SB42\Vibrations.mdb
The daily scheduled job B42ProjectDataWH_Feed.cmd runs on server DBT2 which
loads project data from the data warehouse and calls mcrLoadGintData which loads
GINT data in to Vibrations database.
note: after 20 minutes of inactivity the Vibrations application will automatically close.
MAIN MENU
From the Vibrations main menu you can navigate to the Vibration Events screen, Reports
or Maintenance screens.
Click Exit to close and exit the system.
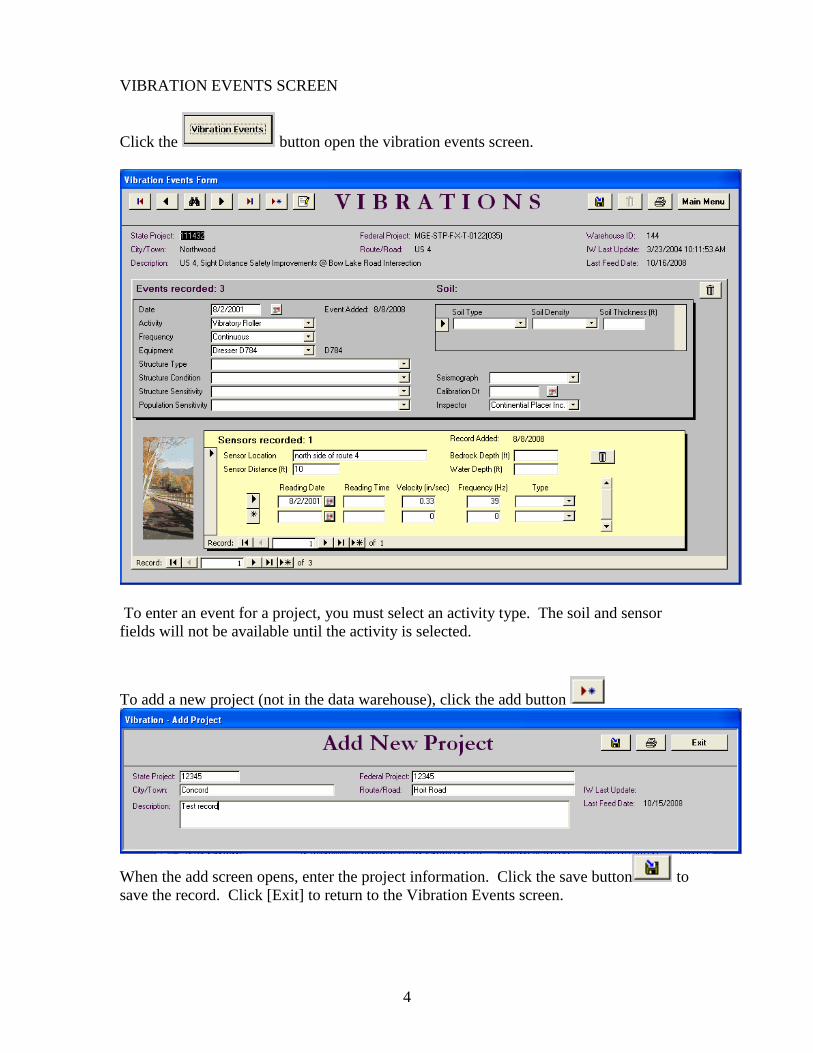
4
VIBRATION EVENTS SCREEN
Click the button open the vibration events screen.
To enter an event for a project, you must select an activity type. The soil and sensor
fields will not be available until the activity is selected.
To add a new project (not in the data warehouse), click the add button
When the add screen opens, enter the project information. Click the save button to
save the record. Click [Exit] to return to the Vibration Events screen.

5
NAVIGATION BUTTONS
On the top of the Vibration Events form are navigation buttons. Move the mouse pointer
over the button to display the button’s description.
- go to the First record
- go to the Previous record
- Find a record
- go to the Next record
- go to the Last record
- Add a new record
- Edit the project record
- Save the record
- Delete the project, event or sensor record.*
- Print the project record
- return to the Vibration main menu
- open the Calendar window to select an event date, calibration date or sensor reading
date.
Click on the date then click the [Ok] button. The date selected will be returned to the
appropriate date field.
SEARCHING
To find a record, click the button to open the Find window.

6
Enter your search criteria in “Find What:”
Change “Look In:” to ‘Vibration Events Form” to search in all fields or change to ‘State
Project’ to search only in the state project field.
You can change “Match:” to ‘Any Part of Field’, ‘Whole Field’ or , ‘Start of Field’.
Click to find the next criteria match.

7
ENTERING EVENT, SOIL and SENSOR INFORMATION
To add a new event or sensor record, click the button.
You must enter the event activity type; all other event fields are optional.
The ‘Events recorded’ will display the number of events for the project.
The same count is displayed for the number of sensor records for the project.
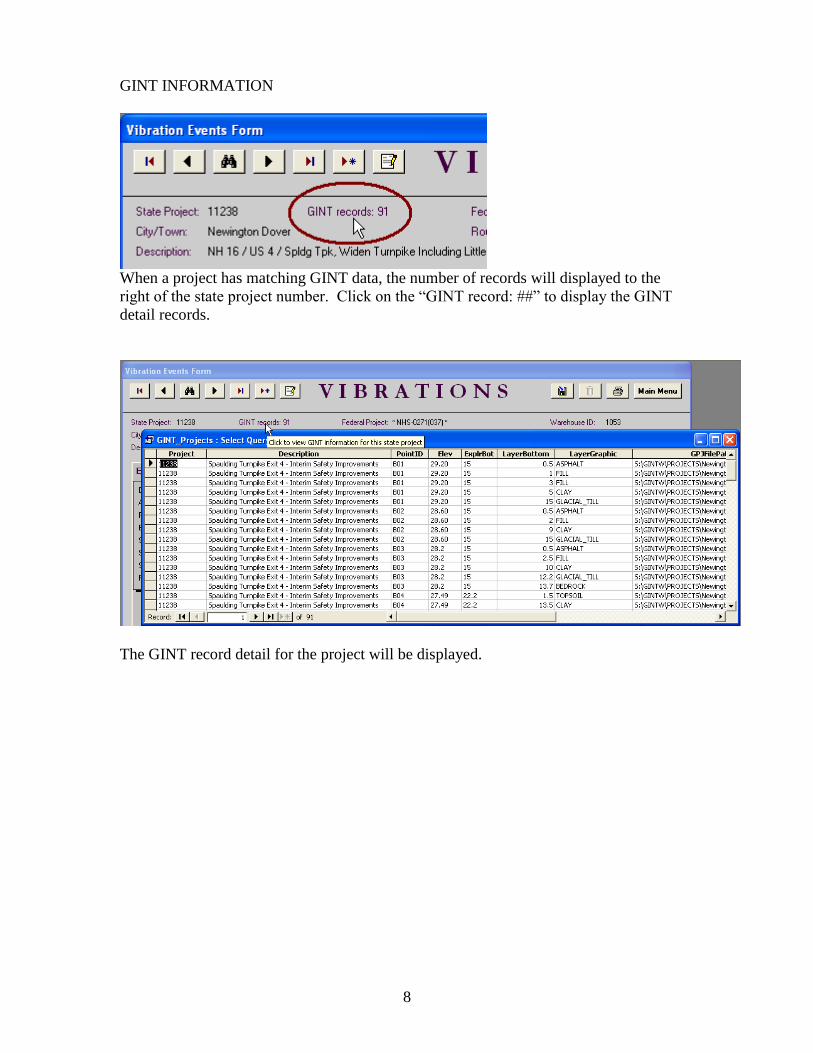
8
GINT INFORMATION
When a project has matching GINT data, the number of records will displayed to the
right of the state project number. Click on the “GINT record: ##” to display the GINT
detail records.
The GINT record detail for the project will be displayed.

9
DELETING RECORDS
There is a delete button in the project, event and sensor locations on the Vibrations
screen. When you delete a project, the related events, soil and sensor information will
also be deleted.
note: the project delete button is only available for projects that were manually added.
To delete records where there is not a specific delete button, click the on the row to
be deleted, then press the [Delete] key.

10
REPORTS
Click the button open the vibrations reports screen.
You must select the activity type to run the either activity reports.
All other fields are optional.
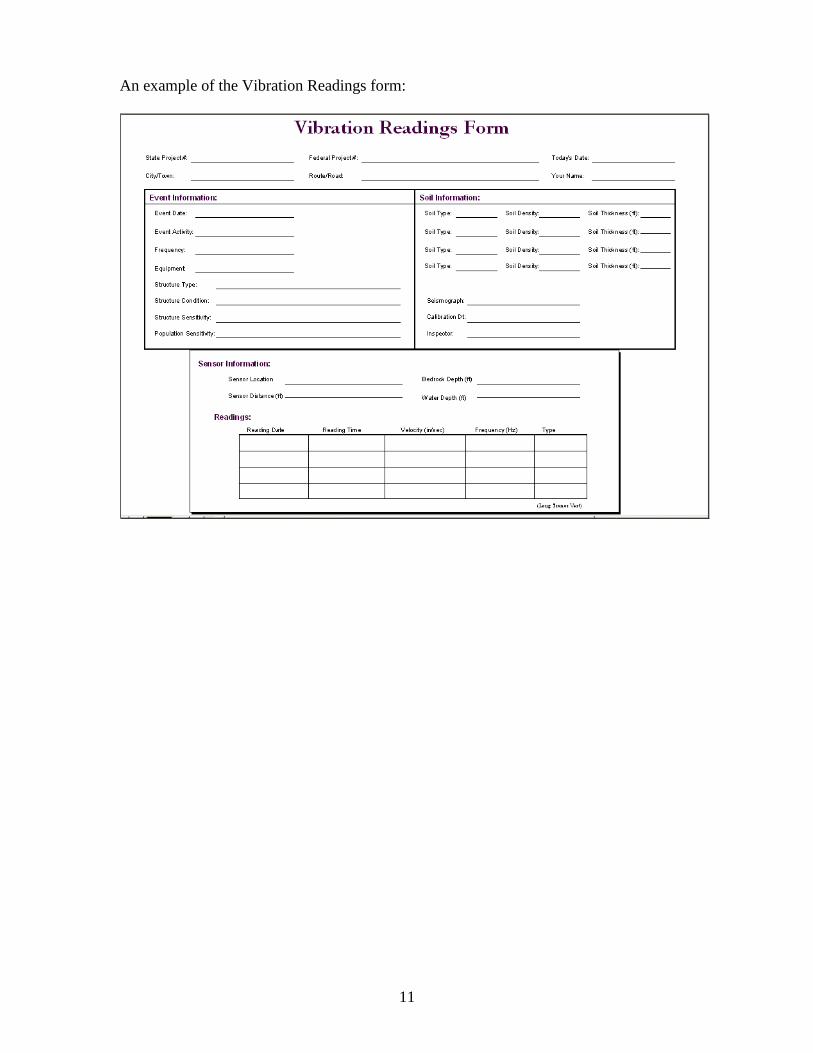
11
An example of the Vibration Readings form:

12
MAINTENANCE MENU
Click the button open the vibrations maintenance menu.
The “Listing Nbr” fields in some maintenance screens is available for you to determine,
from lowest to highest, the order in which the items will be displayed in the pull-down
fields.
In this example, the activity types will be presented in the pull-down in the listing number
order.
EXIT

13
Press the button to exit the Vibrations system.


