Download - TECHNICAL REPORT - Alberta Energy Regulator

i
TECHNICAL REPORT
June 10,
2018
Update of Equipment, Component and Fugitive Emission Factors for Alberta Upstream Oil and Gas.
Prepared For: Alberta Energy Regulator
Suite 1000, 250 – 5 Street SW
Calgary, Alberta T2P 0R4
Prepared by: Clearstone Engineering Ltd.
700, 900-6th Avenue S.W.
Calgary, AB, T2P 3K2
and Carleton University
1125 Colonel By Drive
Ottawa, ON, K1S 5B6
Contact: Yori Jamin, M.Sc., P.Eng. Telephone: 403-215-2733 E-mail: [email protected]

i
DISCLAIMER
While reasonable effort has been made to ensure the accuracy, reliability and
completeness of the information presented herein, this report is made available without
any representation as to its use in any particular situation and on the strict understanding
that each reader accepts full liability for the application of its contents, regardless of any
fault or negligence of Clearstone Engineering Ltd.

ii
EXECUTIVE SUMMARY
This report describes the field campaign conducted at Alberta upstream oil and natural gas
(UOG) sites from 14 August to 23 September 2017 and methodology applied to determine
average factors and confidence intervals for the following parameters.
Process equipment count per facility subtype1 or well status code2.
Component count per process equipment unit3.
Emission control type per process equipment unit.
Pneumatic device count per facility subtype or well status code by device and driver
types.
Leak rate per component and service type 4 considering the entire population of
components with the potential to leak (i.e., ‘population average’ factor).
Leak rate per component and service type considering leaking components only (i.e.,
‘leaker’ factor).
The study was completed under the authority of the Alberta Energy Regulator (AER) and funded
by Natural Resources Canada (NRCan) with the objective of improving confidence in methane
emissions from Alberta UOG fugitive equipment leaks, pneumatic devices and reciprocating rod-
packings. Results are intended for an emission inventory model used to predict
equipment/component counts, uncertainties and air emissions associated with UOG facility and
well identifiers.
Fugitive equipment leaks and pneumatic venting sources are targeted by this study because they
contribute approximately 17 and 23 percent, respectively, of methane emissions in the 2011
national inventory (ECCC, 2014) and are based on uncertain assumptions regarding the
population of UOG equipment and components. Moreover, a 2014 leak factor update report
published by the Canadian Association of Petroleum Producers (CAPP) recommended
equipment and component counts be refined based on field inventories and standardized
definitions because of limitations encountered when determining these from measurement
schematics, process flow diagrams (PFD) or piping and instrumentation diagrams (P&ID)
(CAPP, 2014 sections 4.1.1 and 4.2.1).
1 Facility subtypes are defined in Table 2 of AER Manual 011 (AER, 2016b).
2 Well status codes are defined by the four category types: fluid, mode, type and structure.
3 Process equipment units are defined in Appendix Section 8.4.
4 Component types and service types are defined in Appendix Sections 8.2 and 8.3.

iii
Scope
The scope of this study targets UOG wells, multi-well batteries, and compressor stations
belonging to AER facility subtypes contributing the most to UOG methane emission uncertainty.
Larger UOG facilities and oil sands operations are specifically excluded from this study because
they are often subject to regulated emission quantification, verification and compliance
requirements that motivate accurate, complete and consistent methane emission reporting.
The field sampling plan follows the fugitive emission measurement protocol recommended by
the Canadian Energy Partnership for Environmental Innovation (CEPEI, 2006) with the optical
gas imaging (OGI) method used for leak detection. The field campaign targeted UOG wells,
multi-well batteries, and compressor stations belonging to the following UOG industry segments
(and AER facility subtypes) contributing the most to UOG methane emission uncertainty.
Candidate sample locations were randomly selected from subtype populations with surveys
completed at as many sites as budgeted resources allowed.
Natural Gas Production (subtypes 351, 361, 362, 363, 364, 365, 366, 367, 601, 621 & 622)
Light and Crude Oil Production (subtypes 311, 321 and 322)
Cold Heavy Crude Oil Production (subtypes 331, 341, 342, 343 and 611)
Data collection and leak surveys were completed at 333 locations, operated by 63 different
companies, and included 241 production accounting reporting entities and 440 UWIs. This
sample data represents the vintage, production characteristics and regulatory oversight
corresponding to UOG facilities operating in Alberta during 2017. The geographic distribution
of survey locations is illustrated in Figure ES-1.

iv
Figure ES-1: Survey locations and facility subtypes for the 2017 measurement campaign.
Data Collection and QA/QC
Field measurements and data collection was led by Greenpath Energy Ltd. (Greenpath).
Greenpath technicians were paired with an AER inspector or a Clearstone engineer to enhance
field team depth with respect to regulatory inspections and process knowledge. Before beginning
the campaign, all field team members attended three days of project-specific desktop and field
training. Standardized data collection methods and strict definitions for component, equipment,
service, emission and facility type are documented in the sampling plan and used by field teams.
Other quality assurance (QA) measures implemented to ensure reliable field data included:
Use of leak detection and measurement equipment appropriate for the site conditions and
source characteristics encountered at UOG facilities. Equipment is regularly serviced and
maintained in accordance with the manufacturer’s specifications.

v
Field observations were documented in a complete and consistent manner using a
software application designed for this project. The application was installed on tablets
and pre-populated with site identifiers and standard definitions that enabled selection
from drop-down menus (instead of free-form data entry).
Photos were taken of each site placard (to confirm surveyed locations) and each
equipment unit (to confirm the correct equipment type was selected and reasonable
component counts were completed).
Infrared (IR) camera videos were recorded to confirm the component type and leak
magnitude.
Tablet data was uploaded to an online repository at the end of each working day to
minimize data loss risk (e.g., due to damaged or lost tablets). Backup archive files were
checked at the end of the field campaign to confirm no data leakage occurred.
Parsing of tablet records into an SQL database was automated to minimize processing
time and transcription errors.
The data collected was tested according to the following quality control (QC) procedures:
Records were reviewed by the field team coordinator on a daily basis to identify and
mitigate data collection errors. When observed, problematic records were corrected and
communicated to the entire field team to prevent future occurrences.
The possibility of data leakage between the field tablets and final SQL database was
checked by comparing tablet archives to final database records.
Site placard photos, equipment photos, IR videos and measurement schematics were used
during post survey processing to determine the validity of data outliers.
Various post-processing statistical tests and quality control checks were performed on the
data to ensure records are correctly classified and representative of process conditions.
Raw data records were provided to the operator of each site surveyed. Written feedback
regarding data corrections were received from five operators and refinements made to the
dataset.
Observational and measurement data are assigned to corresponding AER facility and well
identifiers based on measurement schematics provided by subject operators. Field observations
are correlated to Facility IDs and UWIs so that the resulting factors are representative and
applicable to the AER regulated UOG industry managed with Petrinex data models.
Uncertainty Analysis
It is good practice to evaluate the uncertainties in all measurement results and in the emission
calculation parameters derived from these results. Quantification of these uncertainties ultimately
facilitates the prioritization of efforts to improve the accuracy of emissions inventories developed
using these data. Measurement uncertainty arises from inaccuracy in the measuring equipment,

vi
random variation in the quantities measured and approximations in data-reduction relations.
These individual uncertainties propagate through the data acquisition and reduction sequences to
yield a final uncertainty in the measurement result. Two types of uncertainties are encountered
when measuring variables: systematic (or bias) and random (or precision) uncertainties (Wheeler
and Ganji, 2004). Confidence intervals for study results are determined using the bootstrapping
method and adopt the IPCC (2000) Good Practice Guidance suggestion to use a 95% confidence
level (i.e., the interval that has a 95% probability of containing the unknown true value) and Tier
1 rules for error propagation.
Bootstrapping is a statistical resampling method which is typically used to estimate population
variables/parameters from empirically sampled data (Efron, and Tibshirani, 1993). Bootstrapping
as a method is non-parametric and does not rely on common assumptions such as normality, data
symmetry or even knowledge of the data’s underlying distribution. It is applied by other studies
investigating ‘heavy-tailed’ leak distributions and is shown to increase the width of confidence
intervals by increasing the upper bound (Brandt et al, 2016). The one main underlying
assumption behind bootstrapping, for the results to be reliable, is that the sample set is
representative of the population.
Results for Process Equipment and Components
Process equipment and components (greater than 0.5” NPS) in pressurized hydrocarbon service
were counted and classified according to standardized definitions presented in Appendix Section
8. Equipment and component schedules are used to estimate the number of potential hydrocarbon
vapour leak sources exist in the Alberta UOG industry. Process equipment and components
entirely in water, air5, lubricating oil and non-volatile chemical service were not included in the
inventory because they are less likely to emit hydrocarbons. Factors representing the average
(mean) number of equipment units per facility subtype or well status are calculated by dividing
the total equipment count by the total number of sites surveyed for each of the stratums
considered. Average counts and confidence intervals are determined for 27 process equipment
types observed at 11 facility subtypes and 12 well status codes. Results for facility subtypes are
presented in Table 3 of the report body while results for well status codes are in Table 4.
In addition to counting components, the following emission controls were noted by field
inspectors when installed on subject process equipment units.
Gas Conserved – where natural gas is captured and sold, used as fuel, injected into
reservoirs for pressure maintenance or other beneficial purpose.
Gas tied to flare – where natural gas is captured and disposed by thermal oxidization in a
flare or incinerator.
5 Pneumatic devices driven by instrument air were inventoried as discussed in Section 3.4. The air compressor and
piping were not inventoried.

vii
Gas tied to scrubber – where natural gas is captured and specific substances of concern
(e.g., H2S or other odourous compounds) are removed via adsorption or catalytic
technologies.
Average emission control per subject equipment units are presented in Table ES-1. These results
consider the frequency controls are observed and the estimated control efficiency for preventing
the release of natural gas to the atmosphere (i.e., how much of the subject gas stream is captured
and combusted/conserved over an extended period of time). Because control efficiency
assessment was beyond the scope of the 2017 field campaign, a conservative estimate of 95
percent is adopted for conservation and flaring (from CCME, 1995 6 ) while scrubbers are
assigned 0 control because they prevent very little of subject natural gas streams from being
released to atmosphere.
Table ES-1: Average (mean) emission control & confidence interval per equipment unit.
Description of Control Process
Equipment
Count
Control
Count
Average
Control
Factor
95% Confidence Interval
(%of mean)
Lower Upper
Storage tank tied into flare or
conserved
213 46 0.21 28% 31%
Storage tank tied into scrubber 213 3 0.00 - -
Compressor rod-packing vent
tied into flare or conserved
54 7 0.12 65% 72%
Pop tank tied into flare or
conserved
20 2 0.10 100% 123%
The average (mean) number of components in hydrocarbon process gas or liquid service per
process equipment type is calculated for the following component types. Results with confidence
intervals are presented in Table 5 of the report body.
Reciprocating Compressor Rod-Packing,
Connector,
Control Valve,
Meter,
Open-Ended Line,
Pressure Relief Valves and Pressure Safety Valves (PRV/PSV),
Pump Seal,
Regulator,
Thief Hatch,
Valve, and
Well Surface Casing Vent (SCVF).
6 This is the minimum performance required by CCME (1995) for vapour control systems.
viii
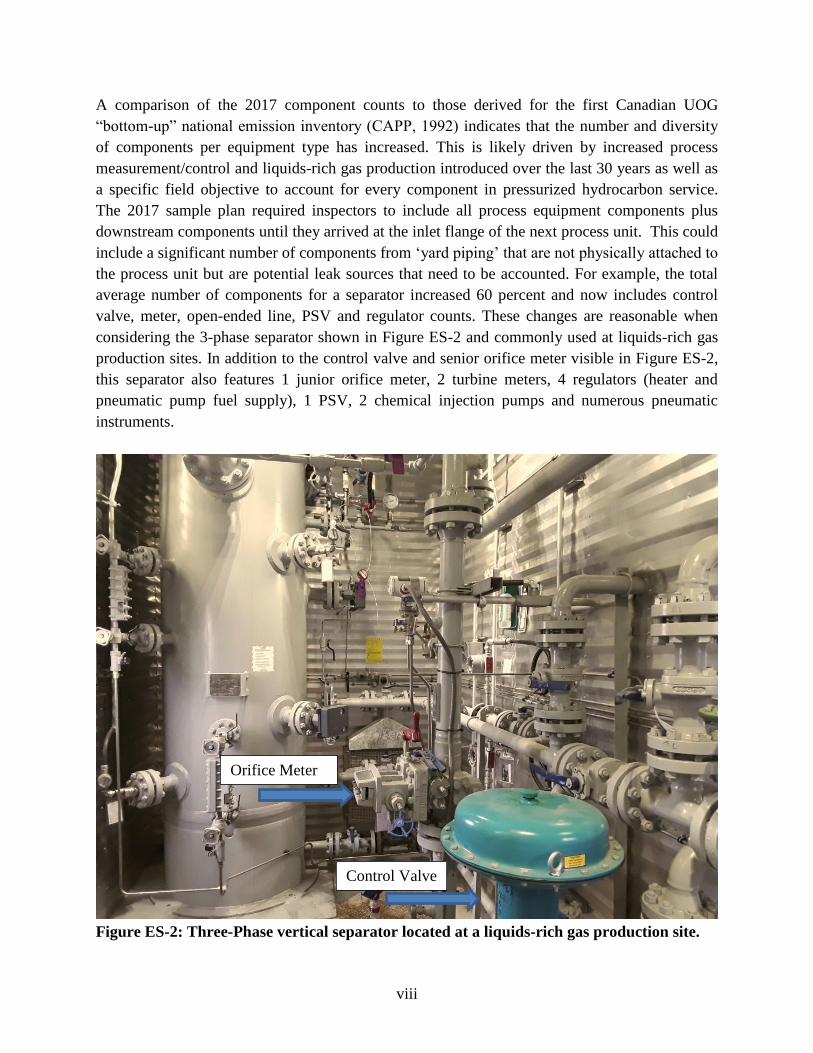
A comparison of the 2017 component counts to those derived for the first Canadian UOG
“bottom-up” national emission inventory (CAPP, 1992) indicates that the number and diversity
of components per equipment type has increased. This is likely driven by increased process
measurement/control and liquids-rich gas production introduced over the last 30 years as well as
a specific field objective to account for every component in pressurized hydrocarbon service.
The 2017 sample plan required inspectors to include all process equipment components plus
downstream components until they arrived at the inlet flange of the next process unit. This could
include a significant number of components from ‘yard piping’ that are not physically attached to
the process unit but are potential leak sources that need to be accounted. For example, the total
average number of components for a separator increased 60 percent and now includes control
valve, meter, open-ended line, PSV and regulator counts. These changes are reasonable when
considering the 3-phase separator shown in Figure ES-2 and commonly used at liquids-rich gas
production sites. In addition to the control valve and senior orifice meter visible in Figure ES-2,
this separator also features 1 junior orifice meter, 2 turbine meters, 4 regulators (heater and
pneumatic pump fuel supply), 1 PSV, 2 chemical injection pumps and numerous pneumatic
instruments.
Figure ES-2: Three-Phase vertical separator located at a liquids-rich gas production site.
Orifice Meter
Control Valve

ix
Results for Pneumatic Devices
Pneumatic devices driven by natural gas, propane, instrument air and electricity were inventoried
at each location surveyed in 2017. To increase the sample size, pneumatic inventory data
collected in 2016 by Greenpath Energy Ltd. for the AER was considered for this assessment
(Greenpath, 2017a). Devices are included in this study when sufficient information was available
to assign 2016 records to a Facility ID or UWI (otherwise the data record was discarded). The
final dataset includes 1753 devices from the 2017 field campaign plus 1105 devices from the
2016 field campaign.
The average (mean) number of pneumatic devices per facility subtype and well status are
presented in the report body Table 7 and Table 8 according to device (e.g., level controllers,
positioners, pressure controllers, transducers, chemical pumps and intermittent) and driver type
(e.g., instrument air, propane and electric). The factors for natural gas driven devices should be
adopted for GHG emission inventory purposes. Factors for propane (relevant to volatile organic
compound (VOC) emissions), instrument air and electric driven devices provide some insight
into the installation frequency of non-emitting devices. Given the large number of wells and their
tendency to rely on natural gas, well-site pneumatics are a noteworthy contributor to total
methane emissions in Alberta and deserve careful consideration when developing province-wide
emission inventories.
Devices that provide the following control actions are the dominant contributors to pneumatic
venting emissions and account for 2,289 of the 2,858 pneumatic devices observed during 2016
and 2017 surveys.
Level Controller
Positioner
Pressure Controller
Chemical Pump
Transducer
Figure ES-3 delineates the pneumatic inventory by device type and driver type. The majority of
devices are driven by natural gas while approximately 30 percent of devices utilize alternative
drivers (instrument air, propane or electricity) that do not directly contribute methane emissions.

x
Figure ES-3: Pneumatic counts, by device type and driver type, observed at Alberta UOG
facilities and wells during 2016 and 2017 field campaigns.
Devices that provide the following control actions typically vent at rates well below 0.17 m3 per
hour or only during infrequent unloading (de-energizing) events. Therefore, subject models are
aggregated and presented as device type “Intermittent” in report tables. This simplifies emission
inventory development efforts and is reasonable for devices that contributes very little to total
methane emissions.
High Level Shut Down
High Pressure Shut Down
Level Switch
Plunger Lift Controller
Pressure Switch
Temperature Switch
Because pneumatic venting rates were not measured during the 2017 and 2016 field campaigns,
other studies are relied on to determine vent rates representative of each device type. Emission
factors presented in Table ES-2 are a sample-size weighted average of mean bleed rates from

xi
2013 Prasino and 2018 Spartan (Fisher L2 level controller7) studies as well as manufacturer
specifications for less common models (Prasino, 2013 and Spartan, 2018). The factor labeled
‘generic pneumatic instrument’ includes high and low-bleed instruments that continuously vent.
The ‘generic pneumatic instrument’ vent rate of 0.3217 m3/hr is greater than the ‘generic high
bleed controller’ vent rate published in the Prasino study (0.2605 m3/hr) largely because of the
revised level controller factor published by Spartan (i.e., 0.46 m3/hr ± 22% versus the Prasino
factor of 0.2641 m3/hr ± 34%) and the large number of level controllers in the study population.
Interestingly, the ‘generic pneumatic instrument’ vent rate is only 9 percent less than the rate
applied in the last national inventory (i.e., 0.354 m3/hr in ECCC, 2014). The same isn’t true for
chemical pumps, a rate of 0.236 m3/hr was applied in the last national inventory which is 4 times
less than the rate presented in Table ES-2.
Table ES-2: Sample-size weighted average vent rates for pneumatic device types observed
during 2016 and 2017 field campaigns.
Device Type Average Vent Rate
(m3 natural gas/hour)
95% Confidence Interval
(% of mean)
Level Controller 0.3508 31.68
Positioner 0.2627 39.02
Pressure Controller 0.3217 35.95
Transducer 0.2335 22.54
Generic Pneumatic Instrument 0.3206 31.53
Chemical Pump 0.9726 13.99
Results for Fugitive Emission Factors
Emission factors for estimating fugitive equipment leaks are normally evaluated by type of
component and service category within an industry sector. This allows the factors to be broadly
applied within the sector provided component populations are known. There are two basic types
of emission factors that may be used to estimate emissions from fugitive equipment leaks: those
that are applied to the results of leak detection or screening programs (e.g., leak/no-leak and
stratified emission factors), and those that those that do not require any screening information
and are simply applied to an inventory of the potential leak sources (i.e., population average
emissions factors). Population average emission factors are determined by summing measured
leak rates and dividing by the total number of potential leak sources (i.e., components) for each
component/service type of interest. End users multiply population average factors by the entire
component population in pressurized hydrocarbon service belonging to the facilities/wells of
interest.
7 Further investigation of level controllers was completed by Spartan (with the support of PTAC) because of
concerns that the 2013 Prasino study did not adequately capture emission contributions from the transient sate. The
mean vent rate from Spartan (0.46 m3/hr ± 22% based on 72 samples) is used to determine level controller rate in
Table 16 instead the Prasino factor (0.2641 m3/hr ± 34% based on 48 samples).

xii
“Leaker” emission factors are determined in the same manner but the denominator only includes
the number of leaking components. End users conduct an OGI survey and multiply the number
of leaking components by the corresponding component and service type “leaker” factor.
Fugitive emissions estimated using this approach should provide better accuracy and
identification of high leak-risk components and facilities than population average factors.
However, direct measurement of detected leaks is more accurate and provides valuable insight
regarding leak magnitude and frequency distributions that are not available from emission factor
approaches. For example, Figure ES-4 indicates that a small number of leaks contribute most of
the fugitive emissions for a given component population. The top 10 sites represent most (about
65 percent) of the total leak rate measured during the 2017 campaign with the single largest leak
(a SCVF) representing 35 percent of the total leak rate. This is a highly skewed distribution with
approximately 16 percent of the leaking components responsible for 80 percent of the total leak
rate. This result is consistent with other studies and indicates “super-emitters” are present in the
2017 sample population.
Population average emission factor results are presented on a volume and mass basis in Table
ES-3 by component and service type. ‘Leaker’ emissions factors for the same stratums are
presented in Table ES-4. ‘No-leak’ emission factors are not determined in this study because the
High-Flow Sampler method detection limit (MDL) is not sensitive enough to accurately quantify
leaks below 10,000 ppmv8.
Leak factor results are based on best available OGI survey equipment and technicians currently
providing fugitive emission services for the Canadian UOG industry. Notwithstanding this and
QAQC efforts, the OGI leak detection and High Flow Sampler measurement methods have
limitations that impact the completeness and accuracy of the subject dataset. Thus, a rigorous
quantitative uncertainty analysis endeavors to identify and account for all parameters
contributing uncertainty to the final emission factors. 2017 confidence limits are generally
greater than historic values primarily because of the following contributions that were
acknowledged but underestimated in historic results (CAPP, 2005 and CAPP, 2014).
Uncertainty in component counts due to field technician variability and bias.
Uncertainty that all leaks are detected by the OGI survey method.
Exceptions where 2017 confidence limits are less than those presented in CAPP, 2014 occur for
components with large no-leak contributions (e.g., connectors, PRV, pump seals and valves).
The 2014 assessment assigned a very large upper confidence limit to no-leak factors (500
percent) which strongly influences population average confidence limits for components with
8 Ideally, no-leak emission factors would be developed using an instrument with precision of 1 ppm, MDL of about
2 ppm above background readings and measurement uncertainty of less than ±1% of reading.

xiii
large no-leak contributions. Whereas, no-leak contributions are not included in 2017 population
average factors. Moreover, no-leak contributions should be calculated as a separate category
when estimating fugitive emissions. When no-leak emission factors are multiplied by the
population of components surveyed in 2017, it’s estimated that leakage occurring below OGI and
High-Flow MDLs is responsible for approximately 38 percent of total equipment leak emissions.
Comparison of 2017 Leak Results with Historic Fugitive Studies
The implications of 2017 emission factors on total fugitive emissions is estimated by multiplying
the component population surveyed in 2017 by population average leak factors from two
reference studies: 2014 CAPP Update of Fugitive Emission Equipment Leak Emission Factors
and 2005 CAPP National Inventory of GHG, CAC and H2S Emissions by the Upstream Oil and
Gas Industry. A comparison of results indicates 2017 and 2014 factors generate about the same
total fugitive emissions which are approximately 60 percent less than those generated using 2005
factors.
Reciprocating Compressor Rod-Packing Leakage Rates Expected by Manufacturers
The largest manufacturer of reciprocating gas compressors indicates typical leakage rates for
packing rings in good condition range from 0.17 m3 to 0.29 m3 per hour per rod-packing while
the ‘alarm’ point for scheduling maintenance ranges from 2.9 m3 to 5.8 m3 per hour per rod-
packing (Ariel, 2018). The probable population average leak rate for rod-packings is 0.2875 m3
THC per hour per rod-packing (with lower and upper confidence limits of 0.1361 and 0.5415 m3
THC per hour). Thus, reciprocating compressors surveyed in 2017 typically vent within
manufacturer tolerances for packing rings in good condition. The upper confidence limit is much
less than the maintenance alarm threshold of 2.9 m3 per hour. Only two measurement records
were greater than 2.9 m3 per hour but because rod-packings vent into a common header, it’s not
known whether the emissions were dominated by one or multiple rod-packings.

14
Table ES-3: Population average emission factors for estimating fugitive emissions from Alberta UOG facilities on a volumea or mass basis.
Sector Component Type Service Leaker
Count
Component
Count
Leak
Frequency
EF
(kg THC
/h/source)
95% Confidence
Limit (% of mean)
EF
(m3 THC
/h/source)
95% Confidence
Limit (% of mean)
Lower Upper Lower Upper
All Compressor Rod-Packingb,c PG 139 0.20622 53% 88% 0.28745 53% 88%
All Connector PG 145 137,391 0.11% 0.00014 32% 53% 0.00019 32% 52%
All Connector LL 6 45,356 0.01% 0.00001 71% 114% 0.00001 70% 120%
All Control Valve PG 16 539 2.97% 0.00487 53% 77% 0.00646 53% 77%
All Meter PG 8 531 1.51% 0.00105 47% 73% 0.00145 47% 70%
All Open-Ended Line PG 10 144 6.95% 0.06700 91% 219% 0.09249 91% 225%
All Pressure Relief Valve PG 7 1,176 0.60% 0.00399 54% 85% 0.00552 53% 79%
All Pump Seal PG 6 178 3.37% 0.00761 73% 142% 0.01057 73% 141%
All Regulator PG 27 3,067 0.88% 0.00112 60% 99% 0.00122 50% 76%
All Thief Hatch PG 6 52 11.46% 0.12870 77% 134% 0.12860 70% 115%
All Valve PG 28 20,545 0.14% 0.00044 64% 112% 0.00058 62% 111%
All Valve LL 6 8,944 0.07% 0.00015 72% 122% 0.00021 73% 120%
All SCVF PG 15 440 3.41% 0.09250 98% 204% 0.12784 98% 196% a Volumes are presented at standard reference conditions of 15ºC and 101.325 kPa. b Reciprocating compressor rod-packing emission factors are calculated on a per rod-packing basis and exclude compressors that are tired into a flare or VRU
(because these rod-packings are controlled and have a very low probability of ever leaking to atmosphere). Rod-packings are defined as vents in Directive 060
(AER, 2018). c Reciprocating Compressor rod-packings vents are typically tied into a common header with measurements conducted on the common vent. Therefore, the actual
number of leaking components and leak frequency are not known.

15
Table ES-4: Leaker emission factors for estimating fugitive emissions from Alberta UOG facilities on a volumea or mass basis.
Sector Component Type Service Leaker
Count
Leaker EF (kg
THC/h/source)
95% Confidence
Limit (% of mean) Leaker EF (sm3
THC/h/source)
95% Confidence
Limit (% of mean)
Lower Upper Lower Upper
All Compressor Rod-Packingb PG 27 1.08150 45% 58% 0.77563 43% 56%
All Connector PG 145 0.13281 19% 21% 0.10137 20% 21%
All Connector LL 6 0.05906 71% 88% 0.04156 70% 85%
All Control Valve PG 16 0.16213 47% 50% 0.12203 48% 52%
All Meter PG 8 0.07201 39% 49% 0.05238 40% 50%
All Open-Ended Line PG 10 0.98904 90% 195% 0.70729 90% 199%
All Pressure Relief Valve PG 7 0.69700 49% 62% 0.50395 49% 63%
All Pump Seal PG 6 0.23659 71% 121% 0.16974 71% 125%
All Regulator PG 27 0.10275 45% 56% 0.09514 56% 79%
All Thief Hatch PG 6 0.81672 67% 83% 0.82401 75% 106%
All Valve PG 28 0.31644 58% 90% 0.24356 60% 97%
All Valve LL 6 0.23098 72% 107% 0.16929 71% 110%
All SCVF PG 15 2.70351 97% 201% 3.74007 97% 189% a Volumes are presented at standard reference conditions of 15ºC and 101.325 kPa. b Because reciprocating compressor rod-packing leakage is routed to common vent lines, the actual number of leakers is not known. The compressor rod-packing
‘leaker’ factor is calculated on a per vent line basis (not per rod-packing basis). Rod-packings are defined as vents in Directive 060 (AER, 2018).

16
Figure ES-4: Distribution of total leak rate by site observed during the 2017 Alberta field campaign (excluding 195 sites where no leaks were detected).

xvii
SCVF Emission Factor
The SCVF component is included in Tables ES-3 and ES-4 to improve emission inventory
transparency and highlight the significance of this source. The population average leak factor
calculated from 15 leaks detected at the 440 wells screened in 2017 is 0.0925 kg THC per hour
which is only 37 percent less than the factor used to estimate SCVF emissions in the last UOG
national inventory (ECCC, 2014). SCVF was the second largest source of methane released by
the UOG industry because of the very large number of potential leak sources (i.e., approximately
150,000 wells in Alberta). The refined emission factor and confidence interval decreases SCVF
contributions to total methane emissions and uncertainty, however, it is expected to remain one
of the top 5 methane emission contributors.
Components in Heavy Liquid Service
Also of note is that zero components in heavy liquid service were observed to be leaking. This is
consistent with results presented in CAPP, 2014 and CAPP, 1992. Population average leak
factors are for components in heavy liquid service are presented in CAPP, 2005 but are at least
one order of magnitude less than light liquid no-leak factors presented in Table 18. All four
studies agree that components in heavy oil service have a very small contribution to total UOG
fugitive emissions.
Comparison of Vent and Leak Emission Rates
In addition to the inventories and leak measurements discussed above, field inspectors recorded
venting emission sources observed with the IR camera and estimated their release magnitude (or
measured the release if convenient to do so with the High Flow Sampler). Moreover, pneumatic
venting is estimated using the average emission factors. Although measurement of venting
sources was not a primary objective for this study, available estimates for pneumatic and process
vent sources enable a qualitative comparison with equipment leaks. Accordingly, the cumulative
natural gas release rate is summed for all emission sources observed during the 2017 field
campaign and presented by emission and source type in Figure ES-5. The largest contributors to
equipment leaks are SCVF and reciprocating compressor rod-packings that represent
approximately 60 percent of the total leak rate.
More importantly, the total leak rate is about 20 percent of the total natural gas released from all
sources. Pneumatic devices (approximately 33 percent of the total release), production tanks
(approximately 28 percent of the total release), heavy oil well casing vents (approximately 16
percent of the total release) and unlit flares (approximately 3 percent of the total release) are
much more important sources natural gas emissions.
Although direct measurement of vent sources is often difficult to complete with the resources
and equipment typically budgeted for leak surveys because of accessibility and process condition
challenges (e.g., transient tank top emissions, dehydrator still columns or unlit flares).

xviii
Qualitative indicators obtained with an IR camera (e.g., the vent is small, large, or very large)
may provide useful information to confirm production accounting completeness and improve the
identification of cost-effective gas conservation or repair opportunities. This approach may
identify venting sources where the release magnitude is not fully appreciated by operators and
represents the small number of sources that contribute the majority of methane emissions.
Although the IR Camera estimates are qualitative and not sufficient for production accounting
purposes; they can identify process venting sources, provide an indication of abnormal behaviour
and trigger root-cause analysis when images indicate a risk of exceeding regulated site venting
limits.
Figure ES-5: Cumulative hourly release rate for emission and source types observed at 333
locations during the 2017 Alberta field campaign.9
9 The venting estimates presented in Figure ES-5 have large, undetermined uncertainties and only provide a
qualitative perspective on natural gas emission sources. Moreover, pneumatic results assume only half of the
inventoried chemical pumps are active because many methanol injections pumps are only active during cold winter
months. Also, in addition to flashing, breathing and working losses; production tank emissions may include
contributions from well casing vents, leaks past liquid dump valves, unintentional gas flow-through from undersized
separators.

xix
TABLE OF CONTENTS
DISCLAIMER.................................................................................................................... i
EXECUTIVE SUMMARY .............................................................................................. ii
TABLE OF CONTENTS .............................................................................................. xix
LIST OF TABLES ........................................................................................................ xxii
LIST OF FIGURES ..................................................................................................... xxiv
LIST OF ACRYNOMS ............................................................................................... xxvi
ACKNOWLEDGEMENTS ....................................................................................... xxvii
1 INTRODUCTION ....................................................................................................... 1
1.1 BACKGROUND ................................................................................................ 2
2 FIELD STUDY............................................................................................................ 5
2.1 Quality Assurance ............................................................................................... 7
2.2 Quality Control ................................................................................................... 8
2.3 Conversion of measured flow rates to THC mass rates ...................................... 9
2.3.1 Conversion of Volumetric Flows from Meter to Standard Conditions ........... 9
2.3.2 Conversion of Volumentric Flows to Mass Flows ....................................... 10
2.3.3 Use of Response Factor ................................................................................ 10
3 METHODOLOGY AND RESULTS ........................................................................ 12
3.1 Process Equipment Counts ............................................................................... 14
3.2 Component Counts............................................................................................ 23
3.3 Emission Controls ............................................................................................. 36
3.4 Pneumatic Device Counts ................................................................................. 37
3.5 Population Average Leak Factors ..................................................................... 51
3.6 ‘Leaker’ Factors ................................................................................................ 54
3.7 Uncertainty Analysis ......................................................................................... 56
3.7.1 Component Counting Uncertainty ................................................................ 57
3.7.2 OGI Leak Detection Uncertainty .................................................................. 58
3.7.3 Bootstrapping Method .................................................................................. 58
4 DISCUSSION ............................................................................................................ 60
4.1 Process Equipment ............................................................................................ 60
4.1.1 Facilities ........................................................................................................ 61
4.1.2 Wells ............................................................................................................. 66
4.2 Components ...................................................................................................... 68
4.3 Pneumatics ........................................................................................................ 80
4.4 Population Average Leak Factors ..................................................................... 82
4.4.1 Contribution of Fugitive Emissions Not Detected By The IR Camera ........ 83
4.4.2 Distribution of 2017 Leaks and “super-Emitters” ........................................ 84
4.4.3 Comparison of 2017 Results with Historic Fugitive Studies ........................ 84

xx
4.4.4 Reciprocating Compressor Rod-Packing Leakage Rates Expected by
Manufacturers ............................................................................................................ 85
4.4.5 SCVF Emission Factor ................................................................................. 86
4.4.6 Components in Heavy Liquid Service .......................................................... 86
4.5 Leaker Factor .................................................................................................... 89
4.6 Comparison of Vent and Leak Emission Rates ................................................ 91
5 CONCLUSIONS AND RECOMMENDATIONS .................................................... 93
5.1 Utilization of Factors ........................................................................................ 95
6 REFERENCES .......................................................................................................... 96
7 APPENDIX – 2017 AER FIELD SAMPLING PLAN ............................................. 99
7.1 Objective ........................................................................................................... 99
7.2 Site Selection .................................................................................................... 99
7.2.1 Target Facilities .......................................................................................... 100
7.2.2 Target Wells ................................................................................................ 104
7.3 Data Collection Procedures (Using the Tablet) .............................................. 105
7.3.1 Process Equipment and Component Counting ........................................... 105
7.3.2 Pneumatic Device Counting ....................................................................... 106
7.3.3 Fugitive and Vent Screening and Measurement ......................................... 106
7.4 Training and QAQC ........................................................................................ 108
7.4.1 Class training .............................................................................................. 108
7.4.2 Field training ............................................................................................... 108
7.4.3 Data Collection Error Management ............................................................ 108
7.4.4 Data Completeness...................................................................................... 109
7.5 Inspector Safety and Conduct ......................................................................... 109
8 APPENDIX – STANDARDIZED DEFINITIONS ................................................. 111
8.1 Emission Types ............................................................................................... 111
8.1.1 Leak............................................................................................................. 111
8.1.2 Vent ............................................................................................................. 111
8.2 Service Types .................................................................................................. 112
8.2.1 Heavy Liquid .............................................................................................. 112
8.2.2 Light Liquid ................................................................................................ 112
8.2.3 Process Gas ................................................................................................. 112
8.3 Component Types ........................................................................................... 112
8.3.1 Reciprocating Compressor Rod-Packings .................................................. 112
8.3.2 Centrifugal Compressor Seals..................................................................... 112
8.3.3 Connectors .................................................................................................. 113
8.3.4 Control Valve .............................................................................................. 113
8.3.5 Meters ......................................................................................................... 113
8.3.6 Open-Ended Lines ...................................................................................... 113
8.3.7 Pressure-Relief Valve ................................................................................. 113

xxi
8.3.8 Pump Seals .................................................................................................. 114
8.3.9 Regulators ................................................................................................... 114
8.3.10 Thief Hatch ............................................................................................. 114
8.3.11 Valves ..................................................................................................... 114
8.3.12 Well Surface Casing Vent Flow (SCVF) ................................................ 114
8.4 Process Equipment Types ............................................................................... 115
8.5 Technology Types ........................................................................................... 124
8.5.1 Leak Detection ............................................................................................ 124 8.5.1.1 Portable Catalytic/Thermal Conductivity Leak Detector............................................................... 124 8.5.1.2 Portable Acoustical Leak Detector ................................................................................................ 125 8.5.1.3 Infrared Camera............................................................................................................................. 125
8.5.2 Leak and Vent Measurement ...................................................................... 126 8.5.2.1 Calibrated Bag ............................................................................................................................... 126 8.5.2.2 Full-flow Flow Meters................................................................................................................... 126 8.5.2.3 Hi-Flow Sampler ........................................................................................................................... 127
8.6 Facility SubType Codes .................................................................................. 128
8.7 Well Status Codes ........................................................................................... 130
9 Appendix - Methodology For Assessing Uncertainties ........................................... 133
9.1 Error Propagation Equations ........................................................................... 133
9.1.1 Combining Uncertainties in Multiplication and Division Steps ................. 134
9.1.2 Combining Uncertainties in Addition and subtraction Steps ...................... 134
9.2 Limitations to Rules of Combination of Uncertainties ................................... 135
9.3 Derivation of Error Propagation Equations .................................................... 135
9.3.1 Uncertainty of multiplication and division ................................................. 138
9.3.2 Uncertainty of Addition and Subtraction .................................................... 139
9.3.3 Uncertainty of Combined Operations ......................................................... 139
10 Appendix - Leak Factors by Sector .................................................................... 141
11 Appendix - Raw Data (Blinded) ......................................................................... 157
xxii
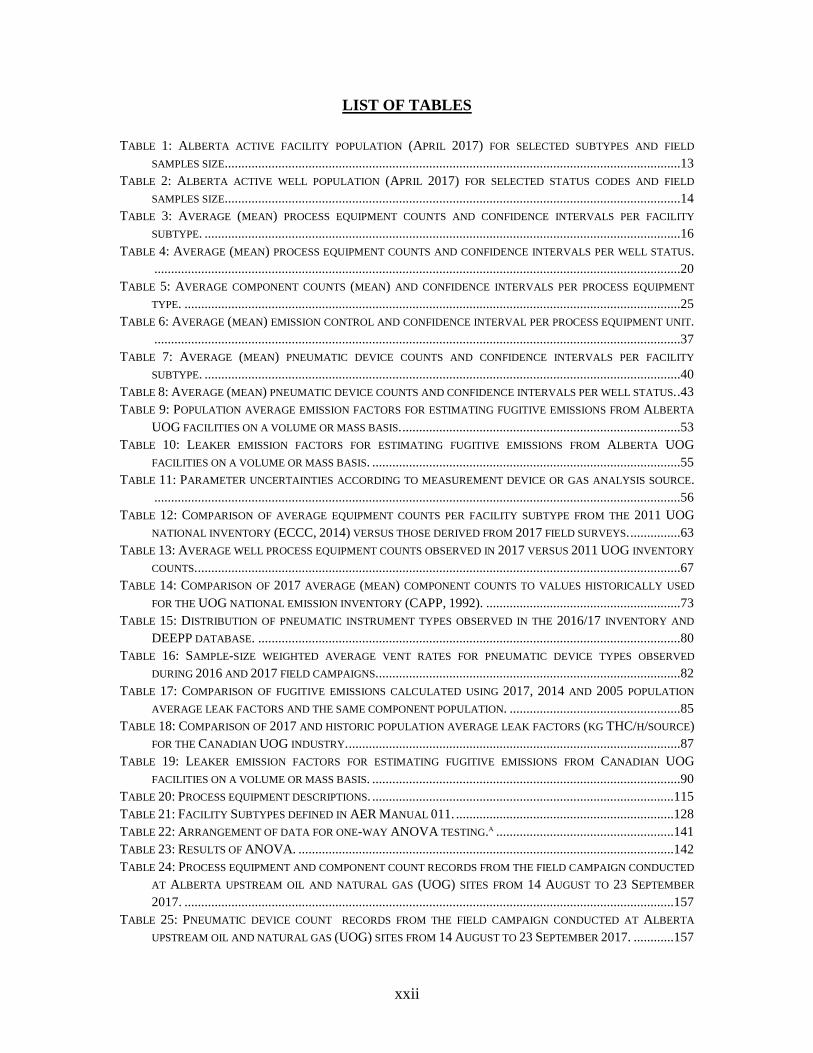
LIST OF TABLES
TABLE 1: ALBERTA ACTIVE FACILITY POPULATION (APRIL 2017) FOR SELECTED SUBTYPES AND FIELD
SAMPLES SIZE........................................................................................................................................13 TABLE 2: ALBERTA ACTIVE WELL POPULATION (APRIL 2017) FOR SELECTED STATUS CODES AND FIELD
SAMPLES SIZE........................................................................................................................................14 TABLE 3: AVERAGE (MEAN) PROCESS EQUIPMENT COUNTS AND CONFIDENCE INTERVALS PER FACILITY
SUBTYPE. ..............................................................................................................................................16 TABLE 4: AVERAGE (MEAN) PROCESS EQUIPMENT COUNTS AND CONFIDENCE INTERVALS PER WELL STATUS.
.............................................................................................................................................................20 TABLE 5: AVERAGE COMPONENT COUNTS (MEAN) AND CONFIDENCE INTERVALS PER PROCESS EQUIPMENT
TYPE. ....................................................................................................................................................25 TABLE 6: AVERAGE (MEAN) EMISSION CONTROL AND CONFIDENCE INTERVAL PER PROCESS EQUIPMENT UNIT.
.............................................................................................................................................................37 TABLE 7: AVERAGE (MEAN) PNEUMATIC DEVICE COUNTS AND CONFIDENCE INTERVALS PER FACILITY
SUBTYPE. ..............................................................................................................................................40 TABLE 8: AVERAGE (MEAN) PNEUMATIC DEVICE COUNTS AND CONFIDENCE INTERVALS PER WELL STATUS. .43 TABLE 9: POPULATION AVERAGE EMISSION FACTORS FOR ESTIMATING FUGITIVE EMISSIONS FROM ALBERTA
UOG FACILITIES ON A VOLUME OR MASS BASIS. ...................................................................................53 TABLE 10: LEAKER EMISSION FACTORS FOR ESTIMATING FUGITIVE EMISSIONS FROM ALBERTA UOG
FACILITIES ON A VOLUME OR MASS BASIS. ............................................................................................55 TABLE 11: PARAMETER UNCERTAINTIES ACCORDING TO MEASUREMENT DEVICE OR GAS ANALYSIS SOURCE.
.............................................................................................................................................................56 TABLE 12: COMPARISON OF AVERAGE EQUIPMENT COUNTS PER FACILITY SUBTYPE FROM THE 2011 UOG
NATIONAL INVENTORY (ECCC, 2014) VERSUS THOSE DERIVED FROM 2017 FIELD SURVEYS. ...............63 TABLE 13: AVERAGE WELL PROCESS EQUIPMENT COUNTS OBSERVED IN 2017 VERSUS 2011 UOG INVENTORY
COUNTS. ................................................................................................................................................67 TABLE 14: COMPARISON OF 2017 AVERAGE (MEAN) COMPONENT COUNTS TO VALUES HISTORICALLY USED
FOR THE UOG NATIONAL EMISSION INVENTORY (CAPP, 1992). ..........................................................73 TABLE 15: DISTRIBUTION OF PNEUMATIC INSTRUMENT TYPES OBSERVED IN THE 2016/17 INVENTORY AND
DEEPP DATABASE. ..............................................................................................................................80 TABLE 16: SAMPLE-SIZE WEIGHTED AVERAGE VENT RATES FOR PNEUMATIC DEVICE TYPES OBSERVED
DURING 2016 AND 2017 FIELD CAMPAIGNS...........................................................................................82 TABLE 17: COMPARISON OF FUGITIVE EMISSIONS CALCULATED USING 2017, 2014 AND 2005 POPULATION
AVERAGE LEAK FACTORS AND THE SAME COMPONENT POPULATION. ...................................................85 TABLE 18: COMPARISON OF 2017 AND HISTORIC POPULATION AVERAGE LEAK FACTORS (KG THC/H/SOURCE)
FOR THE CANADIAN UOG INDUSTRY. ...................................................................................................87 TABLE 19: LEAKER EMISSION FACTORS FOR ESTIMATING FUGITIVE EMISSIONS FROM CANADIAN UOG
FACILITIES ON A VOLUME OR MASS BASIS. ............................................................................................90 TABLE 20: PROCESS EQUIPMENT DESCRIPTIONS. ..........................................................................................115 TABLE 21: FACILITY SUBTYPES DEFINED IN AER MANUAL 011. .................................................................128 TABLE 22: ARRANGEMENT OF DATA FOR ONE-WAY ANOVA TESTING.A .....................................................141 TABLE 23: RESULTS OF ANOVA. ................................................................................................................142 TABLE 24: PROCESS EQUIPMENT AND COMPONENT COUNT RECORDS FROM THE FIELD CAMPAIGN CONDUCTED
AT ALBERTA UPSTREAM OIL AND NATURAL GAS (UOG) SITES FROM 14 AUGUST TO 23 SEPTEMBER
2017. ..................................................................................................................................................157 TABLE 25: PNEUMATIC DEVICE COUNT RECORDS FROM THE FIELD CAMPAIGN CONDUCTED AT ALBERTA
UPSTREAM OIL AND NATURAL GAS (UOG) SITES FROM 14 AUGUST TO 23 SEPTEMBER 2017. ............157

xxiii
TABLE 26: LEAK AND VENT MEASUREMENT RECORDS FROM THE FIELD CAMPAIGN CONDUCTED AT ALBERTA
UPSTREAM OIL AND NATURAL GAS (UOG) SITES FROM 14 AUGUST TO 23 SEPTEMBER 2017. ............157

xxiv
LIST OF FIGURES
FIGURE 1: 2011 ALBERTA UOG METHANE EMISSION CATEGORIES PRIORITIZED ACCORDING TO THEIR
CONTRIBUTION TO TOTAL UNCERTAINTY (ECCC, 2014). ...................................................................... 6 FIGURE 2: EXAMPLE OF TABLET DATA ENTRY FORM. ...................................................................................... 8 FIGURE 3: SURVEY LOCATIONS AND FACILITY SUBTYPES FOR THE 2017 MEASUREMENT CAMPAIGN. ............12 FIGURE 4: PNEUMATIC COUNTS, BY DEVICE TYPE AND DRIVER TYPE, OBSERVED AT ALBERTA UOG
FACILITIES AND WELLS DURING 2016 AND 2017 FIELD CAMPAIGNS. .....................................................38 FIGURE 5: DISTRIBUTION OF LEVEL CONTROLLER MODELS OBSERVED DURING 2016 AND 2017 SURVEYS. ....46 FIGURE 6: DISTRIBUTION OF POSITIONER MODELS OBSERVED DURING 2016 AND 2017 SURVEYS. .................46 FIGURE 7: DISTRIBUTION OF PRESSURE CONTROL MODELS OBSERVED DURING 2016 AND 2017 SURVEYS. ....47 FIGURE 8: DISTRIBUTION OF TRANSDUCER MODELS OBSERVED DURING 2016 AND 2017 SURVEYS. ...............47 FIGURE 9: DISTRIBUTION OF CHEMICAL PUMP MODELS OBSERVED DURING 2016 AND 2017 SURVEYS. ..........48 FIGURE 10: PNEUMATIC COUNTS BY FACILITY SUBTYPE (EXCLUDING LOCATIONS WHERE ALL DEVICES ARE
ASSIGNED TO WELLS) AND DRIVER TYPE. ..............................................................................................49 FIGURE 11: PNEUMATIC COUNTS BY WELL STATUS CODE AND DRIVER TYPE. .................................................50 FIGURE 12: THREE-PHASE VERTICAL SEPARATOR LOCATED AT A LIQUIDS-RICH GAS PRODUCTION SITE. .......69 FIGURE 13: EXAMPLE OF A GAS REGULATOR INSTALLED ON AN OIL WELLHEAD. ...........................................70 FIGURE 14: COMPARISON OF 1992 AND 2017 TOTAL NUMBER OF COMPONENTS IN LIGHT LIQUID (LL) AND
PROCESS GAS (PG) SERVICE FOR THE PROCESS EQUIPMENT PRESENTED IN TABLE 14 (COMPONENT
COUNTS LESS THAN 50). ........................................................................................................................71 FIGURE 15: COMPARISON OF 1992 AND 2017 TOTAL NUMBER OF CONNECTORS AND VALVES IN LIGHT LIQUID
(LL) AND PROCESS GAS (PG) SERVICE FOR THE PROCESS EQUIPMENT PRESENTED IN TABLE 14
(COMPONENT COUNTS GREATER THAN 50). ...........................................................................................72 FIGURE 16: DISTRIBUTION OF PNEUMATIC INSTRUMENT TYPES OBSERVED DURING 2016 AND 2017 SURVEYS.
.............................................................................................................................................................81 FIGURE 17: DISTRIBUTION OF CHEMICAL INJECTION PUMP TYPES OBSERVED DURING 2016 AND 2017
SURVEYS. ..............................................................................................................................................81 FIGURE 18: DISTRIBUTION OF TOTAL LEAK RATE BY SITE OBSERVED DURING THE 2017 ALBERTA FIELD
CAMPAIGN (EXCLUDING 195 SITES WHERE NO LEAKS WERE DETECTED). ..............................................88 FIGURE 19: CUMULATIVE HOURLY RELEASE RATE FOR EMISSION AND SOURCE TYPES OBSERVED AT 333
LOCATIONS DURING THE 2017 ALBERTA FIELD CAMPAIGN. ..................................................................92 FIGURE 20: EXAMPLE OF TARGET AND NON-TARGET FACILITY IDS FOR A SINGLE LOCATION. .....................101 FIGURE 21: EXAMPLE MEASUREMENT SCHEMATIC WITH TARGET AND NON-TARGET FACILITY IDS. ............102 FIGURE 22: EXAMPLE MEASUREMENT SCHEMATIC WITH INCORRECT FACILITY ID LOCATIONS LISTED IN
PETRINEX (EQUIPMENT IS NOT SURVEYED). ........................................................................................103 FIGURE 23: EXAMPLE OF WELLS (UWI) THAT REPORT (FLOW) TO PETRINEX FACILITY ID. .........................105 FIGURE 24: NUMBER OF UWIS (REPRESENTING PRODUCTION STRINGS) AND WELL LICENCES (REPRESENTING
WELLHEADS WITH HYDROCARBON FLOWS) FOR EACH WELL STATUS CODE REPORTED IN PETRINEX FOR
DECEMBER 2017. ................................................................................................................................131 FIGURE 25: POPULATION-AVERAGE LEAK RATES FOR ROD-PACKINGS IN PROCESS GAS SERVICE BY SECTOR.
...........................................................................................................................................................143 FIGURE 26: POPULATION-AVERAGE LEAK RATES FOR CONNECTORS IN PROCESS GAS SERVICE BY SECTOR. .144 FIGURE 27: POPULATION-AVERAGE LEAK RATES FOR CONNECTORS IN LIGHT LIQUID SERVICE BY SECTOR. .145 FIGURE 28: POPULATION-AVERAGE LEAK RATES FOR CONTROL VALVES IN PROCESS GAS SERVICE BY SECTOR.
...........................................................................................................................................................146 FIGURE 29: POPULATION-AVERAGE LEAK RATES FOR METERS IN PROCESS GAS SERVICE BY SECTOR. ..........147

xxv
FIGURE 30: POPULATION-AVERAGE LEAK RATES FOR OPEN-ENDED LINES IN PROCESS GAS SERVICE BY
SECTOR. ..............................................................................................................................................148 FIGURE 31: POPULATION-AVERAGE LEAK RATES FOR PRV/PSVS IN PROCESS GAS SERVICE BY SECTOR. .....149 FIGURE 32: POPULATION-AVERAGE LEAK RATES FOR PUMP SEAL IN PROCESS GAS SERVICE BY SECTOR. .....150 FIGURE 33: POPULATION-AVERAGE LEAK RATES FOR REGULATORS IN PROCESS GAS SERVICE BY SECTOR...151 FIGURE 34: POPULATION-AVERAGE LEAK RATES FOR SCVFS IN PROCESS GAS SERVICE BY SECTOR. ...........152 FIGURE 35: POPULATION-AVERAGE LEAK RATES FOR THIEF HATCHES IN PROCESS GAS SERVICE BY SECTOR.
...........................................................................................................................................................153 FIGURE 36: POPULATION-AVERAGE LEAK RATES FOR VALVES IN PROCESS GAS SERVICE BY SECTOR. ..........154 FIGURE 37: POPULATION-AVERAGE LEAK RATES FOR VALVES IN LIGHT LIQUID SERVICE BY SECTOR. ..........155

xxvi
LIST OF ACRYNOMS
AEP Alberta Environment and Parks
AER Alberta Energy Regulator
BMP Best Management Practices
C Component
CAPP Canadian Association of Petroleum Producers
CEL Clearstone Engineering Ltd.
DI&M Direct Inspection and Maintenance
ECON Saskatchewan Ministry of Economics
EF Emission Factor
FG Fuel Gas
GHG Greenhouse gas
GM Gas Migration
GV Gas/Vapour (process and sales gas)
h Hour
HL Heavy Liquid
IPCC Intergovernmental Panel on Climate Change
IR Infrared (camera)
kg Kilogram
LDAR Leak Detection and Repair
LF Leak Frequency
LL Light Liquid
MDL Minimum Detection Limit
N Number of components
NIR National Inventory Report
OGC British Columbia Oil and Gas Commission
OGI Optical Gas Imaging
QA Quality Assurance
QC Quality Control
SR Sour
SW Sweet
THC Total Hydrocarbon
UNFCCC United Nations Framework Convention on Climate Change
UOG Upstream Oil and Gas
US EPA United States Environmental Protection Agency
VOC Volatile Organic Compound
VRU Vapour Recovery Unit

xxvii
ACKNOWLEDGEMENTS
The development of this report was sponsored by the Natural Resources Canada Energy
Innovation Program and supported by the Alberta Energy Regulator. The support and
direction provided by each of the participating agencies and companies listed below is
gratefully acknowledged. Special thanks are given to the individuals and companies who
hosted field surveys and/or provided review comments.
Alberta Energy Regulator – Climate Policy Assurance Team
Carleton University
Greenpath Energy Ltd.

1
1 INTRODUCTION
A field study was conducted during the period of 14 August to 23 September 2017 to inventory
equipment and components in hydrocarbon service as well as measure detected leaks. The study
was completed under the authority of the Alberta Energy Regulator (AER) and funded by
Natural Resources Canada (NRCan) with the objective of improving confidence in methane
emissions from Alberta upstream oil and natural gas (UOG) fugitive equipment leaks, pneumatic
devices and reciprocating rod-packings.
This report describes the field campaign and methodology applied to determine average factors
and confidence intervals for the following parameters. These results are intended for an emission
inventory model used to predict equipment/component counts, uncertainties and air emissions
associated with UOG facility and well identifiers.
Process equipment count per facility subtype10 or well status code11.
Component count per process equipment unit12.
Emission control type (i.e., gas conservation or gas tied into flare) per process equipment
unit.
Pneumatic device count per facility subtype or well status code by device (e.g., level
controllers, positioners, pressure controllers, transducers, chemical pumps and
intermittent) and driver (e.g., natural gas, instrument air, propane or electricity) types.
Leak rate per component and service type 13 considering the entire population of
components with the potential to leak (i.e., ‘population average’ factor).
Leak rate per component and service type considering leaking components only (i.e.,
‘leaker’ factor).
Fugitive equipment leaks and pneumatic venting sources are targeted by this study because they
contribute approximately 17 and 23 percent, respectively, of methane emissions in the 2011
national inventory (ECCC, 2014) and are based on uncertain assumptions regarding the
population of UOG equipment and components. Moreover, a 2014 leak factor update report
published by the Canadian Association of Petroleum Producers (CAPP) recommended
equipment and component counts be refined based on field inventories and standardized
definitions because of limitations encountered when determining these from measurement
schematics, process flow diagrams (PFD) or piping and instrumentation diagrams (P&ID)
(CAPP, 2014 sections 4.1.1 and 4.2.1).
10 Facility subtypes are defined in Table 2 of AER Manual 011 (AER, 2016b).
11 Well status codes are defined by the four category types (fluid, mode, type and structure) that describe wells
listed on the AER ST37 report.
12 Process equipment units are defined in Appendix Section 8.4.
13 Component types and service types are defined in Appendix Sections 8.2 and 8.3.
2
The scope of this study targets UOG wells, multi-well batteries, and compressor stations
belonging to AER facility subtypes listed in Section 3. Larger UOG facilities and oil sands
operations are specifically excluded from this study because they are often subject to regulated
emission quantification, verification and compliance requirements that motivate accurate,
complete and consistent methane emission reporting.
Details of the field study and selection criteria of survey locations as well as quality assurance
(QA) and quality control (QC) measures are presented in Sections 2 and 7. The data and
uncertainty analysis methodology and results are provided in Section 3. A discussion and
comparison of results to other studies are presented in Section 4. The key conclusions and
recommendations of this study are given in Section 5. All references cited herein are listed in
Section 6. Standard definitions for terms used throughout this document are presented in
Appendix Section 8 while blinded raw data from the field campaign is available in Appendix
Section 11.
1.1 BACKGROUND
Fugitive equipment leaks are defined in Section 8.1.1 as an unintentional loss of process fluid,
past a seal, mechanical connection or minor flaw, that can be visualized with an infrared (IR)
leak imaging camera (herein referred to as optical gas imaging (OGI) method) or detected by an
organic vapour analyzer (with a hydrocarbon concentration screening value greater than 10,000
ppmv) in accordance with U.S. EPA Method 21. An EPA comparison of OGI versus Method 21
based leak factors observed that leaker emission factors determined from more recent OGI study
data agreed reasonably well with the leaker emission factors developed from Method 21-based
data with a leak screening threshold of 10,000 ppmv (US EPA, 2016). The study also observed
that leaker emission factors determined using Method 21 (and a leak threshold of 500 ppmv) are
statistically different than OGI-based leaker emission factors. This suggests the OGI method is
reasonably equivalent to Method 21 for detecting leaks with a screening concentration greater
than 10,000 ppmv but not appropriate for use where the desired screening concentration is 500
ppmv.
Emissions from fugitive equipment leaks and pneumatic venting are most often estimated for use
in emissions inventories by multiplying component populations by corresponding average
emission factors. Emission estimates based on these factors are used by companies for regulatory
reporting and by governments to meet national and international reporting agreements.
For the Canadian upstream oil and natural gas (UOG) industry, the most up-to-date set of
average fugitive factors are published in CAPP, 2014 and intended to reflect best management
practices (BMP) for the management of fugitive emissions (CAPP, 2007). However, the 2014
assessment encountered challenges determining equipment and component counts that impacted
the accuracy of emission factor results. The 2017 field work is largely driven by
3
recommendations from CAPP, 2014 and extended to include pneumatic inventories (that are
subject to similar challenges).
Process equipment and corresponding component count schedules be developed from a
dedicated field inventory campaign.
The field campaign should establish and utilize standardized definitions for major
equipment, component, service and emission types.
Notwithstanding these limitations, engineering judgement was applied to bridge data gaps when
sufficient supporting data was available and the resulting emission factors recommended for use
for facilities subject to the CAPP BMP.
The BMP identifies key sources UOG fugitive emissions and strategies for achieving cost-
effective reductions through the implementation of a Directed Inspection & Maintenance
(DI&M) program. The DI&M program enables flexibility regarding target components,
screening frequency, measurement and repair through a prioritized decision tree that considers
criteria such as health, safety, and environment impact; repair difficulty; repair economics; and
the requirement for a facility shutdown.
The CAPP BMP was promulgated through the following regulatory instruments but remains a
voluntary initiative for Saskatchewan and other provinces. The BMP succeeded in greater
awareness, improved management and has a downward influence on UOG fugitive emissions.
However, uncertainty persists regarding the magnitude and most effective approach to managing
fugitive emissions.
Alberta Energy Regulator (AER) Directive 060: Upstream Petroleum Industry Flaring,
Incinerating, and Venting.
British Columbia Oil and Gas Commission (OGC) Flaring and Venting Reduction
Guideline.
Earlier emission factors were based on emissions data collected over the mid-1990s to the early
2000s and published as part of the CAPP/Environment Canada/NRCan Upstream Oil and Gas
emission inventory (CAPP, 2005). They reflect the level of control inherent with the operating
and regulatory environment in Canada from the early 1990’s until formal leak management
programs were implemented in 2007. This environment may be characterized as one in which
safety inspections, routine visual inspections, area monitoring and regular facility turn-arounds
are conducted. However, there were no specific programs to detect leaks on a regular basis using
a portable organic analyzer, and there were no policies for immediate repair of these leaks.
In general, the studies referenced above indicate fugitive emissions from equipment leaks are due
to normal wear and tear, improper or incomplete assembly of components, inadequate material
specification, manufacturing defects, damage during installation or use, corrosion, fouling and

4
environmental effects (e.g., vibrations and thermal cycling). The potential for such emissions
depends on a variety of factors including the type, style and quality of components, type of
service (gas/vapour, light liquid or heavy liquid), age of component, frequency of use,
maintenance history, process demands, whether the process fluid is highly toxic or malodorous
and operating practices.
Most of the atmospheric emissions from fugitive equipment leaks tend to be from components in
natural gas or hydrocarbon vapour service rather than from those in hydrocarbon liquid service14.
Components in odourized or H2S service tend to have much lower average fugitive emissions
than those in non-odourized or non-toxic service. Components tend to have greater average
emissions when subjected to frequent thermal cycling, vibrations or cryogenic service. Different
types of components have different leak potentials and repair lives.
14 This reflects the greater difficulty in containing a gas than a liquid (i.e., due to the greater mobility or fluidity of
gases), and the general reduced visual indications of gas leaks.

5
2 FIELD STUDY
The field equipment inventory and measurement campaign was completed in August and
September of 2017. The field sampling plan is presented in Section 7 and followed the fugitive
emission measurement protocol recommended by the Canadian Energy Partnership for
Environmental Innovation (CEPEI, 2006) with the OGI method used for leak detection. The field
campaign targeted sites belonging to facility subtypes that contribute the most to uncertainty in
the Alberta UOG methane emission inventory. Survey locations were randomly selected from
the facility subtype populations belonging to the following UOG industry segments.
Natural Gas Production (includes subtypes 351, 361, 362, 363, 364, 365, 366, 367, 601,
621, and 622)
Light and Crude Oil Production (includes subtypes 311, 321 and 322)
Cold Heavy Crude Oil Production (includes subtypes 331, 341, 342 and 611)
Location selection was further constrained by:
Exclusion of sites that emit more than 100,000 t CO2E because these sites are already
subject to SGER GHG reporting and verified by independent 3rd party.
Proximity to urban centers where target facility clustering was observed (i.e., central
logistical nodes were selected for field team accommodation). Sites within 100 km radius
of the following cities were visited: Brooks, Calgary, Red Deer, Drayton Valley, Grand
Prairie and Bonnyville.
Time budgeted to complete surveys within a geographical area.
Logistical challenges encountered by field teams upon arrival (e.g., access restrictions
due to standing crops or poor road conditions).
Facility subtypes contributing the most to methane uncertainty were identified as part of a
decision framework that identified risks to achieving ISO GHG emission inventory principles of
accuracy, transparency, completeness, relevance and consistency (Clearstone, 2017). The
outcome of this process is the Figure 1 matrix that ranks emission subcategories according to
their contribution to total uncertainty in Alberta’s 2011 UOG methane emission inventory
(ECCC, 2014) and presents qualitative indicators of methane emission contributions15.
The QA/QC activities completed to ensure the reliability of field data are described in Sections
2.1 and 2.2. Calculations required to convert leak rates, measured at local conditions by three
different methods, to total hydrocarbon (THC) mass rates are described in Section 2.3.
15 Indicators are presented for each intersect where “High” is greater than 1 percent of total methane, “Low” is
greater than 0.01 percent, but less than 1 percent of total methane, and ‘Negligible’ is less than 0.01 percent of total
methane (and the sum of all “Negligible” intersects is less than 1 percent of total methane).

6
Figure 1: 2011 Alberta UOG methane emission categories prioritized according to their contribution to total uncertainty
(ECCC, 2014).

7
2.1 QUALITY ASSURANCE
A data collection and management system was implemented to ensure reliability of sample data.
This includes the following quality assurance (QA) measures:
Selected field technicians are knowledgeable of the subject matter and trained to
complete project data collection tasks. Greenpath Energy Ltd. (Greenpath) was
subcontracted to lead field surveys. Greenpath technicians were paired with an AER
inspector or a Clearstone engineer to enhance field team depth with respect to regulatory
inspections and process knowledge. Selected field team members were knowledgeable of
potential fugitive emission sources at UOG facilities and attended three days of desktop
and field training dedicated to implementing the field sampling plan described in Section
7. Team members were responsible for understanding equipment, component, service and
emission type definitions in Section 8 as well as applying standardized data collection
and measurement methods described in Section 7 as part of the project quality
management plan.
Appropriate leak detection and measurement equipment for the site conditions and
source characteristics encountered at UOG facilities. The equipment is regularly serviced
and maintained in accordance with the manufacturer’s specifications, and subjected to
regular calibration and functional checks.
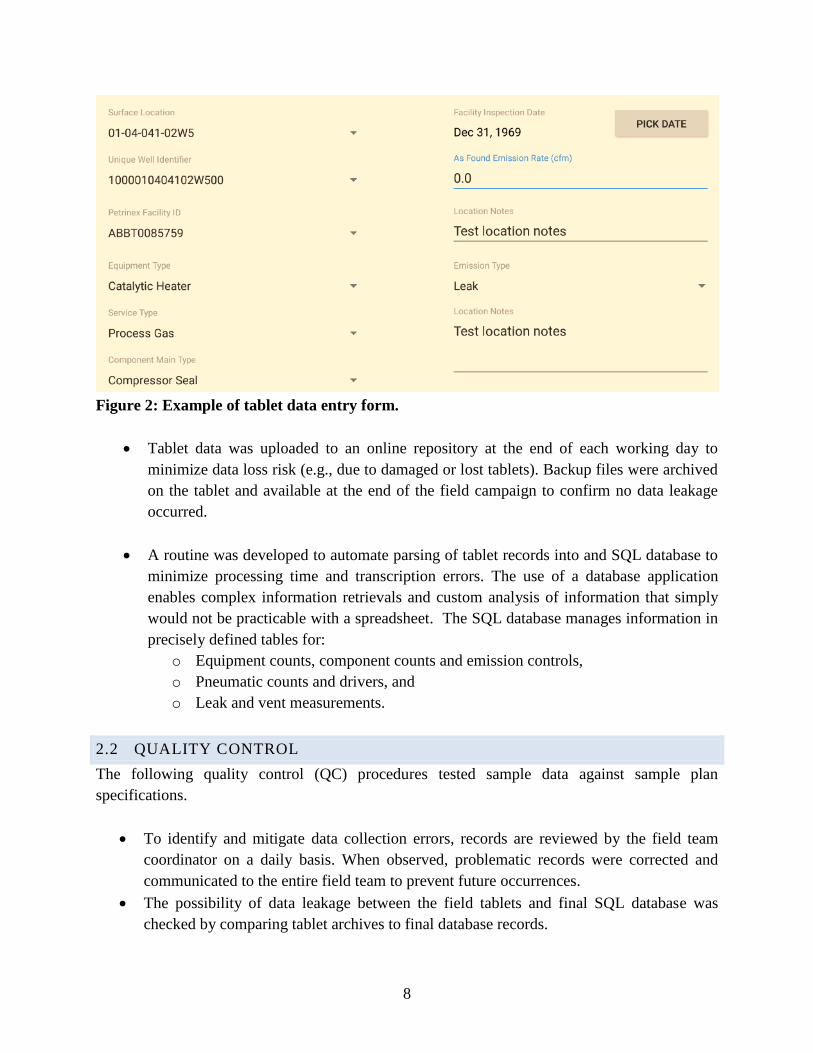
Field observations were documented in a complete and consistent manner using a
software application designed for this project. The application was installed on field
tablets and pre-populated with site identifiers (e.g., Petrinex Facility IDs and UWIs) and
standard definitions (Section 8). Field technicians selected applicable records from drop-
down menus as presented in Figure 2. Record typing was limited to observed leak rates,
component counts and comments.
Photos were taken of each site placard to confirm the surveyed location is the same as
the selected location appearing in the final dataset. Photos were taken of each equipment
unit to confirm the correct equipment type was selected and reasonable component
counts were completed. Infrared (IR) camera videos were recorded to confirm the
component type and leak magnitude.
8
Figure 2: Example of tablet data entry form.
Tablet data was uploaded to an online repository at the end of each working day to
minimize data loss risk (e.g., due to damaged or lost tablets). Backup files were archived
on the tablet and available at the end of the field campaign to confirm no data leakage
occurred.
A routine was developed to automate parsing of tablet records into and SQL database to
minimize processing time and transcription errors. The use of a database application
enables complex information retrievals and custom analysis of information that simply
would not be practicable with a spreadsheet. The SQL database manages information in
precisely defined tables for:
o Equipment counts, component counts and emission controls,
o Pneumatic counts and drivers, and
o Leak and vent measurements.
2.2 QUALITY CONTROL
The following quality control (QC) procedures tested sample data against sample plan
specifications.
To identify and mitigate data collection errors, records are reviewed by the field team
coordinator on a daily basis. When observed, problematic records were corrected and
communicated to the entire field team to prevent future occurrences.
The possibility of data leakage between the field tablets and final SQL database was
checked by comparing tablet archives to final database records.

9
Site placard photos, equipment photos, IR videos and measurement schematics are used
during post survey processing to determine the validity of data outliers. For data entry
error cases, reasonable corrections where made based on available images. The
availability of inspection images and corporate schematics is of tremendous benefit when
conducting QC tests on raw data records.
Various post-processing statistical tests and quality control checks were performed on the
data to ensure records are correctly classified and representative of process conditions.
For example, the population of tank ‘thief hatch’ components was reviewed to ensure
they were only counted when in pressurized hydrocarbon service (i.e., thief hatches are
only counted for tanks tied into a VRU or flare). If not tied into a VRU or flare,
atmospheric tank vapours released from a goose neck vent or open thief hatch are
intentional and defined as a vent.
Raw data records were provided to the operator of each site surveyed. Written feedback
regarding data corrections were received from five operators and mostly related to
assignment of process equipment to Facility IDs. When merited, refinements were made
to the dataset.
2.3 CONVERSION OF MEASURED FLOW RATES TO THC MASS RATES
The steps required to convert measured flow rate to THC mass rates are delineated in the
following subsections.
2.3.1 CONVERSION OF VOLUMETRIC FLOWS FROM METER TO STANDARD
CONDITIONS
Metered volumetric flows are converted from the actual conditions of the meter to standard
reference conditions of 15ºC and 101.325 kPa using the following relation:
𝑄𝑆𝑇𝑃 = 𝑐 ∙ 𝑥𝑇𝐻𝐶 ∙ 𝑄𝑀𝑃𝑀(𝑇𝑆 + 273.15)
𝑃𝑆(𝑇𝑀 + 273.15)
Equation 1
Where,
QSTP = measured THC volumetric flow rate referenced at standard temperature and
pressure (m3 THC/h),
QM = measured volumetric flow rate referenced at the actual temperature and pressure
of the flow meter (ft3/min),
PM = absolute reference pressure of the flow meter (kPa),

10
PS = standard pressure (i.e., 101.325 kPa),
TS = standard temperature (i.e., 15 ºC),
TM = reference temperature of the flow meter (ºC),
xTHC = THC mole fraction applied only when QM is a whole gas flow (measured with
the Hawk meter or calibrated bag). Not applied for Hi-Flow measurements.
c = conversion factor
= 1.699 m3·h-1·ft3·min.
2.3.2 CONVERSION OF VOLUMENTRIC FLOWS TO MASS FLOWS
The volumetric flow rate is converted to a mass flow rate using the following relation:
�̇� = 𝑄𝑆𝑇𝑃𝑃 ∙ 𝑀𝑊𝑇𝐻𝐶
𝑅(𝑇 + 273.15)
Equation 2
Where,
�̇� = mass flow rate (kg THC/h),
QSTP = THC volumetric flow rate at standard reference conditions (m3 THC/h),
P = absolute pressure (kPa) at the reference conditions of the flow.
T = temperature (ºC) at the reference conditions of the flow.
MWTHC = Molecular weight of hydrocarbon compounds
R = gas constant
= 8.3145 kPa·m3·kmole-1·K-1.
2.3.3 USE OF RESPONSE FACTOR
Most gas detectors are able to detect more than one type of compound but have different
sensitivities to each. Gas detectors calibrated to methane are adequate for the purposes of
screening components in natural gas service; however, the results of emission measurement
methods that use gas detectors (e.g., the Hi-Flow Sampler) require corrections to more accurately
account for the non-methane constituents of the natural gas mixture. This may be done using
response factors. The response factor for a specific substance i may be defined by the relation:
𝑅𝐹𝑖 =𝐴𝑐𝑢𝑡𝑎𝑙 𝐶𝑜𝑛𝑐𝑒𝑛𝑡𝑟𝑎𝑡𝑖𝑜𝑛
𝐼𝑛𝑠𝑡𝑟𝑢𝑚𝑒𝑛𝑡 𝑅𝑒𝑎𝑑𝑖𝑛𝑔
Equation 3

11
Substance specific response factors for the catalytic oxidation sensor installed in the Hi-Flow
Sampler used in this study are obtained from Table D-1 of EPA, 1995. The response factor for
gas mixtures observed during the study are estimated using the relation:
𝑅𝐹𝑀 =1
∑𝑌𝑖𝑅𝐹𝑖
𝑁𝑖=1
Equation 4
Where,
RFM = estimated response factor of the mixture,
Yi = mole fraction of component i (kmol of component i/kmol of gas or vapour),
N = number of components in the mixture.
The determined value of RFM is then applied using Equation 5 to adjust measured emission rates.
𝑄 = 𝑄𝑚 ∙ 𝑅𝐹𝑀
Equation 5
Where,
Qm = the uncorrected volumetric emission rate determined by the applied
measurement technique.

12
3 METHODOLOGY AND RESULTS
Data collection and leak surveys were completed at 333 locations, operated by 63 different
companies, and included 241 production accounting reporting entities and 440 UWIs. This
sample data represents the vintage, production characteristics and regulatory oversight
corresponding to UOG facilities operating in Alberta during 2017. The number of sites surveyed
and total site populations are delineated by target facility subtype in Table 1 and well status code
in Table 2. The geographic distribution of survey locations is illustrated in Figure 3 while
blinded raw data from the field campaign is available in Appendix Section 11.
Figure 3: Survey locations and facility subtypes for the 2017 measurement campaign.
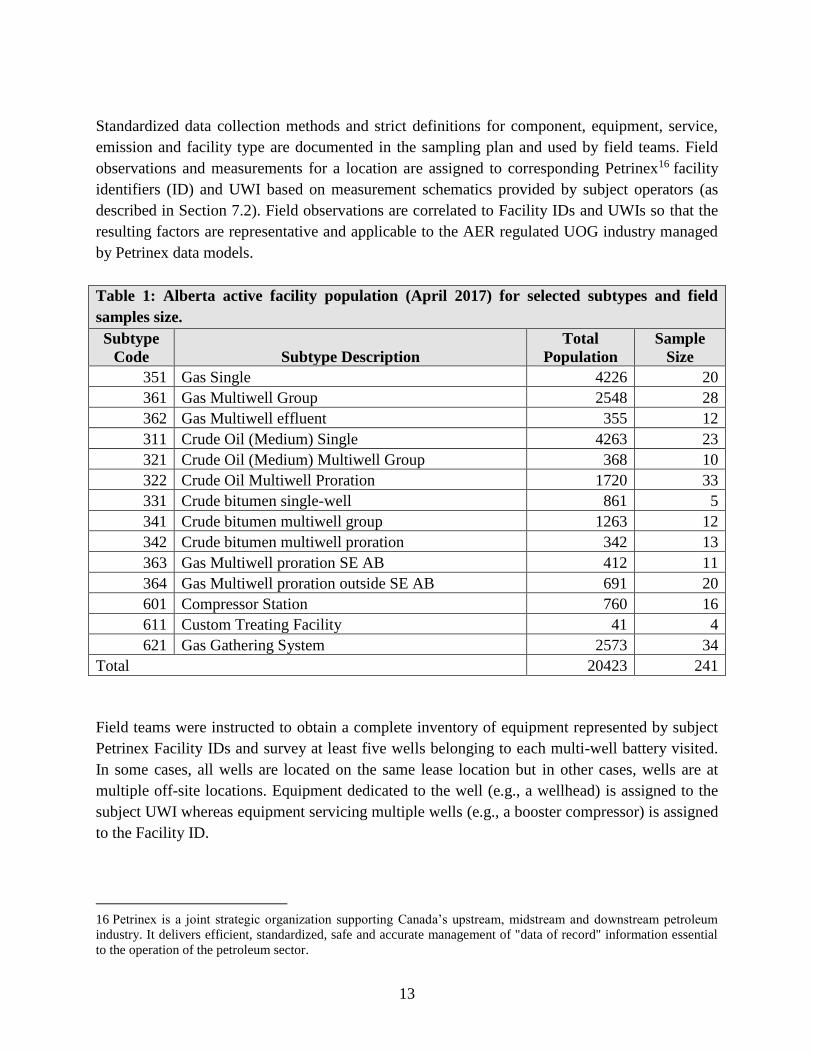
13
Standardized data collection methods and strict definitions for component, equipment, service,
emission and facility type are documented in the sampling plan and used by field teams. Field
observations and measurements for a location are assigned to corresponding Petrinex16 facility
identifiers (ID) and UWI based on measurement schematics provided by subject operators (as
described in Section 7.2). Field observations are correlated to Facility IDs and UWIs so that the
resulting factors are representative and applicable to the AER regulated UOG industry managed
by Petrinex data models.
Table 1: Alberta active facility population (April 2017) for selected subtypes and field
samples size.
Subtype
Code Subtype Description
Total
Population
Sample
Size
351 Gas Single 4226 20
361 Gas Multiwell Group 2548 28
362 Gas Multiwell effluent 355 12
311 Crude Oil (Medium) Single 4263 23
321 Crude Oil (Medium) Multiwell Group 368 10
322 Crude Oil Multiwell Proration 1720 33
331 Crude bitumen single-well 861 5
341 Crude bitumen multiwell group 1263 12
342 Crude bitumen multiwell proration 342 13
363 Gas Multiwell proration SE AB 412 11
364 Gas Multiwell proration outside SE AB 691 20
601 Compressor Station 760 16
611 Custom Treating Facility 41 4
621 Gas Gathering System 2573 34
Total 20423 241
Field teams were instructed to obtain a complete inventory of equipment represented by subject
Petrinex Facility IDs and survey at least five wells belonging to each multi-well battery visited.
In some cases, all wells are located on the same lease location but in other cases, wells are at
multiple off-site locations. Equipment dedicated to the well (e.g., a wellhead) is assigned to the
subject UWI whereas equipment servicing multiple wells (e.g., a booster compressor) is assigned
to the Facility ID.
16 Petrinex is a joint strategic organization supporting Canada’s upstream, midstream and downstream petroleum
industry. It delivers efficient, standardized, safe and accurate management of "data of record" information essential
to the operation of the petroleum sector.

14
Table 2: Alberta active well population (April 2017) for selected status codes and field
samples size.
Well Status Code Description Total
Population
Sample
Size
CBMCLS Flow Coalbed Methane Flowing Well – Coals Only 6630 14
CBMOT Flow Coalbed Methane Flowing Well – Coals & Other
Lithology
14361 21
CBMOT Pump Coalbed Methane Well (equipped with a plunger
lift) – Coals & Other Lithology
46 1
CR-BIT ABZONE Crude Bitumen Well – Abandoned Zone 14 1
CR-BIT Pump Crude Bitumen Pumping Well 6630 85
CR-BIT Susp Crude Bitumen Well – Suspended 3 2
CR-OIL Flow Crude Oil Flowing Well 2807 21
CR-OIL PUMP Crude Oil Pumping Well 27856 103
GAS FLOW Natural Gas Flowing Well 74838 127
GAS PUMP Natural Gas Well (equipped with a plunger lift) 14827 62
GAS STORG Natural Gas Storage Well 139 2
SHG Flow Shale Gas Flowing Well 284 1
Total 148435 440
Gas analysis were requested from operators for sites with noteworthy equipment leaks17. When
site-specific analysis are not available, a typical gas composition is used to calculate mass
emission rates (Table 26 in Volume 3 of ECCC, 2014).
Methodologies applied to calculate factors and the results are delineated in subsequent sections.
All volumes are presented on a dry basis at standard reference conditions 101.325 kPa and 15o C.
The uncertainty analysis and determination of confidence intervals is presented in Section 3.7.
3.1 PROCESS EQUIPMENT COUNTS
Process equipment in pressurized hydrocarbon service were counted for each location surveyed.
The counts included both operating and pressurized non-operating equipment selected from the
list of 54 predefined process equipment types delineated in Section 8.4. Units that didn’t appear
to match predefined types were entered as ‘other’ and added to a new or existing equipment type,
during post-processing, based on a photo of the unit and facility measurement schematic. Process
equipment and components entirely in water, air18, lubricating oil and non-volatile chemical
service were not included in the inventory because they are less likely to emit hydrocarbons.
17 Laboratory analysis reports were requested for the top 20% of leakers for each component and service type.
18 Pneumatic devices driven by instrument air were inventoried as discussed in Section 3.4. The air compressor and
piping were not inventoried.

15
The average (mean) process equipment count for a given facility subtype or well status is
determined using the following relation:
�̅�𝑃𝐸 =𝑁𝑃𝐸𝑁𝐹/𝑊
Equation 6
Where,
N̅PE = average (mean) process equipment count for a given facility subtype or well
status,
NPE = total number of process equipment surveyed for a given facility subtype or well
status,
NF/W = total number of facilities or wells surveyed for the subject facility subtype or
well status.
Average process equipment counts and confidence intervals per facility subtype and well status
are presented in Table 3 and Table 4respectively.

16
Table 3: Average (mean) process equipment counts and confidence intervals per facility subtype.
Facility
SubType
Code
Process Equipment Type Facility
SubType
Count
Process
Equipment
Count
Average
Equipment
Count
95% Confidence
Limit (% of mean)
lower upper
321 Catalytic Heater 10 13 1.296 77% 85%
321 Flare KnockOut Drum 10 2 0.200 100% 149%
321 Gas Boot 10 1 0.100 100% 201%
321 Gas Pipeline Header 10 1 0.101 100% 197%
321 Incinerator 10 1 0.099 100% 204%
321 Line Heater 10 4 0.397 100% 102%
321 Liquid Pipeline Header 10 1 0.101 100% 197%
321 Pig Trap (Gas Service) 10 2 0.199 100% 151%
321 Pop Tank 10 1 0.101 100% 198%
321 Production Tank (fixed roof) 10 13 1.302 54% 77%
321 Screw Compressor 10 1 0.101 100% 198%
321 Separator 10 7 0.703 72% 85%
322 Catalytic Heater 33 136 4.125 35% 44%
322 Flare KnockOut Drum 33 10 0.303 50% 50%
322 Gas Boot 33 2 0.060 100% 151%
322 Gas Pipeline Header 33 7 0.212 57% 71%
322 Gas Sample and Analysis System 33 2 0.061 100% 199%
322 Gas Sweetening: Amine 33 1 0.031 100% 197%
322 Line Heater 33 6 0.181 67% 100%
322 Liquid Pipeline Header 33 31 0.942 32% 38%
322 Liquid Pump 33 10 0.304 80% 109%
322 Pig Trap (Gas Service) 33 9 0.273 67% 77%
322 Pig Trap (Liquid Service) 33 14 0.424 57% 72%
322 Pop Tank 33 7 0.211 71% 87%
322 Power Generator (natural gas
fired)
33 1 0.031 100% 197%
322 Production Tank (fixed roof) 33 85 2.580 28% 32%
322 Propane Fuel Tank 33 2 0.061 100% 149%
322 Reciprocating Compressor 33 7 0.212 100% 143%
322 Reciprocating Compressor -
Electric Driver
33 3 0.091 100% 100%
322 Screw Compressor 33 5 0.151 100% 181%
322 Screw Compressor - Electric
Driver
33 3 0.091 100% 167%
322 Scrubber 33 1 0.030 100% 201%
322 Separator 33 81 2.452 30% 30%
322 Tank Heater 33 1 0.030 100% 202%
322 Treater 33 20 0.607 35% 35%
341 Catalytic Heater 12 6 0.498 50% 51%
341 Gas Pipeline Header 12 4 0.334 75% 75%
341 Production Tank (fixed roof) 12 13 1.076 92% 132%
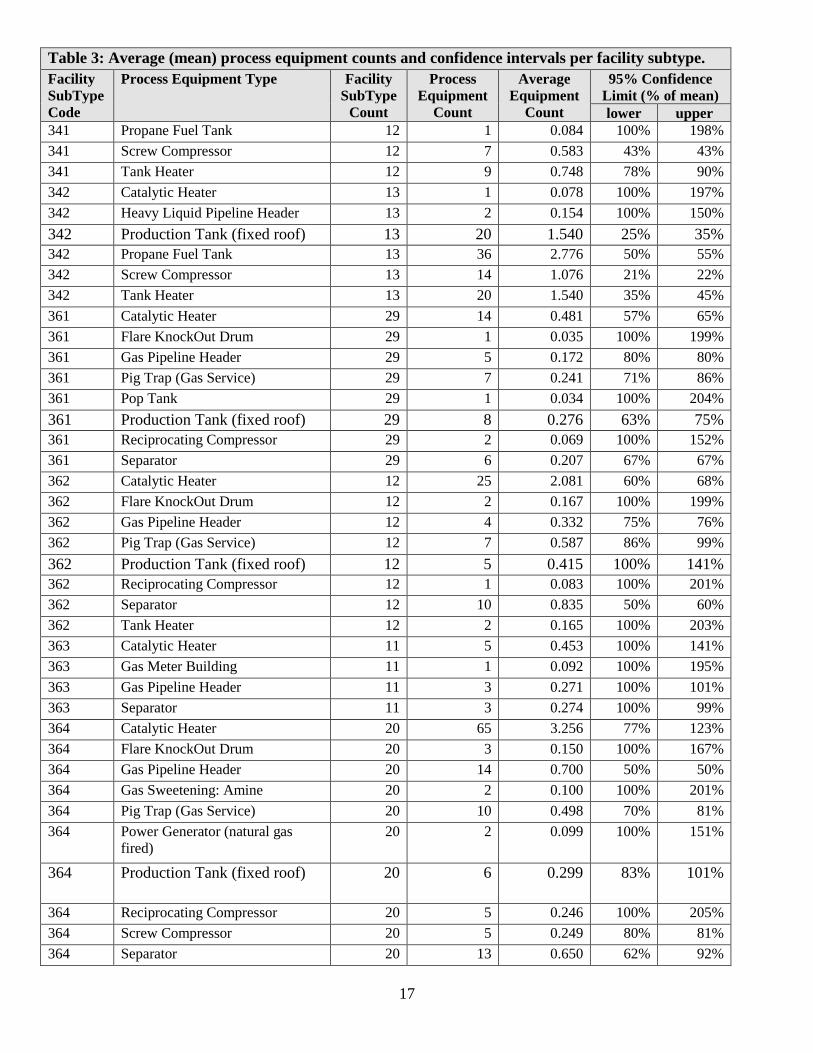
17
Table 3: Average (mean) process equipment counts and confidence intervals per facility subtype.
Facility
SubType
Code
Process Equipment Type Facility
SubType
Count
Process
Equipment
Count
Average
Equipment
Count
95% Confidence
Limit (% of mean)
lower upper
341 Propane Fuel Tank 12 1 0.084 100% 198%
341 Screw Compressor 12 7 0.583 43% 43%
341 Tank Heater 12 9 0.748 78% 90%
342 Catalytic Heater 13 1 0.078 100% 197%
342 Heavy Liquid Pipeline Header 13 2 0.154 100% 150%
342 Production Tank (fixed roof) 13 20 1.540 25% 35%
342 Propane Fuel Tank 13 36 2.776 50% 55%
342 Screw Compressor 13 14 1.076 21% 22%
342 Tank Heater 13 20 1.540 35% 45%
361 Catalytic Heater 29 14 0.481 57% 65%
361 Flare KnockOut Drum 29 1 0.035 100% 199%
361 Gas Pipeline Header 29 5 0.172 80% 80%
361 Pig Trap (Gas Service) 29 7 0.241 71% 86%
361 Pop Tank 29 1 0.034 100% 204%
361 Production Tank (fixed roof) 29 8 0.276 63% 75%
361 Reciprocating Compressor 29 2 0.069 100% 152%
361 Separator 29 6 0.207 67% 67%
362 Catalytic Heater 12 25 2.081 60% 68%
362 Flare KnockOut Drum 12 2 0.167 100% 199%
362 Gas Pipeline Header 12 4 0.332 75% 76%
362 Pig Trap (Gas Service) 12 7 0.587 86% 99%
362 Production Tank (fixed roof) 12 5 0.415 100% 141%
362 Reciprocating Compressor 12 1 0.083 100% 201%
362 Separator 12 10 0.835 50% 60%
362 Tank Heater 12 2 0.165 100% 203%
363 Catalytic Heater 11 5 0.453 100% 141%
363 Gas Meter Building 11 1 0.092 100% 195%
363 Gas Pipeline Header 11 3 0.271 100% 101%
363 Separator 11 3 0.274 100% 99%
364 Catalytic Heater 20 65 3.256 77% 123%
364 Flare KnockOut Drum 20 3 0.150 100% 167%
364 Gas Pipeline Header 20 14 0.700 50% 50%
364 Gas Sweetening: Amine 20 2 0.100 100% 201%
364 Pig Trap (Gas Service) 20 10 0.498 70% 81%
364 Power Generator (natural gas
fired)
20 2 0.099 100% 151%
364 Production Tank (fixed roof) 20 6 0.299 83% 101%
364 Reciprocating Compressor 20 5 0.246 100% 205%
364 Screw Compressor 20 5 0.249 80% 81%
364 Separator 20 13 0.650 62% 92%

18
Table 3: Average (mean) process equipment counts and confidence intervals per facility subtype.
Facility
SubType
Code
Process Equipment Type Facility
SubType
Count
Process
Equipment
Count
Average
Equipment
Count
95% Confidence
Limit (% of mean)
lower upper
364 Storage Bullet 20 2 0.100 100% 201%
601 Catalytic Heater 16 43 2.689 44% 51%
601 Flare KnockOut Drum 16 1 0.063 100% 200%
601 Gas Pipeline Header 16 5 0.314 60% 79%
601 Gas Sample and Analysis System 16 1 0.062 100% 203%
601 Pig Trap (Gas Service) 16 5 0.312 100% 140%
601 Pop Tank 16 1 0.062 100% 204%
601 Production Tank (fixed roof) 16 3 0.188 100% 100%
601 Reciprocating Compressor 16 13 0.817 54% 68%
601 Reciprocating Compressor -
Electric Driver
16 1 0.062 100% 202%
601 Screw Compressor 16 7 0.438 57% 57%
601 Separator 16 12 0.748 58% 76%
611 Catalytic Heater 4 1 0.249 100% 201%
611 Flare KnockOut Drum 4 1 0.254 100% 195%
611 Gas Meter Building 4 1 0.253 100% 197%
611 LACT Unit 4 4 0.990 100% 203%
611 Liquid Pump 4 3 0.751 100% 100%
611 Pig Trap (Gas Service) 4 1 0.251 100% 199%
611 Pop Tank 4 2 0.500 100% 100%
611 Production Tank (fixed roof) 4 14 3.503 43% 64%
611 Screw Compressor - Electric
Driver
4 3 0.752 100% 199%
611 Scrubber 4 2 0.501 100% 99%
611 Separator 4 2 0.498 100% 101%
611 Treater 4 4 1.000
621 Catalytic Heater 34 69 2.026 48% 55%
621 Flare KnockOut Drum 34 7 0.205 57% 72%
621 Gas Meter Building 34 5 0.148 80% 99%
621 Gas Pipeline Header 34 28 0.824 25% 25%
621 Liquid Pump 34 1 0.030 100% 194%
621 Pig Trap (Gas Service) 34 12 0.353 67% 92%
621 Pig Trap (Liquid Service) 34 3 0.088 100% 166%
621 Process Boiler 34 1 0.030 100% 194%
621 Production Tank (fixed roof) 34 11 0.325 64% 72%
621 Reciprocating Compressor 34 24 0.709 46% 54%
621 Reciprocating Compressor -
Electric Driver
34 6 0.176 83% 100%
621 Screw Compressor 34 2 0.059 100% 147%
621 Screw Compressor - Electric
Driver
34 2 0.059 100% 150%
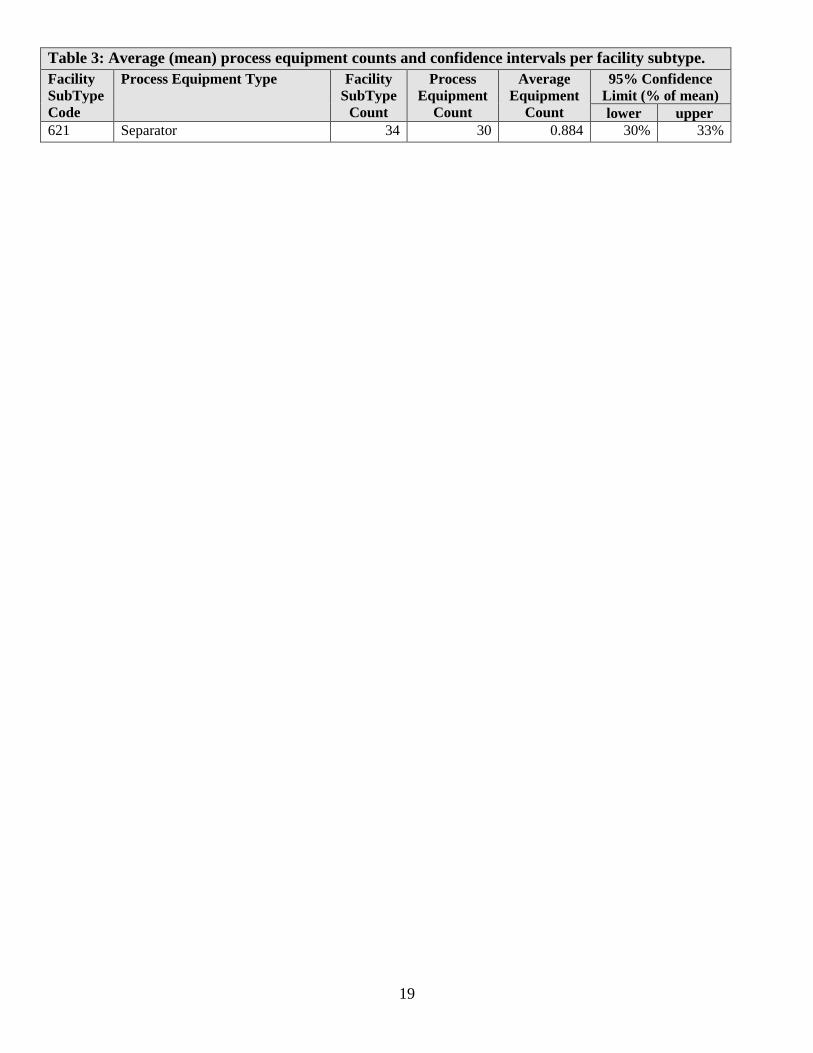
19
Table 3: Average (mean) process equipment counts and confidence intervals per facility subtype.
Facility
SubType
Code
Process Equipment Type Facility
SubType
Count
Process
Equipment
Count
Average
Equipment
Count
95% Confidence
Limit (% of mean)
lower upper
621 Separator 34 30 0.884 30% 33%
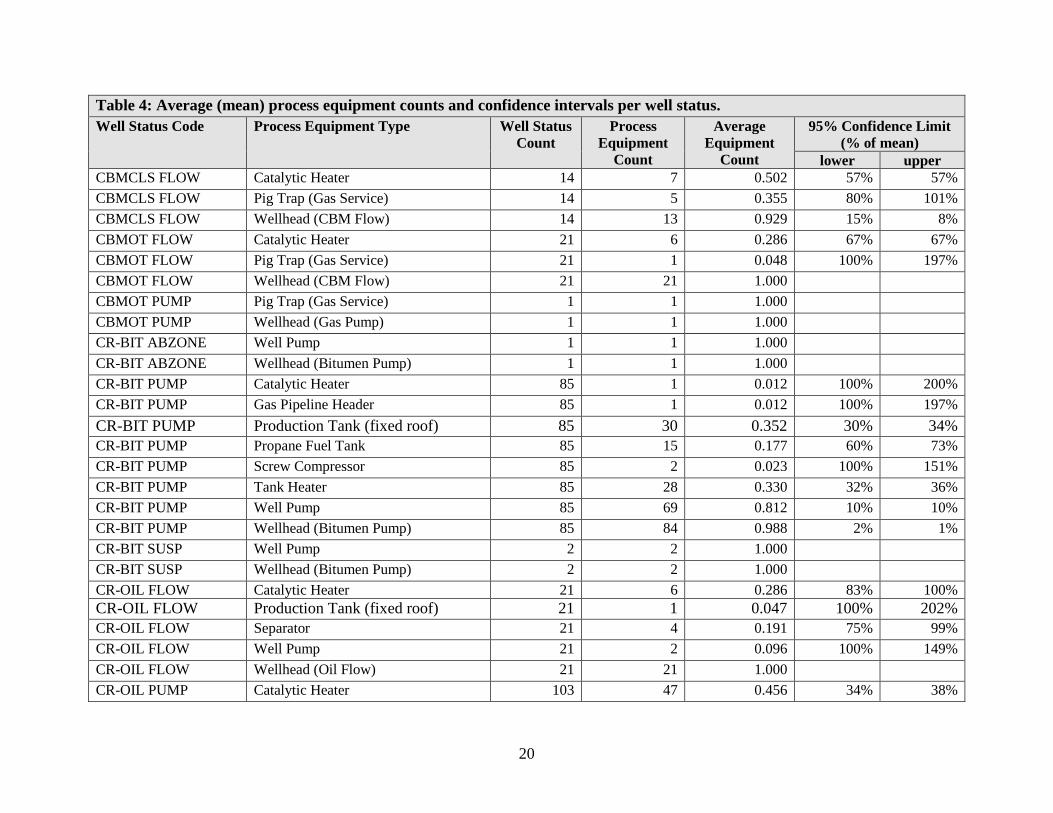
20
Table 4: Average (mean) process equipment counts and confidence intervals per well status.
Well Status Code Process Equipment Type Well Status
Count
Process
Equipment
Count
Average
Equipment
Count
95% Confidence Limit
(% of mean)
lower upper
CBMCLS FLOW Catalytic Heater 14 7 0.502 57% 57%
CBMCLS FLOW Pig Trap (Gas Service) 14 5 0.355 80% 101%
CBMCLS FLOW Wellhead (CBM Flow) 14 13 0.929 15% 8%
CBMOT FLOW Catalytic Heater 21 6 0.286 67% 67%
CBMOT FLOW Pig Trap (Gas Service) 21 1 0.048 100% 197%
CBMOT FLOW Wellhead (CBM Flow) 21 21 1.000
CBMOT PUMP Pig Trap (Gas Service) 1 1 1.000
CBMOT PUMP Wellhead (Gas Pump) 1 1 1.000
CR-BIT ABZONE Well Pump 1 1 1.000
CR-BIT ABZONE Wellhead (Bitumen Pump) 1 1 1.000
CR-BIT PUMP Catalytic Heater 85 1 0.012 100% 200%
CR-BIT PUMP Gas Pipeline Header 85 1 0.012 100% 197%
CR-BIT PUMP Production Tank (fixed roof) 85 30 0.352 30% 34%
CR-BIT PUMP Propane Fuel Tank 85 15 0.177 60% 73%
CR-BIT PUMP Screw Compressor 85 2 0.023 100% 151%
CR-BIT PUMP Tank Heater 85 28 0.330 32% 36%
CR-BIT PUMP Well Pump 85 69 0.812 10% 10%
CR-BIT PUMP Wellhead (Bitumen Pump) 85 84 0.988 2% 1%
CR-BIT SUSP Well Pump 2 2 1.000
CR-BIT SUSP Wellhead (Bitumen Pump) 2 2 1.000
CR-OIL FLOW Catalytic Heater 21 6 0.286 83% 100%
CR-OIL FLOW Production Tank (fixed roof) 21 1 0.047 100% 202%
CR-OIL FLOW Separator 21 4 0.191 75% 99%
CR-OIL FLOW Well Pump 21 2 0.096 100% 149%
CR-OIL FLOW Wellhead (Oil Flow) 21 21 1.000
CR-OIL PUMP Catalytic Heater 103 47 0.456 34% 38%

21
Table 4: Average (mean) process equipment counts and confidence intervals per well status.
Well Status Code Process Equipment Type Well Status
Count
Process
Equipment
Count
Average
Equipment
Count
95% Confidence Limit
(% of mean)
lower upper
CR-OIL PUMP Gas Pipeline Header 103 2 0.019 100% 150%
CR-OIL PUMP Gas Sample and Analysis System 103 1 0.010 100% 202%
CR-OIL PUMP Liquid Pipeline Header 103 1 0.010 100% 199%
CR-OIL PUMP Pig Trap (Gas Service) 103 2 0.019 100% 151%
CR-OIL PUMP Pig Trap (Liquid Service) 103 14 0.136 43% 50%
CR-OIL PUMP Pop Tank 103 7 0.068 57% 71%
CR-OIL PUMP Production Tank (fixed roof) 103 20 0.194 40% 45%
CR-OIL PUMP Propane Fuel Tank 103 1 0.010 100% 198%
CR-OIL PUMP Screw Compressor 103 3 0.029 100% 134%
CR-OIL PUMP Scrubber 103 1 0.010 100% 201%
CR-OIL PUMP Separator 103 28 0.272 32% 36%
CR-OIL PUMP Well Pump 103 24 0.232 33% 38%
CR-OIL PUMP Wellhead (Oil Pump) 103 103 1.000
GAS FLOW Catalytic Heater 127 112 0.882 20% 20%
GAS FLOW Flare KnockOut Drum 127 1 0.008 100% 195%
GAS FLOW Gas Meter Building 127 7 0.055 71% 85%
GAS FLOW Gas Pipeline Header 127 5 0.039 80% 100%
GAS FLOW Line Heater 127 1 0.008 100% 200%
GAS FLOW Pig Trap (Gas Service) 127 9 0.071 55% 67%
GAS FLOW Pop Tank 127 1 0.008 100% 198%
GAS FLOW Production Tank (fixed roof) 127 27 0.213 33% 37%
GAS FLOW Reciprocating Compressor 127 2 0.016 100% 147%
GAS FLOW Separator 127 57 0.449 19% 19%
GAS FLOW Wellhead (Gas Flow) 127 127 1.000
GAS PUMP Catalytic Heater 62 93 1.502 17% 18%
GAS PUMP Flare KnockOut Drum 62 1 0.016 100% 205%

22
Table 4: Average (mean) process equipment counts and confidence intervals per well status.
Well Status Code Process Equipment Type Well Status
Count
Process
Equipment
Count
Average
Equipment
Count
95% Confidence Limit
(% of mean)
lower upper
GAS PUMP Gas Pipeline Header 62 3 0.049 100% 132%
GAS PUMP Pig Trap (Gas Service) 62 3 0.049 100% 164%
GAS PUMP Production Tank (fixed roof) 62 20 0.322 35% 35%
GAS PUMP Propane Fuel Tank 62 1 0.016 100% 196%
GAS PUMP Separator 62 33 0.532 24% 24%
GAS PUMP Wellhead (Gas Pump) 62 61 0.984 3% 2%
GAS STORG Separator 2 1 0.499 100% 100%
GAS STORG Wellhead (Gas Storage) 2 2 1.000
SHG FLOW Catalytic Heater 1 1 1.000
SHG FLOW Separator 1 1 1.000
SHG FLOW Wellhead (Gas Flow) 1 1 1.000

23
3.2 COMPONENT COUNTS
Components in pressurized hydrocarbon service, greater than 0.5” nominal pipe size (NPS) and
belonging to the process equipment described in Section 3.1 were counted and classified
according to the following component types and hydrocarbon service types. More than 216,000
components were counted during the 2017 field campaign. A definition for each component type
is presented in Section 8.3 and for each service type in Section 8.2.
Reciprocating Compressor Rod-Packing,
Centrifugal Compressor Seals19,
Connector,
Control Valve,
Meter,
Open-Ended Line,
Pressure Relief Valves and Pressure Safety Valves (PRV/PSV),
Pump Seal,
Regulator,
Thief Hatch,
Valve, and
Well Surface Casing Vent (SCVF).
The list of component types is adopted from previous Canadian UOG emission factor
publications (CAPP, 2005 and CAPP, 2014) and extended to include meters, thief hatches and
SCVF. Meters are included as a convenience to mitigate field component counting effort. The
thief hatch and SCVF component types are added because their emission release characteristics
are poorly represented by other component types. Historically, thief hatches were counted as a
connector while SCVF lines were not considered because they are regulated by AER Interim
Directive 2003-01 (or incorrectly counted as open-ended lines 20 ). Because the leaker and
population leak factors presented below for thief hatches and SCVFs are different than
connectors and open-ended lines, separate components types are justifiable.
Reciprocating compressor rod-packings in good condition are intended to release gas and are
therefore defined in Draft Directive 060 as a vent (AER, 2018). However, as they wear, the
release rate increases and eventually becomes a leak. To simplify data analysis and presentation
of results, rod-packings are defined as leak source throughout this report (but should be defined
as a vent source with respect to Directive 060 applications).
19 No centrifugal compressors were observed during the 2017 surveys. They are typically used at gas transmission
stations which were not included in the 2017 survey plan. 20 As defined in Section 8.3.6, open-ended lines feature a closed valve upstream of the open end which is not the
case for SCVF lines (unless a valve was installed on the SCVF line and leakage occurred past the closed valve).

24
Subsequent analysis of the data collected observed no statistical difference in leak factors
between components in fuel versus process gas service. Therefore, there is little value
differentiating between the service types and subject records are assigned to a single service type
(process gas). This consolidation is consistent with the methodology used in other fugitive
emission factor publications (CAPP, 2014 and EPA, 2016). Differences are observed between
gas and liquid service leak factors so liquid service types are retained.
Average (mean) component counts are calculated for each process equipment type using
Equation 7 and are presented in Table 5: Average component counts (mean) and confidence
intervals per process equipment type.. Confidence intervals are determined according to Section
3.7 for each component record and also presented in Table 5: Average component counts (mean)
and confidence intervals per process equipment type.. These component schedules will be used
to estimate the number of potential equipment leak sources for the Alberta UOG industry.
�̅�𝐶𝐶 =𝑁𝐶𝐶𝑁𝑃𝐸
Equation 7
Where,
N̅𝐶𝐶 = average component count for a given service and process equipment type,
NCC = total number of components surveyed for a service and process equipment type,
NPE = total number of units for a given process equipment type.

25
Table 5: Average component counts (mean) and confidence intervals per process equipment type.
Process Equipment Type Component
Type
Service Type Process
Equipment
Count
Total
Component
Count
Average
Component
Count
95% Confidence
Limit (% of mean)
lower upper
Catalytic Heater Regulator Process Gas 651 721 1.159 7% 8%
Catalytic Heater Valve Process Gas 651 745 1.197 9% 11%
Catalytic Heater Connector Process Gas 651 756 1.212 29% 32%
Dehydrator - Glycol Control Valve Process Gas 20 25 1.310 58% 71%
Dehydrator - Glycol Valve Process Gas 20 576 30.118 37% 47%
Dehydrator - Glycol Valve Light Liquid 20 29 1.528 88% 136%
Dehydrator - Glycol Meter Process Gas 20 22 1.153 41% 47%
Dehydrator - Glycol Control Valve Light Liquid 20 6 0.312 98% 141%
Dehydrator - Glycol Open-Ended Line Process Gas 20 8 0.416 97% 151%
Dehydrator - Glycol Regulator Process Gas 20 104 5.457 42% 48%
Dehydrator - Glycol Connector Process Gas 20 4130 215.836 35% 39%
Dehydrator - Glycol Connector Light Liquid 20 227 11.980 88% 137%
Dehydrator - Glycol PRV/PSV Process Gas 20 50 2.621 40% 49%
Flare KnockOut Drum Valve Process Gas 29 244 8.844 56% 90%
Flare KnockOut Drum Meter Process Gas 29 1 0.036 100% 308%
Flare KnockOut Drum Control Valve Process Gas 29 5 0.181 96% 141%
Flare KnockOut Drum Regulator Process Gas 29 30 1.083 57% 71%
Flare KnockOut Drum Control Valve Light Liquid 29 1 0.036 100% 308%
Flare KnockOut Drum Connector Process Gas 29 1516 54.764 45% 58%
Flare KnockOut Drum Connector Light Liquid 29 530 19.086 48% 59%
Flare KnockOut Drum Valve Light Liquid 29 84 3.036 51% 64%
Flare KnockOut Drum PRV/PSV Process Gas 29 5 0.180 100% 169%
Flare KnockOut Drum Open-Ended Line Light Liquid 29 19 0.684 100% 291%
Gas Boot Valve Process Gas 3 3 1.042 100% 163%
Gas Boot Valve Light Liquid 3 20 6.944 77% 103%
Gas Boot Connector Light Liquid 3 77 26.739 76% 87%

26
Table 5: Average component counts (mean) and confidence intervals per process equipment type.
Process Equipment Type Component
Type
Service Type Process
Equipment
Count
Total
Component
Count
Average
Component
Count
95% Confidence
Limit (% of mean)
lower upper
Gas Boot PRV/PSV Process Gas 3 1 0.348 100% 263%
Gas Boot Connector Process Gas 3 15 5.178 76% 92%
Gas Meter Building Valve Process Gas 14 255 19.100 50% 64%
Gas Meter Building Valve Light Liquid 14 12 0.891 100% 299%
Gas Meter Building Meter Process Gas 14 18 1.352 54% 81%
Gas Meter Building Meter Light Liquid 14 4 0.296 100% 316%
Gas Meter Building Control Valve Process Gas 14 7 0.529 93% 124%
Gas Meter Building Regulator Process Gas 14 22 1.643 79% 107%
Gas Meter Building Connector Process Gas 14 1277 95.873 54% 69%
Gas Meter Building Connector Light Liquid 14 76 5.618 100% 309%
Gas Meter Building Open-Ended Line Process Gas 14 2 0.149 100% 305%
Gas Meter Building PRV/PSV Process Gas 14 15 1.118 72% 100%
Gas Pipeline Header Valve Process Gas 82 2346 29.916 31% 38%
Gas Pipeline Header Valve Light Liquid 82 123 1.604 98% 183%
Gas Pipeline Header Meter Process Gas 82 40 0.511 65% 96%
Gas Pipeline Header Control Valve Process Gas 82 34 0.436 71% 133%
Gas Pipeline Header Connector Process Gas 82 8289 105.826 33% 40%
Gas Pipeline Header Connector Light Liquid 82 487 6.272 100% 234%
Gas Pipeline Header Open-Ended Line Process Gas 82 5 0.063 100% 169%
Gas Pipeline Header PRV/PSV Process Gas 82 26 0.334 61% 83%
Gas Pipeline Header Regulator Process Gas 82 60 0.761 70% 115%
Gas Sweetening: Amine Valve Process Gas 3 106 37.046 90% 194%
Gas Sweetening: Amine Valve Light Liquid 3 3 1.046 75% 86%
Gas Sweetening: Amine Regulator Process Gas 3 3 1.042 75% 84%
Gas Sweetening: Amine Connector Process Gas 3 253 87.596 76% 100%
Gas Sweetening: Amine Connector Light Liquid 3 9 3.126 85% 127%

27
Table 5: Average component counts (mean) and confidence intervals per process equipment type.
Process Equipment Type Component
Type
Service Type Process
Equipment
Count
Total
Component
Count
Average
Component
Count
95% Confidence
Limit (% of mean)
lower upper
Gas Sweetening: Amine PRV/PSV Process Gas 3 2 0.691 100% 264%
Heavy Liquid Pipeline Header Valve Heavy Liquid 2 24 12.388 95% 186%
Heavy Liquid Pipeline Header Connector Heavy Liquid 2 56 29.379 91% 129%
Incinerator Valve Process Gas 1 8 8.404 100% 153%
Incinerator Regulator Process Gas 1 3 3.137 100% 151%
Incinerator Control Valve Process Gas 1 2 2.098 100% 150%
Incinerator Connector Process Gas 1 53 56.333 100% 147%
LACT Unit Valve Process Gas 4 2 0.528 100% 158%
LACT Unit Valve Light Liquid 4 102 26.675 68% 82%
LACT Unit Meter Light Liquid 4 14 3.701 84% 125%
LACT Unit Control Valve Process Gas 4 3 0.787 100% 184%
LACT Unit Control Valve Light Liquid 4 10 2.602 78% 115%
LACT Unit Connector Process Gas 4 92 23.527 100% 161%
LACT Unit Connector Light Liquid 4 469 123.323 72% 94%
LACT Unit PRV/PSV Process Gas 4 2 0.525 100% 271%
LACT Unit PRV/PSV Light Liquid 4 2 0.520 100% 276%
Line Heater Valve Process Gas 11 127 12.129 60% 101%
Line Heater Control Valve Process Gas 11 3 0.286 100% 207%
Line Heater Valve Light Liquid 11 28 2.663 81% 121%
Line Heater Meter Process Gas 11 2 0.193 100% 188%
Line Heater Regulator Process Gas 11 41 3.885 55% 70%
Line Heater Connector Process Gas 11 1082 103.033 51% 69%
Line Heater Connector Light Liquid 11 124 11.812 80% 106%
Line Heater PRV/PSV Process Gas 11 7 0.659 84% 131%
Liquid Pipeline Header Meter Light Liquid 33 1 0.031 100% 311%
Liquid Pipeline Header Valve Light Liquid 33 1066 33.770 33% 41%

28
Table 5: Average component counts (mean) and confidence intervals per process equipment type.
Process Equipment Type Component
Type
Service Type Process
Equipment
Count
Total
Component
Count
Average
Component
Count
95% Confidence
Limit (% of mean)
lower upper
Liquid Pipeline Header Control Valve Light Liquid 33 14 0.438 100% 168%
Liquid Pipeline Header Connector Light Liquid 33 3734 118.561 32% 36%
Liquid Pump Valve Process Gas 14 9 0.673 100% 302%
Liquid Pump Valve Light Liquid 14 203 15.162 51% 70%
Liquid Pump Meter Light Liquid 14 6 0.454 81% 116%
Liquid Pump Pump Seal Light Liquid 14 14 1.045 37% 39%
Liquid Pump Connector Light Liquid 14 819 61.322 44% 57%
Liquid Pump Connector Process Gas 14 60 4.606 100% 297%
Liquid Pump PRV/PSV Light Liquid 14 8 0.595 70% 87%
Pig Trap (Gas Service) Valve Process Gas 74 574 8.106 25% 33%
Pig Trap (Gas Service) Connector Process Gas 74 1565 22.153 27% 35%
Pig Trap (Gas Service) PRV/PSV Process Gas 74 2 0.029 100% 207%
Pig Trap (Liquid Service) Valve Light Liquid 31 153 5.137 34% 40%
Pig Trap (Liquid Service) Connector Light Liquid 31 508 17.157 31% 34%
Pop Tank Valve Light Liquid 20 25 1.311 50% 64%
Pop Tank Connector Process Gas 20 45 2.356 92% 176%
Pop Tank Connector Light Liquid 20 110 5.765 53% 66%
Pop Tank Open-Ended Line Light Liquid 20 19 0.998 36% 41%
Power Generator (natural gas fired) Valve Process Gas 3 32 11.179 94% 137%
Power Generator (natural gas fired) Control Valve Process Gas 3 2 0.688 100% 272%
Power Generator (natural gas fired) Regulator Process Gas 3 9 3.157 86% 153%
Power Generator (natural gas fired) Connector Process Gas 3 301 103.754 98% 143%
Process Boiler Valve Process Gas 1 15 15.725 100% 150%
Process Boiler Regulator Process Gas 1 4 4.224 100% 148%
Process Boiler Connector Process Gas 1 64 66.510 100% 150%
Process Boiler PRV/PSV Process Gas 1 1 1.039 100% 155%

29
Table 5: Average component counts (mean) and confidence intervals per process equipment type.
Process Equipment Type Component
Type
Service Type Process
Equipment
Count
Total
Component
Count
Average
Component
Count
95% Confidence
Limit (% of mean)
lower upper
Production Tank (fixed roof - heavy
oil)
Open-Ended Line Heavy Liquid 63 1 0.017 100% 319%
Production Tank (fixed roof - heavy
oil)
PRV/PSV Process Gas 63 1 0.017 100% 317%
Production Tank (fixed roof - heavy
oil)
Connector Heavy Liquid 63 2280 37.905 22% 24%
Production Tank (fixed roof - heavy
oil)
Valve Heavy Liquid 63 857 14.218 19% 20%
Production Tank (fixed roof -
Light/Medium Oil)
Valve Process Gas 213 88 0.431 37% 46%
Production Tank (fixed roof -
Light/Medium Oil)
Thief Hatch Light Liquid 213 82 0.399 83% 229%
Production Tank (fixed roof -
Light/Medium Oil)
Thief Hatch Process Gas 213 50 0.246 31% 34%
Production Tank (fixed roof -
Light/Medium Oil)
Valve Light Liquid 213 1087 5.340 17% 21%
Production Tank (fixed roof -
Light/Medium Oil)
Regulator Process Gas 213 49 0.241 30% 33%
Production Tank (fixed roof -
Light/Medium Oil)
Connector Process Gas 213 785 3.850 36% 46%
Production Tank (fixed roof -
Light/Medium Oil)
Connector Light Liquid 213 4444 21.815 14% 15%
Production Tank (fixed roof -
Light/Medium Oil)
Open-Ended Line Process Gas 213 3 0.015 100% 166%
Production Tank (fixed roof -
Light/Medium Oil)
PRV/PSV Light Liquid 213 1 0.005 100% 297%
Production Tank (fixed roof -
Light/Medium Oil)
PRV/PSV Process Gas 213 49 0.241 30% 33%

30
Table 5: Average component counts (mean) and confidence intervals per process equipment type.
Process Equipment Type Component
Type
Service Type Process
Equipment
Count
Total
Component
Count
Average
Component
Count
95% Confidence
Limit (% of mean)
lower upper
Production Tank (fixed roof -
Light/Medium Oil)
Open-Ended Line Light Liquid 213 3 0.015 100% 239%
Propane Fuel Tank Valve Process Gas 56 115 2.148 23% 27%
Propane Fuel Tank Regulator Process Gas 56 56 1.045 19% 19%
Propane Fuel Tank Connector Process Gas 56 721 13.467 22% 23%
Reciprocating Compressor Valve Process Gas 54 1860 35.982 25% 31%
Reciprocating Compressor Valve Light Liquid 54 327 6.334 38% 44%
Reciprocating Compressor Meter Process Gas 54 15 0.290 56% 66%
Reciprocating Compressor Control Valve Light Liquid 54 36 0.699 55% 64%
Reciprocating Compressor Control Valve Process Gas 54 110 2.131 33% 37%
Reciprocating Compressor Regulator Process Gas 54 293 5.662 31% 36%
Reciprocating Compressor Compressor Rod-
Packing
Process Gas 54 157 3.045 23% 25%
Reciprocating Compressor Connector Light Liquid 54 2786 53.869 43% 54%
Reciprocating Compressor Open-Ended Line Process Gas 54 28 0.545 67% 90%
Reciprocating Compressor PRV/PSV Process Gas 54 190 3.676 24% 26%
Reciprocating Compressor Connector Process Gas 54 31600 612.150 22% 23%
Reciprocating Compressor - Electric
Driver
Valve Process Gas 10 175 18.293 53% 65%
Reciprocating Compressor - Electric
Driver
Regulator Process Gas 10 1 0.103 100% 306%
Reciprocating Compressor - Electric
Driver
Valve Light Liquid 10 89 9.387 60% 79%
Reciprocating Compressor - Electric
Driver
Meter Process Gas 10 4 0.417 90% 117%
Reciprocating Compressor - Electric
Driver
Control Valve Process Gas 10 3 0.312 100% 202%

31
Table 5: Average component counts (mean) and confidence intervals per process equipment type.
Process Equipment Type Component
Type
Service Type Process
Equipment
Count
Total
Component
Count
Average
Component
Count
95% Confidence
Limit (% of mean)
lower upper
Reciprocating Compressor - Electric
Driver
Control Valve Light Liquid 10 15 1.568 79% 102%
Reciprocating Compressor - Electric
Driver
Connector Process Gas 10 3933 412.058 45% 51%
Reciprocating Compressor - Electric
Driver
Compressor Rod-
Packing
Process Gas 10 30 3.120 56% 65%
Reciprocating Compressor - Electric
Driver
Connector Light Liquid 10 560 58.561 60% 92%
Reciprocating Compressor - Electric
Driver
PRV/PSV Process Gas 10 23 2.400 46% 54%
Screw Compressor Valve Process Gas 46 1124 25.556 31% 38%
Screw Compressor Valve Light Liquid 46 200 4.559 55% 74%
Screw Compressor Meter Process Gas 46 43 0.976 37% 41%
Screw Compressor Control Valve Process Gas 46 50 1.135 44% 54%
Screw Compressor Control Valve Light Liquid 46 7 0.159 87% 126%
Screw Compressor Regulator Process Gas 46 182 4.135 26% 30%
Screw Compressor Connector Process Gas 46 14934 339.208 29% 37%
Screw Compressor Connector Light Liquid 46 1559 35.562 53% 71%
Screw Compressor Open-Ended Line Process Gas 46 25 0.567 63% 85%
Screw Compressor PRV/PSV Process Gas 46 150 3.407 25% 27%
Screw Compressor - Electric Driver Valve Process Gas 8 130 17.000 55% 69%
Screw Compressor - Electric Driver Control Valve Process Gas 8 9 1.182 88% 118%
Screw Compressor - Electric Driver Valve Light Liquid 8 27 3.534 77% 102%
Screw Compressor - Electric Driver Meter Process Gas 8 3 0.396 100% 200%
Screw Compressor - Electric Driver Regulator Process Gas 8 1 0.132 100% 288%
Screw Compressor - Electric Driver Connector Process Gas 8 1582 208.041 58% 77%

32
Table 5: Average component counts (mean) and confidence intervals per process equipment type.
Process Equipment Type Component
Type
Service Type Process
Equipment
Count
Total
Component
Count
Average
Component
Count
95% Confidence
Limit (% of mean)
lower upper
Screw Compressor - Electric Driver Connector Light Liquid 8 279 36.610 69% 88%
Screw Compressor - Electric Driver Open-Ended Line Process Gas 8 2 0.260 100% 188%
Screw Compressor - Electric Driver PRV/PSV Process Gas 8 12 1.569 68% 84%
Scrubber Valve Process Gas 4 46 12.000 98% 183%
Scrubber Connector Process Gas 4 290 76.711 96% 186%
Scrubber PRV/PSV Process Gas 4 2 0.522 100% 164%
Separator Valve Process Gas 288 5548 20.126 15% 16%
Separator Control Valve Process Gas 288 244 0.885 19% 21%
Separator Valve Light Liquid 288 3407 12.373 13% 14%
Separator Meter Process Gas 288 299 1.085 13% 15%
Separator Control Valve Light Liquid 288 200 0.726 19% 22%
Separator Meter Light Liquid 288 115 0.417 22% 23%
Separator Connector Light Liquid 288 18762 68.110 14% 16%
Separator Regulator Process Gas 288 689 2.501 17% 18%
Separator Connector Process Gas 288 29929 108.724 11% 12%
Separator Open-Ended Line Process Gas 288 33 0.120 51% 60%
Separator PRV/PSV Process Gas 288 460 1.670 11% 13%
Storage Bullet Valve Light Liquid 2 40 20.924 91% 107%
Storage Bullet Control Valve Light Liquid 2 4 2.088 92% 106%
Storage Bullet Connector Light Liquid 2 160 83.719 92% 106%
Tank Heater Valve Process Gas 60 450 7.847 22% 27%
Tank Heater Meter Process Gas 60 1 0.017 100% 307%
Tank Heater Regulator Process Gas 60 226 3.939 21% 22%
Tank Heater Connector Process Gas 60 3109 54.248 20% 22%
Treater Valve Process Gas 24 465 20.286 38% 47%
Treater Valve Light Liquid 24 394 17.206 42% 51%

33
Table 5: Average component counts (mean) and confidence intervals per process equipment type.
Process Equipment Type Component
Type
Service Type Process
Equipment
Count
Total
Component
Count
Average
Component
Count
95% Confidence
Limit (% of mean)
lower upper
Treater Meter Process Gas 24 21 0.916 49% 57%
Treater Control Valve Process Gas 24 18 0.783 47% 55%
Treater Control Valve Light Liquid 24 23 1.007 52% 63%
Treater Meter Light Liquid 24 11 0.477 65% 85%
Treater Regulator Process Gas 24 112 4.887 40% 47%
Treater Connector Process Gas 24 4548 197.835 34% 38%
Treater Connector Light Liquid 24 2181 95.200 39% 47%
Treater Open-Ended Line Process Gas 24 5 0.216 100% 304%
Treater Open-Ended Line Light Liquid 24 14 0.612 100% 212%
Treater PRV/PSV Process Gas 24 36 1.571 42% 54%
Well Pump Valve Process Gas 98 591 6.305 18% 20%
Well Pump Regulator Process Gas 98 191 2.036 17% 18%
Well Pump PRV/PSV Process Gas 98 28 0.300 40% 45%
Well Pump Connector Process Gas 98 4781 51.104 18% 19%
Wellhead (Bitumen Pump) Valve Heavy Liquid 87 747 8.983 17% 18%
Wellhead (Bitumen Pump) Valve Process Gas 87 630 7.573 18% 20%
Wellhead (Bitumen Pump) Connector Heavy Liquid 87 3025 36.393 18% 19%
Wellhead (Bitumen Pump) Regulator Process Gas 87 39 0.469 34% 38%
Wellhead (Bitumen Pump) Open-Ended Line Process Gas 87 12 0.144 59% 71%
Wellhead (Bitumen Pump) Connector Process Gas 87 2307 27.725 20% 21%
Wellhead (Bitumen Pump) PRV/PSV Process Gas 87 24 0.289 43% 46%
Wellhead (CBM Flow) Valve Process Gas 34 331 10.167 32% 48%
Wellhead (CBM Flow) Meter Process Gas 34 8 0.245 69% 87%
Wellhead (CBM Flow) Regulator Process Gas 34 2 0.063 100% 196%
Wellhead (CBM Flow) Connector Process Gas 34 1024 31.475 28% 32%
Wellhead (CBM Flow) Open-Ended Line Process Gas 34 10 0.307 62% 75%

34
Table 5: Average component counts (mean) and confidence intervals per process equipment type.
Process Equipment Type Component
Type
Service Type Process
Equipment
Count
Total
Component
Count
Average
Component
Count
95% Confidence
Limit (% of mean)
lower upper
Wellhead (CBM Flow) PRV/PSV Process Gas 34 2 0.062 100% 198%
Wellhead (Gas Flow) Valve Process Gas 128 1543 12.613 17% 18%
Wellhead (Gas Flow) Meter Process Gas 128 8 0.065 72% 92%
Wellhead (Gas Flow) Regulator Process Gas 128 50 0.417 95% 263%
Wellhead (Gas Flow) Open-Ended Line Process Gas 128 1 0.008 100% 312%
Wellhead (Gas Flow) PRV/PSV Process Gas 128 6 0.049 82% 107%
Wellhead (Gas Flow) Connector Process Gas 128 5383 43.948 16% 18%
Wellhead (Gas Pump) Valve Process Gas 62 855 14.435 23% 27%
Wellhead (Gas Pump) Meter Process Gas 62 20 0.336 45% 50%
Wellhead (Gas Pump) Regulator Process Gas 62 33 0.557 54% 71%
Wellhead (Gas Pump) Connector Process Gas 62 4300 72.591 24% 28%
Wellhead (Gas Pump) Open-Ended Line Process Gas 62 2 0.034 100% 208%
Wellhead (Gas Pump) PRV/PSV Process Gas 62 27 0.456 51% 60%
Wellhead (Gas Storage) Valve Process Gas 2 18 9.340 93% 135%
Wellhead (Gas Storage) Connector Process Gas 2 59 30.684 92% 103%
Wellhead (Oil Flow) Valve Process Gas 21 250 12.417 58% 74%
Wellhead (Oil Flow) Meter Process Gas 21 1 0.050 100% 314%
Wellhead (Oil Flow) Valve Light Liquid 21 139 6.915 49% 57%
Wellhead (Oil Flow) Connector Process Gas 21 714 35.342 55% 70%
Wellhead (Oil Flow) Connector Light Liquid 21 623 31.109 51% 58%
Wellhead (Oil Pump) Valve Process Gas 103 385 3.918 35% 39%
Wellhead (Oil Pump) Valve Light Liquid 103 990 10.038 19% 21%
Wellhead (Oil Pump) Meter Process Gas 103 2 0.020 100% 212%
Wellhead (Oil Pump) Regulator Process Gas 103 11 0.112 71% 93%
Wellhead (Oil Pump) Open-Ended Line Process Gas 103 1 0.010 100% 306%
Wellhead (Oil Pump) Connector Process Gas 103 1793 18.177 34% 39%

35
Table 5: Average component counts (mean) and confidence intervals per process equipment type.
Process Equipment Type Component
Type
Service Type Process
Equipment
Count
Total
Component
Count
Average
Component
Count
95% Confidence
Limit (% of mean)
lower upper
Wellhead (Oil Pump) Connector Light Liquid 103 4847 49.139 19% 20%
Wellhead (Oil Pump) Pump Seal Light Liquid 103 103 1.047 14% 14%
Wellhead (Oil Pump) PRV/PSV Process Gas 103 4 0.041 100% 180%

36
3.3 EMISSION CONTROLS
In addition to counting components, the following emission controls were noted by field
inspectors when installed on subject process equipment units.
Gas Conserved – where natural gas is captured and sold, used as fuel, injected into
reservoirs for pressure maintenance or other beneficial purpose.
Gas tied to flare – where natural gas is captured and disposed by thermal oxidization in a
flare or incinerator.
Gas tied to scrubber – where natural gas is captured and specific substances of concern
(e.g., H2S or other odourous compounds) are removed via adsorption or catalytic
technologies.
Common examples of emission control include storage tanks that are ‘blanketed’ with natural
gas and connected to a flare header (“Gas Flared”) or vapour recovery unit (“Gas Conserved”).
Another example are reciprocating compressor rod-packing vents tied into the flare header (“Gas
Flared”) or captured by a Remvue slipstream and used as fuel (“Gas Conserved”). Additional
details regarding the motivating factors (e.g., H2S content or odour of vapours, corporate
emission reduction objectives or incentives, etc) were not collected.
The average emission control per equipment unit, determined using Equation 8, considers the
frequency controls observed plus the estimated control efficiency for preventing the release of
natural gas to the atmosphere (i.e., how much of the subject gas stream is captured and
combusted/conserved over an extended period of time). Because control efficiency assessment
was beyond the scope of the 2017 field campaign, a conservative estimate of 95 percent is
adopted for conservation and flaring (CCME, 199521) while scrubbers are assigned 0 control
because they prevent very little of subject natural gas streams from being released to atmosphere.
𝐸𝐶 = 𝜂 ∙𝑁𝐶𝐷𝑁𝑃𝑈
Equation 8
Where,
EC = average (mean) emission control per process equipment unit,
η = efficiency of control device to prevent preventing the release of natural gas to the
atmosphere (0.95 for conservation and flares. 0 for scrubbers),
NCD = total number of process units with a control device,
NPU = total number of process units surveyed.
21 This is the minimum performance required by CCME (1995) for vapour control systems.

37
Results in Table 6 provide perspective regarding the proliferation of emission controls for
storage tanks and reciprocating compressor rod-packings located at sites upstream of gas plants.
Application of these factors to large equipment populations will produce representative emission
results, however, this is not true if applied to individual or small populations of equipment.
Other efforts to control emissions are discussed in Section 3.4 (e.g., distribution of air versus
natural gas driven pneumatics), Section 4.4 (e.g., leak factor trends) and are not amenable to
determining convenient control factors presented in Table 6. Efforts to capture and control
emission from individual dehydrators are known via Directive 039 reporting (AER, 2017) so a
control factor is not necessary.
Table 6: Average (mean) emission control and confidence interval per process equipment
unit.
Description of Control Process
Equipment
Count
Control
Count
Average
Control
Factor
95% Confidence Interval
(%of mean)
Lower Upper
Storage tank tied into flare or
conserved
213 46 0.21 28% 31%
Storage tank tied into scrubber 213 3 0.00 - -
Compressor rod-packing vent
tied into flare or conserved
54 7 0.12 65% 72%
Pop tank tied into flare or
conserved
20 2 0.10 100% 123%
3.4 PNEUMATIC DEVICE COUNTS
Pneumatic devices driven by natural gas, propane, instrument air and electricity 22 were
inventoried at each location surveyed in 2017. To increase the sample size, pneumatic inventory
data collected in 2016 by Greenpath Energy Ltd. for the AER was considered for this assessment
(Greenpath, 2017a). Devices are included in the results below when sufficient information was
available to assign 2016 records to a Facility ID or UWI. In cases where multiple Facility ID
were active at a single location or insufficient UWI details available, the 2016 record was
omitted from the sample because a definitive relation between the device and facility subtype or
well status could not be established. Overall, 1,105 of 1,688 pneumatic devices from the 2016
dataset are included in this study. The 2016 records included in this study represent 6 Facility
IDs and 197 wells.
Devices that provide the following control actions are the dominant contributors to pneumatic
venting emissions and account for 2,289 of the 2,858 pneumatic devices observed during 2016
and 2017 surveys. Figure 4 delineates the pneumatic inventory by device type and driver type.
22 The majority of electric driven devices are solar powered chemical injection pumps. However, a small number of
pneumatic instruments were observed to be electric powered.

38
The majority of devices are driven by natural gas while approximately 30 percent of devices
utilize alternative drivers (instrument air, propane or electricity) that do not directly contribute to
methane emissions.
Level Controller
Positioner
Pressure Controller
Chemical Pump
Transducer
Figure 4: Pneumatic counts, by device type and driver type, observed at Alberta UOG
facilities and wells during 2016 and 2017 field campaigns.
Devices that provide the following control actions typically vent at rates well below 0.17 m3 per
hour or only during infrequent unloading (de-energizing) events. Therefore, subject models are
aggregated and presented as device type “Intermittent” in report tables. This simplifies emission
inventory development efforts and is reasonable for devices that contributes very little to total
methane emissions.
High Level Shut Down

39
High Pressure Shut Down
Level Switch
Plunger Lift Controller
Pressure Switch
Temperature Switch
Instances of continuous venting (greater than 0.17 m3 per hour) may occur for these control
actions but they should be limited to malfunctioning, improperly calibrated or improperly
installed devices. Collecting a complete inventory of intermittent-bleed devices was a lower
priority for field technicians because their contribution to the total volume of gas vented by
pneumatic devices is much less than continuous-bleed devices and pumps. Moreover, isolation-
valve actuators were not inventoried because gas release events are infrequent. Therefore,
counts presented in Figure 4 likely understate the number of intermittent devices operating in the
UOG industry.
The average (mean) number of pneumatic devices per facility subtype and well status are
presented in Table 7 and Table 8 according to device (e.g., level controllers, positioners, pressure
controllers, transducers, chemical pumps and intermittent) and driver type (e.g., instrument air,
propane and electric). The mean is calculated using Equation 6 but divides the total number of
devices belonging to the subject category and observed at the subject facility subtype or well
status code (e.g., count of natural gas driven transducers at compressor stations) by the total
number of corresponding facility subtypes or well status codes surveyed (e.g., total count of
compressor stations surveyed). The factors for natural gas driven devices should be adopted for
GHG emission inventory purposes. Factors for propane (relevant to volatile organic compound
(VOC) emissions), instrument air and electric driven devices provide some insight into the
installation frequency of non-emitting devices.
There are a number of different pneumatic models commercially available for each device type.
The observed pneumatic model distributions for level controllers (882 devices), positioners (160
devices), pressure controllers (351 devices), transducers (303 devices) and chemical pumps (593
devices) are presented in Figure 5, Figure 6, Figure 7, Figure 8 and Figure 9, respectively.
Although models are known for each device, the group ‘other’ is used for device model counts
less than 5 to simplify the pie charts below.

40
Table 7: Average (mean) pneumatic device counts and confidence intervals per facility subtype.
Facility
SubType
Code
Pneumatic Device
Type
Driver Facility
SubType
Count
Pneumatic
Device Count
Average
Pneumatic
Count
95% Confidence Limit
(% of mean)
lower upper
321 Intermittent Natural Gas 10 11 1.156 100% 173%
321 Level Controller Natural Gas 10 10 1.045 91% 129%
321 Pressure Controller Natural Gas 10 5 0.522 100% 235%
321 Pump Natural Gas 10 6 0.622 100% 162%
321 Transducer Natural Gas 10 1 0.104 100% 293%
322 Intermittent Instrument Air 33 19 0.601 73% 95%
322 Intermittent Natural Gas 33 26 0.825 69% 87%
322 Level Controller Instrument Air 33 99 3.159 59% 74%
322 Level Controller Natural Gas 33 50 1.581 59% 74%
322 Positioner Instrument Air 33 10 0.317 91% 133%
322 Positioner Natural Gas 33 7 0.221 100% 208%
322 Pressure Controller Instrument Air 33 59 1.870 70% 95%
322 Pressure Controller Natural Gas 33 20 0.638 67% 88%
322 Pump Instrument Air 33 15 0.475 93% 173%
322 Pump Electric 33 1 0.032 100% 313%
322 Pump Natural Gas 33 13 0.411 75% 101%
322 Transducer Instrument Air 33 13 0.412 99% 159%
322 Transducer Natural Gas 33 13 0.411 100% 242%
361 Intermittent Natural Gas 29 19 0.684 83% 140%
361 Level Controller Instrument Air 29 2 0.072 100% 308%
361 Level Controller Natural Gas 29 15 0.537 84% 121%
361 Pressure Controller Natural Gas 29 3 0.107 100% 219%
361 Pump Natural Gas 29 12 0.433 79% 102%
362 Intermittent Natural Gas 12 6 0.524 100% 208%
362 Level Controller Instrument Air 12 4 0.351 100% 160%

41
Table 7: Average (mean) pneumatic device counts and confidence intervals per facility subtype.
Facility
SubType
Code
Pneumatic Device
Type
Driver Facility
SubType
Count
Pneumatic
Device Count
Average
Pneumatic
Count
95% Confidence Limit
(% of mean)
lower upper
362 Level Controller Natural Gas 12 4 0.350 100% 190%
362 Positioner Instrument Air 12 3 0.261 100% 208%
362 Positioner Natural Gas 12 1 0.087 100% 313%
362 Pressure Controller Natural Gas 12 6 0.529 100% 249%
362 Pump Instrument Air 12 6 0.525 100% 299%
362 Pump Natural Gas 12 4 0.351 100% 220%
362 Transducer Instrument Air 12 3 0.262 100% 150%
363 Intermittent Natural Gas 11 1 0.096 100% 306%
363 Level Controller Natural Gas 11 5 0.479 100% 183%
363 Pressure Controller Natural Gas 11 1 0.095 100% 290%
364 Intermittent Instrument Air 20 11 0.576 100% 245%
364 Intermittent Natural Gas 20 21 1.092 74% 104%
364 Level Controller Instrument Air 20 3 0.158 100% 213%
364 Level Controller Natural Gas 20 11 0.570 83% 129%
364 Positioner Instrument Air 20 3 0.158 100% 212%
364 Positioner Natural Gas 20 8 0.420 100% 178%
364 Pressure Controller Instrument Air 20 3 0.159 100% 299%
364 Pressure Controller Natural Gas 20 2 0.107 100% 198%
364 Pump Instrument Air 20 12 0.621 100% 215%
364 Pump Natural Gas 20 5 0.264 100% 249%
364 Transducer Instrument Air 20 2 0.106 100% 205%
364 Transducer Natural Gas 20 3 0.157 100% 209%
601 Intermittent Instrument Air 16 9 0.583 97% 204%
601 Intermittent Natural Gas 16 17 1.116 71% 97%
601 Level Controller Instrument Air 16 14 0.914 100% 193%

42
Table 7: Average (mean) pneumatic device counts and confidence intervals per facility subtype.
Facility
SubType
Code
Pneumatic Device
Type
Driver Facility
SubType
Count
Pneumatic
Device Count
Average
Pneumatic
Count
95% Confidence Limit
(% of mean)
lower upper
601 Level Controller Natural Gas 16 45 2.914 74% 113%
601 Positioner Instrument Air 16 10 0.650 100% 282%
601 Positioner Natural Gas 16 14 0.911 87% 123%
601 Pressure Controller Instrument Air 16 6 0.398 100% 205%
601 Pressure Controller Natural Gas 16 17 1.112 62% 81%
601 Pump Instrument Air 16 6 0.389 100% 208%
601 Pump Electric 16 1 0.065 100% 305%
601 Pump Natural Gas 16 4 0.260 100% 170%
601 Transducer Instrument Air 16 11 0.723 100% 302%
601 Transducer Natural Gas 16 21 1.376 85% 132%
611 Intermittent Instrument Air 4 4 1.045 100% 197%
611 Level Controller Instrument Air 4 4 1.053 100% 194%
611 Pressure Controller Instrument Air 4 3 0.781 100% 176%
611 Pump Instrument Air 4 1 0.265 100% 274%
611 Transducer Instrument Air 4 2 0.521 100% 283%
621 Intermittent Instrument Air 34 20 0.610 75% 113%
621 Intermittent Natural Gas 34 12 0.371 77% 112%
621 Level Controller Instrument Air 34 80 2.457 61% 75%
621 Level Controller Natural Gas 34 35 1.066 77% 110%
621 Positioner Instrument Air 34 26 0.804 81% 109%
621 Positioner Natural Gas 34 5 0.153 100% 252%
621 Pressure Controller Instrument Air 34 31 0.958 68% 92%
621 Pressure Controller Natural Gas 34 14 0.429 75% 99%
621 Pump Instrument Air 34 1 0.030 100% 321%
621 Pump Natural Gas 34 12 0.376 91% 147%
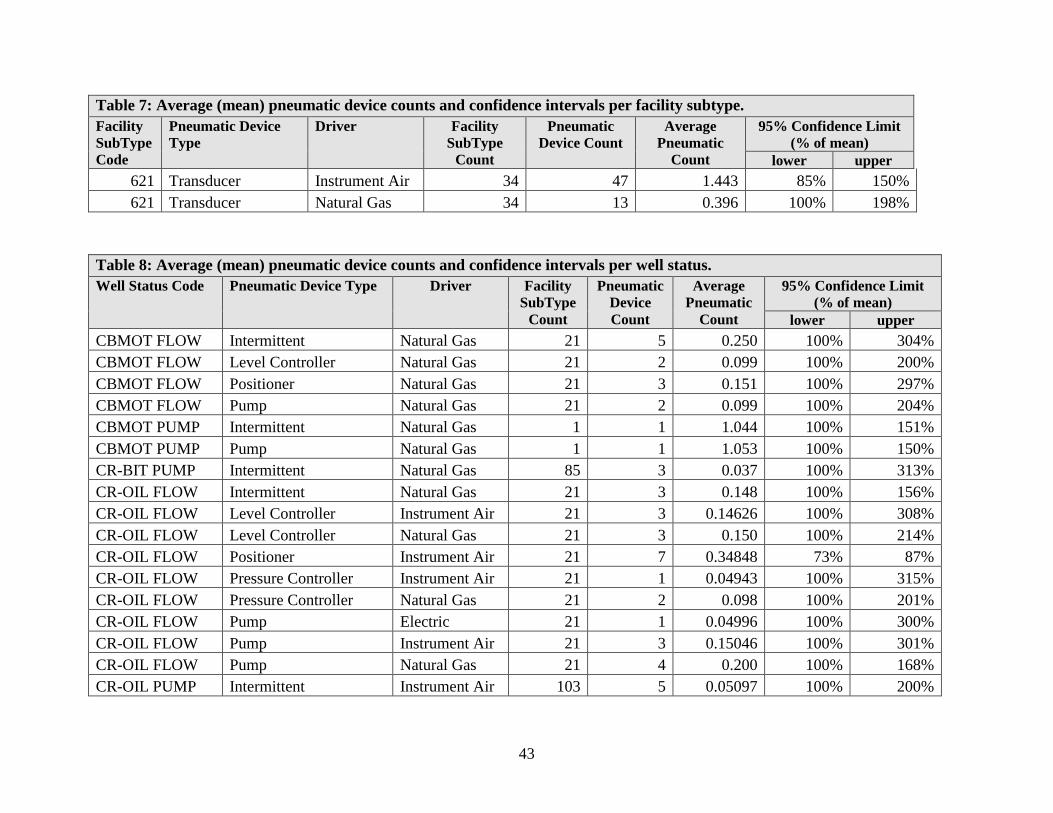
43
Table 7: Average (mean) pneumatic device counts and confidence intervals per facility subtype.
Facility
SubType
Code
Pneumatic Device
Type
Driver Facility
SubType
Count
Pneumatic
Device Count
Average
Pneumatic
Count
95% Confidence Limit
(% of mean)
lower upper
621 Transducer Instrument Air 34 47 1.443 85% 150%
621 Transducer Natural Gas 34 13 0.396 100% 198%
Table 8: Average (mean) pneumatic device counts and confidence intervals per well status.
Well Status Code Pneumatic Device Type Driver Facility
SubType
Count
Pneumatic
Device
Count
Average
Pneumatic
Count
95% Confidence Limit
(% of mean)
lower upper
CBMOT FLOW Intermittent Natural Gas 21 5 0.250 100% 304%
CBMOT FLOW Level Controller Natural Gas 21 2 0.099 100% 200%
CBMOT FLOW Positioner Natural Gas 21 3 0.151 100% 297%
CBMOT FLOW Pump Natural Gas 21 2 0.099 100% 204%
CBMOT PUMP Intermittent Natural Gas 1 1 1.044 100% 151%
CBMOT PUMP Pump Natural Gas 1 1 1.053 100% 150%
CR-BIT PUMP Intermittent Natural Gas 85 3 0.037 100% 313%
CR-OIL FLOW Intermittent Natural Gas 21 3 0.148 100% 156%
CR-OIL FLOW Level Controller Instrument Air 21 3 0.14626 100% 308%
CR-OIL FLOW Level Controller Natural Gas 21 3 0.150 100% 214%
CR-OIL FLOW Positioner Instrument Air 21 7 0.34848 73% 87%
CR-OIL FLOW Pressure Controller Instrument Air 21 1 0.04943 100% 315%
CR-OIL FLOW Pressure Controller Natural Gas 21 2 0.098 100% 201%
CR-OIL FLOW Pump Electric 21 1 0.04996 100% 300%
CR-OIL FLOW Pump Instrument Air 21 3 0.15046 100% 301%
CR-OIL FLOW Pump Natural Gas 21 4 0.200 100% 168%
CR-OIL PUMP Intermittent Instrument Air 103 5 0.05097 100% 200%

44
Table 8: Average (mean) pneumatic device counts and confidence intervals per well status.
Well Status Code Pneumatic Device Type Driver Facility
SubType
Count
Pneumatic
Device
Count
Average
Pneumatic
Count
95% Confidence Limit
(% of mean)
lower upper
CR-OIL PUMP Intermittent Natural Gas 103 27 0.274 55% 67%
CR-OIL PUMP Intermittent Propane 103 5 0.05078 100% 245%
CR-OIL PUMP Level Controller Instrument Air 103 3 0.0305 100% 228%
CR-OIL PUMP Level Controller Natural Gas 103 24 0.243 61% 77%
CR-OIL PUMP Level Controller Propane 103 2 0.02051 100% 312%
CR-OIL PUMP Pressure Controller Instrument Air 103 3 0.03054 100% 223%
CR-OIL PUMP Pressure Controller Natural Gas 103 12 0.122 67% 96%
CR-OIL PUMP Pump Electric 103 2 0.02045 100% 205%
CR-OIL PUMP Pump Instrument Air 103 2 0.0202 100% 211%
CR-OIL PUMP Pump Natural Gas 103 25 0.253 57% 73%
CR-OIL PUMP Transducer Natural Gas 103 1 0.010 100% 320%
GAS FLOW Intermittent Instrument Air 127 26 0.21387 74% 161%
GAS FLOW Intermittent Natural Gas 127 57 0.468 43% 52%
GAS FLOW Level Controller Instrument Air 127 60 0.49545 47% 57%
GAS FLOW Level Controller Natural Gas 127 48 0.395 40% 47%
GAS FLOW Positioner Instrument Air 127 37 0.30528 46% 54%
GAS FLOW Positioner Natural Gas 127 10 0.082 67% 83%
GAS FLOW Pressure Controller Instrument Air 127 13 0.10714 59% 70%
GAS FLOW Pressure Controller Natural Gas 127 13 0.108 65% 85%
GAS FLOW Pump Instrument Air 127 51 0.41914 47% 52%
GAS FLOW Pump Natural Gas 127 44 0.362 41% 47%
GAS FLOW Transducer Instrument Air 127 51 0.42166 46% 55%
GAS FLOW Transducer Natural Gas 127 13 0.107 69% 88%
GAS PUMP Intermittent Natural Gas 62 31 0.522 44% 54%
GAS PUMP Level Controller Natural Gas 62 32 0.540 48% 54%

45
Table 8: Average (mean) pneumatic device counts and confidence intervals per well status.
Well Status Code Pneumatic Device Type Driver Facility
SubType
Count
Pneumatic
Device
Count
Average
Pneumatic
Count
95% Confidence Limit
(% of mean)
lower upper
GAS PUMP Pressure Controller Natural Gas 62 3 0.050 100% 165%
GAS PUMP Pump Instrument Air 62 1 0.01685 100% 312%
GAS PUMP Pump Natural Gas 62 38 0.639 42% 49%
GAS PUMP Transducer Instrument Air 62 3 0.05111 100% 307%
GAS PUMP Transducer Natural Gas 62 12 0.201 63% 79%
GAS STORG Level Controller Instrument Air 2 1 0.52634 100% 236%
GAS STORG Positioner Instrument Air 2 1 0.53481 100% 230%
GAS STORG Pump Electric 2 1 0.51649 100% 236%
GAS STORG Transducer Instrument Air 2 1 0.52853 100% 236%
SHG FLOW Intermittent Instrument Air 1 1 1.04159 100% 149%
SHG FLOW Level Controller Instrument Air 1 3 3.15243 100% 153%
SHG FLOW Positioner Instrument Air 1 3 3.10207 100% 152%
SHG FLOW Pump Instrument Air 1 1 1.0439 100% 153%

46
Figure 5: Distribution of level controller models observed during 2016 and 2017 surveys.
Figure 6: Distribution of positioner models observed during 2016 and 2017 surveys.
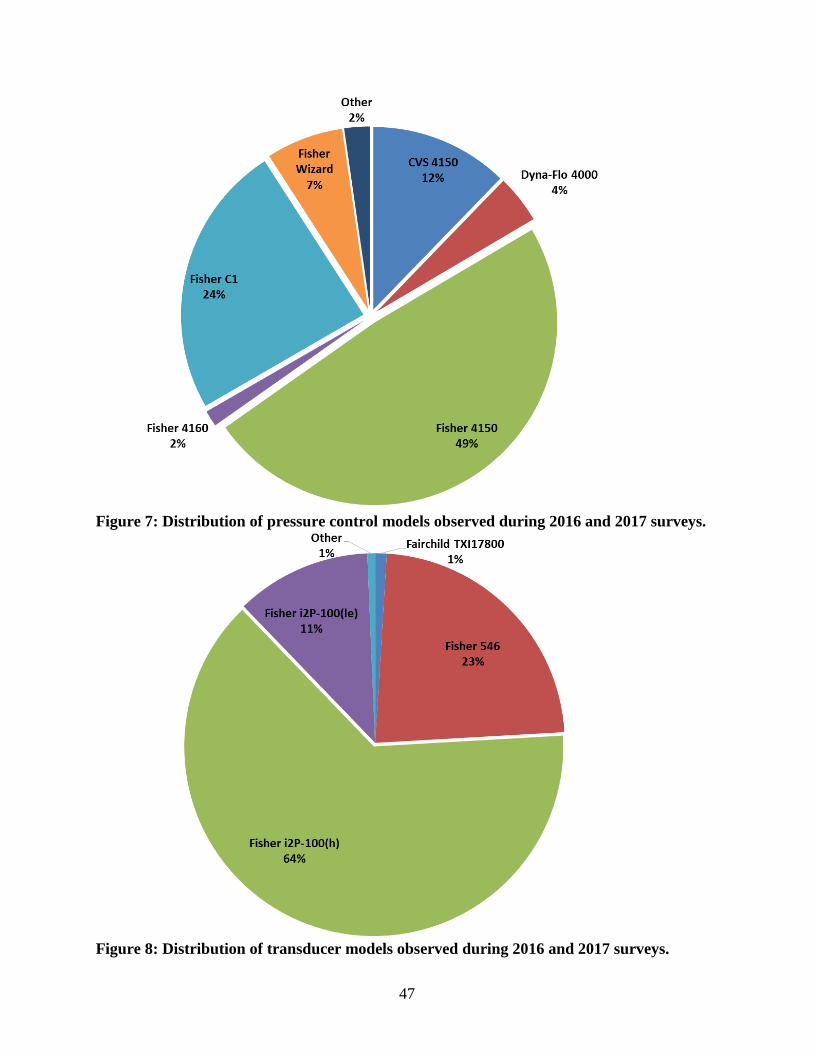
47
Figure 7: Distribution of pressure control models observed during 2016 and 2017 surveys.
Figure 8: Distribution of transducer models observed during 2016 and 2017 surveys.

48
Figure 9: Distribution of chemical pump models observed during 2016 and 2017 surveys.
Figure 10 presents the distribution of pneumatic devices (pumps and instruments) allocated to
Facility IDs (1072) by facility subtype and driver type. Figure 11 presents the distribution of
pneumatic devices allocated to wells23 (1789) by status code and driver type. Non-emitting
instrument air and electric driven devices represent approximately 30 percent of the sample
population with most of these (19 percent) located at facilities. Propane driven devices represent
less than 1 percent of the entire sample population. Given the large number of wells and their
tendency to rely on natural gas, well-site pneumatics are a noteworthy contributor to total
methane emissions in Alberta and deserve careful consideration when developing province-wide
emission inventories.
23 Pneumatics dedicated to a well are assigned to the subject UWI and not the parent Facility ID. This has an upward
bias on well average and downward bias on facility subtype averages.

49
Figure 10: Pneumatic counts by facility subtype24 (excluding locations where all devices are assigned to wells) and driver type.
24 The number of sites surveyed for each subtype is stated at the top of each bar. Because the number of sites surveyed for each subtype is not proportional to
Alberta-wide subtype populations, readers are cautioned that Figure 10 should not be interpreted as the actual distribution of pneumatics by subtype.

50
Figure 11: Pneumatic counts by well status code25 and driver type.
25 The number of wells surveyed for each status code (described in Table 2) is stated at the top of each bar. Because the number of wells surveyed is not
proportional to Alberta-wide well status populations, readers are cautioned that Figure 11 should not be interpreted as the actual distribution of pneumatics by
well status.

51
3.5 POPULATION AVERAGE LEAK FACTORS
Emission factors for estimating fugitive equipment leaks normally are evaluated by type of
component and service category within an industry sector. This allows the factors to be broadly
applied within the sector provided component populations are known. The advantage of this
level of disaggregation is that it allows facility differences. A simpler approach which introduces
additional uncertainties is to develop factors by type of process unit and area, or by type of
facility; however, these higher-level factors are not considered here.
There are two basic types of emission factors that may be used to estimate emissions from
fugitive equipment leaks: those that are applied to the results of leak detection or screening
programs (e.g., leak/no-leak and stratified emission factors), and those that those that do not
require any screening information and are simply applied to an inventory of the potential leak
sources (i.e., population average emissions factors). Population average emission factors are
considered in this section while ‘leaker’ emissions factors are determined in Section 3.6. ‘No-
leak’ emission factors are not determined in this study because the Hi-Flow Sampler minimum
detection limit (MDL) is not sensitive enough to accurately quantify leaks below 10,000 ppmv26.
No-leak factors for the Canadian UOG industry have received little research attention since the
early 1990’s and available factors (from Table 7 of CAPP, 1992) may not be representative of
current component populations. Instead of including no-leak contributions in the population
average leak factor (as was the case for factors published in CAPP, 2014, CAPP, 2005 and
CAPP, 1992), it’s recommended that these factors be applied separately when estimating fugitive
emissions so their relative contributions are better understood and to facilitate inclusion of
operator estimated fugitives27 into emission inventories.
The population average emission factor for a given component and service category equals the
total hydrocarbon emissions (that satisfy the leak definition presented in Section 8.1.1) divided
by the number of potential leak sources (i.e., components) as presented in Equation 8. Unlike
other studies that rely on typical component counts (CAPP, 2014 and EPA, 2016), emission
factors are determined using component counts from the same sample population. Moreover,
emission contribution from leaks below thresholds stated in Section 8.1.1 (i.e., no-leak factors)
are not included in the population average.
Population average emission factors (mass and volumes rate) and their 95 percent confidence
limits are presented in Table 9 and delineated by component type and service type. Further
delineation by industry sector (i.e., factors for Oil versus Gas production sites) is considered in
26 Ideally, no-leak emission factors would be developed using an instrument with precision of 1 ppm, MDL of about
2 ppm above background readings and measurement uncertainty of less than ±1% of reading. 27 Pending methane regulations may require operators to report fugitive emissions estimated using leaker factors or
by direct measurement. Both cases omit the no-leak contribution.

52
Section 10, however, one-way analysis of variance (ANOVA method) confirmed the difference
in means between the “Gas” and “Oil” groups are not statistically significant.
The 95 percent confidence limits provide an indication of the variability of the compiled average
emission factors. In general, the confidence interval is narrow when there are a large number of
data points or the data is clustered around the mean. If the data shows a wide variability around
the mean or there are few data points, the 95 percent confidence interval is wide. Comparing the
confidence limits of two data sets provides a simple means of establishing if the data sets are
from the same population (EPA, 1995).
𝑃𝐸𝐹𝑘,𝑗 =∑𝑄𝑆𝑇𝑃𝑘,𝑗 𝒐𝒓 ∑ �̇�𝑘,𝑗
∑𝑁𝑘,𝑗
Equation 9
Where,
PEFi,k,j = population average emission factor for service k and component type j (m3 or kg
THC/hr/source),
�̇�i,k,j = mass flow rate of total measured THC emissions for service k and component
type j (kg THC/hr),
QSTP,i,k,j = volume flow rate of total measured THC emissions for service k and component
type j at standard reference conditions (m3 THC/hr),
Ni,k,j = total number of potential emission sources surveyed (i.e., total number of
components including those that did not have any emissions) for service k and
component type j (number).

53
Table 9: Population average emission factors for estimating fugitive emissions from Alberta UOG facilities on a volume or mass basis.
Sector Component Type Service Leaker
Count
Component
Count
Leak
Frequency
EF
(kg THC
/h/source)
95% Confidence
Limit (% of mean)
EF
(m3 THC
/h/source)
95% Confidence
Limit (% of mean)
Lower Upper Lower Upper
All Compressor Rod-
Packinga,b
PG 139 0.20622 53% 88% 0.28745 53% 88%
All Connector PG 145 137,391 0.11% 0.00014 32% 53% 0.00019 32% 52%
All Connector LL 6 45,356 0.01% 0.00001 71% 114% 0.00001 70% 120%
All Control Valve PG 16 539 2.97% 0.00487 53% 77% 0.00646 53% 77%
All Meter PG 8 531 1.51% 0.00105 47% 73% 0.00145 47% 70%
All Open-Ended Line PG 10 144 6.95% 0.06700 91% 219% 0.09249 91% 225%
All Pressure Relief Valve PG 7 1,176 0.60% 0.00399 54% 85% 0.00552 53% 79%
All Pump Seal PG 6 178 3.37% 0.00761 73% 142% 0.01057 73% 141%
All Regulator PG 27 3,067 0.88% 0.00112 60% 99% 0.00122 50% 76%
All Thief Hatch PG 6 52 11.46% 0.12870 77% 134% 0.12860 70% 115%
All Valve PG 28 20,545 0.14% 0.00044 64% 112% 0.00058 62% 111%
All Valve LL 6 8,944 0.07% 0.00015 72% 122% 0.00021 73% 120%
All SCVF PG 15 440 3.41% 0.09250 98% 204% 0.12784 98% 196% a Reciprocating compressor rod-packing emission factors are calculated on a per rod-packing basis and exclude compressors that are tired into a flare or VRU
(because these rod-packings are controlled and have a very low probability of ever leaking to atmosphere). Rod-packings are defined as vents in Directive 060
(AER, 2018). b Reciprocating Compressor rod-packings vents are typically tied into a common header with measurements conducted on the common vent. Therefore, the actual
number of leaking components and leak frequency are not known.
54
3.6 ‘LEAKER’ FACTORS
To facilitate estimation of leaks detected but not measured during fugitive emission surveys,
‘leaker’ factors can be applied. ‘Leaker’ emission factors (mass and volumes rate) are calculated
using Equation 10 and presented by component type and service type in Table 10 with their 95
percent confidence limits.
𝐿𝐸𝐹𝑘,𝑗 =∑𝑄𝑆𝑇𝑃𝑘,𝑗 𝒐𝒓 ∑ �̇�𝑘,𝑗
∑𝑁𝐿𝑘,𝑗
Equation 10
Where,
LEFi,k,j = ‘leaker’ emission factor for service k and component type j (m3 or kg
THC/hr/leaking source),
�̇�i,k,j = mass flow rate of total measured THC emissions for service k and component
type j (kg THC/hr),
QSTP,i,k,j = volume flow rate of total measured THC emissions for service k and component
type j at standard reference conditions (m3 THC/hr),
NLi,k,j = number of leaking components detected for service k and component type j
(number).
This screening-based approach for estimating fugitive emissions requires that a full leak
detection survey by conducted and leaks (that satisfy the definition presented in Section 8.1.1) by
recorded according to their service (process gas or light liquid) and component type (delineated
in Section 8.3). End users can then multiply leak counts by the leaker factors in Table 10.
Fugitive emissions estimated using this approach should provide better accuracy and
identification of high leak-risk components and facilities than population average factors.
However, direct measurement of detected leaks is more accurate and provides valuable insight
regarding leak magnitude and frequency distributions that are not available from emission factor
approaches. For example, Figure 18 indicates that a small number of leaks contribute most of the
fugitive emissions for a given component population. Screening coupled with direct
measurement takes advantage of this fact to provide a reasonable balance between cost of
assessment and accuracy of total estimated emissions.
Regardless of the estimation approach, the no-leak contribution representing leaks with a
screening value of less than 10 000 ppmv or that are not observable with an IR camera should be
estimated and included in emission inventories. This is accomplished by multiplying total
component populations by no-leak emission factors (available from Table 18).

55
Table 10: Leaker emission factors for estimating fugitive emissions from Alberta UOG facilities on a volume or mass basis.
Sector Component Type Service Leaker
Count
Leaker EF (kg
THC/h/source)
95% Confidence
Limit (% of mean) Leaker EF (m3
THC/h/source)
95% Confidence
Limit (% of mean)
Lower Upper Lower Upper
All Compressor Rod-Packinga PG 27 1.08150 45% 58% 0.77563 43% 56%
All Connector PG 145 0.13281 19% 21% 0.10137 20% 21%
All Connector LL 6 0.05906 71% 88% 0.04156 70% 85%
All Control Valve PG 16 0.16213 47% 50% 0.12203 48% 52%
All Meter PG 8 0.07201 39% 49% 0.05238 40% 50%
All Open-Ended Line PG 10 0.98904 90% 195% 0.70729 90% 199%
All Pressure Relief Valve PG 7 0.69700 49% 62% 0.50395 49% 63%
All Pump Seal PG 6 0.23659 71% 121% 0.16974 71% 125%
All Regulator PG 27 0.10275 45% 56% 0.09514 56% 79%
All Thief Hatch PG 6 0.81672 67% 83% 0.82401 75% 106%
All Valve PG 28 0.31644 58% 90% 0.24356 60% 97%
All Valve LL 6 0.23098 72% 107% 0.16929 71% 110%
All SCVF PG 15 2.70351 97% 201% 3.74007 97% 189% a Because reciprocating compressor rod-packing leakage is routed to common vent lines, the actual number of leakers is not known. The compressor rod-packing
‘leaker’ factor is calculated on a per vent line basis (not per rod-packing basis). Rod-packings are defined as vents in Directive 060 (AER, 2018).

56
3.7 UNCERTAINTY ANALYSIS
It is good practice to evaluate the uncertainties in all measurement results and in the emission
calculation parameters derived from these results. Quantification of these uncertainties ultimately
facilitates the prioritization of efforts to improve the accuracy of emissions inventories developed
using these data.
Measurement uncertainty arises from inaccuracy in the measuring equipment, random variation
in the quantities measured and approximations in data-reduction relations. These individual
uncertainties propagate through the data acquisition and reduction sequences, as described
above, to yield a final uncertainty in the measurement result. Elemental uncertainty can arise
from errors in calibration, data-acquisition, data-reduction, methodology or other sequences.
Two types of uncertainties are encountered when measuring variables: systematic (or bias) and
random (or precision) uncertainties (Wheeler and Ganji, 2004). Systematic and random errors are
combined using IPCC Tier 1 rules for error propagation (described in Section 9) to determine
confidence intervals for the factors presented above.
Random errors are characterized by their lack of repeatability during experimentation and can be
described using probability density functions. The probability density function describes the
range and relative likelihood of possible values. The shape of the probability density function
may be determined empirically from the available measurement data. Confidence limits give the
range within which the underlying value of an uncertain quantity is thought to lie for a specified
probability. This range is called the confidence interval and is determined using the
bootstrapping method described in Section 3.7.3. The IPCC (2000) Good Practice Guidance
suggestion to use a 95% confidence level is adopted for this study (i.e., the interval that has a
95% probability of containing the unknown true value).
Systematic errors do not vary during repeated readings and are usually due to instrument
properties or data reduction. The systematic uncertainties for measurement devices and gas
analysis presented in Table 11 are considered when calculating leak rate uncertainties. Further
discussion of uncertainties introduced by component count and leak detection methods are
presented in Section 3.7.1 and 3.7.2.
Table 11: Parameter uncertainties according to measurement device or gas analysis
source.
Parameter Measurement Device Uncertainty Reference
Atmospheric
Pressure and
Temperature
Multifunction digital
thermometer and barometer
±10% Professional judgement
Flow Rate Anti-Static Measurement Bag ±10% Heath, 2014
Hawk PD Meter ±2% Calscan, 2017

57
Table 11: Parameter uncertainties according to measurement device or gas analysis
source.
Parameter Measurement Device Uncertainty Reference
Hi-Flow Sampler ±10% Bacharach, 2015
Technician estimate from IR
image
±100% Professional judgement
Leak
Detection
IR Camera On average 3 of
every 4 leaks are
detected
Professional judgement
and Ravikumar et al, 2018
Molecular
Weight of
Gas Mixture
Site specific gas analysis ±5% Professional judgement
Typical gas analysis ±25%
3.7.1 COMPONENT COUNTING UNCERTAINTY
Of particular influence on overall confidence intervals is the uncertainty inherent to component
and pneumatic device counting. Notwithstanding the desktop and field training described in
Section 7.4, there is variability and bias introduced by field technicians when interpreting,
classifying and counting the tremendous number of components in pressurized hydrocarbon
service. To estimate the uncertainty introduced by field technicians, independent surveys were
completed on different days by 2 different field teams of the same facility. Results from these
surveys provide two overlapping sample counts for 8 distinct component types and 6 different
pneumatic devices. Although the surveys covered a variety of equipment, the limited nature of
two sample points per component and pneumatic device precludes an empirical estimation of the
underlying distribution governing counting errors. Thus, a number of assumptions are required to
estimate the uncertainty associated with the potential under or over counting of components and
pneumatics. Individual component and pneumatic counts are combined into a single population
of counting errors by computing the percent difference of each sample count from their
respective sample mean. This normalization step creates a single sample set of 14 representative
counting errors based on the assumption that inherent counting errors are independent of the
component or pneumatic being counted (e.g. counting connectors carrying process gas is the
same as counting connectors in liquid service, is the same as counting level controllers etc.).
Under the assumption that these counting errors are normally distributed, the sample standard
deviation 𝜎𝑠 could provide a simple point estimation for the spread of population of errors.
However, because this survey data is limited in size and is from a single facility it’s likely that
because of sampling variability the uncertainty bounds defined by ±2𝜎𝑠 would not actually
encompass 95% of the expected counting errors. To ensure the spread of the uncertainty bounds
was sufficiently wide a tolerance interval was used.
A tolerance interval for capturing at least k% of the values in a normal population with a
confidence level of 95% has the form ±(tolerance critical value) ⋅ 𝜎𝑠 where the critical values

58
depend on the number of sample points and the desired value of k (typically chosen to be 90, 95,
or 99). In the case of the survey data, choosing k = 95 results in a critical value of 3.012 and an
overall estimate of the counting uncertainty for components and pneumatics was found to be
±166%.
This random error for component and pneumatic device counts is incorporated into population
average count and leak factor uncertainty using IPCC Tier 1 rules for error propagation.
3.7.2 OGI LEAK DETECTION UNCERTAINTY
Considering the recently published empirical correlation between leak rate, viewing distance and
detection probability (Figure 3 in Ravikumar et al, 2018) and that most ground-level components
are screened at a distance of 1 to 2 meters (Greenpath, 2017b); there is good probability that the
IR camera MDL is about 0.015 m3 CH4/hr28 under favourable survey conditions (i.e., warm
temperatures with wind speeds less than 4 m/s). However, survey conditions are not always ideal
(e.g., wind gusts and rain) and screening distances increase for elevated components like
compressor rod-packing vents (perhaps 3 to 6 meters away) and tank thief hatches (perhaps 5 to
20 meters away). Also, the capability and patience of technicians using the IR camera will vary
and impact whether a leak is detected or not. Research, supported by the EPA, is underway at the
Methane Emissions Test and Evaluation Center (METEC) in Colorado to develop empirical
correlations for OGI performance factors (e.g., OGI equipment model, operator group and
atmospheric conditions).
In the absence of defensible correlations, it is estimated that the IR camera on average detects 3
of every 4 leaks. Under the assumption that false positives (i.e. detecting a leak from a non-
leaking component) do no occur, the actual number of component leaks at a site cannot be less
than the leaks observed during an OGI survey. Consequently, the expected number of leaking
components was modelled by scaling the observed leak counts by a leak count multiplier equal
to 1+X where X is a random variable following a half-normal distribution with a mean of 1/3.
This systematic error is incorporated into the population average leak factor uncertainty using
IPCC Tier 1 rules for error propagation.
3.7.3 BOOTSTRAPPING METHOD
Bootstrapping is a statistical resampling method which is typically used to estimate population
variables/parameters from empirically sampled data (Efron, and Tibshirani, 1993). Bootstrapping
as a method is non-parametric and does not rely on common assumptions such as normality, data
symmetry or even knowledge of the data’s underlying distribution. It is applied by other studies
investigating ‘heavy-tailed’ leak distributions and is shown to increase the width of confidence
28 This equals 10 g CH4/hr and is also the lowest measurement result obtained when using the High Flow Sampler
during 2017. The manufacturer specification for the High Flow is 0.085 m3/hr and results below this MDL are
possible but have greater uncertainty.

59
intervals by increasing the upper bound (Brandt et al, 2016). The one main underlying
assumption behind bootstrapping, for the results to be reliable, is that the sample set is
representative of the population.
In its most basic form bootstrapping is easily implemented to estimate the mean and the mean’s
associated confidence interval. For a sample set of size N, the samples are randomly resampled
N-times with replacement to create a new set of observations of equal size. From this new
resampled set a statistical parameter, in this case the mean, can be calculated. The procedure of
resampling and re-computing a statistic from the original data is repeated over a large number of
iterations (e.g. 10000 times) to obtain a distribution of bootstrapped estimates of the mean. An
overall estimate and 95% confidence interval of the population mean is then extracted from the
bootstrapped distribution.
The above bootstrapping process was directly applied to major equipment counts to obtain mean
count estimates with a corresponding 95% confidence interval per well status or facility subtype.
By virtue of the bootstrapping process the computed confidence intervals are not necessarily
symmetric as would be the case under assumption that counts are normally distributed. For
components, pneumatics, and flow rates the sample data was varied normally on each bootstrap
resample according to specified counter and measurement device uncertainties.
For components, confidence interval estimates for a mean population leak factor were calculated
by a Monte Carlo simulation. For each component type per service, where the leak data
permitted, a population leak factor defined by:
# of component leaks
# of total components∙ Leak factor
was computed 10000 times while randomly varying the number of component leaks as in Section
3.7.2 and varying the total number of components and the leak factor following their respective
bootstrapped distributions. Similar to the bootstrapping process above, an overall estimate and
95% confidence interval of the population mean leak factor is then extracted from the resultant
Monte Carlo distribution.
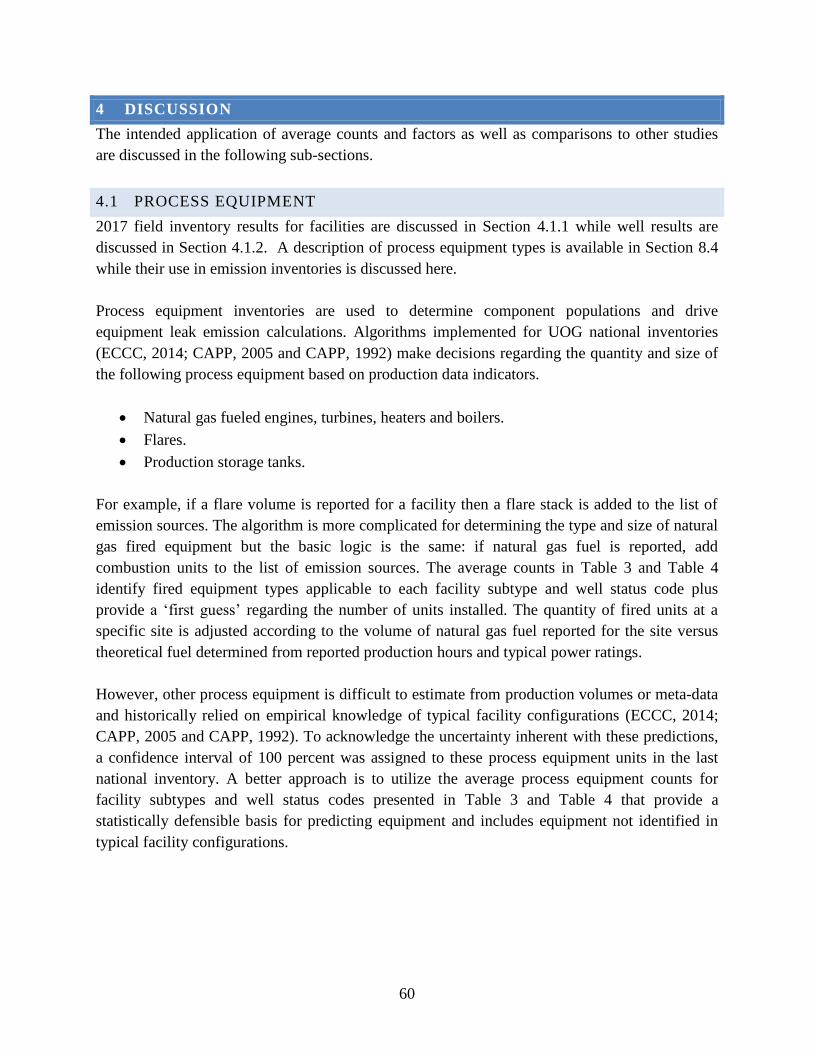
60
4 DISCUSSION
The intended application of average counts and factors as well as comparisons to other studies
are discussed in the following sub-sections.
4.1 PROCESS EQUIPMENT
2017 field inventory results for facilities are discussed in Section 4.1.1 while well results are
discussed in Section 4.1.2. A description of process equipment types is available in Section 8.4
while their use in emission inventories is discussed here.
Process equipment inventories are used to determine component populations and drive
equipment leak emission calculations. Algorithms implemented for UOG national inventories
(ECCC, 2014; CAPP, 2005 and CAPP, 1992) make decisions regarding the quantity and size of
the following process equipment based on production data indicators.
Natural gas fueled engines, turbines, heaters and boilers.
Flares.
Production storage tanks.
For example, if a flare volume is reported for a facility then a flare stack is added to the list of
emission sources. The algorithm is more complicated for determining the type and size of natural
gas fired equipment but the basic logic is the same: if natural gas fuel is reported, add
combustion units to the list of emission sources. The average counts in Table 3 and Table 4
identify fired equipment types applicable to each facility subtype and well status code plus
provide a ‘first guess’ regarding the number of units installed. The quantity of fired units at a
specific site is adjusted according to the volume of natural gas fuel reported for the site versus
theoretical fuel determined from reported production hours and typical power ratings.
However, other process equipment is difficult to estimate from production volumes or meta-data
and historically relied on empirical knowledge of typical facility configurations (ECCC, 2014;
CAPP, 2005 and CAPP, 1992). To acknowledge the uncertainty inherent with these predictions,
a confidence interval of 100 percent was assigned to these process equipment units in the last
national inventory. A better approach is to utilize the average process equipment counts for
facility subtypes and well status codes presented in Table 3 and Table 4 that provide a
statistically defensible basis for predicting equipment and includes equipment not identified in
typical facility configurations.

61
4.1.1 FACILITIES
A comparison of average equipment counts applied to facility subtypes in the 2011 UOG
national inventory versus those observed during 2017 field surveys is presented in Table 12
(when available). The total number of facility subtypes for each year is also presented as an
indicator of the relative importance of a subtype to the Alberta UOG emission inventory. Of the
54 process equipment types anticipated to be in operation (delineated in Section 8.4), only half of
these were observed during the 2017 surveys. Moreover, only the following 14 process
equipment types were observed at a frequency greater than 1 in every 20 facilities visited. This is
expected because of the tendency for standardized facilities and because little processing occurs
upstream of gas plants and refineries. Thus, the simple equipment assignments made for the 2011
national inventory are reasonable. However, exceptions do occur and the average counts
presented in Table 3 and Table 4 enable their quantification as well as improved delineation
between facility subtypes and wells. For example, gas analysis systems are a source of
continuous venting emissions and an H2S analyzer was identified as the 3rd largest emitter
observed by GreenPath Energy during 2016 inspections (Greenpath, 2017a), however, it’s
unknown how many analyzers are installed upstream of gas plants. Results from Table 3
indicate gas analyzers are installed at approximately 1 in every 17 compressor stations and at the
same frequency for crude oil multiwell proration batteries while Table 4 shows gas analyzers
installed at approximately 1 in 100 crude oil wells (pumping). Applying these factors to
corresponding facility and well populations indicates there are about 400 gas analyzers installed
upstream of gas plants in Alberta.
Catalytic Heater
Production Tank
Separator
Pipeline Header
Pig Trap
Reciprocating Compressor
Screw Compressor
Propane Fuel Tank
Tank Heater
Flare Knockout Drum
Treater
Dehydrator - Glycol
Liquid Pump
Pop Tank
Equipment at single-well batteries were assigned to UWIs (discussed in Section 4.1.2) so single-
well batteries are not presented in Table 12. 2011 equipment counts are blank for bitumen

62
batteries and custom treating facilities because site-wide component counts were utilized in the
2011 inventory which precludes a direct comparison.
Dehydrators are not presented in Table 12 because, the AER Directive 039 inventory of glycol
dehydrators (and emission control details) is relied on instead of the average counts presented in
in Table 3. However, applying the average dehydrator counts to corresponding facility
populations in Table 1 results in a prediction of 1,300 dehydrators operating at batteries,
compressor stations and gathering systems. This is only 22 percent greater than listed for the
same facility types in the 2016 AER dehydrator inventory (AER, 2017) which provides some
confidence in provincial equipment populations predicted based on 2017 survey results.
2017 gas flow meter counts don’t appear in Table 12 because they are defined as a component
type (not an equipment type) for the 2017 survey with average leak rates presented in Section
3.5.
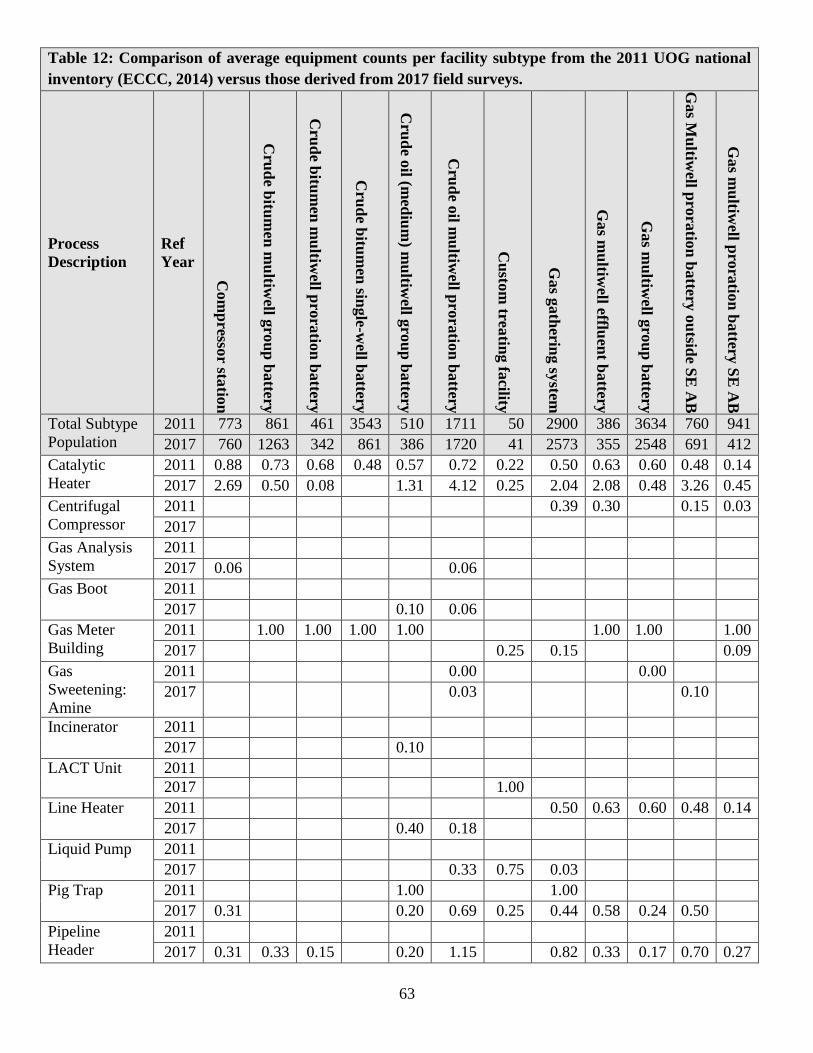
63
Table 12: Comparison of average equipment counts per facility subtype from the 2011 UOG national
inventory (ECCC, 2014) versus those derived from 2017 field surveys.
Process
Description
Ref
Year
Com
presso
r statio
n
Cru
de b
itum
en m
ultiw
ell gro
up
battery
Cru
de b
itum
en m
ultiw
ell pro
ratio
n b
attery
Cru
de b
itum
en sin
gle
-well b
attery
Cru
de o
il (med
ium
) mu
ltiwell g
rou
p b
attery
Cru
de o
il mu
ltiwell p
rora
tion
battery
Cu
stom
treatin
g fa
cility
Gas g
ath
ering sy
stem
Gas m
ultiw
ell effluen
t battery
Gas m
ultiw
ell gro
up
battery
Gas M
ultiw
ell pro
ratio
n b
attery
ou
tside S
E A
B
Gas m
ultiw
ell pro
ratio
n b
attery
SE
AB
Total Subtype
Population
2011 773 861 461 3543 510 1711 50 2900 386 3634 760 941
2017 760 1263 342 861 386 1720 41 2573 355 2548 691 412
Catalytic
Heater
2011 0.88 0.73 0.68 0.48 0.57 0.72 0.22 0.50 0.63 0.60 0.48 0.14
2017 2.69 0.50 0.08 1.31 4.12 0.25 2.04 2.08 0.48 3.26 0.45
Centrifugal
Compressor
2011 0.39 0.30 0.15 0.03
2017
Gas Analysis
System
2011
2017 0.06 0.06
Gas Boot 2011
2017 0.10 0.06
Gas Meter
Building
2011 1.00 1.00 1.00 1.00 1.00 1.00 1.00
2017 0.25 0.15 0.09
Gas
Sweetening:
Amine
2011 0.00 0.00
2017 0.03 0.10
Incinerator 2011
2017 0.10
LACT Unit 2011
2017 1.00
Line Heater 2011 0.50 0.63 0.60 0.48 0.14
2017 0.40 0.18
Liquid Pump 2011
2017 0.33 0.75 0.03
Pig Trap 2011 1.00 1.00
2017 0.31 0.20 0.69 0.25 0.44 0.58 0.24 0.50
Pipeline
Header
2011
2017 0.31 0.33 0.15 0.20 1.15 0.82 0.33 0.17 0.70 0.27

64
Table 12: Comparison of average equipment counts per facility subtype from the 2011 UOG national
inventory (ECCC, 2014) versus those derived from 2017 field surveys.
Process
Description
Ref
Year
Com
presso
r statio
n
Cru
de b
itum
en m
ultiw
ell gro
up
battery
Cru
de b
itum
en m
ultiw
ell pro
ratio
n b
attery
Cru
de b
itum
en sin
gle
-well b
attery
Cru
de o
il (med
ium
) mu
ltiwell g
rou
p b
attery
Cru
de o
il mu
ltiwell p
rora
tion
battery
Cu
stom
treatin
g fa
cility
Gas g
ath
ering sy
stem
Gas m
ultiw
ell effluen
t battery
Gas m
ultiw
ell gro
up
battery
Gas M
ultiw
ell pro
ratio
n b
attery
ou
tside S
E A
B
Gas m
ultiw
ell pro
ratio
n b
attery
SE
AB
Pop Tank 2011 0.96 0.95 0.75 0.90 0.94 0.54 0.49 0.31 0.10
2017 0.06 0.10 0.21 0.50 0.03
Power
Generator
(natural gas
fired)
2011
2017 0.03 0.10
Process Boiler 2011
2017 0.03
Production
Tank
2011 1.93 0.53 1.18 1.50 1.32 0.16 0.84 0.80 0.52 0.12
2017 0.19 1.07 1.54 1.29 2.57 3.51 0.32 0.41 0.28 0.30
Propane Fuel
Tank
2011
2017 0.08 2.76 0.06
Reciprocating
Compressor
2011 0.88 0.14 0.21 0.07 0.30 0.49 0.48 0.51 0.44 0.26 0.07
2017 0.82 0.21 0.70 0.08 0.07 0.25
Reciprocating
Compressor -
Electric Driver
2011
2017 0.06 0.09 0.18
Screw
Compressor
2011
2017 0.44 0.58 1.08 0.10 0.15 0.06 0.25
Screw
Compressor -
Electric Driver
2011
2017 0.09 0.76 0.06
Scrubber 2011
2017 0.03 0.50
Separator 2011 1.03 1.00 0.01 1.00 1.01 1.01 1.02 1.00 1.01
2017 0.75 0.70 2.46 0.50 0.88 0.83 0.21 0.65 0.27
Storage Bullet 2011
2017 0.10

65
Table 12: Comparison of average equipment counts per facility subtype from the 2011 UOG national
inventory (ECCC, 2014) versus those derived from 2017 field surveys.
Process
Description
Ref
Year
Com
presso
r statio
n
Cru
de b
itum
en m
ultiw
ell gro
up
battery
Cru
de b
itum
en m
ultiw
ell pro
ratio
n b
attery
Cru
de b
itum
en sin
gle
-well b
attery
Cru
de o
il (med
ium
) mu
ltiwell g
rou
p b
attery
Cru
de o
il mu
ltiwell p
rora
tion
battery
Cu
stom
treatin
g fa
cility
Gas g
ath
ering sy
stem
Gas m
ultiw
ell effluen
t battery
Gas m
ultiw
ell gro
up
battery
Gas M
ultiw
ell pro
ratio
n b
attery
ou
tside S
E A
B
Gas m
ultiw
ell pro
ratio
n b
attery
SE
AB
Tank Heater 2011 0.73 0.68 0.48 0.57 0.72 0.22
2017 0.76 1.54 0.03 0.17
Treater 2011 1.00
2017 0.61 1.00

66
4.1.2 WELLS
For wells, each active UWI was assigned a single wellhead in the 2011 UOG national inventory.
The 2017 field survey results summarized in Table 13 indicate there are additional equipment
units dedicated to servicing wells that should be included in emission inventories. Of particular
note are multiwell batteries where the number of wells can vary from 2 to more than 1000.
Applying the average counts for facilities from Table 3 doesn’t adequately represent the
variation in process equipment installed at a 2-well battery versus a 1000-well battery. Using
well counts to drive process equipment predictions will result in more representative total
populations.
Average wellhead counts less than one occur because of suspended wells where the main
production valve is closed and downstream piping is depressurized. Shut-in wells are not
included in the inventory because they are not a source of fugitive emissions. Using wellhead
counts of less than one for emission inventories is reasonable because it’s possible for a well to
produce for only part of a reporting month, appear as an active well but in reality it was only a
source of fugitive emissions for the period it was producing.

67
Table 13: Average well process equipment counts observed in 2017 versus 2011 UOG inventory counts.
Well Status Code Well Description
Gas
An
aly
sis
Syst
em (
2017)
Gas
Met
er B
uil
din
g (
2017)
Pig
Tra
p (
2017)
Pip
elin
e H
ead
er (
2017)
Pop
Tan
k (
2017)
Pro
pan
e F
uel
Tan
k (
2017)
Scr
ub
ber
(2017)
Sep
ara
tor
(2017)
Wel
l P
um
p (
2017)
Wel
lhea
d (
2011)
Wel
lhea
d (
2017)
CBMCLS FLOW Coalbed methane-coals only flowing 0.36 1.00 0.93
CBMOT FLOW Coalbed methane-coals&oth lith flowing 0.05 1.00 1.00
CBMOT PUMP Coalbed methane-coals&oth lith pumping 1.00 1.00 1.00
CR-BIT PUMP Crude bitumen pumping 0.01 0.18 0.81 1.00 0.99
CR-OIL FLOW Crude oil flowing 0.19 0.10 1.00 1.00
CR-OIL PUMP Crude oil pumping 0.01 0.16 0.03 0.07 0.01 0.01 0.27 0.23 1.00 1.00
GAS FLOW Gas flowing 0.06 0.07 0.04 0.01 0.45 1.00 1.00
GAS PUMP Gas pumping 0.05 0.05 0.02 0.53 1.00 0.98
GAS STORG Gas storage 0.50 1.00 1.00
SHG FLOW Shale gas only flowing 1.00 1.00 1.00

68
4.2 COMPONENTS
A comparison between the component counts observed during the 2017 field study and those
originally derived for the first Canadian UOG “bottom-up” national emission inventory (CAPP,
1992) is presented in Table 14. A simple ratio of the 2017 mean divided by the 1992 mean
provides an indication of relative change in the average counts (nulls indicate zero components
for one of the reference years). The historic components counts are based on bills of materials,
drawings and actual field inspections of 100 process units (as described in Section 8, Volume 2
of CAPP, 1992). The 1992 report identifies field inspections as the most reliable method for
determining average counts. The key advantages are the ability of inspectors to identify and
account for components not illustrated on drawings (e.g., threaded connections); de-pressurized
equipment; and exclude back-welded threaded connections (that have no pathway for leakage).
The main disadvantages of field inspections are the time commitment and process knowledge
required to identify and classify applicable components. Notwithstanding the inspector training
efforts described in Section 7.4, large uncertainties are inherent to this approach and are a key
contributor to confidence interval results presented in Table 5.
The number of components and type diversity per equipment type is greater for the 2017 data
set. This is likely driven by increased process control and liquids-rich gas production introduced
over the last 30 years as well as a specific field objective to account for every component in
pressurized hydrocarbon service. When counting, inspectors included all process equipment
components plus downstream components until they arrived at the inlet flange of the next
process unit. This could include a significant number of components from ‘yard piping’ that are
not physically attached to the process unit but are potential leak sources that need to be
accounted. For example, the total average number of components for a separator increased 60
percent and now includes control valve, meter, open-ended line, PSV and regulator counts.
These changes are reasonable when considering the 3-phase separator, shown in Figure 12, and
commonly used at liquids-rich gas production sites. In addition to the control valve and senior
orifice meter visible in Figure 12, this separator also features 1 junior orifice meter, 2 turbine
meters, 4 regulators (heater and pneumatic pump fuel supply), 1 PSV, 2 chemical injection
pumps and numerous pneumatic instruments.

69
Figure 12: Three-Phase vertical separator located at a liquids-rich gas production site.
The 2017 field study also accounts for less common component installations. For example, a gas
pressure regulator is not part of the typical design for an oil wellhead or included in 1992
wellhead component schedule. However, a regulator was observed in 2017 at the oil wellhead
shown in Figure 13 and at 11 percent of all other oil wellheads. In the Figure 13 example, the
regulator is part of the oil flow control system.
Orifice Meter
Control Valve

70
Figure 13: Example of a gas regulator installed on an oil wellhead.
Average component counts for the process equipment in Table 14 are summed according to
service and component types and presented with confidence intervals in Figure 14 (less than 50
components per category) and Figure 15 (greater than 50 components per category). This view
enables a comparison of 1992 and 2017 component inventories based on process equipment
listed in Table 14. It indicates 2017 average counts are greater than 1992 average for all but 2
component categories (pump seals in light liquid service and open-ended lines in process gas
service). Pump seal counts are lower in 2017 because there appears to be some redundancy in
the 1992 counts for wellheads (Oil Pump), production tanks and pop tanks where the seal was
counted once for the liquid pump and again these equipment types. The decrease in open-ended
lines may be due to improved leak mitigation efforts where the open side of sample or sensor
port valves are typically fitted with a cap, plug or second closed block valve so they are no
longer a potential leak source (and not inventoried as an open-ended line).
Regulator

71
As indicated in Figure 14, the average number of PRVs, control valves and regulators has
increased since 1992. The 1992 gas service PRV counts were limited to 9 of the 25 equipment
types observed to feature pressure relief in 2017. These results suggest that the installation of
pressure relief has proliferated since 1992. The other noteworthy observation is there are no
regulators or control valves included in the original 1992 reference and only a limited number
included in subsequent national inventories. Thus, these components appear to be under
represented in historic inventories and the 2017 counts are a more reasonable basis for estimating
fugitive emissions.
The 1992 reference does not present counts for thief hatches or meters so these are not included
in the Figure 14 comparison.
Figure 14: Comparison of 1992 and 2017 total number of components in light liquid (LL)
and process gas (PG) service for the process equipment presented in Table 14 (component
counts less than 50).

72
Figure 15: Comparison of 1992 and 2017 total number of connectors and valves in light
liquid (LL) and process gas (PG) service for the process equipment presented in Table 14
(component counts greater than 50).

73
Table 14: Comparison of 2017 average (mean) component counts to values historically used for the UOG
national emission inventory (CAPP, 1992).
Process Equipment Type Component Type Service Type
2017
mean
1992
mean Ratio
Catalytic Heater Connector Process Gas 1.16 10 0.12
Catalytic Heater Regulator Process Gas 1.11
Catalytic Heater Valve Process Gas 1.14 1 1.14
Dehydrator - Glycol Connector Light Liquid 11.31 14 0.81
Dehydrator - Glycol Connector Process Gas 206.75 100 2.07
Dehydrator - Glycol Control Valve Light Liquid 0.30
Dehydrator - Glycol Control Valve Process Gas 1.25
Dehydrator - Glycol Meter Process Gas 1.10
Dehydrator - Glycol Open-Ended Line Process Gas 0.40
Dehydrator - Glycol PRV/PSV Process Gas 2.49 1 2.49
Dehydrator - Glycol Regulator Process Gas 5.20
Dehydrator - Glycol Valve Light Liquid 1.45 7 0.21
Dehydrator - Glycol Valve Process Gas 28.84 24 1.20
Flare KnockOut Drum Connector Light Liquid 18.28 20 0.91
Flare KnockOut Drum Connector Process Gas 52.21 26 2.01
Flare KnockOut Drum Control Valve Light Liquid 0.03
Flare KnockOut Drum Control Valve Process Gas 0.17
Flare KnockOut Drum Meter Process Gas 0.03
Flare KnockOut Drum Open-Ended Line Light Liquid 0.65
Flare KnockOut Drum PRV/PSV Process Gas 0.17
Flare KnockOut Drum Regulator Process Gas 1.03
Flare KnockOut Drum Valve Light Liquid 2.91 1 2.91
Flare KnockOut Drum Valve Process Gas 8.46 3 2.82
Gas Boot Connector Light Liquid 25.66 40 0.64
Gas Boot Connector Process Gas 5.00 37 0.14
Gas Boot PRV/PSV Process Gas 0.33
Gas Boot Valve Light Liquid 6.67 2 3.33
Gas Boot Valve Process Gas 0.99 2 0.50
Gas Meter Building Connector Light Liquid 5.44
Gas Meter Building Connector Process Gas 91.14 70 1.30
Gas Meter Building Control Valve Process Gas 0.50
Gas Meter Building Meter Light Liquid 0.29
Gas Meter Building Meter Process Gas 1.28
Gas Meter Building Open-Ended Line Process Gas 0.14
Gas Meter Building PRV/PSV Process Gas 1.07 2 0.54
Gas Meter Building Regulator Process Gas 1.58
Gas Meter Building Valve Light Liquid 0.85
Gas Meter Building Valve Process Gas 18.19 24 0.76
Gas Pipeline Header Connector Light Liquid 5.94
Gas Pipeline Header Connector Process Gas 100.85 10 10.09

74
Table 14: Comparison of 2017 average (mean) component counts to values historically used for the UOG
national emission inventory (CAPP, 1992).
Process Equipment Type Component Type Service Type
2017
mean
1992
mean Ratio
Gas Pipeline Header Control Valve Process Gas 0.42
Gas Pipeline Header Meter Process Gas 0.49
Gas Pipeline Header Open-Ended Line Process Gas 0.06 1 0.06
Gas Pipeline Header PRV/PSV Process Gas 0.32
Gas Pipeline Header Regulator Process Gas 0.73
Gas Pipeline Header Valve Light Liquid 1.49
Gas Pipeline Header Valve Process Gas 28.67 3 9.56
Gas Sweetening: Amine Connector Light Liquid 3.00 3 1.00
Gas Sweetening: Amine Connector Process Gas 84.42 702 0.12
Gas Sweetening: Amine Open-Ended Line Process Gas 3
Gas Sweetening: Amine PRV/PSV Process Gas 0.67 2 0.34
Gas Sweetening: Amine Pump Seal Light Liquid 1
Gas Sweetening: Amine Regulator Process Gas 1.00
Gas Sweetening: Amine Valve Light Liquid 1.00 1 1.00
Gas Sweetening: Amine Valve Process Gas 35.38 60 0.59
Heavy Liquid Pipeline Header Connector Heavy Liquid 27.99
Heavy Liquid Pipeline Header Valve Heavy Liquid 12.05
Incinerator Connector Process Gas 53.00 10 5.30
Incinerator Control Valve Process Gas 2.00
Incinerator Regulator Process Gas 3.00
Incinerator Valve Process Gas 8.00 1 8.00
LACT Unit Connector Light Liquid 117.50
LACT Unit Connector Process Gas 23.07
LACT Unit Control Valve Light Liquid 2.50
LACT Unit Control Valve Process Gas 0.75
LACT Unit Meter Light Liquid 3.50
LACT Unit PRV/PSV Light Liquid 0.50
LACT Unit PRV/PSV Process Gas 0.50
LACT Unit Valve Light Liquid 25.48
LACT Unit Valve Process Gas 0.50
Line Heater Connector Light Liquid 11.23
Line Heater Connector Process Gas 98.60 185 0.53
Line Heater Control Valve Process Gas 0.27
Line Heater Meter Process Gas 0.18
Line Heater PRV/PSV Process Gas 0.63 1 0.63
Line Heater Regulator Process Gas 3.73
Line Heater Valve Light Liquid 2.52
Line Heater Valve Process Gas 11.56 20 0.58
Liquid Pipeline Header Connector Light Liquid 113.03 10 11.30
Liquid Pipeline Header Control Valve Light Liquid 0.42
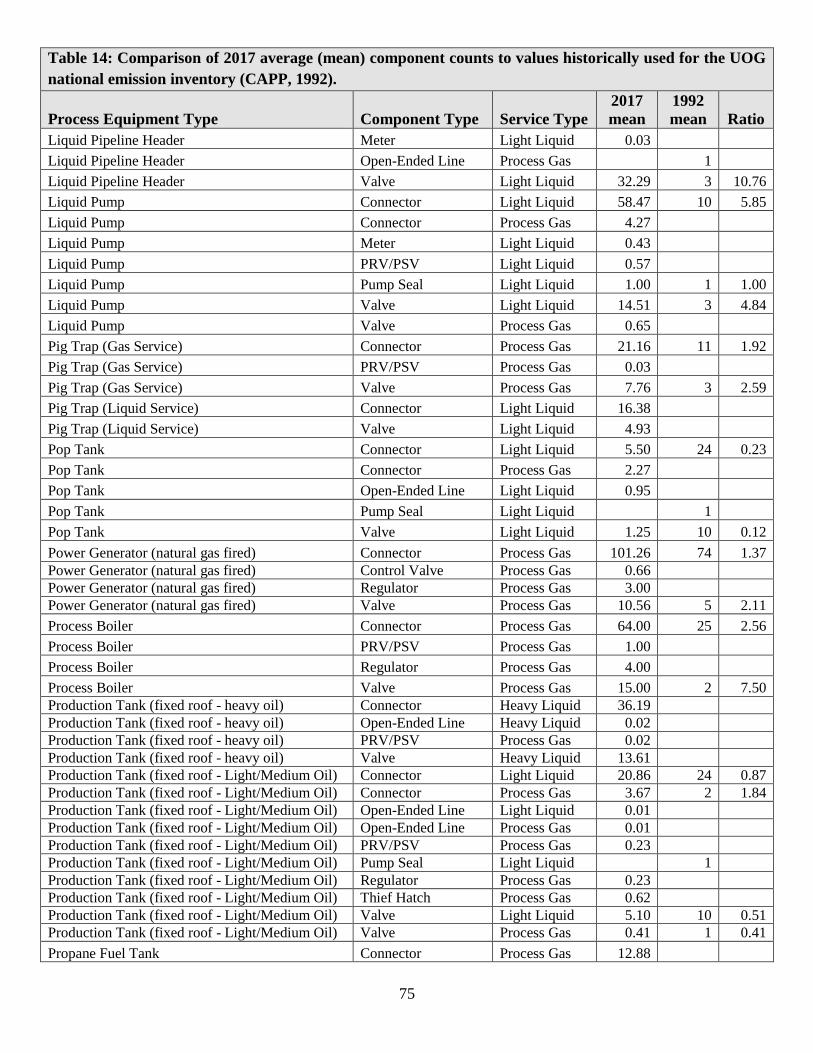
75
Table 14: Comparison of 2017 average (mean) component counts to values historically used for the UOG
national emission inventory (CAPP, 1992).
Process Equipment Type Component Type Service Type
2017
mean
1992
mean Ratio
Liquid Pipeline Header Meter Light Liquid 0.03
Liquid Pipeline Header Open-Ended Line Process Gas 1
Liquid Pipeline Header Valve Light Liquid 32.29 3 10.76
Liquid Pump Connector Light Liquid 58.47 10 5.85
Liquid Pump Connector Process Gas 4.27
Liquid Pump Meter Light Liquid 0.43
Liquid Pump PRV/PSV Light Liquid 0.57
Liquid Pump Pump Seal Light Liquid 1.00 1 1.00
Liquid Pump Valve Light Liquid 14.51 3 4.84
Liquid Pump Valve Process Gas 0.65
Pig Trap (Gas Service) Connector Process Gas 21.16 11 1.92
Pig Trap (Gas Service) PRV/PSV Process Gas 0.03
Pig Trap (Gas Service) Valve Process Gas 7.76 3 2.59
Pig Trap (Liquid Service) Connector Light Liquid 16.38
Pig Trap (Liquid Service) Valve Light Liquid 4.93
Pop Tank Connector Light Liquid 5.50 24 0.23
Pop Tank Connector Process Gas 2.27
Pop Tank Open-Ended Line Light Liquid 0.95
Pop Tank Pump Seal Light Liquid 1
Pop Tank Valve Light Liquid 1.25 10 0.12
Power Generator (natural gas fired) Connector Process Gas 101.26 74 1.37
Power Generator (natural gas fired) Control Valve Process Gas 0.66
Power Generator (natural gas fired) Regulator Process Gas 3.00
Power Generator (natural gas fired) Valve Process Gas 10.56 5 2.11
Process Boiler Connector Process Gas 64.00 25 2.56
Process Boiler PRV/PSV Process Gas 1.00
Process Boiler Regulator Process Gas 4.00
Process Boiler Valve Process Gas 15.00 2 7.50
Production Tank (fixed roof - heavy oil) Connector Heavy Liquid 36.19
Production Tank (fixed roof - heavy oil) Open-Ended Line Heavy Liquid 0.02
Production Tank (fixed roof - heavy oil) PRV/PSV Process Gas 0.02
Production Tank (fixed roof - heavy oil) Valve Heavy Liquid 13.61
Production Tank (fixed roof - Light/Medium Oil) Connector Light Liquid 20.86 24 0.87
Production Tank (fixed roof - Light/Medium Oil) Connector Process Gas 3.67 2 1.84
Production Tank (fixed roof - Light/Medium Oil) Open-Ended Line Light Liquid 0.01
Production Tank (fixed roof - Light/Medium Oil) Open-Ended Line Process Gas 0.01
Production Tank (fixed roof - Light/Medium Oil) PRV/PSV Process Gas 0.23
Production Tank (fixed roof - Light/Medium Oil) Pump Seal Light Liquid 1
Production Tank (fixed roof - Light/Medium Oil) Regulator Process Gas 0.23
Production Tank (fixed roof - Light/Medium Oil) Thief Hatch Process Gas 0.62
Production Tank (fixed roof - Light/Medium Oil) Valve Light Liquid 5.10 10 0.51
Production Tank (fixed roof - Light/Medium Oil) Valve Process Gas 0.41 1 0.41
Propane Fuel Tank Connector Process Gas 12.88

76
Table 14: Comparison of 2017 average (mean) component counts to values historically used for the UOG
national emission inventory (CAPP, 1992).
Process Equipment Type Component Type Service Type
2017
mean
1992
mean Ratio
Propane Fuel Tank Regulator Process Gas 1.00
Propane Fuel Tank Valve Process Gas 2.05
Reciprocating Compressor Compressor Seal Process Gas 3.05 2 1.52
Reciprocating Compressor Connector Light Liquid 51.54 2 25.77
Reciprocating Compressor Connector Process Gas 585.21 420 1.39
Reciprocating Compressor Control Valve Light Liquid 0.67
Reciprocating Compressor Control Valve Process Gas 2.04
Reciprocating Compressor Meter Process Gas 0.28
Reciprocating Compressor Open-Ended Line Process Gas 0.52 4 0.13
Reciprocating Compressor PRV/PSV Process Gas 3.51
Reciprocating Compressor Regulator Process Gas 5.43
Reciprocating Compressor Valve Light Liquid 6.06 1 6.06
Reciprocating Compressor Valve Process Gas 34.45 26 1.33
Reciprocating Compressor - Electric Driver Compressor Seal Process Gas 3.12 2 1.56
Reciprocating Compressor - Electric Driver Connector Light Liquid 55.85 2 27.93
Reciprocating Compressor - Electric Driver Connector Process Gas 392.85 275 1.43
Reciprocating Compressor - Electric Driver Control Valve Light Liquid 1.50
Reciprocating Compressor - Electric Driver Control Valve Process Gas 0.30
Reciprocating Compressor - Electric Driver Meter Process Gas 0.40
Reciprocating Compressor - Electric Driver Open-Ended Line Process Gas 4
Reciprocating Compressor - Electric Driver PRV/PSV Process Gas 2.30
Reciprocating Compressor - Electric Driver Regulator Process Gas 0.10
Reciprocating Compressor - Electric Driver Valve Light Liquid 8.89 1 8.89
Reciprocating Compressor - Electric Driver Valve Process Gas 17.51 20 0.88
Screw Compressor Compressor Seal Process Gas 1
Screw Compressor Connector Light Liquid 33.91
Screw Compressor Connector Process Gas 325.48 228 1.43
Screw Compressor Control Valve Light Liquid 0.15
Screw Compressor Control Valve Process Gas 1.09 1 1.09
Screw Compressor Meter Process Gas 0.94
Screw Compressor Open-Ended Line Process Gas 0.55
Screw Compressor PRV/PSV Process Gas 3.26 2 1.63
Screw Compressor Regulator Process Gas 3.95 2 1.98
Screw Compressor Valve Light Liquid 4.36
Screw Compressor Valve Process Gas 24.42 35 0.70
Screw Compressor - Electric Driver Connector Light Liquid 34.78
Screw Compressor - Electric Driver Connector Process Gas 197.25
Screw Compressor - Electric Driver Control Valve Process Gas 1.13
Screw Compressor - Electric Driver Meter Process Gas 0.38
Screw Compressor - Electric Driver Open-Ended Line Process Gas 0.25
Screw Compressor - Electric Driver PRV/PSV Process Gas 1.50
Screw Compressor - Electric Driver Regulator Process Gas 0.13
Screw Compressor - Electric Driver Valve Light Liquid 3.38

77
Table 14: Comparison of 2017 average (mean) component counts to values historically used for the UOG
national emission inventory (CAPP, 1992).
Process Equipment Type Component Type Service Type
2017
mean
1992
mean Ratio Screw Compressor - Electric Driver Valve Process Gas 16.25
Scrubber Connector Process Gas 71.80
Scrubber PRV/PSV Process Gas 0.50
Scrubber Valve Process Gas 11.46
Separator Connector Light Liquid 65.12 41 1.59
Separator Connector Process Gas 103.93 66 1.57
Separator Control Valve Light Liquid 0.69
Separator Control Valve Process Gas 0.85
Separator Meter Light Liquid 0.40
Separator Meter Process Gas 1.04
Separator Open-Ended Line Process Gas 0.11
Separator PRV/PSV Process Gas 1.60
Separator Regulator Process Gas 2.39
Separator Valve Light Liquid 11.83 11 1.08
Separator Valve Process Gas 19.26 11 1.75
Storage Bullet Connector Light Liquid 80.00 60 1.33
Storage Bullet Connector Process Gas 39
Storage Bullet Control Valve Light Liquid 2.00
Storage Bullet PRV/PSV Light Liquid 1
Storage Bullet PRV/PSV Process Gas 1
Storage Bullet Valve Light Liquid 20.00 27 0.74
Storage Bullet Valve Process Gas 15
Tank Heater Connector Light Liquid 2
Tank Heater Connector Process Gas 51.83 10 5.18
Tank Heater Meter Process Gas 0.02
Tank Heater Regulator Process Gas 3.77
Tank Heater Valve Process Gas 7.50 2 3.75
Treater Connector Light Liquid 90.96 56 1.62
Treater Connector Process Gas 189.36 178 1.06
Treater Control Valve Light Liquid 0.96
Treater Control Valve Process Gas 0.75
Treater Meter Light Liquid 0.46
Treater Meter Process Gas 0.88
Treater Open-Ended Line Light Liquid 0.59 1 0.59
Treater Open-Ended Line Process Gas 0.21 1 0.21
Treater PRV/PSV Process Gas 1.50
Treater Regulator Process Gas 4.67
Treater Valve Light Liquid 16.42 17 0.97
Treater Valve Process Gas 19.43 21 0.93
Well Pump Connector Light Liquid 57

78
Table 14: Comparison of 2017 average (mean) component counts to values historically used for the UOG
national emission inventory (CAPP, 1992).
Process Equipment Type Component Type Service Type
2017
mean
1992
mean Ratio
Well Pump Connector Process Gas 48.83
Well Pump PRV/PSV Process Gas 0.29
Well Pump Pump Seal Light Liquid 1
Well Pump Regulator Process Gas 1.95
Well Pump Valve Light Liquid 14
Well Pump Valve Process Gas 6.03
Wellhead (Bitumen Pump) Connector Heavy Liquid 34.78 22 1.58
Wellhead (Bitumen Pump) Connector Process Gas 26.51
Wellhead (Bitumen Pump) Open-Ended Line Process Gas 0.14
Wellhead (Bitumen Pump) PRV/PSV Process Gas 0.28
Wellhead (Bitumen Pump) Regulator Process Gas 0.45
Wellhead (Bitumen Pump) Valve Heavy Liquid 8.59 9 0.95
Wellhead (Bitumen Pump) Valve Process Gas 7.24
Wellhead (CBM Flow) Connector Process Gas 30.11 10 3.01
Wellhead (CBM Flow) Meter Process Gas 0.24
Wellhead (CBM Flow) Open-Ended Line Process Gas 0.29
Wellhead (CBM Flow) PRV/PSV Process Gas 0.06
Wellhead (CBM Flow) Regulator Process Gas 0.06
Wellhead (CBM Flow) Valve Process Gas 9.73 3 3.24
Wellhead (Gas Flow) Connector Light Liquid 1
Wellhead (Gas Flow) Connector Process Gas 42.08 19 2.21
Wellhead (Gas Flow) Meter Process Gas 0.06
Wellhead (Gas Flow) Open-Ended Line Process Gas 0.01
Wellhead (Gas Flow) PRV/PSV Process Gas 0.05
Wellhead (Gas Flow) Regulator Process Gas 0.39
Wellhead (Gas Flow) Valve Process Gas 12.04 6 2.01
Wellhead (Gas Pump) Connector Process Gas 69.43
Wellhead (Gas Pump) Meter Process Gas 0.32
Wellhead (Gas Pump) Open-Ended Line Process Gas 0.03
Wellhead (Gas Pump) PRV/PSV Process Gas 0.44
Wellhead (Gas Pump) Regulator Process Gas 0.53
Wellhead (Gas Pump) Valve Process Gas 13.79
Wellhead (Gas Storage) Connector Light Liquid 1
Wellhead (Gas Storage) Connector Process Gas 29.50 19 1.55
Wellhead (Gas Storage) Valve Process Gas 9.01 6 1.50
Wellhead (Oil Flow) Connector Light Liquid 29.66 57 0.52
Wellhead (Oil Flow) Connector Process Gas 34.06
Wellhead (Oil Flow) Meter Process Gas 0.05
Wellhead (Oil Flow) Valve Light Liquid 6.64 14 0.47
Wellhead (Oil Flow) Valve Process Gas 11.89
Wellhead (Oil Pump) Connector Light Liquid 47.06 57 0.83

79
Table 14: Comparison of 2017 average (mean) component counts to values historically used for the UOG
national emission inventory (CAPP, 1992).
Process Equipment Type Component Type Service Type
2017
mean
1992
mean Ratio
Wellhead (Oil Pump) Connector Process Gas 17.40
Wellhead (Oil Pump) Meter Process Gas 0.02
Wellhead (Oil Pump) Open-Ended Line Process Gas 0.01
Wellhead (Oil Pump) PRV/PSV Process Gas 0.04
Wellhead (Oil Pump) Pump Seal Light Liquid 1.00 1 1.00
Wellhead (Oil Pump) Regulator Process Gas 0.11
Wellhead (Oil Pump) Valve Light Liquid 9.61 14 0.69
Wellhead (Oil Pump) Valve Process Gas 3.73
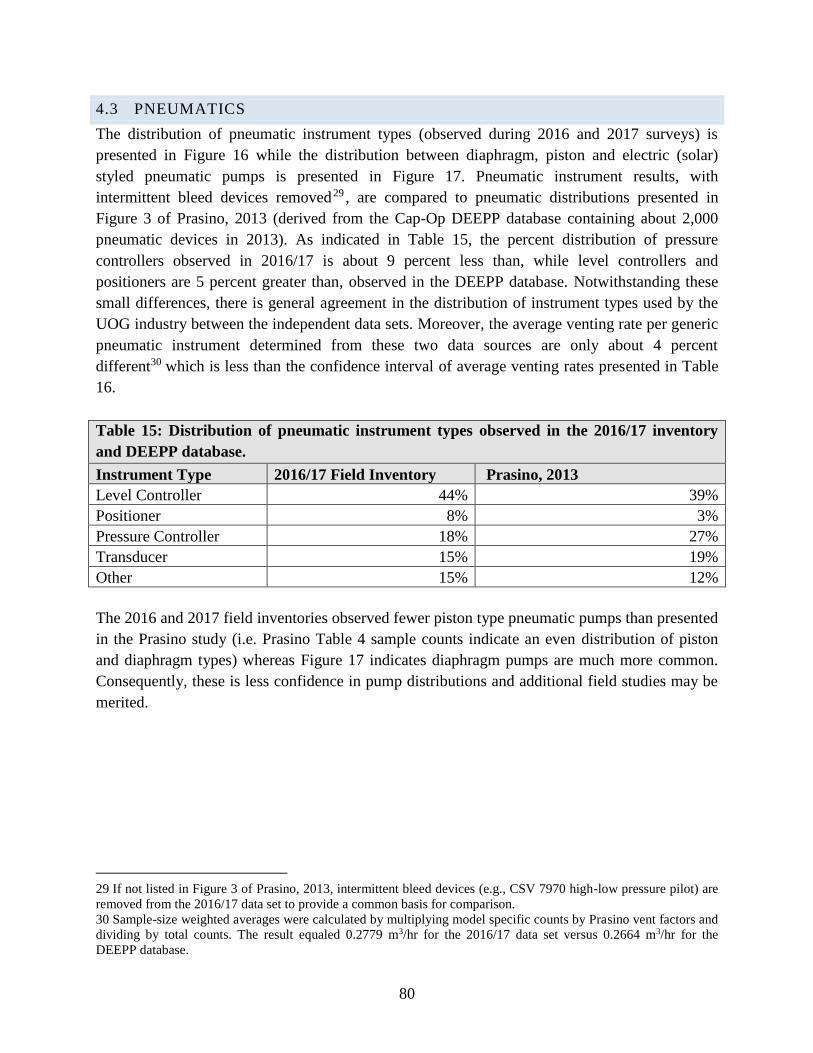
80
4.3 PNEUMATICS
The distribution of pneumatic instrument types (observed during 2016 and 2017 surveys) is
presented in Figure 16 while the distribution between diaphragm, piston and electric (solar)
styled pneumatic pumps is presented in Figure 17. Pneumatic instrument results, with
intermittent bleed devices removed29 , are compared to pneumatic distributions presented in
Figure 3 of Prasino, 2013 (derived from the Cap-Op DEEPP database containing about 2,000
pneumatic devices in 2013). As indicated in Table 15, the percent distribution of pressure
controllers observed in 2016/17 is about 9 percent less than, while level controllers and
positioners are 5 percent greater than, observed in the DEEPP database. Notwithstanding these
small differences, there is general agreement in the distribution of instrument types used by the
UOG industry between the independent data sets. Moreover, the average venting rate per generic
pneumatic instrument determined from these two data sources are only about 4 percent
different30 which is less than the confidence interval of average venting rates presented in Table
16.
Table 15: Distribution of pneumatic instrument types observed in the 2016/17 inventory
and DEEPP database.
Instrument Type 2016/17 Field Inventory Prasino, 2013
Level Controller 44% 39%
Positioner 8% 3%
Pressure Controller 18% 27%
Transducer 15% 19%
Other 15% 12%
The 2016 and 2017 field inventories observed fewer piston type pneumatic pumps than presented
in the Prasino study (i.e. Prasino Table 4 sample counts indicate an even distribution of piston
and diaphragm types) whereas Figure 17 indicates diaphragm pumps are much more common.
Consequently, these is less confidence in pump distributions and additional field studies may be
merited.
29 If not listed in Figure 3 of Prasino, 2013, intermittent bleed devices (e.g., CSV 7970 high-low pressure pilot) are
removed from the 2016/17 data set to provide a common basis for comparison.
30 Sample-size weighted averages were calculated by multiplying model specific counts by Prasino vent factors and
dividing by total counts. The result equaled 0.2779 m3/hr for the 2016/17 data set versus 0.2664 m3/hr for the
DEEPP database.

81
Figure 16: Distribution of pneumatic instrument types observed during 2016 and 2017
surveys.
Figure 17: Distribution of chemical injection pump types observed during 2016 and 2017
surveys.

82
Because pneumatic venting rates were not measured during the 2017 and 2016 field campaigns,
other studies are relied on to determine vent rates representative of each device type. Emission
factors presented in Table 16 are a sample-size weighted average of mean bleed rates from 2013
Prasino and 2018 Spartan (Fisher L2 level controller 31 ) studies as well as manufacturer
specifications for less common models (Prasino, 2013 and Spartan, 2018). The factor labeled
‘generic pneumatic instrument’ includes high and low-bleed instruments that continuously vent.
The ‘generic pneumatic instrument’ vent rate of 0.3217 m3/hr is greater than the ‘generic high
bleed controller’ vent rate published in the Prasino study (0.2605 m3/hr) largely because of the
revised level controller factor published by Spartan (i.e., 0.46 m3/hr ± 22% versus the Prasino
factor of 0.2641 m3/hr ± 34%) and the large number of level controllers in the study population
(indicated in Figure 16). Interestingly, the ‘generic pneumatic instrument’ vent rate is only 9
percent less than the rate applied in the last national inventory (i.e., 0.354 m3/hr in ECCC, 2014).
The same isn’t true for chemical pumps, a rate of 0.236 m3/hr was applied in the last national
inventory which is 4 times less than the rate presented in Table 16.
Table 16: Sample-size weighted average vent rates for pneumatic device types observed
during 2016 and 2017 field campaigns.
Device Type Average Vent Rate
(m3 natural gas/hour)
95% Confidence Interval
(% of mean)
Level Controller 0.3508 31.68
Positioner 0.2627 39.02
Pressure Controller 0.3217 35.95
Transducer 0.2335 22.54
Generic Pneumatic Instrument 0.3206 31.53
Chemical Pump 0.9726 13.99
4.4 POPULATION AVERAGE LEAK FACTORS
Leak factor results are based on best available OGI survey equipment and technicians currently
providing fugitive emission services for the Canadian UOG industry. Notwithstanding this and
QAQC efforts, the OGI leak detection and High Flow Sampler measurement methods have
limitations that impact the completeness and accuracy of the subject dataset. Thus, a rigorous
quantitative uncertainty analysis endeavors to identify and account for all parameters
contributing uncertainty to the final emission factors. 2017 confidence limits are generally
greater than historic values (presented in Table 18) primarily because of the following
31 Further investigation of level controllers was completed by Spartan (with the support of PTAC) because of
concerns that the 2013 Prasino study did not adequately capture emission contributions from the transient sate. The
mean vent rate from Spartan (0.46 m3/hr ± 22% based on 72 samples) is used to determine level controller rate in
Table 16 instead the Prasino factor (0.2641 m3/hr ± 34% based on 48 samples).
83
contributions that were acknowledged but underestimated in historic results (CAPP, 2005 and
CAPP, 2014).
Uncertainty in component counts due to field technician variability and bias (discussed in
Section 3.7.1).
Uncertainty that all leaks are detected by the OGI survey method (discussed in Section
3.7.2).
Exceptions where 2017 confidence limits are less than those presented in CAPP, 2014 occur for
components with large no-leak contributions (e.g., connectors, PRV, pump seals and valves).
The 2014 assessment assigned a very large upper confidence limit to no-leak factors (500
percent) which strongly influences population average confidence limits for components with
large no-leak contributions. Whereas, no-leak contributions are not included in 2017 population
average factors (and should be calculated as a separate category when estimating fugitive
emissions).
Canadian UOG no-leak factors (from Table 7 of CAPP, 1992) are presented in Table 18 and
combined with the 2017 sector-specific population average factors to facilitate an equivalent
comparison with historic emission factors. The no-leak contribution to the combined emission
factor is very small for compressor rod-packings, control valves, open-ended lines, pressure
relief valves and pump seals. However, the no-leak contribution is greater than or approximately
equal to the population average for connectors and valves (the components with the largest
populations). Thus, 2017 combined leak factors are approximately the same as 2014 factors
because they are both strongly influenced by the no-leak contribution. 2005 factors are greater
than both 2017 and 2014 for all components (except SCVF) and therefore less influenced by the
no-leak contribution.
Other noteworthy observations are discussed in the following subsections.
4.4.1 CONTRIBUTION OF FUGITIVE EMISSIONS NOT DETECTED BY THE IR
CAMERA
Multiplying the total population of components screened in 2017 by corresponding no-leak
factors equals 94 kg THC per hour while population average factors yields 149 kg THC per hour.
Thus, the 1992 vintage no-leak factors are responsible for approximately 38 percent of the total
estimated fugitives (for this component population). Considering the significant emission
contribution of no-leak factors; the difficulty detecting very small leaks (less than 10,000 ppmv)
with an IR Camera; the practicality of repairing very small leaks; and the federal regulatory
focus on leak survey frequency, further field studies to validate no-leak factors and their actual
contribution to total UOG fugitive emissions should be considered.
84
4.4.2 DISTRIBUTION OF 2017 LEAKS AND “SUPER-EMITTERS”
As indicated in Figure 18 below, the top 10 sites represent most (about 65 percent) of the total
leak rate measured during the 2017 campaign with the single largest leak (a SCVF) representing
35 percent of the total leak rate. This is a highly skewed distribution with approximately 16
percent of the leaking components responsible for 80 percent of the total leak rate while the top 5
percent of leaking components are responsible for 64 percent of the total leak rate. This result is
consistent with other studies and indicates “super-emitters” are present in the 2017 sample
population. For example, a recent analysis of 15,000 leak measurements from 18 independent
studies indicates leaks from natural gas systems follow extreme distributions with the largest 5
percent of leaks (“super-emitters”) contributing greater than 50 percent of the total leakage
volume (Brandt et al, 2016). Skewed distributions are also observed in measurements completed
in 2016 at sites near Red Deer, Alberta where high-emitting sites disproportionately account for
the majority of emissions. This study indicates 20 percent of sites with highest emissions
contribute 74 to 79 percent of the total emissions measured (Zavala-Araiza D. et al, 2018).
Table 18 provides some perspective on the relationship between facility production type and leak
rate. It indicates that leak rates for 8 of the 11 component categories are greater at oil facilities
than gas facilities. This is similar to observations at production sites near Red Deer, Alberta
where oil producing sites tended to have higher emissions than sites without oil production
(Zavala-Araiza D. et al, 2018).
4.4.3 COMPARISON OF 2017 RESULTS WITH HISTORIC FUGITIVE STUDIES
The 2017 PRV population average leak factor is much greater than the 2014 factor because very
few PRV leaks were present in the 2014 dataset so the 2014 PRV factor is dominated by the no-
leak contribution. The population average leak factors for regulators and control valves are
similar to 2005 factors but much less than 2014 factors because default component populations32
used in CAPP, 2014 understate counts which has a strong upward bias on the emission factors.
These component count limitations were discussed in CAPP, 2014 with recommendations to
obtain actual field counts which motivated the current study.
The implications of new emission factors on total fugitive emissions is estimated in Table 17 and
calculated by multiplying the 2017 component population (from Table 18) by population average
leak factors from two other reference studies. However, the differences between 2017 and 2014
emission factors (described above) makes comparison of total fugitive emissions difficult. For
example, the total number of regulators and control valves are understated in the CAPP, 2014
dataset so it doesn’t matter that the corresponding emission factors are large (if using 2014
component populations). However, multiplying 2014 emission factors for regulators and control
valves by corresponding 2017 component populations results in unreasonably large emission
32 Default component counts are based on inventories published in CAPP, 1992 and are compared to the 2017
counts in Table 14.

85
estimates. To mitigate this bias, 2014 THC emissions presented in Table 17 are calculated using
2017 analogues for regulator and control valve emission factors.
2017 and 2014 results in Table 17 are about the same and approximately 62 and 61 percent lower
than fugitive emissions calculated using 2005 population average leak factors. This observation
is similar to the CAPP, 2014 conclusion that fugitive equipment leaks have decreased 75 percent
since publication of the CAPP BMP and implementation of DI&M programs.
Table 17: Comparison of fugitive emissions calculated using 2017, 2014 and 2005
population average leak factors and the same component population.
2017 (current study) CAPP (2014) CAPP (2005)
Population
Average EF
No-Leak EF
(CAPP, 1992)
Total Population
Average plus
No-Leak EF
Population
Average plus
No-Leak EF
Total THC
Emissions (kg/hr)
149 94 243 245 634
% difference
relative to 2005
-62% -61%
4.4.4 RECIPROCATING COMPRESSOR ROD-PACKING LEAKAGE RATES
EXPECTED BY MANUFACTURERS
The largest manufacturer of reciprocating gas compressors indicates typical leakage rates for
packing rings in good condition range from 0.17 m3 to 0.29 m3 per hour per rod-packing while
the ‘alarm’ point for scheduling maintenance ranges from 2.9 m3 to 5.8 m3 per hour per rod-
packing (Ariel, 2018). The probable population average leak rate for rod-packings presented in
Table 9 is 0.2875 m3 THC per hour per rod-packing (with lower and upper confidence limits of
0.1361 and 0.5415 m3 THC per hour). Thus, reciprocating compressors surveyed in 2017
typically vent within manufacturer tolerances for packing rings in good condition. The upper
confidence limit is much less than the maintenance alarm threshold of 2.9 m3 per hour. Only two
measurement records were greater than 2.9 m3 per hour but because rod-packings vent into a
common header, it’s not known whether the emissions were dominated by one or multiple rod-
packings.
Efforts to determine the age of rod-packings and qualify observed emission rates were not
successful because maintenance and replacement records were not available from operators or
did not provide enough detail to determine rod-packing installation date.
It’s speculated that compressor rod-packing population average leak rates published in CAPP,
2014 are understated because of ambiguity in ‘leak’ versus ‘vent’ definitions. This study defines
leakage from rod-packings as a leak but other programs define it as a vent (e.g., EPA, 2016 and

86
ECCC, 2014)33 . When “leak data” was provided by industry to complete the CAPP, 2014
emission factor analysis, rod-packing records may have been identified as “vents” by services
providers and excluded from the 2014 dataset. Moreover, because 2014 input data was obtained
from secondary sources, QAQC testing was limited to the input dataset and not the entire data
management system. Thus it was difficult to detect this downward bias.
Similar ambiguity may apply to thief hatch and open-ended line components. Thus,
communication of clear and concise definitions to field inspectors and end users is a critical part
of fugitive emission assessments.
4.4.5 SCVF EMISSION FACTOR
The SCVF component is included in Table 18 to improve emission inventory transparency and
highlight the significance of this source. The population average leak factor calculated from 15
leaks detected at 440 wells screened in 2017 is 0.0925 kg THC per hour which is only 37 percent
less than the factor used to estimate SCVF emissions in the last UOG national inventory (ECCC,
2014). SCVF was the second largest source of methane released by the UOG industry because of
the very large number of potential leak sources (i.e., approximately 150,000 wells in Alberta).
The refined emission factor and confidence interval decreases SCVF contributions to total
methane emissions and uncertainty, however, it is expected to remain one of the top 5 methane
emission contributors.
4.4.6 COMPONENTS IN HEAVY LIQUID SERVICE
Also of note is that zero components in heavy liquid service were observed to be leaking. This is
consistent with results presented in CAPP, 2014 and CAPP, 1992. Population average leak
factors are for components in heavy liquid service are presented in CAPP, 2005 but are at least
one order of magnitude less than light liquid no-leak factors presented in Table 18. All four
studies agree that components in heavy oil service have a very small contribution to total UOG
fugitive emissions.
33 Reciprocating compressor rod-packings in good condition are intended to release gas (i.e., a vent) but as they
wear, the release rate increases and becomes a leak.

87
Table 18: Comparison of 2017 and historic population average leak factors (kg THC/h/source) for the Canadian UOG industry.
Sector Component Type Service CAPP (1992)
No-Leak EFb
2017 Field Measurements 2017
Combined
EF
CAPP (2014) CAPP (2005)
EF 95% Confidence Limit
(% of mean)
EF 95% Confidence Limit
(% of mean)
EF Ratio
(2017/2014)
EF 95% Confidence Limit
(% of mean)
EF Ratio
(2017/2005)
Lower Upper Lower Upper Lower Upper
Gas Compressor Rod-
Packingc
PG 0.00175 0.16736 51% 87% 0.16882 0.04669 41% 44% 3.62 0.71300 36% 36% 0.24
Gas Connector PG 0.00061 0.00012 36% 57% 0.00073 0.00082 36% 250% 0.88 0.00082 32% 32% 0.88
Gas Connector LLa 0.00013 0.00001 71% 114% 0.00014 0.00016 54% 378% 0.86 0.00055 90% 111% 0.25
Gas Control Valve PG 0.00023 0.00301 68% 103% 0.00324 0.03992 44% 44% 0.08 0.01620 23% 23% 0.20
Gas Meter PG 0.00061 0.00149 52% 80% 0.00209 No emission factor No emission factor
Gas Open-Ended Line PG 0.00183 0.09630 95% 233% 0.09796 0.04663 42% 45% 2.10 0.46700 62% 161% 0.21
Gas Pressure Relief Valve PGa 0.00019 0.00399 54% 85% 0.00417 0.00019 55% 420% 21.97 0.01700 98% 98% 0.25
Gas Pump Seal PG 0.00023 0.00261 54% 82% 0.00284 0.00291 50% 367% 0.97 0.02320 74% 136% 0.12
Gas Regulator PG 0.00061 0.00077 52% 83% 0.00137 0.03844 45% 45% 0.04 0.00811 72% 238% 0.17
Gas Valve PG 0.00023 0.00062 66% 119% 0.00085 0.00057 38% 163% 1.50 0.00281 15% 15% 0.30
Gas Valve LLa 0.00081 0.00015 72% 122% 0.00096 0.00086 55% 442% 1.12 0.00352 19% 19% 0.27
Oil Compressor Rod-
Packingc
PG 0.00175 0.76120 92% 257% 0.76226 0.01474 60% 66% 51.71 0.80500 36% 36% 0.95
Oil Connector PG 0.00023 0.00019 37% 58% 0.00042 0.00057 27% 96% 0.74 0.00246 15% 15% 0.17
Oil Connector LL 0.00013 0.00001 71% 143% 0.00014 0.00013 36% 282% 1.05 0.00019 90% 111% 0.72
Oil Control Valve PG 0.00008 0.00962 66% 94% 0.00970 0.09063 87% 87% 0.11 0.01460 21% 21% 0.66
Oil Meter PGa 0.00061 0.00105 47% 73% 0.00165 No emission factor No emission factor
Oil Open-Ended Line PGa 0.00183 0.06700 91% 219% 0.06870 0.15692 47% 47% 0.44 0.30800 78% 129% 0.22
Oil Pressure Relief Valve PG 0.00019 0.00756 55% 87% 0.00775 0.00019 38% 313% 40.79 0.01630 80% 80% 0.48
Oil Pump Seal PGa 0.00023 0.00761 73% 142% 0.00783 0.00230 38% 294% 3.41 0.02320 74% 136% 0.34
Oil Regulator PG 0.00061 0.00154 79% 133% 0.00215 0.52829 38% 38% 0.00 0.00668 72% 238% 0.32
Oil Thief Hatch PG 0.00061 0.15852 77% 140% 0.15904 No emission factor No emission factor
Oil Valve PG 0.00008 0.00009 83% 158% 0.00017 0.00122 44% 48% 0.14 0.00151 79% 79% 0.11
Oil Valve LL 0.00058 0.00021 73% 125% 0.00079 0.00058 37% 288% 1.36 0.00121 19% 19% 0.65
All SCVF PG 0.00183 0.09250 98% 204% 0.09427 0.1464 Not Available 0.64 0.1464 Not Available 0.64 a Insufficient sample size for 2017 to determine confidence limits for this sector, component and service type. Therefore, results presented for 2017 include samples from both oil and gas sectors. b No-leak factors are not available from CAPP, 1992 for Regulator, Meter, SCVF and Thief Hatch components so reasonable analogues are selected. c Reciprocating compressor rod-packing emission factors are calculated on a per rod-packing basis and exclude compressors that are tired into a flare or VRU (because these rod-packings are controlled and have a very low probability of ever
leaking to atmosphere). Rod-packings are defined as vents in Directive 060 (AER, 2018).

88
Figure 18: Distribution of total leak rate by site observed during the 2017 Alberta field campaign (excluding 195 sites where no leaks were detected).

89
4.5 LEAKER FACTOR
Canadian UOG ‘leaker’ factors (from Table 7 of CAPP, 1992) are compared to results from the
current study in Table 19. The ‘leaker’ emission factors have increased relative to 1992 for
connectors, open-ended lines and valves. However, leaker factors have decreased for all other
components except for Control Valves, Meters, Regulators and Thief Hatches.

90
Table 19: Leaker emission factors for estimating fugitive emissions from Canadian UOG facilities on a volume or mass basis.
Sector Component Type Service
2017 Field Measurements CAPP (1992)
Leaker
Count EF
95% Confidence
Limit (% of mean) Leaker
Count EF
95% Confidence
Limit (% of mean)
EF Ratio
(2017/1992)
Lower Upper Lower Upper
Gas Compressor Rod-
Packingb PG 20
0.74024 40% 49% 7 0.44 0.44 0.44 0.44
Gas Connector PG 88 0.08606 25% 29% 160 2.29 2.29 2.29 2.29
Gas Connector LLa 6 0.04156 70% 85% 6 1.11 1.11 1.11 1.11
Gas Control Valve PG 7 0.12230 66% 78% No Emission Factor
Gas Meter PG 7 0.05093 45% 57% No Emission Factor
Gas Open-Ended Line PG 9 0.73869 93% 209% 21 61.81 61.81 61.81 61.81
Gas Pressure Relief Valve PGa 7 0.50395 49% 63% 1 0.30 0.30 0.30 0.30
Gas Pump Seal PG 4 0.06177 49% 63% 1 0.14 0.14 0.14 0.14
Gas Regulator PG 17 0.05574 47% 62% No Emission Factor
Gas Valve PG 24 0.26767 64% 100% 101 1.02 1.02 1.02 1.02
Gas Valve LLa 6 0.16929 71% 110% 10 1.99 1.99 1.99 1.99
Oil Compressor Rod-
Packingb PG 7
0.86950 83% 152% 7 0.51 0.51 0.51 0.51
Oil Connector PG 57 0.12545 27% 30% 37 3.35 3.35 3.35 3.35
Oil Connector LL 5 0.03443 71% 120% 6 0.92 0.92 0.92 0.92
Oil Control Valve PG 9 0.12150 62% 73% No Emission Factor
Oil Meter PGa 8 0.05238 40% 50% No Emission Factor
Oil Open-Ended Line PGa 10 0.70729 90% 199% 21 59.19 59.19 59.19 59.19
Oil Pressure Relief Valve PG 4 0.68355 49% 64% 1 0.40 0.40 0.40 0.40
Oil Pump Seal PGa 6 0.16974 71% 125% 1 0.39 0.39 0.39 0.39
Oil Regulator PG 10 0.16221 77% 113% No Emission Factor
Oil Thief Hatch PG 6 0.83178 75% 106% No Emission Factor
Oil Valve PG 4 0.11332 81% 153% 22 2.51 2.51 2.51 2.51
Oil Valve LL 5 0.19429 72% 106% 5 2.28 2.28 2.28 2.28 a Insufficient 2017 sample size to determine confidence limits for this sector, component and service type. Therefore, results include samples from both oil and gas
sectors. b Because compressor rod-packing leakage is routed to common vent lines, the actual number of leakers is not known. The compressor rod-packing ‘leaker’ factor
is calculated on a per vent line basis (not per rod-packing basis). Rod-packings are defined as vents in Directive 060 (AER, 2018).

91
4.6 COMPARISON OF VENT AND LEAK EMISSION RATES
In addition to the inventories and leak measurements discussed above, field inspectors recorded
venting emission sources observed with the IR camera at the 333 locations surveyed during 2017
and estimated their release magnitude (or measured the release if convenient to do so with the
High Flow Sampler). Moreover, pneumatic venting is estimated using the average emission
factors presented in Table 16. Although measurement of venting sources was not a primary
objective for this study, available estimates for pneumatic and process vent sources enable a
qualitative comparison with equipment leaks. Accordingly, the cumulative natural gas release
rate is summed for all emission sources observed during the 2017 field campaign and presented
by emission and source type in Figure 19. The largest contributors to equipment leaks are SCVF
and reciprocating compressor rod-packings that represent approximately 60 percent of the total
leak rate.
More importantly, the total leak rate is about 20 percent of the total natural gas released from all
sources. Pneumatic devices (approximately 33 percent of the total release), production tanks
(approximately 28 percent of the total release), heavy oil well casing vents (approximately 16
percent of the total release) and unlit flares (approximately 3 percent of the total release) are
much more important sources natural gas emissions. A similar study of US natural gas
production sites observed similar emission distributions where pneumatic and other venting
sources contribute upwards of 70 percent while equipment leaks contribute approximately 13
percent of total methane emissions for the industry sector (Allen et al, 2013).
Although direct measurement of vent sources is often difficult to complete with the resources
and equipment typically budgeted for leak surveys because of accessibility and process condition
challenges (e.g., transient tank top emissions, dehydrator still columns or unlit flares).
Qualitative indicators (e.g., the vent is small, large, or very large) may provide useful
information to confirm production accounting completeness and improve the identification of
cost-effective gas conservation opportunities. This approach may identify venting sources where
the release magnitude is not fully appreciated by operators and represents the small number of
sources that contribute the majority of methane emissions (discussed in Allen et al, 2013 and
Zavala-Araiza D. et al, 2018). For example, a comparison with Petrinex records indicates that
approximately 25 percent of Alberta locations observed to be venting in August or September
2017 did not report venting to Petrinex for the corresponding period (which represents about 25
percent of the estimated vent volume in Figure 19) (Petrinex, 2018). Of the 75 percent of
locations where venting was observed and reported, the total Petrinex volume is approximately
half of the volume estimated with the IR camera. Although the IR Camera estimates are
qualitative and not sufficient for production accounting purposes; they can identify process
venting sources, provide an indication of abnormal behaviour and trigger root-cause analysis
when images indicate a risk of exceeding regulated site venting limits.

92
Figure 19: Cumulative hourly release rate for emission and source types observed at 333
locations during the 2017 Alberta field campaign.34
34 The venting estimates presented in Error! Reference source not found. have large, undetermined uncertainties
and only provide a qualitative perspective on natural gas emission sources. Moreover, pneumatic results assume
only half of the inventoried chemical pumps are active because many methanol injections pumps are only active
during cold winter months. Also, in addition to flashing, breathing and working losses; production tank emissions
may include contributions from well casing vents, leaks past liquid dump valves, unintentional gas flow-through
from undersized separators.

93
5 CONCLUSIONS AND RECOMMENDATIONS
The following are key conclusions from the assessment of 2017 field equipment and leak
measurement data.
The following factors should be considered for Alberta UOG emission inventories
subject to the utilization recommendations presented in Section 5.1.
o Process equipment count per facility subtype or well status code.
o Component count per process equipment unit.
o Emission control type per process equipment unit.
o Pneumatic device count per facility subtype or well status code by device and
driver type.
o Leak rate per component and service type considering the entire component
population surveyed (i.e., ‘population average’ factor).
o Leak rate per component and service type considering leaking components only
(i.e., ‘leaker’ factor).
The use of average factors determined in this report is a statistical approach which is only
valid when estimating total emissions from a large number of sources. Results for
individual facilities or process units may easily be in error by several orders of magnitude
or more. However, considering the IPCC Tier 1 rules for error propagation (described in
Section 9), the percentage uncertainty in the aggregate emission estimate for a category
will tend to decrease by a factor of 1/N0.5 where N is the number of sources in that
category. Thus, aggregate emission estimates become more representative as the number
of sources and facilities increases.
The impact of new emission factors on total fugitive emissions is estimated by
multiplying 2017 component populations by population average leak factors from 2017,
2014 and 2005 reference studies. After mitigating bias in the 2014 emission factors, 2017
and 2014 results are observed to be about the same and approximately 62 and 61 percent
lower than fugitive emissions calculated using 2005 population average leak factors. This
observation is similar to the CAPP, 2014 conclusion that fugitive equipment leaks have
decreased 75 percent since publication of the CAPP BMP and implementation of DI&M
programs. However, further analysis based on larger component populations is
recommended before broad conclusions regarding the net impact on Alberta methane
emissions are relied upon.

94
Considering that no-leak factors contribute 38 percent of the total THC fugitives
emissions calculated for the 2017 component population35; the difficulty detecting very
small leaks (less than 10,000 ppmv) with an IR Camera; the practicality of repairing very
small leaks and the federal regulatory focus on leak survey frequency, further field
studies to validate no-leak factors and their actual contribution to total UOG fugitive
emissions should be considered.
The SCVF component is included in Table 18 to improve emission inventory
transparency and highlight the significance of this source. The population average leak
factor calculated from 15 leaks detected at 440 wells screened in 2017 is 0.0925 kg THC
per hour which is only 37 percent less than the factor used to estimate SCVF emissions.
SCVF was the second largest source of methane in the last UOG national inventory
(ECCC, 2014) due to the very large number of potential leak sources (i.e., approximately
150,000 wells in Alberta). Given that the 2017 factor is only 37 percent less than the
factor used in the last inventory, SCVF is expected to remain one of the top 5
contributors of methane in subsequent emission inventories.
Equipment leaks are estimated to be less than 20 percent of total natural gas fugitive and
venting emissions observed during the 2017 field campaign. Pneumatic devices
(approximately 40 percent of the total release), production tanks (approximately 25
percent of the total release), heavy oil well casing vents (approximately 14 percent of the
total release) and unlit flares (approximately 3 percent of the total release) are arguably
much more important sources of natural gas emissions.
Although direct measurement of vent sources is often difficult to complete with the
resources and equipment typically budgeted for leak surveys because of accessibility and
process condition challenges (e.g., transient tank top emissions, dehydrator still columns
or unlit flares). Qualitative indicators obtained with an IR camera (e.g., the vent is small,
large, or very large) may provide useful information to confirm production accounting
completeness and improve the identification of cost-effective gas conservation
opportunities. This approach may identify venting sources where the release magnitude is
not fully appreciated by operators and represents the small number of sources that
contribute the majority of methane emissions (discussed in Allen et al, 2013 and Zavala-
Araiza D. et al, 2018).
35 The component counts presented in Table 18 are multiplied by corresponding no-leak (CAPP, 1992) and 2017
population average emission factors.

95
5.1 UTILIZATION OF FACTORS
The following should be considered when estimating air emissions based results presented in this
study.
Application of average factors from this report implies the adoption of standard
definitions presented in Section 8 for emission, service, component, equipment, facility
and well types.
Average process equipment and pneumatic device counts presented in Table 3, Table 4,
Table 7 and Table 8 should only be applied to corresponding facility subtypes and well
status populations derived from Facility IDs and UWIs (one per licenced wellhead)
reported in the Petrinex “Facility Volumetric Activity Report.” 36
Application of average process equipment and pneumatic device counts to facility and
well populations derived from the AER ST102 and ST37 reports is not appropriate
because these Facility IDs and UWIs may or may not by utilized for production
accounting purposes in Petrinex.
Population average leak factors only include hydrocarbon emissions occurring at rates
greater than the IR Camera and High Flow Sampler MDLs. To estimate fugitive
emissions occurring below these MDLs, no-leak emission factors should be multiplied by
the population of components belonging to the facilities and wells of interest. This
approach enables a better understanding of relative contributions and facilitates inclusion
of operator estimated fugitives into emission inventories
36 Field observations were correlated with Facility IDs and UWIs (one per licenced wellhead) reported during the
survey period in Petrinex. A well licence number identifies an individual surface wellhead and provides a better
indication of well populations than UWI (i.e., there may be multiple production strings (UWI) for a single surface
wellhead).
96
6 REFERENCES
Alberta Energy Regulator (AER). 2017. Annual Dehydrator Benzene Inventory List for the 2016
reporting year. Calgary, AB.
Alberta Energy Regulator (AER). 2016a. Directive 060: Upstream Petroleum Industry Flaring,
Incinerating, and Venting. Calgary, AB. Available at: https://www.aer.ca/rules-and-
regulations/directives/directive-060.
Alberta Energy Regulator (AER). 2016b. Manual 011: How to Submit Volumetric Data to the
AER. Calgary, AB. Available at: www.aer.ca/documents/manuals/Manual011.pdf
Allen, D. T., Pacsi, A. P., Sullivan, D. W., Zavala-Araiza, D., Harrison, M., Keen, K., Seinfeld,
J. H. (2013) Measurements of methane emissions at natural gas production sites in
the United States. http://www.pnas.org/content/110/44/17768
Ariel Corporation. 2018. Compressor Emissions Reduction Technology. Mount Vernon, OH.
Retrieved March 2018 from https://www.arielcorp.com/Technical-
Papers/Compressor-Emissions-Reduction-Technology/
Bacharach, Inc. 2015. HI FLOW® Sampler - For Natural Gas Leak Rate Measurement:
Operation and Maintenance Manual. Rev 7. New Kensington, PA. Available at:
https://www.mybacharach.com/wp-content/uploads/2015/08/0055-9017-Rev-7.pdf
Brandt A R, Heath G A and Cooley D. 2016. Methane leaks from natural gas systems follow
extreme distributions Environ. Sci. Technol. 50 12512–20. Available online at
http://pubs.acs.org/doi/abs/10.1021/acs.est.6b04303
British Columbia Oil and Gas Commission (OGC). 2016. Flaring and Venting Reduction
Guideline. Victoria, BC. Available at: https://www.bcogc.ca/content/flaring-and-
venting-reduction-guideline
Cal Scan Solutions. 2017. Hawk Vent Gas Meter: Solutions for Low Flow Vent Gas
Measurement. Edmonton, AB. Available at:
http://www.calscan.net/solutions_GreenGasMeasurement.html
Canadian Association of Petroleum Producers (CAPP). 2014. Update of Fugitive Emission
Equipment Leak Emission Factors. Prepared by Clearstone Engineering Ltd.,
Calgary, AB. Available at: http://www.capp.ca/publications-and-
statistics/publications/238773 .
Canadian Association of Petroleum Producers (CAPP). 2007, Best Management Practice for
Fugitive Emission Management. Prepared by Clearstone Engineering Ltd., Calgary,

97
AB. Available at: http://www.capp.ca/publications-and-
statistics/publications/116116
Canadian Association of Petroleum Producers (CAPP). 2005 A National Inventory of
Greenhouse Gas (GHG), Criteria Air Contaminant (CAC) and Hydrogen Sulphide
(H2S) Emissions by the Upstream Oil and Gas Industry Volume 5, Compendium of
Terminology, Information Sources, Emission Factors, Equipment Sched’s and
Uncertainty Data September 2004, Tables 3.1 and 4.1, Publication No. 2005-0015
Canadian Association of Petroleum Producers (CAPP). 1992. A Detailed Inventory of CH4 and
VOC Emissions from Upstream Oil & Gas Operations in Alberta, Vol III, Results of
the Field Validation Program, Table 7, Picard et al, March 1992.
Canadian Council of Ministers of the Environment (CCME). 1995. Environmental Guidelines
for Controlling Emissions of Volatile Organic Compounds from Aboveground
Storage Tanks. Document No. CCME-EPC-87E.
Canadian Energy Partnership for Environmental Innovation (CEPEI). 2006. Fugitive Emissions
Measurement Protocol. Guelph, ON.
Clearstone Engineering Ltd. 2017. Decision framework for confirming air emission inventory
boundaries, data sources and quantification methods for the Alberta upstream oil
and natural gas industry. Calgary, AB.
Efron, B and Tibshirani, RJ. 1993. An Introduction to the bootstrap: monographs on statistics
and applied probability 57. N Y Lond Chapman HallCRC, in press.
Environment and Climate Change Canada (ECCC). 2014, National Inventory of GHG, CAC and
Other Priority Substances by the Upstream Oil and Gas Industry (references years
2001 to 2011) – Volumes 1 to 4. Prepared by Clearstone Engineering Ltd., Calgary,
AB.
GreenPath Energy Ltd. 2017a. Alberta Fugitive and Vented Emissions Inventory Study. Calgary,
AB. Available at: http://www.greenpathenergy.com/wp-
content/uploads/2017/03/GreenPath-AER-Field-Survey-
Results_March8_Final_JG.pdf
GreenPath Energy Ltd. 2017b. Alberta Fugitive and Vented Emissions Inventory Study: AER
Survey Data. Calgary, AB. Available at http://www.greenpathenergy.com/wp-
content/uploads/2017/03/AER-Survey-Data_Mar13.pdf
Heath Consultants Incorporated. 2014. Anti-Static Measurement Bag Brochure. Houston, TX
Available at: http://heathus.com/products/anti-static-measurement-bag/

98
Intergovernmental Panel on Climate Change (IPCC). 2000. Good Practice Guidance and
Uncertainty Management in National Greenhouse Gas Inventories. http://www.ipcc-
nggip.iges.or.jp/public/gp/english/.
Petrinex. 2018. Query Monthly Volumetric Submissions. Calgary, AB. Available to AER
Business Associated online at: http://www.petrinex.ca
Prasino Group. 2013. Final Report for Determining Bleed Rates for Pneumatic Devices in British
Columbia. Calgary Alberta. Available from
http://www2.gov.bc.ca/gov/topic.page?id=CEA465B4EB794C01BEAEEC3C4C48
AB95
Ravikumar A P, Wang J, McGuire M, Bell C S, Zimmerle D and Brandt A. 2018. “Good versus
Good Enough?” Empirical Tests of Methane Leak Detection Sensitivity of a
Commercial Infrared Camera. Environ. Sci. Technol. 52 (4), pp 2368–2374.
Available online at https://pubs.acs.org/doi/abs/10.1021/acs.est.7b04945
Saskatchewan Ministry of Economy (ECON). 2015. Directive S-10: Saskatchewan Upstream
Petroleum Industry Associated Gas Conservation Directive. Regina, SK. Available
at: http://publications.gov.sk.ca/documents/310/85153-Directive%20S-
10%20Saskatchewan%20Upstream%20Petroleum%20Industry%20Associated%20
Gas%20Conservation%20Directive.pdf.
Spartan Controls. 2018. Pneumatic Vent Gas Measurement. Prepared for the Petroleum
Technology Alliance of Canada (PTAC). Calgary, AB.
US Environmental Protection Agency (US EPA). 2016. Greenhouse Gas Reporting Rule:
Technical Support for Leak Detection Methodology Revisions and Confidentiality
Determinations for Petroleum and Natural Gas Systems Final Rule. Docket ID No.
EPA-HQ-OAR-2015-0764. Washington, DC. Retrieved from
https://www.regulations.gov/document?D=EPA-HQ-OAR-2015-0764-0066
US Environmental Protection Agency (US EPA). 1995. Protocol for Equipment Leak Emission
Estimates. Washington, DC. Retrieved from
https://www3.epa.gov/ttnchie1/efdocs/equiplks.pdf
Wheeler A., and Ganji A. 2004. Introduction to Engineering Experimentation. 2nd Ed. New
Jersey: Pearson Prentice Hall.
Zavala-Araiza D, Herndon SC, Roscioli JR, Yacovitch TI, Johnson MR, Tyner DR, et al..
Methane emissions from oil and gas production sites in Alberta, Canada. Elem Sci
Anth. 2018;6(1):27. DOI: http://doi.org/10.1525/elementa.284

99
7 APPENDIX – 2017 AER FIELD SAMPLING PLAN
The following sampling plan was used for the field campaign conducted between 14 August and
23 September 2017.
7.1 OBJECTIVE
Complete a field inventory and measurement campaign to refine models for predicting
equipment/component counts and emission rates used in the determination of fugitive equipment
leaks and pneumatic venting. The specific data collection tasks to be completed are:
1. Identify Petrinex Facility ID(s) and UWI corresponding to each location and equipment
unit surveyed.
2. Count major process equipment (described in Section 8.4 below) and document
applicable emission control type (i.e., gas conservation or gas tied into flare).
3. Count components (defined in Section 8.3 below) for each major process equipment unit
and identify hydrocarbon service type (as defined in Section 8.2 below).
4. Count pneumatic instruments/pumps and identify their driver (i.e. natural gas, air, electric
or other).
5. Conduct an optical gas imaging (OGI) survey and measure any detected leaks (defined in
Section 8.1.1 below).
This campaign is targeting up to 500 locations to provide a sample size of at least 30 Facility IDs
for each target facility subtype group.
7.2 SITE SELECTION
Relevant site population is based on April 2017 Petrinex volume data.
Random selection from facility subtype populations contributing the most to methane
emissions and uncertainty (i.e., natural gas, light/medium crude and cold heavy crude
production batteries and compressor stations). Selection constrained by:
o Exclude sites that emit more than 100,000 t CO2E because these sites are already
subject to SGER GHG reporting and verified by independent 3rd party.
o Exclusion of facility subtype codes with less than 50 instances. Because these
subtypes are limited in number, they have a small contribution to provincial
emissions.
o Proximity to a town with accommodation.
o Locked gates.
For each selected site:
o Email notification letter to Petrinex contact that requests:

100
The name, phone number and email of the production superintendent(s) or
manager(s) responsible for subject locations.
The most recent measurement schematic, showing details delineated in
Directive 017 Section 1.9.1, for subject locations.
o Call production superintendent or manager to confirm site visit timing and ensure
safe access (i.e., avoid locked gates). Alternatively, call company main line
available in “Target Facilities.xlsx” (phone numbers for Petrinex operator and
licensee are provided).
7.2.1 TARGET FACILITIES
All target facility subtypes on a location must be surveyed with relevant Facility IDs
selected in the tablet. Facility IDs for target subtypes are pre-loaded onto the tablets.
o Target Facility IDs can be identified by filtering column A in tab “FacID pivot” of
“Target Facilities.xlsx” on the subject location. Target subtypes are noted in
column B with relevant Facility IDs in column D (see Figure 20).
Non-target Facility IDs are excluded from the tablet. Equipment at non-target Facility
IDs should not be surveyed.
Before arriving on site, select the subject “surface location” and “Petrinex Facility ID” on
the tablet. When multiple Facility IDs occur, review the measurement schematic and
select the ID relevant to the area of the site being surveyed (this should already be
completed by the field coordinator and provided to the field team).
If a target Facility ID appears in “Target Facilities.xlsx” but is not stated on the
measurement schematic, equipment belonging to this Facility ID is very likely off-site.
Thus, on-site equipment should not be assigned to the off-site Facility ID.
For the 10-34-040-04W5 example, a measurement schematic is presented in
measurement schematic Figure 21.
o Equipment for the gas plant is not surveyed (ABGP0001456 is not available on
the tablet dropdown list).
o Equipment for the battery is surveyed and assigned to ABBT4120008 because
this Facility ID is the only one listed at 10-34-040-04W5 on the measurement
schematic.
o Equipment for the gas gathering system is surveyed and assigned to
ABGS0003668 because this Facility ID is the only one listed at 10-34-040-04W5
on the measurement schematic.
o No equipment is assigned to ABGS0140581, ABBT0140582 or ABBT0140583
because corresponding equipment is actually at other physical locations and
operated by other companies (see Figure 22). The physical location of these sites
was incorrectly entered into Petrinex.

101
Figure 20: Example of target and non-target Facility IDs for a single location.
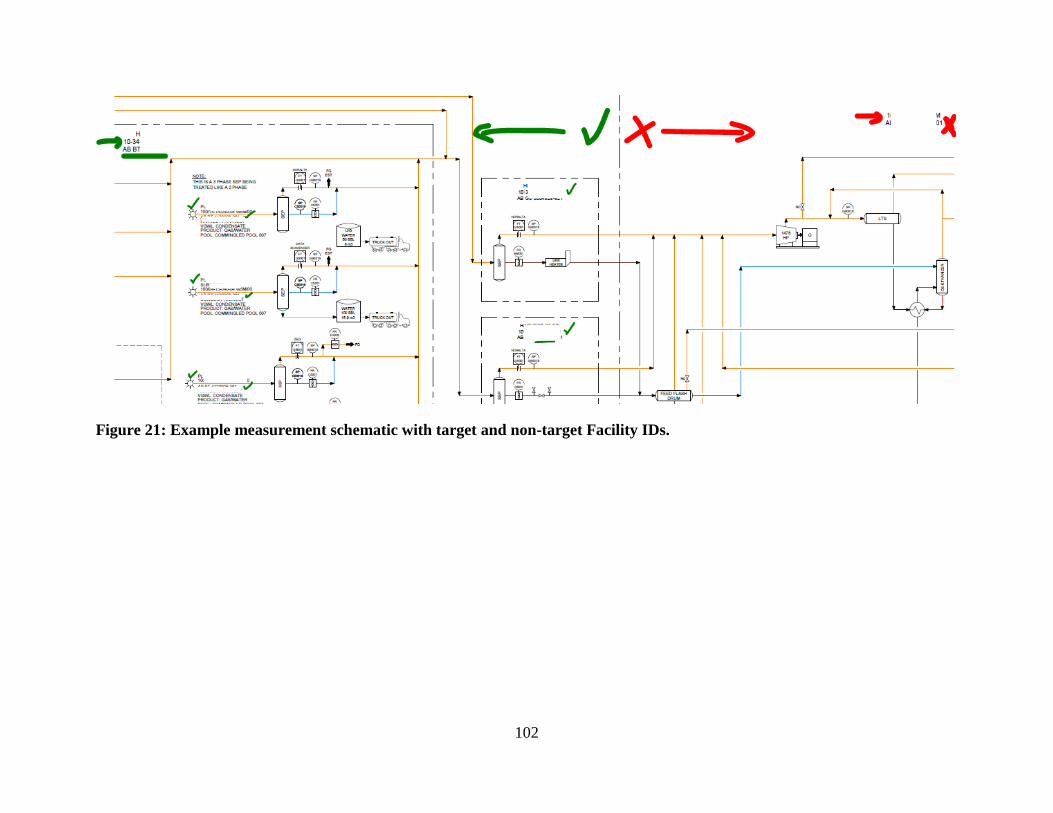
102
Figure 21: Example measurement schematic with target and non-target Facility IDs.
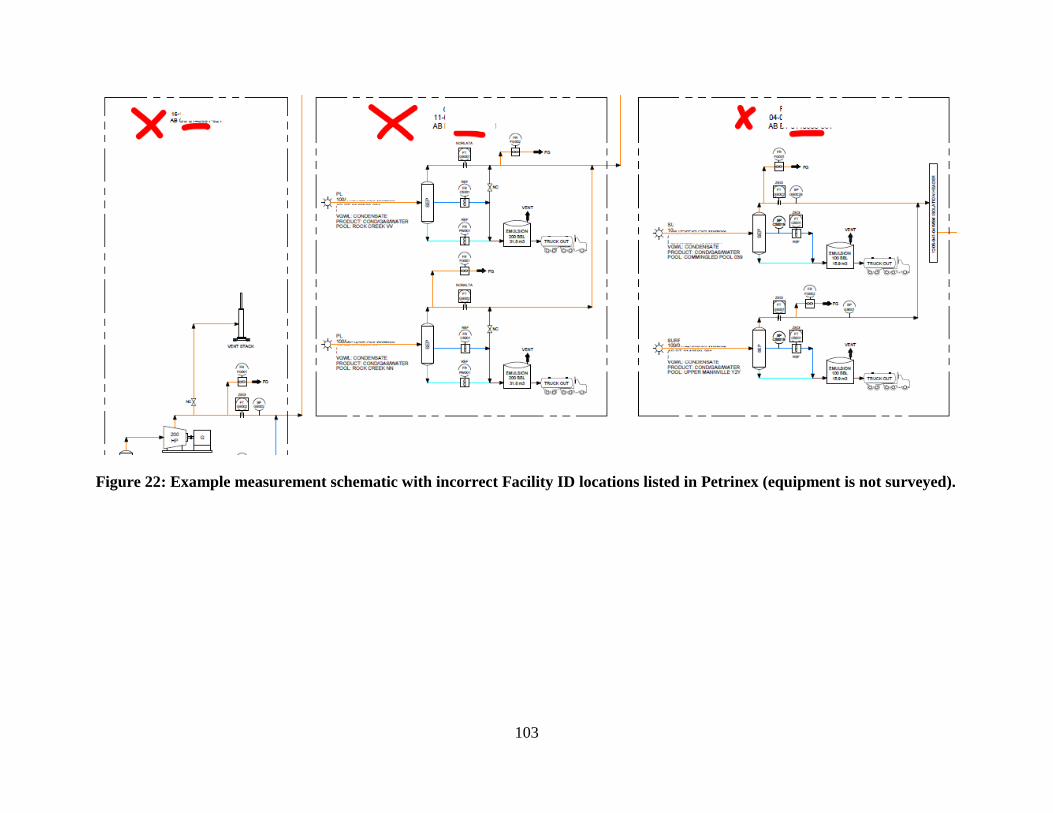
103
Figure 22: Example measurement schematic with incorrect Facility ID locations listed in Petrinex (equipment is not surveyed).

104
7.2.2 TARGET WELLS
o Rules for surveying wells:
All wells at a target location must be surveyed and assigned their
corresponding Petrinex Facility ID and UWI (pre-loaded in the tablet).
Equipment assigned to a UWI includes the wellhead and other equipment
immediately downstream and dedicated to the well (e.g., separator, storage
tank(s), pneumatics and pumpjack). Equipment common to multiple wells
(e.g., flare, compressor, tanks, dehydrator, treater, line heater, pneumatics
etc) is assigned to the Facility ID with UWI left empty (i.e., it’s assigned
to the battery code).
Check whether any wells flowing to the target location are off-site. This is
accomplished by:
Referencing the measurement schematic saved to your tablet
desktop.
Referencing tab “allappsites” in “Survey Schedule - 2017
Inventory and Leak Measurement Campaign.xlsx” saved to your
tablet desktop. All wells flowing to the target Facility ID are
identified by filtering column G on the subject Facility ID. Well
surface locations are presented in column A and UWI in column I.
Alternatively, reference “Target Wells.xlsx”. All wells flowing to
the target location are identified by filtering column A in tab “Well
pivot” of “Target Wells.xlsx” on the subject location.
Corresponding Facility ID are listed in column B with relevant
UWI in column C and well surface locations in column D (note
that sometimes downhole locations are stated in error).
At least 5 off-site wells (flowing into subject location) must be surveyed
with relevant Facility IDs and UWIs selected in the tablet. Additional off-
site wells (up to 10 total) should be surveyed if variability in equipment or
pneumatic counts is observed (i.e., there is little value surveying more than
5 wells if they are all the same).
Minimize driving time when selecting wells to survey by choosing wells
within the same section (i.e., 1 mile x 1 mile). Filter column C in tab
“allappsites”.

105
Figure 23: Example of wells (UWI) that report (flow) to Petrinex Facility ID.
7.3 DATA COLLECTION PROCEDURES (USING THE TABLET)
For each site surveyed:
1. Select relevant surface location, Facility ID and possibly UWI.
2. Take a photo of the site entrance placard displaying the operator name and location.
7.3.1 PROCESS EQUIPMENT AND COMPONENT COUNTING
1. Take photo of equipment unit
2. Enter site tag number for equipment into [Process equipmentNotes]. For example,
separators usually identified by Vxxx, compressors identified by Kxxx, tanks identified
by Txxx, etc.
3. Begin component count at the first flange where process fluid enters the unit.
4. End component count at the next process equipment unit. For example, at a well site in
Figure 21:
a. Start at the wellhead (add first equipment unit) and count components on the
wellhead and along the production pipe until the separator inlet flange. Save
count.
b. Add “separator” and count components on the separator and along production
piping until the pipe leaves the site or goes underground. Save count.
5. Only count components in pressurized hydrocarbon service (i.e., those components with
the potential to leak hydrocarbon vapours). Components that don’t contain volatile

106
hydrocarbons (e.g., instrument air, water, lubricating oil, process chemicals, diesel,
glycol, etc) are much less likely to emit hydrocarbons to the atmosphere and therefore
excluded from the inventory.
6. Only count components equal or greater than 0.5 inches in diameter. For example,
instrumentation tubing less than 0.5 inches is not counted because they have a low leak
potential (i.e., leak rates are typically very small).
7. When defining equipment units, ensure the “Emission Control” field is populated if off
gassing is captured and controlled. Common examples include:
a. Storage tanks that are ‘blanketed’ with natural gas and connected to a flare (“Gas
Flared”) or vapour recovery unit (“Gas Conserved”).
b. Compressor rod-packing vents tied into the flare header (“Gas Flared”) or
captured by a Remvue slipstream and used as fuel (“Gas Conserved”).
c. Dehydrator still column tied the flare header (“Gas Flared”).
8. When counting in teams, ensure each process equipment unit is entered into one tablet
(i.e., can’t have partial counts on two tablets).
9. Document these records in the tablet form “Major Equipment.”
7.3.2 PNEUMATIC DEVICE COUNTING
Pneumatic devices are counted separately from process equipment because the manufacturer and
model are required for each device.
1. Each pneumatic device observed is counted and the following fields populated from
dropdown lists:
a. Driver type (natural gas, air, electric/solar or other)
b. Manufacturer
c. Model
d. Device type
2. Document these records in the tablet form “Pneumatics.”
3. No measurement of venting rates will be completed at this time.
4. I2P-100 pneumatics with serial number greater than F000386281 are 2nd generation low
bleed devices.
7.3.3 FUGITIVE AND VENT SCREENING AND MEASUREMENT
1. Conduct a leak detection survey (OGI) of equipment components in pressurized
hydrocarbon service. Leak detection (or screening) is performed using a Flir GFx320 or
GF320 leak-imaging infrared (IR) camera. Supplemental portable hydrocarbon gas
detectors (i.e. Bascom-Turner Gas Sentry CGI-211) are available in the event an IR
camera is not available (e.g., insufficient batteries, extra team member available for
screening, etc).
2. Tag each detected leak with a unique ID. Leaking component tags, when used, are hung
directly on the leaking component, or, if this was not practical, in close proximity, with

107
appropriate location information included, so the actual leaking component could be
easily located for repair. The tags are uniquely numbered, weather resistant, and securely
hung using either plastic zip ties.
3. Record a video of noteworthy leaks with the IR camera and document the media #.
4. Measure safely accessible leaks with the following equipment (described in Section
8.5.2):
a. The Hi-Flow Sampler
b. Calibrated Bag
c. VPAC (ultrasonic measurement on the upstream dump valve).
d. Calscan Positive Displacement Vent Meter
5. Leaks that are not safely accessible should be recorded with the IR camera and the leak
rate estimated based on the intensity and size of the plume visualized using the IR
camera. IR camera video files will be included with the final report.
6. Document these leak records and atmospheric temperature and pressure in the tablet form
“Vents/Leaks.”
7. For tanks with gas loss from thief hatch but tied into VRU or flare (i.e., unintentional gas
loss or leak), enter upstream pressure (kPa) and temperature (C) into comment field.
8. Vents (i.e., intentional gas release from pneumatics, dehydrators, atmospheric storage
tanks, unlit flares, etc) are not measured during this campaign. Instead, noteworthy vents
(possible super emitters) are recorded with the IR Camera and file name recorded in the
tablet.
9. Special cases:
a. Well surface casing vent flows (SCVF) should be measured with the high-flow,
with emission type = Leak, process equipment= “wellhead” and component =
“SCVF”. When measuring, be sure you are only capturing the passive release of
gas by placing the high-flow nozzle close to the vent but not fully enclosing the
vent line (i.e., don’t drawdown gas from the well casing).
b. Gas Sample and Analysis System should be measured with the high-flow, with
emission type = Vent.

108
7.4 TRAINING AND QAQC
7.4.1 CLASS TRAINING
Completed August 3, 2017 and included the following topics.
1. Introduction (15 minutes)
2. Project overview and objectives– (45 minutes)
a. Target facility subtypes and methane emission sources.
b. Inventory boundaries and alignment with Petrinex Facility IDs (i.e., site selection
rules).
c. Field data collection elements.
3. Demonstration of data collection application – (45 minutes)
a. Each field team member will be provided a tablet to follow procedures for:
i. Entering site location and Petrinex Facility ID.
ii. Entering leak measurement results.
iii. Entering equipment and component counts.
iv. Uploading data after every day.
4. Break (15 minutes)
5. Field safety overview – (45 minutes)
a. Field coordinator and lines of communication.
b. Safe work procedures.
c. Job Hazard Assessment (JHA).
d. Incident and near-miss reporting and investigation.
6. Component counting – (75 minutes)
a. Basic component categories and counting rules.
b. Potential issues.
7.4.2 FIELD TRAINING
Completed August 14 and 15, 2017 and includes:
1. Each team member complete component count of the same equipment unit. Counts
compared until team agreed results were consistent with rules stated above.
2. Each team member completes a leak measurement of the same component. Results
compared until team agreed results are the same.
7.4.3 DATA COLLECTION ERROR MANAGEMENT

109
Despite the training, definition standardization and tablet dropdown pick lists; data collection
errors are anticipated. To identify and mitigate errors, records are reviewed daily by the field
team coordinator. When observed:
1. Errors are corrected upon observation in the subject csv file with cells containing
proposed changed highlighted yellow.
2. Modified data rows are saved to corresponding xlsx versions of MajorEquipment,
Pneumatics and Vents. Column A of the xlsx is populated with the subject zip file epoch
# and Column B is populated with the subject csv file epoch #. Columns C and greater
contain records from their source file.
3. The ‘error spreadsheet’ is emailed to Clearstone on Friday of every week for review and
confirmation that the proposed change is reasonable.
4. Systematic errors are communicated to field teams to prevent further occurrence.
5. Clearstone changes problematic records in its database.
7.4.4 DATA COMPLETENESS
It’s possible that records collected by field inspectors and saved to tablets are not uploaded to the
Clearstone database (e.g., dropbox upload failure). To check whether ‘data leakage’ has
occurred, backup files saved on each tablet are parsed and imported to a back Clearstone
database. Missing records are identified by comparing primary and backup database records.
This check was completed on September 19 (for data collected from August 14 to September 10)
and no missing data was observed (as evidenced in P:\Alberta Energy Regulator\2017 - Phase 3
(Field Campaign)\QAQC\Review Major Equipment Aug 14 to Sept 10.xlsx).
The check was completed after all field data collection was finished and no missing data was
observed (as evidenced in P:\Alberta Energy Regulator\2017 - Phase 3 (Field
Campaign)\QAQC\Missing Data\).
7.5 INSPECTOR SAFETY AND CONDUCT
Safety is of paramount concern to the AER. Field Operations staff will conduct their work in
accordance with the following field safety procedures.
1. Each field team member must review and sign (last page) the attached file “AER Field
Work.pdf” (14 pages). This “standing hazard identification and assessment” prioritizes
typical field work activities according to risk; identifies hazards; and the engineering,
administrative and PPE controls we are responsible to implement before work can
proceed. Keep a copy with you for reference during the campaign. If you have any
questions, please bring them forward August 14 during our first field safety meeting.

110
2. When site conditions change (e.g., arrival at a sour site) or if there is any doubt regarding
potential job hazards, your team must complete and sign the pre-job field level hazard
assessment “AER Hazard Identification and Assessment.pdf”. We will complete this
assessment August 14 at the first field location before starting any work. Signed copies
must be emailed to [email protected] (preferably at the end of each week).
3. Our team will follow Greenpath safe work practices and procedures attached. In
particular, please read the safe work procedure: “4.5 Inspecting a Facility with the IR
camera.docx” before August 14. This is directly applicable to the work you will be doing
(i.e., IR camera inspection, leak measurement and component counting).
4. All incidents (injury, property loss/damage, security) and near misses (event that has the
potential to cause serious injury or damage) must be reported to your immediate
supervisor (following supervision and reporting structure below) and documented using
the appropriate form attached.
5. Contact details for all team members are provided in the following table.
The documents attached will be saved to each field tablet (Desktop “Safety” folder) and should
be referenced throughout the campaign.

111
8 APPENDIX – STANDARDIZED DEFINITIONS
This glossary provides definitions relevant to the classification of venting and fugitive emissions
sources.
8.1 EMISSION TYPES
Emission types are defined as follows:
8.1.1 LEAK
It is important that an objective leak definition be established for application in a leak
management program and that this definition meet or exceed common industry or regulatory
standards. A leak is the unintentional loss of process fluid past a seal, mechanical connection or
minor flaw at a rate that is in excess of normal tolerances allowed by the manufacturer or
applicable health, safety and environmental standards. An equipment component in hydrocarbon
service is commonly deemed to be leaking when the emitted gas can be visualized with an
infrared (IR) leak imaging camera37, detected by an organic vapour analyzer in accordance with
U.S. EPA Method 21 (i.e., hydrocarbon concentration screening value of 10,000 ppmv or more),
or detected by any other techniques with similar or better detection capabilities.
8.1.2 VENT
An intentional release of hydrocarbon gas directly to the atmosphere. Venting does not include
partial products of combustion that might occur during flaring or other combustion activities.
To be consistent with regulatory definitions (e.g., US EPA and Western Climate Initiative
jurisdictions), the following emission sources are defined as vents unless they are connected to a
vapour recovery or control system and gas is observed to be leaking from corresponding
equipment.
Depressurization of process equipment (e.g., blowdowns).
Engine and turbine starters.
Glycol dehydrator off-gas.
Loading hydrocarbon liquids (into truck or rail tankers).
Pneumatic instruments and pumps.
Storage tanks open to the atmosphere (e.g., working, breathing and flashing losses).
Well liquid unloading.
37 The IR camera is not always as sensitive as screening using organic vapour analyzers, but has been demonstrated
to be sufficiently sensitive to detect the big leaks that are contributing most of the emissions.

112
Well servicing, completion and testing flows.
Well surface casing vent flows.
Unlit flare stacks.
8.2 SERVICE TYPES
Service types relevant to the classification of fugitive emission leaks are defined as follows and
refer to the hydrocarbon in contact with the leaking component. A component is considered to be
in hydrocarbon service when the process fluid being handled contains greater than 10 percent
hydrocarbons on a mass basis.
8.2.1 HEAVY LIQUID
Process fluid that is a hydrocarbon liquid at the operating conditions and has a vapour pressure of
less than 0.3 kPa at 15ºC. Heavy crude oil and crude bitumen fall into this category.
8.2.2 LIGHT LIQUID
Process fluid that is a hydrocarbon liquid at the operating conditions and has a vapour pressure of
0.3 kPa or greater at 15ºC. Light/medium crude oil, condensate and NGLs fall into this category.
8.2.3 PROCESS GAS
Process fluid that is a hydrocarbon gas at the subject operating condition.
8.3 COMPONENT TYPES
Component types relevant to the classification of fugitive emission leaks are defined as follows:
8.3.1 RECIPROCATING COMPRESSOR ROD-PACKINGS
Packing systems (seals) are used on reciprocating compressors to control leakage around the
piston rod on each cylinder. A reciprocating compressor is deemed to have one seal associated
with each compressor cylinder regardless of whether it is really a single or tandem seal.
Controlled rod-packing vent lines that are tired into a flare header, VRU or other gas capture
system have a very low probability of leaking to the atmosphere and therefore excluded from the
component populations used to calculate population-average leak factors.
8.3.2 CENTRIFUGAL COMPRESSOR SEALS
Centrifugal compressors generally require shaft-end seals between the compressor and bearing
housings. Either face-contact oil-lubricated mechanical seals or oil-ring shaft seals, or dry-gas
shaft seals are used. A centrifugal compressor has two seals, one on each side of the housing
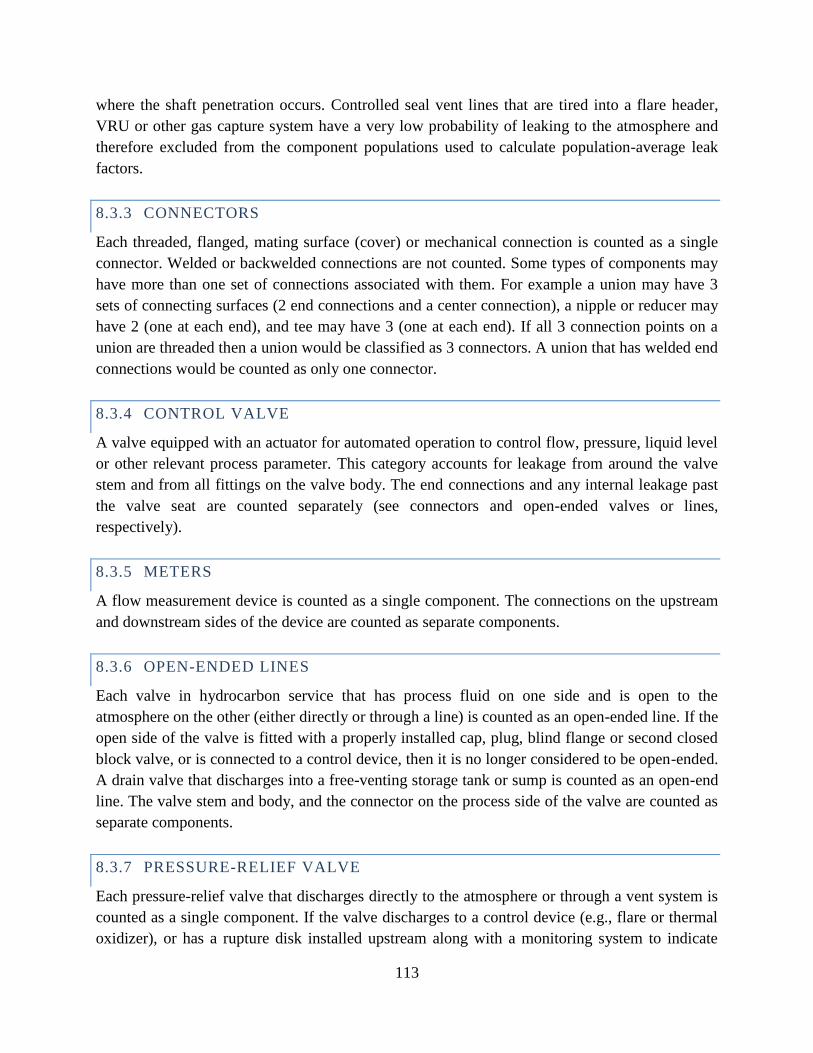
113
where the shaft penetration occurs. Controlled seal vent lines that are tired into a flare header,
VRU or other gas capture system have a very low probability of leaking to the atmosphere and
therefore excluded from the component populations used to calculate population-average leak
factors.
8.3.3 CONNECTORS
Each threaded, flanged, mating surface (cover) or mechanical connection is counted as a single
connector. Welded or backwelded connections are not counted. Some types of components may
have more than one set of connections associated with them. For example a union may have 3
sets of connecting surfaces (2 end connections and a center connection), a nipple or reducer may
have 2 (one at each end), and tee may have 3 (one at each end). If all 3 connection points on a
union are threaded then a union would be classified as 3 connectors. A union that has welded end
connections would be counted as only one connector.
8.3.4 CONTROL VALVE
A valve equipped with an actuator for automated operation to control flow, pressure, liquid level
or other relevant process parameter. This category accounts for leakage from around the valve
stem and from all fittings on the valve body. The end connections and any internal leakage past
the valve seat are counted separately (see connectors and open-ended valves or lines,
respectively).
8.3.5 METERS
A flow measurement device is counted as a single component. The connections on the upstream
and downstream sides of the device are counted as separate components.
8.3.6 OPEN-ENDED LINES
Each valve in hydrocarbon service that has process fluid on one side and is open to the
atmosphere on the other (either directly or through a line) is counted as an open-ended line. If the
open side of the valve is fitted with a properly installed cap, plug, blind flange or second closed
block valve, or is connected to a control device, then it is no longer considered to be open-ended.
A drain valve that discharges into a free-venting storage tank or sump is counted as an open-end
line. The valve stem and body, and the connector on the process side of the valve are counted as
separate components.
8.3.7 PRESSURE-RELIEF VALVE
Each pressure-relief valve that discharges directly to the atmosphere or through a vent system is
counted as a single component. If the valve discharges to a control device (e.g., flare or thermal
oxidizer), or has a rupture disk installed upstream along with a monitoring system to indicate

114
when the rupture disk has failed, then the valve is not counted. The connection on the upstream
side of the valve is counted as a separate component. The connection on the downstream is not
counted unless there is gas pressure on that side.
8.3.8 PUMP SEALS
Each pump in hydrocarbon service may leak from around the pump shaft and is typically
controlled a packing material, with or without a sealant. It may be used on both the rotating and
reciprocating pumps (and includes pneumatic injection pumps). Specially designed packing
materials are available for different types of service. The selected material is placed in a stuffing
box and the packing gland is tightened to compress the packing around the shaft.
8.3.9 REGULATORS
Most regulators are equipped with a vent where gas is released in the event the diaphragm inside
becomes damaged. Often, this venting either goes unnoticed or is assumed to be normal
operation of the regulator. All regulators should be checked for such leakage. Leakage from
around the connections to the regulator should be classified as connectors
8.3.10 THIEF HATCH
Storage tanks connected to a VRU or flare do not emit gas unless the internal tank pressure
exceeds the PRV or thief hatch set pressures (and intermittent venting occurs). When the tank
pressure drops, the PRVs return to a closed position and typically don’t leak. However, once
opened, thief hatches remain partially open until an operator closes the hatch. Gas loss from
partially open thief hatches is unintentional and therefore classified as a leak.
Gas losses from storage tanks open to the atmosphere (i.e., not connected to a VRU or flare) are
classified as a process vent (not a leak).
8.3.11 VALVES
A valve that is not a control valve. This category accounts for leakage from around the valve
stem and from all fittings on the valve body. The end connections and any internal leakage past
the valve seat are counted separately (see connectors and open-ended valves or lines,
respectively).
8.3.12 WELL SURFACE CASING VENT FLOW (SCVF)
A wellhead vent port that permits the flow of gas and/or liquid out of the surface casing/casing
annulus (often referred to as internal migration). This condition exists when gas enters the
exterior production casing annulus from a source formation below the surface casing shoe or
through a compromised section of casing wall (i.e. a casing failure).

115
It is important to recognize the following difference between venting from surface casing and
venting from production casing.
Production casing venting is purposely initiated by the operator, and undertaken to
stimulate oil well production. This is an intentional activity and therefore not classified as
a leak.
Surface casing vent flows (SCVF’s) are an undesirable result of wellbore leakage, and
most commonly attributed to poor well cementing practices. These leaks are classified as
a fugitive emission source.
8.4 PROCESS EQUIPMENT TYPES
Process equipment types relevant to the UOG are described in Table 20.
Table 20: Process equipment descriptions.
Process
Equipment
Description
Air Cooled
Heat
Exchangers
Air cooled heat exchangers, or air coolers, use fans to move air across tube
bundles to cool down the circulating fluid inside the tubes. Air coolers are
categorized as either forced draft or induced draft depending on the location of
the fan.
Forced draft air coolers have fans below the tube bundles, pushing the air up
across the tubes. Flow in forced draft air coolers is more turbulent than in
induced draft coolers, resulting in a greater heat transfer with lower costs. The
low escape velocity of the heated air results in poor distribution of the
recirculated air.
Induced draft air coolers have fans above the tube bundles, pulling air up across
the tubes. Induced draft coolers use less power, have more even air distribution,
and higher escape velocities, which lead to less recirculation of the heated air.
However, they cost more and are noisier than forced draft air coolers.
Catalytic
Heater
A catalytic heater is a flameless heat source that uses chemical reactions to
break down molecules and produce heat. In the presence of a catalyst which is
within the heater, counter current combustion or catalytic combustion occurs
when natural gas (or liquid propane gas) in the presence of oxygen creates
carbon dioxide, water and heat. In this situation the ignition temperature of
natural gas occurs at substantially lower temperatures, therefore no flame is
involved in the combustion process and far infrared wave emitters are created,
producing radiant heat. Once the oxidation begins, the reaction and heating
continues until either the oxygen or fuel source is eliminated.
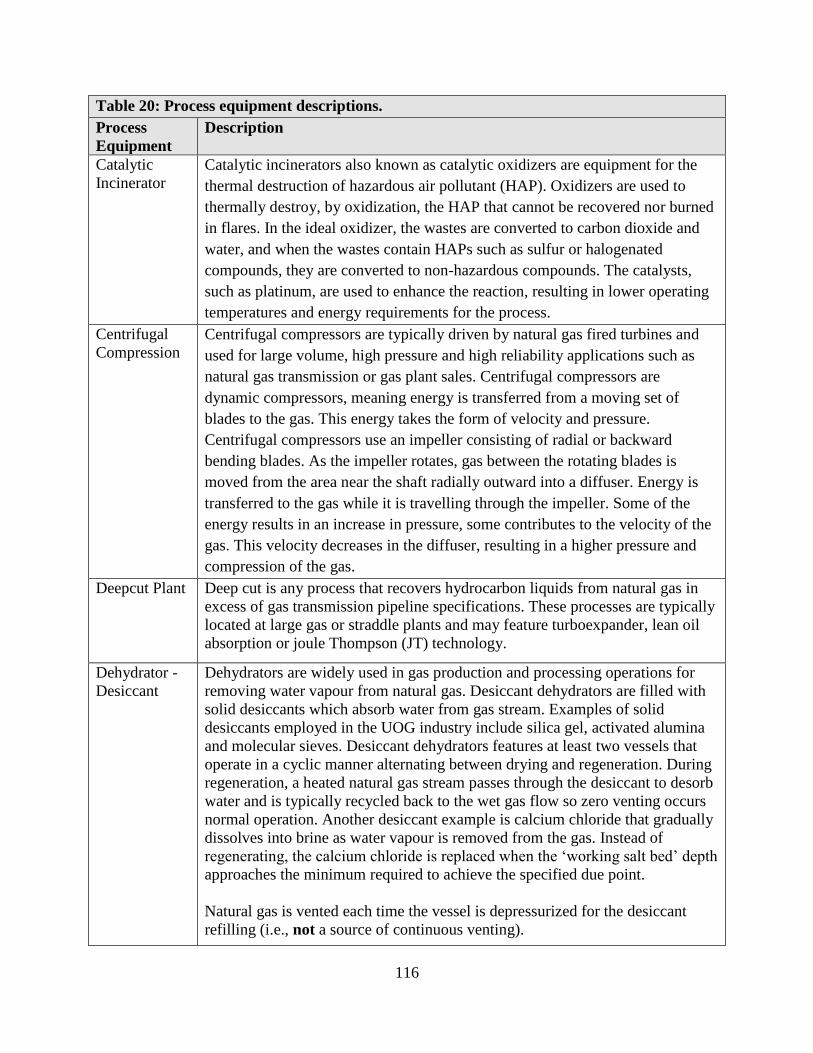
116
Table 20: Process equipment descriptions.
Process
Equipment
Description
Catalytic
Incinerator
Catalytic incinerators also known as catalytic oxidizers are equipment for the
thermal destruction of hazardous air pollutant (HAP). Oxidizers are used to
thermally destroy, by oxidization, the HAP that cannot be recovered nor burned
in flares. In the ideal oxidizer, the wastes are converted to carbon dioxide and
water, and when the wastes contain HAPs such as sulfur or halogenated
compounds, they are converted to non-hazardous compounds. The catalysts,
such as platinum, are used to enhance the reaction, resulting in lower operating
temperatures and energy requirements for the process.
Centrifugal
Compression
Centrifugal compressors are typically driven by natural gas fired turbines and
used for large volume, high pressure and high reliability applications such as
natural gas transmission or gas plant sales. Centrifugal compressors are
dynamic compressors, meaning energy is transferred from a moving set of
blades to the gas. This energy takes the form of velocity and pressure.
Centrifugal compressors use an impeller consisting of radial or backward
bending blades. As the impeller rotates, gas between the rotating blades is
moved from the area near the shaft radially outward into a diffuser. Energy is
transferred to the gas while it is travelling through the impeller. Some of the
energy results in an increase in pressure, some contributes to the velocity of the
gas. This velocity decreases in the diffuser, resulting in a higher pressure and
compression of the gas.
Deepcut Plant Deep cut is any process that recovers hydrocarbon liquids from natural gas in
excess of gas transmission pipeline specifications. These processes are typically
located at large gas or straddle plants and may feature turboexpander, lean oil
absorption or joule Thompson (JT) technology.
Dehydrator -
Desiccant
Dehydrators are widely used in gas production and processing operations for
removing water vapour from natural gas. Desiccant dehydrators are filled with
solid desiccants which absorb water from gas stream. Examples of solid
desiccants employed in the UOG industry include silica gel, activated alumina
and molecular sieves. Desiccant dehydrators features at least two vessels that
operate in a cyclic manner alternating between drying and regeneration. During
regeneration, a heated natural gas stream passes through the desiccant to desorb
water and is typically recycled back to the wet gas flow so zero venting occurs
normal operation. Another desiccant example is calcium chloride that gradually
dissolves into brine as water vapour is removed from the gas. Instead of
regenerating, the calcium chloride is replaced when the ‘working salt bed’ depth
approaches the minimum required to achieve the specified due point.
Natural gas is vented each time the vessel is depressurized for the desiccant
refilling (i.e., not a source of continuous venting).
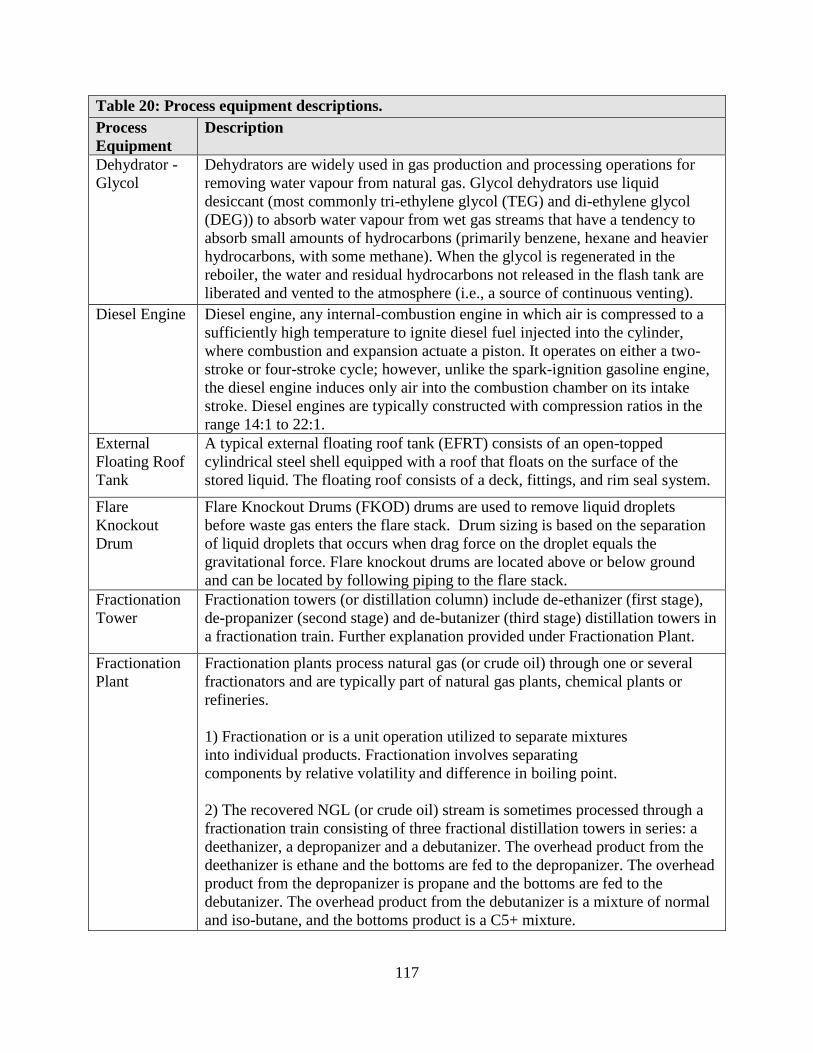
117
Table 20: Process equipment descriptions.
Process
Equipment
Description
Dehydrator -
Glycol
Dehydrators are widely used in gas production and processing operations for
removing water vapour from natural gas. Glycol dehydrators use liquid
desiccant (most commonly tri-ethylene glycol (TEG) and di-ethylene glycol
(DEG)) to absorb water vapour from wet gas streams that have a tendency to
absorb small amounts of hydrocarbons (primarily benzene, hexane and heavier
hydrocarbons, with some methane). When the glycol is regenerated in the
reboiler, the water and residual hydrocarbons not released in the flash tank are
liberated and vented to the atmosphere (i.e., a source of continuous venting).
Diesel Engine Diesel engine, any internal-combustion engine in which air is compressed to a
sufficiently high temperature to ignite diesel fuel injected into the cylinder,
where combustion and expansion actuate a piston. It operates on either a two-
stroke or four-stroke cycle; however, unlike the spark-ignition gasoline engine,
the diesel engine induces only air into the combustion chamber on its intake
stroke. Diesel engines are typically constructed with compression ratios in the
range 14:1 to 22:1.
External
Floating Roof
Tank
A typical external floating roof tank (EFRT) consists of an open-topped
cylindrical steel shell equipped with a roof that floats on the surface of the
stored liquid. The floating roof consists of a deck, fittings, and rim seal system.
Flare
Knockout
Drum
Flare Knockout Drums (FKOD) drums are used to remove liquid droplets
before waste gas enters the flare stack. Drum sizing is based on the separation
of liquid droplets that occurs when drag force on the droplet equals the
gravitational force. Flare knockout drums are located above or below ground
and can be located by following piping to the flare stack.
Fractionation
Tower
Fractionation towers (or distillation column) include de-ethanizer (first stage),
de-propanizer (second stage) and de-butanizer (third stage) distillation towers in
a fractionation train. Further explanation provided under Fractionation Plant.
Fractionation
Plant
Fractionation plants process natural gas (or crude oil) through one or several
fractionators and are typically part of natural gas plants, chemical plants or
refineries.
1) Fractionation or is a unit operation utilized to separate mixtures
into individual products. Fractionation involves separating
components by relative volatility and difference in boiling point.
2) The recovered NGL (or crude oil) stream is sometimes processed through a
fractionation train consisting of three fractional distillation towers in series: a
deethanizer, a depropanizer and a debutanizer. The overhead product from the
deethanizer is ethane and the bottoms are fed to the depropanizer. The overhead
product from the depropanizer is propane and the bottoms are fed to the
debutanizer. The overhead product from the debutanizer is a mixture of normal
and iso-butane, and the bottoms product is a C5+ mixture.

118
Table 20: Process equipment descriptions.
Process
Equipment
Description
Gas Sample
and Analysis
System
This system consists of piping and regulator to collect a slipstream of process
gas for analysis by a gas chromatograph. It normally draws a continuous stream
of natural gas sample with a small fraction used for analysis and then vents both
the unused and spent portions to the atmosphere.
Gas Boot Gas boots (also known as vapor recovery towers) are typically located at oil
production sites and separate hydrocarbon vapor from liquid or emulsion
streams. These vessels operate at low pressure (typically 3 to 5 psig) to allow
final flashing of vapors after separation and prior to storage. Captured gas can
be used for onsite fuel demands, incinerated/flared or directed sales line.
Gas Meter
Building
Building dedicated to gas metering for downstream sales. This includes one or
more meter runs with corresponding isolation valves; temperature and pressure
sensors and, in some cases, pressure regulation.
Gas Pipeline
Header
A header pipe having several openings through which it collects or distributes
hydrocarbon gas from/to other pipes (i.e., a tie-in header).
Gas
Sweetening:
Amine
The removal of H2S from sour gas is called sweetening. Sweetening units are
typically installed at sour gas plants or at smaller sites to remove H2S from fuel
gas. The process for sweetening sour gas with regenerative solvent typically
features two towers (i.e. Absorber and Regenerator). The sour gas flows into the
lower part of the absorber or contactor. This vessel usually contains 20 to 24
trays, but for small units, it could be a column containing packing. Lean
solution containing the sweetening solvent in water is pumped into the absorber
near the top. As the solution flows down from tray to tray, it is in intimate
contact with the sour gas as the gas flows upward through the liquid on each
tray. When the gas reaches the top of the vessel, virtually all the H2S and,
depending on the solvent used, all the CO2 have been removed from the gas
stream. Then, the rich solution form the bottom of vessel flows to the
regenerator and recirculated back to the absorber.
Most of the chemical sweetening regenerative solvents are alkanol amines,
which are compounds formed by replacing one, two, or three hydrogen atoms of
the ammonia molecule with radicals of other compounds to form primary,
secondary, or tertiary amines respectively. Amines are weak organic bases that
are used to remove CO2 and H2S from natural gas as well as from synthesis gas.
These compounds combine chemically with the acid gases in the contactor to
form unstable salts. The salts break down under the elevated temperature and
low pressure in the still. The common amine solvents are Monoethanolamide
(MEA), Diglycolamine (DGA), Diethanolamine (DEA), and Triethanolamine
(TEA).

119
Table 20: Process equipment descriptions.
Process
Equipment
Description
Gas
Sweetening:
Iron Sponge
The removal of H2S from sour gas is called sweetening. Iron sponge
sweetening features wood chips that are impregnated with a hydrated form of
iron oxide. The material is placed in a pressure vessel through which the sour
gas is flowed. Because this is a batch process, usually two vessels are
installed—one in service and the other on standby. The H2S reacts with the iron
oxide to form iron sulfide. While it is possible to regenerate the iron sulfide
with air to restore the iron oxide, in practice this is not done. Instead, the tower
containing the spent iron sponge is taken out of service, and the standby tower
is placed in service. The spent iron sponge is moistened with water, removed,
and disposed of at an approved disposal site, and the tower is filled with a new
charge of iron sponge.
Gas
Sweetening:
Sulfinol
The removal of H2S from sour gas is called sweetening. The Sulfinol process is
a hybrid process using a combination of a physical solvent, sulfolane, and a
chemical solvent, Diisopropanolamine (DIPA) or Methyl diethanolamine
MDEA. The physical solvent and one of the chemical solvents each make up
about 35 to 45% of the solution with the balance being water. The sulfinol
process is economically attractive for treating gases with a high partial pressure
of the acid gases
Gas
Sweetening:
Sulfreen
The removal of H2S from sour gas is called sweetening. The Sulfreen process is
a dry-bed, sub-dew point absorption process based on the extension of the Claus
reaction, i.e. catalytic oxidation of H2S to S. Basically consists of two
(occasionally three for large capacities) Sulfreen reactors in series with the
Claus reactors. Activated Alumina is used as a catalyst. Regeneration is needed
since the sulphur accumulates on the catalyst decreasing its activity.
Incinerator Incinerators (also known as thermal oxidizers) are equipment for the thermal
destruction of hazardous air pollutants (HAP). They consist of a chamber
through which waste gas flows with sufficient air and fuel to obtain high
combustion temperatures. Oxidizers are used to thermally destroy, by
oxidization, the HAP that cannot be recovered nor burned in flares.
Internal
Floating Roof
Tank
An internal floating roof tank (IFRT) has both a permanent fixed roof and a
floating roof inside. There are two basic types of internal floating roof tanks:
tanks in which the fixed roof is supported by vertical columns within the tank,
and tanks with a self-supporting fixed roof and no internal support columns.
Joule
Thomson
Refrigeration
Plant
Joule Thomson unit is used to lower the gas temperature by using the Joule
Thomson effect (expansion cooling). Gas cooling is performed by forcing gas
through a valve or porous plug while kept insulated so that no heat is exchanged
with the environment. JT unit usually contains a gas to gas heat exchanger, JT
valve (control or motor valve) and a two phase separator. In order to increase its
effectiveness cooled gas is used to lower the temperature of the gas intake. In
this manner very low temperatures can be achieved in high purity gases by
constantly recirculating them with the use of a compressor.
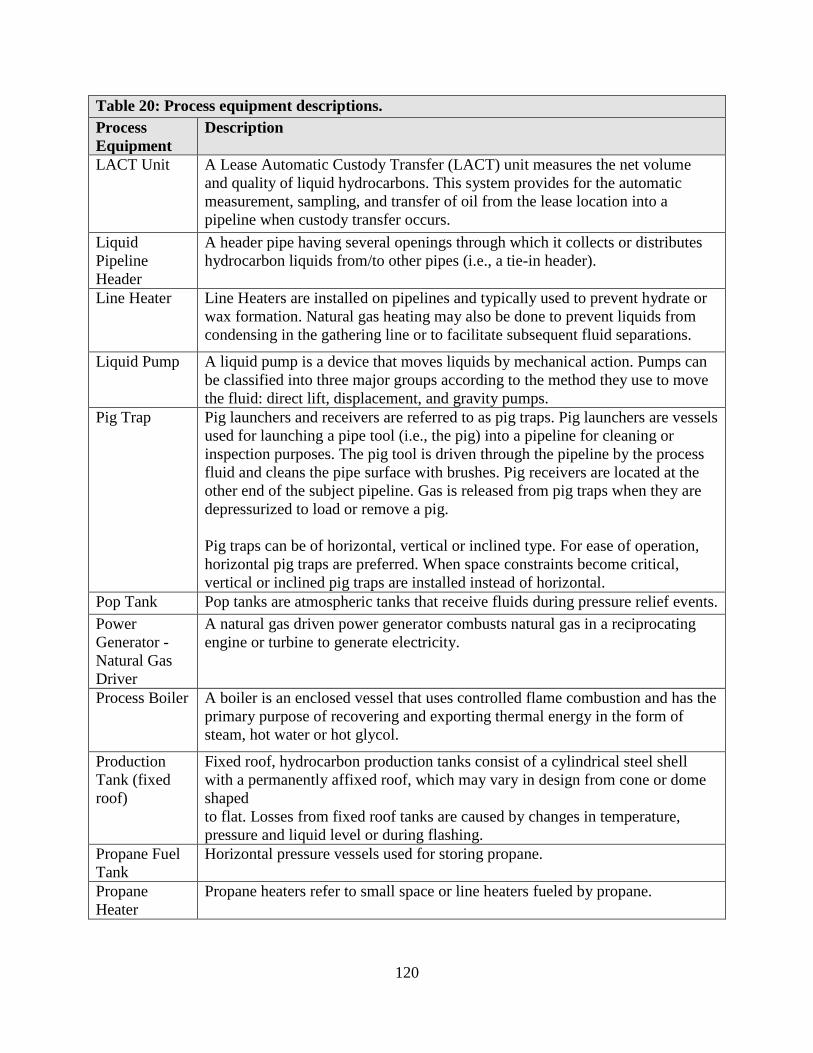
120
Table 20: Process equipment descriptions.
Process
Equipment
Description
LACT Unit A Lease Automatic Custody Transfer (LACT) unit measures the net volume
and quality of liquid hydrocarbons. This system provides for the automatic
measurement, sampling, and transfer of oil from the lease location into a
pipeline when custody transfer occurs.
Liquid
Pipeline
Header
A header pipe having several openings through which it collects or distributes
hydrocarbon liquids from/to other pipes (i.e., a tie-in header).
Line Heater Line Heaters are installed on pipelines and typically used to prevent hydrate or
wax formation. Natural gas heating may also be done to prevent liquids from
condensing in the gathering line or to facilitate subsequent fluid separations.
Liquid Pump A liquid pump is a device that moves liquids by mechanical action. Pumps can
be classified into three major groups according to the method they use to move
the fluid: direct lift, displacement, and gravity pumps.
Pig Trap Pig launchers and receivers are referred to as pig traps. Pig launchers are vessels
used for launching a pipe tool (i.e., the pig) into a pipeline for cleaning or
inspection purposes. The pig tool is driven through the pipeline by the process
fluid and cleans the pipe surface with brushes. Pig receivers are located at the
other end of the subject pipeline. Gas is released from pig traps when they are
depressurized to load or remove a pig.
Pig traps can be of horizontal, vertical or inclined type. For ease of operation,
horizontal pig traps are preferred. When space constraints become critical,
vertical or inclined pig traps are installed instead of horizontal.
Pop Tank Pop tanks are atmospheric tanks that receive fluids during pressure relief events.
Power
Generator -
Natural Gas
Driver
A natural gas driven power generator combusts natural gas in a reciprocating
engine or turbine to generate electricity.
Process Boiler A boiler is an enclosed vessel that uses controlled flame combustion and has the
primary purpose of recovering and exporting thermal energy in the form of
steam, hot water or hot glycol.
Production
Tank (fixed
roof)
Fixed roof, hydrocarbon production tanks consist of a cylindrical steel shell
with a permanently affixed roof, which may vary in design from cone or dome
shaped
to flat. Losses from fixed roof tanks are caused by changes in temperature,
pressure and liquid level or during flashing.
Propane Fuel
Tank
Horizontal pressure vessels used for storing propane.
Propane
Heater
Propane heaters refer to small space or line heaters fueled by propane.

121
Table 20: Process equipment descriptions.
Process
Equipment
Description
Propane
Refrigeration
Propane refrigeration plants consist of a refrigeration cycle to cool natural gas
and remove hydrocarbon liquids or provide dew point control. Ethylene glycol
is injected to achieve the required water dew point and prevent hydrates in the
gas stream. The water rich glycol is regenerated to an 80% EG/water mix and
re-injected.
Reciprocating
Compressor -
Natural Gas
Driver
Reciprocating compressors are positive displacement compressors that use
pistons driven by a crankshaft to deliver high pressure gas. The intake gas
enters the suction manifold, then flows into the compression cylinder where it
gets compressed by a piston driven in a reciprocating motion via a crankshaft,
and is then discharged. Compressors are typically skid mounted, driven by a
natural gas fired engine or electric motor, include an air cooled heat exchangers
and enclosed by a shed.
Reciprocating
Compressor -
Electric
Driver
Salt Bath
Heater
A salt bath heater utilizes molten salt as a transfer media in lieu of water or
thermal oil. The salt liquefies at ~390º allowing a process stream outlet
temperature of 300º to 650º to be achieved. Salt Bath Heaters are designed for
high temperatures at low operating pressures
Screw
Compressor -
Natural Gas
Driver
Screw compressors utilize a rotary positive displacement mechanism that
compresses gas between intermeshing helical lobes and chambers in the
compressor housing. As the mechanism rotates, the meshing and rotation of the
two helical rotors produces a series of volume-reducing cavities. Gas is drawn
in through an inlet port in the casing, captured in a cavity, compressed as the
cavity reduces in volume, and then discharged through another port in the
casing. They are usually used for boosting the gas from wells to reciprocating
compressors in the field or gas plants. Screw compressors are typically skid
mounted, driven by a natural gas fired engine or electric motor and enclosed by
a shed.
Screw
Compressor -
Electric
Driver
Scrubber Vessel containing a catalytic or adsorption substance designed to remove
problematic compounds (often H2S or other odourous compounds) from the gas
stream.
Separator A vessel used to separate a mixed-phase stream into gas and liquid phases that
are "relatively" free of each other. This includes 2-phase and 3-phase
separators.
Shell and
Tube Heat
Exchanger
Shell and tube heat exchangers are horizontal vessels that take the energy from
a hot stream (shell side) and transfer it to a cool stream (tube site), or vice versa.
Most of the heat exchangers used in industry are shell and tube, air cooled or
plate and frame.

122
Table 20: Process equipment descriptions.
Process
Equipment
Description
Stabilization
Tower
Stabilization Tower (or stabilizer) is a unit used to stabilize condensate in order
to reduce tank venting emissions and recover dissolved gas. It is usually a
vertical separator type of vessel with operating conditions at low (atmospheric
or lower) pressure and temperature in a region of 70-80 C°. High pressure feed
enters in the mid region and momentarily expands. Pressure reduction reduces
the boiling point of the feed which causes sudden evaporation (flashing).
Stabilizer is heated at bottom, thus creating a reflux which allows condensate
with less dissolved gas. Liquids are boiled off of gases and exit at bottom and
gases on top. In this manner flash losses are avoided of the top of the tanks.
Storage Bullet Storage bullets are horizontal pressure vessels used for storing hydrocarbon
liquids with high vapour pressures.
Sulphur
Recovery
Plant
Sulfur Recovery Units, also known as Claus Units, use a feedstock of acid gases
from sweetening units and sour-water strippers. The feedstock is sent into a
proprietary burner system, where it is burnt sub-stoichiometrically with air. The
resulting mixture of hydrogen sulfide and sulfur dioxide reacts to form
elemental sulfur (“Claus reaction”), which is then removed through
condensation. This initial combustion section is followed by two or three
catalytic sections to increase sulfur recovery rates to 94.5% – 97.5%.
Tank Heater A tank heater also known as immersion heater is installed in a tank to maintain
liquid temperature at a certain controlled set point.
Thermal
Electric
Generator
A thermoelectric generator (TEG) is a solid state device that converts heat flux
(temperature differences) directly into electrical energy through a phenomenon
called the Seebeck effect (a form of thermoelectric effect).
Treater A vessel used to break oil-water emulsions and achieve oil pipeline
specifications. A treater can use several mechanisms. These include heat,
gravity segregation, chemical additives and electric current to break emulsions.
There are vertical and horizontal treaters. The main difference between them is
the residence time, which is shorter in the vertical configuration compared with
the horizontal one. A treater can be called a heater treater or an emulsion treater.
Turbo
Expander
Turbo expansion plant is where a turboexpander is used. A turboexpander is a
centrifugal or axial flow turbine through which a high pressure gas is expanded
to produce work that is often used to drive a compressor or generator.
Turboexpanders are very widely used as sources of refrigeration in industrial
processes such as the extraction of ethane and natural gas liquids (NGLs) from
natural gas, the liquefaction of gases (such as oxygen, nitrogen, helium, argon
and krypton) and other low-temperature processes.
Unit Heater A unit heater is a natural gas or propane fired space heater (such as an office
furnace or hot water heater).
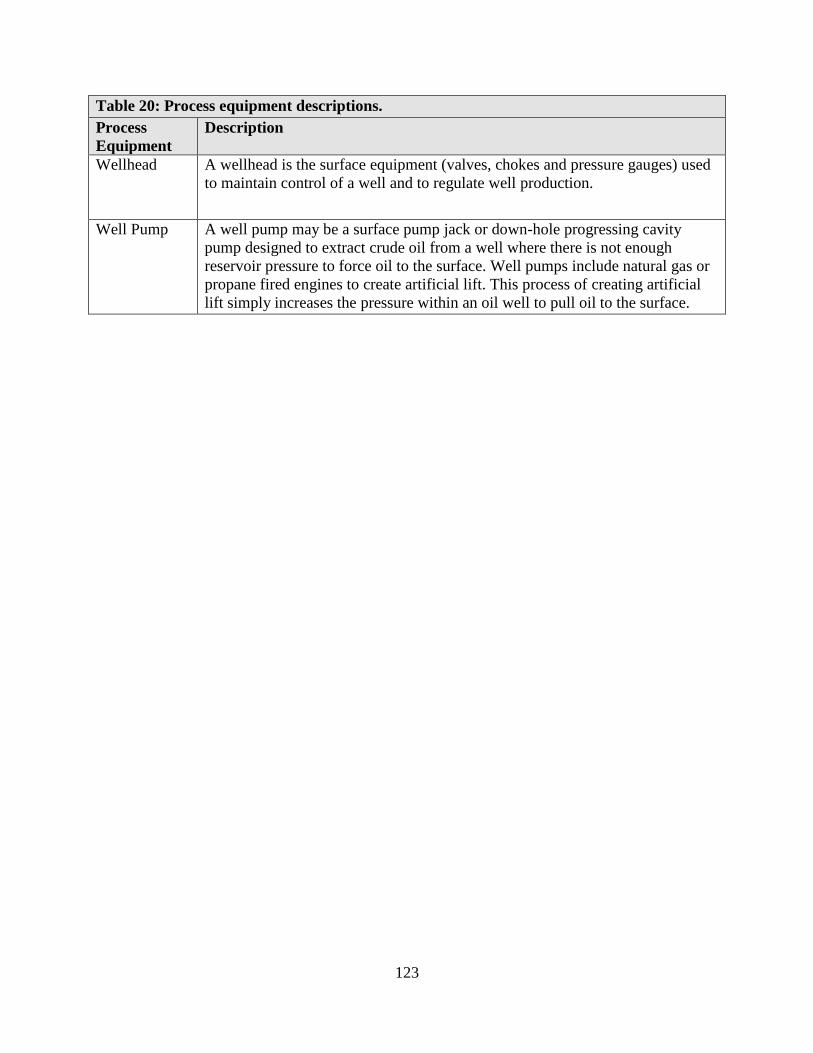
123
Table 20: Process equipment descriptions.
Process
Equipment
Description
Wellhead A wellhead is the surface equipment (valves, chokes and pressure gauges) used
to maintain control of a well and to regulate well production.
Well Pump A well pump may be a surface pump jack or down-hole progressing cavity
pump designed to extract crude oil from a well where there is not enough
reservoir pressure to force oil to the surface. Well pumps include natural gas or
propane fired engines to create artificial lift. This process of creating artificial
lift simply increases the pressure within an oil well to pull oil to the surface.

124
8.5 TECHNOLOGY TYPES
Technology types used in this study are described in the following subsection.
8.5.1 LEAK DETECTION
8.5.1.1 PORTABLE CATALYTIC/THERMAL CONDUCTIVITY LEAK DETECTOR
Portable catalytic gas sensors are capable of measuring the combustible gas content of a sample.
The core of the sensor (pellistor) comprises two platinum wires, one wire (termed the catalytic
bead) is coated with a catalytically-treated metal oxide and the other (termed reference bead) is
coated with a compound to inhibit catalytic oxidization. These beads are arranged in series on
the “unknown leg” of a Wheatstone bridge circuit, and are electrically heated. In the presence of
ambient air (i.e. no combustible gases), the sensor is zeroed by adjusting the electrical resistivity
of the “known leg” of the Wheatstone bridge so the circuit is balanced (i.e. zero voltage across
the bridge). This zeroing operation is automatically done by the instrument when it is turned on,
and takes approximately 30 seconds. Once the sensor has been zeroed and a sample of
combustible gas and air is supplied, the electrical heating promotes catalytic oxidization of the
sample’s combustible gases and oxygen in the air, on the surface of the catalytic bead. This
oxidation creates additional heat on the catalytic bead and increases the electrical resistivity of
the platinum wire within the bead. This change in electrical resistance can be measured as a
voltage difference across the bridge, and is nearly linearly proportional to the combustible gas
content of the sample for the 0 to 3% of methane (0 to 60% LEL) range, and slightly less linearly
proportional in 3-5% methane (60 to 100% LEL) range. Beyond 100% LEL, the reducing
oxygen content of the sample will result in a non-linear sensor response and the signal will fall-
off at compositions beyond stoichiometric.
A thermal conductivity sensor (as known as a Katharometer) is required to reliably measure
samples with the combustible gas content beyond 100% LEL. The thermal conductivity sensor
comprises a balanced Wheatstone bridge of electrically heated resistors. A reference gas
(ambient air) is flowed across resistors on opposite legs of the bridge. While a sample gas
(methane and ambient air mixture) is flowed across the other pair of resistors on opposite legs of
the bridge. The differences in thermal conductivity of the reference and sample flows will affect
the cooling rates of the heated resistors and change their resistivity, which is measured as a
voltage difference across the bridge. The technique is reliable across a whole range of gas
mixture, provided that mixture comprises only two gases and the two gases have different
thermal conductivities (e.g. methane and air).
125
The handheld gas Bascom Turner CGI-201 and 211 Class 1, Division 1 hazardous location
compliant instruments which can accurately quantify methane composition, as well as other
hydrocarbons which reduced certainty. It is equipped with catalytic combustion sensor to
measure hydrocarbon content from 0.05% up to 4% and a thermal conductivity sensor to
measure methane 4% to 100%. The CGI-211 has a “Track Gas” mode which is ideal for finding
leaks as it has a very fast response time and a beeper/alarm when the instrument detects
combustible gases in excess of a user adjustable set point. However using the instrument in
“Track Gas” mode only uses the catalytic gas sensor which restricts the operational range to 0 to
4% methane. The catalytic sensor is susceptible to catalyst poisoning from silicon compounds
(common in oil and lubricants), sulfur compounds, chlorine and heavy metals. Also, halogen or
halide compounds (used in fire extinguishers) and Freon (used in refrigerants) can inhibit the
catalytic sensor. However, the sensor should return to normal functionality with 24 to 48 hours
of exposure to the ambient air. Finally, the catalytic bead of the sensor is susceptible to thermal
stress cracking when exposed to high concentration combustible gases, which generate a lot of
catalytic oxidation heat on the bead.
The methane sensor in the instrument should be replaced when sensitivity changes substantially
since the last calibration. The instrument can be manually calibrated by supplying a calibration
gas to the instrument at atmospheric pressures and adjusting a potentiometer until the correct
concentration is displayed by the instrument. Typically, this instrument is calibrated once every
six months.
8.5.1.2 PORTABLE ACOUSTICAL LEAK DETECTOR
Portable acoustical leak detectors (e.g., VPAC Model 5131) can estimate the internal leakage
past the seat of a valve (through valve leakage). These instruments require the operator to enter
the valve type, size and differential pressure (pressure upstream vs downstream of the valve), and
place a hand held acoustic probe with some gel on the body of the value. The acoustic signal
observed by the instrument and valve properties are used to estimate the through valve leak rate
from an empirical derived database of laboratory tested valves with known through valve leak
rates.
While this type is leak detector is easy to use it is only appropriate for valves and can only
estimate the through valve leak rate. This instrument cannot estimate the valve stem leak rate
and does not give an indication of the hydrocarbon emissions if the valve is in gas service. This
instrument is not appropriate for screening an area for fugitive emissions.
8.5.1.3 INFRARED CAMERA

126
Gas detecting infrared (“IR”) cameras are a fast and easy to use tool for screening fugitive
emissions sources. However, IR cameras have limited performance in rain, snow, or fog; and an
inability to distinguish between natural gas and hot gases. Also, since IR camera video recording
equipment is not rated for usage in Class I, Division 1 hazardous locations, a hot work permit is
required, and the screening area must be monitored for LEL concentrations.
IR cameras operate on the principle that all matter emits infrared radiation (light) at different
frequencies, depending on its temperature. Gas detecting IR cameras are equipped with an
optical filter which only lets through a narrow portion of the infrared spectrum that target gases
(e.g. hydrocarbons) are known to have stronger absorption than the other gases in ambient air.
Hydrocarbon emissions are registered by the camera as a deficit in the infrared light intensity
relative to that of the background. The captured infrared light intensity is processed by the
camera, and displayed as a false coloured image in the visible part of the spectrum.
The deficit in infrared light intensity will be more pronounced if the target gas is colder than the
background or if the target gas contains heavy hydrocarbons (e.g. C2 to C6). Similarly, an
opposite response can be observed when the emission source is much hotter than the
background, such as a flare with a cold sky background.
8.5.2 LEAK AND VENT MEASUREMENT
8.5.2.1 CALIBRATED BAG
A calibrated bag is a bag for measuring the emission rate from a vent or opened line. The bag
has a known volume and a neck sized to fit over vent openings. The leak rate is determined as
the volume of the calibrated bag divided by the time it took to fill. The emissions are also
sampled to determine the concentration of target gases. The product of the leak rate and target
gas concentration give the emission rate of the vent. This method is capable of measuring leaks
up to 408 m3/hr of natural gas and is accurate to within ±10% (Health Consultants Inc., 2009).
8.5.2.2 FULL-FLOW FLOW METERS
If possible to fully capture leak emissions, the leak rate can be determined by from the product of
the flow rate and the concentration of the target gas in the sampling stream. The target gas
concentration can be measured with a vapour analyzer presented in Section 8.5.1 or lab analysis
of a grab sample. The sample stream flow rate can be measured with a variety of instruments
such as a diaphragm flow meter, rotary meter, orifice meters and ultrasonic flow meter. At

127
higher flow rates the target gas concentration in the flow stream will be reduced due to additional
dilution by ambient air being drawn from around the leak site that is being measured. However,
the product of the measured flow rate and target gas concentration should give a consistent
estimate of the leak emission rate. A flow rate should be selected such that the all the emissions
from the leak are captured but not so high that the target gas concentration in the sampling
stream is approaching the detectable limit of the instrument. The Hi-Flow Sampler (Section
8.5.2.3) is an example of a product which estimates a hydrocarbon leak rate by capturing all the
emissions from a leak. The Calscan positive displacement meter is another example, however,
this device measures whole gas flow and is not equipped with a hydrocarbon sensor.
8.5.2.3 HI-FLOW SAMPLER
The Hi-Flow Sampler is an intrinsically safe instrument manufactured and sold by Bacharach,
for measuring methane emission rates from leaking components. The instrument is portable
(9 kg) and fits inside a backpack. The Hi-Flow Sampler comprises a sampling hose which the
operator places on a leak site, an instrumentation box containing a blower and catalytic/thermal
conductivity natural gas sensors, a battery pack, and a control pad/display. The Hi-Flow
Sampler attempts to capture all the emissions from a leak by continuously drawing a sample of
the air around a leak site at a relatively high (up to 17 m3/hr), but adjustable flow rate. The flow
rate is determined by the measured pressure differential across an orifice restrictor, and the
methane concentration is determined by directing a portion of the flow to a catalytic
oxidation/thermal conductivity combustible gas sensor (see Section 8.5.1.1). An identical sensor
also measures the background concentration of methane within the vicinity of the leak site. The
background methane concentration is discounted from the sampled methane concentration in the
assessment of the component leak rate. Finally, a blower which draws the sample through the
instrument, exhausts to atmosphere.
This instrument is capable of determining leak rates from 0.085 to 13.6 m3/hr ±10%. The
manufacture recommends monthly calibration at a minimum, and more frequent calibration
depending on how often the instrument is used and the amount of gas that has been sampled.
Since this instrument uses a catalytic/thermal conductivity combustible gas sensor to quantify the
sample’s methane concentrations, it is susceptible to sensor flooding and poisoning (see Section
8.5.1.1).
Sensor flooding occurs when a high concentration (greater than 5%) of methane is quickly
introduced to the sensor methane sensor. Under ideal conditions the instrument would transition
from the catalytic sensor (valid for 0% to 5% methane) to the thermal conductivity sensor (valid
5% to 100% methane). However, when too great a methane concentration is quickly introduced
to the catalytic sensor, the instrument will report erroneously low reading because the catalytic
reaction is oxygen starved and will not trigger the thermal conductivity sensor. To prevent

128
sensor flooding a source with combustible gas content greater than stoichiometric
(approximately 9% methane) must be approached slowly so as to trigger the transition to the
thermal conductivity sensor.
8.6 FACILITY SUBTYPE CODES
When operators apply for a production accounting facility identifier (Facility ID), the AER
requires that a facility subtype by specified according to the descriptions listed in Tables 2 and 3
of Manual 011 (AER, 2016). Facility subtype codes are presented in Table 21 and grouped
according to UOG industry segments. Although these facility descriptions don’t provide
complete or definitive explanations of process equipment installed, they do provide some insight
on the nature of processing activities at subject sites. When combined with volumetric flow data
and field inventory statistics, the quantity and size of equipment at discrete sites can be
estimated.
Table 21: Facility Subtypes defined in AER Manual 011.
UOG
Industry
Segment
SubType
Code
Facility
Type
Facility SubType
Well drilling,
testing and
servicing
381 Battery Drilling and completing
371 Battery Gas test
Light and
Medium
Crude Oil
Production
311 Battery Crude Oil (Medium) Single
321 Battery Crude Oil (Medium) Multiwell Group
322 Battery Crude Oil Multiwell Proration
501 Injection Enhanced recovery scheme
502 Injection Concurrent production-cycling scheme
508 Injection Enhanced recovery scheme (issued by AER). No
License Required.
Cold Heavy
Crude Oil
Production
331 Battery Crude bitumen single-well
341 Battery Crude bitumen multiwell group
342 Battery Crude bitumen multiwell proration
343 Battery Crude bitumen/heavy oil administrative grouping
611 Custom
Treating
Custom Treating Facility
Thermal
Heavy Crude
Oil Production
344 Battery In-Situ Oil Sands battery
345 Battery In-Situ Oil Sands battery (Sulphur Reporting)
506 Injection In-Situ oil sands
902 Battery Water Source
Natural Gas
Production
351 Battery Gas Single
361 Battery Gas Multiwell Group
362 Battery Gas Multiwell effluent

129
Table 21: Facility Subtypes defined in AER Manual 011.
UOG
Industry
Segment
SubType
Code
Facility
Type
Facility SubType
363 Battery Gas Multiwell proration SE AB
364 Battery Gas Multiwell proration outside SE AB
365 Battery Gas Multiwell Group (issued by AER). No License
Required.
366 Battery Gas Multiwell proration SE AB (issued by AER). No
License Required.
367 Battery Gas Multiwell proration outside SE AB (issued by
AER). No License Required.
Natural Gas
Gathering
601 Compressor
Station
Compressor Station
621 Gas
Gathering
Gas Gathering System
622 Gas
Gathering
Gas Gathering System (compression < 75 kW.
Issued by AER). No License Required.
Natural Gas
Processing
401 Gas Plant Gas Plant Sweet
402 Gas Plant Gas Plant Sour (receives <1 t/d sulphur) - Flaring
403 Gas Plant Gas Plant Sour (receives >1 t/d sulphur) - Flaring
404 Gas Plant Gas Plant Sour - Injection
405 Gas Plant Gas Plant Sour - Recovery
406 Gas Plant Gas Plant Sweet - Straddle
407 Gas Plant Gas Plant fractionation
504 Injection Acid Gas Disposal
Natural gas
transmission,
storage and
distribution
204 Pipeline Gas transporter
206 Pipeline Gas distributor
505 Injection Underground gas storage
631 Gas
Gathering
Field Receipt meter station
632 Gas
Gathering
Disposition meter station
633 Gas
Gathering
Interconnected meter station
634 Gas
Gathering
Border crossing meter station
637 Gas
Gathering
NEB field receipt meter station
638 Gas
Gathering
NEB interconnect receipt meter station
639 Gas
Gathering
NEB interconnect disposition meter station

130
Table 21: Facility Subtypes defined in AER Manual 011.
UOG
Industry
Segment
SubType
Code
Facility
Type
Facility SubType
640 Gas
Gathering
Interconnect PL to PL disposition meter station
Petroleum
Liquids
Transportation
207 Pipeline Oil pipeline
208 Pipeline NGL pipeline
209 Pipeline NEB Regulated Pipeline
671 Tank Farm-
Terminal
Tank loading and unloading terminal
672 Tank Farm-
Terminal
NEB regulated terminal
673 Tank Farm-
Terminal
Third-party tank loading and unloading terminal
675 Tank Farm-
Terminal
RailCar/Oil Loading And Unloading Terminal
Disposal and
Waste
Treatment
503 Injection Water Disposal
507 Injection Disposal (approved as waste plant)
509 Injection Disposal (issued by AER). No License Required.
612 Custom
Treating
Custom Treating Facility (approved as waste plant)
8.7 WELL STATUS CODES
Well status codes are defined for each UWI in Alberta. They feature the following categories that
identify the activity and classification of a well and its fluid.
Fluid - the primary fluid the well produces or injects, such as oil or gas.
Mode - the mechanism the well uses to produce or inject, such as flowing or pumping, or
the inactive phases of a well, such as suspended or abandoned.
Type - the well type reflects the well's purpose, such as injection or disposal.
Structure - the well structure reflects when a well has multiple wells that have
commingled production, or when a well is completed horizontal and the producing
interval is open and draining into a common wellbore.
All four categories may not apply to every UWI. Non-null records are concatenated to form a
single well status code for each UWI. The most common well status records are presented in
Figure 24 with example counts from December 2017. Emission inventory refinements should
focus on the top 9 well status codes that represent 99 percent of the relevant well population.

131
Figure 24: Number of UWIs (representing production strings) and well licences (representing wellheads with hydrocarbon
flows) for each well status code reported in Petrinex for December 2017.

132

133
9 APPENDIX - METHODOLOGY FOR ASSESSING UNCERTAINTIES
Uncertainties in emission inventories arise through at least three different processes (IPCC,
2000):
Uncertainties from definitions (e.g., meaning incomplete, unclear, or faulty definition of
an emission or uptake).
Uncertainty from natural variability of the process that produces the emission.
Uncertainties from the assessment of the process or quantity, including, depending on the
method used: (i) uncertainties from measuring, (ii) uncertainties from sampling, (iii)
uncertainties from reference data that may be incompletely described, and (iv)
uncertainties from expert judgment.
For most purposes it is reasonable to assume that uncertainties from definitions are adequately
controlled through the applied QA/QC procedures, and therefore, are negligible. Quantitative
uncertainty estimates to account for the latter two contributions may be developed using the Tier
1 approach published by IPCC (2000). This approach employs simple error propagation
equations based on the assumption of uncorrelated normally distributed uncertainties under
addition and multiplication.
9.1 ERROR PROPAGATION EQUATIONS
An emission inventory may be viewed as the sum of emission estimates for multiple equipment
units where the estimate for each equipment is typically the product of an emission factor and a
corresponding activity value. For example, emissions from a single source are typically
estimated using a relation of the form:
𝑬𝑹 = 𝑬𝑭 ∙ 𝑨 ∙ (𝟏 − 𝑪𝑭) ∙ 𝑶𝑻
Equation 11
Where,
ER = average emission rate,
EF = average emission factor,
A = activity value,
CF = control factor,
OT = fraction of the time the source is in service.
Total aggregate emissions from multiple sources are then calculated using the relation:
𝑬𝑹𝑻𝒐𝒕𝒂𝒍 = 𝑬𝑹𝟏 + 𝑬𝑹𝟐 +⋯+ 𝑬𝑹𝒏
Equation 12
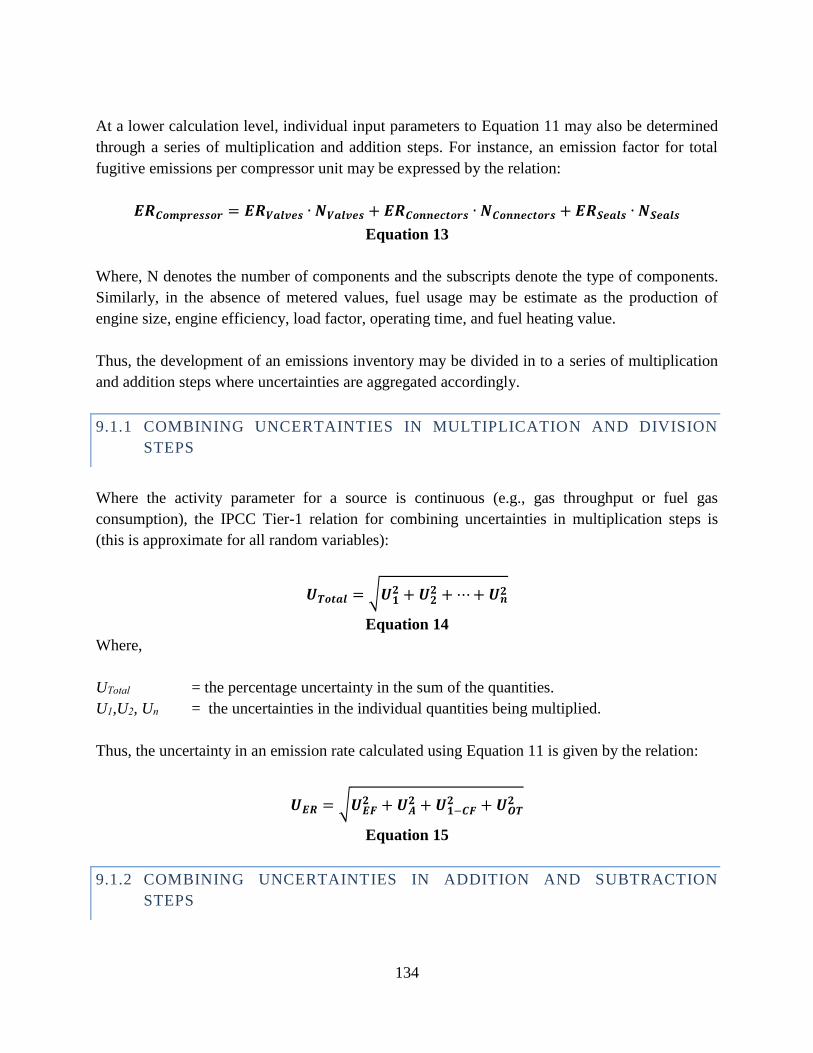
134
At a lower calculation level, individual input parameters to Equation 11 may also be determined
through a series of multiplication and addition steps. For instance, an emission factor for total
fugitive emissions per compressor unit may be expressed by the relation:
𝑬𝑹𝑪𝒐𝒎𝒑𝒓𝒆𝒔𝒔𝒐𝒓 = 𝑬𝑹𝑽𝒂𝒍𝒗𝒆𝒔 ∙ 𝑵𝑽𝒂𝒍𝒗𝒆𝒔 + 𝑬𝑹𝑪𝒐𝒏𝒏𝒆𝒄𝒕𝒐𝒓𝒔 ∙ 𝑵𝑪𝒐𝒏𝒏𝒆𝒄𝒕𝒐𝒓𝒔 + 𝑬𝑹𝑺𝒆𝒂𝒍𝒔 ∙ 𝑵𝑺𝒆𝒂𝒍𝒔
Equation 13
Where, N denotes the number of components and the subscripts denote the type of components.
Similarly, in the absence of metered values, fuel usage may be estimate as the production of
engine size, engine efficiency, load factor, operating time, and fuel heating value.
Thus, the development of an emissions inventory may be divided in to a series of multiplication
and addition steps where uncertainties are aggregated accordingly.
9.1.1 COMBINING UNCERTAINTIES IN MULTIPLICATION AND DIVISION
STEPS
Where the activity parameter for a source is continuous (e.g., gas throughput or fuel gas
consumption), the IPCC Tier-1 relation for combining uncertainties in multiplication steps is
(this is approximate for all random variables):
𝑼𝑻𝒐𝒕𝒂𝒍 = √𝑼𝟏𝟐 + 𝑼𝟐
𝟐 +⋯+𝑼𝒏𝟐
Equation 14
Where,
UTotal = the percentage uncertainty in the sum of the quantities.
U1,U2, Un = the uncertainties in the individual quantities being multiplied.
Thus, the uncertainty in an emission rate calculated using Equation 11 is given by the relation:
𝑼𝑬𝑹 = √𝑼𝑬𝑭𝟐 + 𝑼𝑨
𝟐 + 𝑼𝟏−𝑪𝑭𝟐 + 𝑼𝑶𝑻
𝟐
Equation 15
9.1.2 COMBINING UNCERTAINTIES IN ADDITION AND SUBTRACTION
STEPS

135
Where the activity parameter for a source is a count or integer value (e.g., number of equipment
components, number of pneumatic devices, number of compressors, etc.), Equation 16 is used to
evaluate the aggregate uncertainty for N sources of the same type (this expression is exact for
uncorrelated or independent variables).
𝑼𝑻𝒐𝒕𝒂𝒍 =√(𝑼𝟏 ∙ 𝒙𝟏)𝟐 + (𝑼𝟐 ∙ 𝒙𝟐)𝟐 +⋯+ (𝑼𝒏 ∙ 𝒙𝒏)𝟐
𝒙𝟏 + 𝒙𝟐 +⋯+ 𝒙𝒏
Equation 16
Where:
x1,x2,xn = are the uncertain quantities being added.
Thus, the uncertainty in an emission rate calculated using Equation 12 is given by the relation:
𝑼𝑬𝑹𝑻𝒐𝒕𝒂𝒍 =√(𝑼𝑬𝑹𝟏 ∙𝑬𝑹𝟏)
𝟐+(𝑼𝑬𝑹𝟐 ∙𝑬𝑹𝟐)𝟐+⋯+(𝑼𝑬𝑹𝒏 ∙𝑬𝑹𝒏)
𝟐
𝑬𝑹𝟏+𝑬𝑹𝟐+⋯+𝑬𝑹𝒏
Equation 17
9.2 LIMITATIONS TO RULES OF COMBINATION OF UNCERTAINTIES
The rules stated above are derived below in Section 9.3. These rules have two limitations. First,
they can be used only when there is a combination of multiplication and/or addition. Second, the
variables in the equations are assumed independent of one another. In case of any dependency
between variables, covariance terms must be incorporated in the uncertainty calculations as
presented in Equation 20.
9.3 DERIVATION OF ERROR PROPAGATION EQUATIONS
Uncertainty in this work is defined as 95% confidence interval. The uncertainty of a variable
may be calculated using Equation 18 which is a linear function of standard deviation.
𝑈𝑥𝑖 =𝑐
√𝑛
𝜎𝑥𝑖𝑥𝑖
Equation 18
Where
Uxi = uncertainty of xi,
136
σxi = standard deviation of xi,
xi = an arbitrary variable,
c = 95% confidence level critical value,
n = number of data points.
Equation 18 is generally used to calculate the uncertainty of variables from measurement data;
however, when a variables is calculated as a function of other variables, its uncertainty shall be
calculated as an aggregation of other variables’ uncertainties. Since the uncertainty is a linear
function of standard deviation, rule of propagation of standard deviation shall be used to
calculate the uncertainty of a function.
For function x defined as
𝑥 = 𝑓(𝜒1, … , 𝜒𝑖 , … , 𝜒𝑛)
Equation 19
where n is the number of variables, the standard deviation is calculated in terms of standard
deviation of its variables, 𝜒𝑖, using the rule of propagation of standard deviation as express by
Equation 20.
𝜎𝑥 = √∑∑𝜕𝑥
𝜕𝜒𝑖
𝑛
𝑗=1
𝜎𝜒𝑖,𝜒𝑗𝜕𝑥
𝜕𝜒𝑗
𝑛
𝑖=1
Equation 20
In the above equation, 𝜎𝜒𝑖,𝜒𝑗 is covariance of 𝜒𝑖 and 𝜒𝑗 which is defined as:
𝜎𝜒𝑖,𝜒𝑗 =∑𝑑𝜒𝑖𝑑𝜒𝑗
𝑁 − 1
Equation 21
where N is the population of data. If 𝜒𝑖 are independent, Equation 20 simplifies to
𝜎𝑥 = √∑(𝜕𝑥
𝜕𝜒𝑖𝜎𝜒𝑖)
2𝑛
𝑖=1
Equation 22
where 𝜎𝜒𝑖 is the standard deviation of 𝜒𝑖.

137
Equation 20 and Equation 22 could be proved by an example. Consider an arbitrary equation x
which is a function of three parameters a, b, and c:
𝑥 = 𝑓(𝑎, 𝑏, 𝑐)
Equation 23
The standard deviation of x is defined as
𝜎𝑥 = √∑𝑑𝑥𝑖
2
𝑁 − 1
Equation 24
where dx is differential of x and is calculated by Equation 25.
𝑑𝑥 = (𝜕𝑥
𝜕𝑎)𝑏,𝑐𝑑𝑎 + (
𝜕𝑥
𝜕𝑏)𝑎,𝑐𝑑𝑏 + (
𝜕𝑥
𝜕𝑐)𝑎,𝑏𝑑𝑐
Equation 25
Inserting Equation 25 into Equation 24 leads to Equation 26, which aggregates the standard
deviations.

138
𝜎𝑥 = (1
𝑁 − 1(∑(
𝜕𝑥
𝜕𝑎)𝑏,𝑐
2
𝑑𝑎𝑖2 +∑(
𝜕𝑥
𝜕𝑏)𝑎,𝑐
2
𝑑𝑏𝑖2 +∑(
𝜕𝑥
𝜕𝑐)𝑎,𝑏
2
𝑑𝑐𝑖2
+∑2(𝜕𝑥
𝜕𝑎)𝑏,𝑐(𝜕𝑥
𝜕𝑏)𝑎,𝑐𝑑𝑎𝑖𝑑𝑏𝑖 +∑2(
𝜕𝑥
𝜕𝑎)𝑏,𝑐(𝜕𝑥
𝜕𝑐)𝑎,𝑏𝑑𝑎𝑖𝑑𝑐𝑖
+∑2(𝜕𝑥
𝜕𝑏)𝑎,𝑐(𝜕𝑥
𝜕𝑐)𝑎,𝑏𝑑𝑏𝑖𝑑𝑐𝑖))
1/2
= ((𝜕𝑥
𝜕𝑎)𝑏,𝑐
2
∑𝑑𝑎𝑖
2
𝑁 − 1+ (𝜕𝑥
𝜕𝑏)𝑎,𝑐
2
∑𝑑𝑏𝑖
2
𝑁 − 1+ (𝜕𝑥
𝜕𝑐)𝑎,𝑏
2
∑𝑑𝑐𝑖
2
𝑁 − 1
+ 2(𝜕𝑥
𝜕𝑎)𝑏,𝑐(𝜕𝑥
𝜕𝑏)𝑎,𝑐∑𝑑𝑎𝑖𝑑𝑏𝑖𝑁 − 1
+ 2 (𝜕𝑥
𝜕𝑎)𝑏,𝑐(𝜕𝑥
𝜕𝑐)𝑎,𝑏∑𝑑𝑎𝑖𝑑𝑐𝑖𝑁 − 1
+ 2(𝜕𝑥
𝜕𝑏)𝑎,𝑐(𝜕𝑥
𝜕𝑐)𝑎,𝑏∑𝑑𝑏𝑖𝑑𝑐𝑖𝑁 − 1
)
1/2
= ((𝜕𝑥
𝜕𝑎)𝑏,𝑐
2
𝜎𝑎2 + (
𝜕𝑥
𝜕𝑏)𝑎,𝑐
2
𝜎𝑏2 + (
𝜕𝑥
𝜕𝑐)𝑎,𝑏
2
𝜎𝑐2 + 2(
𝜕𝑥
𝜕𝑎)𝑏,𝑐(𝜕𝑥
𝜕𝑏)𝑎,𝑐𝜎𝑎,𝑏
+ 2(𝜕𝑥
𝜕𝑎)𝑏,𝑐(𝜕𝑥
𝜕𝑐)𝑎,𝑏𝜎𝑎,𝑐 + 2(
𝜕𝑥
𝜕𝑏)𝑎,𝑐(𝜕𝑥
𝜕𝑐)𝑎,𝑏𝜎𝑏,𝑐)
1/2
Equation 26
If parameters are independent, covariance terms are zero, and Equation 26 becomes
𝜎𝑥 = √(𝜕𝑥
𝜕𝑎)𝑏,𝑐
2
𝜎𝑎2 + (𝜕𝑥
𝜕𝑏)𝑎,𝑐
2
𝜎𝑏2 + (𝜕𝑥
𝜕𝑐)𝑎,𝑏
2
𝜎𝑐2
Equation 27
Equation 27 correspond to Equation 22 for x as defined by Equation 23.
Assuming all the parameters are independent, Equation 22 and Equation 1 may be used to
develop rules for calculating the standard deviations and uncertainties of the mathematical
operations. This is delineated in the following sections.
9.3.1 UNCERTAINTY OF MULTIPLICATION AND DIVISION
Consider x defined as

139
𝑥 =𝑎 ∙ 𝑏
𝑐
Equation 28
The standard deviation of x may be calculate using Equation 22 as follows
𝜎𝑥𝑥= √(
𝜎𝑎𝑎)2
+ (𝜎𝑏𝑏)2
+ (𝜎𝑐𝑐)2
Equation 29
Inserting Equation 1 into above equation leads to a rule for calculating the uncertainty of
multiplications and divisions:
𝑈𝑥 = √(𝑈𝑎)2 + (𝑈𝑏)2 + (𝑈𝑐)2
Equation 30
9.3.2 UNCERTAINTY OF ADDITION AND SUBTRACTION
Consider x defined as
𝑥 = 𝑎 + 𝑏 − 𝑐
Equation 31
The standard deviation of x may be calculate using Equation 22 as follows
𝜎𝑥 = √𝜎𝑎2 + 𝜎𝑏2 + 𝜎𝑐2
Equation 32
Inserting Equation 1 into above equation leads to a rule for calculating the uncertainty of
additions and subtractions:
𝑈𝑥 =√(𝑈𝑎 ∙ 𝑎)2 + (𝑈𝑏 ∙ 𝑏)2 + (𝑈𝑐 ∙ 𝑐)2
𝑎 + 𝑏 + 𝑐
Equation 33
9.3.3 UNCERTAINTY OF COMBINED OPERATIONS

140
The standard deviation and uncertainty when mathematical operations are combined shall be
calculated using Equation 22 in the same fashion demonstrated above. For example, consider
𝑥 = 𝑎 ∙ 𝑏
Equation 34
where
𝑎 = 𝛼 + 𝛽
Equation 35
The standard deviation of x using Equation 22 is calculated as
𝜎𝑥𝑥= √(
𝜎𝑎𝑎)2
+ (𝜎𝑏𝑏)2
= √
(
√𝜎𝛼2 + 𝜎𝛽2
𝛼 + 𝛽
)
2
+ (𝜎𝑏𝑏)2
Equation 36
To obtain the uncertainty of x, Equation 1 shall be inserted into the above equaiton, which leads
to
𝑈𝑥 = √
(
√(𝑈𝛼 ∙ 𝛼)2 + (𝑈𝛽 ∙ 𝛽)2
𝛼 + 𝛽
)
2
+ (𝑈𝑏)2
Equation 37

141
10 APPENDIX - LEAK FACTORS BY SECTOR
Figures Figure 25 to Figure 37 in this appendix provide a graphical comparison of the average
emission factors by sector for compressor rod-packings, connectors, control valves, meters,
open-ended lines, PRV/PSVs, pump seals, regulators, SCVFs, and thief hatches respectively.
Each figure presents bars showing the average emission factor, whisker plots of the 95 percent
confidence limits plus the number of components surveyed. In all cases, the confidence limits for
the oil and gas sector overlap so distinguishing separate sector factors is not necessary (EPA,
1995) and the value corresponding to “All” sectors should be applied by users.
To support the combination of records into a single sector population, one-way analysis of
variance (ANOVA method) is used to confirm there is no statistically significant difference
between the means of these two independent groups. This test is conducted by considering
“sector” as the main factor of the analysis with two levels (Oil and Gas). Each level is assigned
12 leak rate “responses” as delineated in Table 22 which correspond to the component types
identified in this study.
Table 22: Arrangement of data for one-way ANOVA testing.a
Response Categories
(Component – Service)
Sector Factor (kg/hr)a
Level 1 (Oil) Level 2 (Gas)
Compressor Seal - Process Gas 0.761199 0.167356
Connector - Process Gas 0.000191 0.000116
Control Valve - Process Gas 0.00962 0.003012
Meter - Process Gas 0.00039 0.001493
Open-ended Line - Process Gas 0.011516 0.096298
PRV/PSV -Process Gas 0.007561 0.001527
Pump Seal - Process Gas 0.020611 0.002614
Regulator - Process Gas 0.001543 0.000769
SCVF - Process Gas 0.007103 0.17126
Valve - Process Gas 0.000089 0.000623
Connector - Light Liquid 0.000007 0.000007
Valve - Light Liquid 0.000209 0.000023 a Thief hatch is excluded as no data is available for the gas sector.
The results of ANOVA testing are presented in Table 23 and indicate the null hypothesis is true,
and the true means of the populations are the same. This means the difference between the
observed means and the variation between the data in the oil and gas sectors are caused only by
random error. Thus, a single factor for each component type with sector = “All” is presented in
Section 3 Table 9 and Table 10.

142
Table 23 summarizes sum of squares, degree of freedom, and mean of square as well as the
output of F-test in terms of F, F critical, and P-value. The results reflect the variation of data
within and between the levels. Moreover, they provides F-test outputs that assess the null
hypothesis that the population means are equal. F critical is calculated to be 4.3 when a
significance level of 0.05 is considered, while F value of the test is only 0.22. As F is much
smaller than F critical, the null hypothesis cannot be rejected. Additionally, F corresponds to a
P-value of 0.64, which is much higher than the significance level so the null hypothesis cannot
be rejected.
Table 23: Results of ANOVA.
Source of
Variation
Sum of Squares
(SS)
Degree of
Freedom (df)
Mean
Square (MS)
F P-value F critical
Between
Levels
0.005858 1 0.005858 0.2244 0.6404 4.3009
Within
Levels
0.5742 22 0.02610
Total 0.5801 23
The following assumptions are made to perform the ANOVA test:
1. Responses and observations are chosen randomly and independently.
2. The levels have a common variance.
3. The distributions of the residuals are normal.
The first assumption is true based on the observations in the study were made. The second
assumption also was shown to be true by F test. The last assumption is not true since the
distributions are skewed; however, as long as number of observation are sufficiently large, the
normality can be violated if the distributions have similar shape.
No-leak factors are also presented below to illustrate their contribution to fugitive emissions for
each component type. No-leak factors are less important for component populations featuring
lots of leaks but as fewer and smaller leaks are detected, the no-leak contribution to total fugitive
emissions becomes more important. This is the case for connectors and valve where the no-leak
factor is actually greater than the population average factor. In fact, the no-leak contribution to
total fugitive emissions from connectors and valves is approximately 74 percent.

143
Figure 25: Population-average leak rates for rod-packings in process gas service by sector.

144
Figure 26: Population-average leak rates for connectors in process gas service by sector.

145
Figure 27: Population-average leak rates for connectors in light liquid service by sector.
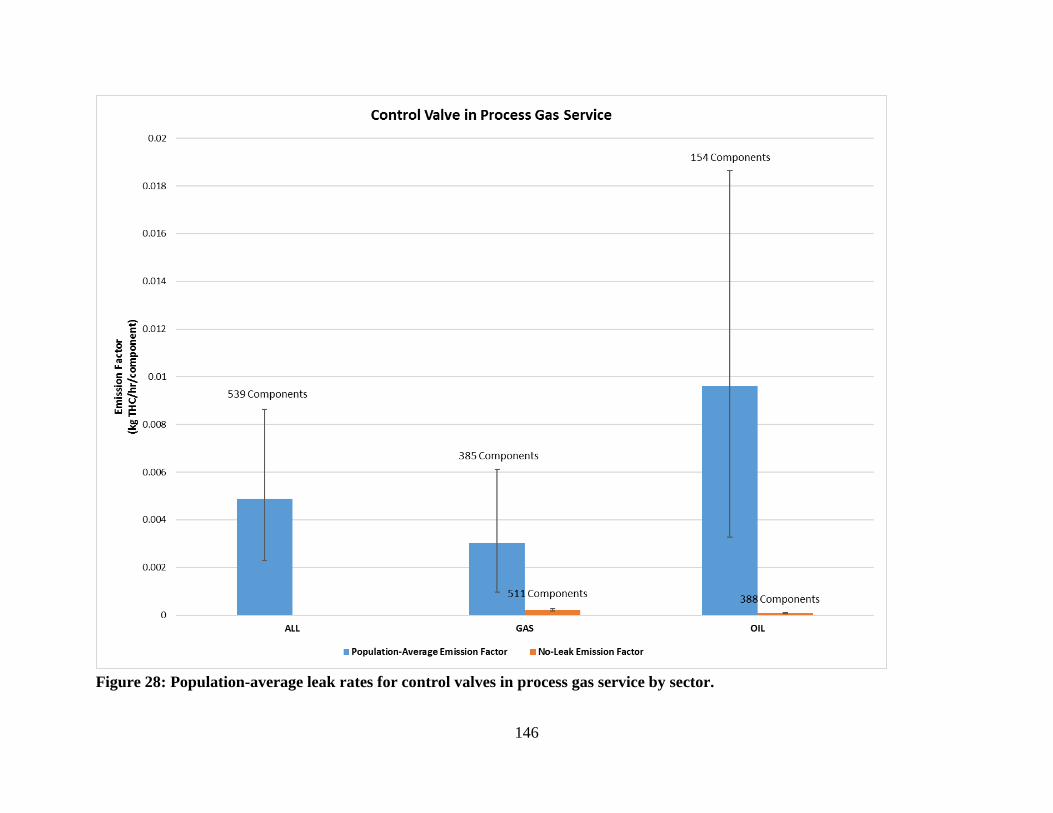
146
Figure 28: Population-average leak rates for control valves in process gas service by sector.

147
Figure 29: Population-average leak rates for meters in process gas service by sector.

148
Figure 30: Population-average leak rates for open-ended lines in process gas service by sector.

149
Figure 31: Population-average leak rates for PRV/PSVs in process gas service by sector.
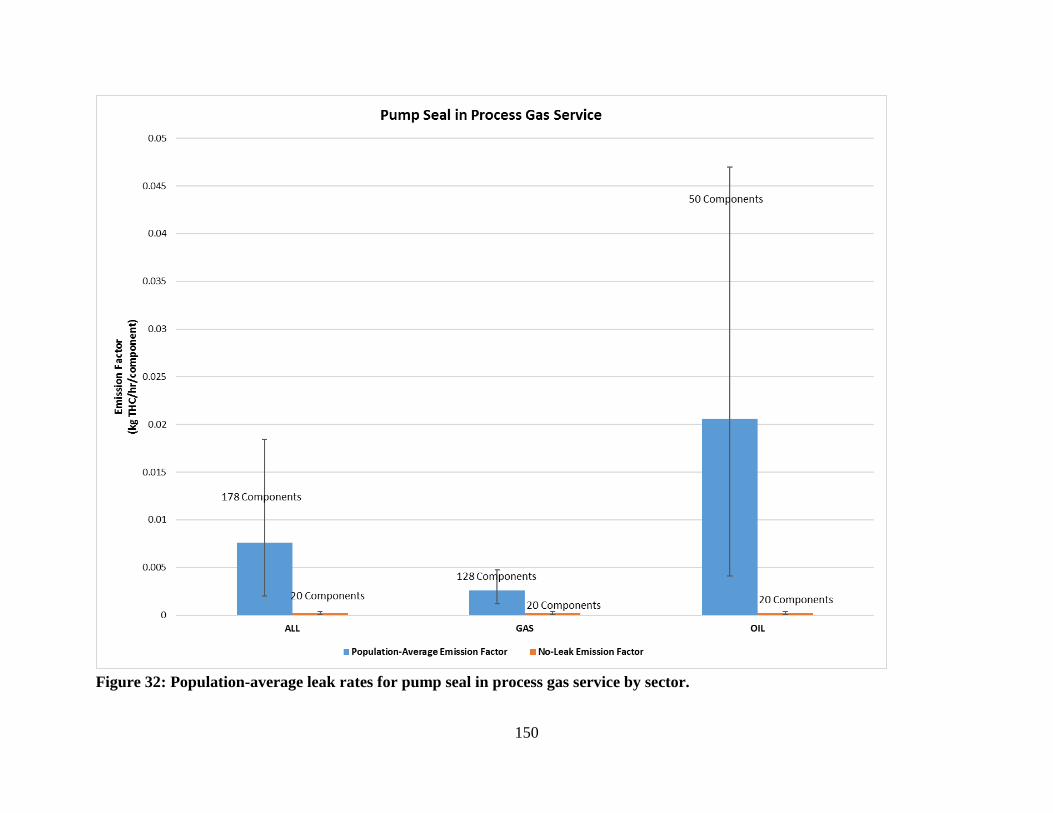
150
Figure 32: Population-average leak rates for pump seal in process gas service by sector.

151
Figure 33: Population-average leak rates for regulators in process gas service by sector.

152
Figure 34: Population-average leak rates for SCVFs in process gas service by sector.

153
Figure 35: Population-average leak rates for thief hatches in process gas service by sector.

154
Figure 36: Population-average leak rates for valves in process gas service by sector.
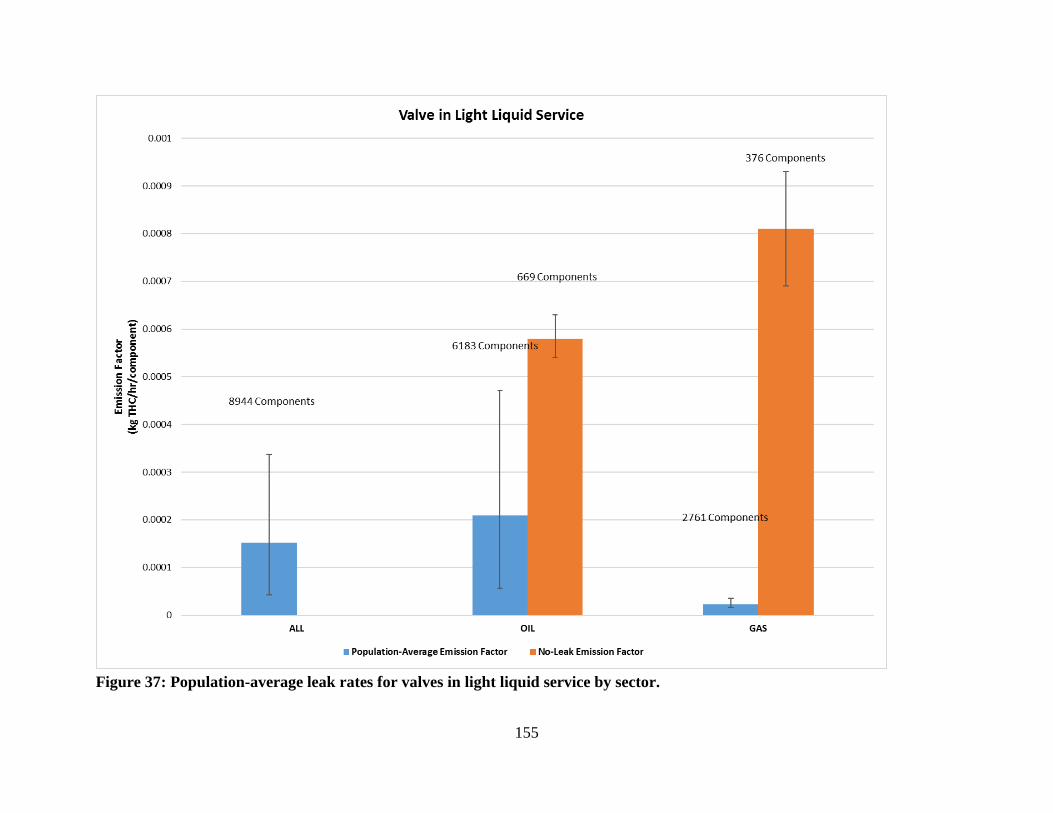
155
Figure 37: Population-average leak rates for valves in light liquid service by sector.

156

157
11 APPENDIX - RAW DATA (BLINDED)
Table 24: Process equipment and component count records from the field campaign
conducted at Alberta upstream oil and natural gas (UOG) sites from 14 August to 23
September 2017.
Table 25: Pneumatic device count records from the field campaign conducted at Alberta
upstream oil and natural gas (UOG) sites from 14 August to 23 September 2017.
Table 26: Leak and vent measurement records from the field campaign conducted at
Alberta upstream oil and natural gas (UOG) sites from 14 August to 23 September 2017.


