
i
Technical Report 2014-5
________________________________________________________________
MIGRATION BEHAVIOR AND SPAWNING SUCCESS OF SPRING CHINOOK SALMON IN FALL CREEK, THE NORTH FORK MIDDLE FORK WILLAMETTE AND
SOUTH SANTIAM RIVERS: RELATIONSHIPS AMONG FATE, FISH CONDITION, AND ENVIRONMENTAL FACTORS, 2013
By
G.P. Naughton, C.C. Caudill, T.S. Clabough, M.L. Keefer, M.J. Knoff, M.R. Morasch,
G.A. Brink and M.A. Jepson
Department of Fish and Wildlife Sciences University of Idaho, Moscow, ID 83844-1136
For U.S. Army Corps of Engineers Portland District, Portland OR
2014
ii
Technical Report 2014-5
__________________________________________________________________
MIGRATION BEHAVIOR AND SPAWNING SUCCESS OF SPRING CHINOOK
SALMON IN FALL CREEK, THE NORTH FORK MIDDLE FORK WILLAMETTE, AND THE SOUTH SANTIAM RIVERS: RELATIONSHIPS AMONG FATE, FISH
CONDITION, AND ENVIRONMENTAL FACTORS, 2013
By
G.P. Naughton, C.C. Caudill, T.S. Clabough, M.L. Keefer, M.J. Knoff, M.R. Morasch, G.A. Brink and M.A. Jepson
Department of Fish and Wildlife Sciences
University of Idaho, Moscow, ID 83844-1136
For U.S. Army Corps of Engineers Portland District, Portland OR
2014
iii
Acknowledgements
Many people assisted with work on this report and its successful completion was made
possible through their efforts. This project was funded by the U.S. Army Corps of Engineers
(USACE). We would like to thank: Tim Blubaugh, U. of Idaho for assisting with field work and
data collection; Greg Taylor, Doug Garletts, Chad Helms, Todd Pierce, Nathaniel Erickson, and
Greg Gauthier from the USACE Lookout Point office for field help and project coordination;
David Griffith, Rich Piaskowski, and Robert Wertheimer from USACE Portland District;
Oregon Department of Fish and Wildlife staff, including Tom Friesen, Craig Tinus, Cameron
Sharpe, Ryan Emig, Dan Peck, Tim Wright, Tony Amandi, Brian Franklin, and Suzette Savoie
J.D Hansen, Dan Coffman and Reed Fischer. Carl Schreck, Michael Kent and Oregon State
University personnel for disease screening, especially Susan Benda, Mike Colvin, Rob
Chitwood, Kristin Berkenkamp, Virginia Watral, Julia Unrein and Trace Peterson, D.V.M.; and
others who contributed their time to this project. Toxicology samples were processed by Peter G.
Green at the University of California, Davis. Karen Johnson from the U. of Idaho also provided
support. This study was conducted under Cooperative Ecosystems Study Unit (CESU)
agreement CESU W912HZ-12-2-0004 funded by the U.S. Army, Corps of Engineers (USACE),
Portland District, with the assistance of Robert Wertheimer, Rich Piaskowski, David Griffith,
Glen Rhett, and Deberay Carmichael.
iv
Table of Contents
Acknowledgements ........................................................................................................................ iii
Executive Summary ....................................................................................................................... vi
Introduction ..................................................................................................................................... 1
Methods........................................................................................................................................... 3
Middle Fork Willamette .................................................................................................................. 3
Study Sites and Facilities ........................................................................................................ 3
Tagging and Assessment of Condition .................................................................................... 5
Proximate Analysis .................................................................................................................. 7
Temperature Monitoring ......................................................................................................... 8
Spawning Ground Surveys and Spawning Success ................................................................ 8
Multi-year summary ................................................................................................................ 9
South Santiam River ....................................................................................................................... 9
Toxicology Sampling .................................................................................................................... 10
Results ........................................................................................................................................... 10
Middle Fork Willamette ................................................................................................................ 10
Fall Creek .............................................................................................................................. 10
North Fork Middle Fork Willamette River ........................................................................... 13
Proximate Analysis .................................................................................................................... 15
River Conditions ........................................................................................................................ 17
Spawning Ground Surveys and Spawning Success ................................................................... 21
Fall Creek .............................................................................................................................. 21
North Fork Middle Fork Willamette River ........................................................................... 23
Multi-year summary................................................................................................................... 25
South Fork Santiam....................................................................................................................... 35
River and Reservoir Environment ......................................................................................... 37
Proximate Analysis ................................................................................................................ 39
Reservoir Releases ................................................................................................................ 39
Toxicology sampling .................................................................................................................... 40
Discussion ..................................................................................................................................... 42
Fish Condition, Environmental Conditions and Spawning Success: Middle Fork .................... 44
South Fork Santiam and Foster Reservoir Releases .................................................................. 45
Toxicology ................................................................................................................................. 46
Management Implications .......................................................................................................... 46

v
References ..................................................................................................................................... 48
Appendix ....................................................................................................................................... 54
vi
Executive Summary
Many adult Chinook salmon in the Willamette River basin die prior to spawning
(prespawning mortality). While PSM rates appear to vary among years and among subbasins, the
exact cause and relationships are not well defined. In 2013 we continued to survey the energetic
status and prespawn survival rates of three populations of Willamette River spring Chinook
salmon, monitored river environmental conditions, and investigated the relationships among
prespawn mortality and a suite of potential causative factors. Carcass recovery rates were lower
than in previous years because record rainfall in September made study streams too dangerous to
survey during peak Chinook salmon spawning activity.
In 2013, a total of 96 Chinook salmon were sampled at Fall Creek Dam. Fish were collected,
assessed for energetic content and overall condition, PIT-tagged and then transported above the
dam and allowed to spawn naturally. Four PIT-tagged salmon were recovered during spawning
ground surveys on Fall Creek, a recapture rate of 4.2% that was lower than in previous years (10-
12%) due to flood conditions. Both of the PIT-tagged females recovered on the spawning
grounds were prespawn mortalities. Thirteen unmarked Chinook salmon were also recovered on
the spawning grounds, all of which were prespawn mortalities. The average water temperature
during the study period was 15.7 °C with a peak of 20.8 °C occurring in late July.
A total of 165 Chinook salmon collected at the Dexter Dam trap were outplanted into the
North Fork Middle Fork Willamette River (NFMF) in 2013. Overall, 17 (10.3%) of the PIT and
radio-tagged fish were recovered in carcass surveys, a recovery rate within the range of previous
years (7-20%). Female prespawn mortality of NFMF outplants was 44.4% (four out of nine
females recovered) for PIT and radio-tagged fish combined. Mean water temperature in the
NFMF during the study period was 11.7 °C with a peak of 14.8 °C in early-July.
In 2013, we initiated outplanting into the NFMF approximately a month earlier than in
previous years. Of the 165 PIT and radio-tagged fish released in the NFMF, 64 (39%) were
released between 22-May and 5-June (early release group, hereafter). The remaining 101 fish
(61%) were released between 19-June and 17-July (standard release group, hereafter). Overall,
9% (n = 6) from the early release group were recovered on the spawning ground versus 11% (n =
11) for the standard release group. Only one female from the early release group was recovered
and it was a prespawn mortality. A total of six females from the ‘standard’ release group were
recovered and three (50%) were prespawn mortalities. Few inferences could be drawn from the
small sample affected by the September flood.
We also estimated prespawn mortality in the South Fork Santiam River upstream of Foster
Dam and evaluated behavior of adult salmon released in Foster Reservoir. A total of 200 spring
Chinook salmon were radio+PIT-tagged (n = 75) or PIT-tagged (n = 125) and then transported
upstream from the dam. Twenty-one radio- and PIT-tagged fish (10.5%) were recovered during
spawning ground surveys prior to the flood. Ten female PIT- and radio-tagged fish were
recovered on the spawning grounds and five (50%) were prespawn mortalities. Of the 75 radio-
tagged fish, 50 (67%) were released in Foster Reservoir; 38 (76%) of the 50 fish were last
recorded in the South Santiam, 6 (12%) were last recorded in the Middle Fork Santiam, and 6
(12%) passed downstream over Foster Dam. Three radio-tagged adults (6.0%) from the
reservoir release group were recovered on the South Santiam spawning grounds compared to
vii
20% for radio-tagged fish released in the river. Median reservoir residence times were 32.3 d for
fish last recorded on the South Fork Santiam receiver and 16.1 d for fish last recorded on the
Middle Fork Santiam receiver. The one female reservoir-released fish recovered was a prespawn
mortality. Mean water temperature in the South Santiam upstream from Foster Dam during the
study period was 14.8 °C with a peak of 19.3 °C on 6-Aug.
Although recoveries of PIT- and radio-tagged fish were lower than in previous years and
small sample sizes make interannual comparisons challenging, prespawning mortality rates were
likely higher in 2013 than in previous study years. In 2013, PSM rates were 100% at Fall Creek
and 44% in the NFMF. Across the previous five study years (2008-2012) pre-spawn mortality
estimates of PIT and radio-tagged females combined were 44.5% (range 6-82%) for Fall Creek
and 29.8% (range 14-44%) for immediate outplants to the NFMF.
We tested for associations between fate and a suite of factors potentially related to prespawn
mortality across study years using univariate and multiple logistic regression models and multi-
model selection techniques. The models for Fall Creek included 82 females collected over 5
years. Among the univariate logistic regression models, year, tag date, Fulton’s K, fork length
and standardized breadth at anus (StdBa) were significantly associated with prespawn mortality.
In the multi-model logistic regression evaluation, the most parsimonious model included year
and tag date. Several additional models had statistical support, including all models that
included either year or tag date. The models for the NFMF included 57 females collected over 5
years. Prespawn mortality was not significantly associated with any univariate factors in the
NFMF.
During 2013 we collected tissue samples from adults scored as prespawn mortalities or
successful spawners for evaluation of contaminant concentrations. Nineteen adults were
collected from NFMF, seven from the S. Santiam River, and two adults were collected from Fall
Creek (total 16 PSM and 12 successful spawners). To date, three metals previously implicated in
prespawn mortality (Pb, Cd, and Ni) have been analyzed and revealed concentrations similar to
or below those previously reported for salmon. Concentrations of Pb and Cd were significantly
higher from carcasses collected in the S. Santiam River compared NFMF samples (P <= 0.048)
and concentrations did not differ between successful and unsuccessful spawners. Future
analyses will include additional trace elements and organic compounds.
1
Introduction
The numbers of adult spring-run Chinook salmon (Oncorhynchus tshawytscha) returning to
the Willamette River, including tributaries managed as part of the USACE Willamette Valley
Project (WVP), have fluctuated widely and have been near historic low levels in recent years.
Development of the WVP began in 1941 and currently includes 13 dams and reservoirs on the
Long Tom, Santiam, McKenzie, Middle Fork Willamette, and Coast Fork Willamette subbasins.
The WVP is managed for flood control, recreation, irrigation, fish and wildlife management, and
power generation. Upper Willamette Chinook salmon populations in the WVP have declined for
a variety of reasons, including habitat degradation, habitat loss associated with dams, land use
practices, overharvest, pollution, changes in hydrologic and thermal regimes, and direct and
indirect effects of artificial propagation (NMFS 2008). Due in part to these concerns, the upper
Willamette River spring Chinook salmon run was listed as threatened under the U.S. Endangered
Species Act in 1999 (NMFS 1999).
Due to impassable WVP dams on major tributaries of the Willamette River, , returning adults
in many populations cannot reach much of their historic spawning habitat. Therefore an adult
trap-and-haul program was initiated in the 1990’s to make use of surplus hatchery broodstock
with the objectives of restoring a source of marine-derived nutrients and supplementing the prey
base of native resident fish and wildlife, including other threatened species (i.e., bull trout,
Salvelinus confluentus) (Beidler and Knapp 2005; Schroeder et al. 2007). Secondary benefits of
outplanting include facilitating natural spawning of these populations above the dams and
reconnecting habitats, and these secondary objectives have been elevated in recent years. There
has been high prespawn mortality observed in some years since the start of the trap-and-haul
program. Rates have been widely variable among years and among sub-basin populations
(Schroeder et al. 2007; Kenaston et al. 2009; Keefer et al. 2010; Keefer and Caudill 2010;
Roumasset 2012) and underlying mechanisms are not fully understood. Factors most likely to
contribute to adult prespawn mortality include environmental stressors (especially water
temperature), infectious disease, and poor energetic condition. Importantly, demographic
modeling suggests that observed levels of prespawn mortality (e.g. > 50-70%) may strongly
negatively affect population growth rates and hinder salmon recovery (Keefer et al. 2010). The
importance of prespawn mortality to the dynamics and viability of Willamette tributary
populations may increase if future regional climate warming (e.g., Eaton and Scheller 1996;
Mote et al. 2003) increases the rate of temperature-related mortality.
The migration corridors of many rivers in the Willamette River basin have been altered by
habitat degradation, hydroelectric installations, and climate change. In addition to the direct
effects of passage barriers and lost access to spawning habitat, the operation of dam and reservoir
systems for power production, recreation, and flood control can affect salmon and their
migrations. Some important indirect effects are the alteration of river flow and temperature
regimes. In many river systems, operating dams for flood control has resulted in less variable
flow regimes during migration. Depending on dam operation, water stored in reservoirs can
either warm or cool downstream reaches when it is released (Rounds 2010). In the Willamette
system, tributary dams tend to cool downstream reaches in the spring and early summer and tend
to increase water temperatures in the late summer and fall compared to the undammed system
(e.g., Rounds 2007). The physiological effects of altered water temperatures during Chinook

2
salmon migration, both below dams and in tributaries during holding and spawning, may have
negative effects on energy use and gonad development, potentially resulting in lower
reproductive fitness for these populations.
Migrating adult Chinook salmon do not feed during their upstream freshwater migration but
rely on finite energy reserves accumulated while feeding in the ocean. Adult salmon die within
days to weeks of spawning, indicating that energy stores are likely fine-tuned by past selection to
maximize reproductive output (spawning and gametes) while also providing adequate energy to
fuel upstream migration, summer holding, and spawning. The energetic costs of migration and
spawning activities in the Willamette basin may have changed as a result of altered flow and
temperature regimes, degradation of main stem and tributary habitats, and the effects of climate
change. Thus, it is possible that energy stores in returning Chinook salmon may currently be
mismatched to present conditions and possibly insufficient to allow successful spawning for
some fish.
Energy is primarily stored as lipids and energy content tends to be higher in populations
traveling greater distances or that return to higher elevations (e.g., Crossin et al. 2004b). Within
populations, there is evidence that energetic condition depends on growth conditions experienced
in the ocean prior to return migration. For example, adult sockeye salmon (O. nerka) return with
lower reserves in years following relatively poor ocean feeding conditions (Crossin et al. 2004a).
More generally, poor energetic condition at river entry (Crossin et al. 2004a; Rand et al. 2006)
and temperature regime during migration and on spawning grounds (Mann 2007; Crossin et al.
2008; Keefer et al. 2008, 2010; Mann et al. 2010) has been associated with higher probability of
prespawn mortality.
Stress from trapping and transport efforts, in combination with disease, may also contribute
to prespawn mortality (Schreck et al. 2001). The role of pathogens in prespawn mortality has
frequently been overlooked and underestimated because all salmon and most steelhead die
shortly after they spawn and there have been few attempts to document the proportion that die
prematurely. Spawning fish are severely immune compromised, and thus even those that survive
past spawning often are infected with a variety of pathogens. Therefore, infections and lesions in
adult salmon in freshwater are considered normal, and commonly post-spawned fish exhibited a
variety of infections and lesions. However, if infections become too severe, fish may succumb
days or weeks before spawning, reducing recruitment to the subsequent generation.
Release of outplanted adults to Willamette basin reservoirs downstream of traditional
outplant streams is being considered as a management alternative that may reduce exposure to
stressful temperatures and depletion of energetic stores. WVP reservoirs offer a potential
thermal refuge for adult Chinook salmon during warm summer months if adults select and hold
in cooler waters below the thermocline prior to movement into spawning tributaries. Release to
reservoirs could also reduce transport distances and handling time.
The primary goal of this study was to evaluate factors potentially associated with prespawn
mortality in adult Chinook salmon from the time they were collected at the traps through
spawning, including environmental stressors, maturation status, disease, parasites, and initial
energetic condition. Adults were collected at Dexter and Fall Creek dams in the Middle Fork

3
Willamette River basin, assessed and tagged, and released above the dams into spawning
habitats. In 2013, we began evaluating prespawn mortality in salmon outplanted to the South
Fork Santiam River and continued a feasibility study of releasing fish into Foster Reservoir.
Additionally, subsamples of adults from collected at Dexter and Foster were transported to
Oregon State University to assess holding benefits and disease prevalence (reported separately
by Schreck et al. in review). Also new in 2013 was a small-scale comparison of toxins
concentrations in carcasses of successful and unsuccessful adult Chinook salmon.
Specific objectives were to:
1) Estimate prespawn mortality rates in two populations of adult Chinook salmon outplanted
to WVP tributaries (Fall Creek and the NFMF) as part of a multi-year monitoring program
(in collaboration with ODFW).
2) Test for associations between prespawn mortality, individual adult traits evaluated at the
time of collection, and environmental conditions encountered during holding.
3) Estimate prespawn mortality rates in populations of adult Chinook salmon outplanted to
the South Fork Santiam River (in collaboration with ODFW).
4) Continue evaluating the feasibility of releasing adults in Foster Reservoir on the South
Fork Santiam River.
5) Evaluate interannual patterns in prespawn mortality.
6) Screen carcasses recovered on spawning grounds for a broad panel of known toxins and
test for associations between concentrations and spawning success.
Methods
Chinook salmon collection and tagging for this study took place at two sites in Middle Fork
Willamette River, west of Eugene, OR (Figure 1) and a third site upstream of Albany, OR. The
first site was at Fall Creek Dam on Fall Creek, a tributary of the Middle Fork of the Willamette
River. The second was at Dexter Dam on the Middle Fork of the Willamette River. Dexter Dam
regulates the outflow from Lookout Point Dam just upstream. The third location was Foster
Dam, Foster Dam Reservoir and upstream tributaries.
Middle Fork Willamette River: Study Sites and Facilities
The Fall Creek trap included a small ladder that led to a finger weir in front of a large
collection area. USACE personnel operated a mechanical sweep to crowd trapped fish and raise
them into a chute that dropped the fish into an anesthetic tank containing eugenol. The tank was
lifted using a fixed crane and placed on the ground where anesthetized fish were tagged and
assessed. Fish were then transported approximately 3 km upstream from the head of Fall Creek
Reservoir and released at rkm 505.4.
The Dexter trap was operated by Oregon Department of Fish and Wildlife (ODFW) and
sampled fish were provided by ODFW. ODFW primarily uses the Dexter facility to collect
broodstock for the Willamette Hatchery (WH) in Oakridge, OR. In 2009-2013, a fish ladder led

4
to a slot weir at the entrance to a holding raceway. At the time of sorting, fish were
mechanically crowded into an elevator which lifted them to an anesthetic tank. After fish were
sedated with CO2, they were transferred to a secondary tank with freshwater then transferred to
an anesthetic tank with MS-222 where they were assessed and tagged. Fish were transferred to a
transportation truck for recovery then transported above Lookout Point or Hills Creek dams for
release. No fish were held for late outplant at the Willamette Hatchery in 2013 because the
facility was being used to produce broodstock for the Coast Fork of the Willamette River. Only
fish above the hatchery’s broodstock quota were transported and released for natural spawning.
In 2013, we initiated outplanting into the NFMF approximately a month earlier than in previous
years. Figure 2 outlines the 2009-2013 study design.
Figure 1. Map of the Middle Fork Willamette River basin showing Chinook salmon
collection and outplant sites. Dams are numbered: 1 = Dexter Dam, 2 = Fall Creek Dam, 3 =
Lookout Point Dam, and 4 = Hills Creek Dam.

5
Figure 2. Study design for 2013. All fish tagged at Fall Creek trap were immediately
outplanted into Fall Creek. Fish collected and tagged at Dexter Dam were immediately
outplanted into the NFMF Willamette River. Additionally, a sub-sample of fish from Dexter
Dam was sent to Oregon State University after tagging and assessment.
Tagging and Assessment of Condition
Salmon were fully anesthetized prior to handling at both trap sites. Adults were anesthetized
in approximately 60 ppm eugenol at Fall Creek trap. Sampling at Dexter trap used CO2 during
initial trapping followed by MS-222 according to ODFW protocols (approximately 50 ppm with
2.5:1 NaC03 to MS222 buffer). Following tagging, fish were loaded into a truck filled with fresh
river water and transported to an upstream release site. Oxygen was monitored during
transportation with a target concentration of 10 ppm. Tagging temperature was recorded and
was generally less than 16°C because bottom-draw reservoir water was used for the anesthetic
tank and hauling truck at all sites.
While anesthetized, fish were sexed and inspected for clips or markings. A composite
condition score was recorded based on injuries, marine mammal marks, headburn, parasites, and
descaling. A score of three indicated no obvious damage or minimal healed scrapes, two
indicated minor or healed injuries with potential scarring, and one indicated open/severe wounds

6
or multiple minor injuries. Fish were PIT tagged in the dorsal sinus, near the back of the dorsal
fin in an effort to increase tag retention on scavenged carcasses. Fork lengths to the nearest 0.5
cm were taken as well as four morphological measures previously used to estimate energetic
status (Figure 3) (Mann et al. 2010). Mid-eye to hypural length was defined as the distance
along the lateral line from the middle of the eye to the end of the scales on the hypural plate on
the caudal peduncle. Hump height was the distance from the anterior origin of the dorsal fin to
the lateral line, perpendicular to the lateral line. Depth at anus was the total depth of the fish
perpendicular to the lateral line at the anal opening. Breadth at anus was the width of the fish at
the intersection of the lateral line and a theoretical line perpendicular to the lateral line at the
anus. Morphometric measurements were taken using calipers and recorded to the nearest mm.
Fish weights (to the nearest decagram) were collected using a flat table scale (Ohaus Defender
bench scale, Ohaus Corp., Pine Brook, NJ).
The percentage of lipids in the muscle tissue was used as the estimation of energy condition
because lipids are the primary energy reserve fish use during migration and spawning (Brett
1995). Lipid levels were estimated using a Distell Fatmeter (Distell Industries Ltd., West
Lothian, Scotland). The fatmeter was developed in the commercial fish industry to estimate the
percent of lipids in a trimmed fillet. The meter uses a low energy microwave sensor to estimate
water content in the muscle tissue. Based on the inverse relationship between water and lipid
levels in fish tissue (Craig et al. 1978; Higgs et al. 1979), the meter estimates the percent lipid in
Chinook salmon muscle tissue using a proprietary algorithm. We used proximate analysis of
tissues in each study year (see below) to test the accuracy of fatmeter estimates and correct for
any instrument drift among years. Four readings were taken just above the lateral line,
progressing toward the posterior of the fish and the average was recorded for each fish.
A sub-sample of 59 fish was radio-tagged prior to outplanting in the NFMF in 2013. A 3-
volt transmitter (Lotek Wireless Inc., New Market, Ontario; MCFT-3A, 43 mm × 14 mm
diameter, 11 g in air) was inserted gastrically through the mouth. A latex band was placed on
each transmitter to reduce regurgitation (Keefer et al. 2004). The purpose of radio tagging was
to verify that fish were moving upstream after release, estimate distribution during holding
(Naughton et al. 2011; Roumasset 2012), evaluate residence time and fate of reservoir-released
adults, and to determine if fish migrated into the reservoir. Additionally, the use of radio tags
aided in the collection of carcasses for prespawn mortality assessments.
Blood samples from radio-tagged fish at the Dexter trap were taken from the sub-vertebral
caudal vessel posterior to the anal fin. The blood sample was centrifuged for a minimum of four
minutes until the red blood cells separated from the plasma. The plasma was transferred to a vial
using a pipette, and immediately stored on ice. Samples were frozen as soon as possible and
transferred to OSU.

7
Figure 3. Diagram of morphometrics collected. MeH = Mid-eye to hypural length, HH =
Hump height, Da = Depth at anus, Ba = Breadth at anus.
Proximate Analysis
Fifteen additional fish were lethally sampled at the Dexter trap to estimate mean lipid,
protein, water, and ash amounts in tissues and to validate the accuracy of the fatmeter estimates
of energy condition. Processing fish entailed partitioning the fish carcass into four tissues types;
muscle, skin, viscera and gonads (e.g., Mann et al. 2010). Each of the tissues was removed as
entirely as possible from a carcass, and weighed to the nearest gram to establish the total weight
of each tissue type. Then each tissue was homogenized independently in a Cuisinart®
food
processor and a 50 gram subsample of the homogenate was taken. The samples were frozen and
later transported to Washington State University where they underwent proximate analysis.
Proximate analyses were performed using established methods. Lipid amounts were
calculated by passing volatized ether through the 50 g tissue samples which removed all ether-
soluble products including lipids. Lipids were then extracted from the ether, dried and weighed
(AOAC 1965). Ash content was calculated by combusting weighed samples at 500–600 ºC for
12 hours and reweighing (AOAC 1965; Craig et al. 1978). The percent moisture in the samples
was obtained by placing a weighed sample in a freeze drier at -40º C for 24 to 36 hours and
reweighing. Protein content was determined by subtraction (% protein =100 - % water - % fat -
% ash), as in other studies on salmon energetics (e.g., Berg et al. 1998; Hendry and Berg 1999;
Hendry et al. 2000). Carbohydrate content was assumed to be negligible. After lipid weights
were calculated for each 50 gram subsample, we calculated total lipid per tissue and total body
lipid levels. Energy density or gross somatic energy was calculated as kJ of energy per kg of fish
mass, assuming energy equivalents for fat and protein of 36.4 kJ g
-1 and 20.1 kJ
g
-1, respectively
(Brett 1995). Total energy included gonadal tissues.
Gross somatic energy density (kJ/kg) was used as a second measure of energy condition and
was calculated for the lethally sampled fish. Gross somatic energy density represents the energy
density contained within somatic tissues of the fish and is a measure of energy contained not
only in the muscle tissue, but also the viscera and skin (Crossin and Hinch 2005). Because it is
standardized by mass, it can be directly compared among individuals. Gross somatic energy
MeH
Da
HH
Ba

8
density was regressed on lipid percentage (natural log [loge] transformed) estimated by the
fatmeter (non-standardized values, see below) to examine the relationship between fatmeter
estimates and gross somatic energy density (e.g., Colt and Shearer 2001; Crossin and Hinch
2005).
We used linear regression to estimate the relationship between muscle lipid content and
fatmeter readings. The relationship was then used to estimate muscle lipid content for each
outplanted fish by inverse prediction (Sokal and Rohlf 1995) using fatmeter measurements taken
at the time of tagging. Henceforth, we refer to the corrected lipid estimates for outplanted fish as
“standardized lipid percentage”. Fatmeter readings from 2013 were also collected from fish
tagged at Willamette Falls (see Jepson et al. 2013) and compared with readings from fish tagged
at Fall Creek and the Dexter Dam trap. We evaluated the relationships between lipid values of
fish collected for proximate analysis and morphometrics using multiple regression.
Temperature Monitoring
Temperature recorders were installed in 2013 at four sites in Fall Creek and four in the
NFMF. In Fall Creek, loggers were located at the release site (rkm 505.4), the bridge near
Johnny Creek (rkm 513.0), near the mouth of Portland Creek (rkm 516.5), and at the unnamed
falls that act as a fish barrier (rkm 529.6) (Appendix Figure 1). In the NFMF Willamette River,
loggers were placed at the release site (rkm 557.9), below the bridge near Kiahanie campground
(rkm 565.4), at the forest road 1944 bridge (rkm 572.5), and above Skookum Creek (rkm 585.9)
(Appendix Figure 2). Depth of temperature loggers ranged from approximately 0.5-1.5 m.
Temperatures were logged at 15 minute intervals from mid-May to mid-October. Note river
kilometers are measured from the mouth of the Columbia River.
We used IBT submersible temperature loggers (Embedded Data Systems, LLC,
Lawrenceburg, KY; 17.35×5.89 mm, 3.3g in air) to record internal temperatures on a subsample
of radio-tagged fish. The tags were waterproofed (Plasti Dip multipurpose rubber coating; Plasti
Dip International, Blaine, Minnesota, see Donaldson et al. 2009) and attached to the bottom of
the radio tags with electrical tape then inserted gastrically. The temperature recorders were
recovered during carcass surveys and were downloaded.
Spawning Ground Surveys and Spawning Success
After transport to release sites above the dams, salmon were allowed to spawn naturally and
spawning areas were monitored to collect carcasses and assess spawning success. Carcass
surveys were conducted by both UI and ODFW on a regular basis from the beginning of releases
through the spawning period (June through early October). Fish encountered during spawning
ground surveys were inspected by UI and/or ODFW personnel for radio and PIT tags. When the
carcass of an individual from this study was located, it was inspected to determine spawning
status and its general condition was noted (how recently it died, obvious wounds, fungus levels,
or other apparent visual cues that caused mortality). In addition, otoliths and scales were

9
collected from non-marked fish. If a fish had recently died (gills were red or pink), the fish was
transported on ice to OSU, and tissue samples were collected for histology.
In 2013 spawning success was assessed by inspecting the gonads of females and estimating
the proportion of gametes remaining to the nearest 25%. A successfully spawned fish was
defined as having less than 25% of gametes remaining in the body cavity (Pinson 2005).
Prespawn mortality rates were calculated separately for males and females because the
proportion of remaining gametes could not be reliably estimated in males and in some carcasses
that had been scavenged. Males that died prior to spawning (based on the date the first redd was
counted) were considered prespawn mortalities. Statistical analyses only examined female PSM
rate.
Multi-year summary
We performed several statistical analyses to test for associations between prespawn mortality
and a suite of potential causative factors for both Fall Creek and the NFMF fish across study
years. We used logistic regression and multi-model selection techniques (Burnham and
Anderson 2002) and compared fit using Aaike Information Criteria (AIC). Predictor variables
included year, tag date, condition, fatmeter percent, Fulton’s K (K = (105*weight/FL
3), fork
length(FL), weight, mid-eye-to-hyperal (MeH), depth at anus (Da), breadth at anus (Ba) and
hump height (HH). We also calculated standardized morphometric measurements for the four
morphometric parameters (StdMeH, StdDA, StdBA, StdHH) to control for differences in body
size by dividing each estimate by fork length.
The model set included all univariate models plus eighteen multiple logistic regression
models with adult fate (spawned, prespawn mortality) as the dependent variable. The full
logistic regression model was:
Prespawn mortality (y/n) = + year + tagdate + condition + fatmeter + Fulton’s K + FL + weight +
StdMeH + StdDA + StdBA + StdHH.
In addition, to statistical analyses we summarized prespawn mortality rates across study
years and streams. We also compared prespawn mortality rates among PIT, radio-tagged, and
unmarked fish.
Methods: South Santiam River
Adult Chinook salmon were collected and tagged at the Foster Dam trap on the South Santiam
River from 13 June to 4 September 2013. The trap was operated by ODFW and sampled fish
were provided as part of routine trap operations. The Foster trap consists of a ladder, a collection
area and a mechanical sweep to crowd fish. ODFW personnel sorted fish and transferred fish
into an anesthetic tank where they were anesthetized with CO2 before transfer to a secondary
tank containing MS-222. Tagging, handling, and proximate analysis methods were similar to
those reported above for salmon trapped at Dexter. Salmon were released in Foster Reservoir

10
near the Calkins boat launch (rkm 421.7; measured from mouth of the Columbia River) and in
the South Fork Santiam River at River Bend (rkm 428.3) and Gordon Road (rkm 444.7).
Methods: Toxicology sampling
In 2013, we also collected tissue samples from female spring Chinook salmon carcasses in
Fall Creek, the NFMF and the South Fork of the Santiam River to estimate the concentrations of
toxins. The primary goal was to screen samples for a broad spectrum of metals (~25 elements)
and organic toxins (~100 compounds) to identify potential toxins of concern, while also testing
for differences in adults that were either prespawn mortalities or successful spawners. We
focused on radio or PIT-tagged fish but unmarked fish were also collected. After determining
spawning status, we removed a 2.5×2.5 cm (one inch) square of muscle and skin tissue from the
belly about 2.5 cm anterior to the pelvic fin on the left side of the fish. The sample was then
placed in a labeled 60 ml amber glass jar. Samples were placed in a freezer at the end of each
day then transferred to the University of California, Davis for toxicological screening at the end
of the field season using previously described methods (e.g., Greenfield et al. 2008, Hwang et al.
2009a, 2009b, McGourty, et al. 2009). To date, three metals (Cd, Pb, and Ni) have been fully
analyzed. We tested for differences in mean concentrations of Cd, Pb, and Ni using individual
two-way ANOVAs using the model: Concentration = Site + Spawned
Two samples from Fall Creek were not included in the model. Preliminary models indicated
no evidence of a Site X Spawned interaction (P => 0.207) and were dropped.
Results: Middle Fork Willamette River
Fall Creek
Tagging occurred from 16 May to 26 August, 2013. A total of 96 fish (46 females, 50 males)
were PIT tagged (Figure 4). Tagging was representative of the overall timing of the run, which
peaked in early June followed by another peak in late-July (Figure 4). All fish transported above
the dam were non-adipose clipped fish. The mean condition score in 2013 was 2.5, mean fork
length was 70.3 cm, mean weight was 3.9 kg, and mean lipid percentage was 5.2% (Table 1).

11
Figure 4. Numbers of adult Chinook salmon tagged in 2013. Top panel: distributions of
Chinook salmon that were (open bars) and were not (black bars) tagged at Fall Creek trap. Fall
Creek fish were immediately outplanted above Fall Creek Dam and Reservoir. Bottom panel:
distributions of Chinook salmon collected and tagged at Dexter Dam and immediately outplanted
to the NFMF on the date of tagging (gray bars).
Table 1. Adult Chinook salmon size, lipid content, and condition metrics for fish sampled at
Fall Creek trap in 2013. MeH = Mid-eye to hypural length, Da = Depth at anus, Ba = Breadth at
anus, HH = Hump height, % Lipid = Standardized % lipid in muscle tissue, wet weight.
Fall Creek (n = 96)
Fork Length
(cm) Weight
(kg) MeH
(cm) Da
(cm) Ba
(cm) HH
(cm) % Lipid Condition
Score
Mean 70.3 3.87 59.6 11.3 6 7.8 5.2 2.5
St. Deviation 6.8 1.7 6.0 1.3 1.0 0.9 3.0 0.7
Max 94 9.65 81 16 9.3 10.3 12.7 3
Min 57 2.1 49 9.1 4.1 5.5 0.5 1
Num
be
r o
f fish
0
20
40
60
80
Date
01-Apr 01-May 01-Jun 01-Jul 01-Aug 01-Sep 01-Oct 01-Nov
0
20
40
60
80

12
Individual lipid concentrations as estimated with the Fatmeter during 2013 were positively
correlated with the values estimated from proximate analysis taken from lethally sampled adults
(adj. r2 = 0.680, P = <0.001, n = 15 see Proximate Analysis section below). Mean lipid content
of tagged adults arriving to Fall Creek trap early in the run were similar to those estimated for
adults at Willamette Falls (Figure 5) and decreased through the 2013 season (Figure 6). This
seasonal decline was similar to results in previous years.
Figure 5. Weekly distributions of fatmeter estimates for Chinook salmon tagged at Fall
Creek trap in 2013. Box plots represent median (solid line), 25th
and 75th
percentiles (ends of
boxes), 10th
and 90th
percentiles (whiskers), and 5th
and 95th
percentiles (solid circles). Sample
size for each date given below each box. First box on left shows data for Chinook salmon
sampled at Willamette Falls Dam (WFALLS) from Jepson et al. (2014).
Tag week
WFA
LLS
May
13
May
20
May
27
June
03
June
10
June
17
June
24
July 0
1
July 0
8
July 1
5
July 2
2
July 2
9
Aug
05
Aug
12
Aug
19
Aug
26
Fa
tme
ter
pe
rce
nt
0
2
4
6
8
10
12
14
5 18 11 3 0 210 10 8 4 0 0300 014 0 0

13
Figure 6. Fatmeter percentages for all fish tagged at arrival at Fall Creek Dam in 2013.
North Fork Middle Fork Willamette River
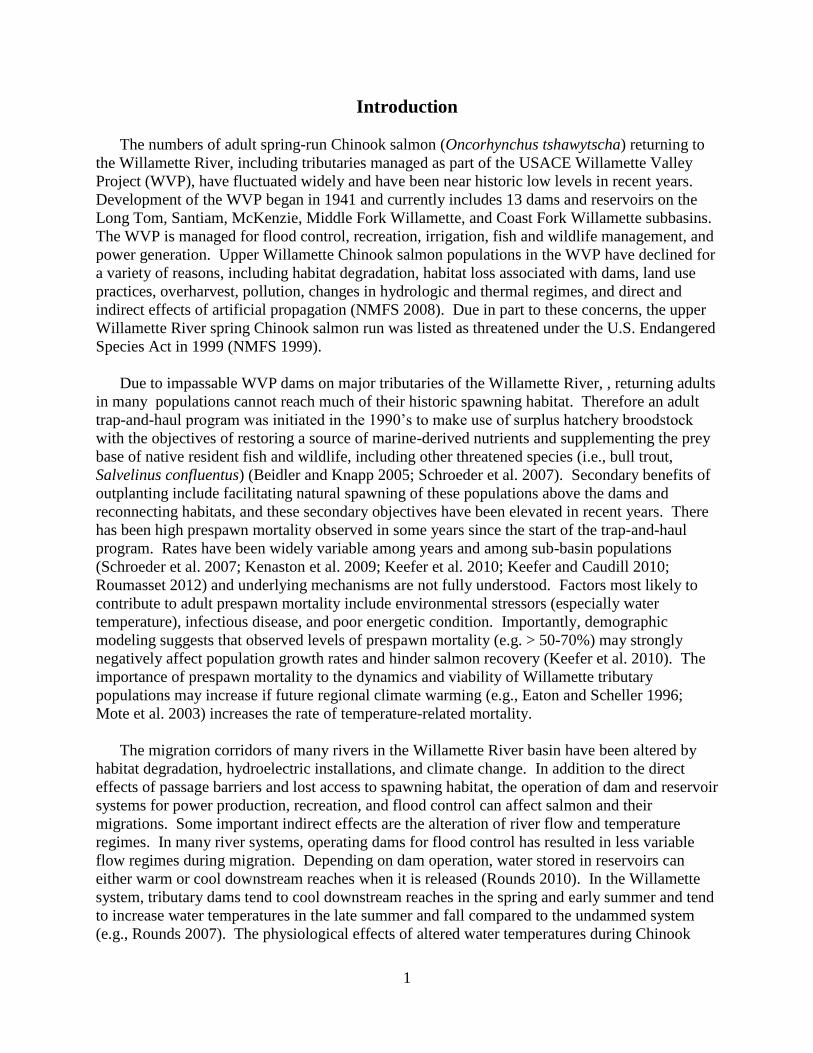
In 2013, we initiated outplanting into the NFMF approximately a month earlier than in
previous years in an attempt to reduce the residence time of adults in the Dexter Dam tailrace.
Tagging began on 22 May and continued until 17 July (Figure 6). This group included 165 fish
(75 females, 90 males), and had mean length of 74.3 cm, mean weight of 4.7 kg, mean condition
score of 2.4, and mean standardized lipid percentage of 2.8% (Table 2). Mean fatmeter readings
from fish tagged at the Dexter Dam trap were lower than those for fish tagged at Willamette
Falls and decreased across the eight tagging events (Figure 7).
Month
May June July Aug Sep
Fa
tme
ter
pe
rce
nt
-2
0
2
4
6
8
10
12
14
Y = --0.082X + 19.11
r2 = 0.4771
P <0.0001
14
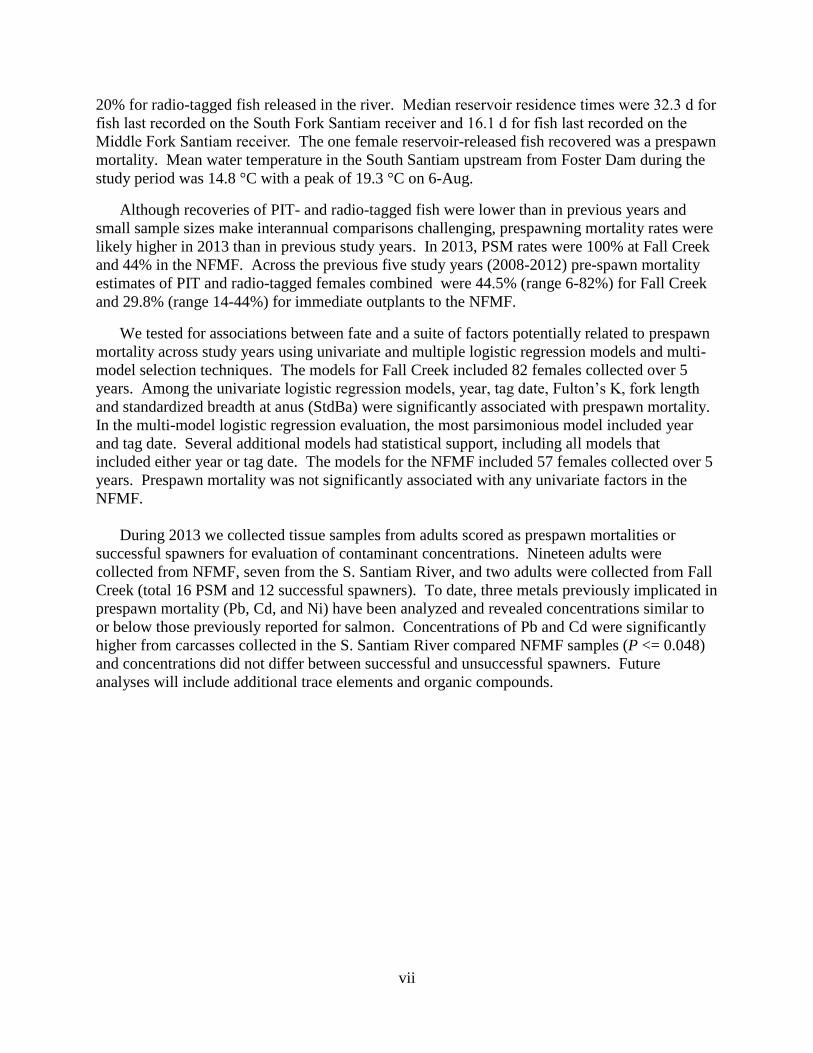
Table 2. Adult Chinook salmon size, lipid content, and condition metrics for fish collected
and sampled at Dexter trap and then immediately outplanted in 2013. MeH = Mid-eye to
hypural length, Da = Depth at anus, Ba = Breadth at anus, HH = Hump height, % Lipid =
Standardized % lipid in muscle tissue, wet weight.
Dexter (n = 165)
Fork Length
(cm) Weight
(kg) MeH
(cm) Da
(cm) Ba
(cm) HH
(cm) %
Lipid Condition
Score
Mean 74.3 4.7 62.6 11.4 6 7.8 2.8 2.4
St. Deviation 7.0 1.4 6.2 1.5 0.8 1.0 1.4 0.7
Max 90.5 8.6 78.5 19.5 8.1 10.5 7.1 3
Min 57 2.1 47 8.1 4 4.4 0.6 1
Tag date
WFal
ls
May
22
May
29
June
5
June
19
June
26
July 2
July 1
0
July 1
7
Fa
tme
ter
pe
rce
nt
0
2
4
6
8
10
12
14
300 25 23 16 19 19 16 21 26
Figure 7. Weekly distributions of fatmeter results for Chinook salmon tagged at Dexter trap
in 2013. Box plots represent median (solid line), 25th
and 75th
percentiles (ends of boxes), 10th
and 90th
percentiles (whiskers), and 5th
and 95th
percentiles (solid circles). First box on left
shows data for Chinook salmon sampled at Willamette Falls Dam (WFALLS) from Jepson et al.
(2014).

15
Proximate Analysis
In 2013, proximate analysis was performed on 15 salmon collected at Dexter (8 males and 7
females). No fish were sampled from Fall Creek (Table 3) because of concerns over lethally
sampling unclipped (presumed natural origin) adults from this location. Lethal takes for
proximate analysis were conducted on 29 May (n = 5), 12 July (n = 3), and 6 August (n = 7).
The average muscle lipid level was 6.2% (Table 4) and ranged from 3-12%. Females had
gonadal lipid compositions of 10.6%, while males were 1.0%, on average (Table 4).
Table 3. Mean tissue composition of Chinook salmon collected at Dexter and
used in proximate analysis in 2013.
Tissue % Moisture % Crude Lipid % Total Ash % Protein
Gonads 71.6 5.5 2.1 20.9
Muscle 73.5 6.2 1.1 19.2
Skin 63.0 8.6 1.0 27.3
Viscera 76.9 4.1 1.6 17.4
Table 4. Tissue composition of Chinook salmon used in proximate analysis by sex.
Fatmeter readings were taken on proximate analysis fish at the time of trapping to
simultaneously assess the accuracy of the fatmeter readings and provide regression equations to
calculate standardized values across years. Preliminary multiple regression models provided no
evidence of a difference between sexes in the relationship between uncorrected fatmeter and
proximate analysis lipid estimates (P > 0.1 in all years), but did suggest differences in the
relationship among years (P < 0.05). Consequently, we performed regression analyses for each
year with combined sexes. In all years the relationship was positive. However, the significance
and strength of the relationship varied among years (Table 5).
Tissue % Moisture % Crude Fat % Total Ash % Protein
Males (n = 8)
Gonads 80.8 1.0 2.6 15.6
Muscle 72.7 6.7 1.1 19.5
Skin 61.8 9.9 1.0 27.3
Viscera 77.3 3.0 1.6 18.1
Females (n = 7)
Gonads 61.0 10.6 1.5 26.9
Muscle 74.5 5.6 1.1 18.8
Skin 64.5 7.1 1.0 27.4
Viscera 76.6 5.0 1.7 16.7

16
Table 5. Linear regression results that show the relationships between
fatmeter percentages (FM) and percent lipid in wet weight muscle tissue calculated
in proximate analysis (PA) for combined males and females. These equations
were used to obtain standardized fatmeter estimates for individual adults.
Year n Intercept Slope P adj r2
2013 15 -1.348 0.726 <0.001 0.68
2012 15 0.523 0.5137 0.408 0.61
2011 15 1.854 0.46 0.072 0.17
2010 30 0.703 0.413 <0.001 0.65
2009 29 3.097 0.758 <0.001 0.38
2008 11 3.738 0.387 0.090 0.21
We also tested whether the fatmeter provided accurate estimates of total energy in all body
compartments combined (muscle, skin, and viscera). Specifically, we estimated whole-body
somatic energy density (kJ/kg) using tissue samples, which standardized energy content for
differences in fish size. Although the relationship was weak, we found a positive relationship
between fatmeter readings and energy density in 2013 (Figure 8). Overall the results suggest that
the fatmeter provides a non-lethal method to estimate a relative index of lipid reserves and
energy content among individuals within years, but may not provide adequate precision to
predict absolute values for individual adult Chinook salmon lipid or energy content.
Figure 8. Relationship between Chinook salmon energy density (kJ/kg) estimated using
proximate analysis and arcsine square root transformed raw fatmeter percentages, 2013.
Arcsin (fatmeter percentage)
0.6 0.8 1.0 1.2 1.4 1.6 1.8 2.0
Gro
ss s
om
atic e
nerg
y (
kJ/k
g)
8000
10000
12000
14000
16000
18000
20000
22000
24000
26000
28000
y = 6412.2x + 8644.5
r2 = 0.204
P = 0.0907

17
River Conditions
The 2013 migration season was characterized low base flow during the early spawning
period and by high flows due to record rainfalls in September (Figure 9). Water temperatures
were near average throughout the monitoring period (Figure 10). The average water temperature
at Fall Creek during the 2013 study period was 15.7 °C with a peak of 20.8 °C in late July
(Figure 11). These temperatures were favorable for Chinook salmon holding as they were within
the thermal preferendum of this species and were 3-4°C lower than incipient lethal temperatures
(Orsi 1971; Coutant 1977; Jobling 1981; Richter and Kolmes 2005). Overall, water temperatures
in Fall Creek were cooler in 2011 and 2013 than in 2009 and 2010. Temperatures increased at
downstream locations and were highest at the release site in all study year (2009-2013). Mean
daily temperatures in 2008 were < 19°C at a single site monitored by the USFS (Mann et al.
2010).
Date
Jul Aug Sep Oct Nov
Flo
w (
cfs
)
0
500
1000
1500
2000
2500
2013
2012
2011
Figure 9. Mean daily discharge (cfs) at Fall Creek 2011-2013. Data is from the USGS Fall
Creek gage below Winberry Creek.

18
Figure 10. Mean daily water temperatures in Fall Creek in 2009-2013 near the release site
(rkm 505.4).
Date
Jun Jul Aug Sep Oct
Tem
peatu
re (
C)
5
10
15
20
25
2009
2010
2011
2012
2013

19
Date
01-Jun 01-Jul 01-Aug 01-Sep 01-Oct
Te
mp
era
ture
(C
)
0
5
10
15
20
25
Fall Creek Release
Portland Creek
Figure 11. Daily mean water temperatures in 2013 at two sites in Fall Creek. The loggers
represent a progression upstream from the release site (rkm 505.4) to the fish barrier (rkm 529.6).
Data loggers deployed at Johnny Creek and the barrier falls were damaged or malfunctioned.
Water temperatures in the NFMF in 2013 were similar to previous study years (Figure 12).
In the NFMF, daily means did not exceed 15°C at the release site during the monitoring period in
2013 and ranged from 8.1 to 14.8 °C from June through mid-October (Figure 12). NFMF
temperatures were generally near or below the Chinook salmon thermal preferendum.
Temperatures generally were higher at downstream locations in all years (Figure 13).
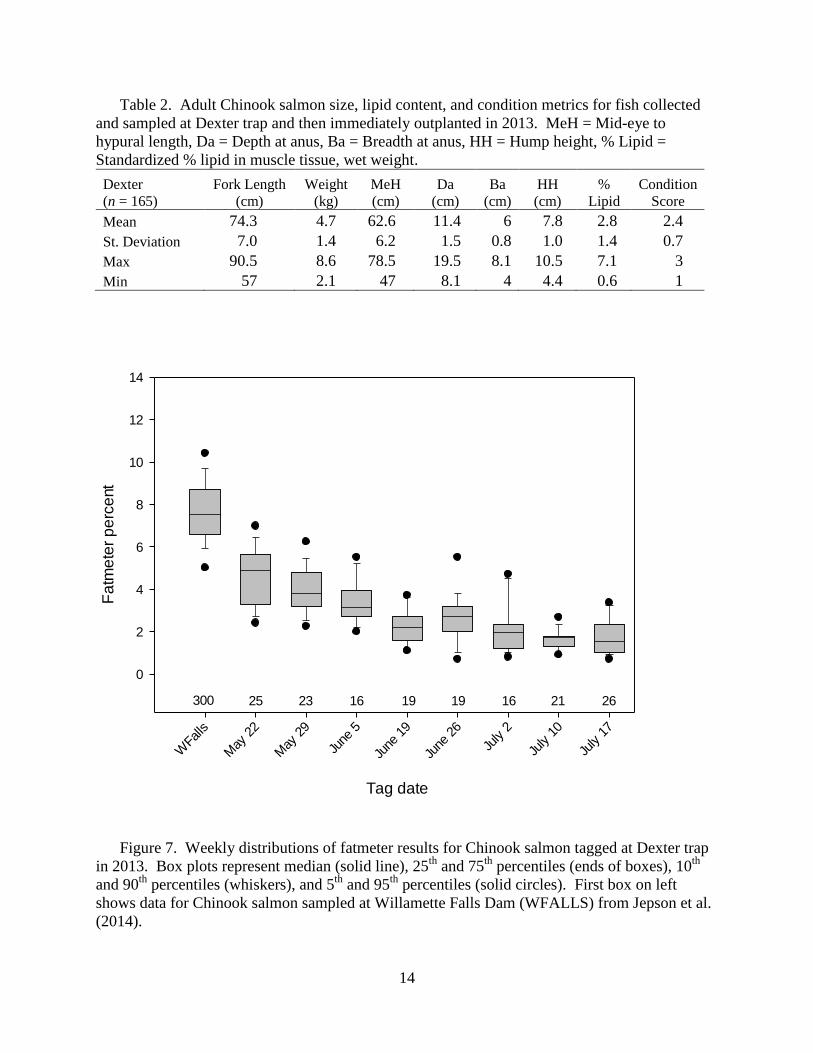
Although the release sites at Fall Creek and the NFMF Willamette were located 16.5 miles
from each other, the NFMF was consistently cooler than Fall Creek due to differences in
elevation and watershed characteristics (Figure 14). Mean water temperature in the NFMF
during the 2013 study period was 11.7 °C with a peak of 14.8 °C in early July. Daily mean river
temperatures in the NFMF averaged about 3.0 °C lower than in Fall Creek at the release sites
throughout the monitoring period and about 4.0 °C lower during the July and August holding
period.

20
Figure 12. Comparison of mean daily water temperatures collected in the NFMF in 2009-
2013 near the release site (rkm 557.9).
Figure 13. Daily mean water temperatures in 2013 at four NFMF sites. The loggers
represent a progression upstream from the release site (rkm 557.9) to Skookum Creek (rkm
585.9). Data gaps at the release site resulted from lost/stolen loggers.
Date
Jun Jul Aug Sep Oct
Te
mp
ea
ture
(C
)
0
5
10
15
20
2009
2010
2011
2012
2013
Date
01-Jun 01-Jul 01-Aug 01-Sep 01-Oct
Te
mp
era
ture
(C
)
0
5
10
15
20
25
NFMF Release
Kiahanie Bridge
1944 Bridge
Skookum Creek
21
Figure 14. Daily mean water temperatures in Fall Creek and the NFMF Willamette River in
2013. Solid line at 20 °C represents temperature considered to be physiologically stressful for
adult salmonids.
Spawning Ground Surveys and Spawning Success: Fall Creek
Carcasses were recovered in Fall Creek from 9 July until 12 October with the first redd
observed on 19-September. The recovery rate was 4.2% (4 out of 96 fish) of the PIT-tagged fish.
We recovered a higher proportion of unmarked fish in 2013 (8.4%) than PIT -tagged fish (Table
7). The 2013 prespawn mortality estimates in 2013 were the highest in the 2008-2013 period for
Fall Creek (Table 7). The prespawn mortality estimate was 100% (13 of 13 females recovered)
for untagged carcasses and 100% (2 of 2 females) for PIT-tagged fish (Table 6).
Date
01-Jun 01-Jul 01-Aug 01-Sep 01-Oct
Te
mp
era
ture
(C
)
0
5
10
15
20
25
Fall Creek Release
Fall Johnny Creek
Fall Portland Creek
Fall Fish Barrier
NFMF Release
NFMF Kiahanie Bridge
NFMF 1944 Bridge
NFMF Skookum Creek

22
Table 6. Recovery rates and final estimated fates of Chinook salmon that were PIT-tagged or
double-tagged (PIT and radio-tagged) and unmarked fish in Fall Creek, 2008-2013.
Prespawning mortality (PSM) rates were only calculated for females.
The final distribution of PIT-tagged fish indicated that the majority of spawning occurred
15-25 km upstream from the release site (Figure 15). Each of the two PIT-tagged prespawn
mortalities was recovered between Portland Creek and the barrier falls.
Year
Group
# released
# recovered
% recovered
Females
# recovered
Females
%PSM
2008 PIT 188 30 16 0 N/A
Double 7 1 14 0 N/A
Unmarked N/A 19 N/A 0 N/A
2009 PIT 175 22 13 10 80
Double 25 11 44 6 100
Unmarked N/A 66 N/A 15 87
2010 PIT 124 30 24 12 42
Double 75 32 43 15 73
Unmarked N/A 148 N/A 46 43
2011 PIT 125 27 22 12 17
Double 75 22 29 9 44
Unmarked 128 33 26 13 54
2012 PIT 78 20 26 11 0
Double 40 11 28 5 20
Unmarked 192 67 35 28 18
2013 PIT 96 4 4.2 2 100
Unmarked 371 31 8.4 13 100

23
Figure 15. Distribution of PIT-tagged and untagged female Chinook salmon carcasses that
were recovered in Fall Creek spawning ground surveys in 2013, including their spawning status.
Spawning Ground Surveys and Spawning Success: NFMF
Carcasses were recovered in the NFMF from 5 June to 8 October from two groups of tagged
adults. The recovery rate was 10.4% for adults tagged only with at PIT-tag and released
immediately (Table 7), a proportion similar to the recovery rate for radio-tagged adults (10.2%).
Approximately 17% of the unmarked fish released in the NFMF were recovered on the spawning
grounds.
The prespawning mortality rates in 2013 were 50% (3 of 6 females recovered) for PIT-tagged
fish and 33% (1 of 3 females recovered) for radio-tagged fish (Table 8). The prespawn mortality
rate for unmarked fish was approximately 29% (Table 7).
Rkm
490 500 510 520 530 540
PS
M
yes
no
Reserv
oir
Receiv
er
Rele
ase s
ite
Johnny
Cre
ek
Port
land C
reek
Barr
ier
falls
1828 B
ridge

24
Table 7. Final fates of PIT-and radio-tagged and unmarked subsets of the Chinook salmon
outplanted in the NFMF Willamette River in 2009-2013. Prespawning mortality (PSM) rates
were only calculated for females. DEX = fish tagged at the Dexter Dam trap and immediately
outplanted into the NFMF Willamette River. HH = fish held at the Willamette Hatchery then
later outplanted into the NFMF Willamette River.
Year
Group
# released
# recovered
% recovered
Females
#recovered
Females
%PSM
2009 (DEX) PIT 124 6 5 3 0
Double 12 3 25 1 100
Unmarked N/A 66 N/A 19 47
2009 (HH) PIT 103 1 1 1 0
2010 (DEX) PIT 148 30 20 15 47
Double 43 8 18 3 67
Unmarked N/A 266 N/A 102 64
2010 (HH) PIT 81 8 10 7 0
Double 18 7 39 6 33
2011 (DEX) PIT 109 7 6 5 0
Double 71 11 15 5 60
Unmarked 1,366 186 14 98 38
2011 (HH) PIT 79 8 10 5 40
2012 (DEX) PIT 104 14 13 10 10
Double 50 11 22 6 17
Unmarked 2,441 387 16 192 23
2012 (HH) PIT 71 17 24 10 10
2013 PIT 106 11 10.4 6 50
Double 59 6 10.2 3 33.3
Unmarked 2031 336 16.5 153 28.8
In the NFMF, spawning activity was concentrated in a 10 km reach just upstream from the
release site (Figure 16), a pattern similar to spawning distributions observed in previous years
(Mann et al. 2011; Naughton et al. 2011). A total of 177 redds were counted in 2013 and all
were upstream from the release site.

25
Figure 16. Distribution of PIT- and radio-tagged female Chinook salmon carcasses that were
recovered in the NFMF Willamette River spawning ground surveys in 2013, by their spawning
status.
In 2013, we initiated outplanting into the NFMF approximately a month earlier than in
previous years. Few tagged carcasses were recovered prior to flooding. Only one female from
the early release group was recovered and it was a prespawn mortality. A total of 6 females from
the standard release group were recovered and three (50%) were prespawn mortalities.
Table 8. Prespawn mortality (PSM) percentages for two groups of spring Chinook salmon
tagged at the Dexter trap and released in in the NFMF in 2013.
Release Number Number Percent Females Percent
Date Released Recovered Recovered Recovered PSM PSM
22May-5June 64 6 9.4 3 1 33
19Jun-17Jul 101 11 10.9 6 3 50
Multi-year Summary
We tested for associations between fate and a suite of factors potentially related to prespawn
mortality across study years using univariate and multiple logistic regression models and multi-
model selection techniques. The models for Fall Creek included 82 females over 5 years.
Rkm
520 530 540 550 560 570 580 590
PS
M
yes
no
Mouth
Rele
ase s
ite
Kia
hanie
CG
Skookum
Cre
ek
1944B
ridge

26
Among the univariate logistic regression models, year, tag date, Fulton’s K, fork length and
standardized breadth at anus (StdBa) were significantly (P < 0.05) associated with prespawn
mortality (Table 9). In the multi-model logistic regression evaluation, the most parsimonious
model included year and tag date (Table 9). The tag date effect reflected higher prespawn
mortality among earlier migrants, on average, while the year effect indicated higher prespawn
mortality in the early study years. Several additional models had statistical support, with ΔAIC
< 4.0. All but one model that included either year or tag date were significant. These models
included various combinations of condition, fork length, Fulton’s K, weight and shape. That
multiple models produced similar results was not surprising given the inter-correlations among
predictor variables.
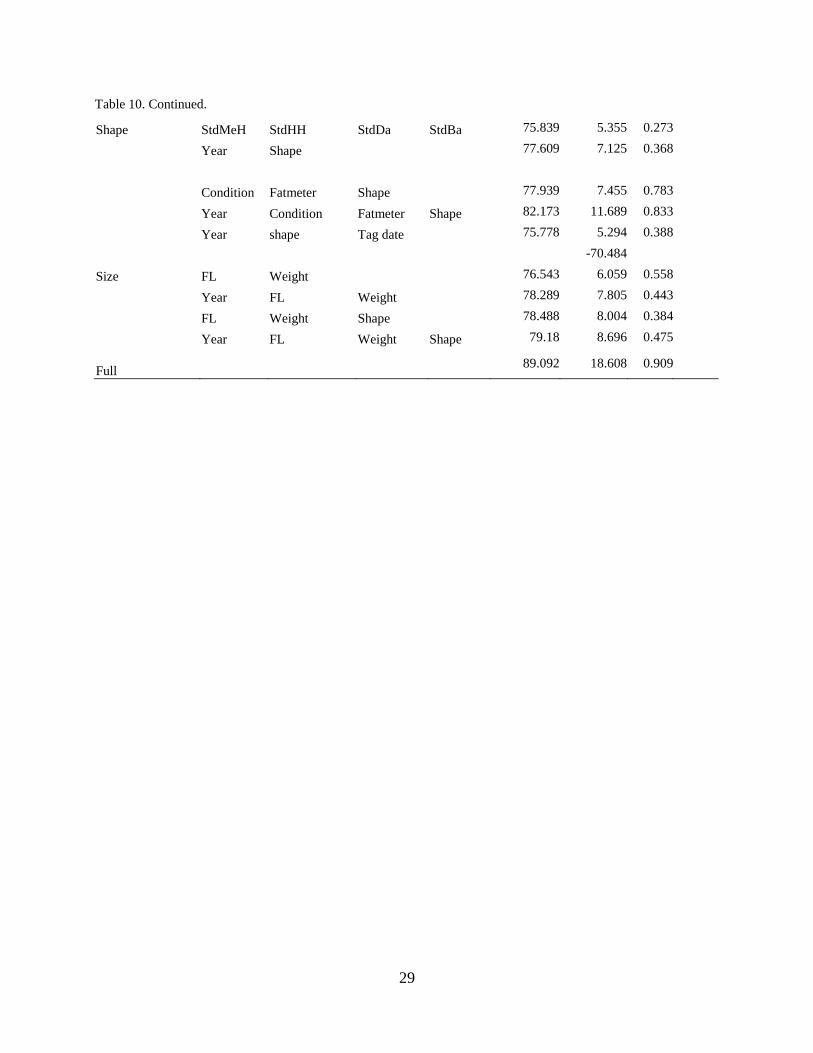
The models for the NFMF included 57 females over 5 years. Prespawn mortality was not
significantly associated with any univariate predictors (all model P ≥ 0.127), although the
fatmeter-only model was the most parsimonious among all models tested (Table 10). In the
multivariate models, year plus tag date was the model with the lowest P value (P = 0.115) and
was the most parsimonious (Table 9).
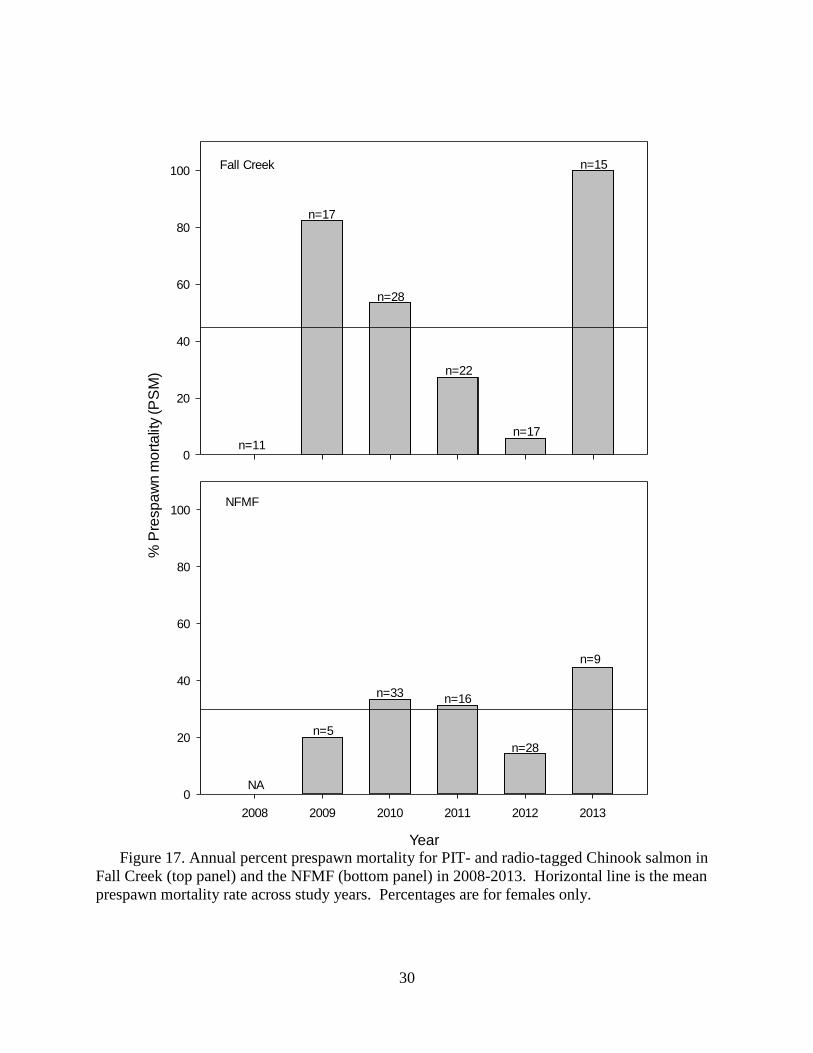
Overall, prespawn mortality rates for PIT and radio-tagged female Chinook salmon were
highly variable in Fall Creek ranging from about 6% in 2012 to 100% in 2013 (Figure 17).
Prespawn mortality rates for PIT and radio-tagged females combined in the NFMF were also
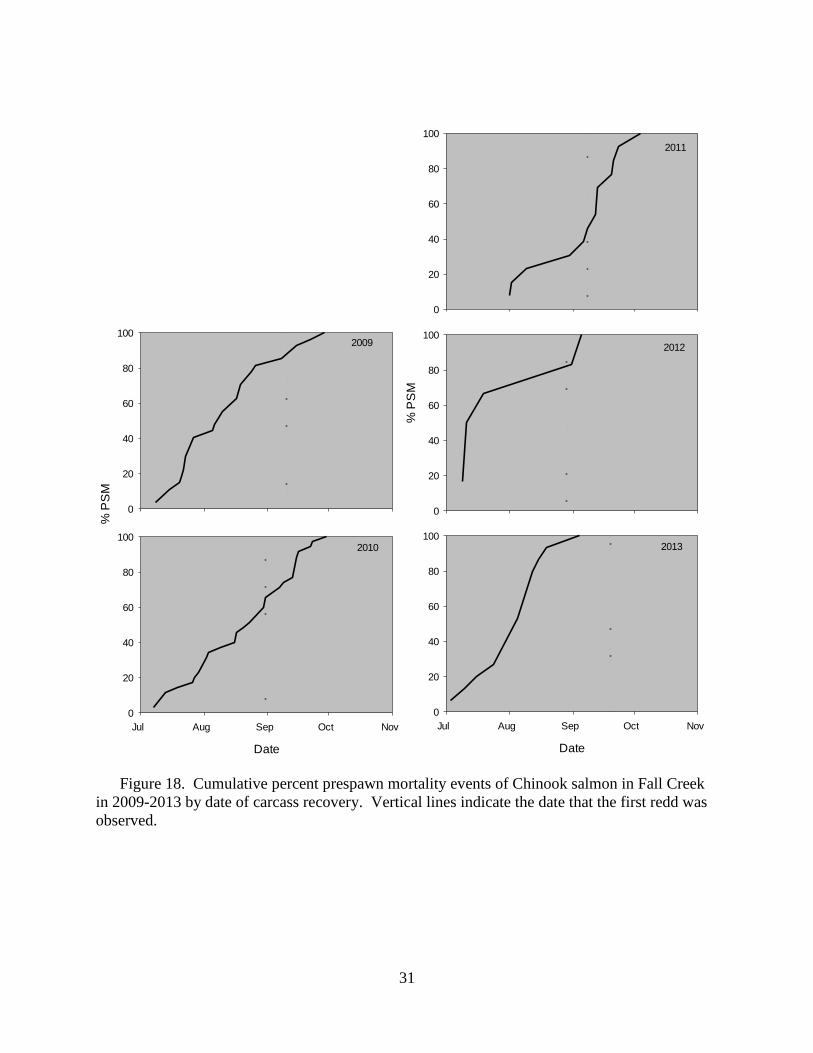
highest in 2013 (44%; Figure 17) versus 14-33% in previous years. In most years, a majority of
prespawn mortalities occurred prior to the first redd count in each stream (Figures 18 and 19).
Prespawn mortality rates were higher for PIT and radio-tagged fish in Fall Creek compared to
untagged fish in 2009 and 2010 but rates were similar for tagged and untagged groups in 2011-
2013 (Figure 20). In the NFMF, there were no consistent year-to-year patterns in prespawn
mortality rates among untagged, PIT-tagged or radio-tagged groups (Figure 21).
Table 9. Selection statistics for logistic regression models of prespawn mortality in Fall
Creek from 2008-2013 that included a variety of predictor variables and mortality as the
dependent variable. AIC = Akaike information criteria, ΔAIC = AICcurrent-AICbest. Models in
shaded grey had statistical support (ΔAIC < 4 in multivariate model, P < 0.05 in univariate
models), and the model in bold text was most parsimonious. Variable definitions: Condition =
overall physical condition; TagDate = release date; Fatmeter = fatmeter percentage; StdMeH =
standardized mideye to hypural length; StdHH = standardized hump height; StdDa =
standardized depth at anus; StdBa = standardized breadth at anus; FL = fork length; Weight, and
K = Fulton’s K (105*weight/L
3).
Model type
Univariate Variables
AIC ΔAIC P-value
Timing Year
91.761 3.22 0.002
Tag Date
100.159 11.618 <0.001

27
Table 9. Continued
Condition Condition
118.899 30.358 0.796
Fatmeter
112.54 23.999 0.080
Fulton's K
112.045 23.504 0.036
Shape StdMeH
116.088 27.547 0.307
StdHH
115.765 27.224 0.233
StdDA
117.064 28.523 0.680
StdBA
111.478 22.937 0.025
Size FL
111.748 14.286 0.028
Weight
115.127 17.665 0.157
Multivariate Variables
Timing Year Tag Date
88.541 0 0.001
Condition Condition Fatmeter
116.49 27.949 0.241
Year Condition Fatmeter
95.056 6.515 0.029
Condition Fatmeter K
114.74 26.199 0.228
Year Condition Fatmeter K 95.691 7.15 0.042
Condition Fatmeter tagdate 102.377 13.836 0.020
Year Fatmeter tagdate K 91.852 3.311 0.007
Shape StdMeH StdHH StdDA StdBA 118.856 30.315 0.393
Year Shape
95.925 7.384 0.027
Condition Fatmeter Shape
119.714 31.173 0.523
Year Condition Fatmeter Shape 99.987 11.446 0.180
Shape Tag date
101.779 13.238 0.008
Year shape Tag date
93.408 4.867 0.036
Size FL Weight
111.376 22.835 0.043
Year FL Weight
91.032 2.491 0.009
FL Weight Shape
113.364 24.823 0.155
Year FL Weight Shape 96.937 8.396 0.086
Full
101.934 13.393 0.586

28
Table 10. Selection statistics for logistic regression models of prespawn mortality in NFMF
from 2009-2013 that included a variety of predictor variables and mortality as the dependent
variable . AIC = Akaike information criteria, ΔAIC = AICcurrent-AICbest. Models in shaded grey
had statistical support (ΔAIC < 4 in multivariate model, P < 0.05 in univariate models), and the
model in bold text was most parsimonious. Variable definitions: Condition = overall physical
condition; TagDate = release date; Fatmeter = fatmeter percentage; StdMeH = standardized
mideye to hypural length; StdHH = standardized hump height; StdDa = standardized depth at
anus; StdBa = standardized breadth at anus; FL = fork length; Weight, and K = Fulton’s K
(105*weight/L
3).
Model type
Univariate Variables
AIC ΔAIC P-value
Timing Year
76.091 5.607 0.248
Tag date
76.025 5.541 0.466
Condition
77.904 7.420 0.720
Fatmeter
71.113 0.629 0.635
Fulton's K
73.288 2.804 0.127
Shape StdMeH
75.721 5.237 0.883
StdHH
74.513 4.029 0.277
StdDA
75.742 5.258 0.985
StdBA
75.567 5.083 0.678
Size FL
76.421 5.937 0.706
Weight
75.742 5.258 0.974
Multivariate
Timing Year Tag date
70.484 0.000 0.115
Condition Condition Fatmeter
74.808 4.324 0.916
Year Condition Fatmeter
79.527 9.043 0.836
Condition Fatmeter K
75.254 4.770 0.895
Year Condition Fatmeter K 80.232 9.748 0.885
Condition Fatmeter Tag date 76.699 6.215 0.961
Year Fatmeter Tag date K 73.655 3.171 0.482
29
Table 10. Continued.
Shape StdMeH StdHH StdDa StdBa 75.839 5.355 0.273
Year Shape
77.609 7.125 0.368
Condition Fatmeter Shape
77.939 7.455 0.783
Year Condition Fatmeter Shape 82.173 11.689 0.833
Year shape Tag date 75.778 5.294 0.388
-70.484
Size FL Weight
76.543 6.059 0.558
Year FL Weight
78.289 7.805 0.443
FL Weight Shape
78.488 8.004 0.384
Year FL Weight Shape 79.18 8.696 0.475
Full
89.092 18.608 0.909
30
% P
resp
aw
n m
ort
alit
y (P
SM
)
0
20
40
60
80
100
Year
2008 2009 2010 2011 2012 2013
0
20
40
60
80
100
n=11
n=17
n=28
n=22
n=17
n=15
n=5
n=33n=16
NA
n=28
n=9
Fall Creek
NFMF
Figure 17. Annual percent prespawn mortality for PIT- and radio-tagged Chinook salmon in
Fall Creek (top panel) and the NFMF (bottom panel) in 2008-2013. Horizontal line is the mean
prespawn mortality rate across study years. Percentages are for females only.
31
% P
SM
0
20
40
60
80
100
Date
Jul Aug Sep Oct Nov
0
20
40
60
80
100
2009
2010
0
20
40
60
80
100
% P
SM
0
20
40
60
80
100
Date
Jul Aug Sep Oct Nov
0
20
40
60
80
100
2011
2012
2013
Figure 18. Cumulative percent prespawn mortality events of Chinook salmon in Fall Creek
in 2009-2013 by date of carcass recovery. Vertical lines indicate the date that the first redd was
observed.

32
% P
SM
0
20
40
60
80
100
Date
Jul Aug Sep Oct Nov
0
20
40
60
80
100
0
20
40
60
80
100
% P
SM
0
20
40
60
80
100
Date
Jul Aug Sep Oct Nov
0
20
40
60
80
100
2009
2010
2011
2012
2013
Figure 19. Cumulative frequency of prespawn mortality events of Chinook salmon in the
NFMF of the Willamette River in 2009-2013. Vertical lines indicate the date that the first redd
was observed.

33
Figure 20. Prespawn mortality rates for Chinook salmon for untagged fish and by tag type in
Fall Creek in 2009-2013. Sample sizes are above bars. Percentages are for females only.
Figure 21. Prespawn mortality rates for Chinook salmon for untagged fish and by tag type
for the NFMF in 200902013. Sample sizes are above bars. Percentages are for females only.
Year
2009 2010 2011 2012 2013
% P
SM
0
20
40
60
80
100
120
NONE
PIT
RT
NFMF
9
1
44
65
7
437
3 3
12
44
2
2
Year
2009 2010 2011 2012 2013
% P
SM
0
20
40
60
80
100
120
NONE
PIT
RT
Fall Creek
138
6
205
10
6
2
4
5 1
13 2
n/a

34
We examined the interannual relationship between water temperature and prespawn mortality
in the two study areas (Figure 22). In Fall Creek, annual female mortality was strongly
associated with mean daily water temperature from 1 July to 15 September (r2 = 0.83) and
positively but weakly correlated with the maximum 7-d moving average temperature (r2 = 0.27).
The first metric was an indicator of the overall thermal environment in each year and the second
metric was an index of potential acute thermal stress. There were no clear patterns in the NFMF
(Figure 23). Neither the seasonal mean (r2 = 0.08) nor the 7-d moving average (r
2 = 0.30) was
strongly associated with prespawn mortality.
Figure 22. Prespawning mortality rates of female PIT and radio-tagged Chinook salmon in
Fall Creek and the NFMF in relation to the maximum 7-d moving average daily temperatures
(top panel) and the mean daily temperature from 1 July to 15 September (bottom). Temperatures
were recorded at the release sites.
Maximum 7-day moving average daily temperature (oC)
12 14 16 18 20 22 24
PS
M (
%)
0
20
40
60
80
100
120
NFMF
Fall Creek
20112010
2009
2011
2010
2009
2012
2012
Mean daily temperature (oC) 1 July to 15 Sept
10 12 14 16 18 20 22
PS
M (
%)
0
20
40
60
80
100
120
Fall Creek
NFMF
2011
2010
20092011
2010
2009
2012 2012
2013
2013
2013
2013

35
Results: South Fork Santiam
A total of 200 fish (86 females, 114 males) were PIT tagged, and 75 of these were also radio-tagged at Foster Dam and released
into the South Fork Santiam River or Foster Reservoir (Figure 23). All fish transported above the dam were non-adipose clipped fish.
Fish were released at three sites (Figure 24): River Bend (n = 22), Calkins (n = 50) and Gordon Road (n = 128). Fish released at the
Calkins site were used to evaluate reservoir releases. The mean fork length was 77.8 cm in 2013, mean condition score in 2013 was
2.3, mean weight was 5.7 kg, and mean lipid percentage was 2.6% (Table 11). Overall, 12.8% of the PIT-tagged and 20% of the
radio-tagged fish released were recovered on the spawning grounds. Prespawn mortality estimates for fish released upstream from
Foster Dam were 28.6% (2 of 7 females recovered) for PIT-tagged fish and 100% (3 of 3 females recovered) for radio-tagged fish.
Figure 23. Map of Foster Reservoir including South Fork and Middle Fork Santiam river arms (top panel), radio telemetry and
release sites (bottom panel). Note: Gordon Road release site is approximately 16.4 river kilometers upstream of River Bend and is not
shown on the map.
Foster Fish Trap
Middle Santiam River
South Santiam River
Calkins Park Release Site
River Bend Release Site
Middle Santiam Receiver Site
South Santiam Receiver Site

36
Figure 24. Numbers of adult Chinook salmon tagged at Foster Dam in 2013. Fish were
immediately outplanted at three locations above Foster Dam.
Table 11. Adult Chinook salmon size, lipid content, and condition metrics for fish collected
and sampled at Foster trap on the South Fork of the Santiam River and then immediately
outplanted in 2013. MeH = Mid-eye to hypural length, Da = Depth at anus, Ba = Breadth at
anus, HH = Hump height, % Lipid = % lipid in muscle tissue, wet weight.
SF Santiam (n = 200)
Fork Length
(cm) Weight
(kg) MeH
(cm) Da
(cm) Ba
(cm) HH
(cm) %
Lipid Condition
Score
Mean 77.8 5.7 64.8 12.8 6.1 8.5 2.6 2.3
St. Deviation 6.6 1.5 5.8 1.4 0.9 0.9 1.7 0.8
Max 92.0 9.6 77.0 18.5 8.5 11.0 13.2 3
Min 51.0 0 41.0 7.7 3.5 5.0 0.4 1
Individual lipid concentrations of fish collected at Foster Dam as estimated with the fatmeter
were poorly correlated with the values estimated from proximate analysis taken from lethally
sampled adults (adj. r2 = -0.0740, P = 0.854, n = 15 see Proximate Analysis section below).
Negative adjusted r-square values indicate that the mean of the data provides a better fit than the
regression equation. Mean estimated lipid content of tagged adults arriving at the Foster trap in
June were lower than lipid content estimated for adults at Willamette Falls and generally
decreased through the 2013 season (Figure 25).
Date
10-Jun 24-Jun 08-Jul 22-Jul 05-Aug 19-Aug 02-Sep
Sa
lmo
n ta
gg
ed
0
10
20
30
40
50
Calkins n=50
River Bend n=22
Gordon Rd n=128

37
Figure 25. Distributions of fatmeter results for Chinook salmon tagged at the Foster Dam
trap in 2013. Box plots represent median (solid line), 25th
and 75th
percentiles (ends of boxes),
10th
and 90th
percentiles (whiskers), and 5th
and 95th
percentiles (solid circles). Sample size for
each date given below each distribution. Fat meter readings from Willamette Falls (WFALLS)
are from Jepson et al. 2013.
River and Reservoir Environment
Mean water temperature in the South Santiam during the 2013 study period was 14.8 °C with
a peak of 19.3 °C on 6 August and tended to be progressively warmer downstream (Figure 26).
Water temperatures in the Middle Fork Santiam were approximately 4 degrees cooler (mean =
11.8 °C) than in the South Fork with a maximum temperature of 15.5 °C on 22 July. Mean water
temperatures collected at 11 depths in Foster Reservoir ranged from 19.0 °C at 0.2 m from the
surface to about 8 °C at 24 m, with a maximum of 23.5 °C in early July (Figure 27). The
thermocline was at approximately 4-6 m and temperatures below 6 m remained <= 15°C
throughout the summer.
Date
WFA
LLS
June
10
June
17
June
24
July 1
July 8
July 1
5
July 2
2
July 2
9
Aug
5
Aug
12
Aug
19
Aug
26
Sep
2
Fa
tme
ter
pe
rce
nt
0
2
4
6
8
10
12
14
16
22 0 34300 10 25 24 34 0 0 304 17 0

38
Figure 26. Daily mean water temperatures in 2013 in the Middle Fork Santiam River and
three sites in the South Fork Santiam River. The loggers in the South Fork Santiam represent a
progression upstream from the River Bend release site (rkm 428.3) to the Gordon Road release
site (rkm 444.7).
Figure 27. Foster Reservoir temperatures collected at 11 depths between 1-May and
1-October 2103 (US Army Corps of Engineers).
Date
01-Jun 01-Jul 01-Aug 01-Sep 01-Oct
Te
mp
era
ture
(C
)
5
10
15
20
25
MF SunnySide
SF River Bend
SF Cascadia
SF Gordon Rd
Date
01-May 01-Jun 01-Jul 01-Aug 01-Sep 01-Oct
Te
mp
era
ture
(C)
5
10
15
20
25
0.2
1.5
3.0
4.6
6.1
9.1
12.2
15.2
18.3
21.3
24.4
Depth (m)
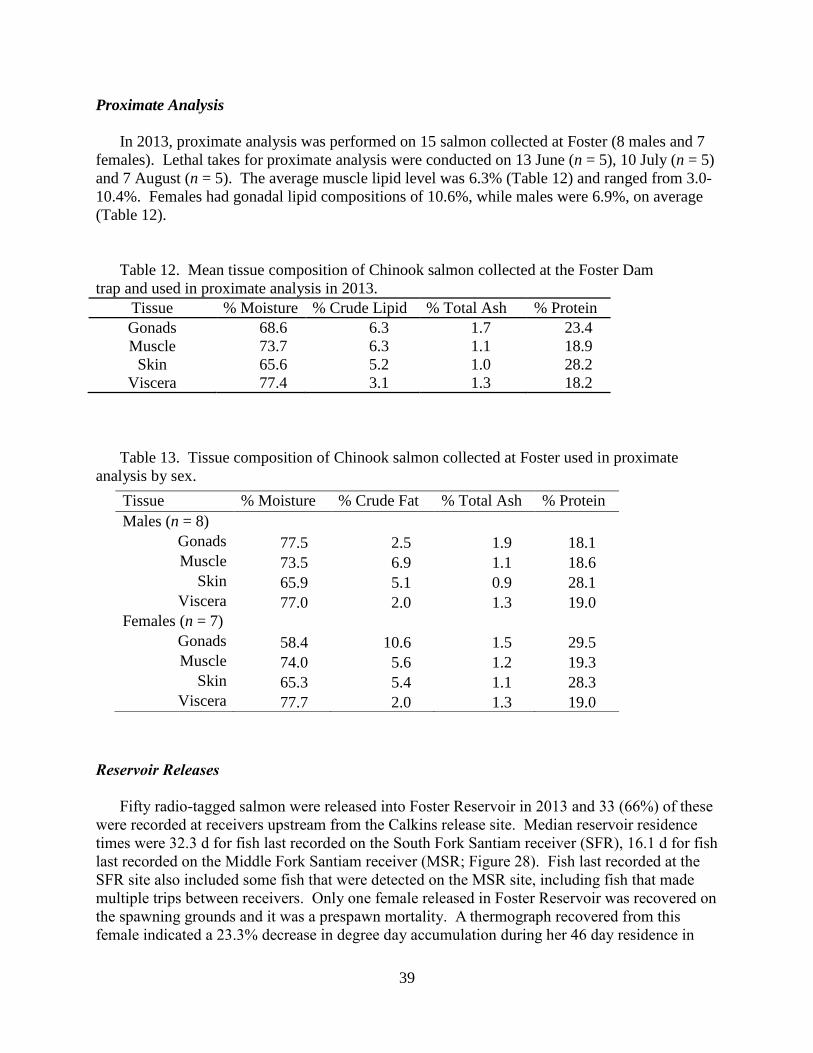
39
Proximate Analysis
In 2013, proximate analysis was performed on 15 salmon collected at Foster (8 males and 7
females). Lethal takes for proximate analysis were conducted on 13 June (n = 5), 10 July (n = 5)
and 7 August (n = 5). The average muscle lipid level was 6.3% (Table 12) and ranged from 3.0-
10.4%. Females had gonadal lipid compositions of 10.6%, while males were 6.9%, on average
(Table 12).
Table 12. Mean tissue composition of Chinook salmon collected at the Foster Dam
trap and used in proximate analysis in 2013.
Tissue % Moisture % Crude Lipid % Total Ash % Protein
Gonads 68.6 6.3 1.7 23.4
Muscle 73.7 6.3 1.1 18.9
Skin 65.6 5.2 1.0 28.2
Viscera 77.4 3.1 1.3 18.2
Table 13. Tissue composition of Chinook salmon collected at Foster used in proximate
analysis by sex.
Reservoir Releases
Fifty radio-tagged salmon were released into Foster Reservoir in 2013 and 33 (66%) of these
were recorded at receivers upstream from the Calkins release site. Median reservoir residence
times were 32.3 d for fish last recorded on the South Fork Santiam receiver (SFR), 16.1 d for fish
last recorded on the Middle Fork Santiam receiver (MSR; Figure 28). Fish last recorded at the
SFR site also included some fish that were detected on the MSR site, including fish that made
multiple trips between receivers. Only one female released in Foster Reservoir was recovered on
the spawning grounds and it was a prespawn mortality. A thermograph recovered from this
female indicated a 23.3% decrease in degree day accumulation during her 46 day residence in
Tissue % Moisture % Crude Fat % Total Ash % Protein
Males (n = 8)
Gonads 77.5 2.5 1.9 18.1
Muscle 73.5 6.9 1.1 18.6
Skin 65.9 5.1 0.9 28.1
Viscera 77.0 2.0 1.3 19.0
Females (n = 7)
Gonads 58.4 10.6 1.5 29.5
Muscle 74.0 5.6 1.2 19.3
Skin 65.3 5.4 1.1 28.3
Viscera 77.7 2.0 1.3 19.0

40
Foster Reservoir (mean 13.8 C temperature, accumulation of 635 degree days) compared to the
temperatures during the same period in the S. Santiam at Cascadia (average 18 C, 828 degree
days).
Figure 28. Reservoir residence times (d) of radio-tagged adult Chinook salmon released into
Foster reservoir in 2013. Box plots represent median (solid line), 25th
and 75th
percentiles (ends
of boxes), and 10th
and 90th
percentiles (whiskers). SFR = South Fork Santiam River, MSR =
Middle Fork Santiam River.
Toxicology sampling
Overall we collected 28 tissue samples from adult Chinook salmon recovered on the
spawning grounds: 19 (68%) from the NFMF, 7 (25%) from the South Fork Santiam and 2 (7%)
from Fall Creek. Of the nineteen collected in the NFMF 10 (53%) were from prespawn
mortalities and 9 (47%) were from fish that spawned. Four of the seven (57%) samples collected
in the South Fork Santiam were from prespawn mortalities while the other three were from fish
that spawned. Both of the Fall Creek samples were from prespawn mortalities, had
concentrations within the range observed at other sites and are not considered further due to
limited sample size.
Mean concentrations across all samples were: Ni: 91.6 ng/g; Cd: 4.2 ng/g; Pb 10.1 ng/g. The
concentrations of metals analyzed to-date indicated significant spatial variation in concentration
of Cd and Pb but not Ni (Figure 29) and no evidence of differences in concentrations of metals in
salmon classified as successful spawners vs. prespawn mortalities (Figure 30; 2-way ANOVA:
Last detection site
SFR MSR
Re
se
rvo
ir d
ura
tio
n (
da
ys)
0
20
40
60
80
100
n=29
n=4

41
Ln([Ni]) Fsite = 0.047; Psite = 0.831; Fspawn = 0.036; Pspawn = 0.862; Ln([Cd]) Fsite = 4.450; Psite =
0.047; Fspawn = 0.007; Pspawn = 0.935; Ln([Pb]): Fsite = 9.254; Psite = 0.006; Fspawn = 0.063; Pspawn
= 0.804).
Figure 29. Concentrations of nickel, cadmium and lead in muscle+skin tissue samples from
carcasses collected on the S. Santiam and NFMF rivers, 2013. S. Santiam N = 7; NFMF N = 19.
S. Sant. NiNFMF Ni
S. Sant. CdNFMF Cd
S. Sant. PbNFMF Pb
Concentr
ation (
ng/g
)
1
10
100
1000

42
Figure 30. Concentrations of Ni, Cd, and Pb for individual adult Chinook salmon carcasses
classified as having successfully spawned or as prespawn mortalities.
Discussion
The primary Middle Fork study objectives were to estimate prespawning mortality rates in
the two Middle Fork populations and to examine relationships between prespawn mortality and
potential causative agents. Accomplishing these objectives in 2013 was difficult because record
rainfall in September made study streams too dangerous to survey during peak Chinook salmon
spawning activity. Thus all comparisons regarding 2013 must be viewed with caution because
potential biases in the estimates caused by the flood remain unknown as discussed below.
Secondary goals included examination of patterns across years, evaluation of behavior of
reservoir-released adults at Foster Reservoir, and preliminary screening of toxin concentrations.
Prespawn mortality rates did not differ systematically between groups that were untagged,
tagged with PIT tags or double-tagged with PIT- and radio-tags, suggesting that tagging had
minimal effect on fate. Notably this result contrasts with a recent study of Chinook salmon in
the Yakima River where adults were also tagged relatively late in the migration and displayed
strong tagging effects (Corbett et al. 2012). The disparity between locations indicates
[C
d]
(ng
/g)
0
2
4
6
8
10
12
[Ni] (ng/g)
1 10 100 1000 10000
[Pb
] (n
g/g
)
0
10
20
30
40
Prespawn Mortality
Successful Spawner
[Ni] (ng/g)
1 10 100 1000 10000
43
population-specific differences in response to methodologies or tagging, differences in prior
experience and exposure to pathogens, toxins, high temperatures or other carry-over effects prior
to tributary entry and tagging, differences in environment during holding, or a combination of the
above. Moreover, lower PSM rates of marked groups in recent years may reflect more careful
handling, tagging and transport. Regardless, the results for the WVP suggest carefully executed
tagging studies can provide reliable estimates of prespawn mortality and fate within the study
areas.
Although the sample sizes were low, prespawn mortality rates in Fall Creek in 2013 were the
highest among all study years and this result was consistent with the high temperature observed
there (also, see below). In 2013, 100% of the females (n = 2 PIT-tagged, n = 13 unmarked)
recovered on the spawning grounds were prespawn mortalities. The 2013 rates were similar to
the high (40-90%) rates observed in 2009 and 2010 (i.e., mortality as high as 90%, Schroeder et
al. 2007; Kenaston et al. 2009; Keefer and Caudill 2010). However, it remains unknown if this
estimate is biased high because carcasses of late-spawning adults could not be recovered.
Nonetheless, evaluation of the seasonal timing of prespawn mortality events (Figures 18 and 19)
reveal that much of the mortality occurs prior to the onset of spawning, suggesting the true rate
was high relative to past years.
The 2013 prespawn mortality rate in the NFMF was also the highest in the time series. For
this population it is unknown whether the estimate was biased high or biased low by the flood
event. The rate would be biased high if adults remaining post flood had high spawning success
whereas the estimate would be biased low if remaining adults subsequently died at a higher rate
than prior to the flood. The high variability in the seasonal pattern of prespawn mortality
expression and the moderate temperatures in the NFMF during 2013 prevent speculation about
the true rate. Small sample size and similar issues also render the S. Santiam prespawn mortality
rate estimate unreliable.
In 2013, we initiated trapping at Dexter about three weeks earlier than past years (see
Appendix tables 1 and 2) in an effort to make the sampled outplants more representative of the
actual run timing in the Middle Fork of the Willamette. In previous years, sampling at Fall
Creek was more representative of the timing of the run than sampling at Dexter. This was due to
limitations in the operation of the Dexter Trap, which is primarily used for broodstock
collections for Willamette Hatchery. With the assistance of ODFW the collection of adults at
Dexter Dam began on 19 May (approximately two weeks earlier than in 2012), with collections
every two to three weeks thereafter until the first week in August. Data from our 2012 study
revealed that radio-tagged adults spent about two weeks on average (range <1-22 days) in the
Dexter Dam tailrace prior to collection (Jepson et al. 2013). This pattern suggested that
residence time in the tailrace may be determined by trapping interval. Poor attraction flow from
the Dexter trap entrance compared to turbine discharge may also contribute somewhat to tailrace
residence time irrespective of trap operations. In 2013, operations were modified to allow adults
to enter the trap throughout the run season which could potentially reduce tailrace residence time
and densities in the trap during collection of broodstock and adults for outplanting. However,
low numbers of carcass recoveries in 2013 due to high flows during spawning ground surveys
prevented a rigorous evaluation of associations between prespawn mortality and potential trap
timing effects that may be associated with holding in the tailrace and trap operations. Continued

44
early operation of the trap combined with improved collection and handling protocols could
reduce the prespawn mortality rate for this population, which is thought to be relatively high
given the near optimal temperatures and apparently high quality habitat at the release site.
When combining the results from all five study years, we found an association between
annual prespawn mortality rate and summer water temperatures in Fall Creek, though we note
this conclusion should be considered preliminary because it is largely driven by results from two
years (2009 and the potentially biased 2013 estimate; Figure 23). We have also observed
prespawn mortality that directly coincided with increases in water temperatures within year
(Mann et al. 2010 and 2011). The 2013 Fall Creek temperatures were cooler in 2013 than in
2009, although daily maximums exceeded 20°C, a range that is considered deleterious to adult
Chinook salmon (Richter and Kolmes 2005; Mann 2007). We observed lower mortality rates for
fish collected and outplanted in May in 2010, when water was cooler than later in the summer.
In 2011 and 2012, river temperatures rarely exceed 20°C throughout the run and lower
temperature exposures likely contributed in part to low prespawn mortality rates. In 2013,
temperatures were similar to 2011 and 2012, but spawning ground recoveries in 2013 were too
low make meaningful comparisons among study years. Moreover, all of the prespawn
mortalities occurred prior to the observation of the first redd which was nearly three weeks later
than in 2012 (2012 first redd date = 30-August) and two weeks later than in 2011 (first redd date
= 8 September). In contrast to Fall Creek, the first redd observed in the NFMF was on 6
September. The low numbers of early redds observed in 2013 at Fall Creek may be partially
explained by changes in the distribution of fish in Fall Creek related to warmer late summer and
fall temperatures. Fish were observed on several occasions holding in large pools downstream
from typical spawning areas two to three weeks after the typical onset of spawning (late-
August/early September) but the lack of radio-tagged fish made it difficult to effectively monitor
their distributions. Temperatures during this period were among the warmest in the time series
(Figure 10).
Fish Condition, Environmental Conditions, and Spawning Success: Middle Fork
The energetic condition of two populations of Willamette River spring Chinook salmon was
assessed. The percentage of lipid in the muscle tissue was used as the measure of energetic
condition. The mean lipid content at the time of tagging in 2013 was 5.2% % and 2.8% % for
Fall Creek and Dexter fish, respectively. These measurements were nearly the same as in 2012
where mean lipid content was 5.3% at Fall Creek and 2.4% at Dexter. Differences in tagging
dates among and between years made direct comparison of these means difficult, though after
standardization using the proximate analyses, we did not observe significant differences in lipid
levels between years or locations.
The lipid levels of fish tagged at Fall Creek and Dexter Dam in 2012 and 2013 were
generally lower than in 2009-2011 (Mann et al. 2011). Differences in the locations and timing of
these sampling events likely explain some of the among-year and population differences in lipid
levels. Lipid levels in Chinook salmon collected at Willamette Falls in 2013 were about 2-5%
higher (mean lipid level at Willamette Falls = 7.7%), on average, than those collected at Fall
Creek or the Dexter Dam trap. This was not surprising because significant energy is required to
migrate the more than 250 km from Willamette Falls to these upstream sites.
45
Although samples sizes were too low to detect a significant association between physical
condition and spawning success in 2013 in Fall Creek, salmon were in generally good condition
in 2013 (mean condition score = 2.5). The mean condition in 2013 was slightly lower than 2012
(mean = 2.6). The relatively high condition scores suggest initial composite condition and
previous injury was not a major factor contributing to the apparently high prespawn mortality.
We note that this index was somewhat subjective because there may be some interannual
variability in scores because different personnel collected data in some years.
Although prespawn mortality rates for PIT and radio-tagged fish were high (44%) it is
unlikely that water temperatures in NFMF near areas used by outplanted Chinook salmon had
large impacts on survival. Daily mean water temperatures did not exceed 15°C at the NFMF
release site during the monitoring period in 2013 or in previous years except 2009 (max
temperature = 15.8°C). It is more likely that prespawn mortality rates were affected by
additional factors, including transportation stress, long holding times downstream from Dexter
Dam and at the facility, unmeasured factors affecting condition at arrival, and density-dependent
issues that were not quantifiable in this study but were potentially important based on field
observations. These factors should be a management concern for salmon released into the
NFMF, but may be of less importance at Fall Creek where transportation times are shorter and
densities are lower.
South Fork Santiam and Foster Reservoir Releases
In 2013, we continued our study to evaluate the feasibility of releasing adults into Foster
Reservoir. Release into a reservoir would allow unmarked (presumably natural-origin) adults
collected below dams to select and home to their natal tributary. Thus in 2012 and 2013, we
conducted reservoir and in-stream releases to evaluate the use of reservoir release for both
thermal and homing benefits. In contrast to the relatively short residence times (< 1 d) observed
in Fall Creek reservoir in 2011 and 2012, the typical residence time in Foster reservoir ranged
from 3 to 8 days in 2012 and was substantially longer in 2013. The mean residence times in
2013 were ~16 d for fish last recorded in the Middle Fork Santiam and ~32 d for fish last
recorded in the South Fork Santiam. The single thermograph recovered from a reservoir release
fish indicated slightly less than a 25% decrease in thermal exposure during the period of
reservoir residence. This was not surprising because temperatures in Foster Reservoir may have
provided a cool water refuge (mean = 8 °C at 24 m depth) during summer months when
temperatures in the South Fork Santiam River often exceeded 18 °C. Telemetry records also
indicated that there was some evidence for tributary selection, including fish that made multiple
trips between tributary receiver sites. While these behaviors suggest natal site selection,
selection could not be confirmed because no fish were of known origin.
In addition to evaluating Foster Reservoir releases we also estimated prespawn mortality
rates of adults released into the South Fork Santiam River. While record rainfalls precluded
surveys during peaks in spawning in the South Fork Santiam as well as the other study systems,
our radio-tag recovery rate was about two times higher in the South Fork Santiam River (20%)
than in the NFMF (10.2%), although PIT tag recovery rates were approximately the same
(12.8%, SF Santiam, 10.4% NFMF). Due to the low number of tags recovered, conclusions

46
about prespawn mortality remain speculative. Nevertheless, the combined rate for radio and PIT
tag fish was 50% which was similar to the NFMF (44%).
Toxicology
We collected samples in 2013 for screening of toxins with two goals: 1) to screen
concentrations from a broad panel of known toxins to identify “background” loads and potential
toxins of concern, and 2) to directly test for associations between concentrations and spawning
success in individual salmon. Complete screening will include evaluation of more than 25 trace
elements and metals and more than 100 organic pollutants. We selected three target elements
(Pb, Cd, Ni) for initial reporting because elevated concentrations were observed in these metals
in gill tissues of prespawn mortality coho salmon compared to successful spawners in non-urban
hatchery salmon (Scholz et al. 2011). Concentrations observed in the WVP reported here were
lower or similar than those reported for Fraser River Chinook salmon (Kelly et al. 2008, Kelly et
al. 2011) for similar tissues (muscle). Observed values from WVP Chinook salmon were also
lower or similar to those reported for coho from both non-urban and urban streams by Scholz et
al. (2011). We note differences in species and tissue type (muscle+skin vs gill) between our
study and the Scholz et al. (2011) study prevent direct comparison. Nonetheless, metal
concentrations observed in the WVP are approaching those observed in prespawn mortality
salmon by Scholz et al (2011). While we did not observe a clear association between toxins
concentrations and fate, we did observe spatial differences in metal concentrations. The
mechanisms resulting in spatial variation in Pb and Cd may be related to underlying geology (the
natural source of these elements) or differences in exposure to anthropogenic sources
encountered during rearing, migration or holding. Overall, the data for three metals analyzed
provided little evidence that toxic concentrations of these elements were directly responsible for
prespawn mortality in 2013.
Management Implications
The apparent impact that water temperatures had on spawning success across study years
suggests that strategies that minimize Chinook salmon exposure to high temperatures should be
considered to increase survival of outplanted fish. Development of structured management plans
for years with different anticipated river conditions could be used to ensure minimum impacts to
outplanted fish, with the costs and benefits depending on biological benefit and economic costs
(e.g., Schreck et al 2013). Without the ability to directly manipulate water temperatures in the
rivers above impoundments, managers may have to manipulate the timing or location of
outplanting, or use cool water holding strategies during summer.
If fish that die pre-spawning do so because of conditions in the Willamette River main stem
or in tributaries, then holding them in high quality conditions may increase survival, particularly
in years with predicted low discharge and/or high temperatures. Upon trapping, the fish could be
held in cool water until river temperatures have dropped to a more favorable level. Results from
our previous holding studies (2009-2012) at Willamette Hatchery suggest that this strategy could
be useful, particularly in warm years, although this approach entails added risks associated with

47
transport and longer holding times. Schreck et al. 2013 reported that prespawn mortality rates of
fish captured at Willamette Fall, Dexter Dam, and Foster Dam and held until sexual maturity in
cool (~13 C) were lower for fish collected earlier (0-6%) compared to fish collected later (10-
32%) in the run. However, we note that there are potentially serious concerns with extended
holding that need to be considered before implementation, including disease transmission,
maturation effects, and reduction of condition, as well as logistical issues concerning facility use
and personnel demand. Similarly, conditions encountered at collection facilities and during
transport and at outplanting may affect prespawn mortality rate. The relatively high prespawn
mortality in the cool-water NFMF compared to Fall Creek in cool years suggests differences in
experience prior to outplanting may contribute to prespawn mortality in the NFMF. Potential
factors include tailrace residence time, collection density, physical differences in the collection
and trap facilities, handling procedures including differences in anesthetics, and any differences
in transport protocols (densities, travel times, tank structure and conditions, etc.). Improving
collection, transport, and release of adults from Dexter into the NFMF is likely to be effective at
reducing PSM, however, salmon returning the Middle Fork Willamette tributaries also have the
longest travel distances among the Willamette basin spring Chinook populations and may
already be physiologically stressed or have higher disease loads when they arrive at Fall Creek
and Dexter dams. This migration stress may significantly affect their post-outplant survival.
The short movements of adults prior to spawning in the NFMF relative to Fall Creek suggest
that habitat conditions within the NFMF are not limiting near the release site. Experimental tests
of alternative collection and handling protocols could identify causative agents and effective
management strategies. An alternative management strategy may be to use different outplant
release sites in years with different in-river conditions in streams such as Fall Creek (Schreck et
al. 2013). For example, release sites further upstream, which are generally cooler, could be used
during periods of unfavorable water temperatures.
In contrast to 2010 and 2011 there were no significant mortalities observed following a
release event in the NFMF in 2012 or 2013. There was, however, presumably some delayed
mortality associated with collection and transportation to the release site. The mechanism for
this mortality is unclear, but may have attributable to short-term stress of handling and transport
and/or “shipping fever” (Schreck et al. 2012a) rather than to water quality issues during
transportation (which would manifest in minutes to hours and would likely have been evident
prior to release from the truck). Schreck et al. 2013 suggested minimizing crowding and
duration of the stress and possibly using antibiotics to reduce the severity of “shipping fever”.
Handling protocols at Dexter Dam Trap require use of CO2 for anesthetization. While CO2 is
known to induce higher stress and mortality in fishes during anesthesia (e.g., Sanderson and
Hubert 2007), to what degree differences in collection and handling protocols contributed to
prespawn mortality at either site remains unknown. The effects of handling protocol could be
tested explicitly by applying alternative protocols or anesthesia treatments to paired release
groups through the outplant season at Dexter Dam or other locations.
Demonstrating causal links between prespawn mortality and mechanism(s) (e.g., disease
expression or energy) could provide guidance and support for other recovery options proposed
for the recovery of the Upper Willamette Chinook ESU (ODFW and NMFS. 2011) and is an on-
going goal of this collaborative project (see Schreck et al. 2012a,b, 2013). For example, if

48
temperature is a controlling factor for pathogenesis, then proposed measures that would prevent
warming or reduce temperatures that are in the proposed “Conservation and Recovery Plan”
could be even more strongly endorsed. Schreck et al. 2013 found a strong positive association
between PSM and accumulated degree days and time in the UWR system and suggested that
accumulated degree days provided a simple, biologically relevant metric since it is associated
with thermal exposure, pathogen dynamics, and energetic status. Results reported here and in
Jepson et al. (2013) indicate that Chinook salmon accumulate considerable thermal units before
and after collection and outplanting. The possibility of managing water temperatures below the
dams during the spring Chinook migration to reduce stress, disease and reduce prespawning
mortality should be considered. Active management of temperature regime has been successful
below Lost Creek reservoir on the Rogue River (ODFW 1991) and below Dworshak Dam on the
Clearwater-Snake rivers (Clabough et al. 2007). Successful management of adults within the
WVP and on the spawning grounds above projects will require reliable information on disease
prevalence, individual-and population-level energetics, abiotic factors in the migration corridor,
and effects of current protocols for handling and transporting fish.
References
Association of Official Agricultural Chemists (AOAC) (1965) Official Methods of Analysis
10.ed. AOAC, Washington.
Beidler, W. and S. Knapp (2005) A synopsis of information relating to the success of adult
hatchery Chinook salmon releases above migration barriers in the Willamette River system.
Oregon Department of Fish and Wildlife, 51 pp.
Berg, O. K., E. Thronӕs, and G. Bremset (1998) Energetics and survival of virgin and repeat
spawning brown trout (Salmo trutta). Canadian Journal of Fisheries and Aquatic Sciences
55:47-53.
Brett, J. R. (1995) Energetics. In C. Groot, L. Margolis, and W. C. Clarke, editors. Physiological
Ecology of Pacific Salmon. University of British Columbia Press, Vancouver. pp 1-66.
Burnham, K. P., and D. R. Anderson (2002) Model selection and multimodel inference : a
practical information-theoretic approach. Springer, New York.
Clabough, T.S., C.C. Caudill, C.A. Peery, T.C. Bjornn, and B.J. Burke (2007) Associations
between adult salmon and steelhead body temperature during upstream migration and
estimated environmental temperatures in Lower Granite Reservoir during cold water releases
from Dworshak Reservoir, 2004. Report for US Army Corps of Engineers, Walla Walla
District. http://www.webpages.uidaho.edu/uiferl/pdf%20reports/2007-
3_LGR%20Map%20Tracking%20Report%2004.pdf
Colt, J., and K. D. Shearer (2001) Evaluation of the use of the Torry Fish Fatmeter to nonlethally
estimate lipid in adult salmon. Prepared for: U.S. Army Corps of Engineers, Portland
District, Contract Report W66QKZ00805700, Seattle.

49
Corbett, S. C., M. L. Moser and A. H. Dittman( 2012) Experimental evaluation of adult spring
Chinook salmon radio-tagged during the late stages of spawning migration. North American
Journal of Fisheries Management 32(5): 853-858.
Coutant, C. C. (1977) Compilation of temperature preference data. Journal of the Fisheries
Research Board of Canada 34:739-745.
Craig, J .F., M. J. Kenley, and J. F. Talling (1978) Comparative estimations of energy content of
fish tissue from bomb calorimetry, wet oxidation and proximate analysis. Freshwater Biology
8:585-590.
Crossin, G. T., S. G. Hinch, A. P. Farrell, D. A. Higgs, and M. C. Healey (2004a) Somatic
energy of sockeye salmon Oncorhynchus nerka at the onset of upriver migration: a
comparison among ocean climate regimes. Fisheries Oceanography 13(5):345-349.
Crossin, G. T., S. G. Hinch, A. P. Farrell, D. A. Higgs, A. G. Lotto, J. D. Oakes, and M. C.
Healey (2004b) Energetics and morphology of sockeye salmon: effects of upriver migratory
distance and elevation. Journal of Fish Biology 65:788-810.
Crossin, G. T. and S. G. Hinch (2005) A non-lethal, rapid method for assessing the somatic
energy content of migrating adult Pacific salmon. Transactions of the American Fisheries
Society 134:184-191.
Crossin, G. T., S. G. Hinch, S. J. Cooke, D. W. Welch, D. A. Patterson, S. R.M. Jones, A. G.
Lotto, R. A. Leggatt, M. T. Mathes, J. M. Shrimpton, G. Van Der Kraak, and A. P. Farrell
(2008) Exposure to high temperature influences the behaviour, physiology, and survival of
sockeye salmon during spawning migration. Canadian Journal of Zoology 86:127-140.
Donaldson, M. R., S.J. Cooke, D.A. Patterson, S.G. Hinch, D. Robichaud, K.C. Hanson, I.
Olsson, G.T. Crossin, K.K. English, and A.P. Farrell (2009) Limited behavioural
thermoregulation by adult upriver-migrating sockeye salmon (Oncorhynchus nerka) in the
Lower Fraser River, British Columbia. Canadian Journal of Zoology. 87: 480–490 (2009)
Greenfield, B. K., S. J. Teh, J. R. M. Ross, J. Hunt, G. H. Zhang, J. A. Davis, G. Ichikawa, D.
Crane, S. S. O. Hung, D. F. Deng, F. C. Teh and P. G. Green (2008). Contaminant
concentrations and histopathological effects in Sacramento splittail (Pogonichthys
macrolepidotus). Archives of Environmental Contamination and Toxicology 55(2): 270-281.
Eaton, J. G., and R. M. Scheller (1996) Effects of climate warming on fish thermal habitat in
streams of the United States. Limnology and Oceanography 41:1109-1115.
Hendry, A. P., and O .K Berg (1999) Secondary sexual characteristics, energy use, senescence,
and the cost of reproduction in sockeye salmon. Canadian Journal of Zoology 77:1663-1675.

50
Hendry, A. P., A. H. Dittman, and R. W. Hardy (2000) Proximate composition, reproductive
development, and a test for trade-offs in captive sockeye salmon. Transactions of the
American Fisheries Society 129(5):1082-1095.
Higgs,D. A.,J. R. Markert, D. W. MacQuarrie, J. R. McBride, B. S. Dosanjh, C. Nichols, and G.
Hos-kins (1979) Development of practical dry diets for coho salmon, Oncorhynchus kisutch,
using poultry-by product meal, feather meal, soybean meal, and rapeseed meal as major
protein sources. Pages191–218 in J. E. Halver and K. Tiews, editors.
Hwang, H. M., P. G. Green and R. W. Holmes (2009a). Anthropogenic impacts on the quality of
streambed sediments in the lower Sacramento River watershed, California. Journal of
Environmental Science and Health Part a-Toxic/Hazardous Substances & Environmental
Engineering 44(1): 1-11.
Hwang, H. M., P. G. Green and T. M. Young (2009b). Historical trends of trace metals in a
sediment core from a contaminated tidal salt marsh in San Francisco Bay. Environmental
Geochemistry and Health 31(4): 421-430.
Jepson, M. A., M. L. Keefer, T. S. Clabough, C. C. Caudill, and C. S. Sharpe (2013) Migratory
behavior, run timing, and distribution of radio-tagged adult winter steelhead, summer
steelhead, and spring Chinook salmon in the Willamette River, 2012. Technical Report
2013-1. Cooperative Fish and Wildlife Research Unit, University of Idaho, Moscow.
Prepared for: U.S. Army Corps of Engineers.
Jepson, M. A., M. L. Keefer, T. S. Clabough, C. C. Caudill, and C. S. Sharpe (2014) Migratory
behavior, run timing, and distribution of radio-tagged adult winter steelhead, summer
steelhead, and spring Chinook salmon in the Willamette River, 2013. Technical Report
2014-4. University of Idaho, Moscow. Prepared for: U.S. Army Corps of Engineers,
Portland District.
Jobling, M. (1981) Temperature tolerance and the final preferendum – rapid methods for the
assessment of optimum growth temperatures. Journal of Fish Biology 19:439-455.
Keefer, M. L., C. A. Peery, T. C. Bjornn, M. A. Jepson, and L. C. Stuehrenberg (2004).
Hydrosystem, dam, and reservoir passage rates of adult Chinook salmon and Steelhead in the
Columbia and Snake Rivers. Transactions of the American Fisheries Society 133:1413-
1439.
Keefer, M. L., C. A. Peery, and M. J. Heinrich (2008). Temperature-mediated en route migration
mortality and travel rates of endangered Snake River sockeye salmon. Ecology of
Freshwater Fish 17:136-145.
Keefer, M. L., G. A. Taylor, D .F. Garletts, G. A. Gauthier, T. M. Pierce, and C. C. Caudill
(2010). Prespawn mortality in adult spring Chinook salmon outplanted above barrier dams.
Ecology of Freshwater Fish 19:361-372.

51
Keefer, M. L. and C. C. Caudill (2010). A review of adult salmon and steelhead life history and
behavior in the Willamette River basin: identification of knowledge gaps and research needs.
Technical Report 2010-8. University of Idaho, Moscow. Prepared for: U.S. Army Corps of
Engineers, Portland District.
Kelly, B. C., M. G. Ikonomou, D. A. Higgs, J. Oakes and C. Dubetz (2008). Mercury and other
trace elements in farmed and wild salmon from British Columbia, Canada. Environmental
Toxicology and Chemistry 27(6): 1361-1370.
Kelly, B. C., M. G. Ikonomou, N. MacPherson, T. Sampson, D. A. Patterson and C. Dubetz
(2011). Tissue residue concentrations of organohalogens and trace elements in adult Pacific
salmon returning to the Fraser River, British Columbia. Environmental Toxicology and
Chemistry 30(2): 367-376.
Kenaston, K., K. Schroeder, F. Monzyk, and B. Cannon (2009) Interim activities for monitoring
impacts associated with hatchery programs in the Willamette Basin, USACE funding: 2008.
ODFW.
Mann, R. D. (2007) The effects of high temperature exposures on migration success and embryo
quality of Snake River adult Chinook salmon and steelhead. Department of Fish and
Wildlife. Master’s Thesis, University of Idaho, Moscow, Idaho.
Mann, R. D., C. C. Caudill, M. L. Keefer, C. A. Peery, C. B. Schreck, M. L. Kent (2010)
Migration behavior and spawning success of spring Chinook salmon in Fall Creek and the
North Fork Middle Fork Willamette River: relationships among fate, fish condition, and
environmental factors. Technical Report 2010-7. Cooperative Fish and Wildlife Research
Unit, University of Idaho, Moscow. Prepared for: U.S. Army Corps of Engineers.
Mann, R. D., C. C. Caudill, M. L. Keefer, C. A. Peery, C. B. Schreck, M. L. Kent (2011)
Migration behavior and spawning success of spring Chinook salmon in Fall Creek and the
North Fork Middle Fork Willamette River: relationships among fate, fish condition, and
environmental factors. Technical Report 2011-8. Cooperative Fish and Wildlife Research
Unit, University of Idaho, Moscow. Prepared for: U.S. Army Corps of Engineers.
McGourty, C. R., J. A. Hobbs, W. A. Bennett, P. G. Green, H. M. Hwang, N. Ikemiyagi, L.
Lewis and J. M. Cope (2009). "Likely Population-Level Effects of Contaminants on a
Resident Estuarine Fish Species: Comparing Gillichthys mirabilis Population Static
Measurements and Vital Rates in San Francisco and Tomales Bays." Estuaries and Coasts
32(6): 1111-1120.
Mote, P. W., E. A. Parson, A. F. Hamlet, W. S. Keeton, D. Lettenmaier, N. Mantua, E. L. Miles,
D. W. Peterson, D. L. Peterson, R. Slaughter, and A. K. Snover (2003) Preparing for climatic
change: the water, salmon, and forests of the Pacific Northwest. Climatic Change 61:45-88.

52
Naughton, G. P., C. C. Caudill, T. S. Clabough, M. L. Keefer, M. J. Knoff, and M. A. Jepson
(2011) Migration behavior and spawning success of spring Chinook salmon in Fall Creek
and the North Fork Middle Fork Willamette River: relationships among fate, fish condition,
and environmental factors. Technical Report 2012-2. Cooperative Fish and Wildlife
Research Unit, University of Idaho, Moscow. Prepared for: U.S. Army Corps of Engineers.
NMFS (National Marine Fisheries Service) (1999) Endangered and threatened species:
threatened status for three Chinook salmon evolutionarily significant units (ESUs) in
Washington and Oregon, and endangered status for one Chinook salmon ESU in
Washington. Federal Register 64(56):14308-14328.
NMFS (2008) 2008 Willamette Project Biological Opinion. NMFS.
ODFW (1991). Effects of Lost Creek Dam on the distribution and time of Chinook salmon
spawning in the Rogue River upstream from Gold Ray Dam. Oregon Department of Fish
and Wildlife
ODFW and NFMS (2011). Upper Willamette River conservation and recovery plan for Chinook
salmon and steelhead. http://www.dfw.state.or.us/fish/CRP/upper_willamette_river_plan.asp
Orsi, J. J. (1971) Thermal shock and upper lethal temperature tolerances of young king salmon,
Oncorhynchus tshawytscha, from the Sacramento-San Joaquin River system. Report No. 71-
11, California Department of Fish and Game, Sacramento, CA
Pinson, A. M. (2005) Energy use, migration time and spawning success of adult Chinook salmon
returning to the South Fork of the Salmon River in Central Idaho. Department of Fish and
Wildlife. Master’s Thesis, University of Idaho, Moscow, Idaho.
Rand, P .S., S. G. Hinch, J. Morrison, M. G.G. Foreman, M. J. MacNutt, J. S. Macdonald, M. C.
Healey, A. P. Farrell, and D. A. Higgs (2006) Effects of river discharge, temperature, and
future climates on energetics and mortality of adult migrating Fraser River sockeye salmon.
Transactions of the American Fisheries Society 135:655-667.
Richter, A. and S. A. Kolmes (2005) Maximum temperature limits for Chinook, Coho, and chum
salmon, and steelhead trout in the Pacific Northwest. Reviews in Fisheries Science 13:23-49.
Roumasset, A.G. (2012). Pre-spawn mortality of upper Willamette River spring Chinook
salmon: associations with stream temperature, watershed attributes, and environmental
conditions on the spawning grounds. M.Sc. Thesis, Water Resources. University of Idaho,
Moscow, Idaho.
Rounds, S. A. (2007) Temperature effects of point sources, riparian shading, and dam operations
on the Willamette River, Oregon. U.S. Geological Survey Scientific Investigations Report
2007-5185, 34 p.

53
Rounds, S .A. (2010) Thermal effects of dams in the Willamette River basin, Oregon. U.S.
Geological Survey Scientific Investigations Report 2010-5153, 64 p.
Sanderson, T. B. and W. A. Hubert (2007) Assessment of gaseous CO2 and AQUI-S as
Anesthetics when surgically implanting radio transmitters into cutthroat trout. North
American Journal of Fisheries Management 27(4): 1053-1057.
Scholz, N. L., M. S. Myers, S. G. McCarthy, J. S. Labenia, J. K. McIntyre, G. M. Ylitalo, L. D.
Rhodes, C. A. Laetz, C. M. Stehr, B. L. French, B. McMillan, D. Wilson, L. Reed, K. D.
Lynch, S. Damm, J. W. Davis and T. K. Collier (2011). Recurrent Die-Offs of Adult Coho
Salmon Returning to Spawn in Puget Sound Lowland Urban Streams. Plos One 6(12).
Schreck, C.B., W. Contreras-Sanchez, and M.S. Fitzpatrick (2001) Effects of stress on fish
reproduction, gamete quality, and progeny. Aquaculture 197:3-24.
Schreck, C. B., M. Kent, S. Benda, J. Unrein, R. Chitwood, C. C. Caudill, and G. Naughton
(2012a) Prespawn mortality in spring Chinook salmon in the upper Willamette River:
potential causes. USACE 2011 Willamette Basin Fisheries Science Review, Corvallis, OR.
Schreck, C. B., M. Kent, S. Benda, J. Unrein, R. Chitwood, C. C. Caudill, and G. Naughton
(2012b) Prespawn mortality in spring Chinook salmon in the upper Willamette River:
potential management options. USACE 2011 Willamette Basin Fisheries Science Review,
Corvallis, OR.
Schreck, C., M. L. Kent, M. E. Colvin, S. Benda, C. Sharpe, J. T. Peterson and B. Dolan (2013).
Potential causes and management of prespawn mortality in adult upper Willamette River
Spring Chinook. Draft report prepared for USACE Portland District, Portland OR.
Schroeder, R. K., K. R. Kenaston, and L. K. McLaughlin (2007) Spring Chinook salmon in the
Willamette and Sandy rivers. Oregon Department of Fish and Wildlife, Portland, OR, 62 pp.
Sokal, R., and F. J. Rohlf (1995) Biometry. New York, W.H. Freeman and Co.
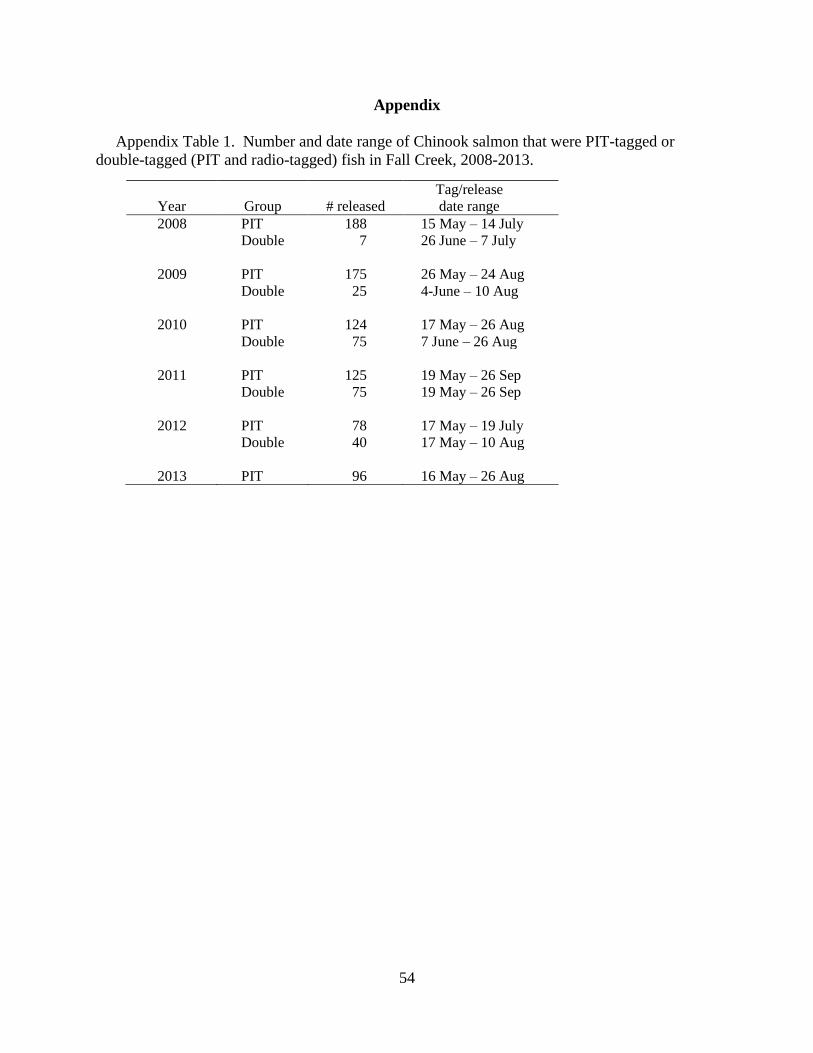
54
Appendix
Appendix Table 1. Number and date range of Chinook salmon that were PIT-tagged or
double-tagged (PIT and radio-tagged) fish in Fall Creek, 2008-2013.
Year
Group
# released
Tag/release
date range
2008 PIT 188 15 May – 14 July
Double 7 26 June – 7 July
2009 PIT 175 26 May – 24 Aug
Double 25 4-June – 10 Aug
2010 PIT 124 17 May – 26 Aug
Double 75 7 June – 26 Aug
2011 PIT 125 19 May – 26 Sep
Double 75 19 May – 26 Sep
2012 PIT 78 17 May – 19 July
Double 40 17 May – 10 Aug
2013 PIT 96 16 May – 26 Aug

55
Appendix Table 2. Number and tag date range of PIT-and radio-tagged subsets of the
Chinook salmon outplanted in the NFMF Willamette River in 2009-2013. DEX = fish tagged at
the Dexter Dam trap and immediately outplanted into the NFMF Willamette River. HH = fish
held at the Willamette Hatchery then later outplanted into the NFMF Willamette River with
release date shown in parentheses.
Year
Group
# released
Tag/release
date range
2009 (DEX) PIT 124 25-June – 17 Aug
Double 12 17 July – 17 Aug
2009 (HH) PIT 103 24 June – 9 July (24 Aug)
2010 (DEX) PIT 148 13 July – 11 Aug
Double 43 13 July – 11 Aug
2010 (HH) PIT 81 18 June – 1 July (1 Sep)
Double 18 18 June – 1 July (1 Sep)
2011 (DEX) PIT 109 26 May – 24 Aug
Double 71 26 May – 24 Aug
2011 (HH) PIT 79 15 June – 18 Aug (30 Aug)
2012 (DEX) PIT 104 6 June – 1Aug
Double 50 6 June – 1Aug
2012 (HH) PIT 71 19 June – 1Aug (29 Aug)
2013 PIT 106 22 May – 17 July
Double 59 22 May – 17 July

56
Appendix Figure 1. Map of temperature monitoring locations in Fall Creek in 2014.
Appendix Figure 2. Map of temperature monitoring locations in NFMF Willamette River in
2014.


