
FACTA UNIVERSITATIS Series: Mechanical Engineering Vol. 18, No 2, 2020, pp. 281 - 300
https://doi.org/10.22190/FUME200218028K
© 2020 by University of Niš, Serbia | Creative Commons License: CC BY-NC-ND
Original scientific paper
TEACHING-LEARNING-BASED PARAMETRIC OPTIMIZATION
OF AN ELECTRICAL DISCHARGE MACHINING PROCESS
Vidyapati Kumar1, Sunny Diyaley
2, Shankar Chakraborty
3
1Central Institute of Mining and Fuel Research, Dhanbad, Jharkhand, India 2Department of Mechanical Engineering, Sikkim Manipal Institute of Technology,
Sikkim Manipal University, Majitar, Sikkim, India 3Department of Production Engineering, Jadavpur University, Kolkata, West Bengal, India
Abstract. Due to several unique features, electrical discharge machining (EDM) has
proved itself as one of the efficient non-traditional machining processes for generating
intricate shape geometries on various advanced engineering materials in order to fulfill
the requirement of the present day manufacturing industries. In this paper, the
machining capability of an EDM process is studied during standard hole making
operation on pearlitic SG iron 450/12 grade material, while considering gap voltage,
peak current, cycle time and tool rotation as input parameters. On the other hand,
material removal rate, surface roughness, tool wear rate, overcut and circularity error
are treated as responses. Based on single- and multi-objective optimization models, this
process is optimized using the teaching-learning-based optimization (TLBO) algorithm,
and its performance is contrasted against firefly algorithm, differential evolution
algorithm and cuckoo search algorithm. It is revealed that the TLBO algorithm
supersedes the others with respect to accuracy and consistency of the derived optimal
solutions, and computational efforts.
Key Words: EDM Process, TLBO Algorithm, Metaheuristics, Optimization
1. INTRODUCTION
Electrical discharge machining (EDM) has already been accepted as an efficient
thermo-electrical material removal process in tool and die making, aerospace and
automotive industries, and also in finishing of surgical components due to its ability to
maintain close tolerances and attain higher dimensional accuracy [1, 2]. In this process, a
series of successive discharges between the tool (electrode) and the workpiece is responsible
Received February 18, 2020 / Accepted June 08, 2020
Corresponding author: Shankar Chakraborty
Department of Production Engineering, Jadavpur University, Kolkata, West Bengal, India
E-mail: [email protected]

282 V. KUMAR, S. DIYALEY, S. CHAKRABORTY
for removing material in the presence of a dielectric medium (kerosene or de-ionized
water). During electrical discharge, a discharge channel is developed having a temperature
around 12000°C causing melting and evaporation of material from the workpiece surface.
The electrode is advanced towards the workpiece until the inter-electrode gap is small
enough for the higher impressed voltage to ionize the dielectric [3]. In EDM process, a
perfect replication of the tool shape is generated on the workpiece surface. This process is
especially suitable for generating complex shape profiles on electrically conductive materials
with low machinability [4].
As there is no direct contact between the tool and the workpiece, this process is free
from any mechanical stress generation, chatter/burr formation and vibration problem. Its
machining performance is also uninfluenced by the hardness of the work material
because the material removal takes place by melting due to high intensity localized heat
generation. Since no cutting force is generated, extremely deep narrow holes with high
aspect ratio can be machined using this process with minimum tool wear. It can even
generate intricate cavities in a single operation. But EDM process also suffers from several
drawbacks, like generation of recast layer and heat-affected zone (HAZ), low material
removal rate (MRR), high machining time and related cost, low flexibility, capability of
machining only electrically conductive materials, etc.
It has been observed that the machining performance of an EDM process with respect to
MRR, surface roughness (SR), tool wear rate (TWR), HAZ, radial overcut (ROC) etc. is
significantly affected by different electrical parameters (peak current, pulse-on time, pulse-
off time, gap voltage, polarity, etc.) and non-electrical parameters (electrode material, type
of the dielectric used, dielectric pressure, rotation of the electrode, etc.). Thus, in order to
fulfill the requirements of better response values, it is always preferred to operate an EDM
set-up while maintaining the settings of its different input parameters as their optimal levels.
It would also lead to a higher production rate with reduced machining time.
Keeping in mind the requirements of finding out the optimal parametric mixes for EDM
processes, this paper deals with the application of teaching-learning-based optimization
(TLBO) algorithm to study the influences of various input parameters of an EDM process
on its responses (outputs) while machining pearlitic SG iron 450/12 grade work material.
For this process, gap voltage, peak current, cycle time and rotation of the tool are considered
as input parameters, whereas, MRR, SR, TWR, overcut (OC) and circularity error (CE) are
treated as responses. Both the single- and multi-objective optimization models are developed
and subsequently solved using the considered algorithm. Its optimization performance is also
contrasted with that of firefly algorithm (FA), differential evolution (DE) algorithm and
cuckoo search (CS) algorithm. The TLBO algorithm supersedes the other algorithms with
respect to accuracy and consistency of the derived optimal solutions, and computational
effort. The results of two-tailed paired t-tests also confirm its superiority over the others.
2. REVIEW OF THE LITERATURE
Mandal et al. [5] first applied artificial neural network (ANN) with back-propagation
algorithm to model an EDM process and non-dominating sorting genetic algorithm-II
(NSGA-II) was later adopted to optimize the said process. Using controlled elitist NSGA
technique, Bharti et al. [6] optimized different input parameters of a die-sinking EDM
process. The ANN with back-propagation algorithm was also adopted to model the

Teaching-Learning-Based Parametric Optimization of an Electrical Discharge Machining Process 283
considered process. Baraskar et al. [7] employed NSGA-II technique to identify the optimal
settings of pulse-on time, pulse-off time and discharge current for an EDM process to
achieve better values of SR and MRR responses. Shivakoti et al. [8] studied the effects of
salt-mixed de-ionized water as a dielectric on MRR, TWR, ROC and taper during EDM
operation of D3 die steel. The Taguchi method was later utilized to optimize the considered
EDM process parameters. Aich and Banerjee [9] applied weight-varying multi-objective
simulated annealing technique to develop the corresponding Pareto optimal front for
simultaneous optimization of MRR and SR in an EDM process. Radhika et al. [10]
considered peak current, pulse-on time and flushing pressure as the input parameters of an
EDM process. A hybrid optimization technique consisting of ANN and genetic algorithm
(GA) was later employed to minimize SR and TWR, and maximize MRR. A Pareto-
optimal front was also developed offering a set of non-dominated solutions. Tiwari et al.
[11] applied GA technique to simultaneously optimize MRR and SR during an EDM
operation. The corresponding Pareto-optimal solutions were subsequently proposed.
Mazarbhuiya et al. [12] performed eight experimental runs in an EDM set-up based on
Taguchi’s design plan, and applied grey relational analysis (GRA) technique to determine
the optimal settings of discharge current, flushing pressure, pulse-on time and polarity for
achieving maximum value of MRR and minimum SR value. Mohanty et al. [13] considered
open circuit voltage, discharge current, pulse-on time, duty factor, flushing pressure and
type of the tool material as the control parameters of a die-sinking EDM process. Based on
a multi-objective particle swarm optimization (PSO) algorithm, the optimal values of
different process responses, like MRR, EWR, SR and ROC were subsequently determined.
While considering peak current, polarity, pulse-on time, gap voltage and spindle speed as
the input parameters of an EDM process, Gohil and Puri [14] adopted Taguchi-GRA
technique to maximize MRR and minimize SR while machining titanium alloys. Satpathy
et al. [15] combined principal component analysis with technique for order of preference by
similarity to ideal solution (TOPSIS) for multi-objective optimization of an EDM process,
while taking into account peak current, pulse-on time, duty cycle and gap voltage as the
input parameters, and MRR, TWR, ROC and SR as the responses. Applying VIKOR index
as a multi-objective optimization tool for an EDM process, Mohanty et al. [16] determined
the optimal settings of current, pulse-on time and voltage for having better values of MRR,
TWR, SR and ROC. Singh et al. [17] utilized NSGA-II technique to optimize MRR and
TWR in an EDM process while considering peak current, pulse-on time, pulses-off time
and gap voltage as the input parameters. Gostimirovic et al. [18] modeled the energy
efficiency of an EDM process with respect to MRR and SR responses. Evolutionary multi-
objective optimization was later performed to derive a set of optimal solutions for discharge
energy taking into account discharge current and discharge duration as the input parameters.
Ramprabhu et al. [19] applied passing vehicle search (PVS) as a multi-objective
optimization tool for optimizing various input parameters of an EDM process. The
performance of the adopted technique was also compared with that of other intelligent
computing models. Based on GRA technique, Tharian et al. [20] performed multi-objective
optimization of MRR and SR during EDM operation of Al7075 alloy. Huu et al. [21]
proposed the application of multi-objective optimization based on ratio analysis (MOORA)
method for having better values of MRR, SR and TWR during EDM operation of SKD61
die steel with low-frequency vibration. Analytic hierarchy process (AHP) was utilized to
estimate relative weights of the considered responses. While employing response surface
methodology (RSM)-based regression models, Niamat et al. [22] endeavored to study the

284 V. KUMAR, S. DIYALEY, S. CHAKRABORTY
influences of current, pulse-on time and pulse-off time on MRR, SR and TWR in an EDM
process. Multi-objective optimization was also performed to achieve sustainability while
optimizing the conflicting responses.
The above-cited review of the existing literature reveals that parametric optimization of
EDM processes has already caught the attention of the research community, and several
optimization techniques, like GA, NSGA-II, simulated annealing, PVS, PSO, etc. have been
applied in this direction. Those adopted algorithms have too many algorithmic parameters,
which if not properly tuned, may increase the computational effort and result in local
optimal solutions. Similarly, numerous multi-criteria decision making approaches, such as
VIKOR, TOPSIS, GRA, AHP, MOORA, etc. have also been utilized to determine the most
feasible parametric mixes for EDM processes. But, in most of the cases, near optimal or
sub-optimal solutions have been arrived at. Moreover, there is a scarcity of research works
dealing with comparative analysis of the optimization performance of the available
metaheuristic algorithms. In order to overcome such drawbacks, the TLBO algorithm is
applied in this paper for the first time to find out the best combination of four EDM process
parameters while machining pearlitic SG iron 450/12 grade work material in order to
simultaneously optimize the responses under consideration. The TLBO algorithm is a
population-based optimization technique, requiring no algorithmic specific parameters and
has already earned a broad acceptance among the researchers in the optimization domain.
This algorithm is efficient, simple and capable of achieving almost global optimal solutions
with less computational effort. The comparative analysis results reveal that it is more
flexible, robust and reliable as compared to other mostly preferred metaheuristic algorithms,
like FA, DE and CS techniques. Their optimization performance is compared with respect
to three metrics, i.e. accuracy of the derived solutions, consistency of the solutions and
convergence speed. These comparison results are also validated using the developed boxplots
and paired t-test.
3. TLBO ALGORITHM
The TLBO algorithm is based on the concept of improving knowledge of the students
within the classroom by the teacher first, and the knowledge is further upgraded by the
mutual interaction among the students [23]. This algorithm thus consists of two phases,
i.e. a) teacher phase and b) student phase. The knowledge acquired by the students from
the teacher is known as the teacher’s phase. On the other hand, enrichment in knowledge
through mutual interactions among the students is known as the student’s phase [24].
Teacher Phase
In this algorithm, the teacher is supposed to be the best solution in an entire set of
solutions and the learners acquire knowledge from the teacher. A teacher always attempts
to improve the grades of all the students in the class by bettering the mean result of the
entire class. But, from the practical point of view, it is not at all possible to uplift the
mean result of the class because the learning capability of the class depends on the ability
of the students to grab knowledge from the concerned teacher. Let Xj,k,i be any value in
the solution, where j is the design variable (subject taken by the learners) (j = 1,2,...,m); k
is the population member (i.e. learner) (k = 1,2,...,n) and i is the iteration number (i =
1,2,...,Genmax) (Genmax is the number of maximum iterations). The teacher phase begins
Teaching-Learning-Based Parametric Optimization of an Electrical Discharge Machining Process 285
with the identification of the teacher (best solution) from the available population, based
on the objective function value. Atith iteration, Xk,i represents the best solution having the
value of f(Xk,i) being minimum among the population. This best solution is denoted as
Xkbest,i.. The mean result Mj,i of the learners in jth subject is computed. In this algorithm,
the teacher always attempts to uplift the mean result of the entire class in a particular
subject. Thus, the difference between the result of the teacher and mean result of the
learners in each subject is represented as:
Difference_Meanj,k,i = rj,i(Xj,kbest,i – TfMj,i) (1)
where rj,iis a random number between 0 and 1,Xj,kbest,i is the result of the best learner in jth
subject, and Tf is the teaching factor which chooses the value of the mean to be modified.
The value of Tf can be either 1 or 2 and is decided randomly using the following equation:
Tf = round [1 + rand (0,1){2-1}] (2)
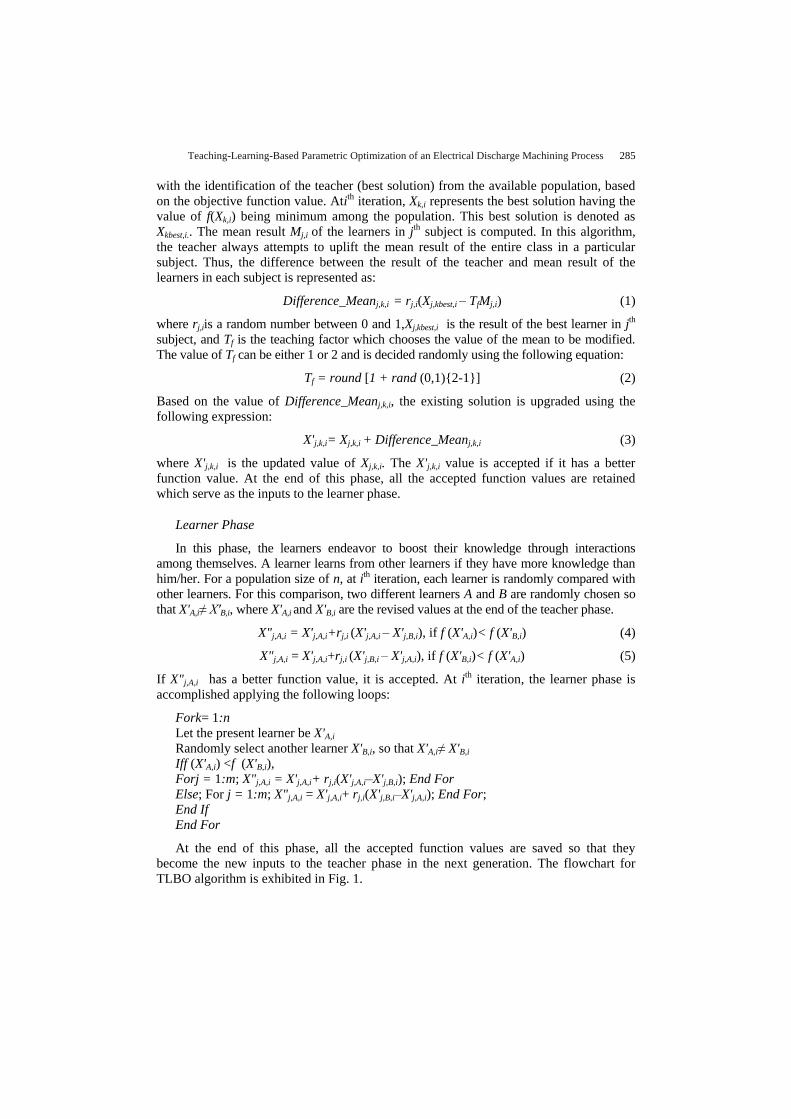
Based on the value of Difference_Meanj,k,i, the existing solution is upgraded using the
following expression:
X'j,k,i= Xj,k,i + Difference_Meanj,k,i (3)
where X'j,k,i is the updated value of Xj,k,i. The X'j,k,i value is accepted if it has a better
function value. At the end of this phase, all the accepted function values are retained
which serve as the inputs to the learner phase.
Learner Phase
In this phase, the learners endeavor to boost their knowledge through interactions
among themselves. A learner learns from other learners if they have more knowledge than
him/her. For a population size of n, at ith iteration, each learner is randomly compared with
other learners. For this comparison, two different learners A and B are randomly chosen so
that X'A,i≠ X'B,i, where X'A,i and X'B,i are the revised values at the end of the teacher phase.
X"j,A,i = X'j,A,i+rj,i (X'j,A,i – X'j,B,i), if f (X'A,i)< f (X'B,i) (4)
X"j,A,i = X'j,A,i+rj,i (X'j,B,i – X'j,A,i), if f (X'B,i)< f (X'A,i) (5)
If X"j,A,i has a better function value, it is accepted. At ith iteration, the learner phase is
accomplished applying the following loops:
Fork= 1:n
Let the present learner be X'A,i
Randomly select another learner X'B,i, so that X'A,i≠ X'B,i
Iff (X'A,i) <f (X'B,i),
Forj = 1:m; X"j,A,i = X'j,A,i+ rj,i(X'j,A,i–X'j,B,i); End For
Else; For j = 1:m; X"j,A,i = X'j,A,i+ rj,i(X'j,B,i–X'j,A,i); End For;
End If
End For
At the end of this phase, all the accepted function values are saved so that they
become the new inputs to the teacher phase in the next generation. The flowchart for
TLBO algorithm is exhibited in Fig. 1.

286 V. KUMAR, S. DIYALEY, S. CHAKRABORTY
Fig. 1 Flowchart of TLBO algorithm
4. EXPERIMENTAL DETAILS
This paper deals with the EDM operation for generation of standard holes on pearlitic
SG iron 450/12 grade material while considering gap voltage, peak current, cycle time and
rotation of the tool (electrode) as the input parameters. This work material for EDM
operation is chosen due to its several favorable properties, like good wear and corrosion
resistance, better castability and machinability, reasonable strength, low cost, suitability for
hydraulic applications as compared to steel, malleable and grey iron castings, capability to
generate intricate shapes due to better fluidity as compared to steel castings, requirement of
less heat treatment resulting in better dimensional stability compared to malleable castings
etc. It has found wide ranging applications in manufacturing of water pump bodies, pump
housings, pump covers, pump hub for cooling system of diesel engines, manifolds for inlet
Teaching-Learning-Based Parametric Optimization of an Electrical Discharge Machining Process 287
and exhaust valves, castings for engine mounting arms, engine supports, fly wheels, engine
couplings, drive coupling assembles, anti-vibration mountings, etc., pulleys for crankshaft
assembly, castings for reduction gear boxes, bearing covers and end covers, castings for
machine tool components, etc. The chemical composition and mechanical properties of SG
iron 450/12 grade material are respectively provided in Tables 1 and 2.
Table 1 Chemical composition of pearlitic ductile iron
Element C Si Mn P S Cr Mo Cu Mg Ti Zn Fe Others
% 3.365 2.393 0.238 0.072 <0.150 0.007 <0.010 0.37 0.085 0.032 0.027 90.75 2.661
Table 2 Mechanical properties of pearlitic SG iron (450/12 grade)
Mechanical property Value
Tensile strength 450 MPa
Yield strength 310 MPa
Elongation 12%
Hardness 197 BHN
Density 6.95 gm/cm³
Relative wear resistance Excellent
Table 3 EDM process parameters with their operating levels
Process parameter Symbol Unit Level
-2 -1 0 1 2
Gap voltage x1 V 40 45 50 55 60
Peak current x2 A 20 30 40 50 60
Cycle time x3 μs 80 160 240 320 400
Tool rotation x4 rpm 5 15 25 35 45
While performing EDM operation on pearlitic SG iron 450/12 grade material, each of
the considered EDM process parameters has been varied at five different operating levels,
as shown in Table 3. According to the central composite design plan, for four factors with
five levels, 30 experiments have been conducted in an Agietron 250 C EDM set-up. It has
the following specifications, e.g. working area: [X 700 Y 500 Z 500] mm, maximum
workpiece dimension: [L 1000 W 700 H 320] mm, maximum workpiece weight: 1200
kg, maximum electrode weight: 400 kg, work tank volume: 360 l, dielectric unit capacity:
1200 l and accuracy: 0.001 mm. The photograph of the EDM set-up is shown in Fig. 2.
During the machining operation, Castrol SE 180 EDM fluid is used as the dielectric
because of its various advantageous properties, like low odor, higher stability with
extended fluid life, low viscosity, high flash point, increased reliability and safe use. The
specimen size has been taken as 15 × 40 mm.

288 V. KUMAR, S. DIYALEY, S. CHAKRABORTY
Table 4 Details of experimental results
Exp. No. Gap
voltage
Peak
current
Cycle
time Rotation MRR SR TWR OC CE
1 50 20 240 25 6.00 8.572 0.589 0.8084 0.2914
2 40 40 240 25 16.60 8.581 0.671 0.8495 0.2982
3 50 40 240 45 13.07 8.092 0.623 0.8473 0.1495
4 50 60 240 25 21.07 8.532 0.698 0.8606 0.3055
5 50 40 240 25 11.98 8.712 0.612 0.8333 0.3012
6 50 40 240 5 9.28 9.612 0.599 0.8295 0.3197
7 60 40 240 25 15.98 8.902 0.663 0.8493 0.2998
8 50 40 400 25 23.26 8.742 0.726 0.9266 0.3032
9 50 40 80 25 4.10 8.622 0.531 0.7623 0.2989
10 50 40 240 25 15.21 8.531 0.659 0.8492 0.3011
11 45 30 320 35 7.41 8.235 0.590 0.8077 0.1932
12 55 30 320 15 6.10 9.092 0.586 0.8095 0.3176
13 50 40 240 25 13.07 8.626 0.627 0.8446 0.3014
14 45 30 160 15 2.25 9.207 0.522 0.7233 0.3143
15 55 50 320 15 18.14 9.367 0.677 0.8543 0.3179
16 45 30 160 35 2.16 8.265 0.518 0.7154 0.1795
17 45 50 320 15 19.29 9.247 0.696 0.8559 0.3174
18 45 50 160 35 4.98 8.635 0.545 0.7827 0.1934
19 50 40 240 25 9.95 8.732 0.597 0.8297 0.3019
20 55 30 160 35 3.59 8.475 0.529 0.7345 0.2236
21 55 30 160 15 1.97 9.212 0.511 0.7154 0.3161
22 55 50 160 35 6.25 8.685 0.593 0.8246 0.2579
23 55 30 320 35 22.13 8.345 0.719 0.9118 0.2003
24 50 40 240 25 12.84 8.826 0.618 0.8393 0.3015
25 45 50 320 35 19.78 8.436 0.692 0.8604 0.2693
26 45 50 160 15 4.96 9.232 0.548 0.7725 0.3156
27 55 50 320 35 21.24 8.176 0.702 0.8988 0.2009
28 50 40 240 25 11.06 8.696 0.605 0.8306 0.3018
29 55 50 160 15 5.65 9.172 0.552 0.7935 0.3164
30 45 30 320 15 5.80 9.497 0.567 0.8077 0.3183
It is worthwhile to mention here that all the 30 experiment runs have been performed in
random order so that the machining error can be minimized. Five most important responses
(outputs) of the EDM process are considered here, i.e. MRR (in mm3/min), SR (in μm),
EWR (in mm3/min), OC (in mm) and CE (in mm). For measurement of MRR and EWR, an
electronic weighing balance (A&D GR-202 type) has been employed. On the other hand,
SR has been measured using HommelWerke Turbo Wave V7.20 roughness tester, and
ZEISS O-INSPECT 442 CMM machine (with GEOMET universal CMM software) has
been used for measuring both OC and CE. Table 4 displays the experimental design plan
along with the measured values of the considered responses. In Fig. 3, the photographs of
the copper electrode utilized during EDM operation and the machined component are
provided. Among these responses, MRR is the sole larger-the-better quality characteristic,
and the remaining three are of smaller-the-better type.

Teaching-Learning-Based Parametric Optimization of an Electrical Discharge Machining Process 289
Fig. 2 EDM set-up
Fig. 3 Round copper tool and machined component (5 mm depth and 20 mm dia.)
5. OPTIMIZATION OF THE EDM PROCESS
Now, based on the experimental data of Table 4 and using Minitab software (R17),
the following RSM-based equations are developed for the five responses, considering the
main, second order and interaction effects between the considered EDM process
parameters. Higher values of the corresponding coefficient of determination (R2) justify
that these RSM-based equations are the best fit models depicting the relationships
between the process parameters and responses.
1 2 3 4 1 22
1 4 2 3 3 4
( ) –5.0 0.235 0.727 – 0.05 –1.436 – 0.0 ...
(
174
0.0241 0.00196 0.00149 81.5 )7
Y MRR x x x x x x
x x x x x x R
(6)
2
1 2 3 4( ) 9.57433 0.00305 0.00207 – 0.000105 – 0.0407 85.47( )Y SR x x x x R (7)
1 2 3 4
2 2 2 2
1 2 3 42
1 2 2 4 3 4
0.54 – 0.0134 0.0073 0.000319 0.00329 ...
0.000201 – 0.000008 – 0.000001 – 0.00009 – ...
0.00013
( )
(0.000011 0.00001 84.59)
Y TWR x x x x
x x x x
x x x x x x R
(8)
2
1 2 3 4 12 2 2
2 3 4 1 2 1 42
2 3 2 4 3 4
( ) 0.147 0.0101 0.01212 0.01184 – 0.00912 – 0.000133 – ...
0.000071 – 0.0000001 – 0.000061 – 0.000022 0.000238 – ...
0.000012 – 0.000014 0.000008 84.59( )
Y OC x x x x x
x x x x x x x
x x x x x x R
(9)

290 V. KUMAR, S. DIYALEY, S. CHAKRABORTY
1 2 3 4
2 2 2
1 2 4 1 2 1 42
2 3 2 4
( ) –0.162 0.016 0.00459 0.000158 – 0.00091 – ...
0.000142 – 0.000037 – 0.000196 – 0.000069 0.000056 ...
0.000002 0.000077 90.5( )6
Y CE x x x x
x x x x x x x
x x x x R
(10)
Table 5 Results of single-objective optimization
Response Method Mean SD Optimal
value
Parameter
Gap
voltage
Peak
current
Cycle
time
Tool
rotation
MRR
FA 40.629 1.169 40.824 60 55.172 387.421 45
DE 38.952 0.576 39.022 55.03 58.75 393.49 39.363
CS 41.316 1.201 41.508 56.457 57.999 392.36 44.76
TLBO 44.629 0.246 44.660 60 60 400 45
SR
FA 7.938 0.001 7.904 43.482 32.00 361.18 45
DE 8.009 0.001 7.987 58.05 27.39 194.14 44.23
CS 8.01 0.017 7.883 40 27.85 372.16 45
TLBO 7.874 0.0009 7.864 40 20 400 45
TWR
FA 0.481 0.004 0.480 50.5481 42.169 110.778 45
DE 0.435 0.01 0.434 45.975 26.991 93.612 45
CS 0.437 0.009 0.436 46.963 30.184 88.668 45
TLBO 0.403 0.00069 0.402 40.024 20.001 80 45
OC
FA 0.689 0.005 0.688 45.813 23.817 173.132 43.464
DE 0.626 0.008 0.625 43.351 26.565 117.224 44.966
CS 0.605 0.006 0.604 43.014 28.959 86.787 45
TLBO 0.515 0.002 0.514 40.024 20.215 80 45
CE
FA 0.078 0.002 0.077 45.77 26.02 116.07 45
DE 0.058 0.004 0.057 45.86 20.05 94.71 44.68
CS 0.060 0.004 0.059 43.66 25.411 81.892 45
TLBO 0.021 0.001 0.020 40 20 80 45
It has already been mentioned that this paper focuses on the applications of four popular metaheuristic algorithms in the form of FA, DE, CS and TLBO techniques for both single- and multi-objective optimization of the considered EDM process. While solving this parametric optimization problem using the considered algorithms, the corresponding values of different algorithmic parameters are set as follows:
FA: Number of iterations = 500, number of fireflies = 300, light absorption coefficient = 1, initial randomness = 0.9, randomness factor = 0.91 and randomness reduction = 0.75.
DE algorithm: Number of iterations = 500, population size = 300, lower bound of scaling factor = 0.2, upper bound of scaling factor = 0.8 and crossover probability = 0.9.
CS algorithm: Number of iterations = 500, population size (nests) = 300 and discovering rate of alien eggs = 0.25.
TLBO algorithm: Number of iterations = 500 and population size = 300.
For single objective optimization, the developed equations are solved using the considered metaheuristics within the given sets of constraints as 40 ≤ x1≤ 60, 20 ≤ x2≤ 60, 80 ≤ x3≤ 400 and 5 ≤ x4≤ 45. The results of this single objective optimization are provided in Table 5. It can be clearly unveiled from the table that among the four metaheuristics, the TLBO algorithm has the superiority over the others with respect to better values of the responses with higher accuracy and lower standard deviation (SD). The results of single objective optimization derive the optimal settings of the four EDM process parameters to be

Teaching-Learning-Based Parametric Optimization of an Electrical Discharge Machining Process 291
maintained for maximization/minimization of the considered responses. The boxplots of Fig. 4 prove that the optimal solutions derived using the TLBO algorithm are more consistent having the lowest variability as compared to others. On the other hand, the convergence diagrams, as exhibited in Fig. 5, also demonstrate that TLBO algorithm requires less computational effort with respect to both computation speed and time. It can be interestingly noticed that the TLBO algorithm provides the optimal solutions for all the five EDM responses almost within 5-10 iterations.
(a)
(b)
(c)
(d)
(e)
Fig. 4 Boxplots for the considered metaheuristic algorithms

292 V. KUMAR, S. DIYALEY, S. CHAKRABORTY
(a)
(b)
(c)
(d)
(e)
Fig. 5 Convergence diagrams for the metaheuristic algorithms
Table 6 t-test results with respect to the TLBO algorithm
Response FA DE CS
MRR 74.817 204.362 60.383
SR -272.183 -1423.66 -28.1014
TWR -205.229 -57.451 -63.872
OC -627.432 -351.727 -436.548
CE -409.364 -183.558 -191.048

Teaching-Learning-Based Parametric Optimization of an Electrical Discharge Machining Process 293
Finally, in order to validate the uniqueness of the TLBO algorithm over the remaining
three optimization techniques, two-tailed paired t-tests are performed with the null
hypothesis and alternative hypothesis as H0(µA= µB) and Hα(µA≠ µB) respectively (where α
is the level of significance, and µA and µB are respectively the mean response values
obtained using two algorithms being pair-wise compared). The results of the paired t-tests
are provided in Table 6. In this table, as the absolute values of t-statistic for all the
responses for the pair-wise comparisons between TLBO and other algorithms are greater
than the corresponding tabulated t-value, the null hypotheses can be rejected. It thus
demonstrates the uniqueness of the optimization performance of the TLBO algorithm
against the other techniques while providing the best single objective optimization solutions.
Based on the optimal solutions provided by the TLBO algorithm, effects of the EDM
process parameters under consideration on the responses are investigated using the
developed response graphs of Figs. 6-10. Fig. 6 exhibits how the obtained MRR changes
with varying values of the process parameters. It can be interestingly noticed that with the
increasing values of all the EDM process parameters, the MRR values also increase. Higher
values of gap voltage, peak current and cycle time cause the available discharge energy to
increase, resulting in more melting and vaporization of material from the workpiece. The
impulsive force in the spark gap also increases, which is responsible for higher MRR [25].
(a)
(b)
(c)
(d)
Fig. 6 Effects of EDM process parameters on MRR
294 V. KUMAR, S. DIYALEY, S. CHAKRABORTY
In this EDM process, the tool (electrode) rotates normal to the workpiece surface and a
centrifugal force is thus generated causing more debris removal from the machining zone.
Tool rotation in the EDM process also results in formation of a thin recast layer, and the
debris get easily cleared from the melt pool while exposing the workpiece to increased
spark intensity. Thus, less material remains in the melt cavity to be re-deposited over the
workpiece surface [26]. Tool rotation eases the flushing problem as encountered during
the EDM operation.
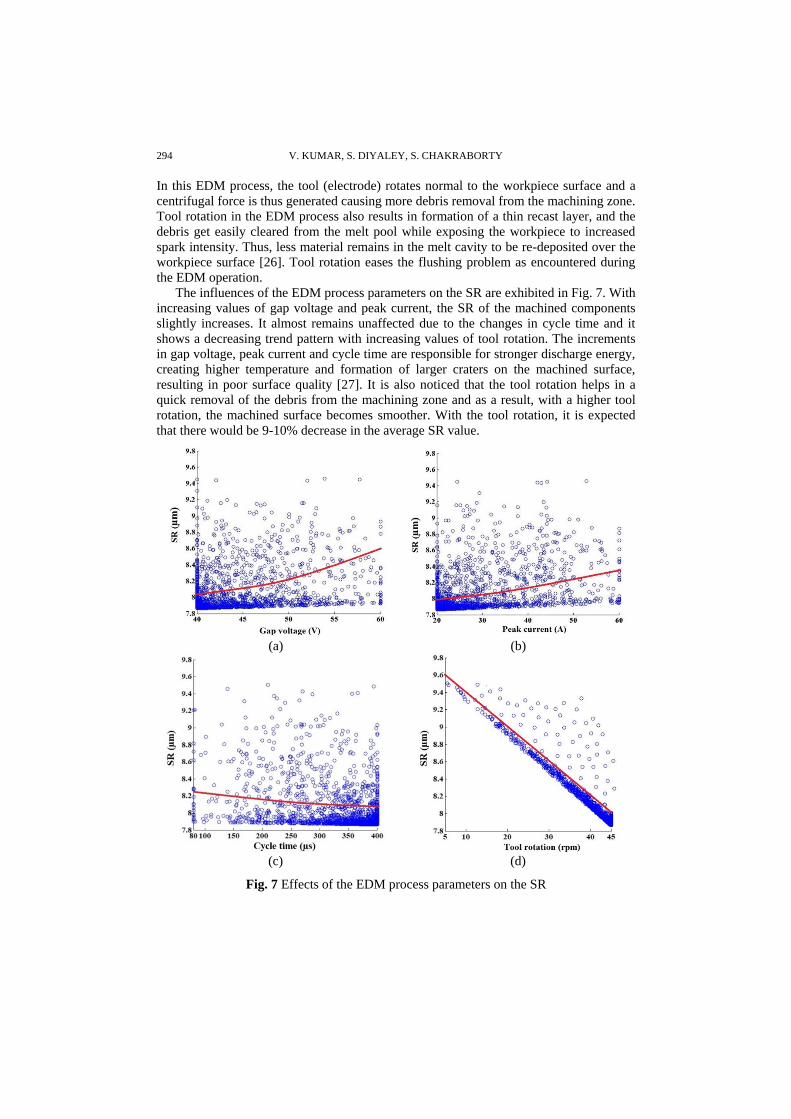
The influences of the EDM process parameters on the SR are exhibited in Fig. 7. With
increasing values of gap voltage and peak current, the SR of the machined components
slightly increases. It almost remains unaffected due to the changes in cycle time and it
shows a decreasing trend pattern with increasing values of tool rotation. The increments
in gap voltage, peak current and cycle time are responsible for stronger discharge energy,
creating higher temperature and formation of larger craters on the machined surface,
resulting in poor surface quality [27]. It is also noticed that the tool rotation helps in a
quick removal of the debris from the machining zone and as a result, with a higher tool
rotation, the machined surface becomes smoother. With the tool rotation, it is expected
that there would be 9-10% decrease in the average SR value.
(a)
(b)
(c)
(d)
Fig. 7 Effects of the EDM process parameters on the SR
Teaching-Learning-Based Parametric Optimization of an Electrical Discharge Machining Process 295
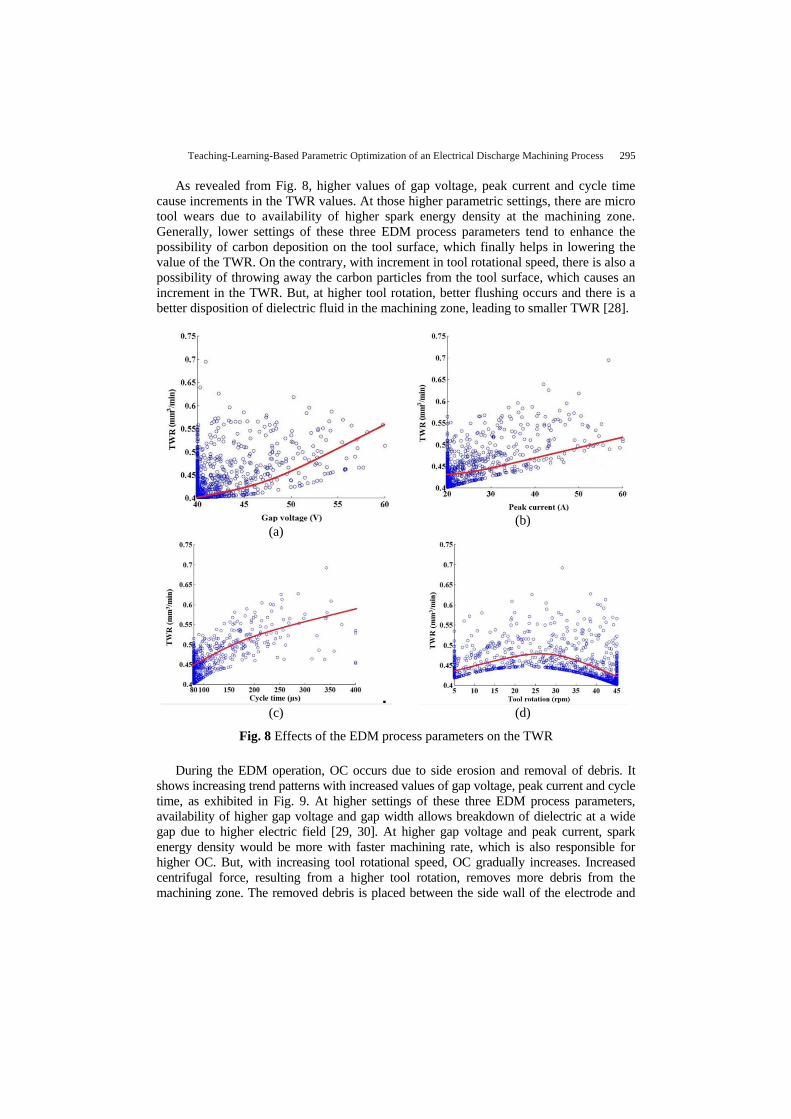
As revealed from Fig. 8, higher values of gap voltage, peak current and cycle time
cause increments in the TWR values. At those higher parametric settings, there are micro
tool wears due to availability of higher spark energy density at the machining zone.
Generally, lower settings of these three EDM process parameters tend to enhance the
possibility of carbon deposition on the tool surface, which finally helps in lowering the
value of the TWR. On the contrary, with increment in tool rotational speed, there is also a
possibility of throwing away the carbon particles from the tool surface, which causes an
increment in the TWR. But, at higher tool rotation, better flushing occurs and there is a
better disposition of dielectric fluid in the machining zone, leading to smaller TWR [28].
(a)
(b)
(c)
(d)
Fig. 8 Effects of the EDM process parameters on the TWR
During the EDM operation, OC occurs due to side erosion and removal of debris. It
shows increasing trend patterns with increased values of gap voltage, peak current and cycle
time, as exhibited in Fig. 9. At higher settings of these three EDM process parameters,
availability of higher gap voltage and gap width allows breakdown of dielectric at a wide
gap due to higher electric field [29, 30]. At higher gap voltage and peak current, spark
energy density would be more with faster machining rate, which is also responsible for
higher OC. But, with increasing tool rotational speed, OC gradually increases. Increased
centrifugal force, resulting from a higher tool rotation, removes more debris from the
machining zone. The removed debris is placed between the side wall of the electrode and

296 V. KUMAR, S. DIYALEY, S. CHAKRABORTY
workpiece, causing generation of a spark between them. It leads to higher OC. At a higher
tool rotational speed, there would be more turbulence taking place at the machining zone
which would perhaps be responsible for removal of the debris, leading to gradual decrement
in OC.
The CE in the machined components occurs due to non-uniform undercut and overcut
which can be effectively controlled by proper settings of different EDM process parameters.
As noticed in Fig. 10, with increasing values of gap voltage, peak current and cycle time,
CE shows an increasing trend pattern. It is also affected by tool rotation. At a higher gap
voltage, peak current and cycle time, there are occurrences of secondary spark discharges
caused by poor flushing, which are responsible for inferior CE. Increase in CE is also
occurred due to high tool wear and sporadic machining at higher voltage [31]. A higher tool
rotational speed may create turbulence of the dielectric fluid at the machining zone, which
would be responsible for removal of debris from the external periphery of the machined
hole. Thus, there may be a high chance of obtaining lower CE at higher tool rotation.
(a)
(b)
(c)
(d)
Fig. 9 Effects of the EDM process parameters on the OC

Teaching-Learning-Based Parametric Optimization of an Electrical Discharge Machining Process 297
(a)
(b)
(c)
(d)
Fig. 10 Effects of the EDM process parameters on the CE
It can be noticed from the results of single objective optimization of the considered
EDM process that separate parametric settings are obtained for different responses based
on the applications of four metaheuristic algorithms. But, in a real time machining
environment, it is never possible for an operator to set the EDM process parameters at
different operating levels in a single EDM set-up. It is thus always advised to derive a
unique combination of the process parameters so as to simultaneously optimize all the
five responses. For this purpose, the following multi-objective optimization model is
developed which is subsequently solved using the considered metaheuristics.
min
5
min
4
min
3
min
2
max
1
(CE)
)CE(
(OC)
)OC(
(EWR)
)EWR(
(SR)
)SR(
(MRR)
)MRR(Minimize
YwYwYwYwYwZ
(11)
where w1, w2, w3, w4 and w5 are the weights allotted to MRR, SR, EWR, OC and CE
respectively, (MRR)max is the maximum value of MRR, (SR)min, (EWR)min, (OC)min and
(CE)min are the minimum values of SR, EWR, OC and CE, respectively. These values are
obtained from the results of single objective optimization of the responses. In this paper,
equal weights are assigned to all the responses under consideration. The solutions of this
multi-objective optimization problem are provided in Table 7. It can be clearly unveiled from
this table that the TLBO algorithm again excels over the remaining three metaheuristics with

298 V. KUMAR, S. DIYALEY, S. CHAKRABORTY
respect to accuracy and consistency of the derived optimal solutions. Thus, for obtaining
the most desired performance of the EDM process while generating standard holes on
pearlitic SG iron 450/12 grade work material, it is always recommended to set the input
parameters as gap voltage = 41 V, peak current = 58.58 A, cycle time = 285 μs and tool
rotation = 45 rpm. Thus, based on the optimal solutions derived using TLBO algorithm, it
can be concluded that lower gap voltage, higher peak current, moderate cycle time and
higher tool rotational speed would concurrently optimize all the responses of the
considered EDM process.
Table 8 exhibits the percentage improvements in the response values based on the
multi-objective optimization results of the TLBO algorithm against FA, DE and CS
techniques. It can be observed from this table that for the considered EDM process, the
values of MRR, SR, TWR, OC and CE are significantly improved employing the TLBO
algorithm as compared to other metaheuristic algorithms.
Table 7 Results of multi-objective optimization
Method Response Mean SD Optimal
value Z
Parameter
Gap
voltage
Peak
current
Cycle
time
Tool
rotation
FA MRR
SR
TWR
OC
CE
2.229 0.107 23.2
7.96
0.436
0.8
0.182
2.225 43.258 56.25 290 45
DE MRR
SR
TWR
OC
CE
2.309 0.152 21.953
7.961
0.428
0.788
0.181
2.303 42.3 57.25 278.35 45
CS MRR
SR
TWR
OC
CE
2.293 0.192 22.808
7.959
0.434
0.779
0.179
2.284 41.23 58.23 283.56 45
TLBO MRR
SR
TWR
OC
CE
2.223 0.09 24.012
7.959
0.409
0.708
0.178
2.218 41 58.58 285 45
Table 8 Percentage improvements in responses using the TLBO algorithm
Response FA DE CS
MRR 3.5 9.37 5.27
SR 0.75 0.75 0
TWR 6.19 4.43 5.76
OC 11.5 10.15 9.11
CE 2.19 1.65 0.55

Teaching-Learning-Based Parametric Optimization of an Electrical Discharge Machining Process 299
6. CONCLUSIONS
The paper studies the capability of an EDM process in generating standard holes on
pearlitic SG iron 450/12 grade material, which has found wide ranging applications in
manufacturing of diverse mechanical components. The optimal settings of gap voltage,
peak current, cycle time and tool rotation for the considered machining application are
determined using the TLBO algorithm. It is observed that lower gap voltage, higher peak
current, moderate cycle time and higher tool rotational speed would simultaneously
optimize material removal rate, surface roughness, tool wear rate, radial overcut and
circularity error of this EDM process. The effects of all these EDM process parameters on
the responses are also investigated. The optimization performance of the TLBO algorithm is
compared with three other metaheuristics, and it is concluded that the TLBO algorithm
excels over the others with respect to higher accuracy of the optimal solutions with low
variability and less computational effort. The results of the paired t-tests and developed
boxplots also confirm this observation. This algorithm provides almost global optimal
solutions for both single- and multi-objective optimization problems as it is least affected
due the settings of its different tuning parameters. The applicability of this algorithm for
optimization of other conventional and non-conventional machining processes can also be
explored. The effects of changing weights allotted to different responses on the optimization
performance of TLBO algorithm can be examined as the future scope of this paper.
REFERENCES
1. El-Hofy, H., 2005, Advanced Machining Processes: Nontraditional and Hybrid Machining Processes,
McGraw-Hill, New York, USA.
2. Pandey, P.C., Shan, H.S., 2005, Modern Machining Processes, Tata MacGraw-Hill Publishing Com. Ltd.,
New Delhi, India.
3. Qudeiri, J.E.A., Mourad, A-H.I., Ziout, A., Abidi, M.H., Elkaseer, A., 2018, Electric discharge machining of
titanium and its alloys: Review, International Journal of Advanced Manufacturing Technology, 96(1-4), pp.
1319-1339.
4. Gangil, M., Pradhan, M.K., Purohit, R., 2017, Review on modelling and optimization of electrical discharge
machining process using modern techniques, Materials Today: Proceedings, 4(2), pp. 2048-2057. 5. Mandal, D., Pal, S.K., Saha, P., 2007,Modeling of electrical discharge machining process using
backpropagation neural network and multi-objective optimization using non-dominating sorting genetic
algorithm-II, Journal of Materials Processing Technology, 186(1-3), pp. 154-162.
6. Bharti, P.S., Maheshwari, S., Sharma, C., 2012, Multi-objective optimization of electric-discharge
machining process using controlled elitist NSGA-II, Journal of Mechanical Science and Technology, 26(6),
pp. 1875-1883.
7. Baraskar, S.S., Banwait, S.S., Laroiya, S.C., 2013, Multiobjective optimization of electrical discharge
machining process using a hybrid method, Materials and Manufacturing Processes, 28(4), pp. 348-354.
8. Shivakoti, I., Kibria, G., Diyaley, S., Pradhan, B.B., 2013, Multi-objective optimization and analysis of
electrical discharge machining process during micro-hole machining of D3 die steel employing salt mixed
de-ionized water dielectric, Journal of Computational and Applied Research in Mechanical Engineering,
3(1), pp. 27-39.
9. Aich, U., Banerjee, S., 2014, A simple procedure for searching Pareto optimal front in machining process:
Electric discharge machining, Modelling and Simulation in Engineering Article ID 594054: 12 pages,
http://dx.doi.org/10.1155/2014/594054.
10. Radhika, N., Shivaram, P., Vijay Karthik, K.T., 2014, Multi-objective optimization in electric discharge
machining of aluminium composite, Tribology in Industry, 36(4), pp. 428-436.
11. Tiwari, R.K., 2015, Multi-objective optimization of electrical discharge machining process parameters using
genetic algorithm, International Journal of Engineering Research and General Science, 3(3), pp. 1411-1423.

300 V. KUMAR, S. DIYALEY, S. CHAKRABORTY
12. Mazarbhuiya, R.M., Choudhury, P.K., Rahang, M., 2016, Taguchi-grey relational based multi-objective
optimization of process parameters in electric discharge machining of aluminium with copper electrode,
Journal of Basic and Applied Engineering Research, 3(13), pp. 1169-1171.
13. Mohanty, C.P., Mahapatra, S.S., Singh, M.R., 2016, A particle swarm approach for multi-objective
optimization of electrical discharge machining process, Journal of Intelligent Manufacturing, 27(6), pp.
1171-1190.
14. Gohil, V., Puri, Y.M., 2017, Multi-objective optimization of material removal rate and surface roughness in
electrical discharge turning of titanium alloy (Ti-6Al-V), Indian Journal of Engineering & Materials
Sciences, 24(6), pp. 429-436.
15. Satpathy, A., Tripathy, S., Senapati, N.P., Brahma, M.K., 2017, Optimization of EDM process parameters
for AlSiC-20% SiC reinforced metal matrix composite with multi response using TOPSIS, Materials Today:
Proceedings, 4, pp. 3043-3052.
16. Mohanty, U.K., Rana, J., Sharma, A., 2017, Multi-objective optimization of electro-discharge machining
(EDM) parameter for sustainable machining, Materials Today: Proceedings, 4(2), pp. 9147-9157.
17. Singh, B., Kumar, S., Kumar, J., 2017,Multi-objective optimization in electrical discharge machining of
6061 Al/SiCp using RSM and NSGA-II, Key Engineering Materials, 748, pp. 207-211.
18. Gostimirovic, M., Pucovsky, V., Sekulic, M., Radovanovic, M., Madic, M., 2018, Evolutionary multi-
objective optimization of energy efficiency in electrical discharge machining, Journal of Mechanical Science
and Technology, 32(10), pp. 4775-4785.
19. Ramprabhu, T., Savsani, V., Parsana, S., Radadia, N., Sheth, M., Sheth, N., 2018,Multi-objective
optimization of EDM process parameters by using passing vehicle search (PVS) algorithm, Defect and
Diffusion Forum, 382, pp. 138-146.
20. Tharian, B.K., Jacob, E., Johnson, J., Hari, V., 2019, Multi-objective parametric optimization in EDM using
grey relational analysis, Materials Today: Proceedings, 16(2), pp. 1013-1019.
21. Huu, P.N., Tien. L.B., Duc, Q.T., Van, D.P., Xuan, C.N., Van, T.N., Duc, L.N., Jamil, M., Khan, A.M,
2019. Multi-objective optimization of process parameter in EDM using low-frequency vibration of
workpiece assigned for SKD61, Sadhana, 44, 211, https://doi.org/10.1007/s12046-019-1185-y.
22. Niamat, M., Sarfraz, S., Ahmad, W., Shehab, E., Salonitis, K., 2020, Parametric modelling and multi-
objective optimization of electro discharge machining process parameters for sustainable production,
Energies, 13(1), 20 pages, doi:10.3390/en13010038.
23. Rao, R.V., Savsani, V.J., Vakharia, D.P., 2011, Teaching-learning-based optimization: a novel method for
constrained mechanical design optimization problems, Computer-Aided Design, 43(3), pp. 303-315.
24. Diyaley, S., Chakraborty, S., 2019, Optimization of multi-pass face milling parameters using metaheuristic
algorithms,FactaUniversitatis-Series Mechanical Engineering,17(3), pp. 365-383.
25. Gopalakannan, S., Senthivelan, T., Ranganathan, 2012, Modeling and optimization of EDM process
parameters on machining of Al7075-B4C MMC using RSM, Procedia Engineering, 38, pp. 685-690.
26. Dwivedi, A.P., Choudhury, S.K., 2016, Effect of tool rotation on MRR, TWR, and surface integrity of AISI-
D3 steel using the rotary EDM process, Materials and Manufacturing Processes, 31(14), pp. 1844-1852.
27. Kiyak, M., Çakır, O., 2007, Examination of machining parameters on surface roughness in EDM of tool
steel, Journal of Materials Processing Technology, 191(1-3), pp. 141-144.
28. Lin, Y.C., Lee, H.S., 2008, Machining characteristics of magnetic force-assisted EDM, International Journal
of Machine Tools and Manufacture, 48(11), pp. 1179-1186.
29. Pradhan, B.B., Masanata, M., Sarkar, B.R., Bhattacharyya, B.B., 2009, Investigation of electro-discharge
micro-machining of titanium super alloy, International Journal of Advanced Manufacturing Technology, 41,
pp. 1094-1106.
30. Jahan, M.P., Wong, Y.S., Rahman, M., 2008, A study on the fine-finish die-sinking micro-EDM of
tungsten carbide using different electrode materials, Journal of Materials Processing Technology, 209(8),
pp. 3956-3967.
31. Alshemary, A., Pramanik, A., Basak, A.K., Littlefair, G., 2018, Accuracy of duplex stainless steel feature
generated by electrical discharge machining (EDM), Measurement, 130, pp. 137-144.


