
Tax policy and innovation performance:
Evidence from enactment of the Alternative Simplified Credit
Abstract
We examine how direct tax incentives affect firm innovation performance using a new U.S. R&D
tax credit regime enacted in 2007, the Alternative Simplified Credit (ASC). A difference-in-
differences analysis indicates that innovation performance is poorer for ASC users than for firms
using the original R&D tax credit method following the ASC enactment. The results are stronger
for firms with poorer governance and greater innovation diversity. ASC users suffer from poorer
profitability and lower valuations. The findings remain robust to self-selection bias and various
robustness checks. Our evidence favors a dark-side view of R&D tax credit effects under the
ASC.
JEL classification: G30; G38; O38.
Keywords: R&D tax credits; Alternative Simplified Credit; Innovation performance; Innovation
diversity; Corporate governance.

1
Tax policy and innovation performance:
Evidence from enactment of the Alternative Simplified Credit
The U.S. tax code provides incentives to promote corporate investment that allows firms to
gain competitive advantages in global markets. To examine the effectiveness of tax policy as to
its impact on corporate intangible investment, researchers have focused mainly on research and
development (R&D) tax credits, which provide more direct tax incentives than general corporate
tax policies. These are perhaps the most visible tax incentives related to technology (see, e.g.,
Mansfield, 1986; Hall and Van Reenen, 2000). Mansfield (1986), Bloom, Griffith, and Van
Reenen (2002), Wilson (2009), Finley, Lusch, and Cook (2015), and Rao (2016) have
documented that U.S. R&D tax credits reduce R&D costs and have a positive effect on firm
R&D expenditures, suggesting that a favorable tax policy encourages corporate intangible
investment.1 Tax policy also has effects on corporate tangible investment. Hall and Jorgenson
(1967), Summers et al. (1981), and others show that favorable U.S. tax policies stimulate firm
capital expenditures by reducing investment costs.2
While prior studies suggest that U.S. R&D tax credits stimulate firm innovation inputs (i.e.,
R&D expenditures), how they affect firm innovation output performance has so far received
limited attention. As indicated by Hall, Jaffe, and Trajtenberg (2001, 2005) and Hsu (2009),
there is a variation in the innovation performance produced by an R&D expenditure. The
government cares more about firm R&D output performance than it does about firm R&D
expenditures when it evaluates the effects of R&D tax credit policy (Jaffe, 2000). This is because
R&D expenditures do not necessarily create positive economic value. The expenditures may in
1 Mukherjee, Singh, and Žaldokas (2017) examine general tax policies, which include changes in corporate tax rates
and other changes that affect the tax bill (e.g., reduction in income tax deductibility). They show that a reduction in
corporate tax rates has a weak but positive effect on firm innovation. Their finding is further confirmed by
Atanassov and Liu (2019). 2 For an excellent review, see Hanlon and Heitzman (2010).

2
fact have a negative economic impact if the R&D investment is wasteful or produces outputs that
perform poorly.
We examine how U.S. R&D tax credits affect firm innovation performance using a new
federal R&D tax credit regime, the Alternative Simplified Credit (ASC), made effective in 2007.
Prior to enactment of the ASC, all firms that qualified as R&D tax credit users applied for tax
credits within one R&D tax regime under the Omnibus Budget Reconciliation Act tax credit
(OBRA credit). The OBRA credit was complex and not friendly to innovative firms.3 The ASC
regime did not replace the OBRA credit, but rather became part of a dual-track system. Firms
could choose between two credit-calculation methods, depending on which method provided a
better tax credit, but a switch to the ASC regime is not reversible.
The ASC regime can have positive or negative effects on the performance of firm
innovation outputs. The bright-side view argues that the ASC leads to better innovation
performance. As R&D tax credits motivate firm investment in R&D and the ASC simplifies their
application, there is likely to be more R&D investment (Finley, Lusch, and Cook, 2015). When
the level of innovation inputs (i.e., R&D expenditures) is higher, use of the ASC is likely to
enhance firm innovation output performance (e.g., Aghion, Van Reenen, and Zingales, 2013;
Hsu, Tian, and Xu, 2014).
The dark-side view, on the other hand, argues that the ASC has a negative effect on
innovation performance because of the agency problem of free cash flow and internal capital
market inefficiency. Jensen (1986, 1993) defines free cash flow as the cash flow remaining after
a firm has invested in all positive net present value (NPV) projects, where free cash flow is an
inverse function of tax payments (e.g., Lehn and Poulsen, 1989; Lang, Stulz, and Walkling,
3 Industries generally regard the ASC as a friendlier R&D tax credit regime (see the report of IPC-Association
Connecting Electronics Industries at https://www.ipc.org/ContentPage.aspx?pageid=Alternative-Simplified-Credit-
Computation).

3
1991). As firms using the ASC method gain extra tax benefits, they will, all else equal, pay less
tax and generate more free cash flow. Thus, ASC firms are likely to face higher internal capital
market inefficiency, which arises from conflicts among internal innovation teams and the
misallocation of extra resources. This is consistent with the argument of Holmstrom (1989) that
innovation activities may mix poorly with relatively routine activities in an organization, a notion
confirmed by Henderson and Cockburn (1996), Sampson (2007), and Barnes, Lynham, Kalberg
and Leung (2016). Higher internal capital market inefficiency in ASC firms can diminish effort
paid to uncertain R&D projects, and adversely affect the performance of innovation outputs
(Seru, 2014).
To examine the impact of the ASC since 2007, we collect a sample of U.S. firms between
2003 and 2010 and identify them as either ASC or OBRA users according to federal tax laws,
Internal Revenue Code (IRC) Section 41. Our sample ends in 2010 to alleviate the patent
truncation issue noted by Hall, Jaffe, and Trajtenberg (2001, 2005). We use a
difference-in-differences approach and investigate the change in innovation performance since
2007 between firms switching from the OBRA to the ASC method and firms continuing with the
OBRA. If a firm gains an R&D tax credit through the OBRA before 2007 and shifts to the ASC
in any year between 2007 and 2010, we identify it as an ASC user. If a firm stays in the OBRA
regime in both pre- and post-2007 periods, we identify it as an OBRA user. We proxy for the
performance of innovation by citations per patent and number of patents, two common measures
used by prior researchers (e.g., Belenzon and Berkovitz, 2010; Aghion, Van Reenen, and
Zingales, 2013; He and Tian, 2013; Hirshleifer, Hsu, and Li, 2013; Hsu, Tian, and Xu, 2014).
We find that, relative to OBRA users, ASC users show a significant decline in citations per
patent and numbers of patents after enactment of the Alternative Simplified Credit. The impact

4
of ASC is also economically significant. Firms switching from the OBRA to the ASC experience
a decline in citations per patent (numbers of patents) of about 23.1% (22.8%) surrounding the
switching year compared to firms staying with OBRA. The results indicate that the ASC method
results in poorer performance of corporate innovation outputs, hence favoring the dark-side
rather than the bright-side view of the effects of R&D tax credits. As choice of the R&D tax
credit method is voluntary, we also perform a Heckman (1979) two-stage regression analysis to
control for potential self-selection bias. The results remain unchanged. The findings are also
robust when we use a sample limited to firms that identify themselves in their 10-K reports as
R&D tax credit users, or a propensity score matched sample, or alternative measures of
innovation performance (generality, originality, relative citations, self-citations, non-self-
citations, and aggregate citations).
We carry out two conditional tests to examine the strength of the reduction in patent counts
and citations per patent of the ASC users. ASC is expected to have a more negative impact on
innovation performance for firms with poorer corporate governance. Hoechle et al. (2012)
suggest that corporate governance explains a considerable amount of internal capital market
efficiency. Hence, when ASC users are not well governed, inefficiency in internal capital
markets resulting from the ASC method is higher. We also expect a more negative effect of ASC
on innovation performance when a firm has more diversified innovation activities. As innovation
diversity may lead to resource misallocation and agency costs (Holmstrom, 1989), firms with
greater innovation diversity are subject to poorer internal market efficiency. When firms with
more diversified innovation activities are less efficient in allocating the extra resources from the
additional free cash flows of the ASC tax benefit to different innovation teams, they are likely to
suffer greater deterioration in innovation performance. Consistent with our predictions, we find

5
stronger negative effects of ASC on innovation performance when firms have poorer governance
or face higher levels of innovation diversification.
Results of a number of additional tests corroborate our findings. If a firm adopting the ASC
method experiences poorer innovation performance than OBRA users, its operating performance
and valuation are likely to decline. We find supporting evidence by documenting that ASC users
experience poorer profitability and lower valuations than OBRA users after enactment of the
Alternative Simplified Credit.
We also investigate the effect of the Alternative Simplified Credit on young firms. As
young firms, with their stronger sales growth, are less likely to qualify for R&D tax credits under
the OBRA method, the ASC method may be advantageous to facilitate their innovation activities.
Thus, our difference-in-differences analysis tends to exclude young firms. To address this
concern, we compare innovation performance for young firms that do and do not use R&D tax
credits under the ASC method. We show that young firms using the ASC regime perform much
the same in innovation as other young firms, suggesting that our conclusion is not likely driven
by the exclusion of young firms.
Our results are also not explained by q-theory, which proposes that a firm selects
investment projects according to their NPV (e.g., Liu, Whited, and Zhang, 2009; Li and Zhang,
2010; Wu, Zhang, and Zhang, 2010). Q-theory predicts a more negative impact of the ASC
method on innovation performance for firms that have decreasing or constant returns to scale.
According to q-theory, the marginal revenue of investment declines with the level of investment,
and the firm decides its optimal investment when the marginal revenue equals the marginal cost
of capital. One important assumption behind q-theory is that firm technology is represented by a
production function exhibiting decreasing or constant returns to scale (Liu, Whited, and Zhang,

6
2009; Wu, Zhang, and Zhang, 2010). Thus, ASC users are expected to show poorer innovation
performance than OBRA users in the post-ASC period, and this relation is stronger for ASC
users with decreasing or constant returns to scale than for ASC users with increasing returns to
scale. We do not find, however, any significant difference in the ASC effect on innovation
performance between firms with decreasing or constant returns to scale and other firms.
One challenge to our research is that the ASC stimulates R&D investment, and probably
leads to technology dispersion with greater R&D spillover, which may be beneficial to other
firms’ innovation activities.4 We investigate this issue by performing R&D spillover regressions
using the spillover measure of Jaffe (1986), Bloom, Schankerman, and Van Reenen (2013), and
Qiu and Wan (2015). We show that the ASC method does not contribute to more R&D spillover
than the OBRA method, implying that the ASC is not associated with greater technology
dispersion.
It is possible that, when the OBRA regime was first enacted in 1981, R&D tax credits had
produced a negative effect on firm innovation performance. Hence, our results for the ASC
regime might be nothing more than reconfirmation of the evidence in a different R&D tax credit
regime. For a sample of U.S. firms between 1974 and 2006, we perform a
difference-in-differences analysis by examining whether there are differences in innovation
performance changes between OBRA users and firms not taking R&D tax credits. We find that
OBRA users significantly increased both citations per patent and patent counts over other firms
following the 1981 Omnibus Budget Reconciliation Act. In contrary to the ASC results that there
was a deterioration in innovation performance, the Omnibus Budget Reconciliation Act improves
the performance of innovation outputs. Thus, the evidence favors a bright-side view of R&D tax
4 See, for example, the U.S. Treasury Department report (https://www.treasury.gov/resource-center/tax-policy/tax
-analysis/Documents/RE-Credit.pdf).

7
credit effects under OBRA.
Finally, in a placebo test we examine whether our findings are driven merely by chance. We
replace each ASC user with a randomly selected firm from among OBRA users (i.e.,
pseudo-ASC users) and run regressions of number of citations per patent and number of patents
1,000 times. We show no significant impact of R&D tax credits on firm innovation performance
for these pseudo-ASC users, confirming that our findings are unlikely driven by pure luck.
Our paper makes three valuable contributions to the literature. First, our research provides
evidence regarding which and how tax-motivated activities do not necessarily enhance
shareholder value. Given a recent stream of studies on the dark-side economic consequences of
corporate tax avoidance, this paper helps rationalize why some tax avoidance reduces firm value
or increases managerial rent diversion (Lev and Nissim, 2004; Hanlon, 2005; Desai and
Dharmapala, 2006; Laplante, Skaife, Swenson, and Wangerin 2019). Second, the conventional
theory suggests that government tax policy provides incentives to mitigate R&D
underinvestment. Research in this regard focuses mainly on innovation inputs and shows that
U.S. R&D tax credits encourage R&D expenditures (e.g., Mansfield, 1986; Bloom, Griffith, and
Van Reenen, 2002; Wilson, 2009; Finley, Lusch, and Cook, 2015; Rao, 2016). We use a new
U.S. federal tax credit that became effective in 2007 as a quasi-experiment, and show that R&D
tax credits lead to a deterioration in the performance of innovation outputs subsequent to
establishment of that credit. Third, to the best of our knowledge, this is the first evidence to
document the dark-side effect of a government tax policy on firm innovation. Our research calls
into question whether the direct tax incentives enacted since 2007 to stimulate corporate R&D
investments create positive economic value for U.S. firms.
Second, a number of studies over the past decade have investigated the determinants of firm

8
innovation performance. They find that takeover provisions, liquidity, ownership structure,
top-executive compensation, analyst coverage, labor union and law enactment can affect the
performance of corporate innovation outputs (e.g., Becker-Blease, 2011; Aghion, Van Reenen,
and Zingales, 2013; Ederer and Manso, 2013; He and Tian, 2013; Fang, Tian, and Tice, 2014;
Bradley, Kim, and Tian, 2016; Png, 2017). Our research adds to this line of research by
documenting that government tax policy offering direct tax incentives through R&D tax credits
also plays an important role in determining innovation performance.
The rest of this paper is organized as follows. Section 1 describes U.S. R&D tax credit
policy. Section 2 explains our data and methodology and provides summary statistics. Section 3
examines the effect of the new R&D tax credit regime on innovation performance. Section 4
offers conditional tests. Section 5 presents a number of additional analyses. The final section
concludes.
1. U.S. R&D tax credits
The first regular R&D tax credit to be implemented in the U.S. established a statutory tax
credit of 25% under the Omnibus Budget Reconciliation Act of 1981. To earn this R&D tax
credit, a firm must have qualified research expenses (QREs) over a moving average threshold,
the average of past three-year qualified research expenses.5 In 1986, the U.S. Congress made a
significant change in taxes, including R&D tax credits. The statutory rate for R&D tax credits
was reduced to 20%, and the threshold became a fixed base. The base amount is a firm-specific
fixed research intensity (i.e., QREs in gross receipts from 1984 through 1988) multiplied by the
minimum of 16% or prior four-year average gross receipts. As in the 1981 OBRA, the credit
retained the 50% base-amount limitation of the current-year QRE. Further rules in the Omnibus
5 R&D tax credits and qualified research expenses were then defined in IRC § 44F (currently IRC § 41).

9
Budget Reconciliation Act of 1993 were intended to mitigate the problem that some firms did
not conduct research during 19841988. The base percentage was set at 3% for firms that had
just experienced their first five-year R&D spending and sales, a slightly higher base determined
by their R&D intensity for the sixth through tenth years, and a fixed base determined by their
R&D intensity thereafter.6
Since 2007, a dual-track R&D tax credit system has been implemented in the U.S. Firms can
apply for two alternative R&D tax credits when they conduct qualified research activities over a
certain threshold: regular R&D tax credits (OBRA) and alternative simplified research credits
(ASC). The ASC statutory credit rate was initially set at 12% in 2007 and has been increased to
14% since 2009. The ASC retains one feature of the original formula of the regular R&D tax
credits enacted in 1981, using a moving average of the previous three years. The R&D tax credits
in year t based on the OBRA and ASC methods are computed as follows:
,5.0,,16.0min4
1max2.0_
1988
1984
1988
19844
11989,
t
jj
jj
kktttt QRE
Sales
QRE
SalesQRECreditOBRA (1)
,3
15.0_
3
1
k
kttt Q R EQ R EC r e d i tA S C (2)
where QRE is qualified research expenses, Sales are revenues, and τ is the statutory credit rate
(12% or 14%).
The ASC regime is subject to the same drawback as the original formula, in that spending in
6 Under IRC § 41(a), in general a firm fixed-base percentage is QRE/gross receipts during 19841988. R&D
start-ups have a different fixed-base percentage from other firms. For the first five taxable years, the fixed-base
percentage is 3%. For the sixth and seventh taxable years, the fixed-base percentage is 1/6 and 1/3 of QRE/gross
receipts for the previous two years, respectively. For the eighth through the tenth taxable years, the fixed-base
percentage is 1/2, 2/3, and 5/6 of QRE/gross receipts for the fifth through the seventh, eighth, and ninth years,
respectively. Thereafter, the fixed-base percentage is the QRE/gross receipts for any selected five years from the
fifth to the tenth years.

10
one year raises the base amount for the next three years. Yet, some firms may still benefit from
the ASC regime, such as start-ups, firms without QRE documentation from 1984 through 1988,
or firms with a high base amount or rapidly growing sales. Grigsby and Westmoreland (2001),
for example, indicate that the semiconductor industry posted unusually high fixed-base
percentages from 1984 through 1988 because Japanese competition produced unusually low
sales during the mid-1980s. Another feature of the new R&D tax credit system is that a firm
originally choosing the OBRA method can switch to apply for the ASC method, but it cannot
switch back to the OBRA method once it selects the ASC method.
2. Data and methodology
2.1. Data
The financial and stock market information of our sample firms comes from Compustat and
the Center for Research in Security Prices (CRSP) database. We collect U.S. patent data from the
European Patent Office (EPO) Worldwide Patent Statistical Database (PATSTAT, 2016 edition)
because it provides detailed and comprehensive information (Bena and Li, 2014). We eliminate
financial firms (Compustat SIC codes 60006999), American depositary receipts, closed-end
funds, non-U.S. firms, and real estate investment trusts from the sample. For the
difference-in-differences analysis, the sample includes U.S. firms that applied for either the ASC
or OBRA credit between 2003 and 2010. The sample period starts in 2003 to mitigate potential
confounding effects associated with the Internet bubble and stops at 2010 to ensure that we have
enough patent and citation observations for the ASC users after the switching year. Given that
more recent patents will have fewer citations, a truncation problem is likely to occur. To address
this concern, we use the truncation adjustment process suggested by Hall, Jaffe, and Trajtenberg

11
(2001, 2005) and terminate our patent and citation data in the year 2014. In our final sample, 569
firms switched from the OBRA to the ASC regime, and 2,825 firms stayed in the OBRA regime
between 2007 and 2010.
2.2. ASC and OBRA users and innovation performance measures
Firms might not disclose qualified research expenses (QREs) and R&D tax credits in annual
reports. The computation of R&D tax credits, however, is based on QREs. According to Hall and
van Reenen (2000), about 50% to 73% of R&D expenses are QREs, implying that QREs are
highly correlated with R&D expenditures shown in the income statement. Accordingly, we use
60% of R&D expenditures as a proxy for QREs. Our conclusion remains unchanged when QREs
are proxied by 50% or 70% of R&D expenditures.7 We further assume that firms are motivated
by greater tax benefits when they decide to use a R&D tax credit method. That is, we assume that
a firm uses Equations (1) and (2) and chooses to switch to the ASC method if it produces higher
R&D tax credits than under OBRA. Accordingly, a firm is defined as an ASC user if it gains an
R&D tax credit through the OBRA regime before 2007 but shifts to the ASC regime in any year
between 2007 and 2010 (i.e., the ASC offers a higher R&D tax credit). A firm is defined as an
OBRA user if it stays in the OBRA regime in both pre- and post-2007 periods.
We use citations per patent and number of patents to measure the performance of firm
innovation outputs. Citations are the number of truncation-adjusted citations divided by the
number of patents applied for by a firm. Number of patents is the number of patents applied for.
Firms that have never applied to the United States Patent and Trademark Office (USPTO) for
patents are removed from the sample.
7 Later, we also use a reduced sample of firms that indicate in their 10-K reports they are R&D tax credit users.
While 40% of our sample firms do not disclose their R&D tax credit information, this reduced sample shows
consistent results.
12
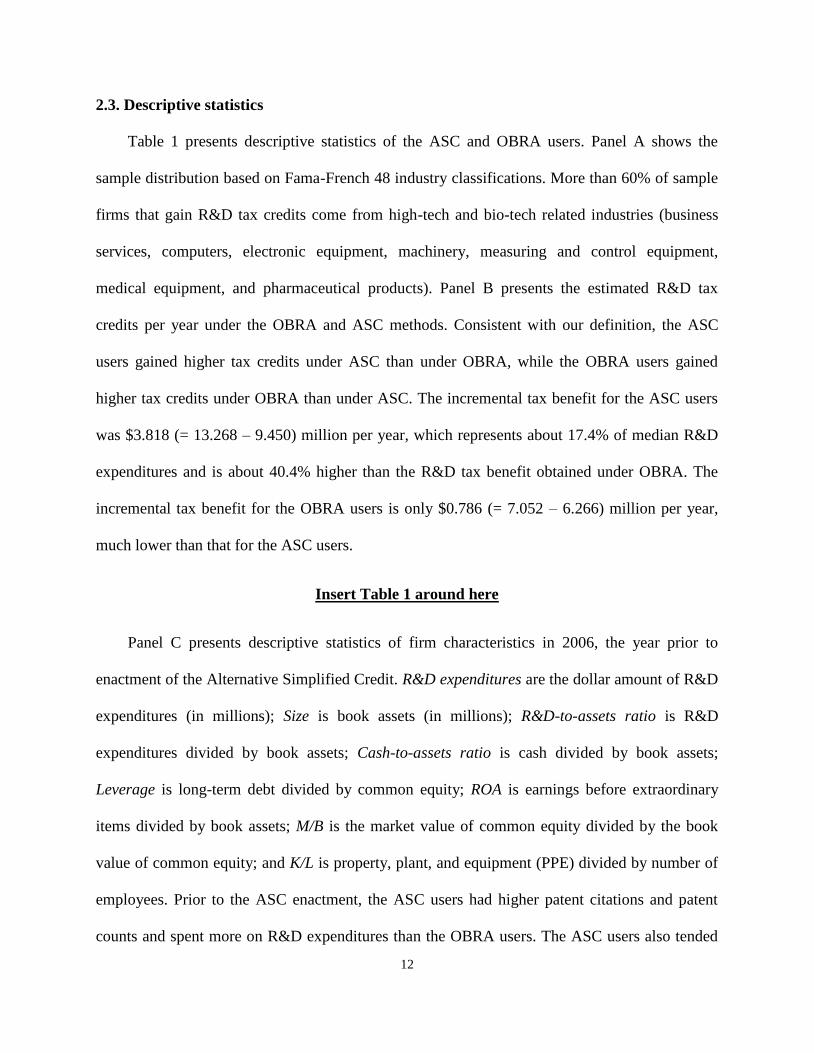
2.3. Descriptive statistics
Table 1 presents descriptive statistics of the ASC and OBRA users. Panel A shows the
sample distribution based on Fama-French 48 industry classifications. More than 60% of sample
firms that gain R&D tax credits come from high-tech and bio-tech related industries (business
services, computers, electronic equipment, machinery, measuring and control equipment,
medical equipment, and pharmaceutical products). Panel B presents the estimated R&D tax
credits per year under the OBRA and ASC methods. Consistent with our definition, the ASC
users gained higher tax credits under ASC than under OBRA, while the OBRA users gained
higher tax credits under OBRA than under ASC. The incremental tax benefit for the ASC users
was $3.818 (= 13.268 – 9.450) million per year, which represents about 17.4% of median R&D
expenditures and is about 40.4% higher than the R&D tax benefit obtained under OBRA. The
incremental tax benefit for the OBRA users is only $0.786 (= 7.052 – 6.266) million per year,
much lower than that for the ASC users.
Insert Table 1 around here
Panel C presents descriptive statistics of firm characteristics in 2006, the year prior to
enactment of the Alternative Simplified Credit. R&D expenditures are the dollar amount of R&D
expenditures (in millions); Size is book assets (in millions); R&D-to-assets ratio is R&D
expenditures divided by book assets; Cash-to-assets ratio is cash divided by book assets;
Leverage is long-term debt divided by common equity; ROA is earnings before extraordinary
items divided by book assets; M/B is the market value of common equity divided by the book
value of common equity; and K/L is property, plant, and equipment (PPE) divided by number of
employees. Prior to the ASC enactment, the ASC users had higher patent citations and patent
counts and spent more on R&D expenditures than the OBRA users. The ASC users also tended

13
to be larger and to have lower R&D-to-assets and cash-to-assets ratios, higher leverage, and
better return on assets.
3. Effects of R&D tax credits on innovation performance
3.1. Multivariate analysis
We perform regression analysis of innovation performance using firms adopting the OBRA
or ASC method:
tieperformancInnovation ,)(
ti A S Cp o s tf o rD u m m yaf i r m ss w i t c h i n gf o rD u m m yaa )()( 210
.)()( ,3 tijti,ti eASCpostforDummyfirmsswitchingforDummya Xγ' (3)
The dependent variable, Innovation performance, refers to the two measures of firm innovation
performance, Citations and Number of patents, over the period from 2003 through 2014. Dummy
for switching firms is equal to one for an ASC user and zero for an OBRA user. Dummy for post
ASC is equal to one for the years after 2006, and zero otherwise. The effect of
difference-in-differences is measured by the interaction variable, Dummy for switching firms ×
Dummy for post ASC, which captures the change in innovation performance for the ASC users
(the treatment group) after enactment of the Alternative Simplified Credit relative to the OBRA
users (the control group). X represents a set of control variables suggested in the literature,
including R&D-to-assets ratio, log(Size), Cash-to-assets ratio, Leverage, ROA, M/B, and K/L
(e.g., Aghion, Van Reenen, and Zingales, 2013; He and Tian, 2013; Chang et al., 2015).8
8 The results are similar when we winsorize all control variables at the 1st and 99th percentiles. Our conclusion also
remains unchanged if we additionally control for Analyst coverage, Institutional ownership, CEO turnover, CEO
turnover × Dummy for post ASC, and R&D-to-assets ratio × Dummy for post ASC, although the sample size is
substantially reduced. Analyst coverage is number of analysts following the firm, where data come from the IBES
database. Institutional ownership is percentage of shares held by institutional investors, where data come from the

14
captures Fama-French 48 industry fixed effects. We compute t-statistics using standard errors
that are clustered by firm.
Table 2 presents the regression results, where Models 1 and 2 use the logarithm of one plus
citations per patent and the logarithm of one plus number of patents as the dependent variable,
respectively. The coefficients on the interaction variable, Dummy for switching firms × Dummy
for post ASC, are 0.2308 and 0.2276 for Citations and Number of patents, respectively, both
statistically significant at the 1% level. These coefficients indicate that, compared to firms
staying in the OBRA regime, firms switching from the OBRA regime to the ASC regime
experienced a decline in citations per patent and numbers of patents of about 23.1% and 22.8%
surrounding the switching year, respectively. Thus, we see poorer innovation performance from
the ASC users after enactment of the Alternative Simplified Credit than from the OBRA users.
This evidence favors a negative interpretation of the effect of R&D tax credits on innovation
performance.9
Insert Table 2 around here
We also perform difference-in-differences analysis of R&D expenditures and present the
results in Internet Appendix Table A1. Following Finley, Lusch, and Cook (2015), we perform
dynamic panel regressions of the logarithm of one plus R&D expenses on Dummy for switching
firms, Dummy for post ASC, Dummy for switching firms × Dummy for post ASC, and a set of
Thomson Reuters 13F database. CEO turnover is a dummy that is equal to one if a CEO is replaced by a new one,
where data come from the S&P ExecuComp database. 9 We perform several robustness checks of model specifications, including Tobit regressions, Poisson regressions,
and negative binomial regressions. We also use one-year-ahead patent or three-year cumulative patent measures as
the dependent variable. All results are consistent with the findings so far. We further redefine ASC/OBRA users
using the average of tax credits in the current year and the estimated tax credits from Equations (1) and (2) during
the following three years based on average R&D growth and average sales growth over the past five years. Firms are
defined as ASC users if they gain OBRA credits before 2007 but shift to the ASC regime in any year between 2007
and 2010 (i.e., the ASC offers a higher forward-looking R&D tax credit). While this alternative approach may suffer
from a look-ahead bias, our conclusion remains valid.

15
control variables for the sample periods from 2003 through 2010 and from 2005 through 2008.10
Coefficients are estimated using a system generalized method of moments (GMM) approach.
The coefficients on Dummy for switching firms × Dummy for post ASC are significantly positive
at the 10% level or better in both sample periods. Thus, the results show that enactment of the
Alternative Simplified Credit encourages firm R&D investments, consistent with prior research
that indicates R&D tax credits have a positive impact on firm innovation inputs.
3.2. Self-selection bias
According to U.S. federal tax law, an OBRA tax user could choose to use the ASC method
since 2007, but cannot switch back to the OBRA method once selecting the ASC method. As a
firm’s choice of the tax credit method is voluntary, our estimates in Equation (3) could be subject
to a self-selection bias. To control for this potential bias, we perform Heckman’s (1979)
two-stage regression analysis. In the first stage, we use a probit regression of Dummy for
switching firms on IRS attention, Size, Cash-to-assets ratio, Leverage, Sales growth, K/L,
Average cash effective tax rates, and Volatility of cash effective tax rates. IRS attention is a
dummy variable that is equal to one for a firm with tax positions that incurred penalties, were
increased, or were settled with the Internal Revenue Service (IRS) during the year. Sales growth
is this year’s sales minus previous year’s sales divided by previous year’s sales. Average cash
effective tax rates are the average of cash effective tax rates over the past three years, where the
cash effective tax rate is equal to cash taxes paid divided by pre-tax earnings before special items.
Volatility of cash effective tax rates is the standard deviation of cash effective tax rates over the
past three years. Other variables have been defined.
We expect IRS attention to be positively related to the likelihood that a firm will switch to
10 The results are similar for the entire sample period from 2005 through 2014.

16
the ASC regime. In 2006, the Financial Accounting Standards Board (FASB) introduced FIN 48,
a mandatory requirement that public firms disclose their uncertain tax positions. As such
disclosures are not voluntary, they are not endogenous to the firm. IRS attention substantially
increased following the FIN 48 requirement (Bozanic et al., 2017). These disclosures under the
FIN 48 arguably represent increasing IRS attention, which could trigger more audits and affect
firm tax planning (Hoopes, Mescall, and Pittman, 2012). To save taxes, firms that experience
IRS attention are hence likely to switch to the ASC regime. As IRS attention is unlikely to
directly affect innovation performance, it serves as an appropriate exogenous variable to tease
out the causal effect. We include firm size and sales growth because firms with stronger sales
growth tend to face more difficulty in earning R&D tax credits under the OBRA computation,
and firms that experience greater sales growth tend to increase in size. We include cash effective
tax rates because firms with higher taxes or more variable taxes would seek a stable way to
reduce their tax burden and are more likely to choose the ASC method to reduce their tax burden.
We include leverage because of a potential agency problem, as firms with less leverage are likely
to be more poorly governed (Jensen, 1986). We include the cash ratio because the choice of tax
credit method may depend on the firm’s liquidity position. Finally, we control for K/L because it
is a control commonly used in the innovation literature.11
In the second stage, we estimate Equation (3) by including the inverse Mills ratio as an
additional control that is estimated from the first-stage probit regression. Table 3 shows the
results for the first stage in Model 1 and for the second stage in Models 2 (patent citations) and 3
(patent counts). There are fewer observations because of data availability. Model 1 shows that
firms with IRS attention are likely to switch to the ASC regime. Firms switching from the OBRA
11 Our results remain unchanged if we also include the KZ index (Kaplan and Zingales, 1997), E-index (Bebchuk,
Cohen, and Ferrell, 2009), Herfindahl-Hirschman index, and state R&D tax credit rate according to the state in
which a firm is headquartered (Wilson, 2009).

17
to the ASC regime also tend to be large and have low cash holdings, low leverage, low K/L, and
high and volatile cash effective tax rates. Models 2 and 3 show that the coefficients on the
interaction variable, Dummy for switching firms × Dummy for post ASC, are 0.2375 and
0.2038, both statistically significant at the 1% level. Consistent with the findings in Table 2,
ASC users experience poorer innovation performance after enactment of the Alternative
Simplified Credit than OBRA users. Thus, our results remain unchanged after accounting for a
potential self-selection bias. The inverse Mills ratios are statistically insignificant in Model 2 but
significant in Model 3, indicating the importance of controlling for self-selection in determining
patent counts.
Insert Table 3 around here
3.3. Sample of R&D tax credit users from 10-K reports
We also estimate Equation (3) using a sample limited to the firms that indicate in their
10-Ks they are R&D tax credit users. The sample size is substantially reduced. Table 4 shows
that the coefficients on the interaction variable, Dummy for switching firms × Dummy for post
ASC, are 0.2536 and 0.2180 for Citations and Number of patents, respectively. Both
coefficients are statistically significant at the 1% level. Thus, the results are still robust in a
reduced sample: Innovation performance is poorer for the ASC users than for the OBRA users
following enactment of the Alternative Simplified Credit.
Insert Table 4 around here
Firms that disclose they are R&D tax credit users in 10-Ks, however, do not indicate which
regime they adopt. To address this concern, we compare their R&D tax credits reported in 10-Ks
with our estimated R&D tax credits. We identify a firm as an ASC user if its reported R&D tax
18
credits fall within the range between ±20% of the estimated R&D tax credits of the ASC regime
and outside the range between ±20% of the estimated R&D tax credits of the OBRA regime.12 A
firm is quite likely to be an ASC user if its reported R&D tax credits are close to those obtained
from the ASC formula and far away from those obtained from the OBRA formula. A similar
approach is used to define an OBRA user. Internet Appendix Table A2 shows that our
conclusion remains unchanged.
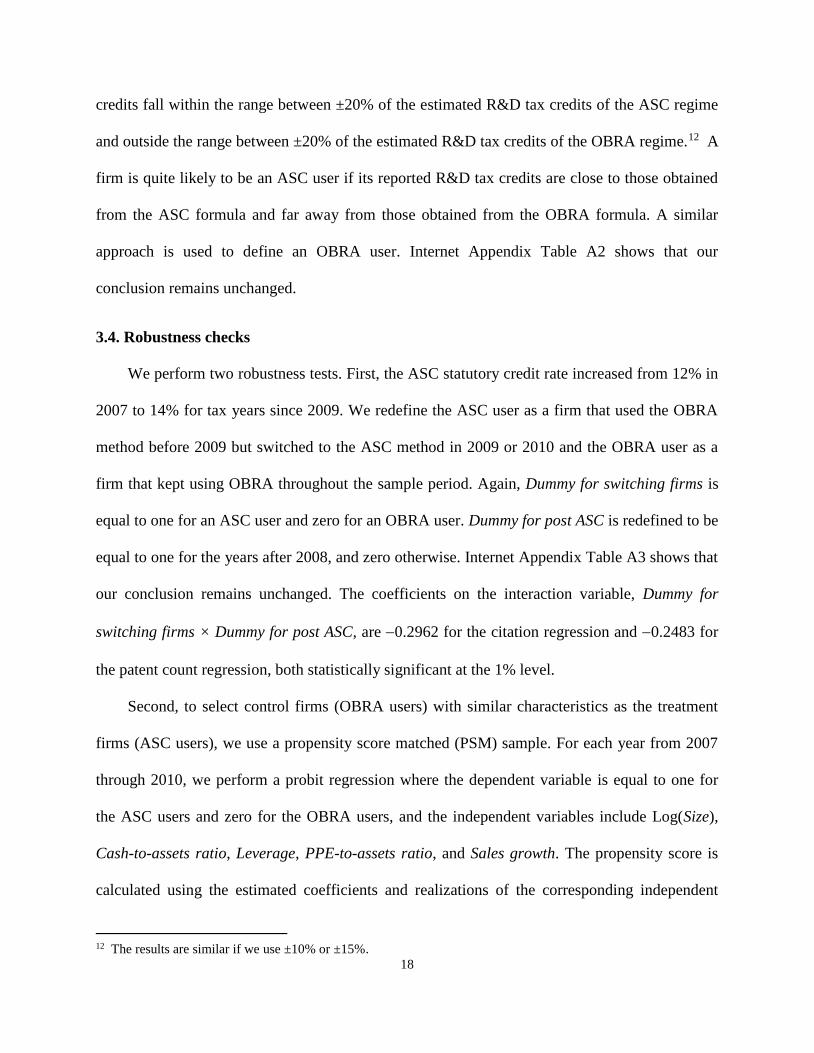
3.4. Robustness checks
We perform two robustness tests. First, the ASC statutory credit rate increased from 12% in
2007 to 14% for tax years since 2009. We redefine the ASC user as a firm that used the OBRA
method before 2009 but switched to the ASC method in 2009 or 2010 and the OBRA user as a
firm that kept using OBRA throughout the sample period. Again, Dummy for switching firms is
equal to one for an ASC user and zero for an OBRA user. Dummy for post ASC is redefined to be
equal to one for the years after 2008, and zero otherwise. Internet Appendix Table A3 shows that
our conclusion remains unchanged. The coefficients on the interaction variable, Dummy for
switching firms × Dummy for post ASC, are 0.2962 for the citation regression and 0.2483 for
the patent count regression, both statistically significant at the 1% level.
Second, to select control firms (OBRA users) with similar characteristics as the treatment
firms (ASC users), we use a propensity score matched (PSM) sample. For each year from 2007
through 2010, we perform a probit regression where the dependent variable is equal to one for
the ASC users and zero for the OBRA users, and the independent variables include Log(Size),
Cash-to-assets ratio, Leverage, PPE-to-assets ratio, and Sales growth. The propensity score is
calculated using the estimated coefficients and realizations of the corresponding independent
12 The results are similar if we use ±10% or ±15%.

19
variables for each firm. Each ASC user is then matched to an OBRA user with the closest
propensity score. We also use an alternative matching approach by first forming a matched group
of OBRA users within a 0.001 caliper of the ASC user’s propensity score and then taking the
average of the matched group for each ASC user. Internet Appendix Table A4 shows that the
coefficients on Dummy for switching firms × Dummy for post ASC for patent citations and
counts are significantly negative at the 5% level or better, indicating that our results are robust to
the PSM sample.
4. Conditional tests
We perform two conditional tests to examine when the effect of the Alternative Simplified
Credit on firm innovation performance might strengthen. We investigate the roles of corporate
governance and innovation diversification in determining the relation between R&D tax credits
and patent counts and citations.
4.1. Corporate governance
Firms with poorer governance are likely to suffer serious agency problems. Hoechle et al.
(2012) suggest that corporate governance explains a large portion of internal capital market
efficiency. ASC users that are poorly governed would tend to experience greater inefficiency in
internal capital markets arising from the new R&D tax credit regime. The Alternative Simplified
Credit is predicted to have a less favorable effect on innovation performance for firms with
poorer corporate governance.
We measure corporate governance using the E-index of Bebchuk, Cohen, and Ferrell (2009),
which is the sum of six binary variables denoting whether a firm has poison pills, classified
boards, golden parachutes, supermajority requirements, limits to amend corporate bylaws, and
limits to amend corporate charters. We focus on this index as Bebchuk, Cohen, and Ferrell (2009)

20
show that their index has a stronger association with firm value than the G-Index of Gompers,
Ishii, and Metrick (2003). Firms with a higher E-index are viewed as having weaker shareholder
rights, as it is more difficult and more costly for shareholders to remove managers. We obtain
data on the E-index from RiskMetrics.
We also construct a residual governance index (RGI), in spirit similar to Jenter and
Lewellen (2015), using six governance characteristics: stock ownership by the CEO, by
blockholders, and by directors; board size; board independence; and an indicator for CEOs who
are also the board chair. Data on board- and CEO-related information and block ownership come
from GMI Ratings and BoardEx. We regress each of these governance variables on firm and
CEO characteristics, including logarithm of market value of equity, book-to-market ratio, firm
age, one-year past return, return on assets, leverage, PPE/book assets, sales growth, CEO tenure,
CEO age, and Fama-French 48 industry and year fixed effects. We then sort each regression
residual into terciles, with higher values indicating better governance, and cumulate the tercile
ranks (02). In contrast to the E-index, firms with a higher value of RGI indicate better
governance.13
Panel A of Table 5 shows the regression results of innovation performance for the
subsamples of high and low E-index firms, where high and low E-index firms are classified
every year by the median of the whole U.S. listed firms with data available on the E-index.
Innovation performance is measured by Citations in Models 1 and 2 and by Number of patents in
Models 3 and 4. In both Models 1 and 3, the coefficients on the interaction variable, Dummy for
switching firms × Dummy for post ASC, are statistically insignificant at the conventional level
13 The values are higher for firms with higher stock ownership of the CEO, blockholders, or directors, a more
independent board, a smaller board size, and CEO-board chair separation. The results are unchanged if we include
institutional ownership and board co-option as additional governance characteristics in constructing the residual
governance index, where co-option is measured as the proportion of outside directors appointed after the incumbent
CEO assumes office (Coles, Daniel, and Naveen, 2014).

21
for firms with low E-index. However, in Models 2 and 4 the coefficients on the interaction
variable for firms with high E-index are negative and statistically significant at the 5% level or
better. The Wald test indicates that the differences in the coefficients on the interaction variable
between high and low E-index firms are statistically significant at the 1% level for both measures
of innovation performance. Thus, consistent with the prediction, the Alternative Simplified
Credit has a more negative effect on innovation performance for firms with poorer corporate
governance. Panel B shows that the conclusion remains unchanged when firms are classified by
the residual governance index.14
Insert Table 5 around here
4.2. Innovation diversification
The innovation diversity literature suggests that innovation-diversified firms allocate
resources into divisions inefficiently and tend to suffer agency problems. For example,
Holmstrom (1989) indicates that innovation activities may mix poorly with relatively routine
activities in an organization. Henderson and Cockburn (1996) and Sampson (2007) also suggest
that firms with greater innovation diversity are poorer in innovation performance than firms with
less innovation diversity. When research teams are very dissimilar at innovative firms, the costs
of innovation diversity dominate the benefits of technological diversity achieved through
knowledge spillovers from team to team. Barnes, Lynham, Kalberg and Leung (2016) show that
individuals tend to share information primarily with others most similar to themselves and this
behavior impedes the diffusion of knowledge and working efficiency, consistent with the
argument of Chen, Yang, and Lin (2013), who find a negative relation between technological
14 We also consider an alternative corporate governance indicator: financial experts in the audit committee. Our
results show that the coefficients on the interaction variable, Dummy for switching firms × Dummy for post ASC, are
stronger for those without financial experts in the audit committee. This once again supports our agency problem
explanation.

22
diversification and firm performance.15 Thus, firms with greater innovation diversity will be less
efficient in allocating to different innovation teams the extra resources that come from the
additional free cash flows of R&D tax credits. Their innovation performance is accordingly
likely to suffer. We expect the Alternative Simplified Credit to have a more negative effect on
innovation performance for firms engaged in diversified innovation activities.
We measure the diversity of innovation following Lerner, Sorensen, and Strömberg (2011).
Let Si = (Si,1, …, Si,k) be a vector of innovation activity in k technology areas for firm i, where k
indicates a technology classification of six technology classifications in Hall, Jaffe, and
Trajtenberg (2001, 2005).16 Innovation activity is measured by the number of patents that a firm
applies for. The diversification of innovation is:
./
2
k
ikikinnovi SSHHI (4)
Firms with a high (low) value of HHIinnov have a low (high) level of innovation diversity.
Table 6 presents the regression results of innovation performance for the subsamples of
firms with high and low innovation diversity classified every year by the median of all U.S.
listed firms that have data available on HHIinnov.17 We measure innovation performance by
Citations in Models 1 and 2 and Number of patents in Models 3 and 4. In Models 1 and 3, the
coefficients on the interaction variable, Dummy for switching firms × Dummy for post ASC, are
negative and statistically significant at the 1% level for firms with high innovation diversity (i.e.,
low HHIinnov firms). In Models 2 and 4, the coefficients on the interaction variable are not
15 This evidence is consistent with the product diversification literature (e.g., Stein, 1997; Rajan, Servaes, and
Zingales, 2000; Wulf, 2009). See, for example, Martin and Sayrak (2003) for a review. 16 The six technological categories include chemical, computers and communication, drugs and medical, electrical
and electronics, mechanical, and other. 17 Our results are similar if we divide our sample into innovation-diversified firms (i.e., HHIinnov < 1) and
innovation-focused firms (i.e., HHIinnov = 1).

23
statistically significant at the conventional level for firms with more focused innovation activity
(i.e., high HHIinnov firms). The Wald test indicates that the differences in the two coefficients on
the interaction variable between high and low HHIinnov firms are statistically significant at the 1%
level for both measures of innovation performance. Thus, the Alternative Simplified Credit has
stronger negative effects on innovation performance when firms face a higher level of innovation
diversification.
Insert Table 6 around here
5. Additional analyses
5.1. Alternative measures of innovation performance
We have shown that ASC users experience poorer innovation performance after enactment
of the Alternative Simplified Credit than OBRA users, supporting a negative view of the effect
of R&D tax credits. We examine now whether our results hold using six other measures of
innovation performance suggested by prior research: Generality, Originality, Relative citations,
Self-citations, Non-self-citations, and Aggregate citations. Generality is defined as the sum of
squared ratios of forward-citations divided by the number of total forward citations in the same
International Patent Classification (IPC) code. A patent with greater generality is more
influential in various technology areas. Originality is measured using a similar formula but
replacing forward-citations by backward-references. Patent originality captures the
diversification of technology knowledge background, so a patent has more originality if it does
not rely on the knowledge pool of a specific area. Relative citations are citations per patent
divided by the median of citations per patent in the same IPC classification. We further classify
patent citations into Self-citations and Non-self-citations. Self-citations are the number of

24
self-citations divided by the number of patents that a firm applied for, where self-citations are
identified as citing patents assigned by their inventors to the sample firms as the originating
patents. Since higher self-citations imply less knowledge outgoing spillover because the patents
are owned by the same company, self-citations are usually more favorable to the firm (Hall, Jaffe,
and Trajtenberg, 2001). Non-self-citations are defined as the number of non-self-citations
divided by the number of patents that a firm applied for. Aggregate citations are computed as the
aggregate citations of patents for a firm, a measure without scaling patent counts.
Table 7 presents our regression results using these alternative measures of innovation
performance from 2003 through 2014. The coefficients on Dummy for switching firms × Dummy
for post ASC remain negative and statistically significant at the 5% level or better for all six
models. Thus, our findings are robust to alternative measures of innovation performance.
Insert Table 7 around here
5.2. Firm performance and value
If enactment of the Alternative Simplified Credit weakens innovation outputs, the
performance and value of the firm using the new R&D tax credit regime will likely suffer. To
examine this issue, we use the three-year average of firm operating performance over t + 1 and t
+ 3 and firm value in t + 1 as the dependent variables. We measure operating performance by
earnings before extraordinary items plus pre-tax R&D expenses divided by book assets. We add
back pre-tax R&D expenses because R&D reduces earnings (Eberhart, Maxwell, and Siddique,
2004). We measure firm value by Tobin’s Q based on the valuation of physical capital in Peters
and Taylor (2017), which is equal to the market value of equity plus the book value of debt and
the book value of preferred equity minus inventories and deferred taxes, divided by the book
value of capital (proxied by property, plant, and equipment).
25
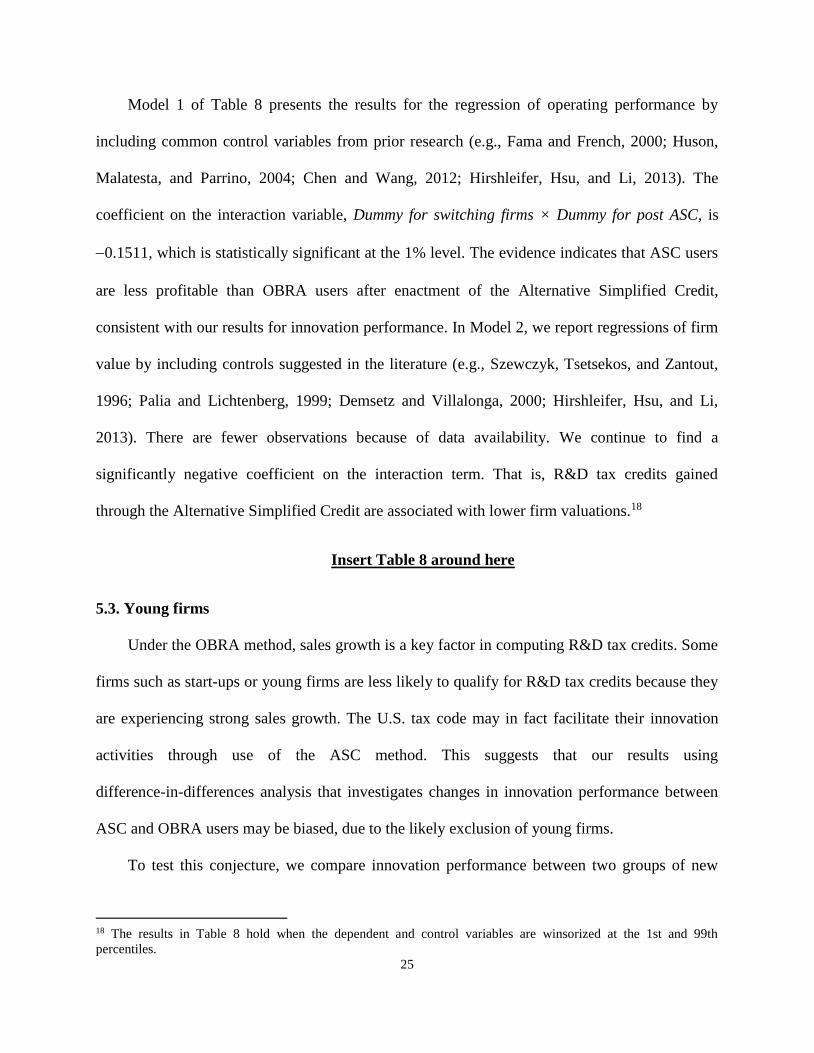
Model 1 of Table 8 presents the results for the regression of operating performance by
including common control variables from prior research (e.g., Fama and French, 2000; Huson,
Malatesta, and Parrino, 2004; Chen and Wang, 2012; Hirshleifer, Hsu, and Li, 2013). The
coefficient on the interaction variable, Dummy for switching firms × Dummy for post ASC, is
0.1511, which is statistically significant at the 1% level. The evidence indicates that ASC users
are less profitable than OBRA users after enactment of the Alternative Simplified Credit,
consistent with our results for innovation performance. In Model 2, we report regressions of firm
value by including controls suggested in the literature (e.g., Szewczyk, Tsetsekos, and Zantout,
1996; Palia and Lichtenberg, 1999; Demsetz and Villalonga, 2000; Hirshleifer, Hsu, and Li,
2013). There are fewer observations because of data availability. We continue to find a
significantly negative coefficient on the interaction term. That is, R&D tax credits gained
through the Alternative Simplified Credit are associated with lower firm valuations.18
Insert Table 8 around here
5.3. Young firms
Under the OBRA method, sales growth is a key factor in computing R&D tax credits. Some
firms such as start-ups or young firms are less likely to qualify for R&D tax credits because they
are experiencing strong sales growth. The U.S. tax code may in fact facilitate their innovation
activities through use of the ASC method. This suggests that our results using
difference-in-differences analysis that investigates changes in innovation performance between
ASC and OBRA users may be biased, due to the likely exclusion of young firms.
To test this conjecture, we compare innovation performance between two groups of new
18 The results in Table 8 hold when the dependent and control variables are winsorized at the 1st and 99th
percentiles.

26
firms that went public after 2002. Group A consists of start-ups that never gained R&D tax
credits during our sample period, and Group B consists of start-ups that did not seek R&D tax
credits before 2007 but gained R&D tax credits through the ASC method. We define Dummy for
ASC start-ups to be equal to one if a start-up belongs to Group B, and zero if it belongs to Group
A. Table 9 presents regression results of Citations and Number of patents for the sample of
start-ups that includes Groups A and B. Both coefficients on the interaction variable, Dummy for
ASC start-ups × Dummy for post ASC, are positive but statistically insignificant at the
conventional level. The results indicate that start-ups using the ASC method do not have better or
poorer innovation performance than other start-ups. This suggests that our conclusion is unlikely
to be driven by the exclusion of young firms.
Insert Table 9 around here
5.4. Q-theory
We examine whether our findings can be also explained by q-theory, which argues that
firms choose investment projects according to net present values and decide their optimal
investment when marginal revenue equals the marginal cost of capital (e.g., Liu, Whited, and
Zhang, 2009; Li and Zhang, 2010; Wu, Zhang, and Zhang, 2010). For q-theory to explain our
finding that ASC users have poorer innovation performance than OBRA users in the post-ASC
period, the firm production function must exhibit decreasing or constant returns to scale. Thus,
q-theory predicts the Alternative Simplified Credit would have a stronger negative effect on
innovation performance for ASC users with decreasing or constant returns to scale than for those
with increasing returns to scale.
We consider a Cobb-Douglas production function with inputs of labor, capital, and R&D
and with outputs of firm revenues. The production function is estimated for each firm using its

27
time-series data. The returns to scale are equal to the sum of output elasticities of labor, capital,
and R&D from the estimated production function. Table 10 shows the regression results of
innovation performance classified by returns to scale, where sample firms are divided into a
subsample with increasing returns to scale and a subsample with decreasing or constant returns
to scale. Models 1 and 2 show that, when innovation performance is measured by Citations, the
coefficients on the interaction variable, Dummy for switching firms × Dummy for post ASC, are
both significantly negative at the 1% level for the two subsamples. The Wald test indicates no
significant difference between these two coefficients. Similar findings are obtained when we
measure innovation performance by Number of Patents. Thus, our results are unlikely to be
explained by q-theory.
Insert Table 10 around here
5.5. R&D spillover
The enactment of the Alternative Simplified Credit may stimulate technology expansion,
which presumably helps improve social benefits associated with research activities. A firm’s
R&D investment usually has strong positive externalities in that it produces benefits that accrue
to parties other than the firm making the investment (Jaffe, 1986; Cassiman and Veugelers,
2002). Thus, it is possible that, while an ASC user may experience poorer innovation
performance, other firms may benefit from R&D spillover effects, and hence social benefits
increase.
To investigate this issue, we perform regressions of R&D spillover effects using the
spillover measure of Jaffe (1986), Bloom, Schankerman, and Van Reenen (2013), and Qiu and
Wan (2015). To estimate the R&D spillover effect, we define technological proximity as an
uncentered correlation coefficient of innovation activities of two firms i and j:

28
,''
'
jjii
ji
SSSS
SS (5)
where Si = (Si,1, …, Si,k) is a vector of innovation activity in technology classification k for firm i.
We use six technology classifications as in Hall, Jaffe, and Trajtenberg (2001, 2005), and
measure innovation activity by the number of patents that a firm has applied for at the U.S.
Patent and Trademark Office. The R&D spillover effect is estimated as:
ij
jtijCRDw , (6)
where wij is proximity between firms i and j, and firm j is in the same three-digit SIC industry as
firm i; CRD is firm R&D capital (Chan, Lakonishok, and Sougiannis, 2001).19 Because we
obtain missing wij when firm j generates zero patents in year t, we either replace missing values
of wij with zero or simply drop the observation in our analysis.
We perform regression analysis of the R&D spillover effect using the same explanatory
variables as those in Equation (3). Table 11 presents the results, where Model 1 replaces the
missing values of wij with zero and Model 2 drops the observation with missing wij. Model 1
shows that the coefficient on the interaction variable, Dummy for switching firms × Dummy for
post ASC, is negative and statistically significant at the 10% level. Model 2 shows that the
coefficient on the interaction variable is statistically insignificant at the conventional level. Thus,
we find no evidence that the ASC method contributes to greater R&D spillover than the OBRA
method in the post-ASC period, suggesting that the ASC method does not produce greater
technology dispersion.
Insert Table 11 around here
19 We also estimate the R&D spillover effect using the methodology of Chen et al. (2013) and obtain similar results.

29
5.6. Effect of the 1981 OBRA on innovation performance
We investigate how the Omnibus Budget Reconciliation Act first enacted in 1981 affects
firm innovation performance. This issue is important, as the OBRA regime may have already had
a negative effect on innovation performance. If this is true, our findings for the ASC are just
reconfirmation of the evidence under a different R&D tax credit regime. We collect a sample of
U.S. firms between 1974 and 2006, and perform a difference-in-differences analysis. We
examine whether the change in innovation performance is different for OBRA users and other
firms without R&D tax credits following the 1981 Omnibus Budget Reconciliation Act.
In Table 12, we report the regression results of Citations (Model 1) and Number of Patents
(Model 2) over the period from 1974 through 2006. Dummy for OBRA firms is equal to one if a
firm did not use R&D tax credits before 1981 but applied for R&D tax credits through the
OBRA in any year from 1981 through 2006, and zero if a firm did not use any R&D tax credits
from 1974 through 2006. Dummy for post OBRA is equal to one for the years after 1980, and
zero otherwise. Control variables are the same as those in Equation (3). Models 1 and 2 show
that the coefficients on the interaction variable, Dummy for OBRA firms × Dummy for post
OBRA, are 0.0860 and 0.0655, both statistically significant at the 5% level. The results indicate
that the OBRA users significantly increased in both citations per patent and number of patents
over other firms following the 1981 OBRA enactment. Thus, in contrast to the poorer firm
innovation performance associated with enactment of the Alternative Simplified Credit, the
Omnibus Budget Reconciliation Act improved the performance of innovation.
Insert Table 12 around here
5.7. Placebo test
We conduct a placebo test to examine whether our findings are driven merely by chance, an

30
issue in part related to the data snooping bias. We replace each ASC user with another firm
randomly selected from among OBRA users (i.e., pseudo-ASC users). We re-run the regression
for Equation (3) by replacing Dummy for switching firms by Dummy for switching placebos,
which is equal to one for a pseudo-ASC user, and zero otherwise. We record the coefficient on
the interaction variable, Dummy for switching placebos × Dummy for post ASC. We repeat this
procedure 1,000 times and hence obtain 1,000 estimated coefficients on the interaction variable.
As the pseudo-ASC users are randomly assigned from among OBRA users, we expect the
Alternative Simplified Credit to have an insignificant impact on their innovation performance.
Figure 1 shows the distribution of the estimated coefficients on Dummy for switching
placebos × Dummy for post ASC for innovation performance measured by Citations in Panel A
and by Number of patents in Panel B. In Panel A, the mean and median coefficients on the
interaction variable are 0.0182 and 0.0179, which are statistically insignificantly different
from zero at the conventional level. The magnitudes of these coefficients are also much smaller
than the magnitude of the coefficient on Dummy for switching firms × Dummy for post ASC in
Model 1 of Table 2. We obtain similar results in Panel B. The mean and median coefficients on
the interaction variable are 0.0277 and 0.0274, again statistically insignificantly different from
zero and smaller in magnitude than the coefficient on Dummy for switching firms × Dummy for
post ASC in Model 2 of Table 2. Thus, there is no evidence for the significant impact of the
Alternative Simplified Credit on the innovation performance of the pseudo-ASC users,
suggesting that our results are unlikely driven by pure luck.
Insert Figure 1 around here
5.8. Another self-selection issue
We have controlled for the potential bias arising from self-selection between the OBRA and

31
ASC methods in Section 4.2 (Table 3). Another self-selection bias, however, could be present, as
the decision of whether to use R&D tax credits at all is also voluntary. To address this issue, we
again perform Heckman’s two-stage regression analysis. In the first stage, we use all the firms
covered by Compustat and CRSP and perform a probit regression of Dummy for R&D tax credit
users, which is equal to one if a firm uses the OBRA method before 2007 and the OBRA or ASC
method over the period from 2007 through 2010, and zero otherwise. The explanatory variables
are the same as those in Table 3. In the second stage, we perform regressions of innovation
performance for the sample of OBRA and ASC users by additionally controlling for the inverse
Mills ratio estimated from the first-stage probit regression. Internet Appendix Table A5 shows
that the coefficients on the interaction variable, Dummy for switching firms × Dummy for post
ASC, are still negative and statistically significant at the 1% level for both measures of
innovation performance. Thus, our results remain robust to this potential self-selection bias.
6. Conclusion
The U.S. government provides direct tax incentives through R&D tax credits with an aim to
encourage corporate innovation. Researchers have focused on innovation inputs and documented
that such a tax policy encourages corporate R&D expenditures. Our work contributes to the firm
innovation literature by examining how R&D tax credits affect the performance of firm
innovation outputs. We investigate this issue taking advantage of a new U.S. federal tax policy
effective in 2007, the Alternative Simplified Credit (ASC), as a quasi-experiment. Under this
regime, firms can choose between two methods for determining R&D tax credits, the original
Omnibus Budget Reconciliation Act (OBRA) method or the new ASC method, but switching to
the ASC method is an irreversible choice.

32
We use a difference-in-differences approach to investigate the change in innovation
performance between firms switching from OBRA to ASC (i.e., ASC users) and firms staying
with OBRA (i.e., OBRA users). We report that ASC users had a significant reduction in citations
per patent and number of patents relative to OBRA users following enactment of the Alternative
Simplified Credit. The results indicate that the new federal tax policy in fact resulted in a
deterioration in firm innovation output performance. The evidence favors a dark-side rather than
bright-side view of the effects of R&D tax credits under the ASC regime. The findings remain
robust when we control for potential self-selection bias, use a propensity score matched sample,
or use alternative measures of innovation performance. Thus, our research calls into question
whether the new tax incentives enacted since 2007 to stimulate R&D investments have a positive
economic impact for firms.
We also examine the roles of corporate governance and innovation diversity in explaining
the negative effect of the Alternative Simplified Credit on firm innovation performance. We
show that this negative effect is more profound for firms with poorer governance mechanisms.
The evidence supports the argument that inefficiency in internal capital markets resulting from
the ASC method is likely greater for ASC users that are less well governed. We also show a
stronger negative effect of ASC on innovation performance for firms that face a higher level of
innovation diversification. That is, firms with more diversified innovation activities are likely
less efficient in allocating the extra resources that arise from additional free cash flows of ASC
tax benefits to different innovation teams. Hence, they suffer a greater deterioration in innovation
performance.
A number of additional tests corroborate these findings. We examine firm performance and
value, and show that ASC users experience poorer profitability and lower valuations than OBRA

33
users following the ASC enactment. We rule out the possibility that our conclusion is driven by
the exclusion of young firms, as we find that start-ups using the ASC regime do not have better
or worse innovation performance than other start-ups. Our findings are also not explained by
q-theory, which predicts that the ASC method will have a less favorable impact on innovation
performance for firms with decreasing or constant returns to scale than firms with increasing
returns to scale. We show no evidence of significant difference in the ASC effect on innovation
performance between these two groups of firms. We further find that the ASC method does not
lead to greater R&D spillover than the OBRA method, suggesting that the ASC method does not
produce greater technology dispersion to benefit other firms’ innovation. Finally, we show that,
in contrary to our primary finding that ASC users experience a deterioration in innovation
performance, the Omnibus Budget Reconciliation Act improves firm innovation performance.
Thus, our findings for ASC effects are not just reconfirmation of the evidence under a different
R&D tax credit regime.

34
References
Aghion, P., Reenen, J.V., Zingales, L., 2013. Innovation and institutional ownership. American
Economic Review 103: 277304.
Atanassov, J., Liu, X., 2019. Can Corporate Income Tax Cuts Stimulate Innovation? Journal of
Financial and Quantitative Analysis, forthcoming.
Barnes, M., Lynham, J., Kalberg, K., Leung, P.S., 2016. Social networks and environmental
outcomes. Proceedings of the National Academy of Sciences 113: 64666471.
Bebchuk, L., Cohen, A., Ferrell, A., 2009. What matters in corporate governance? Review of
Financial Studies 22: 783827.
Becker-Blease, J.R., 2011. Governance and innovation. Journal of Corporate Finance 17:
947958.
Belenzon, S., Berkovitz, T., 2010. Innovation in business groups. Management Science
56: 519535.
Bena, J., Li, K., 2014. Corporate innovations and mergers and acquisitions. Journal of Finance
69: 19231960.
Bloom, N., Griffith, R., Reenen, J.V., 2002. Do R&D tax credits work? Evidence from a panel of
countries 19791997. Journal of Public Economics 85: 131.
Bloom, N., Schankerman, M., Reenen, J.V., 2013. Identifying technology spillovers and product
market rivalry. Econometrica 81: 13471393.
Bozanic, Z., Hoopes, J.L., Thornock, J.R., Williams, B.M., 2017. IRS attention. Journal of
Accounting Research 55: 79114.
Bradley, D., Kim, I., Tian, X., 2016. Do unions affect innovation? Management Science 63:
22512271.

35
Cassiman, B., Veugelers, R., 2002. R&D cooperation and spillovers: some empirical evidence
from Belgium. American Economic Review 92: 11691184.
Chan, L.K.C., Lakonishok, J., Sougiannis, T., 2001. The stock market valuation of research and
development expenditures. Journal of Finance 56: 24312456.
Chang, X., Fu, K., Low, A., Zhang, W., 2015. Non-executive employee stock options and
corporate innovation. Journal of Financial Economics 115: 168188.
Chen, S., Chen, Y., Liang, W., Wang, Y., 2013. R&D spillover effects and firm performance
following R&D increases. Journal of Financial and Quantitative Analysis 48: 16071634.
Chen, S., Wang, Y., 2012. Financial constraints and share repurchases. Journal of Financial
Economics 105: 311331.
Chen, Y., Yang, D., Lin, F., 2013. Does technological diversification matter to firm performance?
The moderating role of organizational slack. Journal of Business Research 66: 19701975.
Coles, J.L., Daniel, N.D., Naveen, L., 2014. Co-opted boards. Review of Financial Studies 27:
17511796.
Desai, M., Dharmapala, D., 2006. Corporate tax avoidance and high-powered incentives. Journal
of Financial Economics 79: 145179.
Demsetz, H., Villalonga, B., 2000. Ownership structure and corporate performance. Journal of
Corporate Finance 7: 209233.
Eberhart, A.C., Maxwell, W.F., Siddique, A.R., 2004. An examination of long‐term abnormal
stock returns and operating performance following R&D increases. Journal of Finance 59:
623650.
Ederer, F., Manso, G., 2013. Is pay for performance detrimental to innovation?. Management
Science 59: 14961513.

36
Fama, E.F., French, K.R., 2000. Forecasting profitability and earnings. Journal of Business 73:
161175.
Fang, V.W., Tian, X., Tice, S., 2014. Does stock liquidity enhance or impede firm innovation?
Journal of Finance 69: 20852125.
Finley, A.R., Lusch, S.J., Cook, K.A., 2015. The effectiveness of the R&D tax credit: evidence
from the Alternative Simplified Credit. Journal of the American Taxation Association 37:
157181.
Gompers, P., Ishii, J., Metrick, A., 2003. Corporate governance and equity prices. Quarterly
Journal of Economics 118: 107155.
Grigsby, M., Westmoreland, J.W., 2001. The research tax credit: a temporary and incremental
dinosaur. Tax Notes 93: 16271640.
Hall, B.H., Jaffe, A.B., Trajtenberg, M., 2001. The NBER patent citation data file: lessons,
insights and methodological tools. NBER Working paper 8498.
Hall, B.H., Jaffe, A.B., Trajtenberg, M., 2005. Market value and patent citations. RAND Journal
of Economics 36: 1638.
Hall, B.H., and Reenen, J.V., 2000. How effective are fiscal incentives for R&D? A review of
the evidence. Research Policy 29: 449469.
Hall, R.E., Jorgenson, D.W., 1967. Tax policy and investment behavior. American Economic
Review 57: 391414.
Hanlon, M., 2005. The persistence and pricing of earnings, accruals, and cash flows when firms
have large book-tax differences. The Accounting Review 80: 137-166.
Hanlon, M., Heitzman, S., 2010. A review of tax research. Journal of Accounting and Economics
50: 127178.

37
He, J.J., Tian, X., 2013. The dark side of analyst coverage: the case of innovation. Journal of
Financial Economics 109: 856878.
Heckman, J.J., 1979. Sample selection bias as a specification error. Econometrica 47: 153161.
Henderson, R., Cockburn, I., 1996. Scale, scope, and spillovers: the determinants of research
productivity in drug discovery. RAND Journal of Economics 27: 3259.
Hirshleifer, D., Hsu, P., Li, D., 2013. Innovative efficiency and stock returns. Journal of
Financial Economics 107: 632654.
Hoechle, D., Schmid, M., Walter, I., Yermack, D., 2012. How much of the diversification
discount can be explained by poor corporate governance? Journal of Financial
Economics 103: 4160.
Holmstrom, B., 1989. Agency costs and innovation. Journal of Economic Behavior and
Organization 12: 305327.
Hoopes, J.L., Mescall, D., Pittman, J.A., 2012. Do IRS audits deter corporate tax avoidance? The
Accounting Review 87: 16031639.
Hsu, P., 2009. Technological innovations and aggregate risk premiums. Journal of Financial
Economics 94: 264279.
Hsu, P., Tian, X., Xu, Y., 2014. Financial development and innovation: cross-country
evidence. Journal of Financial Economics 112: 116135.
Huson, M.R., Malatesta, P.H., Parrino, R., 2004. Managerial succession and firm performance.
Journal of Financial Economics 74: 237275.
Jaffe, A.B., 1986. Technological opportunity and spillovers of R&D: evidence from firms’
patents, profits, and market value. American Economic Review 76: 9841001.

38
Jaffe, A.B., 2000. The U.S. patent system in transition: policy innovation and the innovation
process. Research Policy 29: 531557.
Jensen, M.C., 1986. Agency costs of free cash flow, corporate finance, and takeovers. American
Economic Review 76: 323329.
Jensen, M.C., 1993. The modern industrial revolution, exit, and the failure of internal control
systems. Journal of Finance 48: 831880.
Jenter, D., Lewellen, K., 2015. CEO preferences and acquisitions. Journal of Finance 70:
28132852.
Kaplan, S.N., Zingales, L., 1997. Do investment-cash flow sensitivities provide useful measures
of financing constraints? Quarterly Journal of Economics 112: 169215.
Lang, L.H.P., Stulz, R.M., Walkling, R.A., 1991. A test of the free cash flow hypothesis: the case
of bidder returns. Journal of Financial Economics 29: 315335.
Laplante, S.K., Skaife, L.A., Swenson, L.A., Wangerin, D.D., 2019. Limits of tax regulation:
Evidence from strategic R&D classification and the R&D tax credit. Journal of Accounting
and Public Policy 38: 89-105.
Lehn, K., Poulsen, A., 1989. Free cash flow and stockholder gains in going private transactions.
Journal of Finance 44: 771787.
Lerner, J., Sorensen, M., Strömberg, P., 2011. Private equity and long-run investment: the case
of innovation. Journal of Finance 66: 445477.
Lev, B., Nissim, D, 2004. Taxable income, future earnings, and equity values. The Accounting
Review 79: 1039-1074.
Li, D., Zhang, L., 2010. Does q-theory with investment frictions explain anomalies in the
cross-section of returns? Journal of Financial Economics 98: 297314.

39
Liu, L.X., Whited, T.M., Zhang, L., 2009. Investment-based expected stock returns. Journal of
Political Economy 117: 11051139.
Mansfield, E., 1986. The R&D tax credit and other technology policy issues. American
Economic Review 76: 190194.
Martin, J.D., Sayrak, A., 2003. Corporate diversification and shareholder value: a survey of
recent literature. Journal of Corporate Finance 9: 3757.
Mukherjee, A., Singh, M., Žaldokas, A., 2017. Do corporate taxes hinder innovation? Journal of
Financial Economics 124: 195221.
Palia, D., Lichtenberg, F., 1999. Managerial ownership and firm performance: a re-examination
using productivity measurement. Journal of Corporate Finance 5: 323339.
Peters, R.H., Taylor, L.A., 2017. Intangible capital and the investment-q relation. Journal of
Financial Economics 123: 251272.
Png, I., 2017. Law and innovation: evidence from state trade secrets laws. Review of Economics
and Statistics 99: 167179.
Qiu, J., Wan, C., 2015. Technology spillovers and corporate cash holdings. Journal of Financial
Economics 115: 558573.
Rajan, R., Servaes, H., Zingales, L., 2000. The cost of diversity: the diversification discount and
inefficient investment. Journal of Finance 55: 3580.
Rao, N., 2016. Do tax credits stimulate R&D spending? The effect of the R&D tax credit in its
first decade. Journal of Public Economics 140: 112.
Sampson, R.C., 2007. R&D alliances and firm performance: the impact of technological
diversity and alliance organization on innovation. Academy of Management Journal 50:
364386.

40
Seru, A., 2014. Firm boundaries matter: evidence from conglomerates and R&D activity. Journal
of Financial Economics 111: 381405.
Stein, J.C., 1997. Internal capital markets and the competition for corporate resources. Journal of
Finance 52: 111133.
Summers, L.H., Bosworth, B.P., Tobin, J., White, P.M., 1981. Taxation and corporate
investment: a q-theory approach. Brookings Papers on Economic Activity 12: 67140.
Szewczyk, S.H., Tsetsekos, G.P., Zantout, Z., 1996. The valuation of corporate R&D
expenditures: evidence from investment opportunities and free cash flow. Financial
Management 25: 105110.
Wilson, D.J., 2009. Beggar thy neighbor? The in-state, out-of-state, and aggregate effects of
R&D tax credits. Review of Economics and Statistics 91: 431436.
Wu, J., Zhang, L., Zhang, X.F., 2010. The q-theory approach to understanding the accrual
anomaly. Journal of Accounting Research 48: 177223.
Wulf, J., 2009. Influence and inefficiency in the internal capital market. Journal of Economic
Behavior and Organization 72: 305321.

41
Table 1
Descriptive statistics. Panel A: Industry distribution
Fama and French 48-industry classifications All firms % OBRA users % ASC users %
Business services (34) 490 14.44 408 14.44 82 14.41
Computers (35) 215 6.33 162 5.73 53 9.31
Electronic equipment (36) 386 11.37 299 10.58 87 15.29
Machinery (21) 158 4.66 128 4.53 30 5.27
Measuring and control equipment (37) 131 3.86 102 3.61 29 5.10
Medical equipment (12) 225 6.63 190 6.73 35 6.15
Pharmaceutical products (13) 499 14.70 463 16.39 36 6.33
Others 1,290 38.01 1,073 37.98 217 38.14
Panel B: Estimated R&D tax credits
OBRA users ASC users
Year
Estimated OBRA
Tax credits
Estimated ASC
tax credits
Estimated OBRA
tax credits
Estimated ASC
tax credits
2007 6.642 5.868 12.292 12.894
2008 7.712 6.610 10.693 13.119
2009 6.914 6.277 6.267 12.401
2010 7.000 6.532 8.116 14.772
Average 7.052 6.266 9.450 13.268
Panel C: Firm characteristics before ASC was enacted
N Variable Mean Median
OBRA users 2,825 Citations 0.614 0.000
Number of patents 0.585 0.000
R&D expenditures 130.693 11.472
Size 3523.110 101.613
R&D-to-assets ratio 0.279 0.107
Cash-to-assets ratio 0.602 0.328
Leverage 0.148 0.001
ROA -0.226 0.104
M/B 2.916 2.727
K/L 0.121 0.075
ASC users 569 Citations 0.821 0.000
Number of patents 0.895 0.000
R&D expenditures 284.109 21.963
Size 5815.610 347.898
R&D-to-assets ratio 0.111 0.081
Cash-to-assets ratio 0.398 0.242
Leverage 0.241 0.034
ROA 0.082 0.159
M/B 3.620 2.596
K/L 0.123 0.079
This table presents summary statistics of U.S. public firms claiming R&D tax credits under two different regimes. ASC
users represent a subsample of firms applying for Omnibus Budget Reconciliation Act (OBRA) credits before 2007 but
using the Alternative Simplified Credit (ASC) method in any year between 2007 and 2010. OBRA users represent a
subsample of firms staying in the OBRA regime in both pre- and post-2007 periods. Panel A shows the sample distribution
based on Fama-French 48 industry classifications (numbers in parentheses are industry codes). Panel B presents the
average estimated R&D tax credits (in millions of dollars) per year for the OBRA users and the ASC users. Panel C shows
summary statistics of firm characteristics in 2006, the year before enactment of the ASC. Citations are the number of
truncation-adjusted citations divided by the number of patents that a firm applied for. Number of patents is the number of
patents that a firm applied for. R&D expenditures are the dollar amount of R&D expenditures (in millions). Size is book
assets (in millions). R&D-to-assets ratio is R&D expenditures divided by book assets. Cash-to-assets ratio is cash divided
by book assets. Leverage is long-term debt divided by common equity. ROA is earnings before extraordinary items divided
by book assets. M/B is the market value of common equity divided by the book value of common equity. K/L is property,
plant, and equipment (PPE) divided by number of employees.

42
Table 2
Relation between R&D tax credits and innovation performance. Log(1 + Citations) Log(1 + Number of patents)
Variable Model 1 Model 2
Dummy for switching firms 0.1367** 0.1657***
(2.52) (2.66)
Dummy for post ASC -0.7660*** -0.4213***
(-21.29) (-11.53)
Dummy for switching firms -0.2308*** -0.2276***
× Dummy for post ASC (-5.78) (-5.51)
R&D-to-assets ratio 0.1437*** 0.2382***
(5.08) (8.02)
Log(Size) 0.1054*** 0.1776***
(12.53) (12.46)
Cash-to-assets ratio 0.0333*** 0.0296***
(3.77) (3.57)
Leverage -0.0106 -0.0197
(-0.84) (-1.35)
ROA 0.0113* -0.0107
(1.86) (-1.57)
M/B 0.0016** 0.0026***
(2.06) (3.34)
K/L -0.0043 0.0522
(-0.04) (0.32)
Intercept -0.0953 -0.8331***
(-0.46) (-5.97)
Industry FE Yes Yes
N 15,092 15,092
Adj. R2 0.106 0.167
This table presents regressions of innovation performance using a sample of U.S. public firms adopting the OBRA or ASC
method. The dependent variable refers to the two measures of firm innovation performance over the period from 2003
through 2014, Citations in Model 1 and Number of patents in Model 2. Citations are the number of truncation-adjusted
citations divided by the number of patents applied for by a firm. Number of patents is the number of patents applied for.
Dummy for switching firms is equal to one for an ASC user and zero for an OBRA user. Dummy for post ASC is equal to
one for the years after 2006, and zero otherwise. Other variables are defined in Table 1. Numbers in parentheses are
t-statistics computed using standard errors clustered by firm. ***, **, and * denote significance at the 1%, 5%, and 10%
levels, respectively.

43
Table 3 Relation between R&D tax credits and innovation performance after controlling for self-
selection bias. Dummy for switching firms Log(1 + Citations) Log(1 + Number of patents)
Variable Model 1 Model 2 Model 3
Dummy for switching firms 0.1134* 0.1424**
(1.91) (2.15)
Dummy for post ASC -0.2504*** -0.1251***
(-8.02) (-3.48)
Dummy for switching firms -0.2375*** -0.2038***
× Dummy for post ASC (-4.84) (-3.87)
R&D-to-assets ratio 0.3202*** 0.5339***
(5.72) (8.14)
IRS attention 0.6712***
(21.68)
Log(Size) 0.0875*** 0.1158*** 0.1660***
(16.23) (9.42) (9.61)
Cash-to-assets ratio -0.1599*** 0.0692*** 0.1012***
(-6.21) (3.57) (5.10)
Leverage -0.0147* -0.0114 -0.0099
(-1.72) (-1.33) (-1.07)
ROA 0.0066 -0.0135*
(1.04) (-1.77)
M/B 0.0020** 0.0022***
(2.43) (2.60)
Sales growth -0.0461
(-1.17)
K/L -0.0878* -0.0276 0.0094
(-1.84) (-0.64) (0.16)
Average cash effective tax rates 0.1344**
(2.26)
Volatility of cash effective 0.0254
tax rates (1.18)
Inverse Mills ratio -0.2955 -1.1682***
(-0.94) (-2.98)
Intercept -0.8309*** -0.2651 -0.0890
(-24.87) (-1.00) (-0.27)
Industry FE Yes Yes Yes
N 11,024 11,024 11,024
Pseudo R2 or Adj. R2 0.091 0.113 0.181
This table presents Heckman two-stage regression analysis for innovation performance using a sample of U.S. public firms
adopting the OBRA or ASC method. Model 1 shows the results for the first stage, where a probit regression is used. The
dependent variable is Dummy for switching firms, which is equal to one for an ASC user and zero for an OBRA user. IRS
attention is a dummy variable that is equal to one for a firm with tax positions that incurred penalties, were increased, or
were settled with the Internal Revenue Service during the year. Sales growth is this year’s sales minus previous year’s
sales divided by previous year’s sales. Average cash effective tax rates are the average of cash effective tax rates over the
past three years, where the cash effective tax rate is equal to cash taxes paid divided by pre-tax earnings before special
items. Volatility of cash effective tax rates is the standard deviation of cash effective tax rates over the past three years.
Models 2 and 3 show the results for the second stage, where we estimate regressions of Citations and Number of patents
over the period from 2003 through 2014 by including the inverse Mills ratio as an additional control that is estimated from
the first-stage probit regression. Citations are the number of truncation-adjusted citations divided by the number of patents
applied for by a firm. Number of patents is the number of patents applied for. Dummy for post ASC is equal to one for the
years after 2006, and zero otherwise. Other variables are defined in Table 1. Numbers in parentheses are t-statistics
computed using standard errors clustered by firm. There are fewer observations because of data availability. ***, **, and *
denote significance at the 1%, 5%, and 10% levels, respectively.

44
Table 4
Relation between R&D tax credits and innovation performance for a sample of R&D tax credit
users from 10-K reports. Log(1 + Citations) Log(1 + Number of patents)
Variable Model 1 Model 2
Dummy for switching firms 0.1225 0.1115
(1.64) (1.29)
Dummy for post ASC -0.7129*** 0.0020
(-12.08) (0.03)
Dummy for switching firms -0.2536*** -0.2180***
× Dummy for post ASC (-4.48) (-3.69)
R&D-to-assets ratio 0.2361*** 0.4663***
(3.90) (6.90)
Log(Size) 0.1550*** 0.2860***
(11.80) (12.16)
Cash-to-assets ratio 0.0836*** 0.0737***
(5.31) (4.87)
Leverage -0.0409** -0.0497**
(-2.15) (-2.36)
ROA 0.0149 -0.0050
(0.95) (-0.33)
M/B 0.0027** 0.0042***
(1.98) (2.90)
K/L 0.3612** 0.5008*
(1.98) (1.95)
Intercept -0.3898 -1.3981***
(-1.09) (-3.95)
Industry FE Yes Yes
N 9,104 9,104
Adj. R2 0.147 0.239
This table presents regressions of innovation performance for a sample of U.S. firms that indicate in their 10-Ks they are
an R&D tax credit user. The dependent variable refers to the two measures of firm innovation performance over the period
from 2003 through 2014, Citations in Model 1 and Number of patents in Model 2. Citations are the number of
truncation-adjusted citations divided by the number of patents applied for by a firm. Number of patents is the number of
patents applied for. Dummy for switching firms is equal to one for an ASC user and zero for an OBRA user. Dummy for
post ASC is equal to one for the years after 2006, and zero otherwise. Other variables are defined in Table 1. Numbers in
parentheses are t-statistics computed using standard errors clustered by firm. ***, **, and * denote significance at the 1%,
5%, and 10% levels, respectively.
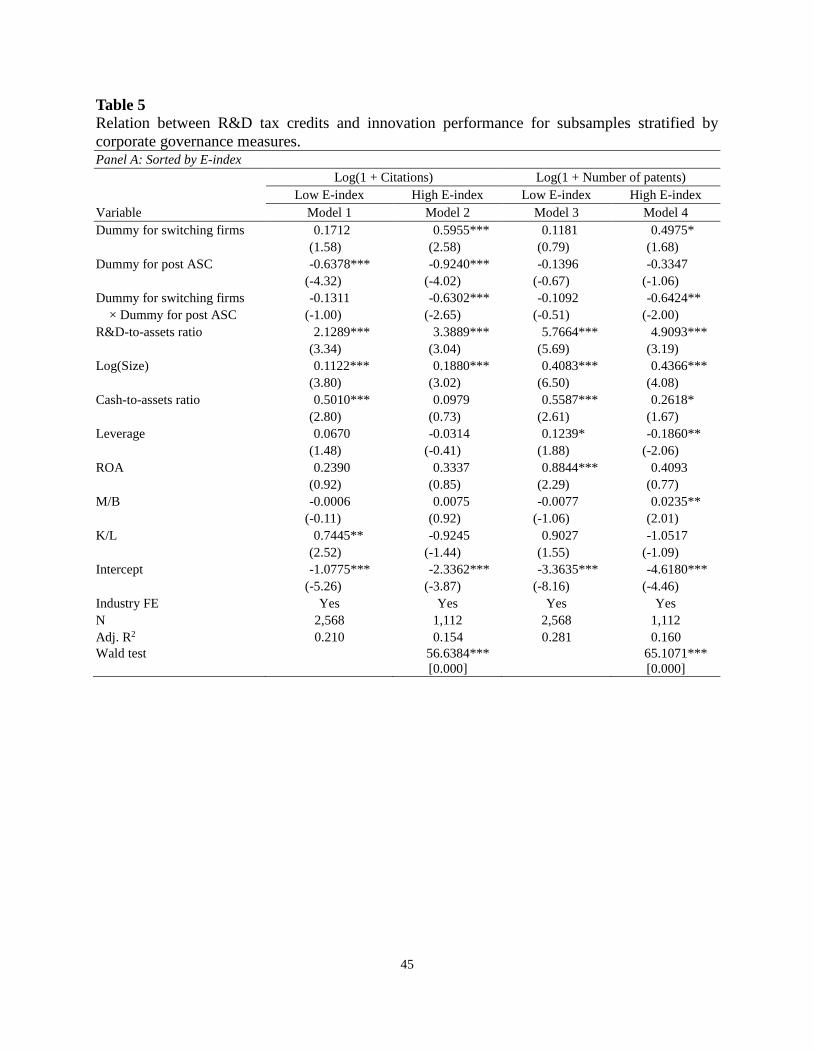
45
Table 5
Relation between R&D tax credits and innovation performance for subsamples stratified by
corporate governance measures. Panel A: Sorted by E-index
Log(1 + Citations) Log(1 + Number of patents)
Low E-index High E-index Low E-index High E-index
Variable Model 1 Model 2 Model 3 Model 4
Dummy for switching firms 0.1712 0.5955*** 0.1181 0.4975*
(1.58) (2.58) (0.79) (1.68)
Dummy for post ASC -0.6378*** -0.9240*** -0.1396 -0.3347
(-4.32) (-4.02) (-0.67) (-1.06)
Dummy for switching firms -0.1311 -0.6302*** -0.1092 -0.6424**
× Dummy for post ASC (-1.00) (-2.65) (-0.51) (-2.00)
R&D-to-assets ratio 2.1289*** 3.3889*** 5.7664*** 4.9093***
(3.34) (3.04) (5.69) (3.19)
Log(Size) 0.1122*** 0.1880*** 0.4083*** 0.4366***
(3.80) (3.02) (6.50) (4.08)
Cash-to-assets ratio 0.5010*** 0.0979 0.5587*** 0.2618*
(2.80) (0.73) (2.61) (1.67)
Leverage 0.0670 -0.0314 0.1239* -0.1860**
(1.48) (-0.41) (1.88) (-2.06)
ROA 0.2390 0.3337 0.8844*** 0.4093
(0.92) (0.85) (2.29) (0.77)
M/B -0.0006 0.0075 -0.0077 0.0235**
(-0.11) (0.92) (-1.06) (2.01)
K/L 0.7445** -0.9245 0.9027 -1.0517
(2.52) (-1.44) (1.55) (-1.09)
Intercept -1.0775*** -2.3362*** -3.3635*** -4.6180***
(-5.26) (-3.87) (-8.16) (-4.46)
Industry FE Yes Yes Yes Yes
N 2,568 1,112 2,568 1,112
Adj. R2 0.210 0.154 0.281 0.160
Wald test
56.6384***
[0.000]
65.1071***
[0.000]

46
Table 5 (continued) Panel B: Sorted by residual governance index (RGI)
Log(1+ Citations) Log(1+ Number of patents)
Low RGI High RGI Low RGI High RGI
Variable Model 1 Model 2 Model 3 Model 4
Dummy for switching firms 0.1825** 0.0673 0.2045*** 0.0841
(2.32) (0.72) (2.37) (0.72)
Dummy for post ASC -0.0282 -0.2050*** 0.0392 -0.0780
(-0.56) (-3.31) (0.83) (-1.22)
Dummy for switching firms -0.2121*** -0.1259 -0.1852*** -0.1722*
× Dummy for post ASC (-2.81) (-1.34) (-2.66) (-1.84)
R&D-to-assets ratio 0.4663*** 0.9053*** 0.6142*** 1.1918***
(4.23) (4.17) (6.42) (5.47)
Log(Size) 0.2073*** 0.1744*** 0.3107*** 0.3414***
(11.77) (8.74) (12.98) (9.76)
Cash-to-assets ratio 0.1231*** 0.1677*** 0.1036*** 0.1310***
(3.24) (4.02) (3.64) (4.15)
Leverage -0.0496** -0.0062 -0.0747*** -0.0027
(-1.97) (-0.19) (-2.81) (-0.07)
ROA 0.1419** -0.0187 0.0089 -0.0027
(2.15) (-0.21) (0.14) (-0.02)
M/B 0.0023 0.0056 0.0040* 0.0060*
(0.95) (1.57) (1.82) (1.83)
K/L 0.2498 0.3966 0.7092*** 0.4422
(1.06) (1.36) (2.61) (1.09)
Intercept -1.2048*** -1.3238*** -0.7662*** -2.3850***
(-10.83) (-10.12) (-5.39) (-10.75)
Industry FE Yes Yes Yes Yes
N 3,874 2,684 3,874 2,684
Adj. R2 0.117 0.108 0.231 0.272
Wald test
2.6298*
[0.072]
2.5648*
[0.077]
This table presents regressions of innovation performance for subsamples stratified by corporate governance measurers. In
Panel A, the corporate governance measure is based on the E-index of Bebchuk, Cohen, and Ferrell (2009). High and low
E-index firms are classified every year by the median of all U.S. listed firms with data available on the E-index. Firms
with a higher E-index are viewed as having poorer governance. In Panel B, the corporate governance measure is based on
a residual governance index (RGI) defined in Section 5.1, in spirit similar to Jenter and Lewellen (2015). Firms with a
higher value of RGI show better governance. High and low RGI firms are classified every year by the median of all U.S.
listed firms with data available on the RGI. The dependent variable is the two measures of firm innovation performance
over the period from 2003 through 2014, Citations in Models 1 and 2 and Number of patents in Models 3 and 4. Citations
are the number of truncation-adjusted citations divided by the number of patents applied for by a firm. Number of patents
is the number of patents applied for. Dummy for switching firms is equal to one for an ASC user and zero for an OBRA
user. Dummy for post ASC is equal to one for the years after 2006, and zero otherwise. Other variables are defined in Table
1. Numbers in parentheses are t-statistics computed using standard errors clustered by firm. The Wald test is used to test
the significance of difference in coefficients on Dummy for switching firms × Dummy for post ASC between two
subsamples (p-value in brackets). ***, **, and * denote significance at the 1%, 5%, and 10% levels, respectively.
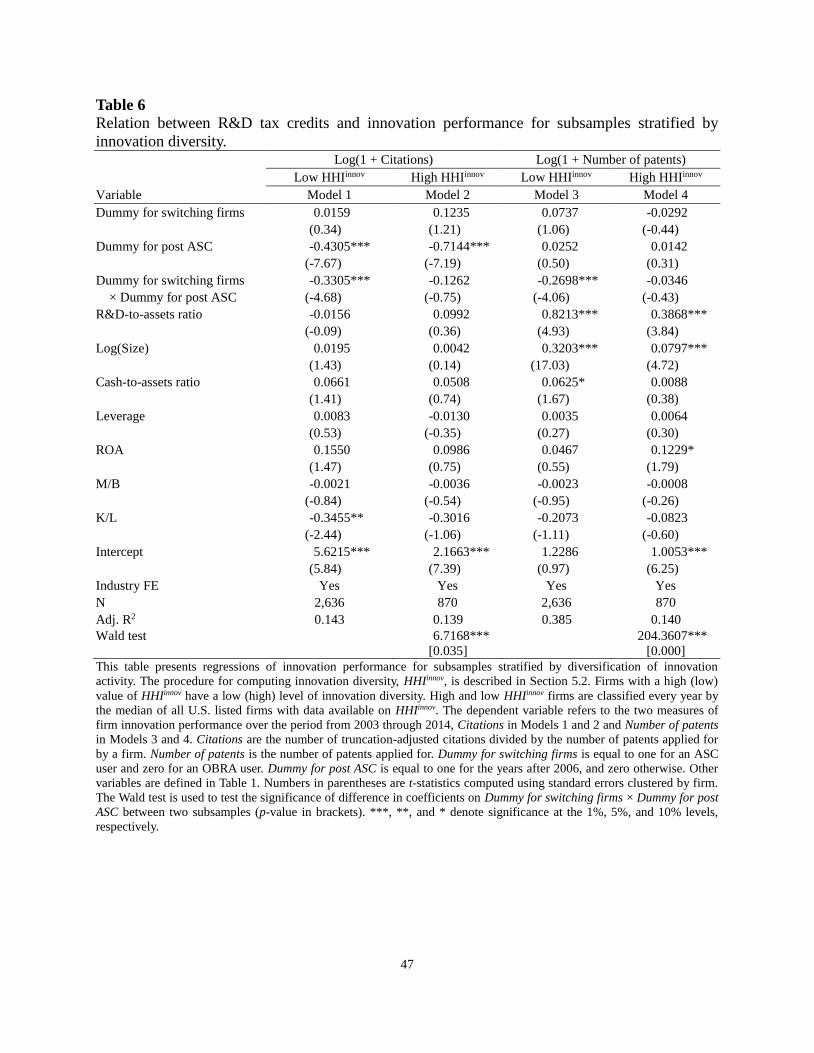
47
Table 6
Relation between R&D tax credits and innovation performance for subsamples stratified by
innovation diversity. Log(1 + Citations) Log(1 + Number of patents)
Low HHIinnov High HHIinnov Low HHIinnov High HHIinnov
Variable Model 1 Model 2 Model 3 Model 4
Dummy for switching firms 0.0159 0.1235 0.0737 -0.0292
(0.34) (1.21) (1.06) (-0.44)
Dummy for post ASC -0.4305*** -0.7144*** 0.0252 0.0142
(-7.67) (-7.19) (0.50) (0.31)
Dummy for switching firms -0.3305*** -0.1262 -0.2698*** -0.0346
× Dummy for post ASC (-4.68) (-0.75) (-4.06) (-0.43)
R&D-to-assets ratio -0.0156 0.0992 0.8213*** 0.3868***
(-0.09) (0.36) (4.93) (3.84)
Log(Size) 0.0195 0.0042 0.3203*** 0.0797***
(1.43) (0.14) (17.03) (4.72)
Cash-to-assets ratio 0.0661 0.0508 0.0625* 0.0088
(1.41) (0.74) (1.67) (0.38)
Leverage 0.0083 -0.0130 0.0035 0.0064
(0.53) (-0.35) (0.27) (0.30)
ROA 0.1550 0.0986 0.0467 0.1229*
(1.47) (0.75) (0.55) (1.79)
M/B -0.0021 -0.0036 -0.0023 -0.0008
(-0.84) (-0.54) (-0.95) (-0.26)
K/L -0.3455** -0.3016 -0.2073 -0.0823
(-2.44) (-1.06) (-1.11) (-0.60)
Intercept 5.6215*** 2.1663*** 1.2286 1.0053***
(5.84) (7.39) (0.97) (6.25)
Industry FE Yes Yes Yes Yes
N 2,636 870 2,636 870
Adj. R2 0.143 0.139 0.385 0.140
Wald test
6.7168***
[0.035]
204.3607***
[0.000]
This table presents regressions of innovation performance for subsamples stratified by diversification of innovation
activity. The procedure for computing innovation diversity, HHIinnov, is described in Section 5.2. Firms with a high (low)
value of HHIinnov have a low (high) level of innovation diversity. High and low HHIinnov firms are classified every year by
the median of all U.S. listed firms with data available on HHIinnov. The dependent variable refers to the two measures of
firm innovation performance over the period from 2003 through 2014, Citations in Models 1 and 2 and Number of patents
in Models 3 and 4. Citations are the number of truncation-adjusted citations divided by the number of patents applied for
by a firm. Number of patents is the number of patents applied for. Dummy for switching firms is equal to one for an ASC
user and zero for an OBRA user. Dummy for post ASC is equal to one for the years after 2006, and zero otherwise. Other
variables are defined in Table 1. Numbers in parentheses are t-statistics computed using standard errors clustered by firm.
The Wald test is used to test the significance of difference in coefficients on Dummy for switching firms × Dummy for post
ASC between two subsamples (p-value in brackets). ***, **, and * denote significance at the 1%, 5%, and 10% levels,
respectively.
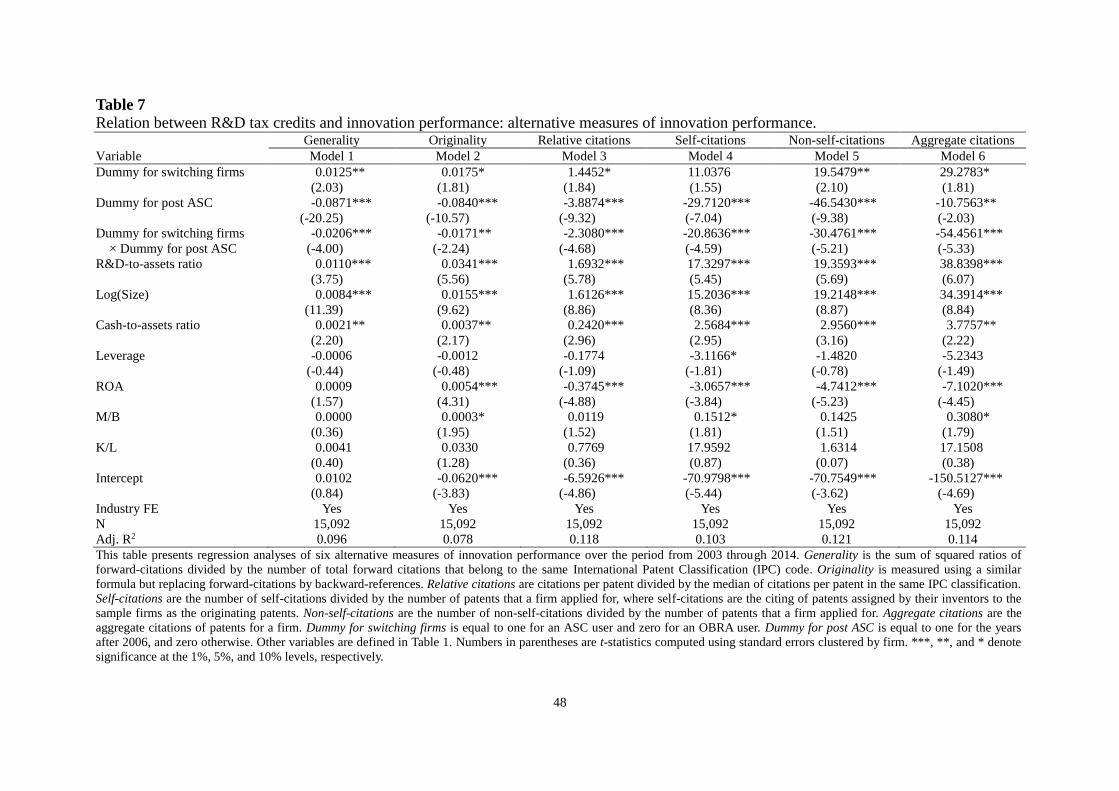
48
Table 7
Relation between R&D tax credits and innovation performance: alternative measures of innovation performance. Generality Originality Relative citations Self-citations Non-self-citations Aggregate citations
Variable Model 1 Model 2 Model 3 Model 4 Model 5 Model 6
Dummy for switching firms 0.0125** 0.0175* 1.4452* 11.0376 19.5479** 29.2783*
(2.03) (1.81) (1.84) (1.55) (2.10) (1.81)
Dummy for post ASC -0.0871*** -0.0840*** -3.8874*** -29.7120*** -46.5430*** -10.7563**
(-20.25) (-10.57) (-9.32) (-7.04) (-9.38) (-2.03)
Dummy for switching firms -0.0206*** -0.0171** -2.3080*** -20.8636*** -30.4761*** -54.4561***
× Dummy for post ASC (-4.00) (-2.24) (-4.68) (-4.59) (-5.21) (-5.33)
R&D-to-assets ratio 0.0110*** 0.0341*** 1.6932*** 17.3297*** 19.3593*** 38.8398***
(3.75) (5.56) (5.78) (5.45) (5.69) (6.07)
Log(Size) 0.0084*** 0.0155*** 1.6126*** 15.2036*** 19.2148*** 34.3914***
(11.39) (9.62) (8.86) (8.36) (8.87) (8.84)
Cash-to-assets ratio 0.0021** 0.0037** 0.2420*** 2.5684*** 2.9560*** 3.7757**
(2.20) (2.17) (2.96) (2.95) (3.16) (2.22)
Leverage -0.0006 -0.0012 -0.1774 -3.1166* -1.4820 -5.2343
(-0.44) (-0.48) (-1.09) (-1.81) (-0.78) (-1.49)
ROA 0.0009 0.0054*** -0.3745*** -3.0657*** -4.7412*** -7.1020***
(1.57) (4.31) (-4.88) (-3.84) (-5.23) (-4.45)
M/B 0.0000 0.0003* 0.0119 0.1512* 0.1425 0.3080*
(0.36) (1.95) (1.52) (1.81) (1.51) (1.79)
K/L 0.0041 0.0330 0.7769 17.9592 1.6314 17.1508
(0.40) (1.28) (0.36) (0.87) (0.07) (0.38)
Intercept 0.0102 -0.0620*** -6.5926*** -70.9798*** -70.7549*** -150.5127***
(0.84) (-3.83) (-4.86) (-5.44) (-3.62) (-4.69)
Industry FE Yes Yes Yes Yes Yes Yes
N 15,092 15,092 15,092 15,092 15,092 15,092
Adj. R2 0.096 0.078 0.118 0.103 0.121 0.114
This table presents regression analyses of six alternative measures of innovation performance over the period from 2003 through 2014. Generality is the sum of squared ratios of
forward-citations divided by the number of total forward citations that belong to the same International Patent Classification (IPC) code. Originality is measured using a similar
formula but replacing forward-citations by backward-references. Relative citations are citations per patent divided by the median of citations per patent in the same IPC classification.
Self-citations are the number of self-citations divided by the number of patents that a firm applied for, where self-citations are the citing of patents assigned by their inventors to the
sample firms as the originating patents. Non-self-citations are the number of non-self-citations divided by the number of patents that a firm applied for. Aggregate citations are the
aggregate citations of patents for a firm. Dummy for switching firms is equal to one for an ASC user and zero for an OBRA user. Dummy for post ASC is equal to one for the years
after 2006, and zero otherwise. Other variables are defined in Table 1. Numbers in parentheses are t-statistics computed using standard errors clustered by firm. ***, **, and * denote
significance at the 1%, 5%, and 10% levels, respectively.
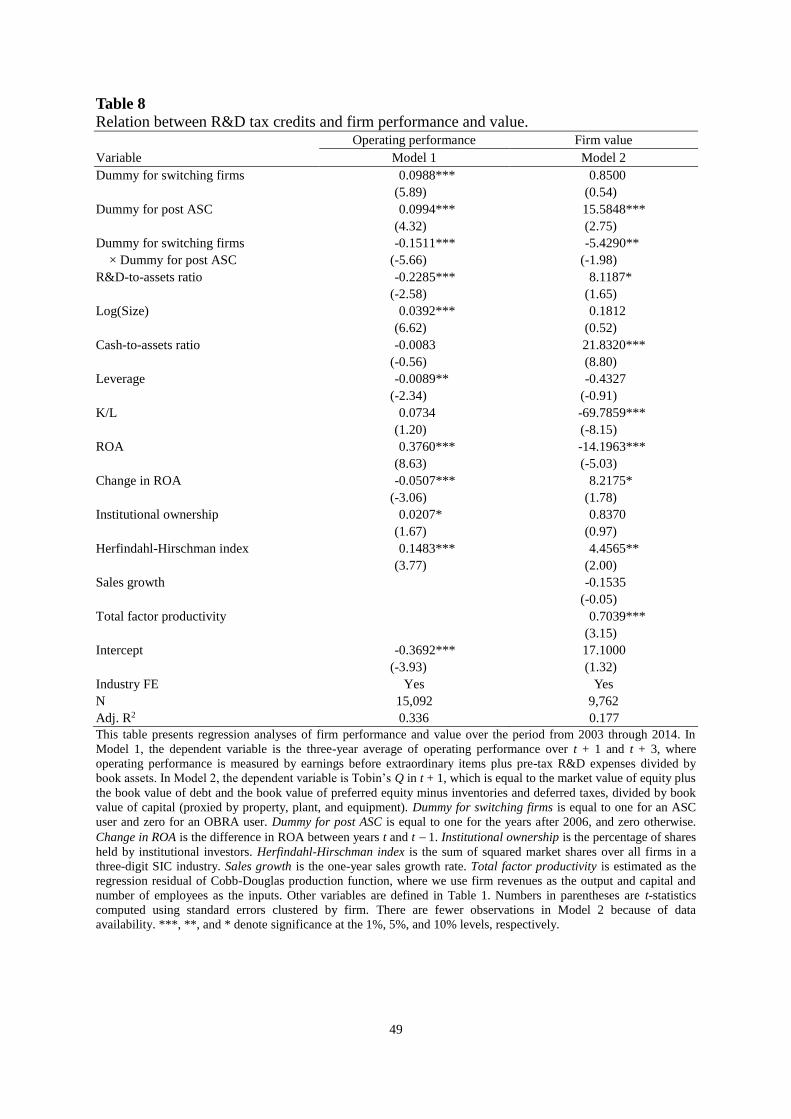
49
Table 8
Relation between R&D tax credits and firm performance and value. Operating performance Firm value
Variable Model 1 Model 2
Dummy for switching firms 0.0988*** 0.8500
(5.89) (0.54)
Dummy for post ASC 0.0994*** 15.5848***
(4.32) (2.75)
Dummy for switching firms -0.1511*** -5.4290**
× Dummy for post ASC (-5.66) (-1.98)
R&D-to-assets ratio -0.2285*** 8.1187*
(-2.58) (1.65)
Log(Size) 0.0392*** 0.1812
(6.62) (0.52)
Cash-to-assets ratio -0.0083 21.8320***
(-0.56) (8.80)
Leverage -0.0089** -0.4327
(-2.34) (-0.91)
K/L 0.0734 -69.7859***
(1.20) (-8.15)
ROA 0.3760*** -14.1963***
(8.63) (-5.03)
Change in ROA -0.0507*** 8.2175*
(-3.06) (1.78)
Institutional ownership 0.0207* 0.8370
(1.67) (0.97)
Herfindahl-Hirschman index 0.1483*** 4.4565**
(3.77) (2.00)
Sales growth -0.1535
(-0.05)
Total factor productivity 0.7039***
(3.15)
Intercept -0.3692*** 17.1000
(-3.93) (1.32)
Industry FE Yes Yes
N 15,092 9,762
Adj. R2 0.336 0.177
This table presents regression analyses of firm performance and value over the period from 2003 through 2014. In
Model 1, the dependent variable is the three-year average of operating performance over t + 1 and t + 3, where
operating performance is measured by earnings before extraordinary items plus pre-tax R&D expenses divided by
book assets. In Model 2, the dependent variable is Tobin’s Q in t + 1, which is equal to the market value of equity plus
the book value of debt and the book value of preferred equity minus inventories and deferred taxes, divided by book
value of capital (proxied by property, plant, and equipment). Dummy for switching firms is equal to one for an ASC
user and zero for an OBRA user. Dummy for post ASC is equal to one for the years after 2006, and zero otherwise.
Change in ROA is the difference in ROA between years t and t 1. Institutional ownership is the percentage of shares
held by institutional investors. Herfindahl-Hirschman index is the sum of squared market shares over all firms in a
three-digit SIC industry. Sales growth is the one-year sales growth rate. Total factor productivity is estimated as the
regression residual of Cobb-Douglas production function, where we use firm revenues as the output and capital and
number of employees as the inputs. Other variables are defined in Table 1. Numbers in parentheses are t-statistics
computed using standard errors clustered by firm. There are fewer observations in Model 2 because of data
availability. ***, **, and * denote significance at the 1%, 5%, and 10% levels, respectively.

50
Table 9
Relation between R&D tax credits and innovation performance for a sample of start-ups. Log(1 + Citations) Log(1 + Number of patents)
Variable Model 1 Model 2
Dummy for ASC start-ups -0.4637*** -0.3499***
(-5.02) (-5.79)
Dummy for post ASC -0.4837*** -0.2211***
(-5.93) (-3.67)
Dummy for ASC start-ups 0.5243 0.1923
× Dummy for post ASC (0.85) (0.51)
R&D-to-assets ratio 0.1223** 0.1702***
(2.06) (3.51)
Log(Size) 0.0584*** 0.0621***
(5.42) (6.59)
Cash-to-assets ratio 0.0076 0.0074
(0.58) (0.80)
Leverage -0.0132 -0.0152*
(-1.08) (-1.71)
ROA 0.0061 0.0027
(1.43) (0.87)
M/B 0.0004 0.0007
(0.64) (1.59)
K/L -0.0038 0.0175
(-0.05) (0.23)
Intercept 0.0842 -0.1494
(0.60) (-1.61)
Industry FE Yes Yes
N 2,662 2,662
Adj. R2 0.110 0.104
This table presents regressions of innovation performance for a sample including two groups of start-ups that went
public after 2002. Group A consists of start-ups that never applied for R&D tax credits during our sample period, and
Group B consists of start-ups that had no R&D tax credits before 2007 but gained them through the ASC method. The
dependent variable refers to the two measures of firm innovation performance over the period from 2003 through
2014, Citations in Model 1 and Number of patents in Model 2. Citations are the number of truncation-adjusted
citations divided by the number of patents applied for by a firm. Number of patents is the number of patents applied
for. Dummy for ASC start-ups is equal to one if a new start-up belongs to Group B, and zero if it belongs to Group A.
Dummy for post ASC is equal to one for the years after 2006, and zero otherwise. Other variables are defined in Table
1. Numbers in parentheses are t-statistics computed using standard errors clustered by firm. ***, **, and * denote
significance at the 1%, 5%, and 10% levels, respectively.

51
Table 10
Relation between R&D tax credits and innovation performance for subsamples stratified by
returns to scale. Log(1 + Citations) Log(1 + Number of patents)
Returns to scale
> 1
Returns to scale ≤ 1
Returns to scale
> 1
Returns to scale ≤ 1
Variable Model 1 Model 2 Model 3 Model 4
Dummy for switching firms 0.0059 0.0731** 0.0133 0.0881***
(0.14) (2.14) (0.30) (2.53)
Dummy for post ASC -0.1331*** -0.0847*** -0.0405* -0.0111
(-6.03) (-6.25) (-1.66) (-0.77)
Dummy for switching firms -0.0976*** -0.1096*** -0.0627** -0.1049***
× Dummy for post ASC (-3.15) (-4.21) (-2.13) (-4.04)
R&D-to-assets ratio 0.1059*** 0.0614*** 0.1949*** 0.0802***
(3.19) (4.94) (5.07) (6.48)
Log(Size) 0.0506*** 0.0480*** 0.0800*** 0.0614***
(7.09) (9.25) (7.80) (9.44)
Cash-to-assets ratio 0.0398*** 0.0034 0.0433*** 0.0036
(2.91) (0.84) (3.29) (0.99)
Leverage -0.0189 0.0014 -0.0270** -0.0002
(-1.59) (0.21) (-2.16) (-0.03)
ROA 0.0248** 0.0057 0.0198* -0.0026
(2.30) (1.21) (1.78) (-0.52)
M/B 0.0025*** -0.0001 0.0031*** 0.0004
(2.74) (-0.16) (3.31) (1.00)
K/L -0.0101 -0.0026 0.0501 0.0100
(-0.09) (-0.05) (0.33) (0.14)
Intercept 0.0349 -0.1704** -0.3013 -0.3162***
(0.22) (-2.20) (-1.56) (-3.91)
Industry FE Yes Yes Yes Yes
N 1,022 2,592 1,022 2,592
Adj. R2 0.109 0.092 0.161 0.136
Wald test
1.444
[0.707]
1.587
[0.206]
This table presents regressions of innovation performance for subsamples stratified by returns to scale. We consider a
Cobb-Douglas production function with inputs of labor, capital, and R&D and with outputs of firm revenues. The
production function is estimated for each firm using its time-series data. The returns to scale are equal to the sum of
output elasticities of labor, capital, and R&D from the estimated production function. The dependent variable refers to
the two measures of firm innovation performance over the period from 2003 through 2014, Citations in Models 1 and
2 and Number of patents in Models 3 and 4. Citations are the number of truncation-adjusted citations divided by the
number of patents applied for by a firm. Number of patents is the number of patents applied for. Dummy for switching
firms is equal to one for an ASC user and zero for an OBRA user. Dummy for post ASC is equal to one for the years
after 2006, and zero otherwise. Other variables are defined in Table 1. Numbers in parentheses are t-statistics
computed using standard errors clustered by firm. The Wald test is used to test the significance of difference in
coefficients on Dummy for switching firms × Dummy for post ASC between two subsamples (p-value in brackets). ***,
**, and * denote significance at the 1%, 5%, and 10% levels, respectively.

52
Table 11
Regression analysis for R&D spillover effects.
Missing wij is replaced
by zero
Observation with missing wij
is dropped
Variable Model 1 Model 2
Dummy for switching firms 1.9627* 4.2663**
(1.85) (2.55)
Dummy for post ASC -5.4499*** -6.4645*
(-5.41) (-1.75)
Dummy for switching firms -1.9652* 1.1524
× Dummy for post ASC (-1.89) (0.47)
R&D-to-assets ratio 4.3907*** 16.2410**
(4.00) (2.48)
Log(Size) 2.0587*** 1.6470***
(9.22) (2.75)
Cash-to-assets ratio 0.1020 -2.4739**
(0.45) (-2.56)
Leverage -0.7426** -0.7168
(-2.29) (-0.87)
ROA 0.6326*** 5.6224**
(3.07) (2.43)
M/B 0.0640*** 0.1182
(2.93) (1.35)
K/L 5.8609* 2.2118
(1.75) (0.25)
Intercept -12.9914*** -7.0690
(-7.41) (-0.77)
Industry FE Yes Yes
N 15,092 4,549
Adj. R2 0.146 0.484
This table presents regressions of R&D spillover effects over the period from 2003 through 2014. To estimate the
R&D spillover effect, we define technological proximity as an uncentered correlation coefficient of innovation
activities of two firms i and j:
,'''jjiiji SSSSSS
where Si = (Si,1, …, Si,k) is a vector of innovation activity in technology classification k for firm i. We use six
technology classifications as in Hall, Jaffe, and Trajtenberg (2001, 2005) and measure innovation activity by the
number of patents that a firm applied for at the U.S. Patent and Trademark Office. The R&D spillover effect is
estimated as:
ij
jtijCRDw ,
where wij is proximity between firms i and j, and firm j is in the same three-digit SIC industry as firm i; CRD is firm
R&D capital. Model 1 replaces the missing values of wij with zero, and Model 2 drops the observation with missing
wij. Dummy for switching firms is equal to one for an ASC user and zero for an OBRA user. Dummy for post ASC is
equal to one for the years after 2006, and zero otherwise. Other variables are defined in Table 1. Numbers in
parentheses are t-statistics computed using standard errors clustered by firm. ***, **, and * denote significance at the
1%, 5%, and 10% levels, respectively.

53
Table 12
Relation between R&D tax credits and innovation performance: effect of the 1981 OBRA. Log(1 + Citations) Log(1 + Number of patents)
Variable Model 1 Model 2
Dummy for OBRA firms 0.0922** 0.0253
(2.21) (0.78)
Dummy for post OBRA -0.0882*** -0.0938***
(-8.12) (-10.66)
Dummy for OBRA firms 0.0860** 0.0655**
× Dummy for post OBRA (2.19) (2.30)
R&D-to-assets ratio 0.9695*** 0.6226***
(16.06) (14.93)
Log(Size) 0.0935*** 0.0912***
(21.53) (20.13)
Cash-to-assets ratio 0.1070*** 0.0424***
(13.48) (9.04)
Leverage -0.0227*** -0.0172***
(-11.94) (-11.22)
ROA 0.0726*** -0.0183*
(5.94) (-1.94)
M/B 0.0059*** 0.0040***
(8.47) (8.06)
K/L -0.0793*** -0.0553***
(-8.32) (-6.24)
Intercept -0.1420* -0.1948***
(-1.66) (-3.51)
Industry FE Yes Yes
N 170,164 170,164
Adj. R2 0.125 0.138
This table investigates how the Omnibus Budget Reconciliation Act enacted in 1981 affected firm innovation
performance. The dependent variable refers to the two measures of firm innovation performance over the period from
1974 through 2006, Citations in Model 1 and Number of patents in Model 2. Citations are the number of
truncation-adjusted citations divided by the number of patents applied for by a firm. Number of patents is the number
of patents applied for. Dummy for OBRA firms is equal to one if a firm does not gain R&D tax credits before 1981 but
gain R&D tax credits through the OBRA in any year from 1981 through 2006, and zero if a firm does not obtain any
R&D tax credits from 1974 through 2006. Dummy for post OBRA is equal to one for the years after 1980, and zero
otherwise. Other variables are defined in Table 1. Numbers in parentheses are t-statistics computed using standard
errors clustered by firm. ***, **, and * denote significance at the 1%, 5%, and 10% levels, respectively.

54
Panel A: Innovation performance measured by citations
Panel B: Innovation performance measured by number of patents
Figure 1
Distribution of coefficients on the interaction variable in regression equation (3): a placebo
test. This figure reports a placebo test for the distribution of coefficients on the interaction variable in the regression of
innovation performance in Equation (3). Innovation performance is measured by Citations in Panel A and Number of
patents in Panel B. Citations are the number of truncation-adjusted citations divided by the number of patents applied
for by a firm. Number of patents is the number of patents applied for. We replace each ASC user with another firm
randomly selected from among OBRA users (i.e., pseudo-ASC users). We re-run the regression for Equation (3) by
replacing Dummy for switching firms by Dummy for switching placebos, which is equal to one for a pseudo-ASC user,
and zero otherwise. We record the coefficient on the interaction variable, Dummy for switching placebos × Dummy for
post ASC, where Dummy for post ASC is equal to one for the years after 2006, and zero otherwise. We repeat this
procedure 1,000 times and hence obtain 1,000 estimated coefficients on the interaction variable.

Internet Appendix for
“Tax policy and innovation performance:
Evidence from enactment of the Alternative Simplified Credit”
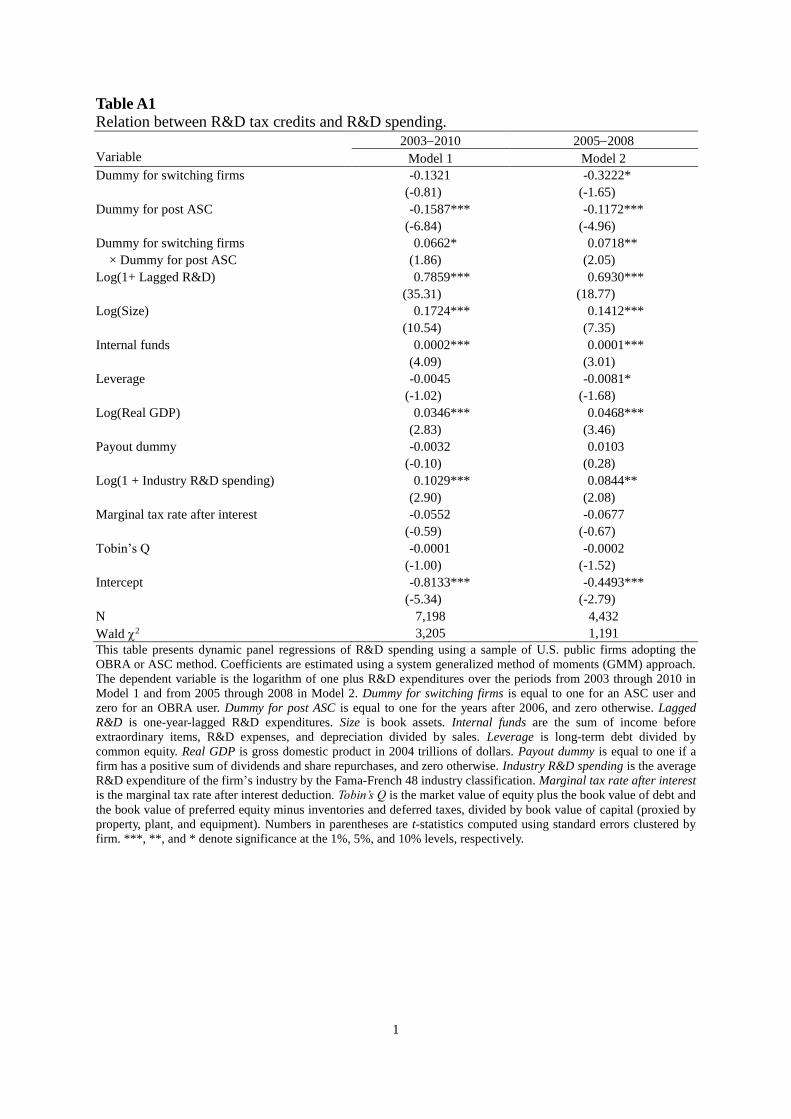
1
Table A1
Relation between R&D tax credits and R&D spending.
20032010 20052008
Variable Model 1 Model 2
Dummy for switching firms -0.1321 -0.3222*
(-0.81) (-1.65)
Dummy for post ASC -0.1587*** -0.1172***
(-6.84) (-4.96)
Dummy for switching firms 0.0662* 0.0718**
× Dummy for post ASC (1.86) (2.05)
Log(1+ Lagged R&D) 0.7859*** 0.6930***
(35.31) (18.77)
Log(Size) 0.1724*** 0.1412***
(10.54) (7.35)
Internal funds 0.0002*** 0.0001***
(4.09) (3.01)
Leverage -0.0045 -0.0081*
(-1.02) (-1.68)
Log(Real GDP) 0.0346*** 0.0468***
(2.83) (3.46)
Payout dummy -0.0032 0.0103
(-0.10) (0.28)
Log(1 + Industry R&D spending) 0.1029*** 0.0844**
(2.90) (2.08)
Marginal tax rate after interest -0.0552 -0.0677
(-0.59) (-0.67)
Tobin’s Q -0.0001 -0.0002
(-1.00) (-1.52)
Intercept -0.8133*** -0.4493***
(-5.34) (-2.79)
N 7,198 4,432
Wald 2 3,205 1,191
This table presents dynamic panel regressions of R&D spending using a sample of U.S. public firms adopting the
OBRA or ASC method. Coefficients are estimated using a system generalized method of moments (GMM) approach.
The dependent variable is the logarithm of one plus R&D expenditures over the periods from 2003 through 2010 in
Model 1 and from 2005 through 2008 in Model 2. Dummy for switching firms is equal to one for an ASC user and
zero for an OBRA user. Dummy for post ASC is equal to one for the years after 2006, and zero otherwise. Lagged
R&D is one-year-lagged R&D expenditures. Size is book assets. Internal funds are the sum of income before
extraordinary items, R&D expenses, and depreciation divided by sales. Leverage is long-term debt divided by
common equity. Real GDP is gross domestic product in 2004 trillions of dollars. Payout dummy is equal to one if a
firm has a positive sum of dividends and share repurchases, and zero otherwise. Industry R&D spending is the average
R&D expenditure of the firm’s industry by the Fama-French 48 industry classification. Marginal tax rate after interest
is the marginal tax rate after interest deduction. Tobin’s Q is the market value of equity plus the book value of debt and
the book value of preferred equity minus inventories and deferred taxes, divided by book value of capital (proxied by
property, plant, and equipment). Numbers in parentheses are t-statistics computed using standard errors clustered by
firm. ***, **, and * denote significance at the 1%, 5%, and 10% levels, respectively.

2
Table A2
Relation between R&D tax credits and innovation performance using data on R&D tax
credits reported in 10-Ks. Log(1 + Citations) Log(1 + Number of patents)
Variable Model 1 Model 2
Dummy for switching firms 0.1520* 0.1062
(1.81) (1.47)
Dummy for post ASC -0.0556 0.0376
(-0.84) (0.56)
Dummy for switching firms -0.2529*** -0.1814*
× Dummy for post ASC (-2.62) (-1.91)
R&D-to-assets ratio 0.1115 0.1298*
(1.36) (1.80)
Log(Size) 0.0950*** 0.1449***
(3.96) (5.54)
Cash-to-assets ratio 0.0449 0.0605**
(1.55) (2.32)
Leverage -0.0394 -0.0648*
(-1.12) (-1.68)
ROA 0.0169 -0.0328
(0.27) (-0.58)
M/B -0.0020 0.0025
(-0.76) (1.02)
K/L 0.3149 0.4623*
(1.26) (1.68)
Intercept -0.1215 -0.4302***
(-0.88) (-2.93)
Industry FE Yes Yes
N 697 697
Adj. R2 0.187 0.330
This table presents regressions of innovation performance for a sample of U.S. firms that report the amount of R&D
tax credits in 10-K reports. We compare their reported R&D tax credits with our estimated R&D tax credits. We
identify a firm as an ASC user if its reported R&D tax credits fall within the range between ±20% of the estimated
R&D tax credits of the ASC regime and outside the range between ±20% of the estimated R&D tax credits of the
OBRA regime. We use a similar approach to define an OBRA user. The dependent variable refers to the two measures
of firm innovation performance over the period from 2003 through 2014, Citations in Model 1 and Number of patents
in Model 2. Citations are the number of truncation-adjusted citations divided by the number of patents applied for by a
firm. Number of patents is the number of patents applied for. Dummy for switching firms is equal to one for an ASC
user and zero for an OBRA user. Dummy for post ASC is equal to one for the years after 2006, and zero otherwise.
Other variables are defined in Table 1. Numbers in parentheses are t-statistics computed using standard errors
clustered by firm. ***, **, and * denote significance at the 1%, 5%, and 10% levels, respectively.

3
Table A3
Relation between R&D tax credits and innovation performance using an alternative definition
of ASC users. Log(1 + Citations) Log(1 + Number of patents)
Variable Model 1 Model 2
Dummy for switching firms 0.0543 -0.0150
(0.59) (-0.14)
Dummy for post ASC -0.7086*** -0.3723***
(-19.49) (-9.99)
Dummy for switching firms -0.2962*** -0.2483***
× Dummy for post ASC (-4.24) (-3.83)
R&D-to-assets ratio 0.1411*** 0.2212***
(5.02) (7.86)
Log(Size) 0.1087*** 0.1750***
(12.54) (12.84)
Cash-to-assets ratio 0.0279*** 0.0230***
(3.20) (2.98)
Leverage -0.0154 -0.0248*
(-1.13) (-1.69)
ROA 0.0107* -0.0100
(1.75) (-1.57)
M/B 0.0016** 0.0024***
(2.07) (3.35)
K/L 0.0676 0.1354
(0.61) (0.96)
Intercept -0.0909 -0.7569***
(-0.30) (-4.40)
Industry FE Yes Yes
N 12,914 12,914
Adj. R2 0.101 0.158
This table presents regressions of innovation performance using an alternative definition of ASC users. The dependent
variable refers to the two measures of firm innovation performance over the period from 2003 through 2014, Citations
in Model 1 and Number of patents in Model 2. Citations are the number of truncation-adjusted citations divided by the
number of patents applied for by a firm. Number of patents is the number of patents applied for. We redefine the ASC
user as a firm that used the OBRA method before 2009 but switched to the ASC method in 2009 or 2010 and the
OBRA user as a firm that kept using OBRA throughout the sample period. Dummy for switching firms is equal to one
for an ASC user and zero for an OBRA user. Dummy for post ASC is redefined to be equal to one for the years after
2008, and zero otherwise. Other variables are defined in Table 1. Numbers in parentheses are t-statistics computed
using standard errors clustered by firm. ***, **, and * denote significance at the 1%, 5%, and 10% levels,
respectively.

4
Table A4
Relation between R&D tax credits and innovation performance using a propensity score
matched sample. Nearest neighbor matching Caliper matching
Log(1 + Citations)
Log(1 + Number
of patents)
Log(1 + Citations)
Log(1 + Number
of patents)
Variable Model 1 Model 2 Model 3 Model 4
Dummy for switching firms 0.1939** 0.2625** 0.0494 0.1348
(2.13) (2.38) (0.71) (1.59)
Dummy for post ASC -0.7694*** -0.5884*** -0.9128*** -0.5404***
(-11.04) (-7.66) (-19.74) (-10.60)
Dummy for switching firms -0.1436** -0.1211** -0.1440*** -0.1833***
× Dummy for post ASC (-2.46) (-1.99) (-2.94) (-3.37)
R&D-to-assets ratio 0.5922*** 0.9131*** 0.1754*** 0.2619***
(3.72) (4.83) (5.13) (7.43)
Log(Size) 0.0874*** 0.1705*** 0.1127*** 0.1844***
(5.71) (6.07) (11.33) (11.02)
Cash-to-assets ratio 0.1265** 0.1022* 0.0349*** 0.0341***
(2.34) (1.70) (2.85) (2.99)
Leverage 0.0158 0.0392 -0.0166 -0.0138
(0.73) (1.36) (-1.14) (-0.79)
ROA 0.0320 -0.0110 0.0245*** 0.0002
(1.00) (-0.25) (3.40) (0.03)
M/B 0.0027 0.0022 0.0007 0.0016*
(0.78) (0.49) (0.79) (1.72)
K/L -0.1838 -0.3316 0.0328 0.0988
(-0.73) (-0.95) (0.27) (0.60)
Intercept -0.2326*** -0.7504*** 0.5330 -0.5319*
(-2.90) (-5.93) (0.54) (-1.77)
Industry FE Yes Yes Yes Yes
N 10,705 10,705 10,705 10,705
Adj. R2 0.128 0.191 0.102 0.178
This table presents regressions of innovation performance using a propensity score matched sample. For each year
from 2007 through 2010, we perform a probit regression where the dependent variable is equal to one for the ASC
users and zero for the OBRA users, and the independent variables include Log(Size), Cash-to-assets ratio, Leverage,
PPE-to-assets ratio, and Sales growth. The propensity score is calculated using the estimated coefficients and
realizations of the corresponding independent variables for each firm. In Models 1 and 2, each ASC user is matched to
an OBRA user with the closest propensity score. We use an alternative matching approach in Models 3 and 4 by first
forming a matched group of OBRA users within a 0.001 caliper of the ASC user’s propensity score and then taking the
average of the matched group for each ASC user. The dependent variable refers to the two measures of firm
innovation performance over the period from 2003 through 2014. Citations are the number of truncation-adjusted
citations divided by the number of patents applied for by a firm. Number of patents is the number of patents applied
for. Dummy for switching firms is equal to one for an ASC user and zero for an OBRA user. Dummy for post ASC is
equal to one for the years after 2006, and zero otherwise. Other variables are defined in Table 1. Numbers in
parentheses are t-statistics computed using standard errors clustered by firm. ***, **, and * denote significance at the
1%, 5%, and 10% levels, respectively.

5
Table A5 Relation between R&D tax credits and innovation performance after accounting for another
self-selection issue. Dummy for
R&D tax credit users
Log(1 + Citations)
Log(1 + Number of patents)
Variable Model 1 Model 2 Model 3
Dummy for switching firms 0.1107* 0.1434**
(1.87) (2.17)
Dummy for post ASC -0.2298*** -0.1120***
(-7.38) (-2.99)
Dummy for switching firms -0.2253*** -0.1975***
× Dummy for post ASC (-4.65) (-3.80)
R&D-to-assets ratio 0.3258*** 0.5191***
(5.79) (8.02)
IRS attention 0.1856***
(10.28)
Log(Size) 0.0682*** 0.1293*** 0.1567***
(18.94) (9.77) (8.89)
Cash-to-assets ratio 0.1600*** 0.0749** -0.0126
(10.09) (2.50) (-0.32)
Leverage -0.0329*** -0.0150 0.0044
(-7.85) (-1.50) (0.37)
ROA 0.0053 -0.0114
(0.85) (-1.55)
M/B 0.0020** 0.0023***
(2.42) (2.62)
Sales growth -0.0773***
(-3.54)
K/L -0.4265*** -0.0497 0.0855
(-18.39) (-1.22) (1.45)
Average cash effective tax rates -0.0821**
(-2.30)
Volatility of cash effective 0.0263**
Tax rates (2.12)
Inverse Mills ratio 0.8546 -4.9724**
(0.59) (-2.32)
Intercept -1.7256*** -1.1551 3.0007*
(-75.69) (-1.01) (1.78)
Industry FE Yes Yes Yes
N 52,574 11,024 11,024
Pseudo R2 or Adj. R2 0.045 0.113 0.180
This table presents Heckman two-stage regression analysis for innovation performance to account for a potential
self-selection bias arising from firm voluntary decision about whether to use R&D tax credits. Model 1 shows the
results for the first stage, where a probit regression is used. The dependent variable is Dummy for R&D tax credit
users, which is equal to one if a firm uses the OBRA method before 2007 and the OBRA or ASC method over the
period from 2007 through 2010, and zero otherwise. Explanatory variables are defined in Table 3. Models 2 and 3
shows the results for the second stage, where we estimate regressions of Citations and Number of patents over the
period from 2003 through 2014 by including the inverse Mills ratio as an additional control that is estimated from the
first-stage probit regression. Citations are the number of truncation-adjusted citations divided by the number of
patents applied for by a firm. Number of patents is the number of patents applied for. Dummy for switching firms is
equal to one for an ASC user and zero for an OBRA user. Dummy for post ASC is equal to one for the years after 2006,
and zero otherwise. Other variables are defined in Table 1. Numbers in parentheses are t-statistics computed using
standard errors clustered by firm. ***, **, and * denote significance at the 1%, 5%, and 10% levels, respectively.


