October 13, 2017
ICICI Securities Ltd | Retail Equity Research
Result Update
Dollar revenue in line, margins surprise…
US$ revenues grew 3.2% QoQ to $4,739 million, in line with our
3.2% QoQ growth and $4,739 million estimate. Constant currency
revenues grew 1.7% QoQ led by volume growth (3.2% QoQ)
Rupee revenues grew 3.2% QoQ to | 30,541 crore, marginally ahead
of our 2.9% growth estimate of | 30,453 crore
At 25.1%, EBIT margins expanded 170 bps and were above our 130
bps expansion and 24.6% estimate mainly on account of better-than-
expected revenue growth and lower SG&A (down 1.9% QoQ)
PAT of | 6,446 crore was ahead of our | 6,267 crore estimate led by a
better-than-expected operational performance. TCS declared a
dividend of | 7 per share
Going ahead: Cautious on BFSI; optimistic on retail…
Constant currency (CC) revenues grew 1.7% QoQ, lower than our
estimates of 2% led by weakness in the retail & BFSI segment. While BFS
is yet to see any meaningful improvement in fundamentals, a couple of
deal wins in insurance segment expected to materialise in coming
quarters would be a positive. For the retail segment, the management
anticipates retail segment to have bottomed out and expects it to pick up
in coming quarters on the back of increasing discretionary spends.
Although a few deals are of significant size, deal size on overall front and,
specifically in BFS, continues to remain small. A recovery on this front
needs to be watched. We now expect dollar revenues to grow at a CAGR
of 8.7% in FY17E-19E.
Margins better than expectations …
EBIT margins came in better than our expectations with a 170 bps uptick
sequentially to 25.1% led by cross currency benefit (50 bps) accompanied
by operational efficiency. Decline in SG&A as a percentage of revenue
(16.9% in Q2 vs. 17.8% in Q1) was a primary reason for margin expansion
coming in better than our estimates. The management continues to target
its EBIT margin band of 26-28% (in CC terms) for FY18E. However, rupee
appreciation, increased local hiring and demand for investments in digital
could make it a rough ride. We tweak our margin estimates to 24.7%,
25.2% in FY18E, FY19E, respectively.
Digital contribution @19.7% of revenues, grows 32.6% YoY…
Digital contribution to overall revenues continues to pick up and is now at
19.7% to revenue vs. 18.9% in Q1FY18. It reported double digit growth
for a third consecutive quarter on a YoY basis and grew 32.6% YoY.
Keeping in view the transformation to digital, TCS has carried out a
restructuring exercise in the previous quarter and reorganised its service
lines. The management said the reorganised service lines successfully
completed their transition in Q2, and are experiencing strong demand
with transformational wins in respective domains.
Await recovery in BFS; maintain HOLD…
TCS surprised us positively on the margin front in Q2FY18. However, the
management commentary on the demand environment remains a mixed
bag. While the retail vertical has bottomed out, we are yet to see a
recovery in its largest vertical i.e. BFSI on the deal size front. Hence, we
continue to expect subdued earning growth (4.3%) in FY17-19.
Nonetheless, FY19 FCF yield of ~5% lends us comfort on limited
downside. Hence, we maintain our HOLD rating on TCS with a revised
target price of | 2540.
Rating matrix
Rating : Hold
Target : | 2540
Target Period : 12 months
Potential Upside : 0%
What’s Changed?
Target Changed from | 2400 to | 2540
EPS FY18E Changed from | 133.1 to | 134.3
EPS FY19E Changed from | 148.6 to | 149.4
Rating Unchanged
Quarterly Performance
Q2FY18 Q2FY17 YoY (%) Q1FY18 QoQ (%)
Revenue 30,541 29,284 4.3 29,584 3.2
EBIT 7,660 7,617 0.6 6,914 10.8
EBIT (%) 25.1 26.0 -93 bps 23.4 171 bps
PAT 6,446 6,586 (2.1) 5,945 8.4
Key Financials
| Crore FY16 FY17 FY18E FY19E
Net Sales 108,646 117,966 123,033 137,087
EBITDA 30,678 32,311 32,419 36,739
Net Profit 24,215 26,289 25,713 28,604
EPS (|) 122.9 133.4 134.3 149.4
Valuation summary
FY16 FY17 FY18E FY19E
P/E 20.7 19.1 18.9 17.0
Target P/E 20.7 19.0 18.9 17.0
EV / EBITDA 15.3 14.0 14.0 11.9
P/BV 6.9 5.7 5.6 4.7
RoNW (%) 33.1 29.8 29.8 27.8
RoCE (%) 42.2 38.0 37.9 35.5
Stock data
Particular Amount
Market Capitalization (| Crore) 499,076.8
Total Debt (| Crore) 289.0
Cash and equivalents (| Crore) 28,826.7
EV (| Crore) 470,494.9
52 week H/L 2707 / 2055
Equity capital 197.0
Face value | 1
Price performance (%)
1M 3M 6M 12M
TCS (0.3) 6.0 8.3 0.1
Infosys 2.9 5.6 (0.5) (10.2)
Wipro 5.9 8.0 11.1 (2.5)
HCL Tech 4.4 10.3 4.9 23.4
Research Analyst
Deepak Purswani, CFA
Deepti Tayal
Tata Consultancy Services (TCS) | 2548
ICICI Securities Ltd | Retail Equity Research Page 2
Variance analysis
Q2FY18 Q2FY18E Q2FY17 YoY (%) Q1FY18 QoQ (%) Comments
Revenue 30,541 30,453 29,284 4.3 29,584 3.2 Constant currency revenues grew 1.7% QoQ led by volume growth (3.2%)
Employee expenses 17,218 17,045 16,171 6.5 16,914 1.8
Gross Margin 13,323 13,408 13,113 1.6 12,670 5.2
Gross margin (%) 43.6 44.0 44.8 -116 bps 42.8 80 bps
SG&A expenses 5,159 5,390 5,002 3.1 5,258 -1.9
EBITDA 8,164 8,017 8,111 0.7 7,412 10.1
EBITDA Margin (%) 26.7 26.3 27.7 -97 bps 25.1 168 bps
Depreciation 504 518 494 2.0 498 1.2
EBIT 7,660 7,500 7,617 0.6 6,914 10.8
EBIT Margin (%) 25.1 24.6 26.0 -93 bps 23.4 171 bps
EBIT margins expanded 170 bps QoQ led by revenue growth and lower SG&A
expenses
Other income (less interest) 812 754 1,052 -22.8 932 -12.9
PBT 8,472 8,253 8,669 -2.3 7,846 8.0
Tax paid 2,012 1,981 2,066 -2.6 1,896 6.1
PAT 6,446 6,268 6,586 -2.1 5,945 8.4 Reported PAT was above our expectation due to better operational performance
Key Metrics
Closing employees 389,213 386,000 371,519 4.8 385,809 0.9 Net addition was up by 3404
Overall attrition (%) 11.3 11.5 11.9 -60 bps 11.6 -30 bps Attrition declined 30 bps sequentially
Average $/| 64.4 64.3 67.0 -3.7 64.4 0.0
Source: Company, ICICIdirect.com Research
Change in estimates
(| Crore) Old New % Change Old New % Change Comments
Revenue 121,736 123,033 1.1 136,174 137,087 0.7
EBIT 30,251 30,389 0.5 34,180 34,477 0.9
EBIT Margin (%) 24.9 24.7 -15 bps 25.1 25.2 5 bps
Revising margin estimates owing to rupee estimates and several other
headwinds
PAT 25,481 25,713 0.9 28,451 28,604 0.5
EPS (|) 133.1 134.3 0.9 148.6 149.4 0.5 Estimates tweaked owing to margin revision estimates
FY18E FY19E
Source: Company, ICICIdirect.com Research
Assumptions
Current Earlier Current Earlier Comments
FY16 FY17 FY18E FY18E FY19E FY19E
Closing employees 353,843 387,223 402,305 392,305 431,040 422,190
Overall attrition (%) 17.5 12.9 11.6 11.6 11.5 11.5
Average $/| 65.7 67.1 64.8 64.5 66.0 66.0 Tweaking FY18E exchange rate
Source: Company, ICICIdirect.com Research
ICICI Securities Ltd | Retail Equity Research Page 3
Company Analysis
Key highlights: Commentary from earnings call
Margin band maintained - The management continues to maintain
its target margin band of 26-28% though rupee appreciation,
increased local hiring and demand for investments in digital could
act as headwinds to the margin profile
BFSI - BFSI (33% of revenue) grew 1.9% (CC) sequentially. BFSI is
yet to see any meaningful improvement in fundamentals and size
of the deal wins
Retail segment - Retail (11.9% of revenue) witnessed softness
with 0.9% sequential decline in Q2FY18. The management
anticipates retail segment to have bottomed out and expects it to
pick up in the coming quarters
Digital business- Sequentially, digital business contributed 19.7%
to revenue (16.1% in Q2FY17), up 7.6%, 32.6% QoQ, YoY,
respectively
Client metrics - Healthy progression of clients was witnessed in
the higher value bucket as one client transitioned to $100 million+
bucket and six each to US$50 million+, US$20 million+ and
US$10 million+ category
Employee update - Attrition in IT services declined to 11.3%
(LTM) vs. 11.6% QoQ while overall attrition also declined to
12.1% (LTM) vs. 12.4% QoQ. Net addition in the quarter was at
3404 taking the total employee headcount to 389,213. As per the
management, more freshers are expected to be on the roll from
Q2 and onwards
Operating metric highlights…
US$ revenues grew 3.2% QoQ to $4,739 million, in line with our 3.2%
QoQ growth and $4,739 million estimate. Operationally, growth was
broad based across verticals and geographies. Geographically, in CC
terms, North America (51.9% of revenue) grew 1.4% sequentially while
UK (14% of revenue), Continental Europe (13.4%) and Latin America
(2.2%) grew 2.5%, 5.3% and 5.7%, respectively. India (6.3% of revenue)
declined 6.8% QoQ while grew 14.3% YoY. Softness in North America is
on the back of sustained softness in the BFSI segment.
Performance wise in CC terms, among verticals, BFSI (33% of revenues)
grew 1.9% QoQ while technology & services (8.1% of revenue),
communication and media (7.3%) and life-sciences & healthcare (7.2%)
posted a growth of 3.4%, 1.4% and 3.6%, respectively. Smaller segments
as per revenue contribution, Energy & utilities (4.2% of revenue) and
travel & hospitality (3.8%) saw strong sequential growth with 7.2% and
8% respectively. On the other side, retail & CPG (11.9%) and regional
markets & others (17% of revenue) were soft and posted a decline of
0.9% and 0.6% QoQ in the quarter.
ICICI Securities Ltd | Retail Equity Research Page 4
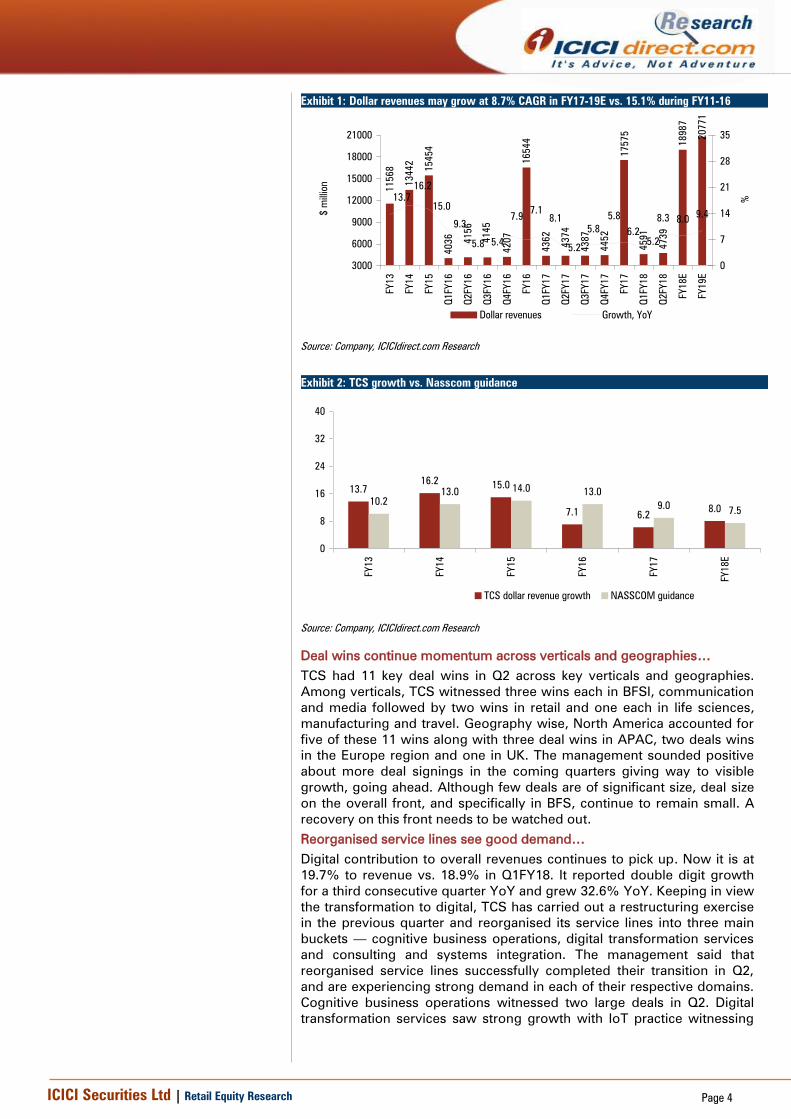
Exhibit 1: Dollar revenues may grow at 8.7% CAGR in FY17-19E vs. 15.1% during FY11-16
13442
15454
4036
4207
16544
4362
4387
4452
4591
4739
18987
20771
11568
4156
4145
4374
17575
8.3 8.09.4
13.7
16.2
15.0
9.3
5.8 5.4
7.97.1
8.1
5.2
5.8
5.8
6.2
5.2
3000
6000
9000
12000
15000
18000
21000
FY13
FY14
FY15
Q1FY16
Q2FY16
Q3FY16
Q4FY16
FY16
Q1FY17
Q2FY17
Q3FY17
Q4FY17
FY17
Q1FY18
Q2FY18
FY18E
FY19E
$ m
illion
0
7
14
21
28
35
%
Dollar revenues Growth, YoY
Source: Company, ICICIdirect.com Research
Exhibit 2: TCS growth vs. Nasscom guidance
13.7
16.215.0
7.16.2
8.0
10.2
13.014.0
13.0
9.07.5
0
8
16
24
32
40
FY13
FY14
FY15
FY16
FY17
FY18E
TCS dollar revenue growth NASSCOM guidance
Source: Company, ICICIdirect.com Research
Deal wins continue momentum across verticals and geographies…
TCS had 11 key deal wins in Q2 across key verticals and geographies.
Among verticals, TCS witnessed three wins each in BFSI, communication
and media followed by two wins in retail and one each in life sciences,
manufacturing and travel. Geography wise, North America accounted for
five of these 11 wins along with three deal wins in APAC, two deals wins
in the Europe region and one in UK. The management sounded positive
about more deal signings in the coming quarters giving way to visible
growth, going ahead. Although few deals are of significant size, deal size
on the overall front, and specifically in BFS, continue to remain small. A
recovery on this front needs to be watched out.
Reorganised service lines see good demand…
Digital contribution to overall revenues continues to pick up. Now it is at
19.7% to revenue vs. 18.9% in Q1FY18. It reported double digit growth
for a third consecutive quarter YoY and grew 32.6% YoY. Keeping in view
the transformation to digital, TCS has carried out a restructuring exercise
in the previous quarter and reorganised its service lines into three main
buckets — cognitive business operations, digital transformation services
and consulting and systems integration. The management said that
reorganised service lines successfully completed their transition in Q2,
and are experiencing strong demand in each of their respective domains.
Cognitive business operations witnessed two large deals in Q2. Digital
transformation services saw strong growth with IoT practice witnessing
ICICI Securities Ltd | Retail Equity Research Page 5
double digit quarterly growth while consulting and systems integration
saw more than 10 major wins in the quarter.
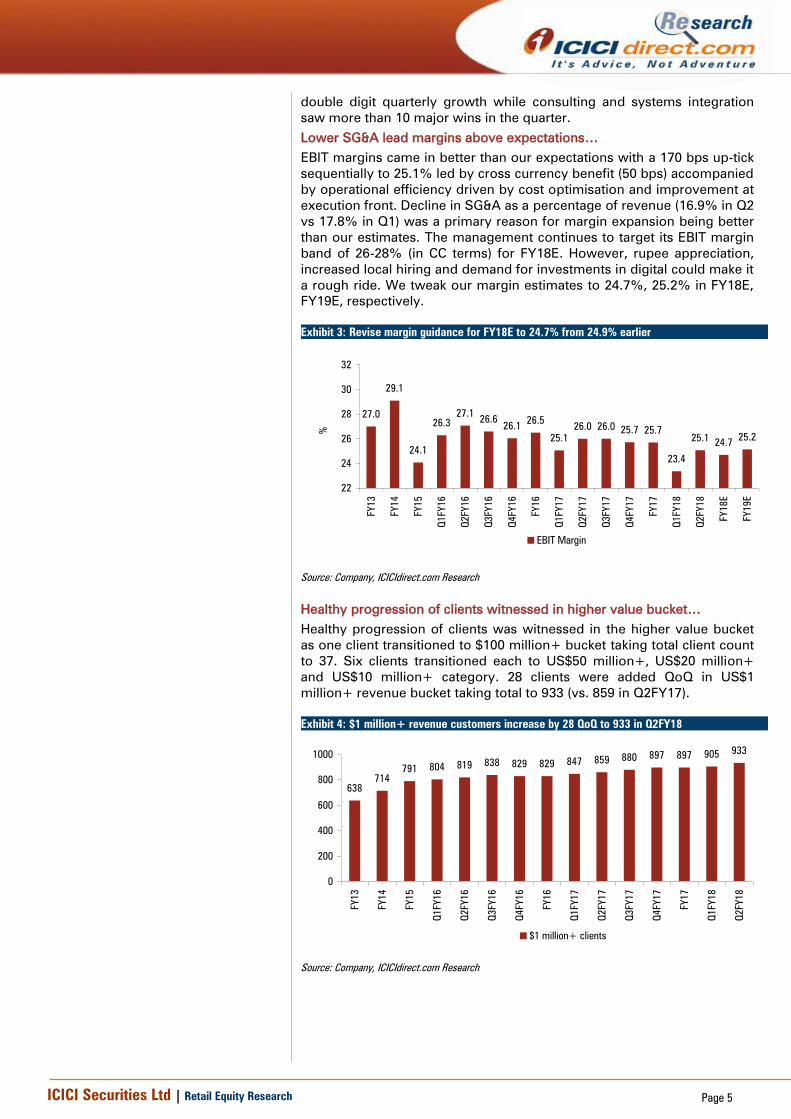
Lower SG&A lead margins above expectations…
EBIT margins came in better than our expectations with a 170 bps up-tick
sequentially to 25.1% led by cross currency benefit (50 bps) accompanied
by operational efficiency driven by cost optimisation and improvement at
execution front. Decline in SG&A as a percentage of revenue (16.9% in Q2
vs 17.8% in Q1) was a primary reason for margin expansion being better
than our estimates. The management continues to target its EBIT margin
band of 26-28% (in CC terms) for FY18E. However, rupee appreciation,
increased local hiring and demand for investments in digital could make it
a rough ride. We tweak our margin estimates to 24.7%, 25.2% in FY18E,
FY19E, respectively.
Exhibit 3: Revise margin guidance for FY18E to 24.7% from 24.9% earlier
27.0
29.1
24.1
26.3
27.126.6
26.126.5
25.1
26.0 26.025.7 25.7
23.4
25.124.7
25.2
22
24
26
28
30
32FY13
FY14
FY15
Q1FY16
Q2FY16
Q3FY16
Q4FY16
FY16
Q1FY17
Q2FY17
Q3FY17
Q4FY17
FY17
Q1FY18
Q2FY18
FY18E
FY19E
%
EBIT Margin
Source: Company, ICICIdirect.com Research
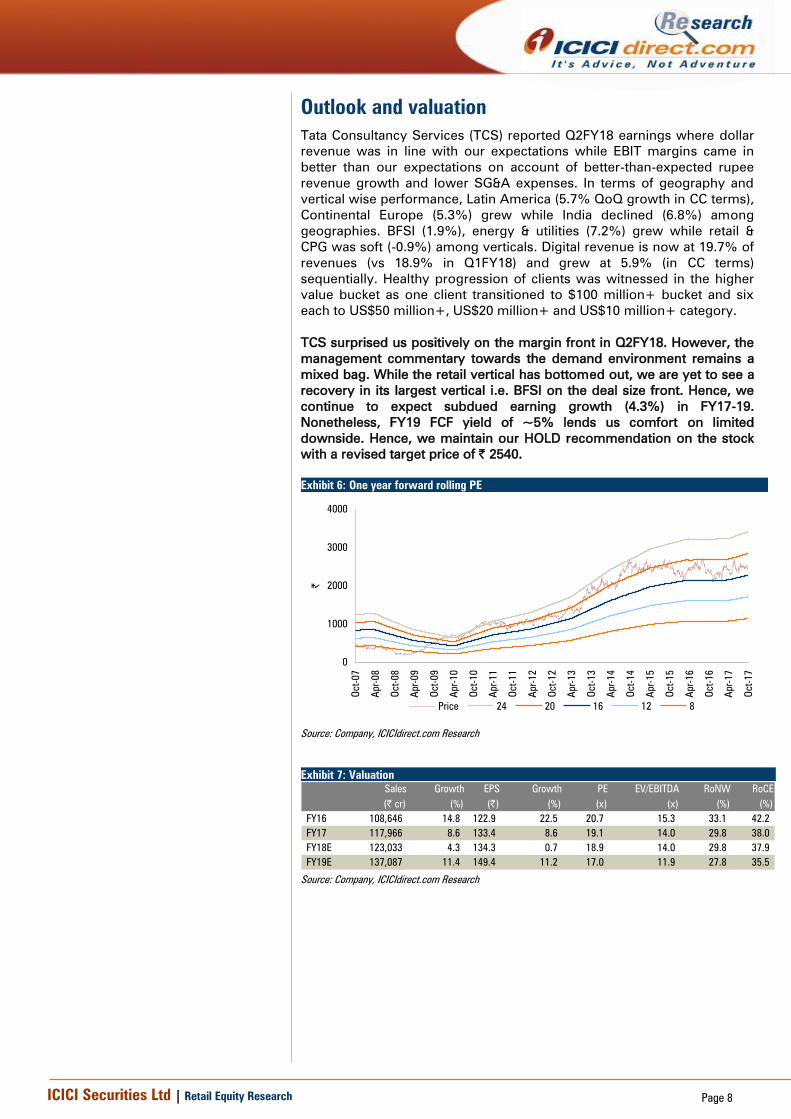
Healthy progression of clients witnessed in higher value bucket…
Healthy progression of clients was witnessed in the higher value bucket
as one client transitioned to $100 million+ bucket taking total client count
to 37. Six clients transitioned each to US$50 million+, US$20 million+
and US$10 million+ category. 28 clients were added QoQ in US$1
million+ revenue bucket taking total to 933 (vs. 859 in Q2FY17).
Exhibit 4: $1 million+ revenue customers increase by 28 QoQ to 933 in Q2FY18
638
714
791 804 819 838 829 829 847 859 880 897 897 905933
0
200
400
600
800
1000
FY13
FY14
FY15
Q1FY16
Q2FY16
Q3FY16
Q4FY16
FY16
Q1FY17
Q2FY17
Q3FY17
Q4FY17
FY17
Q1FY18
Q2FY18
$1 million+ clients
Source: Company, ICICIdirect.com Research

ICICI Securities Ltd | Retail Equity Research Page 6
Attrition in IT services declines 30 bps to 11.3%…
The attrition in IT services declined to 11.3% (LTM) vs. 11.6% QoQ while
overall attrition also declined to 12.1% (LTM) vs. 12.4% QoQ. Net addition
was of 3404 people taking the total employee headcount to 389,213. The
management said it would continue with its effort to hire local talent in all
major markets and continue making investments in building up people
skills. They reiterated that gross hiring would be lower in FY18E
compared to FY17 owing to an increase in local hiring and increasing
usage of automation and productivity enhancement.
Exhibit 5: Overall Attrition declines 30 bps QoQ to 12.1%
10.6
11.3
14.9
15.916.2
15.915.5 15.5
13.6
12.9
12.2
11.5
12.912.4
12.111.6 11.5
10
12
14
16
18
20
FY13
FY14
FY15
Q1FY16
Q2FY16
Q3FY16
Q4FY16
FY16
Q1FY17
Q2FY17
Q3FY17
Q4FY17
FY17
Q1FY18
Q2FY18
FY18E
FY19E
%
Overall attrition (%)
[
Source: Company, ICICIdirect.com Research

ICICI Securities Ltd | Retail Equity Research Page 7
Annual report key takeaways…
TCS chose “Reimagining the Enterprise” as the theme of the
annual report, with the sight of capturing the depth and
profoundness of the transformation that enterprises – both TCS
and its customers - are going through in the Digital age. With
digital technologies now accounting for most of the new IT
spending by customers, ~55% of clients engage on Digital
Services with the percentage much higher for larger clients.
Digital revenue touched ~$3 billion milestone in FY17, making up
16.7% of revenue and growing 28.8% over prior year
TCS’ strategy for long term growth continues to be a) continually
investing in improving its customer-centric execution capabilities
by deepening domain expertise, offering full services capability,
building innovative IP and solution frameworks, b) investing to
expand addressable market by acquiring new clients, scaling
newer geographies & industry verticals, building new capabilities.
The first element of strategy has resulted in improved share of
wallet with increased customer satisfaction levels while the
second element of strategy has led to addition of 11 clients in $50
million+ revenue band bringing the total to 84 and addition of 68
clients in $1 million+ category taking the total to 897. However, a
reduction of two clients took place in $100 million+ bucket
TCS mentioned that local hiring programmes in various
geographies are progressing well. In FY17, the company recruited
over 11,500 employees outside India, bringing down its
dependence on work visas significantly
FY17 was a year of leadership transition in TCS with N
Chandrasekaran stepping down from his executive role (MD &
CEO of TCS) to become the Chairman of the Board. CFO Rajesh
Gopinathan took over as new MD and CEO while V Ramakrishnan
was appointed as CFO succeeding Rajesh Gopinathan
Operating cash flow grew 29% YoY to | 26,992 crore (highest
ever) mainly due to better working capital management to | 1,106
(vs. | 4,871 crore in FY16). FCF increased 32% to | 25,039 crore
while OCF, EBITDA is now at 83.5% from 68.2% in FY16. FCF
yield of 5% and the management’s continuous commentary to
maintain 80% of FCF payout should restrict the downside for the
stock
TCS paid a dividend of | 47 per share in FY17 with dividend
payout ratio (including dividend distribution tax) of 42%
compared to its peers Infosys 49.6% and HCL Tech ~47%.
Additionally, the company completed the buyback of up to 5.6
crore equity shares at | 2,850 per share, for an aggregate amount
not exceeding | 16,000 crore
ICICI Securities Ltd | Retail Equity Research Page 8
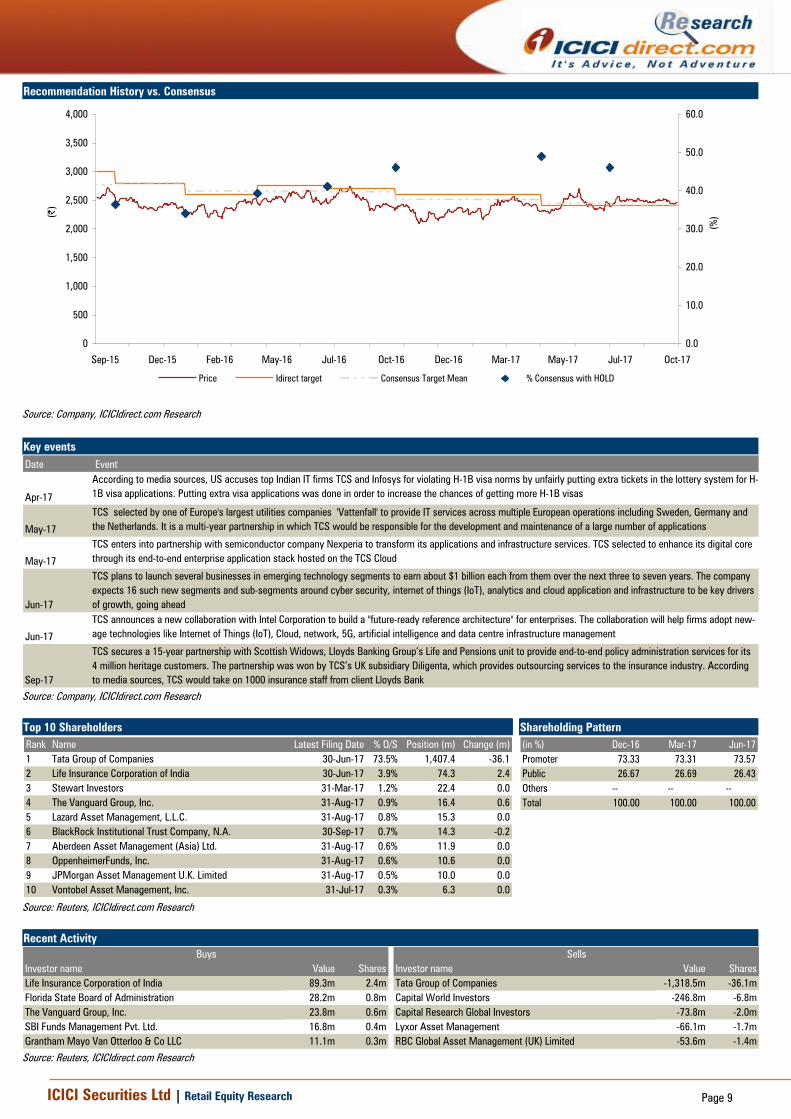
Outlook and valuation
Tata Consultancy Services (TCS) reported Q2FY18 earnings where dollar
revenue was in line with our expectations while EBIT margins came in
better than our expectations on account of better-than-expected rupee
revenue growth and lower SG&A expenses. In terms of geography and
vertical wise performance, Latin America (5.7% QoQ growth in CC terms),
Continental Europe (5.3%) grew while India declined (6.8%) among
geographies. BFSI (1.9%), energy & utilities (7.2%) grew while retail &
CPG was soft (-0.9%) among verticals. Digital revenue is now at 19.7% of
revenues (vs 18.9% in Q1FY18) and grew at 5.9% (in CC terms)
sequentially. Healthy progression of clients was witnessed in the higher
value bucket as one client transitioned to $100 million+ bucket and six
each to US$50 million+, US$20 million+ and US$10 million+ category.
TCS surprised us positively on the margin front in Q2FY18. However, the
management commentary towards the demand environment remains a
mixed bag. While the retail vertical has bottomed out, we are yet to see a
recovery in its largest vertical i.e. BFSI on the deal size front. Hence, we
continue to expect subdued earning growth (4.3%) in FY17-19.
Nonetheless, FY19 FCF yield of ~5% lends us comfort on limited
downside. Hence, we maintain our HOLD recommendation on the stock
with a revised target price of | 2540.
Exhibit 6: One year forward rolling PE
0
1000
2000
3000
4000
Oct-07
Apr-08
Oct-08
Apr-09
Oct-09
Apr-10
Oct-10
Apr-11
Oct-11
Apr-12
Oct-12
Apr-13
Oct-13
Apr-14
Oct-14
Apr-15
Oct-15
Apr-16
Oct-16
Apr-17
Oct-17
|
Price 24 20 16 12 8
Source: Company, ICICIdirect.com Research
Exhibit 7: Valuation
Sales Growth EPS Growth PE EV/EBITDA RoNW RoCE
(| cr) (%) (|) (%) (x) (x) (%) (%)
FY16 108,646 14.8 122.9 22.5 20.7 15.3 33.1 42.2
FY17 117,966 8.6 133.4 8.6 19.1 14.0 29.8 38.0
FY18E 123,033 4.3 134.3 0.7 18.9 14.0 29.8 37.9
FY19E 137,087 11.4 149.4 11.2 17.0 11.9 27.8 35.5
Source: Company, ICICIdirect.com Research
ICICI Securities Ltd | Retail Equity Research Page 9
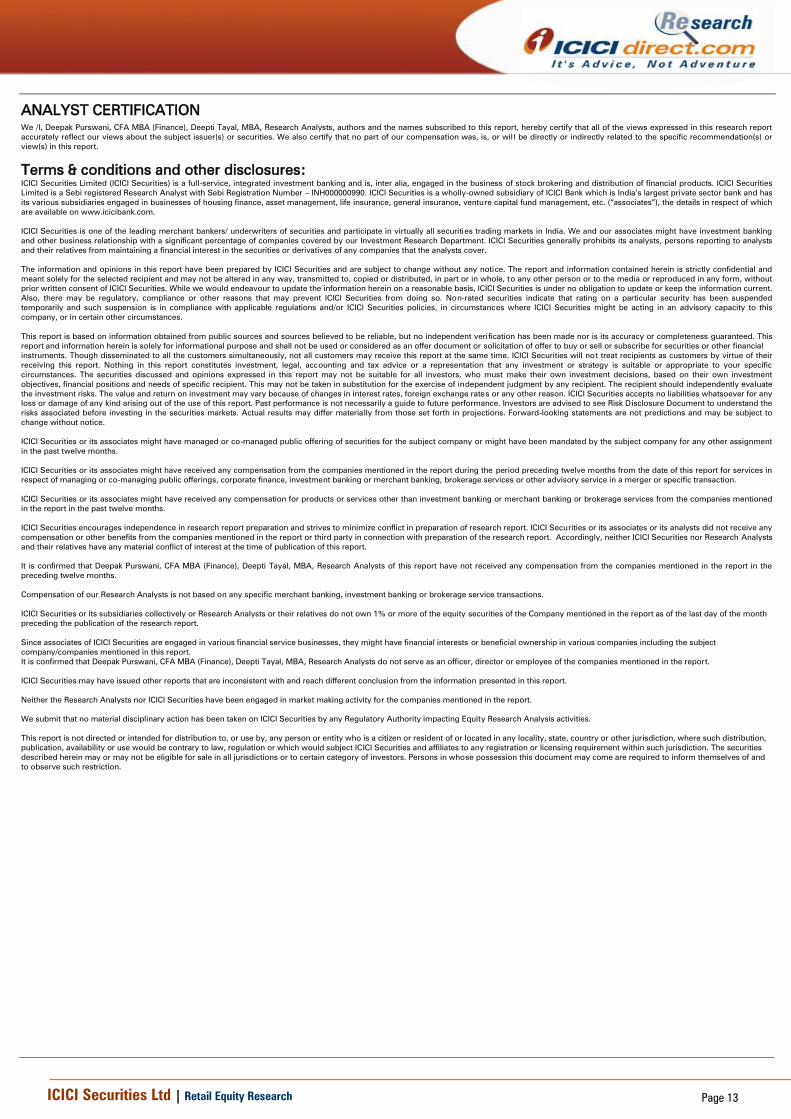
Recommendation History vs. Consensus
0
500
1,000
1,500
2,000
2,500
3,000
3,500
4,000
Oct-17Jul-17May-17Mar-17Dec-16Oct-16Jul-16May-16Feb-16Dec-15Sep-15
(|
)
0.0
10.0
20.0
30.0
40.0
50.0
60.0
(%
)
Price Idirect target Consensus Target Mean % Consensus with HOLD
Source: Company, ICICIdirect.com Research
Key events
Date Event
Apr-17
According to media sources, US accuses top Indian IT firms TCS and Infosys for violating H-1B visa norms by unfairly putting extra tickets in the lottery system for H-
1B visa applications. Putting extra visa applications was done in order to increase the chances of getting more H-1B visas
May-17
TCS selected by one of Europe's largest utilities companies 'Vattenfall' to provide IT services across multiple European operations including Sweden, Germany and
the Netherlands. It is a multi-year partnership in which TCS would be responsible for the development and maintenance of a large number of applications
May-17
TCS enters into partnership with semiconductor company Nexperia to transform its applications and infrastructure services. TCS selected to enhance its digital core
through its end-to-end enterprise application stack hosted on the TCS Cloud
Jun-17
TCS plans to launch several businesses in emerging technology segments to earn about $1 billion each from them over the next three to seven years. The company
expects 16 such new segments and sub-segments around cyber security, internet of things (IoT), analytics and cloud application and infrastructure to be key drivers
of growth, going ahead
Jun-17
TCS announces a new collaboration with Intel Corporation to build a "future-ready reference architecture" for enterprises. The collaboration will help firms adopt new-
age technologies like Internet of Things (IoT), Cloud, network, 5G, artificial intelligence and data centre infrastructure management
Sep-17
TCS secures a 15-year partnership with Scottish Widows, Lloyds Banking Group’s Life and Pensions unit to provide end-to-end policy administration services for its
4 million heritage customers. The partnership was won by TCS’s UK subsidiary Diligenta, which provides outsourcing services to the insurance industry. According
to media sources, TCS would take on 1000 insurance staff from client Lloyds Bank
Source: Company, ICICIdirect.com Research
Top 10 Shareholders Shareholding Pattern
Rank Name Latest Filing Date % O/S Position (m) Change (m)
1 Tata Group of Companies 30-Jun-17 73.5% 1,407.4 -36.1
2 Life Insurance Corporation of India 30-Jun-17 3.9% 74.3 2.4
3 Stewart Investors 31-Mar-17 1.2% 22.4 0.0
4 The Vanguard Group, Inc. 31-Aug-17 0.9% 16.4 0.6
5 Lazard Asset Management, L.L.C. 31-Aug-17 0.8% 15.3 0.0
6 BlackRock Institutional Trust Company, N.A. 30-Sep-17 0.7% 14.3 -0.2
7 Aberdeen Asset Management (Asia) Ltd. 31-Aug-17 0.6% 11.9 0.0
8 OppenheimerFunds, Inc. 31-Aug-17 0.6% 10.6 0.0
9 JPMorgan Asset Management U.K. Limited 31-Aug-17 0.5% 10.0 0.0
10 Vontobel Asset Management, Inc. 31-Jul-17 0.3% 6.3 0.0
(in %) Dec-16 Mar-17 Jun-17
Promoter 73.33 73.31 73.57
Public 26.67 26.69 26.43
Others -- -- --
Total 100.00 100.00 100.00
Source: Reuters, ICICIdirect.com Research
Recent Activity
Investor name Value Shares Investor name Value Shares
Life Insurance Corporation of India 89.3m 2.4m Tata Group of Companies -1,318.5m -36.1m
Florida State Board of Administration 28.2m 0.8m Capital World Investors -246.8m -6.8m
The Vanguard Group, Inc. 23.8m 0.6m Capital Research Global Investors -73.8m -2.0m
SBI Funds Management Pvt. Ltd. 16.8m 0.4m Lyxor Asset Management -66.1m -1.7m
Grantham Mayo Van Otterloo & Co LLC 11.1m 0.3m RBC Global Asset Management (UK) Limited -53.6m -1.4m
Buys Sells
Source: Reuters, ICICIdirect.com Research

ICICI Securities Ltd | Retail Equity Research Page 10
.
Financial summary
Profit and loss statement | Crore
(Year-end March) FY14 FY16 FY17 FY18E FY19E
Total operating Income 108,646 117,966 123,033 137,087
Growth (%) 14.8 8.6 4.3 11.4
COGS (employee expenses) 59,012 64,900 68,837 76,083
S,G&A expenses 18,956 20,755 21,777 24,264
Total Operating Expenditure 77,968 85,655 90,613 100,347
EBITDA 30,678 32,311 32,419 36,739
Growth (%) 24.4 5.3 0.3 13.3
Depreciation 1,888 1,987 2,030 2,262
Other Income less interest 3,050 4,189 3,268 2,987
PBT 31,840 34,513 33,657 37,465
Total Tax 7,503 8,156 7,893 8,804
Minority Interest 123 68 51 56
Exceptional Item 0 0 0 0
PAT before exceptional item 24,215 26,289 25,713 28,604
Growth (%) 23.2 8.6 -2.2 11.2
EPS (|) 122.9 133.4 134.3 149.4
PAT after exceptional item 24,215 26,289 25,713 28,604
EPS - Reported (|) 122.9 133.4 134.3 149.4
Source: Company, ICICIdirect.com Research
Cash flow statement | Crore
(Year-end March) FY16 FY17 FY18E FY19E
Profit before Tax 31,840 34,513 33,657 37,465
Add: Depreciation 1,888 1,987 2,030 2,262
(Inc)/dec in Current Assets (3,725) (896) (1,232) (2,438)
Inc/(dec) in CL and Provisions (1,146) (210) 3,955 2,142
Taxes paid (7,578) (7,946) (7,893) (8,804)
CF from operating activities 20,919 26,992 27,954 27,607
(Inc)/dec in Investments (5,119) (21,823) (17,713) (745)
(Inc)/dec in Fixed Assets (4,848) (3,920) (4,028) (2,075)
Others (264) 0 2,564 2,564
CF from investing activities (6,977) (18,521) (256) 236
Inc/(dec) in loan funds (30) 14 87 0
Dividend paid & dividend tax (9,432) (10,947) (11,645) (12,009)
Others (197) (161) (16,080) (16,000)
CF from financing activities (9,646) (11,006) (27,645) (12,009)
Net Cash flow 4,296 (2,535) 52 15,834
Exchange difference 140 (163) 0 0
Opening Cash 18,245 6,347 4,028 4,079
Closing Cash 6,348 4,027 4,079 19,913
Source: Company, ICICIdirect.com Research
Balance sheet | Crore
(Year-end March) FY14 FY16 FY17 FY18E FY19E
Liabilities
Equity Capital 197 197 191 191
Reserve and Surplus 66,496 81,487 79,561 96,156
Share Premium 6,497 6,631 6,631 6,631
Total Shareholders funds 73,190 88,315 86,383 102,978
Total debt 245 289 298 324
Other liabilities & Provisions 1,212 1,170 1,208 1,244
Deferred tax liability(net) 805 919 919 919
Minority Interest / Others 354 366 417 473
Total Liabilities 75,806 91,059 89,225 105,939
Assets
Net assets & CWIP 11,924 11,788 11,833 11,628
Goodwill 3,812 3,721 3,721 3,721
Other non current assets 12,262 9,318 10,063 10,790
Debtors 24,073 22,684 23,658 24,676
Loans and Advances 4,131 4,531 4,726 5,265
Other Current Assets 6,183 7,648 7,711 8,591
Current Investments 22,479 41,636 41,636 41,636
Cash 6,348 4,027 4,079 19,913
Trade Payable 7,541 6,279 9,843 10,967
OCL & Provisions 7,866 8,015 8,359 9,314
Application of Funds 75,806 91,059 89,225 105,939
Source: Company, ICICIdirect.com Research
Key ratios
(Year-end March) FY16 FY17 FY18E FY19E
Per share data (|)
Adjusted EPS (Diluted) 122.9 133.4 134.3 149.4
BV per share 371.4 448.3 451.4 538.1
DPS 43.5 47.0 50.5 52.1
Cash Per Share 32.2 20.4 21.3 104.0
Operating Ratios (%)
EBIT margins 26.5 25.7 24.7 25.2
PBT Margins 29.3 29.3 27.4 27.3
PAT Margin 22.3 22.3 20.9 20.9
Debtor days 81 70 70 66
Creditor days 25 19 29 29
Return Ratios (%)
RoE 33.1 29.8 29.8 27.8
RoCE 42.2 38.0 37.9 35.5
RoIC 90.9 92.7 101.1 114.1
Valuation Ratios (x)
P/E 20.7 19.1 18.9 17.0
EV / Net Sales 4.3 3.8 3.7 3.2
Market Cap / Sales 4.6 4.2 4.1 3.6
Solvency Ratios
Debt / EBITDA 0.0 0.0 0.0 0.0
Debt / Equity 0.0 0.0 0.0 0.0
Current Ratio 2.2 2.4 2.0 1.9
Quick Ratio 2.2 2.4 2.0 1.9
Source: Company, ICICIdirect.com Research

ICICI Securities Ltd | Retail Equity Research Page 11
ICICIdirect.com coverage universe (IT)
CMP M Cap
(|) TP(|) Rating (| Cr) FY17 FY18E FY19E FY17 FY18E FY19E FY17 FY18E FY19E FY17 FY18E FY19E FY17 FY18E FY19E
Cyient (INFENT) 521 545 Hold 5,866 30.5 35.2 41.7 17.1 14.8 12.5 10.4 8.3 7.0 19.7 20.7 21.6 16.2 16.8 17.6
Eclerx (ECLSER) 1,245 1,145 Sell 5,133 86.4 80.4 88.2 14.4 15.5 14.1 9.7 10.4 9.3 34.5 28.9 29.4 29.1 23.9 23.7
Firstsource (FIRSOU) 43 40 Buy 2,854 4.1 4.0 4.2 10.4 10.7 10.2 8.2 7.5 6.8 11.7 11.7 11.9 13.8 11.9 11.1
HCL Tech (HCLTEC) 909 930 Hold 128,253 60.0 59.7 66.1 15.1 15.2 13.7 11.1 10.4 9.1 30.3 30.6 33.3 26.6 25.5 27.1
Infosys (INFTEC) 933 975 Hold 213,239 62.8 64.7 69.6 14.9 14.4 13.4 9.9 10.1 8.9 28.8 31.2 30.1 20.8 22.4 21.5
KPIT Tech (KPISYS) 132 140 Hold 2,627 10.6 9.9 13.8 12.4 13.3 9.6 7.2 7.4 5.4 16.3 14.9 18.6 15.4 11.7 14.3
Mindtree (MINCON) 487 470 Hold 8,178 24.9 26.9 33.3 19.6 18.1 14.6 10.6 11.0 8.3 21.2 24.2 28.1 16.2 18.8 21.8
NIIT Technologies (NIITEC) 609 575 Hold 2,182 43.5 44.7 52.3 12.8 13.6 11.6 3.3 3.1 2.4 30.0 27.8 30.1 15.0 13.9 14.5
Persistent (PSYS) 663 700 Buy 5,303 37.6 47.9 38.8 16.9 16.4 14.4 9.9 9.0 7.1 20.7 19.4 21.4 15.9 14.6 16.0
TCS (TCS) 2,548 2,540 Hold 499,077 133.4 134.3 149.4 19.1 18.9 17.0 14.0 14.0 11.9 38.0 37.9 35.5 29.8 29.8 27.8
Tech Mahindra (TECMAH) 463 450 Hold 45,499 31.7 32.4 38.2 14.6 14.3 12.1 9.9 9.0 7.4 19.4 17.3 18.4 17.1 15.5 16.2
Wipro (WIPRO) 290 285 Hold 71,306 17.5 18.1 20.2 16.6 16.0 14.3 4.4 5.3 4.1 16.8 17.3 16.8 16.3 17.0 16.2
Sector / Company
RoE(%)RoCE (%)EV/EBITDA (x)P/E (x)EPS (|)
Source: Company, ICICIdirect.com Research

ICICI Securities Ltd | Retail Equity Research Page 12
RATING RATIONALE
ICICIdirect.com endeavours to provide objective opinions and recommendations. ICICIdirect.com assigns
ratings to its stocks according to their notional target price vs. current market price and then categorises them
as Strong Buy, Buy, Hold and Sell. The performance horizon is two years unless specified and the notional
target price is defined as the analysts' valuation for a stock.
Strong Buy: >15%/20% for large caps/midcaps, respectively, with high conviction;
Buy: >10%/15% for large caps/midcaps, respectively;
Hold: Up to +/-10%;
Sell: -10% or more;
Pankaj Pandey Head – Research [email protected]
ICICIdirect.com Research Desk,
ICICI Securities Limited,
1st Floor, Akruti Trade Centre,
Road No 7, MIDC,
Andheri (East)
Mumbai – 400 093
.
ICICI Securities Ltd | Retail Equity Research Page 13
ANALYST CERTIFICATION
We /I, Deepak Purswani, CFA MBA (Finance), Deepti Tayal, MBA, Research Analysts, authors and the names subscribed to this report, hereby certify that all of the views expressed in this research report
accurately reflect our views about the subject issuer(s) or securities. We also certify that no part of our compensation was, is, or wil l be directly or indirectly related to the specific recommendation(s) or
view(s) in this report.
Terms & conditions and other disclosures:
ICICI Securities Limited (ICICI Securities) is a full-service, integrated investment banking and is, inter alia, engaged in the business of stock brokering and distribution of financial products. ICICI Securities
Limited is a Sebi registered Research Analyst with Sebi Registration Number – INH000000990. ICICI Securities is a wholly-owned subsidiary of ICICI Bank which is India’s largest private sector bank and has
its various subsidiaries engaged in businesses of housing finance, asset management, life insurance, general insurance, venture capital fund management, etc. (“associates”), the details in respect of which
are available on www.icicibank.com.
ICICI Securities is one of the leading merchant bankers/ underwriters of securities and participate in virtually all securities trading markets in India. We and our associates might have investment banking
and other business relationship with a significant percentage of companies covered by our Investment Research Department. ICICI Securities generally prohibits its analysts, persons reporting to analysts
and their relatives from maintaining a financial interest in the securities or derivatives of any companies that the analysts cover.
The information and opinions in this report have been prepared by ICICI Securities and are subject to change without any notice. The report and information contained herein is strictly confidential and
meant solely for the selected recipient and may not be altered in any way, transmitted to, copied or distributed, in part or in whole, to any other person or to the media or reproduced in any form, without
prior written consent of ICICI Securities. While we would endeavour to update the information herein on a reasonable basis, ICICI Securities is under no obligation to update or keep the information current.
Also, there may be regulatory, compliance or other reasons that may prevent ICICI Securities from doing so. Non-rated securities indicate that rating on a particular security has been suspended
temporarily and such suspension is in compliance with applicable regulations and/or ICICI Securities policies, in circumstances where ICICI Securities might be acting in an advisory capacity to this
company, or in certain other circumstances.
This report is based on information obtained from public sources and sources believed to be reliable, but no independent verification has been made nor is its accuracy or completeness guaranteed. This
report and information herein is solely for informational purpose and shall not be used or considered as an offer document or solicitation of offer to buy or sell or subscribe for securities or other financial
instruments. Though disseminated to all the customers simultaneously, not all customers may receive this report at the same time. ICICI Securities will not treat recipients as customers by virtue of their
receiving this report. Nothing in this report constitutes investment, legal, accounting and tax advice or a representation that any investment or strategy is suitable or appropriate to your specific
circumstances. The securities discussed and opinions expressed in this report may not be suitable for all investors, who must make their own investment decisions, based on their own investment
objectives, financial positions and needs of specific recipient. This may not be taken in substitution for the exercise of independent judgment by any recipient. The recipient should independently evaluate
the investment risks. The value and return on investment may vary because of changes in interest rates, foreign exchange rates or any other reason. ICICI Securities accepts no liabilities whatsoever for any
loss or damage of any kind arising out of the use of this report. Past performance is not necessarily a guide to future performance. Investors are advised to see Risk Disclosure Document to understand the
risks associated before investing in the securities markets. Actual results may differ materially from those set forth in projections. Forward-looking statements are not predictions and may be subject to
change without notice.
ICICI Securities or its associates might have managed or co-managed public offering of securities for the subject company or might have been mandated by the subject company for any other assignment
in the past twelve months.
ICICI Securities or its associates might have received any compensation from the companies mentioned in the report during the period preceding twelve months from the date of this report for services in
respect of managing or co-managing public offerings, corporate finance, investment banking or merchant banking, brokerage services or other advisory service in a merger or specific transaction.
ICICI Securities or its associates might have received any compensation for products or services other than investment banking or merchant banking or brokerage services from the companies mentioned
in the report in the past twelve months.
ICICI Securities encourages independence in research report preparation and strives to minimize conflict in preparation of research report. ICICI Securities or its associates or its analysts did not receive any
compensation or other benefits from the companies mentioned in the report or third party in connection with preparation of the research report. Accordingly, neither ICICI Securities nor Research Analysts
and their relatives have any material conflict of interest at the time of publication of this report.
It is confirmed that Deepak Purswani, CFA MBA (Finance), Deepti Tayal, MBA, Research Analysts of this report have not received any compensation from the companies mentioned in the report in the
preceding twelve months.
Compensation of our Research Analysts is not based on any specific merchant banking, investment banking or brokerage service transactions.
ICICI Securities or its subsidiaries collectively or Research Analysts or their relatives do not own 1% or more of the equity securities of the Company mentioned in the report as of the last day of the month
preceding the publication of the research report.
Since associates of ICICI Securities are engaged in various financial service businesses, they might have financial interests or beneficial ownership in various companies including the subject
company/companies mentioned in this report.
It is confirmed that Deepak Purswani, CFA MBA (Finance), Deepti Tayal, MBA, Research Analysts do not serve as an officer, director or employee of the companies mentioned in the report.
ICICI Securities may have issued other reports that are inconsistent with and reach different conclusion from the information presented in this report.
Neither the Research Analysts nor ICICI Securities have been engaged in market making activity for the companies mentioned in the report.
We submit that no material disciplinary action has been taken on ICICI Securities by any Regulatory Authority impacting Equity Research Analysis activities.
This report is not directed or intended for distribution to, or use by, any person or entity who is a citizen or resident of or located in any locality, state, country or other jurisdiction, where such distribution,
publication, availability or use would be contrary to law, regulation or which would subject ICICI Securities and affiliates to any registration or licensing requirement within such jurisdiction. The securities
described herein may or may not be eligible for sale in all jurisdictions or to certain category of investors. Persons in whose possession this document may come are required to inform themselves of and
to observe such restriction.


