Universidade do Minho
Escola de Engenharia
Agosto de 2008
Maria Salomé Gião Teixeira de CarvalhoMaria Salomé Gião Teixeira de Carvalho
Survival of drinking water pathogens after disinfectionSurvival of drinking water pathogens after disinfection
Mar
ia S
alom
é G
ião
Teix
eira
de
Car
valh
oS
urv
iva
l of
dri
nki
ng
wa
ter
pa
tho
ge
ns
aft
er
dis
infe
ctio
n

Universidade do Minho
Escola de Engenharia
Dissertation for PhD degree in Chemical and Biological Engineering
Trabalho efectuado sob a orientação daProfessora Maria João Vieira e doProfessor Charles William Keevil
Agosto de 2008
Maria Salomé Gião Teixeira de Carvalho
Survival of drinking water pathogens after disinfection

É AUTORIZADA A REPRODUÇÃO INTEGRAL DESTA TESEAPENAS PARA EFEITOS DE INVESTIGAÇÃO, MEDIANTE DECLARAÇÃOESCRITA DO INTERESSADO, QUE A TAL SE COMPROMETE.
Universidade do Minho, 12 de Agosto de 2008
Maria Salomé Gião Teixeira de Carvalho

“And if I have prophetic powers, and
understand all mysteries and all science
(…) but do not have love, I am nothing.”
I Corinthians 13:2

v
Acknowledgements
“The value of things is not in how long they last, but in the intensity with which they happen. That’s why there are unforgettable moments, unexplainable things and incomparable people”
(Fernando Pessoa) No other words could sum up my PhD time any better.
First I want to thank my supervisors Prof. Maria João Vieira and Prof. Bill Keevil for all their support, ideas and for always giving me courage and strength to go on.
A huge thank you to you, Sandra, for everything, for all your patience, for all you have taught me and for all your support. You helped me to grow not only as a researcher but also as a person. You also made me realize that I want to become a great scientist just as you are!
I know that this will sound like a “cliché” but there are people that no matter where you are they are always there for you! With you Nuno, this is literally true. I will never forget all those times that you ran to messenger to help me, all your support, specially when I was feeling down, all that I have learnt from you, all the fun in the conferences. We are really a great team!!
I also would like to thank both labs, at the Universidade do Minho (LMA) and at the University of Southampton (EHU) for kindly having welcomed me since the very beginning. In particular, I would like to thank Prof. Rosário, Joana, Pilar, Manuel, Lúcia, Nuno C., Ana Fagos, Nuno G. (LMA) and Lucy, Louise, Matt (EHU) for all their support, help and friendship.
But doing a PhD is much more than learning about a science. I remember the day when I first went to Southampton. I remember every minute, every feeling, every thought as if it was yesterday. I remember that day perfectly well, I felt that nothing would be like before, and it was the case. From the past I just kept the true friends, now I have made new friends who are amazing and whose friendships are worth a lot to me!!
Jorge, jamais esquecerei que se cheguei até aqui foi porque sempre me incentivaste a seguir em frente, mesmo quando achava que não conseguia dar mais um passo. Fica a promessa de que terás sempre um lugar muito especial no meu coração!
Minha querida Mariana, em amizades verdadeiras, fortes e puras como a nossa nada se agradece mas tudo se partilha numa sintonia estonteante. E assim sempre será entre nós, onde quer que estejamos!
Paulinha, são as amizades que se constroem ao longo dos anos as que ficam para sempre. Estivemos sempre ao lado uma da outra mesmo quando 1000 milhas nos separavam, mas o destino é generoso e permitiu que estivesse contigo e com o Carlos para partilhar a grande alegria que foi o nascimento da vossa “bonequinha”. Em poucas ocasiões transbordou o meu coração de felicidade como no momento em que conheci a Leonor!
Sanna, todos os meus amigos são especiais por serem muito próprios… A partilha de alegrias silenciosas que vêem no escuro de uma palavra calada acabam por construir amizades de aço!
E também há aqueles que desaparecem do planeta mas cuja alegria do reencontro é genuína! Olívia, eu sei que vais sentir saudades de ter uma chata a interromper-te constantemente o trabalho só “para jogar conversa fora”, mas eu conheço alguém que vai sentir ainda mais saudades!! Adoooooooro conversar contigo e posso garantir-te que ninguém mais me faria rir num certo Sábado…
Idalina, as tuas “boleias”, o teu companheirismo e a tua amizade foram também preciosíssimas no decorrer destes últimos anos.
E claro, não posso esquecer o grupo de Palma e extensões (Cáudia B., Cláudia C., Lu, Sofia e Sónia) que sempre fazem um esforço para que nos consigamos reunir de vez em quando!

vi
Southampton… Since the beginning I’ve been told that Soton has a curse: “everybody comes back”, however the only curse are the amazing people who live there that are addictive.
Clélia, my guardian angel! I can’t express my gratitude for all your support and kindness when I moved to the UK. Thank you for all your friendship and support, especially when I was feeling so lost.
Siavash, you were maybe the first friend that I made in Soton and my first “teacher” of English. Thank you my dear for all your patience, conversations and of course, for all the tea that you prepared for me! Believe it or not, you might be far from my eyes, but you will always be in my heart!!
Fabrizio... one of my best friends! Everything about our friendship is amazing, sweet, beautiful... Communicating with no words is not something that we do with everybody and I really feel special and fortunate to have a friend like you in my life!
Katie, my half “tuga”... Tu bem tentas por algum juízo nesta cabecinha, mas eu sou um caso perdido!! Tenho mesmo muitas saudades das nossas conversas, aeróbica e noites sociais, mas acima de tudo da doçura, equilíbrio e tranquilidade que emana de ti! Um obrigada muito especial para o teu Bruninho, também!!
Family is much more than a question of sharing blood and a few chromosomes!! Clive (daddy) and Derek (little brother) you became part of my family and it just breaks my heart to be apart from you. You always made me feel as your little princess, loved and cared for! Oh God!, how I miss our Sunday family lunches, our talks, table football, teasing you about cleaning and even the PS nights…
Gareth, you entered my life as a breeze of fresh air! I couldn’t have found a better s* d*, so sweet and sensitive! During my thesis’ breaks, speaking to you on the messenger was so refreshing. Thank you for being who you are!!
There are also friends that are special but I can’t explain why… I just love them and that’s that! This is the case of the Ceci (Cecio and Ale) with whom I have shared so many things… And the Bruschetta Brothers concerts? Absolutely fantastic! When are you playing in Wembley?
Michela, it was a pity that you didn’t stay longer but it was enough to build a friendship that doesn’t know distance or time!
My dear “cream of heaven” fans it was a pleasure to cook for you, and not only this dessert: Basil it was a great honor to have met you and just hope you are coming to Europe soon; James I will never forget you and the lovely piano afternoons; Patrick, it was really nice to have met you! Enjoy your time in Soton as I did, and have a good time in Australia!
Eva, I’m still waiting for your visit… Thank you for everything and lately for all the jobs hints!
It’s true that I worked as a slave during my entire PhD but I always had time for Friday and Saturday night fever… Marty, no one is a better dancing partner than you… well, only Tassos but definitely you two are my favorite! Arturo, Maria, Alinne, Denise, Barbara, Mario, Beppe, Pedro, Nicola, Davide, Ivonne, Christos, Nino, Mirko, Fillipo, and all of you that I have already mentioned, thank you for brightening my social nights!
Last but not least! Às minhas ovelhas brancas: pais (Joaquim e Isabel), irmãos (Nela, Paulo, Jorge e Fábia) e sobrinhos (Tiago, Misa, Ana, Sofia, Inês, Timóteo, Pedro e João) eu quero agradecer todo o apoio incondicional às minhas ideias malucas e extravagantes (pelo menos aos seus olhos). Um obrigada muito especial ao Paulo pela infinita paciência com o meu portátil (e respectiva dona), e ao Misa: meu querido, as capas dos capítulos ficaram absolutamente “fabulásticas”! Muito poucos têm um talento como o teu e tenho a certeza que te vai levar longe.
To all of you, who have stayed or just crossed my path during these last four years my deepest and sincere thank you!
This work was financially supported by the PhD grant SFRH/BD/17088/2004 from the Fundação para a Ciência e a Tecnologia (FCT).

vii
Abstract
Legionella pneumophila is a waterborne pathogen, ubiquitous in natural aquatic environments. It is
also commonly found in engineered waters when disinfection fails and is responsible for outbreaks
and sporadic cases of Legionnaires’ disease worldwide. Conversely, the route of transmission of the
gastric pathogen, Helicobacter pylori, is still unknown, but water has been recently considered a
strong candidate for vehicle of transmission. A better knowledge on the survival strategies of these
two pathogens to disinfection is therefore fundamental to achieve an efficient microbiological control of
drinking water distribution systems (DWDS). These studies should however take into account that pipe
surfaces of DWDS are colonized by heterotrophic populations of microorganisms that form structures
denominated as biofilms, and that these biofilms might provide a protective haven for the survival of
the pathogens studied here.
As such, the aim of this work was to study the effect of chorine on L. pneumophila and H. pylori cells,
both in suspension and when associated with heterotrophic biofilms. The role of several physico-
chemical parameters and of specific waterborne bacteria on the inclusion of these two pathogens into
DWDS biofilms was also studied.
In the study of the influence of chlorine on L. pneumophila (Chapter 2), pure cells of L. pneumophila
NCTC 12821 were suspended in tap water and different concentrations of chlorine were added to
obtain final chlorine concentrations of 0.0, 0.2, 0.7 and 1.2 mg l-1. Cells were then quantified by
standard culture methods onto BCYE agar plates and by using a SYTO 9/Propidium Iodide-based
viability kit. The cells exposed to 1.2 mg l-1 were also co-cultured with Acanthamoeba polyphaga. The
results obtained showed that after exposure to low concentrations of chlorine, L. pneumophila can
maintain viability even after a complete loss of cultivability, becoming viable but non-cultivable
(VBNC). This condition was confirmed by the ability of L. pneumophila to recover cultivability after
passage into amoebal cells.
In Chapter 3, the influence of several physico-chemical parameters on the inclusion of autochthonous
L. pneumophila into heterotrophic drinking water biofilms was studied. The experiments were
conducted in a two-stage chemostat system, with the second stage consisting of three vessels
working in parallel at 20ºC. In a second experiment the temperature of the second-stage was
decreased to 15ºC. The biofilm was formed on uPVC coupons and total cells, total and cultivable L.
pneumophila and cultivable heterotrophic microrganisms were quantified. Cultivable L. pneumophila
was never recovered from biofilms or the planktonic phase but results obtained using a peptide nucleic
acid (PNA) probe showed that this pathogen will easily embed into potable water biofilms independent
of the conditions tested. Temperature seems to be the parameter that most influences L. pneumophila
numbers within DWDS biofilms, with a higher incidence being obtained at 15ºC.

viii
To study the influence of low concentrations of chlorine on L. pneumophila associated to drinking
water biofilms, chlorine was continuously fed to the second-stage chemostat to a final concentration of
0.2 and 1.2 mg l-1 (Chapter 4). The two concentrations of chlorine seem to have a little effect on the
numbers of L. pneumophila cells, indicating that biofilms protect this pathogen from the oxidative
stress of chlorine at concentrations higher than those commonly found in DWDS.
In Chapter 5 results obtained for H. pylori NCTC 11637 using a similar culture system and conditions
described for Chapter 3 are presented. The inclusion of H. pylori in drinking water biofilms was not
influenced by any of the conditions tested (temperature, shear stress or carbon addition). It was also
observed that the shape of H. pylori cells is temperature dependent, being predominantly spiral at
20ºC and coccoid at 15ºC. The observation of H. pylori in biofilms after 31 days of inoculation
demonstrates that biofilms are an important ecosystem in the protection of H. pylori under stress
conditions.
The influence of chlorine on H. pylori cells both in suspension and associated to heterotrophic biofilms
was studied (Chapter 6). The results showed that when in pure culture and suspension, H. pylori can
completely lose cultivability without a significant loss of rRNA, possibly becoming VBNC. When
associated to heterotrophic biofilms chlorine has also little effect on H. pylori.
In Chapter 7, the results obtained for the influence of several waterborne heterotrophic bacteria on the
survival of L. pneumophila and H. pylori in dual-species biofilms are presented. The bacterium
Mycobacterium chelonae appears to have a crucial role in the increase of cultivability of both
pathogens, indicating that a wider screening of microorganisms commonly present in water might
identify species that support the survival of these two pathogens in DWDS.
In the end of this work it is possible to conclude that disinfection by chlorine must be handled carefully
as VBNC L. pneumophila and H. pylori might remain in suspension and associate with biofilms
afterwards. In biofilms, cells are not only protected from residual chlorine but also in such a
physiological condition that allows them to divide (L. pneumophila) or concentrate (H. pylori) within
these structures. As a result, the release of biofilm to water due, for instance, to changing
hydrodynamic conditions, might at times release an infectious dose of either pathogen, which should
certainly be a subject of public health concern. Better ways to control water quality and the sloughing
of biofilms are therefore needed.

ix
Sumário A Legionella pneumophila é uma bactéria patogénica que pode ser frequentemente isolada em meios
aquáticos naturais. Logo, pode também ser encontrada em águas potável, como resultado de uma
desinfecção deficiente, o que a torna responsável quer por casos esporádicos, quer por surtos de
doença do Legionário em todo o mundo. Pelo contrário, a via de transmissão do patogénico gástrico
Helicobacter pylori continua por desvendar, sendo no entanto a água um forte candidato. Por esta
razão, é fundamental compreender que estratégias permitem a estes dois patogénicos sobreviverem
ao processo de desinfecção dos sistemas de distribuição de água potável (SDAP), permitindo, assim,
adoptar medidas que visem o controlo eficaz da qualidade desta água. Salienta-se, no entanto, que
estes estudos apenas estão completos quando também se considera o importante papel dos
biofilmes que se formam nas tubagens dos SDAP e que representam um refúgio para estes
microrganismos.
O objectivo deste trabalho foi estudar o efeito do cloro livre em células em suspensão de culturas
puras de L. pneumophila e H. pylori, bem como o efeito deste desinfectante nestes dois patogénicos
quando associados a biofilmes heterotróficos. Foi ainda estudada a influência de diversos parâmetros
físico-químicos e de determinadas bactérias isoladas de água potável na inclusão da L. pneumophila
e da H. pylori em biofilmes.
No estudo da influência do cloro em células de L. pneumophila, (Capítulo 2) foram preparadas
suspensões puras de L. pneumophila NCTC 12821 em água da torneira previamente filtrada e
adicionadas diferentes concentrações de cloro (0.0, 0.2, 0.7 and 1.2 mg l-1). A concentração de
células foi avaliada por diferentes métodos que incluíram cultivo em placas de agar de BCYE e o uso
de kit de viabilidade bacteriana SYTO 9/Iodeto de Propídio (PI). As células tratadas com 1.2 mg l-1
foram ainda co-cultivadas com Acanthamoeba polyphaga. Os resultados obtidos demonstraram que a
exposição desta bactéria a baixas concentrações de cloro resultaram na perda de cultivabilidade sem
no entanto ocorrer perda total de viabilidade, pelo que se pode concluir que estas células após
contacto com este desinfectante entram no estado de viáveis mas não cultiváveis (VBNC)
conseguindo recuperar a sua cultivabilidade após infectarem células de ameba.
No Capítulo 3 foi estudada a influência de diversos parâmetros físico-químicos na inclusão de L.
pneumophila autóctone em biofilmes de água potável. Para tal, utilizou-se um sistema de
quimiostatos, cuja segunda parte era constituída por 3 fermentadores que trabalhavam em paralelo e
a 20ºC. Numa segunda experiência diminuiu-se a temperatura de operação para 15ºC. A formação de
biofilme foi promovida na superfície de cupões de uPVC e posteriormente removido para a
quantificação de células totais, do número de células de L. pneumophila cultivável e total e bactérias
heterotróficas cultiváveis. A recuperação de células de L. pneumophila cultiváveis nunca foi possível,
quer da fase em suspensão quer dos biofilmes, no entanto o uso de sonda de PNA demonstrou que
este patogénico pode facilmente ser incorporado em biofilmes heterotróficos independentemente das

x
condições ambientais. Por outro lado, constatou-se uma maior incidência de L. pneumophila em
biofilmes formados a 15ºC o que demonstra uma maior sensibilidade a variações térmicas.
Foi ainda estudada a influência de concentrações baixas de cloro em células de L. pneumophila
associadas a biofilmes, tendo-se para tal alimentado continuamente dois dos reactores do segundo
estado com cloro obtendo-se uma concentração final dentro de reactor de 0.2 e 1.2 mg l-1 (Capítulo
4). Ambas as concentrações de cloro parecem ter um efeito insignificante na concentração de L.
pneumophila associada a biofilmes indicando que este tipo de ambiente funciona como um refúgio
para este patogénico ao efeito oxidativo do cloro.
No Capítulo 5 utilizou-se o mesmo sistema descrito no Capítulo 3 tendo no entanto os fermentadores
sido inoculados com H. pylori NCTC 11637. Verificou-se que nenhuma das condições estudadas
(temperatura, tensão de corte ou aumento da concentração de carbono) influenciou significativamente
a concentração de H. pylori dentro dos biofilmes. Contudo foi constatado que a forma fisiológica desta
bactéria era predominantemente espiral a 20ºC enquanto que a 15ºC a maioria das células se
apresentava sob a forma cocóide. Por outro lado, a recuperação do biofilme de H. pylori demonstra
que estas estruturas representam um ecossistema importante que protege este patogénico de
condições de stress.
Foi também estudada a influência do cloro em células de H. pylori em suspensão e quando
associadas a biofilmes heterotróficos (Capítulo 6). Os resultados demonstraram que este patogénico
é capaz de perder completamente a cultivabilidade retendo contudo a viabilidade, tornando-se VBNC.
Verificou-se ainda que este desinfectante tem um efeito desprezável em H. pylori associado a
biofilmes heterotróficos.
No Capítulo 7 são apresentados os resultados obtidos no estudo da influência de diversas bactérias
isoladas de água potável na sobrevivência de L. pneumophila e H. pylori em biofilmes de duas
espécies. Não foram obtidos todos os resultados pretendidos no entanto verificou-se que a bactéria
Mycobacterium chelonae parece desempenhar um papel fundamental no aumento da cultivabilidade
de ambos os patogénicos.
No final deste trabalho é possível concluir que a desinfecção através do uso de cloro deve ser
cuidadosamente estudada, uma vez que L. pneumophila e H. pylori no estado de VBNC podem
permanecer em suspensão e associarem-se posteriormente a biofilmes. Dentro destas estruturas, as
células não estão apenas protegidas do cloro residual como também são capazes de se multiplicar
(L. pneumophila) ou concentrar (H. pylori). Como resultado, o desprendimento destas células para o
fluído, devido por exemplo, à mudança das condições hidrodinâmicas, pode originar o aparecimento
de doses capazes de causar infecções o que será, definitavamente, um problema de saúde púbica.
Deste modo, é real a necessidade de um melhor controlo da qualidade da água e do desprendimento
de biofilmes das paredes das tubagens de SDAP.

xi
Contents
Chapter 1 Background and Aims 1
1.1 Is drinking water safe?
1.1.1 Brief history
1.1.2 Water: from nature to tap
1.1.2.1 Coagulation
1.1.2.2 Floculation
1.1.2.3 Sedimentation
1.1.2.4 Filtration
1.1.2.5 Disinfection
1.1.3 Chlorination of drinking water
1.1.4 Waterborne pathogens
1.2 Biofilms
1.2.1 Formation of biofilms
1.2.2 Types of biofilms and their impact on public health
1.2.3 Factors affecting biofilm formation
1.2.4 Drinking water biofilms
1.2.4.1 After disinfection why are biofilms a concern in DWDS?
1.2.4.2 Which problems can drinking water biofilms cause?
1.2.4.3 Pipe material: a dual problem
1.2.4.4 Drinking water biofilms control
1.3 Assessment of sessile and planktonic microorganisms
1.3.1 Culture methods
1.3.2 Microscopy methods
1.3.3 Colorimetric methods
1.3.4 Flow cytometry
1.3.5 Immunological methods
1.3.6 Molecular methods
1.4 Legionella pneumophila
1.4.1 Since the first outbreak
1.4.2 Characteristics
1.4.3 Environmental ecology and route of transmission
1.4.4 Diseases, diagnosis and treatment
1.4.5 Outbreaks worldwide
1.5 Helicobacter pylori
1.5.1 Marshall & Warren towards the Nobel Prize
1.5.2 Characteristics
1.5.3 Is H. pylori a waterborne pathogen?
3
3
4
5
5
6
6
6
7
9
12
12
13
15
16
16
16
17
17
18
18
19
21
21
21
21
23
23
23
24
25
26
28
28
28
29

xii
1.5.4 Diseases, diagnosis and treatment
1.5.5 Predominance worldwide
1.6 Scope and purpose
1.7 References
31
31
33
34
Chapter 2 Validation of SYTO 9/Propidium Iodide uptake for rapid detection of viable but non-cultivable Legionella pneumophila 59
2.1 Introduction
2.2 Material and Methods
2.2.1 Strains
2.2.2 Chlorine preparation and measurements
2.2.3 Chlorine disinfection tests
2.2.4 Assessment of cultivable cells
2.2.5 Assessment of membrane integrity
2.2.6 Co-culture of L. pneumophila and Acanthamoeba polyphaga
2.2.7 Assessment of RNA injury
2.2.8 DNA electrophoresis
6.3.1 Statistical analysis
2.3 Results
2.4 Discussion
2.5 Acknowledgments
2.6 References
61
62
62
62
62
62
63
63
63
64
65
65
68
71
72
Chapter 3 Comparison between standard culture and fluorescence in situ hybridization methods to study the influence of physico-chemical parameters on Legionella pneumophila survival in drinking water biofilms 75
3.1 Introduction
3.2 Material and Methods
3.2.1 Biofilm experiments
3.2.2 Treatment of coupons
3.2.3 Quantification of planktonic cells
3.2.4 Quantification of sessile cells
3.2.5 Confirmative tests
3.2.6 Statistical analysis
3.3 Results
3.3.1 Microbial dynamics in the seed vessel
3.3.2 Planktonic cells in the biofilm-growing chemostats
77
78
78
79
79
80
80
80
81
81
81

xiii
3.3.3 L. pneumophila in heterotrophic biofilms
3.3.4 Confirmative tests and bacterial identification
3.4 Discussion
3.5 Acknowledgments
3.6 References
82
85
86
88
89
Chapter 4 Incorporation of natural uncultivable Legionella pneumophila into potable water biofilms provides a protective niche against chlorination stress 91
4.1 Introduction
4.2 Material and Methods
4.2.1 Biofilm experiments
4.2.2 Treatment of coupons
4.2.3 Quantification of planktonic cells
4.2.4 Quantification of sessile cells
4.2.5 Chlorine measurements and inactivation
4.2.6 Statistical analysis
4.3 Results and Discussion
4.3.1 Population in the planktonic phase
4.3.2 L. pneumophila in heterotrophic biofilms
4.3.3 Impact of chlorine on biofilm physiology
4.3.4 Impact of this study on public heath
4.4 Acknowledgements
4.5 References
93
94
94
94
94
95
95
95
96
96
97
99
99
101
102
Chapter 5 Persistence of Helicobacter pylori in heterotrophic drinking water biofilms 105
5.1 Introduction
5.2 Material and Methods
5.2.1 Biofilm experiments
5.2.2 Cultivation of H. pylori
5.2.3 Preparation of coupons
5.2.4 Quantification of planktonic cells
5.2.5 Quantification of sessile cells
5.2.6 Identification of sessile cells
5.2.7 Statistical analysis
5.3 Results and Discussion
5.3.1 Seed vessel
5.3.2 Planktonic cells in the biofilm-growing vessels
107
108
108
108
109
109
109
110
110
111
111
111

xiv
5.3.3 Cell population in the biofilm-growing vessels
5.3.4 H. pylori total counts in biofilms
5.3.5 H. pylori morphology and location within biofilms
112
113
115
5.3.6 Cultivability of H. pylori in water and water-associated biofilms and implications for transmission 116
5.4 Conclusions
5.5 Acknowledgements
5.6 References
117
118
119
Chapter 6 Resistance of Helicobacter pylori to chlorine in drinking water biofilms 123
6.1 Introduction
6.2 Material and Methods
6.2.1 Culture maintenance
6.2.2 Chlorine preparation and measurements
6.2.3 Experiments in heterotrophic biofilms
6.2.3.1 Biofilm formation
6.2.3.2 Coupon preparation
6.2.3.3 Quantification of planktonic cells
6.2.3.4 Quantification of sessile cells
6.2.3.5 Chlorine measurements and inactivation
6.2.4 Experiments with H. pylori in pure culture
6.2.4.1 Chlorine disinfection tests
6.2.4.2 Assessment of cultivable cells
6.2.4.3 Assessment of membrane integrity
6.2.4.4 DNA electrophoresis
6.2.5 Statistical analysis
6.3 Results
6.3.2 Planktonic cells in the two-stage chemostat
6.3.3 Population of biofilms
6.3.4 Effect of chlorine on pure H. pylori suspensions
6.4 Discussion
6.4.1 Planktonic cells in the two-stage chemostat
6.4.2 Sessile cells in the second stage of the chemostat system
6.4.3 Inclusion of H. pylori in heterotrophic biofilms
6.4.4 Effect of chlorine on pure H. pylori suspensions
6.5 Acknowledgements
6.6 References
125
126
126
126
126
126
127
127
128
128
128
128
129
129
129
130
131
131
132
133
136
136
136
137
137
139
140

xv
Chapter 7 Interaction of Legionella pneumophila and Helicobacter pylori with bacterial species isolated from drinking water biofilms 143
7.1 Introduction
7.2 Material and Methods
7.2.1 Culture maintenance
7.2.2 Co-aggregation in test tubes
7.2.3 Biofilm formation
7.2.4 Preparation of coupons
7.2.5 Quantification of sessile cells
7.2.6 Statistical analysis
7.3 Results and Discussion
7.4 Acknowledgements
7.5 References
145
147
147
147
147
147
148
148
149
155
156
Chapter 8 Final Conclusions and Perspectives of Work 161
8.1 Final Conclusions
8.2 Future Work
163
165
Appendix I Scientific Outputs 167
I.1 Accepted and Submitted papers in peer reviewed international journals
I.2 Oral presentations in international conferences and meetings
I.3 Poster presentations in international conferences
169
170
171
xvi
List of Figures
Chapter 1
Figura 1.1 Water stress worldwide [296] (a) and differences in the assessment of drinking water in a developed [194] (b) and in a third world country [62] (c). 3
Figura 1.2 Chronology of drinking water chlorination [250, 283] (a). Drinking water chlorination: reaction of chlorine with organic compounds present in water and formation of free chlorine [181] (b). Chlorine reactions in water: formation of chlorine species dependant on water pH and respective chemical reactions [9] (c). 8
Figura 1.3 Picture of the Broad Street water pump, in Soho, London, UK (a) and coloured transmission electron micrograph (TEM) bacteria responsible for cholera: V. cholerae [253] (b). 9
Figura 1.4 Stages of biofilm formation showing structure and architecture: 1: Initial attachment; 2: Production of EPS; 3 & 4: Maturation; 5: Dispersion of single cells [270] (a). Microphotograph of a Pseudomonas fluorescens biofilm where the EPS is stained with Live/Dead® BacLightTM kit [96] (b). 12
Figura 1.5 Photographs of different types of biofilms: dental plaque [271] (a), heat exchanger [125] (b), on gut tissues [249] (c) wastewater treatment [15] (d). 14
Figura 1.6 Photograph of a cast iron pipe where corrosion has occurred (a) and of a high density polyethylene pipe with biofilm (b) (photographs kindly yielded by Sofia Bragança). 17
Figura 1.7 Diagram of the cellular targets of some fluorescent dyes [134]. 20
Figura 1.8 Structure of the DNA and PNA molecule (a) and microphotograph of a multiplex assay specific PNA probe for each strain (b) [215]. 22
Figura 1.9 Diagram of the L. pneumophila cycle of life inside protozoa: 1. Environmental L. pneumophila in biofilms or infecting protozoa; 2 & 3. L. pneumophila inside of amoeba; 4. Infectous particles; 5. Transmission to humans; 6: L. pneumophila that have escaped their protozoan host [177] (a). Coloured TEM of a lung macrophage containing L. pneumophila cells (white dots inside of purple) (b) and coloured TEM of L. pneumophila (c) [253]. 24
Figura 1.10 Coulored TEM of H. pylori in the three different physiological possible forms: spiral (a); U-shape (b) and coccoid (c). Coulored scanning electon micrograph (SEM) of H. pylori (pink) in the stomach lining (d)[253]. 29
Figura 1.11 Worldwide prevalence of H. pylori [19]. 32
Chapter 2
Figura 2.1 Variation in the total cell number, viability of SYTO 9-/PI+ stained cells and cultivability on BCYE agar, after exposure to free chlorine concentrations of 0.0 (a), 0.2 (b), 0.7 (c) and 1.2 (d) mg l-1. Error bars represent standard deviation of at least three experiments. 66
Figura 2.2 Number of cultivable L. pneumophila after 24, 48 and 72 hours of co-culture with A. polyphaga. 0 hours represents the number of cultivable L. pneumophila after 30 minutes of exposure to 1.2 mg l-1 of free chlorine. 67

xvii
Chapter 3
Figura 3.1 Photograph of the two stage chemostats installation (a) and a vessel with the coupons (b). 79
Figura 3.2 Variation in the total cell number, total numbers of L. pneumophila and HPC in biofilms formed at 20ºC (a) and 15ºC (b) in the control ( ), high shear stress ( ) and high concentration of carbon ( ). 83
Figura 3.3 Microphotograph of hybridization with the L. pneumophila specific PNA probe: uPVC coupon visualized under the TRITC channel (a) and scraped cells homogenized and filtered onto a membrane visualized under the EDIC channel (c). Bars represent 20 μm. Average of the percentage of total L. pneumophila and total flora (PNA/SYTO 9), for all the conditions tested at both temperatures (d). 84
Chapter 4
Figura 4.1 Variation in the total cell number (a), total numbers of L. pneumophila (b) and HPC (c) in biofilms formed when no chlorine is added ( ), when chlorine is continuously added to a final concentration of 0.2 mg l-1 ( ) and 1.2 mg l-1 ( ). Average of the relation between the numbers total L. pneumophila and total cells for all the conditions tested (d). 97
Figura 4.2 Microphotograph of a uPVC coupon visualized under the EDIC channel. The coupon was covered with a 32 days-old biofilm formed in the absence of chlorine (a); in the presence of 1.2 mg ml-1 of free chlorine (b). Bars represent 20 μm. 98
Chapter 5
Figura 5.1 Variation in the total cell number, HPC and total numbers of H. pylori in biofilms formed at 20ºC (a) and 15ºC (b) under the following conditions: low shear stress and low concentration of carbon ( ), high shear stress and low concentration of carbon ( ) and low shear stress and high concentration of carbon ( ). Error bars represent standard deviation. 113
Figura 5.2 Microphotograph of hybridization with the H. pylori specific PNA probe in a biofilm grown at 20ºC (a) and at 15ºC (b) using the epifluorescence TRITC filter. Large arrows indicate the autofluorescent matrix of the biofilm whereas thin arrows represent coccoid H. pylori embedded in these structures. In (c) the cells were observed using the epifluorescence DAPI filter serving as a control for the autofluorescence of the biofilm stacks and individual cells attached to the substratum. Micrograph of a coupon with a 26 days-old biofilm formed under LS/LC at 15ºC and observed using EDIC microscopy (d). Bars represent 20 μm. 115
Chapter 6
Figura 6.1. Variation in the total cell number (a), total numbers of H. pylori (b) and HPC (c) in biofilms formed when no chlorine is added ( ), when chlorine is continuously added to a final concentration of 0.2 ( ) and 1.2 ( ) mg l-1. Epifluorescence microphotograph of a biofilm hybridized with the H. pylori specific PNA probe, using the TRITC filter. Bar represents 20 μm (d). 132
Figura 6.2. Variation in the number of total, viable and cultivable cells, after exposure to 0.0 (a), 0.2 (b), 0.7 (c) and 1.2 (d) mg l-1. Error bars represent standard deviation of at least three experiments. 134
Figura 6.3. Epifluorescence microphotograph showing H. pylori cells treated with 1.2 mg l-1 of free chlorine and stained with LIVE/DEAD® BacLightTM bacterial viability kit, at time 0 (a) and 30 minutes (b); Bars represent 20 μm and arrows indicate PI positive cells. Variation in the numbers of non viable cells after exposure to 0.0 ( ), 0.2 ( ), 0.7 ( ) and 1.2 (x) mg l-1 of free chlorine. Error bars represent standard deviation of at least three experiments(c). Chromosomal DNA bands isolated from H. pylori cells after exposure to 0.0 (1); 0.2 (2); 0.7 (3) and 1.2 (4) mg l-1 of free chlorine (d). 135

xviii
Chapter 7
Figura 7.1 Epifluorescence microphotograph of L. pneumophila cells from the inoculum stained with SYTO 9 (a) and labeled by the PNA PLPEN620 probe (b). Bars represent 20 μm. (c) Variation with time in the total cell number ( ), L. pneumophila bound to the PNA PLPEN620 probe ( ) and cultivable L. pneumophila ( ) present in the L. pneumophila pure biofilm. (d) Average of the relation between the numbers L. pneumophila PNA cells and total cells (turquoise bars) and relation between cultivable L. pneumophila and L. pneumophila PNA cells (bright blue bars) for the pure and dual species biofilm. 149
Figura 7.2 Microphotograph of a uPVC coupon visualized under EDIC microscopy covered with a 32 days-old biofilm formed by L. pneumophila (a) and L. pneumophila and Sphingomonas sp. (b). Bars represent 20 μm. 152
Figura 7.3 Microphotograph of a uPVC coupon visualized under EDIC microscopy covered with a 1 day-old biofilm formed by H. pylori in pure culture in two different visual planes bottom (a) and top (b) and 32 days-old biofilm (c). Bars represent 20 μm. (d) Variation with time in the total cell number ( ) and H. pylori PNA-cells ( ) present in the biofilm. 153

xix
List of Tables Chapter 1
Table 1.1 References Early civilizations and water basin associated. 4
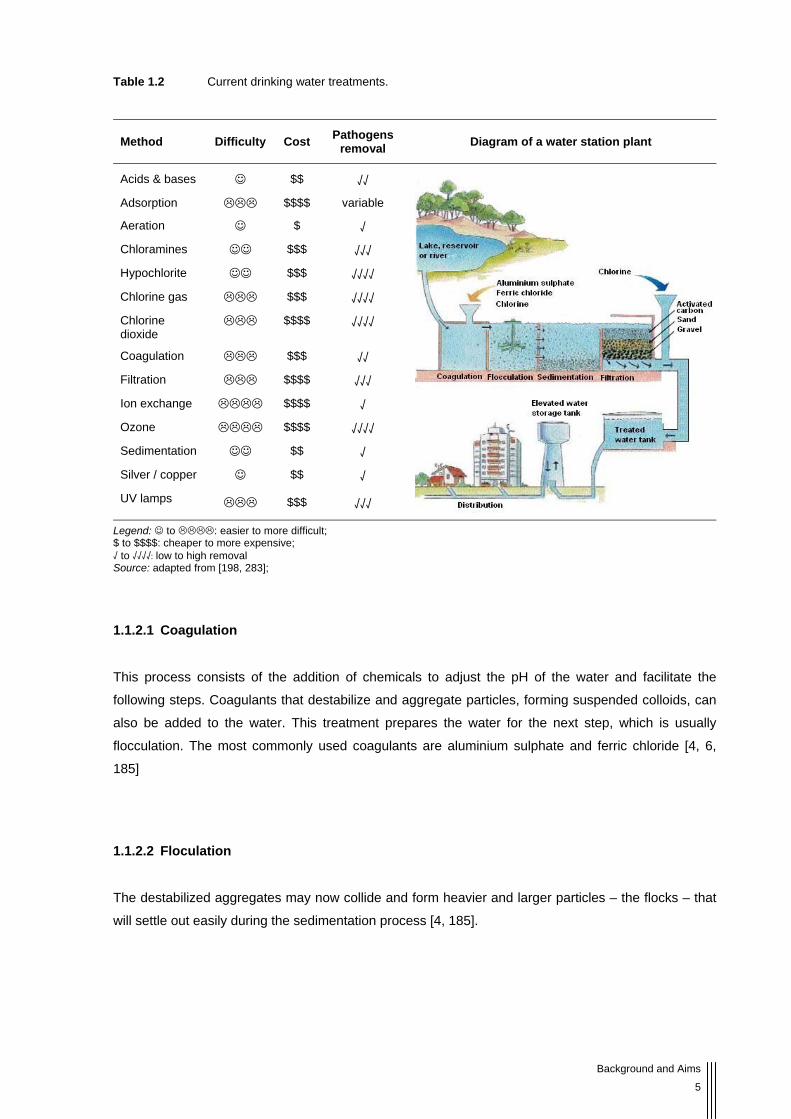
Table 1.2 Current drinking water treatments. 5
Table 1.3 Principal disinfectants used in DWDS and associated characteristics. 7
Table 1.4 Some examples of waterborne pathogens, associated disease and survival time in water. 10
Table 1.5 Media used in drinking water analysis to recover specific microorganisms. 19
Table 1.6 Examples of outbreaks worldwide in the last 3 years. 26
Table 1.7 Number of cases of Legionnaires’ disease in some European countries in the last 10 years. 27
Table 1.8 Possible routes of transmission of H. pylori to humans. 30
Chapter 2
Table 2.1 Chlorine concentration demand immediately after, and 30 minutes after, the chlorine addition to the sterile-filtered tap water and to the L. pneumophila suspension. 65
Chapter 3
Table 3.1 Average numbers of total cells and HPC in the planktonic phase at 20ºC and 15ºC for all three conditions tested. 81
Table 3.2 Results of 16S DNA sequencing and PNA test for the colonies isolated on BCYE and R2A and confirmative tests performed on colonies isolated on BCYE and on L. pneumophila NCTC12821. 85
Chapter 4
Table 4.1 Numbers of planktonic total cells, HPC Numbers of planktonic total cells, HPC and relation between HPC and total cells in the seed, control and in the chlorinated biofilm-growing vessels. 96
Chapter 5
Table 5.1 Average numbers of total cell and HPC in the planktonic phase and relation between HPC and total cell, at 20ºC and 15ºC for all three conditions tested. 111
Chapter 6
Table 6.1 Average numbers of total cell and HPC in the planktonic phase for all three conditions tested. 131
Table 6.2 Chlorine concentration demand immediately after and 30 minutes after the chlorine addition to the H. pylori suspension. 133
Chapter 7
Table 7.1 Average of the total number of cells (quantified by the use of SYTO9), L. pneumophila (quantified by the PNA-FISH method) and cultivable L. pneumophila cells on biofilms formed by L. pneumophila in pure culture and L. pneumophila in a dual-species culture with each one of the species isolated from drinking water biofilms. 151


xxi
List of symbols and abbreviations ASHRAE American Society of Heating, Refrigerating and Air Conditioning Engineers
BCYE Buffered charcoal yeast extract
C Carbon
CBA Columbia blood agar
CCAP Culture collection of algae and protozoa
CDC Centres for Disease Control and Prevention
CFU Colony forming units
Cl2 Chlorine
CO2 Carbon Dioxide
CTC 5-cyano-2,3-ditolyl tetrazolium chloride
cys L-cysteine
DBP Disinfectant by-product
DLVO Derjaguin-Landau-Verwey-Overbeek
DMSO Dimethyl sulfoxide
DNA Deoxyribonucleic acid
DPD N,N-dimethyl-p-phenilenediamine
DWDS Drinking water distribution system
EDIC/EF Episcopic differential interference contrast/epifluorescence
EPS Extracellular polymeric substances
EWGLI European Working Group for Legionella Infections
FISH Fluorescence in situ hybridization
G + C Guanine + Cytosine
GI Gastrointestinal
GVPC Glycine, vancomycin, polymixin and cycloheximide
H2 Hydrogen
HOCl Hypochlorous acid
HP Helicobacter pylori selective agar
HPC Heterotrophic plate count
HSC Health and Safety Commission
HS/LC High shear/low carbon
HSE Health and Safety Executive
INT 2-(p-iodophenyl)-3-(p-nitrophenyl)-5-phenyltetrazolium chloride
LS/HC Low shear/low carbon
LS/LC Low shear/high carbon
MALT Mucosa associated lymphoid tissue
MDPE Medium density polyethylene
MTT 3-[4,5-dimethylthiazol-2-yl]-2,5-diphenyltetrazolium bromide

xxii
N / N2 Nitrogen (element / molecular)
NCTC National Collection of Type Cultures
NHMRC National Health and Medical Research Council
O2 Oxygen
OCl- Hypochlorite ion
P Phosphate
PAH Polycyclic aromatic hydrocarbons
PCR Polymerase Chain Reaction
PI Propidium Iodide
PNA peptide nucleic acid
PPG Proteose peptone glucose
RNA Ribonucleic acid
mRNA Messenger ribonucleic acid
rRNA Ribosomal ribonucleic acid
SEM Scanning electon micrograph
TEM Transmission electron micrograph
TTC 2,3,5-triphenyltetrazolium chloride
UK United Kingdom
uPVC Unplasticized polyvinylchloride
US United States
UV Ultraviolet
VBNC Viable but non cultivable
v/v Volume/volume
WHO World Health Organization
WTS Water Treatment Station
w/v Weight/volume
XTT sodium 3’-[1-[(phenylamino)-carbonyl]-3,4-tetrazolium]-bis (4-methoxy-6-nitro)benzenesulfonic acid hydrate


Background and Aims
3
1.1 Is drinking water safe?
“The human right to drinking water is fundamental for life and health. Sufficient and safe drinking water
is a precondition for the realization of all human rights.”
United Nations, 2002 [60]
In 2002, 1.1 billion of people did not have access to safe drinking water supplies, mainly in African and
Asian countries, and 3900 children died every day from diseases caused by waterborne pathogens.
This happens due to inefficient sanitation, and therefore these diseases rarely occur in developed
countries [133, 296]. However, water that can be used as drinking water is not as safe as it could be
(as will be show in section 1.1.2) and is not homogeneously distributed worldwide. Besides, population
growth, the increase in industrialization, and general pollution and glaciers melting are contributing to
the decrease of freshwater sources and leading to a potential water crisis (Figure 1.1) [279, 296].
Figura 1.1 Water stress worldwide [296] (a) and differences in the assessment of drinking water in a
developed [194] (b) and in a third world country [62] (c).
1.1.1 Brief history
Water is older than the Earth itself. Hydrogen (the oldest and most abundant element in the Universe)
combined with Oxygen (formed in the womb of the stars) to form water (H2O) even before the
formation of the earth [17]. In fact, the first two letters of “earth” is the name “Ea” that means “house of
water”. Ea-Enki was the name of a prehistoric Sumerian god as well, presented as coming from the
sea and connected to the creation [164]. Since the appearance of humanity men have always been
conscious about the importance of water in their lives and the first known settlements were close to
abundant water sources (Table 1.1) [17, 216].

Survival of drinking water pathogens after disinfection
4
Table 1.1 Early civilizations and water basin associated.
Civilization Date of first settlement Water basin location
Sumerians 6000 B.C. Tigris-Euphrates valley (Mesopotamia)
Egyptians 5000 B.C. Nile valley
Ancient Chinese 4500 B.C. Hwang Ho valley
Indus Valley 3000 B.C. Indus Valley
Source: [104, 139, 263, 273]
Water is probably the most precious commodity in life, not only in biological aspects but also from a
social, economic, health, technical, financial and political point of view [262]. Across History it is
possible to find a relation with water in several fields: religious rites, science, art, music, mythology,
transportation, power, heating, architecture, etc. [17].
1.1.2 Water: from nature to tap
Water is fundamental in all biological processes independent of the complexity of the organism. Even
the most primitive microorganism needs a minimal amount of water to perform its basic metabolic
functions. Human beings can survive for almost 50 days without eating but no more than a few days
without drinking [189, 245]. Around 70% of the earth surface is water (in a total of 1.4 x 10⁹ km3) but
only 2.5% is freshwater. However, most of this water is trapped in glaciers and permafrost meaning
that only 0.01% of the total water is available for consumption [188, 268].
The origin of drinking water can be superficial (including streams, rivers, lakes and dams) or
groundwater (such as wells, springs and holes). Prior to A.D.1600, the consumption of water was
based on visual clarity. If necessary, treatments such as exposure to sunlight, dipping of heated
copper or other metals, boiling or filtration through a cloth were performed. In 1600 the treatments
applied to water started to improve: water was therefore treated by the addition of germicidal metals
(such as silver or copper), sand filtration, distillation, coagulation and adsorption with different
materials. But it was only in the late 1800’s that the first disinfectant was used [22, 283]. Table 1.2
summarizes the principal processes in modern water treatment stations (WTS).
Background and Aims
5
Table 1.2 Current drinking water treatments.
Method Difficulty Cost Pathogens removal Diagram of a water station plant
Acids & bases ☺ $$ √√ Adsorption $$$$ variable
Aeration ☺ $ √
Chloramines ☺☺ $$$ √√√
Hypochlorite ☺☺ $$$ √√√√
Chlorine gas $$$ √√√√
Chlorine dioxide
$$$$ √√√√
Coagulation $$$ √√
Filtration $$$$ √√√
Ion exchange $$$$ √
Ozone $$$$ √√√√
Sedimentation ☺☺ $$ √
Silver / copper ☺ $$ √
UV lamps $$$ √√√
Legend: ☺ to : easier to more difficult; $ to $$$$: cheaper to more expensive; √ to √√√√: low to high removal Source: adapted from [198, 283];
1.1.2.1 Coagulation
This process consists of the addition of chemicals to adjust the pH of the water and facilitate the
following steps. Coagulants that destabilize and aggregate particles, forming suspended colloids, can
also be added to the water. This treatment prepares the water for the next step, which is usually
flocculation. The most commonly used coagulants are aluminium sulphate and ferric chloride [4, 6,
185]
1.1.2.2 Floculation
The destabilized aggregates may now collide and form heavier and larger particles – the flocks – that
will settle out easily during the sedimentation process [4, 185].

Survival of drinking water pathogens after disinfection
6
1.1.2.3 Sedimentation
The velocity of water is decreased during its passage in the sedimentation basin to allow the
suspended material and flocks to settle out on the bottom by gravity before the water exits the basin.
The removal of some particles facilitates the filtration process avoiding the quick clogging of filters [5,
185].
1.1.2.4 Filtration
While groundwater is naturally filtered when passing through the porous layers of the soil, surface
water has to be filtered in the WTS. This process is applied to remove organic particles (vegetation,
humic substances), coagulation precipitates (such as precipitates of aluminium or iron), clay and silt
particles, microorganisms and other suspended matter achieved by the passage of water through a
filter (permeable fabric or a porous bed of materials) [7, 92, 185].
1.1.2.5 Disinfection
A common mistake is the confusion of disinfection with sterilization, as they are different. By definition
sterilization is a process that eliminates all forms of life, including live microorganisms and spores,
while disinfection is generally regarded as only killing live microorganisms but having no effect on
spores [32]. In drinking water distribution systems (DWDS), disinfection is understood as a process
that kills or inactivates microorganisms (especially pathogens) to a safe level, i.e., until a harmless
concentration is reached [184, 283]. In DWDS disinfection can occur in two stages: primary (that aims
to inactivate or kill microorganisms to a desired level) and secondary disinfection. In this latter step, it
is necessary that a defined level of disinfectant remains in the treated water to prevent microbiological
regrowth [184]. As such, the disinfection step is absolutely necessary to make water safe. However,
some disinfectants can react with organic matter producing undesirable disinfectant by-products
(DBP), some of them suspected to be carcinogenic and mutagenic. The type of DBP is dependant on
the disinfectant used and the chemical composition of the water [35, 224, 243, 282].
Although chlorine is the universal disinfectant used in DWDS, there are other disinfectants that can
also be used, depending on availability, difficulty, cost and efficacy [51, 117, 283]. Table 1.3
summarizes the most common disinfectants currently used in drinking water stations.

Background and Aims
7
Table 1.3 Principal disinfectants used in DWDS and associated characteristics.
Disinfectant Mode of action Principal DBP Microorg. effective
Residual disinf.
Ozone As an oxidative, reacts with cytoplasmic substances leading to degradation of chromosomal DNA in bacteria and viruses and damaging protein coat of viruses
Carboxylic acid Aldehydes Ketones Di-carboxyl
Bacteria Viruses Cryptosporidium Giardia
No
Ultraviolet radiation
UV penetrates the microbial cell wall disrupting the genetic material, making reproduction impossible
No DBPs formed Bacteria Viruses
No
Chlorine dioxide
Inactivates the phosphotransferase with consequent inhibition of the respiration metabolism. Can also react with viral RNA.
Halocetic acids Haloacetaldehydes Chlorates Toxic chlorites
Bacteria Viruses Cryptosporidium Giardia
Yes
Chloramines Inactivates the energy-producing enzymes. Inactivates also the phosphotransferase inhibiting the respiration process.
Trihalomethanes Halocetic acids
Bacteria Yes
Chlorine The mode of action is not well known, but probably at low concentrations penetrates in the cell and reacts with enzymes and protoplasm while at higher conc. oxides the cell wall destroying the organism.
Trihalomethanes Hydroxyl radicals
Bacteria Viruses Cryptosporidium Giardia
Yes
Source: [35, 179, 184, 230, 283, 291, 299].
1.1.3 Chlorination of drinking water
Chlorine was the first disinfectant used to disinfect drinking water and has been used for more than
150 years (Figure 1.2a). The first time that chlorine was used as a disinfectant in water was in 1846 by
Ignac Semmelweis in the Vienna General Hospital maternity unit to wash and disinfect hands before
touching newborn children, and since then it has became widely used worldwide. The reason why
chlorine is the most commonly used disinfectant is due to its effectiveness, easy of use and low cost.
Furthermore, it can provide a residual disinfectant in water that prevents (or should prevent) the
microorganisms’ regrowth [92, 250, 283, 299].
Chlorine can be added to water in three different forms; chlorine gas, sodium hypochlorite and calcium
hypochlorite. Once in water, chlorine first reacts with the organic compounds present in water forming
secondary products that include DBP’s and only after the breakpoint there will be chlorine available as
a disinfectant (Figure 1.2b). Chlorine then reacts to form hypochlorous acid (HOCl) and hypochlorite
ion (OCl-) as described by the equations in Figure1.2c. These two species are known as free chlorine
and both have oxidative power. However, as HOCl is neutrally charged, it penetrates the cell easier,
being more effective than OCl-. In fact, the effect of the hypochlorite ion as a disinfectant is so low that
it is practically insignificant [149, 179]. The concentration of these two species in water is pH

Survival of drinking water pathogens after disinfection
8
dependent, as observed in Figure 1.2c. At pH 6 the concentration of hypochlorous acid is
approximately 98% decreasing to 83% at pH7 and to 14.5% at pH 8.5, meaning that chlorination will
be more effective when pH is between 6 and 7 [149].
Figura 1.2 Chronology of drinking water chlorination [250, 283] (a). Drinking water chlorination: reaction of
chlorine with organic compounds present in water and formation of free chlorine [181] (b). Chlorine reactions in
water: formation of chlorine species dependant on water pH and respective chemical reactions [9] (c).
Investigations into drinking water chlorination are quite vast, from the characterization of DBPs and
their effect on human health [27, 66, 74, 192, 298, 299, 303] to pathogen resistance. To give some
examples, Mir and colleagues [176] have studied several Gram-positive and Gram-negative bacteria
isolated from chlorinated water and concluded that Gram-positive strains are in general more resistant
to chlorine. Lisle et al. [156] have demonstrated that Escherichia coli can survive higher
concentrations than the residual chlorine concentration left in US water treatment stations. Pathogens
such as Clostridium perfringens [208], Mycobacterium spp [149], L. pneumophila [146] and H. pylori
[24] were found to be more resistant to chlorination than E. coli, the microorganism that is routinely
tested as an indicator of faecal pollution for assessing and maintaining adequate water quality;
consequently the role of E. coli has an effective indicator of treated water quality must now be
questioned.
When inside the cell, chlorine may affect several components of the microorganism. Some authors
have shown that hypochlorous acid is a multitarget reagent that can lead to damage to the DNA, cell
walls, thiol and thiol groups, aminogroups in proteins with consequent cell inactivation or even death
Background and Aims
9
[26, 70, 72, 97, 170, 173, 217, 241, 260]. Most of the studies concerning the deleterious effect of
chlorine are conducted on the bacterium E. coli. As said before this microorganism is less resistant
than some of the pathogens present in water and that, in conjunction with the fact the hypochlorous
acid might affect cells in different ways, brings the necessity of further investigations into the effect of
chlorination on other pathogens.
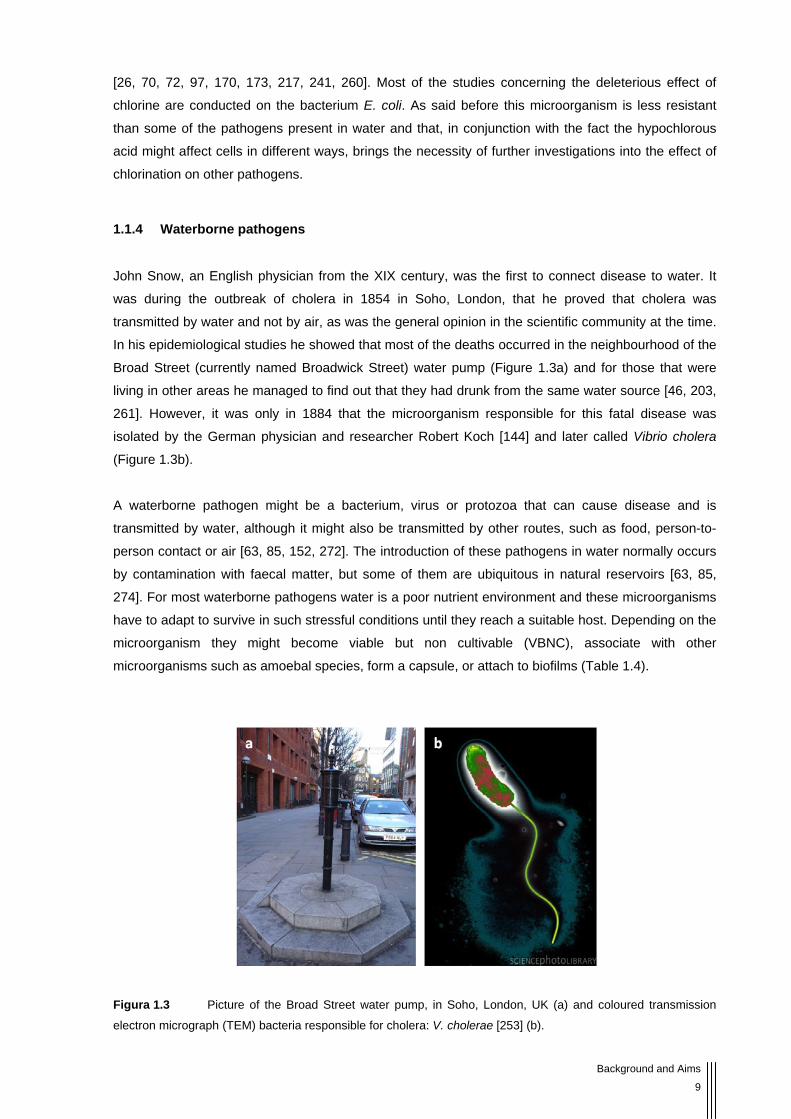
1.1.4 Waterborne pathogens
John Snow, an English physician from the XIX century, was the first to connect disease to water. It
was during the outbreak of cholera in 1854 in Soho, London, that he proved that cholera was
transmitted by water and not by air, as was the general opinion in the scientific community at the time.
In his epidemiological studies he showed that most of the deaths occurred in the neighbourhood of the
Broad Street (currently named Broadwick Street) water pump (Figure 1.3a) and for those that were
living in other areas he managed to find out that they had drunk from the same water source [46, 203,
261]. However, it was only in 1884 that the microorganism responsible for this fatal disease was
isolated by the German physician and researcher Robert Koch [144] and later called Vibrio cholera
(Figure 1.3b).
A waterborne pathogen might be a bacterium, virus or protozoa that can cause disease and is
transmitted by water, although it might also be transmitted by other routes, such as food, person-to-
person contact or air [63, 85, 152, 272]. The introduction of these pathogens in water normally occurs
by contamination with faecal matter, but some of them are ubiquitous in natural reservoirs [63, 85,
274]. For most waterborne pathogens water is a poor nutrient environment and these microorganisms
have to adapt to survive in such stressful conditions until they reach a suitable host. Depending on the
microorganism they might become viable but non cultivable (VBNC), associate with other
microorganisms such as amoebal species, form a capsule, or attach to biofilms (Table 1.4).
Figura 1.3 Picture of the Broad Street water pump, in Soho, London, UK (a) and coloured transmission
electron micrograph (TEM) bacteria responsible for cholera: V. cholerae [253] (b).

Survival of drinking water pathogens after disinfection
10
When collected from natural reservoirs, water passes through several treatments in WTS. The type
and number of treatments are dependent on the raw water quality, but disinfection is an obligatory
step. The complete elimination of drinking water microorganisms is an utopia, it can not be achieved
and would not be beneficial. The problem arises only when the microorganisms that remain in water
are pathogens that still retain infectious ability [195, 210]. To cause outbreaks each pathogen has a
minimal infection dose and therefore the objective is to maintain the water pathogen concentration
below such levels, avoiding the spread of diseases. Nevertheless, for technical and economical
reasons, the control of drinking water safety still relies on the detection/enumeration of total coliforms
and E. coli. As stated above, E. coli is known to be less resistant to chlorination than several
waterborne pathogens. Furthermore, presence/absence of this surrogate is not always related to
them, especially to those that are considered ubiquitous microorganisms [92, 115, 274, 286, 297].
Table 1.4 Some examples of waterborne pathogens, associated disease and survival time in water.
Microorganism Disease Introd. in water
Survival in water
Survival strategy
Bacteria Vibrio cholera cholera FM; U 1 B, IP, VBNC Salmonella spp. Typhoid fever,
Gastroenteritis, Septicaemia FM; U 2 IP, VBNC
Escherichia coli Hemorrhagic colitis, Hemolytic uremic syndrome
FM 3 IP, VBNC
Campylobacter spp. Gastroenteritis FM;U 2 B, VBNC Helicobacter pylori Peptic ulcer, gastric cancer FM 1 B, VBNC Legionella pneumophila Legionnaire’s diesease, Pontiac
fever U 3 B, IP, VBNC
Mycobacterium avium Infections on keleton, soft tissues, repiratory, gastrointestinal and genitourinary track
U B, IP
Pseudomonas aeruginosa Mastitis, otitis, infections on respiratory and urinary tack
U 1 B, IP
Viruses Hepatitis A hepatitis FM 3 A Enteroviruses myocarditis, poliomyelitis
meningoencephalitis FM 3 S, IP
Rotavirus Gastroenteritis FM 3 A Adenovirus Gastroenteritis, pneumonia,
ureteritis FM 3 A
Protozoa
Giardia lambia Giardisis FM 2 C Cryptosporidium parvum Cryptosporidiosis FM 3 B, oC Acanthamoeba spp. Encephalitis, keratitis, uveitis U 3 B, C, S
Legend: B: biofilm; C: cysts; oC: oocysts; IP: inside protozoa; S: suspension; VBNC: viable but non cultivable; 1: less than one week; 2: between one week and one month; 3: more than one month. Source: [82, 102, 152, 201, 228, 242, 297, 300].

Background and Aims
11
One of the major problems in the control of drinking water safety is the ability of some pathogens to
enter a viable but non-cultivable state (VBNC). The VBNC state was first described by the group of
Rita Colwell back in 1982 [301] and since then more than 400 papers have been written about the
VBNC state in several bacteria (reviewed by Oliver [199]). Under some circumstances,
microorganisms can stop their DNA multiplication but maintain minimal metabolic activity. As a
consequence, these microorganisms fail to grow on artificial media as they normally would do (they
are not cultivable) but are still viable and able to recover, some by the simple addition of nutrients
(such as Salmonella enterica serovar Enteritidis, Pseudomonas fluorescens and Pasteurella piscicida)
others only by passage in other microorganisms. For instance, L. pneumophila, M. avium and H. pylori
are able to be resuscitated after coculture with amoeba species. Other pathogens recover cultivability
through passage in animals such as rabbits (V. cholerae, E. coli) or guinea pigs (L. pneumophila)
[199, 200, 294, 301]. Additionally, it has already been proved that VBNC microorganisms maintain
their pathogenicity and cause diseases after cultivability recovery [23, 94, 124, 132, 219]. The
assessment of VBNC cells is therefore challenging and several techniques have been developed to
attempt to detect pathogens that have entered this state as resuscitation in hosts is not practical for
routine analysis. This will be discussed in the section 1.3.

Survival of drinking water pathogens after disinfection
12
1.2 Biofilms
In the natural environment, the physico-chemical conditions are usually adverse to microorganisms.
Factors such as temperature, nutrient availability and oxygen concentration can cause stress in
microbial cells. Microorganisms often do not live as free swimming (planktonic) cells but tend to
adhere to surfaces. In these environments, microorganisms are surrounded by a matrix constituting of
extracellular polymeric substances (EPS) and water. The community of microorganisms (sessile cells)
embedded in the matrix is called a biofilm (Figure 1.4) [71, 129, 290]. Biofilms are well organized
structures where bacteria are protected from environmental stress and can interact with other cells in
antagonism, mutualism, competition and synergy relationships [44, 56, 190, 225, 258]. The way that
cells communicate and organize in a social community is controlled by the secretion of signal
molecules in a process called “quorum sensing”. The secretion of these signal molecules (called
autoinducers or quormon) promotes the communication between cells and regulates the relationship
between bacteria resulting in a group behaviour instead of an individual performance, e.g. cells can
have a different function depending of their location in the biofilm [67, 205, 290].
Figura 1.4 Stages of biofilm formation showing structure and architecture: 1: Initial attachment; 2:
Production of EPS; 3 & 4: Maturation; 5: Dispersion of single cells [270] (a). Microphotograph of a Pseudomonas
fluorescens biofilm where the EPS is stained with Live/Dead® BacLightTM kit [96] (b).
Research into the study of biofilms has been ongoing for over 70 years. The first observations that
bacteria prefer to live in biofilms instead of living a the planktonic state dates back to 1933 [116] and
the first laboratory studies were conducted some years later by Zobell [304, 305]. In the last 30 years
there has been an explosion in the amount of research into biofilms.
1.2.1 Formation of biofilms
Biofilms formation occurs in four main stages: transport of the microorganisms to the surface, initial
adhesion, maturation and detachment (Figure 1.4a).

Background and Aims
13
The first step of the formation of biofilm is the transport of the microbial cells to the substratum surface.
The transport can be due to Brownian motion, transport through the boundary layers, motility by
cellular locomotive structures such as flagella and, in quiescent conditions, sedimentation [93, 223].
When the cells approach the surface they can interact with each other by the establishment of long
and short/intermediate distance forces. The long distance forces are described by the Derjaguin-
Landau-Verwey-Overbeek theory (DLVO forces) and comprise the attractive forces of van der Waals
and the repulsive forces of the electrostatic double-layer. In equilibrium, when favourable, this results
in the adhesion of microorganisms. The short/intermediate distance forces include hydrophobic
interactions, hydrophobic pressure, steric forces, Born repulsion forces and polymer bridges [88, 93,
197].
The adhesion of specific microorganisms can be facilitated by co-aggregation (adhesion of suspended
cells) and co-adhesion (between adhered and suspended cells). The co-aggregation is particularly
important in the formation of biofilms in dental plaques and aquatic environments. The influence of co-
aggregation in biofilms formed in dental plaque is well documented; however, this phenomenon is not
well understood in the formation of aquatic biofilms [45, 140, 231].
After adhering to the substratum cells can grow and replicate. In the maturation phase, the
development of a complex architecture with the formation of channels, pores and redistribution of
bacteria along the biofilm is observed (clusters – Figure 1.4). It is in this stage that microorganisms
produce large amounts of EPS that embed round the biofilm and protect the microorganisms inside
from stress factors, such as the presence of biocides [42, 71, 196, 269].
The last phase is the detachment of cells and other components from the biofilm. The detachment
occurs due to different mechanisms: grazing (predation by protozoa species), erosion (removal of
small particles due to the shear stress of the fluid), abrasion (caused by collision and/or rubbing of
particles that may be covered with biofilm) and sloughing (detachment of large portions of biofilm).
When cells detach from the biofilm they might return to their planktonic growth and cause infections
[38, 105, 232].
The maturation and detachment stages can occur simultaneously and the biofilm enters a dynamic
equilibrium. For this reason older biofilms have a relatively constant biomass [42, 285].
1.2.2 Types of biofilms and their impact on public health
Biofilms can be formed by a single microbial species, such as some medical biofilms, or, more
frequently, constitute a consortium of microorganisms which can include bacteria, viruses, fungi, algae
and protozoa. The diversity of nutrients that can penetrate inside the biofilm will determine the
heterogeneity of the biofilm [140, 196].

Survival of drinking water pathogens after disinfection
14
Depending on the situation, biofilms can be beneficial or detrimental. Biofilms used in pharmaceutical
and fermentation industries, wastewater treatment stations and natural biofilms in lakes or rivers which
contribute to pollutant degradation are considered beneficial, while biofilms that accumulate on heat
exchangers, membrane systems, filters, drinking water pipes, catheters, medical implants, live tissues
and contact lenses are detrimental (Figure 1.5) [53, 84, 172, 202, 206, 246].
Biofilms are quite often also associated to corrosion problems either by the production of elements
that attack the material where they are formed (such as acids, minerals, ammonia) or by direct feeding
on the material [22].
Figura 1.5 Photographs of different types of biofilms: dental plaque [271] (a), heat exchanger [125] (b), on
gut tissues [249] (c) wastewater treatment [15] (d).
One of the biggest problems of biofilms as a form of life is their potential impact on human health. The
susceptibility of sessile cells to disinfectants, biocides and antibiotics is much lower (can be up to 1000
times more resistant) than planktonic cells. Several studies have revealed that the penetration and
diffusion of these products inside the biofilm matrix is very difficult and therefore the concentration of
antimicrobial products needed is considerably higher and sometimes impracticable [122].
Furthermore, when sessile cells release from biofilms they can be able to return to their planktonic
phase as infectious agents (in the case of pathogens). The fact that biofilm microorganisms are
exposed to a sublethal concentration leads to the occurrence of resistant cells after returning to the
planktonic phase, which in turn are more difficult to kill. The physiological mechanisms as to why cells
become resistant are still unclear but in the last few years some theories have arisen to explain the
increase of resistance in those cells which include horizontal gene transfer, the presence of altruistic
cells and change in the cell phenotype [90, 105, 129, 145, 150, 151, 154, 206].

Background and Aims
15
1.2.3 Factors affecting biofilm formation
Biofilms as live communities can be affected by several parameters, ranging from the type of
microorganisms that constitute the biofilm to the physico-chemical parameters such as those stated
below:
Temperature: All microorganisms have an optimal growth temperature and variations
of temperature will influence their development [226]. Consequently microbial adhesion and biofilm
growth are temperature dependent [54, 159, 237].
pH: A different pH from the optimal affects microbial metabolism as well as the
superficial electric properties of the membrane interfering in the repulsion and attraction forces
between the bacteria inside of the biofilm [212].
Shear stress: Biofilms grown under turbulent flows are more compact which hinders
the diffusion of nutrients and oxygen. However more turbulent flows leads to thinner biofilms and might
force mass transfer, therefore increasing shear stress can be beneficial for biofilm formation [75, 121,
213, 277].
Presence of biocidal agents: In DWDS, the biocide present by default, is chlorine.
The presence of residual chlorine is one of the stress factors that leads to biofilm formation however,
some studies have demonstrated that chlorine is also able to control biofilm formation by reducing the
rate of biofilm growth, promoting biofilm detachment and decreasing the activity of microorganisms
[58, 59, 68, 159].
Nutrients quantity and quality: The presence of carbon compounds is essential to
the formation of biofilm and the concentration of nutrients will influence metabolism with emphasis on
EPS production. Other elements necessary for metabolism include mineral ions, phosphorous and
nitrogen [33, 52, 59, 138, 186].
Microorganisms: The type of microbial consortium present in the bulk water will
determine the type of biofilm. Nevertheless, some studies have demonstrated that for some
microorganisms in pure culture, the concentration in the bulk water do not significantly affect the
concentration of the microorganisms in the biofilm [20, 50, 292].
Presence of particles: Depending on the type of particles the effect will be two-fold.
There are particles, like sand, that will promote the erosion of biofilm while others, like kaolin result in
thicker and stronger biofilms [174, 212, 284].
Support material: The influence of surfaces on biofilm formation is well documented
for different microorganisms. Different materials support different biofilm formation but this is also
dependent on the type of microorganism [18, 141, 178, 236].

Survival of drinking water pathogens after disinfection
16
However, in real life all these parameters work together to influence biofilm formation. In this way, the
impact of some of them may be insignificant when compared with the impact of others and must
therefore be considered carefully.
1.2.4 Drinking water biofilms
One type of biofilms which has been extensively studied is the biofilm associated with drinking water
systems. The biofilms formed in DWDS have several implications, from aesthetic to public health
concern and are influenced by several factors.
1.2.4.1 After disinfection why are biofilms a concern in DWDS?
As described previously, disinfection is not sterilization and after this drinking water treatment some
microorganisms still remain in the water. From the disinfection point water has to pass through many
kilometers of pipes until it arrives to the houses. Factors such as nutrient concentration, residual
disinfectant and temperature cause stress in these microorganisms leading to attachment on the pipe
walls and consequent biofilm formation. When cells detach from biofilms they can cause several
problems that will be discussed below and when these microorganisms are pathogenic they might be
related to the occurrence of outbreaks of disease [78, 105].
1.2.4.2 Which problems can drinking water biofilms cause?
The presence of biofilms in DWDS possibly will lead to three main problems: increase in water
company costs, aesthetic inconveniences (taste and odour) and public health concerns. The first
problem is connected to a decrease in water quality or obtaining false results following coliform tests
which require strategies to provide safe drink water while aesthetic problems are related to the
emergence of bad taste, odour, colour and presence of invertebrates in drinking water [22, 140].
When pathogens survive the disinfection stage they will remain in the water, incorporate into biofilms
and survive for long periods and under adverse conditions. Whether they pose a public heath threat
when re-entering the water and reverting to their planktonic phase is a subject of discussion. Payment
et al. [209] did not find any relationship between biofilm presence in DWDS and occurrence of
disease. However it has been proved that pathogens such as L. pneumophila, Mycobacterium spp.,
Pseudomonas aeruginosa, Klebsiella spp., and Cryptosporidium, are transmitted by contaminated
water and biofilms are a good candidate as they can act as a protective niche to their survival in
drinking water as previously showed by several authors (reviewed in [85, 256, 272]).

Background and Aims
17
1.2.4.3 Pipe material: a dual problem
The water distribution network includes pipes of different materials with the most common being cast
iron, medium density polyethylene (MDPE) and unplasticized polyvinylchloride (uPVC). All these
materials can support biofilm formation although cast iron is preferred over the other two materials.
Cast iron pipes provide iron, which is an essential element to the metabolism of most microorganisms.
The presence of biofilms on cast iron surfaces results in the corrosion of these pipes (Figure 1.6) and
loss of pipe material, a deleterious condition that has not been found when MDPE or uPVC are used.
For these reasons in several countries when metallic water pipes need to be replaced they have used
either MDPE or uPVC [22, 141, 193].
Figura 1.6 Photograph of a cast iron pipe where corrosion has occurred (a) and of a high density
polyethylene pipe with biofilm (b) (photographs kindly yielded by Sofia Bragança).
1.2.4.4 Drinking water biofilms control
The formation of biofilms can be affected by several parameters that can be manipulated to control
biofilm growth on DWDS. One of the strategies which can be adopted to control and remove biofilms
from these systems is the increase of residual disinfectants such as chlorine. However, this has to be
carefully studied as required levels could be too high to be practicable, due the introduction of strong
odour and taste in the water, the increase of DBPs and the selection of resistant bacteria. The use of
alternative disinfectants needs more research both with regards to the penetration into biofilms and
consequent antimicrobial effect, their reaction with pipe material, especially cast iron, and the
formation of associated DBPs. The control of carbon content in water is another strategy. In general,
microorganisms need a C:N:P (carbon, nitrogen and phosphorous) ratio of 100:10:1 where carbon is
the growth limiting nutrient, thus restricting the carbon concentration will decrease the microbial growth
[52, 211]. This is, in general, reached by the decrease of organic matter content, however, it would be
a very expensive process and ineffective for bacteria able to grow in oligotrophic environments. This
last strategy relies on the replacement of the pipes with materials such as uPVC and MDPE that
support less microbial adhesion than cast iron and on the other hand are less susceptive to residual
disinfectant attack [140].

Survival of drinking water pathogens after disinfection
18
1.3 Assessment of sessile and planktonic microorganisms
As described in section 1.1.4, assessment of microbiological drinking water safety is performed by
evaluation of the presence of coliform bacteria. To be considered safe no coliform bacteria should be
detected in 100 ml of sample using standard culture methods [297]. However this method is not
reliable for several reasons; VBNC cells may not be detected by cultivable methods, due the presence
of microorganisms which are more resistant to chlorination and because of the existence of species
which are ubiquitous in the environment (the detection of coliform bacteria assesses the contamination
of water by faecal matter). In this section, methods that are currently used in research associated with
drinking water pathogens and not necessarily used by drinking water treatment companies to routinely
analyze drinking water, will be described.
1.3.1 Culture methods
Robert Koch was the first scientist to use the heterotrophic plate count (HPC) method to quantify
heterotrophic microbial species in drinking water as a means of assessing drinking water safety [144].
Most of the HPC present in drinking water are innocuous to man, but some of them can be pathogenic
especially to immunocompromised people; for example, some species of Pseudomonas and
Acinetobacter. Additionally, the presence of pathogens that are non HPC, such as Legionella and
Mycobacterium spp., has also been reported [98]. For simplicity and economic reasons, HPC are
sometimes used in drinking water treatment stations to obtain a general idea of the water quality but it
is not possible to distinguish/identify the bacteria isolated [211, 233]. In particular cases, selective
media can be used to determine the presence of specific pathogens of interest. It should be noted that
no medium is 100% specific for a particular microorganism and overgrowth of other species might be
observed, so confirmative tests are needed afterwards [13, 108, 109, 110, 111, 112]. In Table 1.5
some examples of media (some commercially available) are shown which are used to recover specific
bacteria.
The cultivable methods are primarily used to detect live microorganisms, however since the discovery
of VBNC cells the state of art has changed. The use of cultivable methods to assess drinking water
safety has to be handled carefully, because several pathogens are difficult to recover when in a VBNC
state but they may be able to maintain their virulence and consequently cause infections. Several
authors have already alerted the fact that cultivable methods should be, therefore, used with
precaution and supported by other methods [239].

Background and Aims
19
Table 1.5 Media used in drinking water analysis to recover specific microorganisms.
Microorganism Media Incubation
HPC R2A; m-HPC agar; Plate count agar
22ºC – 28ºC for 5 – 7 days 35ºC for 48 hours
Salmonella Brilliant green agar; Bysmuth sulfite agar; Xylose lysine desoxychocolate; MacConkey agar
35º – 37ºCfor 24±3 hours
E. coli MacConkey agar Nutrient agar
30±1ºC for 4±1 hours followed 44±0.5ºC for 14±1 hours
Campylobacter Columbia blood agar Campylobacter selective agar
80% N2, 10% H2; 10% CO2 41,5ºC for 44±4 hours
Legionella BCYE GVPC
36±1ºC for 10 days (observe 2 times in between)
P. aeruginosa Pseudomonas agar + CN supplement
37 ºC for 22±2 hours + 22±2 hours
Source: [13, 108, 109, 110, 111, 112]
1.3.2 Microscopy methods
The first observation of bacterial and protozoa cells under the microscopy was achieved by Anton van
Leeuwenhoek in the XVII century using a very simple microscope constituted by a small but powerful
lens [251]. Microscopy techniques are now highly advanced and are routinely used in many research
laboratories.
The emergence of staining dyes revolutionized microscopy methods. In the case of fluorescent
molecules, they absorb light when an electron is excited by light. When the electron returns to the
initial energetic level (which has lower energy), it emits a photon of light in a mechanism known as
fluorescence. Fluorochromes are molecules which absorb light of a certain wavelength and emit light
at another wavelength. Microscopes adapted with filters of different wavelengths allow the
visualization of this fluorescence. According to the dye used, it is possible to assess the physiology of
cells (Figure 1.7), although there is still some controversy in the scientific community about the
validation of results, either in the efficient use of these dyes in each microorganism or the veracity of
the relationship to physiological state. Numerous studies have already shown that they can be
successfully used as an alternative to cultivable methods due to their reliability and rapid nature [36,
134].
Each stain has a characteristic wavelength for excitation and emission that results in the fluorescence
of different colours and allows the use of different stains simultaneously. When stains have a low
molecular weight they easily penetrate inside cells (in any physiological condition) and bind to nucleic
acids. This is the case for 4’,6-diamidino-2-phenylindole (DAPI), acridine orange, SYTO 9, etc which
are used to quantify total cells. Alternatively, stains such as propidium iodide (PI), with a higher
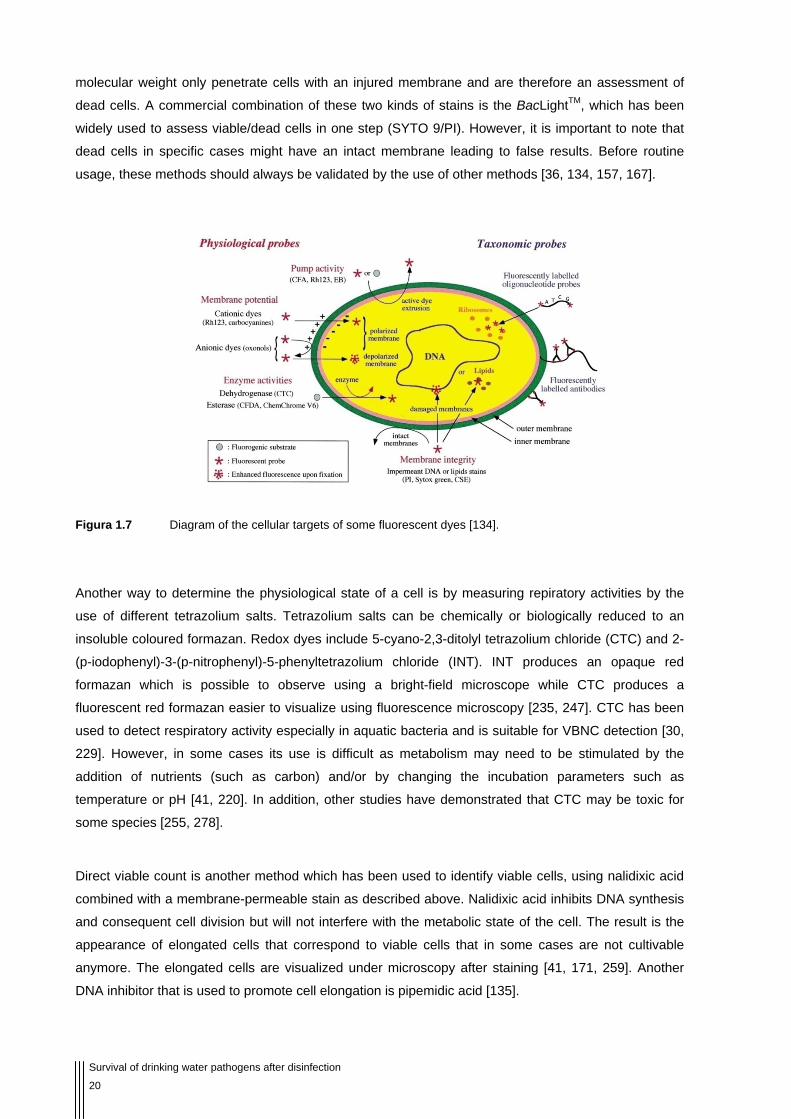
Survival of drinking water pathogens after disinfection
20
molecular weight only penetrate cells with an injured membrane and are therefore an assessment of
dead cells. A commercial combination of these two kinds of stains is the BacLightTM, which has been
widely used to assess viable/dead cells in one step (SYTO 9/PI). However, it is important to note that
dead cells in specific cases might have an intact membrane leading to false results. Before routine
usage, these methods should always be validated by the use of other methods [36, 134, 157, 167].
Figura 1.7 Diagram of the cellular targets of some fluorescent dyes [134].
Another way to determine the physiological state of a cell is by measuring repiratory activities by the
use of different tetrazolium salts. Tetrazolium salts can be chemically or biologically reduced to an
insoluble coloured formazan. Redox dyes include 5-cyano-2,3-ditolyl tetrazolium chloride (CTC) and 2-
(p-iodophenyl)-3-(p-nitrophenyl)-5-phenyltetrazolium chloride (INT). INT produces an opaque red
formazan which is possible to observe using a bright-field microscope while CTC produces a
fluorescent red formazan easier to visualize using fluorescence microscopy [235, 247]. CTC has been
used to detect respiratory activity especially in aquatic bacteria and is suitable for VBNC detection [30,
229]. However, in some cases its use is difficult as metabolism may need to be stimulated by the
addition of nutrients (such as carbon) and/or by changing the incubation parameters such as
temperature or pH [41, 220]. In addition, other studies have demonstrated that CTC may be toxic for
some species [255, 278].
Direct viable count is another method which has been used to identify viable cells, using nalidixic acid
combined with a membrane-permeable stain as described above. Nalidixic acid inhibits DNA synthesis
and consequent cell division but will not interfere with the metabolic state of the cell. The result is the
appearance of elongated cells that correspond to viable cells that in some cases are not cultivable
anymore. The elongated cells are visualized under microscopy after staining [41, 171, 259]. Another
DNA inhibitor that is used to promote cell elongation is pipemidic acid [135].

Background and Aims
21
1.3.3 Colorimetric methods
Colorimetric methods rely on the same principles of action as CTC but it is not observed
microscopically. The reduction of nitroblue tetrazolium dyes by the radical superoxide (frequently
present in biological systems) results in the formation of a soluble blue diformazan which can be
measured spectrophotometrically at an appropriate wavelength. It is faster method of analysis than
microscopic methods but less sensitive. The most common dyes include sodium 3’-[1-[(phenylamino)-
carbonyl]-3,4-tetrazolium]-bis (4-methoxy-6-nitro)benzenesulfonic acid hydrate (XTT), 2,3,5-
triphenyltetrazolium chloride (TTC) and 3-[4,5-dimethylthiazol-2-yl]-2,5-diphenyltetrazolium bromide
(MTT) [41, 91, 238].
1.3.4 Flow cytometry
It is possible to measure the dispersion of light by microbial cells using a flow cytometer and correlate
that dispersion to the number of cells present in the sample. This method is quite accurate but very
complex as several experimental parameters need to be carefully chosen. Combined with fluorescent
stains it gives extra information about cell physiology [218, 252].
1.3.5 Immunological methods
The principle of this technique relies in the fact that antibodies recognize three-dimensional epitope
structures on specific microorganisms. Consequently, specific microorganisms can be detected and
quantified in mixed samples [248, 275].
1.3.6 Molecular methods
Polymerase Chain Reaction (PCR) is a technique widely used to detect specific microorganisms by
the targeting of specific genes and subsequent DNA amplification. One of the major disadvantages is
the impossibility to distinguish viable from non viable cells and therefore its use in drinking water
control should be limited as providing an indication of the presence/absence of a microorganism [302].
Quantitative PCR, that is able to distinguish DNA from viable and non viable cells by the use of
ethidium monoazide and propidium monoazide has been recently under development. However it was
not possible to successfully apply this technique to complex environmental samples [288].
In recent years, fluorescence in situ hybridization (FISH) has become a very popular method to detect
and quantify specific pathogens in mixed consortia [128, 163].
The FISH method consists of the use of an oligonucleotide probe with a specific sequence that will
bind to a complementary sequence on the DNA and RNA molecules. The sequence used determines
whether the probe is specific for a whole genus or for a specific strain. The probes have a fluorophore
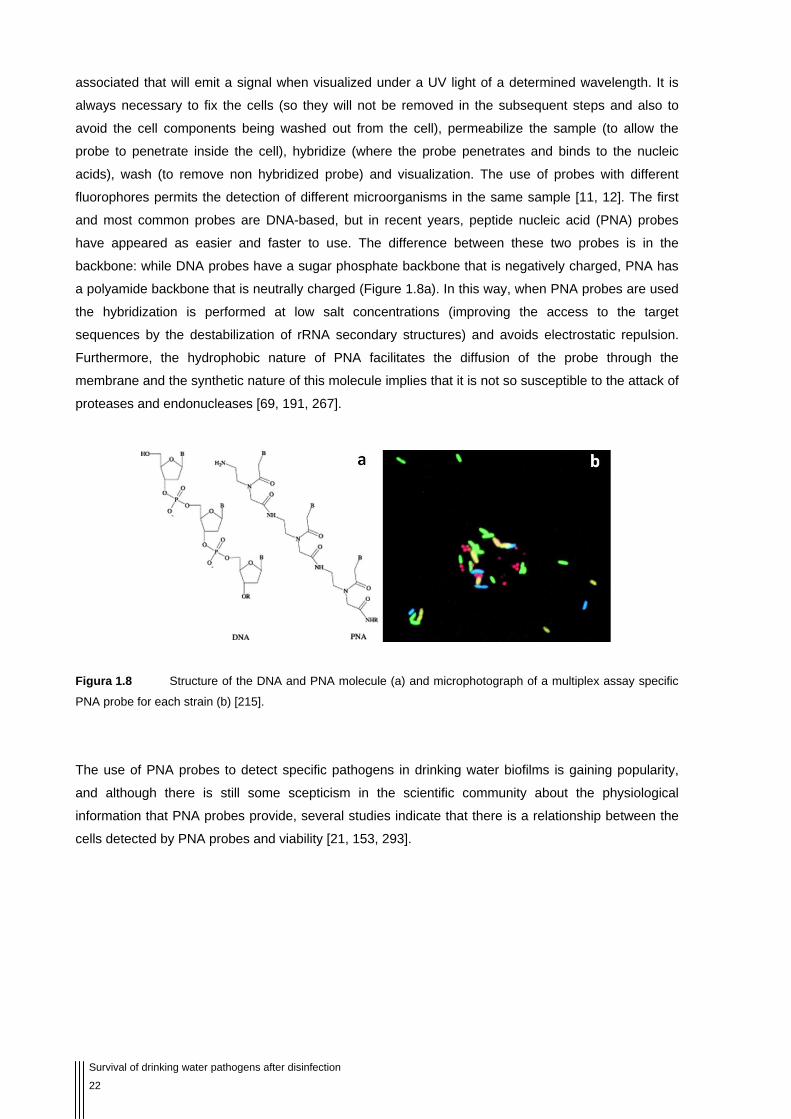
Survival of drinking water pathogens after disinfection
22
associated that will emit a signal when visualized under a UV light of a determined wavelength. It is
always necessary to fix the cells (so they will not be removed in the subsequent steps and also to
avoid the cell components being washed out from the cell), permeabilize the sample (to allow the
probe to penetrate inside the cell), hybridize (where the probe penetrates and binds to the nucleic
acids), wash (to remove non hybridized probe) and visualization. The use of probes with different
fluorophores permits the detection of different microorganisms in the same sample [11, 12]. The first
and most common probes are DNA-based, but in recent years, peptide nucleic acid (PNA) probes
have appeared as easier and faster to use. The difference between these two probes is in the
backbone: while DNA probes have a sugar phosphate backbone that is negatively charged, PNA has
a polyamide backbone that is neutrally charged (Figure 1.8a). In this way, when PNA probes are used
the hybridization is performed at low salt concentrations (improving the access to the target
sequences by the destabilization of rRNA secondary structures) and avoids electrostatic repulsion.
Furthermore, the hydrophobic nature of PNA facilitates the diffusion of the probe through the
membrane and the synthetic nature of this molecule implies that it is not so susceptible to the attack of
proteases and endonucleases [69, 191, 267].
Figura 1.8 Structure of the DNA and PNA molecule (a) and microphotograph of a multiplex assay specific
PNA probe for each strain (b) [215].
The use of PNA probes to detect specific pathogens in drinking water biofilms is gaining popularity,
and although there is still some scepticism in the scientific community about the physiological
information that PNA probes provide, several studies indicate that there is a relationship between the
cells detected by PNA probes and viability [21, 153, 293].

Background and Aims
23
1.4 Legionella pneumophila
In the last 30 years, much research has been done on the pathogen L. pneumophila, which remains
responsible for deaths worldwide. Although nowadays the research is more focused on the clinical
aspects, ecological aspects are still important, mainly because this microorganism is ubiquitous in
natural environments and can survive the disinfection process.
1.4.1 Since the first outbreak
In 1976 during the 58th American Legion’s convention hosted in Philadelphia, USA, more than 220
people fell ill and of those 35 people died of a mysterious disease. As the outbreak occurred during a
Legionnaires’ meeting and most of the affected people were Legionnaires or connected to them, the,
then unknown, disease became known as “Legionnaires’ disease”. The first attempt to isolate the
microorganism responsible for the outbreak failed and ironically it was thought that it was unlikely to
be due to a bacterial infection. Only a few months later, early in 1977, Joseph McDade, using guinea
pigs instead of mice isolated the bacterium that caused the outbreak during the previous August. The
bacterium was named “Legionella” due to its connection with Legionnaires and “pneumophila” as it
caused a pneumonic disease [87, 295].
This was the first Legionella outbreak reported although it is possible that several cases had occurred
previously. In fact, McDade and colleagues identified a bacterium isolated in a pneumonia episode in
1947 as L. pneumophila [168]. Various outbreaks and sporadic cases have been reported and despite
the fact that this disease is treatable, there are still deaths occurring worldwide due to this bacterium.
Last year, 441 cases of Legionnaires’ disease were reported in England and Wales of which 53
resulted in death [107]. In the United States, it is estimated that 8000 to 18000 cases of Legionnaires’
disease occur every year [48]. However it is possible that these numbers are underestimated as in
many cases the causes of pneumonal illnesss are not identified.
1.4.2 Characteristics
The family Legionellacea consist of one single genus named Legionella and are a subgroup of the γ-
proteobacteria class. The nearest relative of the Legionellacea is the pathogen Coxiella burnettii,
which causes a similar disease to legionellosis. The genus Legionella comprises 50 species, most of
them pathogenic to humans, and 73 serogroups. L. pneumophila is the strain with most serogroups
(16 in total and all of them pathogenic) and alone it is responsible for 98% of Legionnaires’ disease,
from which 95% are due to serogroup 1 [8, 158]. The complete genome of L. pneumophila is formed
of 3.5 Megabase pairs, with a G+C content of 38% and approximately 3000 genes. On average 20%
of the genes are unique to the genus Legionella [8, 55]. The mip genes are associated to their ability
to infect and grow inside of phagocytic protist host cells, such as amoebae, and mammalian

Survival of drinking water pathogens after disinfection
24
phagocytes in the immune system, such as human macrophages. Additionally, the icm genes are
associated with virulence of L. pneumophila [8, 57, 254].
L. pneumophila is a Gram-negative rod shaped bacterium (Figure 1.9c) of approximately 0.3 to 0.9 μm
width by 2 to >20 μm length [295]. It has an aerobic and heterotrophic metabolism, and requires amino
acids as source of carbon and energy as it is unable to oxidize or ferment carbohydrates [266]. In fact,
L. pneumophila is not able to grow in artificial media in the absence of L-cysteine (unless when
associated with other microorganisms such as Flavobacterium breve) [287] and requires a certain
concentration of iron [127]. It does not form spores and can have pili and a flagellum. The optimal
growth temperature is 35ºC, but it also grows well between 25º and 42ºC [83]. Nevertheless, it has
been demonstrated that, in specific conditions, this bacteria can grow optimally at different
temperatures, such as 30º or 45ºC [147].
Figura 1.9 Diagram of the L. pneumophila cycle of life inside protozoa: 1. Environmental L. pneumophila in
biofilms or infecting protozoa; 2 & 3. L. pneumophila inside of amoeba; 4. Infectous particles; 5. Transmission to
humans; 6: L. pneumophila that have escaped their protozoan host [177] (a). Coloured TEM of a lung
macrophage containing L. pneumophila cells (white dots inside of purple) (b) and coloured TEM of L.
pneumophila (c) [253].
1.4.3 Environmental ecology and route of transmission
L. pneumophila is ubiquitous in natural aquatic environments and also in manmade water systems. It
appears to fail to grow alone in water either in planktonic or sessile form, however several studies
have demonstrated the important role of heterotrophic biofilms in the pathogen’s resistance and
survival in poor environments [183, 236, 237]. The role of amoeba species is well documented and
these are also ubiquitous in natural and artificial waters. As such, several groups have already
demonstrated that amoeba species, including members of the genera Acanthamoeba, Hartmanella,
and Naegleria, are not only a protective niche for the survival of L. pneumophila in water but also a
support for their growth and multiplication [1, 187, 240, 265, 266].

Background and Aims
25
There is no doubt that L. pneumophila is a waterborne pathogen. In fact, as no person-to-person
transmission has been ever reported, water might be the only route possible, although L. lonbeachae
has been reported to be transmitted in aerosolised dry potting compost. The infection occurs when
aerosolized droplets with a diameter smaller than 8 μm are inhaled and reach the lung alveoli. This
happens because droplets bigger than 8 μm are excluded by the terminal bronchiole and might be the
explanation why there are not more cases of legionellosis [34]. In this way, infections are normally
connected to cooling towers, whirlpool spas, fountains, shower heads, air conditioners and dental
units where water contaminated by L. pneumophila can be aerosolized [2, 16, 34, 118, 264]. However,
research by Janet Stout and colleagues has also suggested that ingestion can be a route of infection
by the later microaspiration of stomach aerosols but this pathway has never been proved (cited by
[143]).
The role of amoebae in the survival of L. pneumophila in the environment has been widely studied
(Figure 1.9a). Living inside these protozoa, L. pneumophila will not only grow and multiply but also
remain substantially protected against disinfection. The use of amoebas as a technique to resuscitate
VBNC L. pneumophila is also commonly used in laboratories [25, 29, 37, 94, 183].
1.4.4 Diseases, diagnosis and treatment
L. pneumophila causes two kinds of disease; Legionnaires’ disease, which is the pneumonia form that
can be fatal, and Pontiac Fever, a milder form of the disease very similar to flu [77, 137, 169, 207]. Not
all people which come into contact with L. pneumophila get Legionnaires’ disease (or even Pontiac
Fever) and symptoms are dependent on factors such as age (it is very rare in children below 15 years
and much more common in people older than 40 years), gender (men are twice as susceptible than
women), immunosuppression, smoking, alcoholism, autoimmune diseases and patients with chronic
pulmonary disease [120, 166, 266].
The pneumonia acquired form includes symptoms such as vomiting, non-productive cough, diahrrea,
myalgia, headache, rising fever and chills, bradycardia and/or confusion/delirium [120, 295].
Radiographies only show lung infection and are not specific for Legionella, so a proper diagnosis is
achieved by the isolation and culture of samples collected from sputum lung, use of antigens in urine
samples and PCR [120, 182].
The treatment of Legionnaire’s disease always involves the use of antibiotics including doxycycline (if
there is no certainty about the causative agent), erythtomycin, azithromycin, clarithromycin,
ciprofloxacin and levofloxocin. Some studies have shown that levofloxocin is the most effective in
severe pneumonias[64, 158, 175].

Survival of drinking water pathogens after disinfection
26
1.4.5 Outbreaks worldwide
Despite the fact that Legionella is a well known and characterized bacterium, it is estimated than on
average six out of every million people get infected and outbreaks still occur worldwide (Table 1.6).
The real number of Legionella infections is difficult to obtain, firstly because most of them will go
unnoticed (Pontiac Fever is similar to a normal flu) and also because not all pneumonal diseases are
checked for Legionella. The numbers present in Table 1.7 refer to the reported cases in the last 3
years but are certainly underestimations of the actual numbers [61, 106, 107, 114].
Table 1.6 Examples of outbreaks worldwide in the last 3 years.
Country Month and Year Number of cases
Number of deaths
New Zealand June 2005 19 3
US (New York) June 2005 21 ?
Canada (Toronto) September 2005 127 21
The Netherlands July 2006 30 2
France September 2006 12 0
Russia (Urals) July 2007 150 4
UK August 2007 5 4
US (Florida) March 2008 2 0
Source: [106]
Legionnaires’ disease is a preventable disease. The prevention and control of Legionella includes the
adoption of guidelines (also called codes of practice, standards or best practices) which are
publications resulting from the collaboration of government, academics and industrial experts. One of
the best known guidelines is the “Approved code of Practice and Guidance” (often referred as “L8”)
developed by Health and Safety Commission (HSC, UK) now Health and Safety Executive (HSE). The
publication of guidelines is vast and have been prepared by organisations such as National Health and
Medical Research Council (NHMRC, Australia), Centres for Disease Control and Prevention (CDC,
US), American Society of Heating, Refrigerating and Air Conditioning Engineers (ASHRAE, US),
Standard Association of Australia/ Standard Association of New Zealand, European Working Group
for Legionella Infections (EWGLI), World Health Organisation (WHO) to mention a few [49, 65, 79,
113].

Background and Aims
27
Table 1.7 Number of cases of Legionnaires’ disease in some European countries in the last 10 years.
Country 1999 2000 2001 2002 2003 2004 2005 2006 2007 2008*
Austria 12 10 11 13 8 16 18 14 21 5
Denmark 18 13 29 18 19 33 40 26 31 6
Finland 2 4 6 7 2 4 4 6 14 1
France 28 43 85 119 120 135 158 174 181 39
Germany 1 9 19 50 48 1 0 0 0 0
Ireland 1 5 1 3 2 3 5 9 11 0
Italy 31 19 49 68 72 66 96 130 149 23
Norway 1 5 7 6 11 9 13 12 17 6
Portugal 0 0 0 0 1 7 2 5 3 0
Spain 3 10 11 33 38 30 40 73 68 28
Sweden 22 22 24 23 27 22 23 28 41 9
The Netherlands 66 103 118 152 104 119 134 158 137 29
United Kingdom1
England & Wales 201 (30)
180 (24)
182 (26)
389 (33)
314 (35)
318 (38)
355 (29)
551 (52)
441 (53) ?
Northern Ireland 5(2) 1(0) 0(0) 4(0) 7(0) 5(0) 6(0) 5(0) ? ?
Scotland 35(3) 32(3) 20(2) 36(2) 29(2) 32(4) 33(1) 42(3) ? ?
Source: [80, 107, 114, 126] 1The numbers in brackets correspond to numbers of deaths. *Until May

Survival of drinking water pathogens after disinfection
28
1.5 Helicobacter pylori
Since the identification of H. pylori systematic research has been done to highlight several aspects
from clinical to ecological. After being discovered almost 30 years ago, its route of transmission is still
unknown. It is estimated that 50% of people are infected worldwide, although most of them are
asymptomatic.
1.5.1 Marshall & Warren towards the Nobel Prize
In 1982 two Australian researchers, Barry Marshall and Robin Warren, discovered that all the patients
with duodenal ulcers and 80% of the patients with gastric ulcers had a common characteristic: they
had a spiral-shaped non-identified bacterium present in their gastrointestinal tract. Based on these
observations they suggested that the bacterium was the principal cause of gastritis and peptic ulcers
[165]. During the following 10 years, research from all over the world confirmed the presence of H.
pylori in patients with gastric ulcers. In addition, in US and Europe it was shown that the use of
antibiotics against this pathogen resulted in the complete cure of the associated ulcers and their
recurrence decreased by 90%. In 1994, it was established that H. pylori is one of the causes for the
development of ulcers and this discovery resulted in a Nobel Prize in Medicine for Marshall and
Warren in 2005.
The bacterium was first named Campylobacter pyloridis and became pylori after some time, due it
relationship with the pylorus. A few years later, DNA tests revealed that the genomic differences
between this bacterium and other Campylobacter species were to great for it to be considered from
the genus Camplylobacter and the bacterium was renamed as Helicobacter pylori, due to its spiral
shape [100].
1.5.2 Characteristics
Helicobacter belongs to the ε-proteobacteria class and consists of at least 30 species. H. pylori is a
Gram-negative bacterium that can exist in 3 different physiological forms (spiral, U-shaped and
coccoid) and grow either microaerobically (concentrations of oxygen below 10%) or anaerobically. It is
a heterotrophic bacterium that uses glucose as a source of energy and carbon by its degradation to
pyruvate. It is a fastidious microorganism to grow in vitro requiring a complex medium and several
days to grow in a special gaseous atmosphere [73, 281].
This bacterium is commonly found in the epithelial cells where the pH is around 7.4. Its survival in the
acid environment of the gastric lumen (pH around 2) is conferred by an enzyme that hydrolyses urea
to carbon dioxide and ammonia: urease. The spiral shape and the presence of seven flagella in one of

Background and Aims
29
the poles gives it high mobility, allowing it to go across the thick and viscous gastric mucosa which
separates the lumen from the epithelial cells.
Although in vivo the spiral shape is the most predominant form, the coccoid shape has been observed
and is principally associated with stress conditions. Between these 2 main shapes the bacterium
passes through an intermediate U-shape (Figure 1.109). The dimensions of the spiral form range from
2-4 μm length and 0.5-0.8 μm width, but can reach 20 μm when grown in vitro under special
conditions. The coccoid form is normally between 1 and 4 μm diameter [14]. The form in which the
bacterium is might give important information about its metabolic condition. As such, in vivo the
predominant form is spiral being therefore associated to the infective form, while the coccoid form is
associated to stress conditions, such as nutrient deficiency, long incubation time, and is seen as a
strategy to survival in a dormant stage. There are some authors who think that the coccoid shape is a
manifestation of cellular death but it has been demonstrated that coccoid cells might be either dying,
cultivable or VBNC [18, 244].
Figura 1.10 Coulored TEM of H. pylori in the three different physiological possible forms: spiral (a); U-shape
(b) and coccoid (c). Coulored scanning electon micrograph (SEM) of H. pylori (pink) in the stomach lining (d)
[253].
The genome of H. pylori comprises of approximately 1.7 Megabase pairs with 35% G+C content. One
of the main genes connected to disease development is that coding for cytotoxin gene A, cagA [10,
73].
1.5.3 Is H. pylori a waterborne pathogen?
The route of transmission of H. pylori is still controversial but all authors seem to agree on one point;
there are several routes which H. pylori uses to infect humans. So far, the only place from where
cultivable H. pylori has been isolated is the gastrointestinal tract, which makes person-to-person the

Survival of drinking water pathogens after disinfection
30
favourite route. Person-to-person transmission routes include breastfeeding, gastro-oral, oral-oral,
faecal-oral and iatrogenic pathways. However food ingestion and zoonotic transmission are possible
as well. Table 1.8 summarizes the possible routes of transmission and respective pathways [19, 76,
99].
Table 1.8 Possible routes of transmission of H. pylori to humans.
Route of transmission Way of transmission
Person-to-person
Breastfeeding Mothers can pass to babies through their own milk, but is more probable that increases immunity in their kids
Oral-Oral Kissing, use of the same chopsticks, pre-masticated food
Faecal-oral Contact with faeces
Gastro-oral Contact with droplets of gastric juice during endoscopies, vomits and gastro-esophageal reflux
Iatrogenic Transmission through endoscopes
Water Ingestion of contaminated drinking water
Food Consumption of raw vegetables, milk and derivates, meat
Zoonotic Consumption of raw milk and meat, contact with animals
Source: [19, 76, 99]
The transmission through the ingestion of contaminated water is a possibility but despite all attempts it
has not been proved yet. Several authors have detected H. pylori DNA by PCR either in natural
reservoirs, in drinking water or associated biofilms [28, 43, 204, 222, 286] however it has been
demonstrated that detection by PCR overestimates the number of cells as it does not distinguish live
from dead cells [221] and therefore it is not accepted as proof that water is a route of transmission.
Other authors have also detected H. pylori cells in drinking water biofilms by the use of a H. pylori
specific PNA probe [39, 40] and therefore it is not accepted as proof that water is a route of
transmission. Other authors have also detected H. pylori cells in drinking water biofilms by the use of a
H. pylori specific PNA probe [180]. The main obstacle to prove that H. pylori is a waterborne pathogen
is the fact that cultivable H. pylori has never been recovered from drinking water and molecular
techniques are not accepted as they cannot prove that the H. pylori detected is viable. Nonetheless, it
has been shown that the coccoid form of H. pylori, the form that is commonly found in water, is the
environmental VBNC adaptation of this pathogen [18, 221] and that it is capable to recover and infect
mice [47, 257]. Moreover, epidemiological studies have successfully correlated the consumption of
water with the incidence of H. pylori [43, 123, 136, 142].

Background and Aims
31
1.5.4 Diseases, diagnosis and treatment
The incidence of H. pylori varies from country to country and also within the same country. Even in
countries with high incidence, such as Portugal, most people are actually asymptomatic and normally
remain untreated until symptoms appear. H. pylori positive tests represent, however, a risk of
development of peptic and duodenal ulcer disease, gastric B-cell mucosa associated lymphoid tissue
(MALT) lymphoma and other gastric carcinoma by inducing DNA damage in epithelial cells [81, 148].
Ironically, H. pylori seems to have a protective effect on gastro-esophagal reflux disease, Barret
esophagus and adenocarcinoma esophagus [31]. Some studies connect H. pylori with Crohn’s
disease, cardiovascular and obesity problems but they are not conclusive [162].
The diagnosis depends on clinical history, local availability and associated cost, and comprise invasive
(endoscopy and biopsy) and non-invasive techniques [73]. The invasive test consists of the detection
of the urease enzyme (urease test) and if positive needs to be confirmed by histological staining tests
or standard culture methods. Non-invasive tests include breath tests (a solution containing urea is
swallowed and the carbon dioxide in the breath is measured) and serological tests (detection of H.
pylori antibodies in the patient’s blood, serum, saliva or urine; nevertheless, this test does not
distinguish past from present infection) [73, 101, 280].
Whether asymptomatic patients should undergo treatment to eradicate H. pylori from the stomach is
subject to different opinions [86, 89]. While some physicians advise the eradication of this pathogen
upon detection, some others think that treatment should only be applied when symptoms appear. In
any case, the treatment consists of a triple or quadruple therapy, which includes a cocktail of two or
more antibiotics (clarithromycin, metronidazole, tetracycline or amoxycillin), Triple therapy consists in
the use a stomach lining shield (normally bismuth subsalicylate) or a proton pump inhibitor (cimetidine,
omeprazole) and two antibiotics. In quadruple treatment both stomach lining shield and proton pump
inhibitor are used in conjunction with two antibiotics [73, 95]. Several groups are at the moment trying
to develop a vaccine against H. pylori but there are no successful results up to the present date [3,
119, 130].
1.5.5 Predominance worldwide
H. pylori occurs worldwide and affects on average approximately 50% of the world population,
although the incidence has been decreasing in recent years [161, 227, 276]. Distribution appears to
have a higher incidence in undeveloped countries and a low incidence in developed countries (Figure
1.11); however in Portugal and Japan, ranked, respectively, as 29th and 8th in the Human Development
Index published by the United Nations Development Program [289] the incidence is higher than 80%
[19, 160]. The incidence of H. pylori in the same country also varies accordingly if it is a developed or
undeveloped country [214].
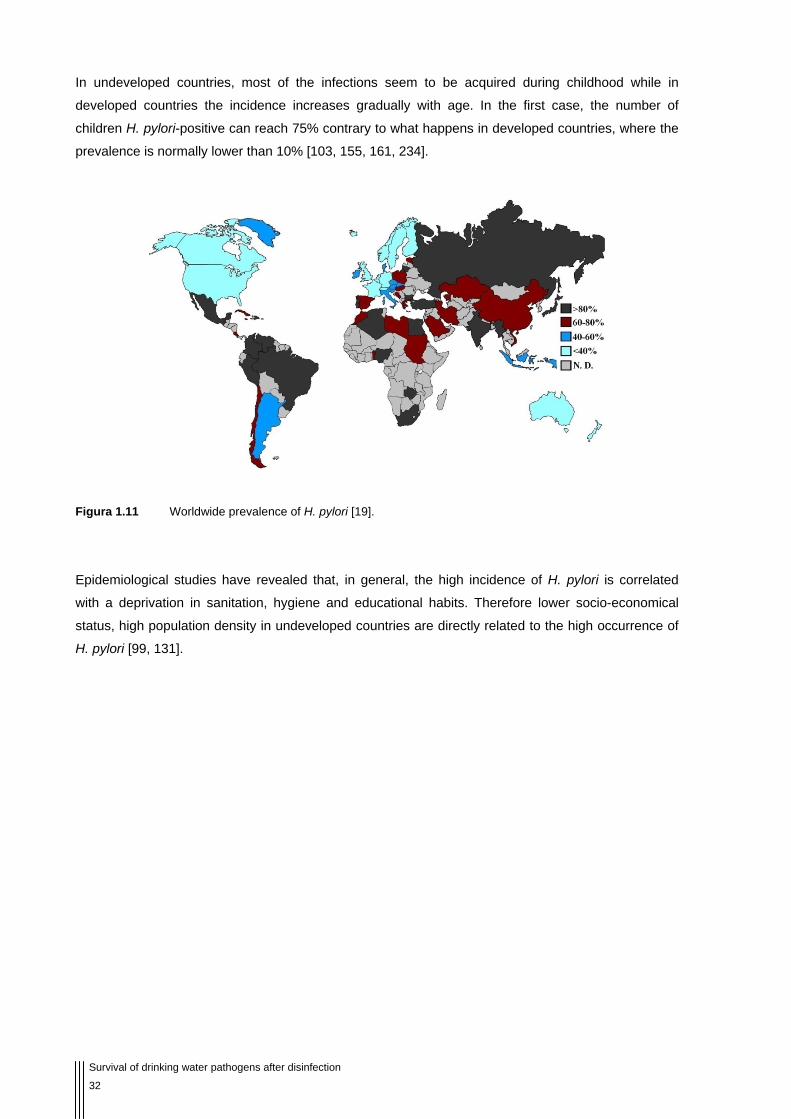
Survival of drinking water pathogens after disinfection
32
In undeveloped countries, most of the infections seem to be acquired during childhood while in
developed countries the incidence increases gradually with age. In the first case, the number of
children H. pylori-positive can reach 75% contrary to what happens in developed countries, where the
prevalence is normally lower than 10% [103, 155, 161, 234].
Figura 1.11 Worldwide prevalence of H. pylori [19].
Epidemiological studies have revealed that, in general, the high incidence of H. pylori is correlated
with a deprivation in sanitation, hygiene and educational habits. Therefore lower socio-economical
status, high population density in undeveloped countries are directly related to the high occurrence of
H. pylori [99, 131].

Background and Aims
33
1.6 Scope and purpose
As previously stated, water is a vehicle for the transmission of several pathogens and associated
diseases. One of these pathogens, transmitted by contaminated water, is L. pneumophila. As for H.
pylori, water might be one of the possible paths of transmission; evidence is very strong but it has not
been proved yet.
The understanding of the behaviour of these two pathogens in chlorinated water and in biofilms is
fundamental to the correct control of water quality. Therefore, in this work, research was undertaken to
gain a better understanding of the influence of chlorine in L. pneumophila and H. pylori cells in both
pure and suspended culture (as in heterotrophic biofilms) formed with microorganisms obtained from
Southampton tap water. A series of experiments without chlorine were also conducted to try to
highlight the role of several physico-chemical parameters in the inclusion and survival of these two
pathogens inside drinking water biofilms and the influence of specific heterotrophic bacteria on the
behaviour of these two pathogens in tap water and associated biofilms.
In this thesis the results are presented in the format of scientific papers, as they were submitted to
peer reviewed international journals.

Survival of drinking water pathogens after disinfection
34
1.7 References
1. Abu Kwaik, Y. 1996. The phagosome containing Legionella pneumophila within the
protozoan Hartmannella vermiformis is surrounded by the rough endoplasmic
reticulum. Applied Environmental Microbiology 62(6):2022-2028.
2. Addiss, D G, Davis, J P, Laventure, M, Wand, P J, Hutchmson, M A, and McKinney, R M. 1989. Community acquired Legionnaires' disease associated with a
cooling tower: Evidence for longer distance transport of Legionella pneumophila.
American Journal of Epidemiology 130(3):557-568.
3. Aebischer, T, Bumann, D, Epple, H-J, Metzger, W, Schneider, T, Cherepnev, G, Walduck, A K, Kunkel, D, Moos, V, Loddenkemper, C, Jiadze, I, Panasyuk, M, Stolte, M, Graham, D Y, Zeitz, M, and Meyer, T F. 2008. Correlation of T cell
response and bacterial clearance in human volunteers challenged with H. pylori
revealed by randomized controlled vaccination with Ty21a-based Salmonella
vaccines. Gut 57(1065-1072.
4. Ahmad, R. 2005. Flocculation In: J. H. Lehr and J. Keeley (ed.), Water
Encyclopedia: Domestic, municipal, and industrial water supply and waste disposal,
vol. I. John Wiley & Sons, Hoboken, New Jersey, pp. 252-254.
5. Ahmad, R. 2005. Gravity separation/sedimentation In: J. H. Lehr and J. Keeley (ed.),
Water Encyclopedia: Domestic, municipal, and industrial water supply and waste
disposal, vol. I. John Wiley & Sons, Hoboken, New Jersey, pp. 259-261.
6. Ahmad, R. 2005. Particulate matter removal by coagulation In: J. H. Lehr and J.
Keeley (ed.), Water Encyclopedia: Domestic, municipal, and industrial water supply
and waste disposal, vol. I. John Wiley & Sons, Hoboken, New Jersey, pp. 137-139.
7. Ahmad, R. 2005. Water filtration In: J. H. Lehr and J. Keeley (ed.), Water
Encyclopedia: Domestic, municipal, and industrial water supply and waste disposal,
vol. I. John Wiley & Sons, Hoboken, New Jersey, pp. 230-233.
8. Albert-Weissenberger, C, Cazalet, C, and Buchrieser, C. 2007. Legionella
pneumophila - a human pathogen that co-evolved with fresh water protozoa. Cellular
and Molecular Life Sciences 64(4):432-448.
9. Alliance for Environmental Technology. Chlorine and chlorine dioxide bleaching
chemistry. http://aet.org/science_of_ecf/eco_risk/rchlorine.html (Accessed
10. Alm, R A, and Noonan, B. 2001. The genome In: H. L. T. Mobley, G. L. Mendz, and
L. Hazell (ed.), Helicobacter pylori: Physiology and genetics. ASM Press, Washington
D.C., pp. 295-311.
Background and Aims
35
11. Amann, R, Fuchs, B M, and Behrens, S. 2001. The identification of microorganisms
by fluorescence in situ hybridisation. Current Opinion in Biotechnology 12(3):231-236.
12. Amann, R I, Ludwig, W, and Schleifer, K H. 1995. Phylogenetic identification and in
situ detection of individual microbial cells without cultivation. Microbiological Reviews
59(1):143-169.
13. American Public Health Association. 1998. Standard methods for the examination
of water and wastewater, In: L. S. Clesceri, A. E. Greenberg, and A. D. Eaton (ed.),
20th ed. American Public Health Association, American Water Works Association,
Water Environmental Federation, Washington DC. pp. 9.34-9.10
14. Andersen, L P, and Wadström, T. 2001. Basic bacteriology and culture In: H. L. T.
Mobley, G. L. Mendz, and L. Hazell (ed.), Helicobacter pylori: Physiology and
genetics. ASM Press, Washington D.C., pp. 27-51.
15. Anoxkaldnes. MBBR™ biofilm technology.
http://www.anoxkaldnes.com/Bilder/jpg/Prodc1r1sr1.jpg (Accessed on 29-06-2008).
16. Atlas, R M. 1999. Legionella: from environmental habitats to disease pathology,
detection and control. Environmental Microbiology 1(4):283-293.
17. Azadpour-Keeley, A, and Keeley, J W. 2005. Water and the history of man In: J. H.
Lehr and J. Keeley (ed.), Water Encyclopedia: Oceanography; meteorology; physics
and chemistry; water law; and water history, art, and culture, vol. IV. John Wiley &
Sons, Hoboken, New Jersey, pp. 745-746.
18. Azevedo, N F, Almeida, C, Cerqueira, L, Dias, S, Keevil, C W, and Vieira, M J. 2007. Coccoid form of Helicobacter pylori as a morphological manifestation of cell
adaptation to the environment. Applied and Environmental Microbiology 73(10):3423-
3427.
19. Azevedo, N F, Guimaraes, N, Figueiredo, C, Keevil, C W, and Vieira, M J. 2007. A
new model for the transmission of Helicobacter pylori: Role of environmental
reservoirs as gene pools to increase strain diversity. Critical Reviews in Microbiology
33(3):157 - 169.
20. Azevedo, N F, Pinto, A R, Reis, N M, Vieira, M J, and Keevil, C W. 2006. Shear
stress, temperature, and inoculation concentration influence the adhesion of water-
stressed Helicobacter pylori to stainless steel 304 and polypropylene. Applied and
Environmental Microbiology 72(4):2936-2941.
21. Azevedo, N F, Vieira, M J, and Keevil, C W. 2003. Development of peptide nucleic
acid probes to detect H. pylori in diverse species potable water biofilms In: A. McBain,
C. Allison, M. Brading, A. Rickard, J. Verran, and J. Walker (ed.), Biofilm
communities: Order from chaos? Bioline, Cardiff, pp. 231-239.

Survival of drinking water pathogens after disinfection
36
22. Bachmann, R T, and Edyvean, R G J. 2005. Biofouling: An historic and
contemporary review of its causes, consequences and control in drinking water
distribution systems. Biofilms 2(197-227.
23. Baffone, W, Casaroli, A, Citterio, B, Pierfelici, L, Campana, R, Vittoria, E, Guaglianone, E, and Donelli, G. 2006. Campylobacter jejuni loss of culturability in
aqueous microcosms and ability to resuscitate in a mouse model. International
Journal of Food Microbiology 107(1):83-91.
24. Baker, K H, Hegarty, J P, Redmond, B, Reed, N A, and Herson, D S. 2002. Effect
of oxidizing disinfectants (chlorine, monochloramine, and ozone) on Helicobacter
pylori. Applied and Environmental Microbiology 68(2):981-984.
25. Barbaree, J M, Fields, B S, Feeley, J C, Gorman, G W, and Martin, W T. 1986.
Isolation of protozoa from water associated with a legionellosis outbreak and
demonstration of intracellular multiplication of Legionella pneumophila. Applied and
Environmental Microbiology 51(2):422-424.
26. Barrette, W C, Albrich, J M, and Hurst, J K. 1987. Hypochlorous acid promoted
loss of metabolic energy in Escherichia coli. Infection and Immunity 55(10):2518-
2525.
27. Bellar, T A, Lichtenberg, J J, and Kroner, R C. 1974. Occurrence of organohalides
in chlorinated drinking waters. Journal American Water Works Association
66(12):703-706.
28. Benson, J A, Fode-Vaughan, K A, and Collins, M L P. 2004. Detection of
Helicobacter pylori in water by direct PCR. Letters in Applied Microbiology 39(3):221-
225.
29. Berk, S G, Ting, R S, Turner, G W, and Ashburn, R J. 1998. Production of
respirable vesicles containing live Legionella pneumophila cells by two
Acanthamoeba spp. Applied and Environmental Microbiology 64(1):279-286.
30. Besnard, V, Federighi, M, and Cappelier, J M. 2000. Evidence of viable but non-
culturable state in Listeria monocytogenes by direct viable count and CTC-DAPI
double staining. Food Microbiology 17(6):697-704.
31. Blaser, M J, and Atherton, J C. 2004. Helicobacter pylori persistence: biology and
disease. Journal of Clinical Investigation 113(3):321-333.
32. Block, S S. 2001. Definition of terms In: S. S. Block (ed.), Disinfection, sterilization,
and preservation, 5th ed. Lippincott Williams & Wilkins, Philadelphia, pp. 19-30.
33. Boe-Hansen, R, Albrechtsen, H-J, Arvin, E, and Jørgensen, C. 2002. Bulk water
phase and biofilm growth in drinking water at low nutrient conditions. Water Research
36(18):4477-4486.

Background and Aims
37
34. Bollin, G E, Plouffe, J F, Para, M F, and Hackman, B. 1985. Aerosols containing
Legionella pneumophila generated by shower heads and hot water faucets. Applied
and Environmental Microbiology 50(5):1128-1131.
35. Boorman, G A, Dellarco, V, Dunnick, J K, Chapin, R E, Hunter, S, Hauchman, F, Gardner, H, Cox, M, and Sills, R C. 1999. Drinking water disinfection byproducts:
Review and approach to toxicity evaluation. Environmental Health Perspectives
107(207-217.
36. Boulos, L, Prevost, M, Barbeau, B, Coallier, J, and Desjardins, R. 1999.
LIVE/DEAD(R) BacLight(TM): application of a new rapid staining method for direct
enumeration of viable and total bacteria in drinking water. Journal of Microbiological
Methods 37(1):77-86.
37. Bouyer, S, Imbert, C, Rodier, M H, and Hechard, Y. 2007. Long-term survival of
Legionella pneumophila associated with Acanthamoeba castellanii vesicles.
Environmental Microbiology 9(5):1341-1344.
38. Brading, M G, Jass, J, and Lappin-Scott, H M. 2003. Dynamics of biofilm formation
In: H. M. Lappin-Scott and J. W. Costerton (ed.), Microbial biofilms. Cambridge
University Press, Cambridge, pp. 46-63.
39. Bragança, S M, Azevedo, N F, Simões, L, Vieira, M J, and Keevil, C W. 2005.
Detection of H. pylori in biofilms formed in a real drinking water distribution system
using peptide nucleic acid fluorescence in situ hybridization In: A. McBain, C. Allison,
J. Pratten, D. Spratt, M. Upton, and J. Verran (ed.), Biofilms: Persistence and
ubiquity. Biofilm Club, Manchester, pp. 231-239.
40. Bragança, S M, Azevedo, N F, Simões, L C, Keevil, C W, and Vieira, M J. 2007.
Use of fluorescent in situ hybridisation for the visualisation of Helicobacter pylori in
real drinking water biofilms. Water Science and Technology 55(8):387-393.
41. Braux, A S, Minet, J, Tamanai-Shacoori, Z, Riou, G, and Cormier, M. 1997. Direct
enumeration of injured Escherichia coli cells harvested onto membrane filters. Journal
of Microbiological Methods 31(1-2):1-8.
42. Bryers, J D. 2000. Biofilm formation and persistence In: J. D. Bryers (ed.), Biofilms II
- Process analysis and applications. John Wiley & Sons, New York, pp. 45-88.
43. Bunn, J E G, Mackay, W G, Thomas, J E, Reid, D C, and Weaver, L T. 2002.
Detection of Helicobacter pylori DNA in drinking water biofilms: implications for
transmission in early life. Letters in Applied Microbiology 34(6):450-454.
44. Burgess, J G, Jordan, E M, Bregu, M, Mearns-Spragg, A, and Boyd, K G. 1999.
Microbial antagonism: a neglected avenue of natural products research. Journal of
Biotechnology 70(1-3):27-32.

Survival of drinking water pathogens after disinfection
38
45. Buswell, C M, Herlihy, Y M, Marsh, P D, Keevil, C W, and Leach, S A. 1997.
Coaggregation amongst aquatic biofilm bacteria. Journal of Applied Microbiology
83(4):477-484.
46. Cameron, D, and Jones, I G. 1983. John Snow, the Broad Street pump and modern
epidemiology. International Journal of Epidemiology 12(4):393-396.
47. Cellini, L, Di Campli, E, Grande, R, Di Bartolomeo, S, Prenna, M, Pasquantonio, M S, and Pane, L. 2005. Detection of Helicobacter pylori associated with
zooplankton. Aquatic Microbial Ecology 40(2):115-120.
48. Centre for Diesease Control and Prevention. Legionellosis resource site
(Legionnaires' disease and Pontiac fever).
http://www.cdc.gov/legionella/patient_facts.htm (Accessed on 10-06-2008).
49. Centre for Diesease Control and Prevention. Legionellosis resource site
(Legionnaires' disease and Pontiac fever). http://www.cdc.gov/legionella/index.htm
(Accessed on 13-06-2008).
50. Cerca, N, Pier, G B, Oliveira, R, and Azeredo, J. 2004. Comparative evaluation of
coagulase-negative staphylococci (CoNS) adherence to acrylic by a static method
and a parallel-plate flow dynamic method. Research in Microbiology 155(9):755-760.
51. Chambers, C W, and Clarke, N A. 1966. Control of bacteria in nondomestic water
supplies. Advances in Applied Microbiology 8(105-143.
52. Chandy, J P, and Angles, M L. 2001. Determination of nutrients limiting biofilm
formation and the subsequent impact on disinfectant decay. Water Research
35(11):2677-2682.
53. Characklis, W G, and Wilderer, P A. 1989. Structure and function of biofilms In: W.
G. Characklis and P. A. Wilderer (ed.), Structure and function of biofilms. John Wiley
& Sons, S. Bernhard, Dahlem Konferenzen, pp. 5-17.
54. Chavant, P, Martinie, B, Meylheuc, T, Bellon-Fontaine, M-N, and Hebraud, M. 2002. Listeria monocytogenes LO28: Surface physicochemical properties and ability
to form biofilms at different temperatures and growth phases. Applied and
Environmental Microbiology 68(2):728-737.
55. Chien, M C, Morozova, I, Shi, S D, Sheng, H T, Chen, J, Gomez, S M, Asamani,
G, Hill, K, Nuara, J, Feder, M, Rineer, J, Greenberg, J J, Steshenko, V, Park, S H, Zhao, B H, Teplitskaya, E, Edwards, J R, Pampou, S, Georghiou, A, Chou, I C, Iannuccilli, W, Ulz, M E, Kim, D H, Geringer-Sameth, A, Goldsberry, C, Morozov, P, Fischer, S G, Segal, G, Qu, X Y, Rzhetsky, A, Zhang, P S, Cayanis, E, De Jong, P J, Ju, J Y, Kalachikov, S, Shuman, H A, and Russo, J J. 2004. The
genomic sequence of the accidental pathogen Legionella pneumophila. Science
305(5692):1966-1968.

Background and Aims
39
56. Christensen, B B, Haagensen, J A J, Heydorn, A, and Molin, S. 2002. Metabolic
commensalism and competition in a two-species microbial consortium. Applied and
Environmental Microbiology 68(5):2495-2502.
57. Cianciotto, N P, and Fields, B S. 1992. Legionella pneumophila mip gene
potentiates intracellular infection of protozoa and human macrophages. Proceedings
of the National Academy of Sciences of the United States of America 89(11):5188-
5191.
58. Codony, F, Morato, J, and Mas, J. 2005. Role of discontinuous chlorination on
microbial production by drinking water biofilms. Water Research 39(9):1896-1906.
59. Codony, F, Morato, J, Ribas, F, and Mas, J D. 2002. Effect of chlorine,
biodegradable dissolved organic carbon and suspended bacteria on biofilm
development in drinking water systems. Journal of Basic Microbiology 42(5):311-319.
60. Committee on Economic Social and Cultural Rights. 2002. General Comment 15:
The right to water. http://www.citizen.org/documents/therightowater.pdf (Accessed on
22-05-2008).
61. Communicable Disease Surveillance Centre Northern Ireland. Reports of
legionellosis, Northern Ireland, 1995-2006.
http://www.cdscni.org.uk/surveillance/Respiratory/Legionnaires%27_Disease.htm
(Accessed on 13-06-2008).
62. Conserve Africa Foundation. http://www.conserveafrica.org.uk/ (Accessed on 20-
05-2008).
63. Csuros, M, and Csuros, C. 2000. Microorganisms in the environment In: M. Csuros
and C. Csuros (ed.), Microbiological examination of water and wastewater. Lewis
Publishers, Boca Raton, pp. 57-78.
64. Cunha, B A. 2003. Community-acquired pneumonia. Infections in Medicine 20(1):27-
30.
65. Cunliffe, D. 2007. Regulatory Aspects In: J. Bartram, Y. Chartier, J. V. Lee, K. Pond,
and S. Surman-Lee (ed.), Legionella and the prevention of legionellosis. WHO Press,
Geneva, pp. 161-174.
66. Daniel, F B, Schenck, K M, Mattox, J K, Lin, E L C, Haas, D L, and Pereira, M A. 1986. Genotoxic properties of haloacetonitriles: Drinking water by-products of
chlorine disinfection. Toxicological Sciences 6(3):447-453.
67. Daniels, R, Vanderleyden, J, and Michiels, J. 2004. Quorum sensing and swarming
migration in bacteria. FEMS Microbiology Reviews 28(3):261-289.
68. de Beer, D, Srinivasan, R, and Stewart, P S. 1994. Direct measurement of chlorine
penetration into biofilms during disinfection. Applied and Environmental Microbiology
60(12):4339-4344.
Survival of drinking water pathogens after disinfection
40
69. Demidov, V V, Potaman, V N, Frankkamenetskii, M D, Egholm, M, Buchard, O, Sonnichsen, S H, and Nielsen, P E. 1994. Stability of peptide nucleic acids in
human serum and cellular extracts. Biochemical Pharmacology 48(6):1310-1313.
70. Denyer, S P, and Stewart, G S A B. 1998. Mechanisms of action of disinfectants.
International Biodeterioration and Biodegradation 41(3-4):261-268.
71. Donlan, R M. 2002. Biofilms: Microbial life on surfaces. Emerging Infectious Diseases
8(9):881-890.
72. Dukan, S, and Touati, D. 1996. Hypochlorous acid stress in Escherichia coli:
resistance, DNA damage, and comparison with hydrogen peroxide stress. The
Journal of Bacteriology 178(21):6145-6150.
73. Dunn, B E, Cohen, H, and Blaser, M J. 1997. Helicobacter pylori. Clinical
Microbiology Reviews 10(4):720-&.
74. Dunnick, J K, and Melnick, R L. 1993. Assessment of the carcinogenic potential of
chlorinated water: Experimental studies of chlorine, chloramine, and trihalomethanes.
JNCI Journal of the National Cancer Institute 85(10):817-822.
75. Dunsmore, B C, Jacobsen, A, Hall-Stoodley, L, Bass, C J, Lappin-Scott, H M, and Stoodley, P. 2002. The influence of fluid shear on the structure and material
properties of sulphate-reducing bacterial biofilms. Journal of Industrial Microbiology
and Biotechnology 29(6):347-353.
76. Duynhoven, Y T H P, and de Jonge, R. 2001. Transmission of Helicobacter pylori: a
role for food? Bulletin of the World Health Organization 79(5):455-460.
77. Edelstein, P H. 1982. Comparative study of selective media for isolation of
Legionella pneumophila from potable water. Journal of Clinical Microbiology
16(4):697-699.
78. Emtiazi, F, Schwartz, T, Marten, S M, Krolla-Sidenstein, P, and Obst, U. 2004.
Investigation of natural biofilms formed during the production of drinking water from
surface water embankment filtration. Water Research 38(5):1197-1206.
79. European Working Group for Legionella Infections (EWGLI), European Surveillance Scheme for Travel Associated Legionnaires' Disease (EWGLINET). 2005. European guidelines for control and prevention of travel associated
Legionnaires’ disease.
http://www.ewgli.org/data/european_guidelines/european_guidelines_jan05.pdf
(Accessed 13-06-2008).
80. European Working Group for Legionella Infections (EWGLI). Cases by year of
onset and country of report.
http://www.ewgli.org/data/data_tables/year_onset_country_report.asp (Accessed on
13-06-2008).

Background and Aims
41
81. Farinha, P, and Gascoyne, R D. 2005. Helicobacter pylori and MALT Lymphoma.
Gastroenterology 128(6):1579-1605.
82. Fayer, R. 2004. Cryptosporidium: a waterborne zoonotic parasite. Veterinary
Parasitology 126(1-2):37-56.
83. Fields, B S, Benson, R F, and Besser, R E. 2002. Legionella and Legionnaires'
disease: 25 years of investigation. Clinical Microbiology Reviews 15(3):506-+.
84. Flemming, H C. 1996. Economical and technical overview In: E. Heitz, H. C.
Flemming, and W. Sand (ed.), Microbially influenced corrosion of materials: scientific
and engineering aspects. Springer, Berlin, pp. 6-14.
85. Ford, T E. 1999. Microbiological safety of drinking water: United States and global
perspectives. Environmental Health Perspectives 107(191-206.
86. Fox, J G, and Wang, T C. 2001. Helicobacter pylori - not a good bug after all. New
England Journal of Medicine 345(11):829-832.
87. Fraser, D W. 2005. The challenges were legion. Lancet Infectious Diseases
5(4):237-241.
88. Freter, R, Gingell, D, Jones, G W, Mutter, P R, and Dazzo, F B. 1984.
Mechanisms of adhesion In: K. C. Marshall (ed.), Microbial adhesion and
aggregation. Springer, Verlag, Berlin, pp. 5-19.
89. Fuccio, L, Zagari, R M, Minardi, M E, and Bazzoli, F. 2007. Systematic review:
Helicobacter pylori eradication for the prevention of gastric cancer. Alimentary
Pharmacology and Therapeutics 25(2):133-141.
90. Fux, C A, Costerton, J W, Stewart, P S, and Stoodley, P. 2005. Survival strategies
of infectious biofilms. Trends in Microbiology 13(1):34-40.
91. Gabrielson, J, Hart, M, Jarelov, A, Kuhn, I, McKenzie, D, and Mollby, R. 2002.
Evaluation of redox indicators and the use of digital scanners and spectrophotometer
for quantification of microbial growth in microplates. Journal of Microbiological
Methods 50(1):63-73.
92. Gadgil, A. 1998. Drinking water in developing countries. Annual Review of Energy
and the Environment 23(1):253-286.
93. Gantzer, C J, Cunningham, A B, Gujer, W, Gutekunst, B, Heijnen, J J, Lightfoot,
E N, Odham, G, Rittmann, B E, Rosenberg, E, Stolzenbach, K D, and Zehnder, A J B. 1989. Exchange processes at the fluid biofilm interface In: W. G. Characklis and
P. A. Wilderer (ed.), Structure and function of biofilms. John Wiley & Sons, S.
Bernhard, Dahlem Konferenzen, pp. 73-89.
94. Garcia, M T, Jones, S, Pelaz, C, Millar, R D, and Abu Kwaik, Y. 2007.
Acanthamoeba polyphaga resuscitates viable non-culturable Legionella pneumophila
after disinfection. Environmental Microbiology 9(5):1267-1277.

Survival of drinking water pathogens after disinfection
42
95. Gerrits, M M, van Vliet, A H M, Kuipers, E J, and Kusters, J G. 2006. Helicobacter
pylori and antimicrobial resistance: Molecular mechanisms and clinical implications.
The Lancet Infectious Diseases 6(11):699-709.
96. Giao, M S, Montenegro, M I, and Vieira, M J. 2005. The influence of. hydrogen
bubble formation on the removal of Pseudomonas fluorescens biofilms from platinum
electrode surfaces. Process Biochemistry 40(5):1815-1821.
97. Gilbert, P, and McBain, A J. 2001. Biocide usage in the domestic setting and
concern about antibacterial and antibiotic resistance. Journal of Infection 43(1):85-91.
98. Glasmacher, A, Engelhart, S, and Exner, M. 2003. Infections from HPC organisms
in drinking-water amongst the immunocompromised In: J. Bartram, J. Cotruvo, M.
Exner, C. Fricker, and A. Glasmacher (ed.), Heterotrophic plate counts and drinking
water safety: The significance of HPCs for water quality and human health. IWA
Publishing on behalf of the World Health Organization, London, pp. 137-145.
99. Gomes, B C, and Martinis, E C P. 2004. The significance of Helicobacter pylori in
water, food and environmental samples. Food Control 15(5):397-403.
100. Goodwin, C S, Armstrong, J A, Chilvers, T, Peters, M, Collins, M D, Sly, L, Mcconnell, W, and Harper, W E S. 1989. Transfer of Campylobacter pylori and
Campylobacter mustelae to Helicobacter gen. nov. as Helicobacter pylori comb. nov.
and Helicobacter mustelae comb. nov., respectively. International Journal of
Systematic Bacteriology 39(4):397-405.
101. Graham, D Y, and Qureshi, W A. 2001. Markers of infection In: H. L. T. Mobley, G.
L. Mendz, and L. Hazell (ed.), Helicobacter pylori: Physiology and genetics. ASM
Press, Washington D.C., pp. 499-510.
102. Greub, G, and Raoult, D. 2004. Microorganisms resistant to free-living amoebae.
Clinical Microbiology Reviews 17(2):413-433.
103. Grimm, W, and Fischbach, W. 2003. Helicobacter pylori infection in children and
juveniles: an epidemiological study on prevalence, socio-economic factors and
symptoms. Deutsche Medizinische Wochenschrift 128(37):1878-1883.
104. Guisepi, R A. 2003. Ancient Sumeria. http://history-world.org/sumeria.htm
(Accessed on 13-06-2008).
105. Hall-Stoodley, L, and Stoodley, P. 2005. Biofilm formation and dispersal and the
transmission of human pathogens. Trends in Microbiology 13(1):7-10.
106. HC Information Resources Inc. http://www.hcinfo.com/outbreaks-news.htm
(Accessed on 11-06-2008).
107. Health Protection Agency. Legionnaires' disease in residents of England and
Wales - cases and deaths by sex, 1980 - 2007.
http://www.hpa.org.uk/webw/HPAweb&HPAwebStandard/HPAweb_C/119573377819
6?p=1191942128217 (Accessed on 13-06-2008).

Background and Aims
43
108. Health Protection Agency. 2006. National standard method: Detection and
enumeration of Legionella species by filtration and centrifugation. http://www.hpa-
standardmethods.org.uk/documents/water/pdf/w12.pdf (Accessed on 13-06-2008).
109. Health Protection Agency. 2006. National standard method: Detection of
Salmonella species. http://www.hpa-
standardmethods.org.uk/documents/water/pdf/W7.pdf (Accessed on 13-06-2008).
110. Health Protection Agency. 2006. National standard method: Enumeration of
coliform bacteria and Escherichia coli by membrane filtration. http://www.hpa-
standardmethods.org.uk/documents/water/pdf/w2.pdf (Accessed on 13-06-2008).
111. Health Protection Agency. 2007. National standard method: Detection of
Campylobacter species in water. http://www.hpa-
standardmethods.org.uk/documents/water/pdf/w8.pdf (Accessed on 13-06-2008).
112. Health Protection Agency. 2007. National standard method: Enumeration of
Pseudomonas aeruginosa by membrane filtration. http://www.hpa-
standardmethods.org.uk/documents/water/pdf/w6.pdf (Accessed on 13-06-2008).
113. Health and Safety Commission. 2000. Legionnaires' disease: The control of
Legionella bacteria in water systems. Approved code of practice and guidance. HSE
Books, Norwich.
114. Health Protection Scotland. 2007. HPS weekly report.
http://www.documents.hps.scot.nhs.uk/ewr/pdf2007/0732.pdf (Accessed on 13-06-
2008).
115. Hegarty, J P, Dowd, M T, and Baker, K H. 1999. Occurrence of Helicobacter pylori
in surface water in the United States. Journal of Applied Microbiology 87(5):697-701.
116. Henrici, A T. 1933. Studies of freshwater bacteria: I. A direct microscopic technique.
Journal of Bacteriology 25(3):277-287.
117. Hiisvirta, L, Kruithof, J C, and van Puffelen, J. 1994. Disinfection and disinfection
by-products. Water Supply 12(1-2):IR6.1–IR6.7.
118. Hlady, W G, Mullen, R C, Mintz, C S, Shelton, B G, Hopkins, R S, and Daikos, G L. 1993. Outbreak of Legionnaires' disease linked to a decorative fountain by
molecular epidemiology. American Journal of Epidemiology 138(8):555-562.
119. Hoffelner, H, Rieder, G, and Haas, R. 2008. Helicobacter pylori vaccine
development: Optimisation of strategies and importance of challenging strain and
animal model. International Journal of Medical Microbiology 298(1-2):151-159.
120. Hoge, C W, and Breiman, R F. 1991. Advances in the epidemiology and control of
Legionella infections. Epidemiologic Reviews 13(1):329-340.
121. Horn, H, Reiff, H, and Morgenroth, E. 2003. Simulation of growth and detachment in
biofilm systems under defined hydrodynamic conditions. Biotechnology and
Bioengineering 81(5):607-617.

Survival of drinking water pathogens after disinfection
44
122. Huang, C T, Yu, F P, McFeters, G A, and Stewart, P S. 1995. Nonuniform spatial
patterns of respiratory activity within biofilms during disinfection. Applied and
Environmental Microbiology 61(6):2252-2256.
123. Hulten, K, Han, S W, Enroth, H, Klein, P D, Opekun, A R, Gilman, R H, Evans, D G, Engstrand, L, Graham, D Y, and El-Zaatari, F A. 1996. Helicobacter pylori in the
drinking water in Peru. Gastroenterology 110(4):1031-1035.
124. Hussong, D, Colwell, R R, O'Brien, M, Weiss, E, Pearson, A D, Weiner, R M, and Burge, W D. 1987. Viable Legionella pneumophila not detectable by culture on agar
media. Nature Biotechnology 5(9):947-950.
125. Hydrosmart. http://www.hydrosmart.com.au/images/b4a_norsky_b4.jpg (Accessed
on 29-06-2008).
126. Ireland, C D S C N. Reports of Legionellosis, Northern Ireland, 1995-2006.
http://www.cdscni.org.uk/surveillance/Respiratory/Legionnaires%27_Disease.htm
(Accessed on 13-06-2008).
127. James, B W, Mauchline, W S, Fitzgeorge, R B, Dennis, P J, and Keevil, C W. 1995. Influence of iron limited continuous culture on physiology and virulence of
Legionella pneumophila. Infection and Immunity 63(11):4224-4230.
128. Jang, A, Bishop, P L, Okabe, S, Lee, S G, and Kim, I S. 2003. Effect of dissolved
oxygen concentration on the biofilm and in situ analysis by fluorescence in situ
hybridization (FISH) and microelectrodes. Water Science and Technology 47(1):49-
57.
129. Jefferson, K K. 2004. What drives bacteria to produce a biofilm? Fems Microbiology
Letters 236(2):163-173.
130. Jeremy, A H T, Du, Y, Dixon, M F, Robinson, P A, and Crabtree, J E. 2006.
Protection against Helicobacter pylori infection in the mongolian gerbil after
prophylactic vaccination. Microbes and Infection 8(2):340-346.
131. Jiménez-Guerra, F, Shetty, P, and Kurpad, A. 2000. Prevalence of and risk factors
for Helicobacter pylori infection in school children in Mexico. Annals of Epidemiology
10(7):474-474.
132. Jolivet-Gougeon, A, Sauvager, F, Bonnaure-Mallet, M, Colwell, R R, and Cormier, M. 2006. Virulence of viable but nonculturable S. Typhimurium LT2 after
peracetic acid treatment. International Journal of Food Microbiology 112(2):147-152.
133. Jong-Wook, L. 2004. World Health Organization water, sanitation and hygiene links
to health: Facts and figures.
http://www.who.int/water_sanitation_health/factsfigures2005.pdf (Accessed on 22-05-
2008).
134. Joux, F, and Lebaron, P. 2000. Use of fluorescent probes to assess physiological
functions of bacteriaat single-cell level. Microbes and Infection 2(12):1523-1535.
Background and Aims
45
135. Juhna, T, Birzniece, D, Larsson, S, Zulenkovs, D, Sharipo, A, Azevedo, N F, Menard-Szczebara, F, Castagnet, S, Feliers, C, and Keevil, C W. 2007. Detection
of Escherichia coli in biofilms from pipe samples and coupons in drinking water
distribution networks. Applied and Environmental Microbiology 73(22):7456-7464.
136. Karita, M, Teramukai, S, and Matsumoto, S. 2003. Risk of Helicobacter pylori
transmission from drinking well water is higher than that from infected intrafamilial
members in Japan. Digestive Diseases and Sciences 48(6):1062-1067.
137. Kaufmann, A F, McDade, J E, Patton, C M, Bennett, J V, Skaliy, P, Feeley, J C, Anderson, D C, Potter, M E, Newhouse, V F, Gregg, M B, and Brachman, P S. 1981. Pontiac fever: Isolation of etiologic agent (Legionella pneumophila) and
demonstration of its mode of transmission. American Journal of Epidemiology
114(3):337-347.
138. Keinanen, M M, Korhonen, L K, Lehtola, M J, Miettinen, I T, Martikainen, P J, Vartiainen, T, and Suutari, M H. 2002. The microbial community structure of drinking
water biofilms can be affected by phosphorus availability. Applied and Environmental
Microbiology 68(1):434-439.
139. Kenoyer, J M, and Meadow, R H. 1999. The latest discoveries: Harappa 1995-98.
http://www.harappa.com/indus2/gif/oldworld.jpg (Accessed
140. Kerr, C J, Osborn, K S, Rickard, A H, Robson, G D, and Handley, P S. 2003.
Biofilms in water distribution systems In: D. Mara and N. Horan (ed.), The handbook
of water and wastewater microbiology. Academic Press, London, pp. 757-775.
141. Kerr, C J, Osborn, K S, Roboson, G D, and Handley, P S. 1999. The relationship
between pipe material and biofilm formation in a laboratory model system. Journal of
Applied Microbiology 85(29s-38s.
142. Klein, P D, Graham, D Y, Gaillour, A, Opekun, A R, and Smith, E O. 1991. Water
source as risk factor for Helicobacter pylori infection in Peruvian children. Lancet
337(8756):1503-1506.
143. Klont, R R, Rijs, A J M, Warris, A, Sturm, P D J, Melchers, W J G, and Verweij, P E. 2006. Legionella pneumophila in commercial bottled mineral water. FEMS
Immunology and Medical Microbiology 47(1):42-44.
144. Koch, R. 1884. An address on cholera and its bacillus. British Medical Journal 2(453-
459.
145. Kreft, J U. 2004. Biofilms promote altruism. Microbiology 150(2751-2760.
146. Kuchta, J M, States, S J, McNamara, A M, Wadowsky, R M, and Yee, R B. 1983.
Susceptibility of Legionella pneumophila to chlorine in tap water. Applied and
Environmental Microbiology 46(5):1134-1139.

Survival of drinking water pathogens after disinfection
46
147. Kusnetsov, J M, Ottoila, E, and Martikainen, P J. 1996. Growth, respiration and
survival of Legionella pneumophila at high temperatures. Journal of Applied
Bacteriology 81(341-347.
148. Ladeira, M S P, Rodrigues, M A M, Salvadori, D M F, Queiroz, D M M, and Freire-Maia, D V. 2004. DNA damage in patients infected by Helicobacter pylori. Cancer
Epidemiology Biomarkers and Prevention 13(4):631-637.
149. Le Dantec, C, Duguet, J P, Montiel, A, Dumoutier, N, Dubrou, S, and Vincent, V. 2002. Chlorine disinfection of atypical mycobacteria isolated from a water distribution
system. Applied and Environmental Microbiology 68(3):1025-1032.
150. LeChevallier, M W, Cawthon, C D, and Lee, R G. 1988. Inactivation of biofilm
bacteria. Applied and Environmental Microbiology 54(10):2492-2499.
151. LeChevallier, M W, Cawthon, C D, and Lee, R G. 1988. Factors promoting survival
of bacteria in chlorinated water supplies. Applied and Environmental Microbiology
54(3):649-654.
152. Leclerc, H, Schwartzbrod, L, and Dei-Cas, E. 2002. Microbial agents associated
with waterborne diseases. Critical Reviews in Microbiology 28(4):371-409.
153. Lehtola, M J, Torvinen, E, Miettinen, L T, and Keevil, C W. 2006. Fluorescence in
situ hybridization using peptide nucleic acid probes for rapid detection of
Mycobacterium avium subsp avium and Mycobacterium avium subsp
paratuberculosis in potable water biofilms. Applied and Environmental Microbiology
72(1):848-853.
154. Lewis, K. 2001. Riddle of biofilm resistance. Antimicrobial Agents and Chemotherapy
45(4):999-1007.
155. Lindkvist, P, Asrat, D, Nilsson, I, Tsega, E, Olsson, G L, Wretlind, B, and Giesecke, J. 1996. Age at acquisition of Helicobacter pylori infection: Comparison of
a high and a low prevalence country. Scandinavian Journal of Infectious Diseases
28(2):181 - 184.
156. Lisle, J T, Broadaway, S C, Prescott, A M, Pyle, B H, Fricker, C, and McFeters, G A. 1998. Effects of starvation on physiological activity and chlorine disinfection
resistance in Escherichia coli O157:H7. Applied and Environmental Microbiology
64(12):4658-4662.
157. Lisle, J T, Pyle, B H, and McFeters, G A. 1999. The use of multiple indices of
physiological activity to access viability in chlorine disinfected Escherichia coli O157 :
H7. Letters in Applied Microbiology 29(1):42-47.
158. Lück, P C. 2008. Diagnostics and clinical disease treatment In: K. Heuner and M.
Swanson (ed.), Legionella: Molecular microbiology Horizon Scientific Press, Norwich,
pp. 19-34.

Background and Aims
47
159. Lund, V, and Ormerod, K. 1995. The influence of disinfection processes on biofilm
formation in water distribution systems. Water Research 29(4):1013-1021.
160. Lunet, N, and Barros, H. 2003. Helicobacter pylori infection and gastric cancer:
Facing the enigmas. International Journal of Cancer 106(6):953-960.
161. Malaty, H M. 2007. Epidemiology of Helicobacter pylori infection. Best Practice &
Research Clinical Gastroenterology 21(2):205-214.
162. Man, S M, Zhang, L, Day, A S, Leach, S, and Mitchell, H. 2008. Detection of
enterohepatic and gastric Helicobacter species in fecal specimens of children with
Crohn's disease. Helicobacter 13(4):234-238.
163. Manz, W, Wendt-Potthoff, K, Neu, T R, Szewzyk, U, and Lawrence, J R. 1999.
Phylogenetic composition, spatial structure, and dynamics of lotic bacterial biofilms
investigated by fluorescent in situ hybridization and confocal laser scanning
microscopy. Microbial Ecology 37(4):225-237.
164. Marks, W E. 2005. Our evolving water consciousness In: J. H. Lehr and J. Keeley
(ed.), Water Encyclopedia: Oceanography; meteorology; physics and chemistry;
water law; and water history, art, and culture, vol. IV. John Wiley & Sons, Hoboken,
New Jersey, pp. 707-713.
165. Marshall, B J. 2001. One hundred years of discovery and rediscovery of
Helicobacter pylori and its association with peptic ulcer disease In: H. L. T. Mobley,
G. L. Mendz, and L. Hazell (ed.), Helicobacter pylori: Physiology and genetics. ASM
Press, Washington D.C., pp. 19-24.
166. Marston, B J, Lipman, H B, and Breiman, R F. 1994. Surveillance for Legionnaires'
disease. Risk factors for morbidity and mortality. Archives of Internal Medicine
154(21):2417-2422.
167. Maukonen, J, Mattila-Sandholm, T, and Wirtanen, G. 2000. Metabolic indicators for
assessing bacterial viability in hygiene sampling using cells in suspension and
swabbed biofilm. Food Science and Technology 33(3):225-233.
168. McDade, J E, Brenner, D J, and Bozeman, F M. 1979. Legionnaires disease
bacterium isolated in 1947. Annals of Internal Medicine 90(4):659-661.
169. McDade, J E, Shepard, C C, Fraser, D W, Tsai, T R, Redus, M A, and Dowdle, W R. 1977. Legionnaires' disease - isolation of a bacterium and demonstration of its role
in other respiratory disease. New England Journal of Medicine 297(22):1197-1203.
170. McDonnell, G, and Russell, A D. 1999. Antiseptics and disinfectants: Activity,
action, and resistance. Clinical Microbiology Reviews 12(1):147-179.
171. McDougald, D, Rice, S A, Weichart, D, and Kjelleberg, S. 1998. Nonculturability:
adaptation or debilitation? Fems Microbiology Ecology 25(1):1-9.

Survival of drinking water pathogens after disinfection
48
172. McFeters, G A, Bazin, M J, Bryers, J D, and Caldwell, D E. 1984. Biofilm
development and its consequences In: K. C. Marshall (ed.), Microbial Adhesion and
Aggregation. Springer, Verlag, Berlin, pp. 109-204.
173. McKenna, S M, and Davies, K J A. 1988. The inhibition of bacterial growth by
hypochlorous acid possible role in the bactericidal activity of phagocytes. Biochemical
Journal 254(3):685-692.
174. Melo, L F, and Bott, T R. 1997. Biofouling in water systems. Experimental Thermal
and Fluid Science 14(375-381.
175. Meyer, R D. 1991. Rote of the quinolones in the treatment of legionellosis. Journal of
Antimicrobial Chemotherapy 28(5):623-625.
176. Mir, J, Morato, J, and Ribas, F. 1997. Resistance to chlorine of freshwater bacterial
strains. Journal of Applied Microbiology 82(1):7-18.
177. Molmeret, M, Bitar, D M, Han, L H, and bu Kwaik, Y. 2004. Cell biology of the
intracellular infection by Legionella pneumophila. Microbes and Infection 6(1):129-
139.
178. Momba, M N B, Kfir, R, Venter, S N, and Cloete, T E. 2000. An overview of biofilm
formation in distribution systems and its impact on the deterioration of water quality.
Water Sa 26(1):59-66.
179. Morató, J, Mir, J, Codony, F, Mas, J, and Ribas, F. 2003. Microbial response to
disinfectants In: D. Mara and N. Horan (ed.), The handbook of water and wastewater
microbiology. Academic Press, London, pp. 657-693.
180. Moreno, Y, Ferrus, M A, Alonso, J L, Jimenez, A, and Hernandez, J. 2003. Use of
fluorescent in situ hybridization to evidence the presence of Helicobacter pylori in
water. Water Research 37(9):2251-2256.
181. Mountain Empire Community College. Water/wastewater distance learning:
chlorination chemistry. http://water.me.vccs.edu/concepts/chlorchemistry.html
(Accessed 29-06-2008)
182. Murdoch, D R. 2003. Diagnosis of Legionella infection. Clinical Infectious Diseases
36(1):64.
183. Murga, R, Forster, T S, Brown, E, Pruckler, J M, Fields, B S, and Donlan, R M. 2001. Role of biofilms in the survival of Legionella pneumophila in a model potable
water system. Microbiology 147(3121-3126.
184. National Drinkind Water. 2005. Disinfection In: J. H. Lehr and J. Keeley (ed.),
Water Encyclopedia: Domestic, municipal, and industrial water supply and waste
disposal, vol. I. John Wiley & Sons, Hoboken, New Jersey, pp. 196-200.
185. National Drinkind Water. 2005. Filtration In: J. H. Lehr and J. Keeley (ed.), Water
Encyclopedia: Domestic, municipal, and industrial water supply and waste disposal,
vol. I. John Wiley & Sons, Hoboken, New Jersey, pp. 227-230.

Background and Aims
49
186. Ndiongue, S, Huck, P M, and Slawson, R M. 2005. Effects of temperature and
biodegradable organic matter on control of biofilms by free chlorine in a model
drinking water distribution system. Water Research 39(6):953-964.
187. Newsome, A L, Baker, R L, Miller, R D, and Arnold, R R. 1985. Interactions
between Naegleria fowleri and Legionella pneumophila. Infection and Immunity
50(2):449-452.
188. Nguyen, T, and De Silva, S. 2006. Freshwater finfish biodiversity and conservation:
an asian perspective. Biodiversity and Conservation 15(11):3543-3568.
189. Nicolaidis, S. 1998. Physiology of thirst In: M. J. Arnaud (ed.), Hydration throughout
life. John Libbey Eurotext, Montrouge, pp. 3-8.
190. Nielsen, A T, Tolker-Nielsen, T, Barken, K B, and Molin, S. 2000. Role of
commensal relationships on the spatial structure of a surface attached microbial
consortium. Environmental Microbiology 2(1):59-68.
191. Nielsen, P E, Egholm, M, Berg, R H, and Buchardt, O. 1991. Sequence-selective
recognition of DNA by strand displacement with a thymine substituted polyamide.
Science 254(5037):1497-1500.
192. Nikolaou, A D, Golfinopoulos, S K, Arhonditsis, G B, Kolovoyiannis, V, and Lekkas, T D. 2004. Modeling the formation of chlorination by-products in river waters
with different quality. Chemosphere 55(3):409-420.
193. Niquette, P, Servais, P, and Savoir, R. 2000. Impacts of pipe materials on densities
of fixed bacterial biomass in a drinking water distribution system. Water Research
34(6):1952-1956.
194. Northumbrian Water. http://www.nwl.co.uk/Inyourhome.aspx (Accessed on 20-05-
2008).
195. Nwachcuku, N, and Gerba, C P. 2004. Emerging waterborne pathogens: can we kill
them all? Current Opinion in Biotechnology 15(3):175-180.
196. O'Toole, G, Kaplan, H B, and Kolter, R. 2000. Biofilm formation as microbial
development. Annual Review of Microbiology 54(49-79.
197. Oliveira, D R. 1992. Physico-chemical aspects of adhesion In: L. F. Melo, T. R. Bott,
M. Fletcher, and B. Capdeville (ed.), Biofilms - science and technology. Kluwer
Academic Publishers, Dordrecht, pp. 45-58.
198. Oliveira, F R, Silveira, A A, Gomes, T L, Silva, S A, and Galvão, D M. 2004. O
sistema de captação, tratamento e distribuição de água em Barretos.
http://www.cdcc.sc.usp.br/ciencia/artigos/art_28/aguaimagem/estacao.jpg (Accessed
on 20-05-2008).
199. Oliver, J D. 2005. The viable but nonculturable state in bacteria. Journal of
Microbiology 43(93-100.

Survival of drinking water pathogens after disinfection
50
200. Oliver, J D. 1993. Formation of viable but nonculturable cells In: S. Kjelleberg (ed.),
Starvation in bacteria. Plenum Press, New York, pp. 239-272.
201. Ortega, Y R, and Adam, R D. 1997. Giardia: Overview and update. Clinical
Infectious Diseases 25(3):545-549.
202. Overman, P R. 2000. Biofilm: a new view of plaque. The Journal of a Contemporary
Dental Practice 1(3):1-8.
203. Paneth, N. 2004. Assessing the contributions of John Snow to epidemiology - 150
years after removal of the Broad Street pump handle. Epidemiology 15(5):514-516.
204. Park, S R, Mackay, W G, and Reid, D C. 2001. Helicobacter sp recovered from
drinking water biofilm sampled from a water distribution system. Water Research
35(6):1624-1626.
205. Parsek, M R, and Greenberg, E P. 2005. Sociomicrobiology: the connections
between quorum sensing and biofilms. Trends in Microbiology 13(1):27-33.
206. Parsek, M R, and Singh, P K. 2003. Bacterial biofilms: An emerging link to disease
pathogenesis. Annual Review of Microbiology 57(1):677-701.
207. Pasculle, W. 2000. Update on Legionella. Clinical Microbiology Newsletter
22(13):97-101.
208. Payment, P. 1999. Poor efficacy of residual chlorine disinfectant in drinking water to
inactivate waterborne pathogens in distribution systems. Canadian Journal of
Microbiology 45(8):709-715.
209. Payment, P, Franco, E, and Siemiatycki, J. 1993. Absence of relationship between
health effects due to tap water consumption and drinking water quality parameters.
Water Science and Technology 27(3-4):137-143.
210. Payment, P, and Robertson, W. 2003. The microbiology of piped distribution
systems and public health In: R. Ainsworth (ed.), Safe piped water: Managing
microbial water quality in piped distribution systems IWA Publishing on behalf of
World Health Organization, London, pp. 1-18.
211. Payment, P, Sartory, D P, and Reasoner, D J. 2003. The history and use of HPC in
drinking water quality management In: J. Bartram, J. Cotruvo, M. Exner, C. Fricker,
and A. Glasmacher (ed.), Heterotrophic plate counts and drinking water safety: The
significance of hpcs for water quality and human health. IWA Publishing on behalf of
the World Health Organization, London, pp. 20-48.
212. Pereira, M O. 2001. Comparação da eficácia de dois biocidas (carbamato e
glutaraldeído) em sistemas de biofilme. Universidade do Minho, Braga.
213. Pereira, M O, Morin, P, Vieira, M J, and Melo, L F. 2002. A versatile reactor for
continuous monitoring of biofilm properties in laboratory and industrial conditions.
Letters in Applied Microbiology 34(1):22-26.
Background and Aims
51
214. Perez-Perez, G I, Rothenbacher, D, and Brenner, H. 2004. Epidemiology of
Helicobacter pylori infection. Helicobacter 9(s1):1-6.
215. Perry-O'Keefe, H, Rigby, S, Oliveira, K, Sørensen, D, Stender, H, Coull, J, and Hyldig-Nielsen, J J. 2001. Identification of indicator microorganisms using a
standardized PNA FISH method. Journal of Microbiological Methods 47(3):281-292.
216. Petts, G. 2005. Water in history In: J. H. Lehr and J. Keeley (ed.), Water
Encyclopedia: Oceanography; meteorology; physics and chemistry; water law; and
water history, art, and culture, vol. IV. John Wiley & Sons, Hoboken, New Jersey, pp.
726-731.
217. Phe, M H, Dossot, M, and Block, J C. 2004. Chlorination effect on the fluorescence
of nucleic acid staining dyes. Water Research 38(17):3729-3737.
218. Phe, M H, Dossot, M, Guilloteau, H, and Block, J C. 2005. Nucleic acid
fluorochromes and flow cytometry prove useful in assessing the effect of chlorination
on drinking water bacteria. Water Research 39(15):3618-3628.
219. Pommepuy, M, Butin, M, Derrien, A, Gourmelon, M, Colwell, R R, and Cormier, M. 1996. Retention of enteropathogenicity by viable but nonculturable Escherichia
coli exposed to seawater and sunlight. Applied and Environmental Microbiology
62(12):4621-4626.
220. Pyle, B H, Broadaway, S C, and McFeters, G A. 1995. Factors affecting the
determination of respiratory activity on the basis of cyanoditolyl tetrazolium chloride
reduction with membrane filtration. Applied and Environmental Microbiology
61(12):4304-4309.
221. Queralt, N, and Araujo, R. 2007. Analysis of the survival of H. pylori within a
laboratory based aquatic model system using molecular and classical techniques.
Microbial Ecology 54(4):771-777.
222. Queralt, N, Bartolome, R, and Araujo, R. 2005. Detection of Helicobacter pylori
DNA in human faeces and water with different levels of faecal pollution in the north-
east of Spain. Journal of Applied Microbiology 98(4):889-895.
223. Quirynen, M, and Bollen, C M L. 1995. The influence of surface-roughness and
surface-free energy on supragingival and subgingival plaque-formation in man - a
review of the literature. Journal of Clinical Periodontology 22(1):1-14.
224. Rajagopal, S, van der Velde, G, Venugoparan, V P, and Jenner, H A. 2005.
Chlorine and chlorine residuals In: J. H. Lehr and J. Keeley (ed.), Water
Encyclopedia: Domestic, municipal, and industrial water supply and waste disposal,
vol. I. John Wiley & Sons, Hoboken, New Jersey, pp. 127-130.
225. Rao, D, Webb, J S, and Kjelleberg, S. 2005. Competitive interactions in mixed-
species biofilms containing the marine bacterium Pseudoalteromonas tunicata.
Applied and Environmental Microbiology 71(4):1729-1736.
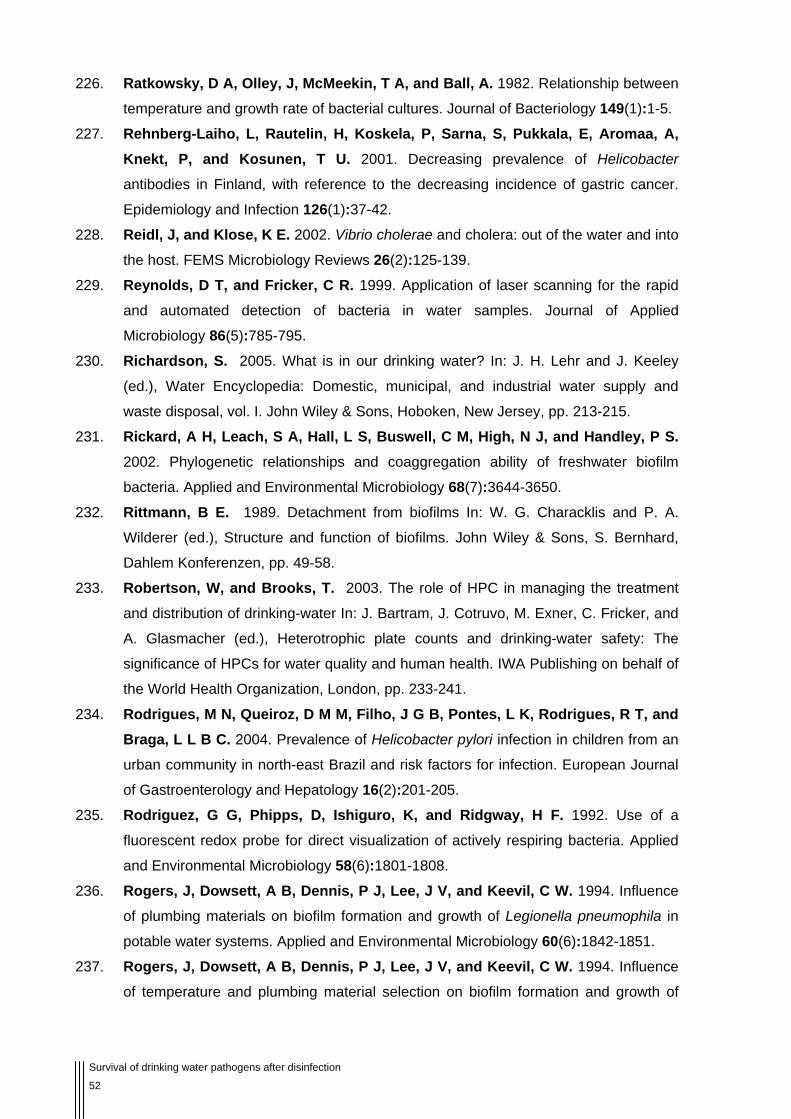
Survival of drinking water pathogens after disinfection
52
226. Ratkowsky, D A, Olley, J, McMeekin, T A, and Ball, A. 1982. Relationship between
temperature and growth rate of bacterial cultures. Journal of Bacteriology 149(1):1-5.
227. Rehnberg-Laiho, L, Rautelin, H, Koskela, P, Sarna, S, Pukkala, E, Aromaa, A, Knekt, P, and Kosunen, T U. 2001. Decreasing prevalence of Helicobacter
antibodies in Finland, with reference to the decreasing incidence of gastric cancer.
Epidemiology and Infection 126(1):37-42.
228. Reidl, J, and Klose, K E. 2002. Vibrio cholerae and cholera: out of the water and into
the host. FEMS Microbiology Reviews 26(2):125-139.
229. Reynolds, D T, and Fricker, C R. 1999. Application of laser scanning for the rapid
and automated detection of bacteria in water samples. Journal of Applied
Microbiology 86(5):785-795.
230. Richardson, S. 2005. What is in our drinking water? In: J. H. Lehr and J. Keeley
(ed.), Water Encyclopedia: Domestic, municipal, and industrial water supply and
waste disposal, vol. I. John Wiley & Sons, Hoboken, New Jersey, pp. 213-215.
231. Rickard, A H, Leach, S A, Hall, L S, Buswell, C M, High, N J, and Handley, P S. 2002. Phylogenetic relationships and coaggregation ability of freshwater biofilm
bacteria. Applied and Environmental Microbiology 68(7):3644-3650.
232. Rittmann, B E. 1989. Detachment from biofilms In: W. G. Characklis and P. A.
Wilderer (ed.), Structure and function of biofilms. John Wiley & Sons, S. Bernhard,
Dahlem Konferenzen, pp. 49-58.
233. Robertson, W, and Brooks, T. 2003. The role of HPC in managing the treatment
and distribution of drinking-water In: J. Bartram, J. Cotruvo, M. Exner, C. Fricker, and
A. Glasmacher (ed.), Heterotrophic plate counts and drinking-water safety: The
significance of HPCs for water quality and human health. IWA Publishing on behalf of
the World Health Organization, London, pp. 233-241.
234. Rodrigues, M N, Queiroz, D M M, Filho, J G B, Pontes, L K, Rodrigues, R T, and Braga, L L B C. 2004. Prevalence of Helicobacter pylori infection in children from an
urban community in north-east Brazil and risk factors for infection. European Journal
of Gastroenterology and Hepatology 16(2):201-205.
235. Rodriguez, G G, Phipps, D, Ishiguro, K, and Ridgway, H F. 1992. Use of a
fluorescent redox probe for direct visualization of actively respiring bacteria. Applied
and Environmental Microbiology 58(6):1801-1808.
236. Rogers, J, Dowsett, A B, Dennis, P J, Lee, J V, and Keevil, C W. 1994. Influence
of plumbing materials on biofilm formation and growth of Legionella pneumophila in
potable water systems. Applied and Environmental Microbiology 60(6):1842-1851.
237. Rogers, J, Dowsett, A B, Dennis, P J, Lee, J V, and Keevil, C W. 1994. Influence
of temperature and plumbing material selection on biofilm formation and growth of

Background and Aims
53
Legionella pneumophila in a model potable water system containing complex
microbial flora. Applied and Environmental Microbiology 60(5):1585-1592.
238. Roslev, P, and King, G M. 1993. Application of a tetrazolium salt with a water-
soluble formazan as an indicator of viability in respiring bacteria. Applied and
Environmental Microbiology 59(9):2891-2896.
239. Rowan, N J. 2004. Viable but nonculturable forms of food and waterborne bacteria:
Quo Vadis? Trends in Food Science and Technology 15(9):462-467.
240. Rowbotham, T J. 1983. Isolation of Legionella pneumophila from clinical specimens
via amoebae, and the interaction of those and other isolates with amoebae. Journal
of Clinical Pathology 36(9):978-986.
241. Russell, A D. 2003. Similarities and differences in the responses of microorganisms
to biocides. Journal of Antimicrobial Chemotherapy 52(5):750-763.
242. Sack, D A, Sack, R B, Nair, G B, and Siddique, A K. 2004. Cholera. The Lancet
363(9404):223-233.
243. Sadiq, R, and Rodriguez, M J. 2004. Disinfection by-products (DBPs) in drinking
water and predictive models for their occurrence: a review. Science of The Total
Environment 321(1-3):21-46.
244. Saito, N, Konishi, K, Sato, F, Kato, M, Takeda, H, Sugiyama, T, and Asaka, M. 2003. Plural transformation processes from spiral to coccoid Helicobacter pylori and
its viability. Journal of Infection 46(1):49-55.
245. Saltmarsh, M. 2001. Thirst: or, why do people drink? Nutrition Bulletin 26(1):53-58.
246. Sand, W. 1996. Microbial mechanisms In: E. Heitz, H. C. Flemming, and W. Sand
(ed.), Microbially influenced corrosion of materials: scientific and engineering aspects.
Springer, Berlin, pp. 16-25.
247. Schaule, G, Flemming, H C, and Ridgway, H F. 1993. Use of 5-cyano-2,3-ditolyl
tetrazolium chloride for quantifying planktonic and sessile respiring bacteria in
drinking-water. Applied and Environmental Microbiology 59(11):3850-3857.
248. Schloter, M, Aîmus, B, and Hartmann, A. 1995. The use of immunological methods
to detect and identify bacteria in the environment. Biotechnology Advances 13(1):75-
90.
249. Schneegurt, M A. A biofilm in your gut.
http://webs.wichita.edu/mschneegurt/biol103/lecture22/ileum_biofilm.gif (Accessed on
27-06-2008).
250. Schoenen, D. 2002. Role of disinfection in suppressing the spread of pathogens with
drinking water: possibilities and limitations. Water Research 36(15):3874-3888.
251. Schultheiss, D, and Denil, J. 2002. History of the microscope and development of
microsurgery: A revolution for reproductive tract surgery. Andrologia 34(4):234-241.

Survival of drinking water pathogens after disinfection
54
252. Schwartz, A, Marti, G E, Poon, R, Gratama, J W, and Fernández-Repollet, E. 1998. Standardizing flow cytometry: A classification system of fluorescence standards
used for flow cytometry. Cytometry 33(2):106-114.
253. Science Photo Library. http://www.sciencephoto.com/index.html (Accessed
254. Segal, G, and Shuman, H A. 1999. Legionella pneumophila utilizes the same genes
to multiply within Acanthamoeba castellanii and human macrophages. Infection and
Immunity 67(5):2117-2124.
255. Servais, P, Agogue, H, Courties, C, Joux, F, and Lebaron, P. 2001. Are the
actively respiring cells (CTC+) those responsible for bacterial production in aquatic
environments? Fems Microbiology Ecology 35(2):171-179.
256. Sharma, S, Sachdeva, P, and Virdi, J S. 2003. Emerging waterborne pathogens.
Applied Microbiology and Biotechnology 61(5):424-428.
257. She, F F, Lin, J Y, Liu, J Y, Huang, C, and Su, D H. 2003. Virulence of water
induced coccoid Helicobacter pylori and its experimental infection in mice. World
Journal of Gastroenterology 9(3):516-520.
258. Simoes, L C, Simoes, M, and Vieira, M J. 2007. Biofilm interactions between
distinct bacterial genera isolated from drinking water. Applied and Environmental
Microbiology 73(19):6192-6200.
259. Singh, A, Yu, F P, and McFeters, G A. 1990. Rapid detection of chlorine induced
bacterial injury by the direct viable count method using image analysis. Applied and
Environmental Microbiology 56(2):389-394.
260. Sips, H J, and Hamers, M N. 1981. Mechanism of the bactericidal action of
myeloperoxidase - increased permeability of the Escherichia coli cell envelope.
Infection and Immunity 31(1):11-16.
261. Snow, J. 1857. Cholera, and the water supply in the south district of London. British
Medical Journal 2(864-865.
262. Sohail, M. 2005. Domestic water supply - public - private partnership In: J. H. Lehr
and J. Keeley (ed.), Water Encyclopedia: Domestic, municipal, and industrial water
supply and waste disposal, vol. I. John Wiley & Sons, Hoboken, New Jersey, pp. 42-
51.
263. Solar, D, Villalba, X, Lopes, P, and Barreiros, M. 2007. História da humanidade: O
Egipto e as antigas civilizações, vol. I. Circulo de Leitores, Lisboa.
264. Spitalny, K, Vogt, R L, Orciari, L A, Witherell, L E, Etkind, P, and Novick, L F. 1984. Pontiac fever associated with a whirlpool spa. American Journal of
Epidemiology 120(6):809-817.
265. Steinert, M, Emody, L, Amann, R, and Hacker, J. 1997. Resuscitation of viable but
nonculturable Legionella pneumophila Philadelphia JR32 by Acanthamoeba
castellanii. Applied and Environmental Microbiology 63(5):2047-2053.

Background and Aims
55
266. Steinert, M, Hentschel, U, and Hacker, J. 2002. Legionella pneumophila: an aquatic
microbe goes astray. FEMS Microbiology Reviews 26(2):149-162.
267. Stender, H, Fiandaca, M, Hyldig-Nielsen, J J, and Coull, J. 2002. PNA for rapid
microbiology. Journal of Microbiological Methods 48(1):1-17.
268. Stewart, B A, and Howell, T A. Encyclopedia of water science.
http://www.dekker.com/sdek/issues~db=enc~content=t713172978#preface
(Accessed on 27-05-2008).
269. Stoodley, P, Cargo, R, Rupp, C J, Wilson, S, and Klapper, I. 2002. Biofilm material
properties as related to shear-induced deformation and detachment phenomena.
Journal of Industrial Microbiology and Biotechnology 29(6):361-367.
270. Stoodley, P, Sauer, K, Davies, D G, and Costerton, J W. 2002. Biofilms as
complex differentiated communities. Annual Review of Microbiology 56(1):187-209.
271. Student BMJ. http://student.bmj.com/issues/00/10/education/images/Sbmj369_1.jpg
(Accessed on 27-06-2008).
272. Szewzyk, U, Szewzyk, R, Manz, W, and Schleifer, K H. 2000. Microbiological safety
of drinking water. Annual Review of Microbiology 54(81-127.
273. The British Museum. 2004. http://www.ancientcivilizations.co.uk/home_set.html
(Accessed on 08-06-2008).
274. Theron, J, and Cloete, T E. 2002. Emerging waterborne infections: Contributing
factors, agents, and detection tools. Critical Reviews in Microbiology 28(1):1-26.
275. Tison, D L, and Seidler, R J. 1983. Legionella incidence and density in potable
drinking water supplies. Applied and Environmental Microbiology 45(1):337-339.
276. Tkachenko, M A, Zhannat, N Z, Erman, L V, Blashenkova, E L, Isachenko, S V, Isachenko, O B, Graham, D Y, and Malaty, H M. 2007. Dramatic changes in the
prevalence of Helicobacter pylori infection during childhood: A 10-year follow-up
study in Russia. Journal of Pediatric Gastroenterology and Nutrition 45(4):428-432.
277. Tsai, Y P. 2005. Impact of flow velocity on the dynamic behaviour of biofilm bacteria.
Biofouling 21(5-6):267-277.
278. Ullrich, S, Karrasch, B, Hoppe, H G, Jeskulke, K, and Mehrens, M. 1996. Toxic
effects on bacterial metabolism of the redox dye 5-cyano-2,3-ditolyl tetrazolium
chloride. Applied and Environmental Microbiology 62(12):4587-4593.
279. UN-Water. 2006. Coping with water scarcity.
http://www.unwater.org/downloads/waterscarcity.pdf (Accessed 13-05-2008).
280. Vaira, D, and Vakil, N. 2001. Blood, urine, stool, breath, money, and Helicobacter
pylori. Gut 48(3):287-289.
281. Velazquez, M, and Feirtag, J M. 1999. Helicobacter pylori: Characteristics,
pathogenicity, detection methods and mode of transmission implicating foods and
water. International Journal of Food Microbiology 53(2-3):95-104.

Survival of drinking water pathogens after disinfection
56
282. Venkatapathy, R, Moudgal, C, Boutin, B, and Bruce, R. 2005. Health effects of
commonly occurring disinfection byproducts in municipal water supplies In: J. H. Lehr
and J. Keeley (ed.), Water Encyclopedia: Domestic, municipal, and industrial water
supply and waste disposal, vol. I. John Wiley & Sons, Hoboken, New Jersey, pp. 264-
277.
283. Venkatapathy, R, Weintraub, J, and Wright, J M. 2005. Disinfectants In: J. H. Lehr
and J. Keeley (ed.), Water Encyclopedia: Domestic, municipal, and industrial water
supply and waste disposal, vol. I. John Wiley & Sons, Hoboken, New Jersey, pp. 192-
196.
284. Vieira, M J, and Melo, L F. 1995. Effect of clay particles on the behaviour of biofilms
formed by Pseudomonas fluorescens. Water Science and Technology 32(45-52.
285. Vieira, M J, Melo, L F, and Pinheiro, M M. 1993. Biofilm formation: hydrodynamic
effects on internal diffusion and structure. Biofouling 7(67-80.
286. Voytek, M A, Ashen, J B, Fogarty, L R, Kirshtein, J D, and Landa, E R. 2005.
Detection of Helicobacter pylori and fecal indicator bacteria in five North American
rivers. Journal of Water and Health 3(4):405-422.
287. Wadowsky, R M, and Yee, R B. 1983. Satellite growth of Legionella pneumophila
with an environmental isolate of Flavobacterium breve. Applied and Environmental
Microbiology 46(6):1447-1449.
288. Wagner, A O, Malin, C, Knapp, B A, and Illmer, P. 2008. Removal of free
extracellular DNA from environmental samples by ethidium monoazide and propidium
monoazide. Applied and Environmental Microbiology 74(8):2537-2539.
289. Watkins, K. 2007. Human development report 2007/2008, Fighting climate change:
Human solidarity in a divided world In: U. N. D. Programme (ed.). Palgrave
Macmillan, New York, pp.
290. Watnick, P, and Kolter, R. 2000. Biofilm, city of microbes. Journal of Bacteriology
182(10):2675-2679.
291. Weintraub, J M, Wright, J M, and Venkatapathy, R. 2005. Alternative disinfection
practices and future directions for disinfection by-products minimization In: J. H. Lehr
and J. Keeley (ed.), Water Encyclopedia: Water quality and resource development,
vol. II. John Wiley & Sons, Hoboken, New Jersey, pp. 118-121.
292. White, D C, Palmer, R J, Jr., Zinn, M, Smith, C A, Burkhalter, R, Macnaughton, S J, Whitaker, K W, and Kirkegaard, R D. 1998. Manipulation of biofilm microbial
ecology. http://www.osti.gov/energycitations/servlets/purl/3920-
QTscNM/webviewable/ (Accessed on 20-05-2008).
293. Wilks, S A, and Keevil, C W. 2006. Targeting species-specific low-affinity 16S rRNA
binding sites by using peptide nucleic acids for detection of legionellae in biofilms.
Applied and Environmental Microbiology 72(8):5453-5462.

Background and Aims
57
294. Winiecka-Krusnell, J, Wreiber, K, Von Euler, A, Engstrand, L, and Linder, E. 2002. Free-living amoebae promote growth and survival of Helicobacter pylori.
Scandinavian Journal of Infectious Diseases 34(4):253-256.
295. Winn, W C, Jr. 1988. Legionnaires' disease: historical perspective. Clinical
Microbiology Reviews 1(1):60-81.
296. World Water Council. http://www.worldwatercouncil.org/index.php?id=25 (Accessed
on 22-05-2008).
297. World Health Organization. 2006. Guidelines for drinking water quality, 3rd ed, vol.
1. World Health Organization, Geneva.
298. Wright, J M, Schwartz, J, and Dockery, D W. 2004. The effect of disinfection by-
products and mutagenic activity on birth weight and gestational duration.
Environmental Health Perspectives 112(8):920-925.
299. Wright, J M, Venkatapathy, R, and Weintraub, J M. 2005. Chlorination by-products
In: J. H. Lehr and J. Keeley (ed.), Water Encyclopedia: Water quality and resource
development, vol. II. John Wiley & Sons, Hoboken, New Jersey, pp. 91-94.
300. Wyatt, T D. 1993. The control of biofilm in recreational waters In: S. P. Denyer, S. P.
Gorman, and M. Sussman (ed.), Microbial biofilms: formation and control. Blackwell
Scientific Publications, Oxford, pp. 227-245.
301. Xu, H S, Roberts, N, Singleton, F L, Attwell, R W, Grimes, D J, and Colwell, R R. 1982. Survival and viability of nonculturable Escherichia coli and Vibrio cholerae in
the estuarine and marine environment. Microbial Ecology 8(4):313-323.
302. Yang, S, and Rothman, R E. 2004. PCR-based diagnostics for infectious diseases:
uses, limitations, and future applications in acute-care settings. The Lancet Infectious
Diseases 4(6):337-348.
303. Zhang, X, and Minear, R A. 2002. Characterization of high molecular weight
disinfection byproducts resulting from chlorination of aquatic humic substances.
Environmental Science and Technology 36(19):4033-4038.
304. Zobell, C E. 1943. The effect of solid surfaces upon bacterial activity. Journal of
Bacteriology 46(1):39-56.
305. Zobell, C E, and Allen, E C. 1935. The significance of marine bacteria in the fouling
of submerged surfaces. Journal of Bacteriology 29(3):239-251.


Rapid detection of VBNC L. pneumophila
61
2.1 Introduction
Legionella pneumophila is a Gram-negative rod shaped bacterium that can cause Legionnaires’
disease (pneumonia with a high mortality rate) or Pontiac fever (a mild non-pneumonic form of illness)
[19, 25, 37]. Contrary to most other pathogens that appear in drinking water due to fecal contamination
[12, 32], L. pneumophila is known to be ubiquitous in natural aquatic systems such as groundwater,
lakes and rivers [6, 9, 25]. When disinfection procedures are not effective, viable L. pneumophila cells
can remain in water and continue to be the cause of outbreaks. This pathogen has been isolated from
shower heads, whirlpools spas, cooling towers, air conditioning systems, humidifiers, etc. [9, 25, 33,
34, 35], being transmitted to humans when contaminated aerosols are formed and inhaled.
Chlorine is the disinfectant most commonly used to ensure drinking water quality and has been used
since the 19th Century [28]. Comparing the disinfectants that can be used in drinking water systems,
chlorine is one of the most effective as residual chlorine can remain in water to control the
microbiological water quality between the application and the distribution points [14]. However, in the
last few years it has been found that emerging pathogens have increased resistance to chlorine,
especially L. pneumophila. On the other hand, studies investigating the effect of chlorine concentration
on this bacterium used a simple culture method to assess viability [15, 16] which is now known to have
limitations [10]. It has been demonstrated that after exposure to stress conditions, a range of different
bacterial species can enter a viable but non-cultivable (VBNC) state. In this state cells are not able to
grow and replicate in artificial media, but are still viable and might maintain their pathogenic properties
[8, 10, 20, 23, 36, 37]. In fact it has been demonstrated that L. pneumophila can recover cultivability
after being exposed to stress conditions when co-cultured with amoeba species [7, 30]. This
procedure demonstrates that L. pneumophila is able to remain infective but is tedious to perform,
taking several days of co-culture followed by four or more days for recovery of cultivable cells on agar
media.
The aim of this work is to develop a rapid viability assay procedure and show that the assessment of
L. pneumophila in water after exposure to chlorine stress by the use of standard methods can lead to
false results: the pathogen can completely lose cultivability but still maintain membrane integrity,
which we have validated to be indicative of cell viability by demonstrating infection of amoebae in co-
culture.

Survival of drinking water pathogens after disinfection
62
2.2 Material and Methods
2.2.1 Strains
L. pneumophila NCTC 12821 was grown on Buffered Charcoal Yeast Extract (BCYE) agar (Oxoid,
UK) for 24 hours at 30ºC. Cells were suspended in 50 ml of dechlorinated and filtered tap water to give
a final concentration of approximately 107 cells ml-1.
2.2.2 Chlorine preparation and measurements
Chlorine tablets (H-8801, Guest Medical, UK) were added to filtered distilled water to obtain a 5 g l-1
stock solution. The measurement of chlorine was done using the N,N-dimethyl-p-phenilenediamine
(DPD) colorimetric method, as described in the Standard methods for the examination of water and
wastewater [2] with the exception of the absorbance wavelength reading which was adjusted to 492
nm [21].
2.2.3 Chlorine disinfection tests
After considering the chlorine demand due to organic matter, an appropriate amount of the stock
solution was added to the suspension in order to obtain a final concentration of free chlorine of 0.2, 0.7
and 1.2 mg l-1. A control assay with no chlorine addition was also performed. Experiments were
carried out in amber flasks (to avoid chlorine degradation by light) at room temperature (20ºC) and
stirred at 620 rpm. Samples were taken at 0, 10, 20 and 30 minutes and cells quantified as explained
below. At times 0 and 30 minutes the concentration of free chlorine was measured by the DPD
method as described previously. The chlorine reaction was inactivated by the addition of sodium
thiosulfate (Sigma, UK) applied at a final concentration of 5 mg l-1. For each chlorine concentration the
experiment was repeated at least three times.
2.2.4 Assessment of cultivable cells
A 40 μl aliquot of each sample was diluted (to give between 15 and 150 colony forming units (CFU)
per agar plate) and spread onto BCYE agar plates (in triplicate for each experiment) and aerobically
incubated at 30ºC for 4 days. After this time the number of colonies was counted to determine the
number of cultivable cells remaining in the chlorinated solution. When, after 4 days, no colonies were
grown on BCYE agar plates, the plates were returned to the incubator for 14 days. Using this method
the limit of detection is 8.33 CFU ml-1.

Rapid detection of VBNC L. pneumophila
63
2.2.5 Assessment of membrane integrity
To assess the membrane integrity the LIVE/DEAD® BacLightTM Bacterial Viability kit (Molecular
Probes, Invitrogen, UK) was used. A 50 μl aliquot of each sample was diluted in 0.950 ml of
dechlorinated, filtered tap water and stained with SYTO 9/Propidium Iodide (PI). A 3 μl volume of an
equal proportion of SYTO 9 and PI mixture was added to the sample and incubated in the dark, at
room temperature (20ºC) for 15 minutes followed by filtration through a black polycarbonate
Nucleopore® membrane (0.2 μm pore size) (Whatman, UK). Subsequently, the membranes were air
dried, mounted onto glass slides with non-fluorescence immersion oil and a cover slip. The slides
were examined using a Nikon Eclipse E800 episcopic differential interference contrast/epifluorescence
(EDIC/EF) microscope under oil immersion (Best Scientific, UK) [13].
2.2.6 Co-culture of L. pneumophila and Acanthamoeba polyphaga
An axenic culture of A. polyphaga CCAP1501/18 was maintained in Proteose Peptone Glucose
Medium (PPG; CCAP, UK) at room temperature and subcultured every week. Five ml samples of the
suspension exposed to 1.2 mg l-1 of free chlorine for 0 (control) and 30 minutes were centrifuged at
3000 rpm for 10 minutes (Heraeus, UK) and washed three times in PP medium (PPG but with glucose
omitted) and before resuspending in a final volume to achieve the concentration of approx. 5 x 10⁵
cells ml-1. Infection of A. polyphaga by L. pneumophila was performed as described by Garcia et al.
[7]. Briefly, monolayers of A. polyphaga were formed in 96 well-plates in the presence of PP medium
at a concentration of 104 cells per well and infected with 200 μl of the L. pneumophila suspension
prepared as described above. The plates were then centrifuged at 500 x g for 5 minutes and
incubated at 30ºC for 1 hour. After this time plates were washed three times with PP medium and
incubated at 30ºC for 1 hour in 50 μg ml-1 of gentamicin followed by three washes with PP media. The
infected monolayers were then incubated at 30ºC and the cultivability of L. pneumophila was assessed
after 24, 48 and 72 hours of infection. For that, A. polyphaga cells were lysed with 0.05% (v/v) Triton
X-100 (Sigma, UK) and supernatants before and after lysis were combined and 40 μl aliquots were
plated onto BCYE as described above.
2.2.7 Assessment of RNA injury
A 1.0 μl aliquot of SYBR® Green II RNA gel stain (SYBR II) (Molecular Probes, Invitrogen, UK) was
added to 50 μl of each sample diluted in 0.95 ml of dechlorinated filtered tap water and incubated in
the dark, at room temperature (20ºC) for 30 minutes. The stained suspension was then filtered through
a black polycarbonate Nucleopore membrane (0.2 μm pore size), air dried and mounted onto glass
slides with non-fluorescence oil and cover slips and examined using EDIC/EF microscopy [13].

Survival of drinking water pathogens after disinfection
64
2.2.8 DNA electrophoresis
L. pneumophila NCTC 12821, grown under the same conditions as previously described, was
suspended in 100 ml of dechlorinated and filtered tap water to give a final concentration of
approximately 107 CFU ml-1. This cell suspension was exposed to the same range of chlorine
concentrations for 30 minutes. Following this, cells were concentrated by centrifugation at 4000 rpm
for 10 minutes and the DNA extracted and purified using a DNA extract kit (Sigma, Spain). The DNA
obtained was run in a horizontal electrophoresis system for 2 hours at 100 V using 1% (w/v) agarose
gel (Bio-Rad, Portugal) containing ethidium bromide (50 μl l-1 of a 10 mg ml-1 stock) (Bio-Rad,
Portugal). Finally, the gel was visualized under UV light.
2.2.9 Statistical analysis
Results obtained for cultivable cells, membrane integrity, RNA injury and total cell counts were
transformed on a logarithmic scale. The average for each was calculated from at least three
experiments, and the homogeneity of variances across these parameters was checked by the Levene
test for equality of variances using a statistical package (SPSS Inc., Chicago IL, USA). Differences
between the parameters measured were subsequently compared by a one-way ANOVA followed by a
Bonferroni post hoc test. Differences were considered relevant if P<0.05.

Rapid detection of VBNC L. pneumophila
65
2.3 Results
The chlorine concentrations measured in the cell suspension at time 0 and 30 minutes indicated that
there was consumption of chlorine by reaction with L. pneumophila cells, as indicated in Table 2.1.
Preliminary results showed that there was consumption of chlorine by the organic matter present in
the tap water (results not shown), so the values presented (0.2, 0.7 and 1.2 mg l-1) are the values
following subtraction of chlorine consumption by organic matter. However, at time 0 minutes the
values obtained were much lower than theoretically expected (i.e. compared to values obtained in tap
water without cells), meaning that there was immediate consumption by cells.
Table 2.1 Chlorine concentration demand immediately after, and 30 minutes after, the chlorine addition to
the sterile-filtered tap water and to the L. pneumophila suspension.
Cl2 concentration (mg l-1)
Cl2 measurement in the cell suspension (mg l-1)
0 min 30 min
0.2 0.058 0.030
0.7 0.483 0.083
1.2 0.858 0.140
The effect of chlorine on L. pneumophila cells was evaluated by quantification of cells by two different
methods: standard culture techniques and direct count of cells by observation under epifluorescence
microscopy after staining with the SYTO 9/PI fluorochrome reagents (Figure 2.1).
The assay where no chlorine was added to the suspension served as a control and showed that cells
maintain their physiological state in dechlorinated filtered tap water for at least 30 minutes. In fact,
ANOVA results show that time does not influence any of the parameters studied, including cultivability
(P>0.95). Cultivable cells represented 55% of the total number of cells and, as expected, differences
between cultivability and either the total number of cells or viable cells (assessed by SYTO 9/PI
membrane integrity staining) were statistically significant (P<0.05). When cells were exposed to 0.2
mg l-1 chlorine there were no alterations in the viability status but the cells appeared to start losing their
cultivability in the first 10 minutes. This result was confirmed by the statistical analysis on the effect of
time on this parameter (P<0.05). Increasing the chlorine concentration up to 0.7 mg l-1 caused a
complete loss of growth capacity on agar plates (total loss of cultivability). Although no statistically
significant differences were detected between the number of viable and total cells (P>0.05), it was
observed that some of the cells did not fluoresce true green but had become yellow/orange; however
only cells fluorescing red were considered as dead cells due to a compromised cell membrane. Cells
exposed to the maximum concentration of chlorine (1.2 mg l-1) showed a loss of cultivability during the

Survival of drinking water pathogens after disinfection
66
first 10 minutes of chlorination and it was observed that there was an increase in the number of red
fluorescent cells. Therefore, at this concentration, the difference in numbers between viable and total
cells was statistically significant (P<0.05).
Figura 2.1 Variation in the total cell number, viability of SYTO 9-/PI+ stained cells and cultivability on BCYE
agar, after exposure to free chlorine concentrations of 0.0 (a), 0.2 (b), 0.7 (c) and 1.2 (d) mg l-1. Error bars
represent standard deviation of at least three experiments.
To validate the results obtained with the LIVE/DEAD viability kit a sample of L. pneumophila exposed
to 1.2 mg l-1 of free chlorine for 30 minutes was treated and co-cultured with A. polyphaga. Figure 2.2
shows that cells were able to recover cultivability between 24 and 48 hours of infection.
Simultaneously, a control experiment was performed in which cells not stressed with chlorine were
also co-cultured with A. polyphaga. After 72 hours of co-culture the numbers of cultivable cells were
lower than before exposure to A. polyphaga.
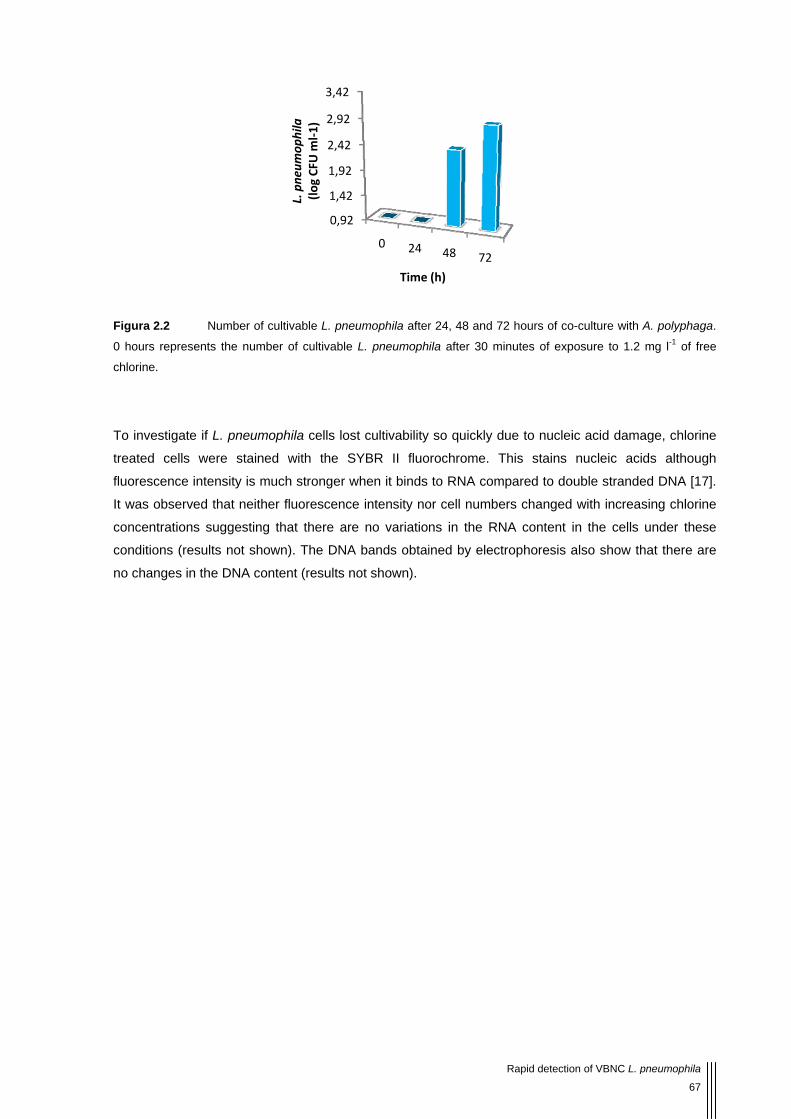
Figur0 hou
chlorin
To in
treate
fluore
It was
conce
cond
no ch
ra 2.2 N
urs represents
ne.
vestigate if L
ed cells we
escence inte
s observed t
entrations su
itions (result
hanges in the
Number of cult
s the number
L. pneumoph
ere stained
nsity is much
that neither f
uggesting th
ts not shown
e DNA conte
tivable L. pneu
of cultivable
hila cells lost
with the SY
h stronger w
fluorescence
at there are
n). The DNA
nt (results no
0,92
1,42
1,92
2,42
2,92
3,42
L. pne
umop
hila
(log CFU m
l‐1)
umophila after
L. pneumoph
t cultivability
YBR II fluo
when it binds
e intensity no
e no variatio
bands obtai
ot shown).
0 24
Time
r 24, 48 and 7
ila after 30 m
so quickly d
orochrome. T
to RNA com
or cell numbe
ns in the RN
ined by elect
48 72
(h)
Rapid detectio
72 hours of co
minutes of exp
due to nuclei
This stains
mpared to do
ers changed
NA content
trophoresis a
on of VBNC L. p
o-culture with A
posure to 1.2
ic acid dama
nucleic acid
ouble strande
with increas
in the cells
also show th
pneumophila
67
A. polyphaga.
mg l-1 of free
age, chlorine
ds although
ed DNA [17].
sing chlorine
under these
hat there are
.
e
e
h
.
e
e
e

Survival of drinking water pathogens after disinfection
68
2.4 Discussion
All the experiments described here were carried out by suspending the cells in dechlorinated, filtered
tap water to represent realistic conditions. As expected when added to tap water (with no previous
inoculation), there was a decrease in the chlorine concentration. This happens because tap water
contains organic matter that can react with chlorine, the so-called chlorine demand, meaning that the
real concentration available to interact with L. pneumophila cells is lower than the concentration added
to the suspension. Prior studies showed that the chlorine consumed by organic matter is
approximately 0.3 mg l-1 and occurs rapidly in the first 10 minutes (results not shown).
When chlorine was added to the L. pneumophila suspension, a sample was immediately taken and
analyzed (corresponding to time zero). As seen in Table 2.1, a high proportion of the chlorine reacts
instantly, with values significantly lower than the concentration added. The results obtained in tap
water with no cells show a lower reduction confirming that chlorine reacts with the cells and that the
reaction starts immediately after the addition. This can also explain the rapid loss of cultivability in the
first 10 minutes after the addition of 1.2 mg l-1 of free chlorine, as seen in Figure 2.1.
The L. pneumophila cell suspensions were prepared using a 24 hour culture so each batch of cells
were in the same physiological conditions. To control this parameter, and because the chlorine
reaction with cells seemed to be immediate and fast, a sample was taken before chlorine addition and
cells were quantified by spreading on BCYE agar plates and by SYTO 9/PI double staining. SYTO
9/PI can be successfully used to stain L. pneumophila cells, as previously demonstrated by Ohno et
al. [22]. Although the cultivability was found in the present study to be slightly variable, these values do
not seem to be significant, the viability results showed that the cells were in a very similar state
(percentage values of viable cells were always around 95 % of total cells).
In the absence of chlorine there was no loss of cultivability and viability of the cells in tap water. This
was expected as L. pneumophila can survive for long periods in tap water [11, 29, 36] and can even
grow and replicate under particular conditions [35, 38].
When 0.2 mg l-1 of free chlorine were added to the suspension it was found that L. pneumophila cells
lost some cultivability but there were cells that could still be recovered by standard culture techniques.
Microscopy observation of cells stained with SYTO 9/PI revealed that the number of viable cells was
constant with time and also that the cells maintained a bright green color. The chlorine measurement
after 30 minutes demonstrated that all chlorine was consumed by the cells. In fact it can be considered
that, at this concentration, chlorine is completely consumed immediately after its addition, as can be
seen on Table 2.1 where the value at 0 minutes is very close to 0 and after 30 minutes no chlorine
remains in the solution. The fact that some cells can still be grown on agar plates demonstrates that
this level of chlorine represents a sublethal concentration and as such does not cause any damage to
the membrane integrity since no cells take up PI. The loss of cultivability when cells are exposed to
stress conditions (such as extreme temperatures, nutrient starvation or chlorine oxidative stress

Rapid detection of VBNC L. pneumophila
69
exposure) is an effect which can be explained by injury to the cytoplasmic membrane and transport
processes which reduce the membrane potential and respiratory activity, and consequently cultivability
[1, 3, 18]. However, Yamamoto et al. [37] have already demonstrated that even after losing cultivability
due to nutrient starvation cells retain intact DNA and RNA and in favorable conditions can recover,
elongate and multiply.
When the free chlorine concentration was increased up to 0.7 mg l-1 the cells lost cultivability
completely between 20 and 30 minutes of exposure time; however, the number of viable cells
assessed using SYTO 9/PI was not altered. Although the green cells lost their brightness and some of
them became yellow and orange, there was no increase in the number of cells that fluoresced red.
Some authors have suggested that when cells change their fluorescence color from green to orange
or yellow but are not exactly red, this means that there is some injury to the cellular membrane that
allows some of the PI to penetrate the cell. However when the injury is minor the concentration of PI
that can penetrate the cell and bind to DNA is not high enough to exclude all the SYTO 9 in the cell
bound to DNA, so they appear yellow and orange, and are considered as viable cells [5]. Indeed, no
residual free chlorine remained at the end of the incubation period which might account for the
extended viability of the cells.
The maximum chlorine concentration used (corresponding to 1.2 mg of free chlorine l-1) was sufficient
to cause complete loss of cell cultivability in 10 minutes but once again there was an insignificant
decrease in viability. In contrast it was observed that most of the cells were not green or red, but
orange which suggests that low level injury to the cytoplasmic membrane had occurred due to the
chlorine concentration. At the end of these experiments some free residual chlorine was still
detectable, indicating that this concentration of chlorine was in excess of that needed to completely
react with the cells within 30 minutes.
The use of LIVE/DEAD to assess the viability of cells is still controversial. Some authors are sceptical
in accepting that green cells that have lost their cultivability are effectively viable [4, 31]. To validate
the results obtained in this work, a sample of L. pneumophila previously exposed to 1.2 mg l-1 of free
chlorine for 30 minutes was used to infect A. polyphaga. Results demonstrated that L. pneumophila
has, in fact, entered into a viable but non-cultivable state as cells recovered their capability of growth
on artificial media (BCYE) between 24 and 48 hours of co-culture with amoebae. Alternatively, in the
control, where cells were not exposed to chlorine, the number of cultivable cells, after 72 hours, was
lower than before co-culture with amoebae, which indicates that cells were not multiplying but were
instead resuscitating inside of the amoebae. These results clearly demonstrate that L. pneumophila
cells that appear green when stained with BacLightTM kit were effectively viable, although not
cultivable. The resuscitation to a cultivable state of VBNC L. pneumophila using amoeba species has
been demonstrated before [7, 30] and therefore used in this work to demonstrate that LIVE/DEAD is a
technique that can be successfully used to access the effectiveness of disinfection. The advantage of
this assay is the short time it takes to obtain the results: using this method the results can be obtained
in a few hours while using the amoeba co-cultivation assay the results are not available in less than
one week.

Survival of drinking water pathogens after disinfection
70
The resuscitation of VBNC cells that have been exposed to stress conditions such as chlorination is
sometimes difficult to achieve. Oliver et al. failed to resuscitate chlorine treated E. coli cells when using
several methods previously demonstrated as successful [24]. However, and unlike the present work,
they have not used live eukaryotic hosts for resuscitation. It has been clearly demonstrated here that
L. pneumophila very quickly loses cultivability without losing viability, which is not surprising as it had
been demonstrated previously that non-cultivable cells can still be viable [8, 22]. Moreover, Hussong
et al. [10] demonstrated that non-cultivable L. pneumophila cells are not just viable but can cause
infection of embryonated eggs. On the other hand, Steinert and colleagues [30] had suggested that
Pontiac fever, a mild from of disease caused by L. pneumophila, could be due to VBNC cells.
At all concentrations of chlorine investigated (0.2, 0.7 and 1.2 mg l-1) the number of total cells
remained constant during the 30 minutes of experimental time. SYTO 9 and PI are both fluorochrome
stains that bind with nucleic acids and when there is some damage to the nucleic acids they are not
able to bind and the cells can not be visualized. The fact that the number of total cells observed by
epifluorescence microscopy was always the same suggests that there was little or no injury to the
nucleic acid structure, as expected at this low concentration of free chlorine. These results were
corroborated by DNA electrophoresis which indicated that genomic DNA remained intact following
chlorine treatment (results not shown). Although Phe et al., [26, 27] have previously shown that
chlorine is able to damage the nucleic acids in Escherichia coli cells the disinfectant dosage used was
much higher and, in addition, it is already known that L. pneumophila is more resistant to chlorine than
E. coli. [16].
This study has clearly demonstrated that the standard culture methods used to assess the presence of
L. pneumophila are not ideal to study the presence of this pathogen and especially its viability,
because even after completely losing the capability of growth on BCYE agar plates, cells remained
viable and able to infect amoebae. This raises a new concern for water quality assessment and
requires the development, as reported here, of new validated, rapid methods to detect viable L.
pneumophila cells in drinking water after disinfection.
In addition, it also suggests that viable L. pneumophila are probably more widespread in drinking
water distribution systems than previously thought, despite the presence of residual chlorine at
concentrations indicated by the international health protection agencies to control microbiological
quality. The fact that a relatively low number of outbreaks with this bacterium are observed is perhaps
more related to the fact that for disease to occur in humans, unlike many waterborne pathogens
causing gastrointestinal infection, L. pneumophila has mainly to be inhaled in the form of aerosols to
gain access to the lung.

Rapid detection of VBNC L. pneumophila
71
2.5 Acknowledgments
This work was supported by the Portuguese Institute Fundação para a Ciência e Tecnologia (PhD
grant SFRH/BD/17088/2004) and has been undertaken as part of a research project which is
supported by the European Commission within the Fifth Framework Programme, “Energy,
Environment and sustainable development programme”, no. EVK1-CT-2002-00108. Disclaimer stating
that the author is solely responsible for the work, it does not represent the opinion of the Community
and the Community is not responsible for any use that might be made of data appearing therein.

Survival of drinking water pathogens after disinfection
72
2.6 References
1. Albrich, J M, and Hurst, J K. 1982. Oxidative inactivation of Escherichia coli by hypochlorous
acid - rates and differentiation of respiratory from other reaction sites. FEBS Letters
144(1):157-161.
2. American Public Health Association. 1998. Standard methods for the examination of water
and wastewater, In: L. S. Clesceri, A. E. Greenberg, and A. D. Eaton (ed.), 20th ed. American
Public Health Association, American Water Works Association, Water Environmental
Federation, Washington DC. pp. 4.63-4.64
3. Barrette, W C, Albrich, J M, and Hurst, J K. 1987. Hypochlorous acid promoted loss of
metabolic energy in Escherichia coli. Infection and Immunity 55(10):2518-2525.
4. Berney, M, Hammes, F, Bosshard, F, Weilenmann, H U, and Egli, T. 2007. Assessment
and interpretation of bacterial viability by using the LIVE/DEAD(R) BacLightTM kit in combination
with flow cytometry. Applied and Environmental Microbiology 73(10):3283-3290.
5. Boulos, L, Prevost, M, Barbeau, B, Coallier, J, and Desjardins, R. 1999. LIVE/DEAD(R)
BacLight(TM): application of a new rapid staining method for direct enumeration of viable and
total bacteria in drinking water. Journal of Microbiological Methods 37(1):77-86.
6. Costa, J, Tiago, I, da Costa, M S, and Verissimo, A. 2005. Presence and persistence of
Legionella spp. in groundwater. Applied and Environmental Microbiology 71(2):663-671.
7. Garcia, M T, Jones, S, Pelaz, C, Millar, R D, and Abu Kwaik, Y. 2007. Acanthamoeba
polyphaga resuscitates viable non-culturable Legionella pneumophila after disinfection.
Environmental Microbiology 9(5):1267-1277.
8. Howard, K, and Inglis, T J J. 2003. The effect of free chlorine on Burkholderia pseudomallei
in potable water. Water Research 37(18):4425-4432.
9. Hsu, S C, Martin, R, and Wentworth, B B. 1984. Isolation of Legionella species from drinking
water. Applied and Environmental Microbiology 48(4):830-832.
10. Hussong, D, Colwell, R R, O'Brien, M, Weiss, E, Pearson, A D, Weiner, R M, and Burge, W D. 1987. Viable Legionella pneumophila not detectable by culture on agar media. Nature
Biotechnology 5(9):947-950.
11. James, B W, Mauchline, W S, Dennis, P J, Keevil, C W, and Wait, R. 1999. Poly-3-
hydroxybutyrate in Legionella pneumophila, an energy source for survival in low nutrient
environments. Applied and Environmental Microbiology 65(2):822-827.
12. Keevil, C W. 2002. Pathogens in environmental biofilms In: G. Bitton (ed.), The Encyclopedia
of Environmental Microbiology. Wiley, New York, pp. 2339-2356.
13. Keevil, C W. 2003. Rapid detection of biofilms and adherent pathogens using scanning
confocal laser microscopy and episcopic differential interference contrast microscopy. Water
Science and Technology 47(5):105-116.
14. Kim, B R, Anderson, J E, Mueller, S A, Gaines, W A, and Kendall, A M. 2002. Literature
review - efficacy of various disinfectants against Legionella in water systems. Water Research
36(18):4433-4444.

Rapid detection of VBNC L. pneumophila
73
15. Kuchta, J M, States, S J, McGlaughlin, J E, Overmeyer, J H, Wadowsky, R M, McNamara, A M, Wolford, R S, and Yee, R B. 1985. Enhanced chlorine resistance of tap water adapted
Legionella pneumophila as compared with agar medium passaged strains. Applied and
Environmental Microbiology 50(1):21-26.
16. Kuchta, J M, States, S J, McNamara, A M, Wadowsky, R M, and Yee, R B. 1983.
Susceptibility of Legionella pneumophila to chlorine in tap water. Applied and Environmental
Microbiology 46(5):1134-1139.
17. Lebaron, P, Parthuisot, N, and Catala, P. 1998. Comparison of blue nucleic acid dyes for
flow cytometric enumeration of bacteria in aquatic systems. Applied and Environmental
Microbiology 64(5):1725-1730.
18. Lisle, J T, Pyle, B H, and McFeters, G A. 1999. The use of multiple indices of physiological
activity to access viability in chlorine disinfected Escherichia coli O157 : H7. Letters in Applied
Microbiology 29(1):42-47.
19. McDade, J E, Shepard, C C, Fraser, D W, Tsai, T R, Redus, M A, and Dowdle, W R. 1977.
Legionnaires' disease - isolation of a bacterium and demonstration of its role in other
respiratory disease. New England Journal of Medicine 297(22):1197-1203.
20. McDougald, D, Rice, S A, Weichart, D, and Kjelleberg, S. 1998. Nonculturability: adaptation
or debilitation? FEMS Microbiology Ecology 25(1):1-9.
21. Moberg, L, and Karlberg, B. 2000. An improved N,N '-diethyl-p-phenylenediamine (DPD)
method for the determination of free chlorine based on multiple wavelength detection.
Analytica Chimica Acta 407(1-2):127-133.
22. Ohno, A, Kato, N, Yamada, K, and Yamaguchi, K. 2003. Factors influencing survival of
Legionella pneumophila serotype 1 in hot spring water and tap water. Applied and
Environmental Microbiology 69(5):2540-2547.
23. Oliver, J D. 2005. The viable but nonculturable state in bacteria. Journal of Microbiology
43(93-100.
24. Oliver, J D, Dagher, M, and Linden, K. 2005. Induction of Escherichia coli and Salmonella
typhimurium into the viable but nonculturable state following chlorination of wastewater.
Journal of Water and Health 3(249-257.
25. Pasculle, W. 2000. Update on Legionella. Clinical Microbiology Newsletter 22(13):97-101.
26. Phe, M H, Dossot, M, and Block, J C. 2004. Chlorination effect on the fluorescence of
nucleic acid staining dyes. Water Research 38(17):3729-3737.
27. Phe, M H, Dossot, M, Guilloteau, H, and Block, J C. 2005. Nucleic acid fluorochromes and
flow cytometry prove useful in assessing the effect of chlorination on drinking water bacteria.
Water Research 39(15):3618-3628.
28. Schoenen, D. 2002. Role of disinfection in suppressing the spread of pathogens with drinking
water: possibilities and limitations. Water Research 36(15):3874-3888.
29. Skaliy, P, Thompson, T A, Gorman, G W, Morris, G K, McEachern, H V, and Mackel, D C. 1980. Laboratory studies of disinfectants against Legionella pneumophila. Applied and
Environmental Microbiology 40(4):697-700.

Survival of drinking water pathogens after disinfection
74
30. Steinert, M, Emody, L, Amann, R, and Hacker, J. 1997. Resuscitation of viable but
nonculturable Legionella pneumophila Philadelphia JR32 by Acanthamoeba castellanii.
Applied and Environmental Microbiology 63(5):2047-2053.
31. Stocks, S M. 2004. Mechanism and use of the commercially available viability stain, BacLight.
Cytometry Part A 61A(2):189-195.
32. Szewzyk, U, Szewzyk, R, Manz, W, and Schleifer, K H. 2000. Microbiological safety of
drinking water. Annual Review of Microbiology 54(81-127.
33. Tobin, J O, Swann, R A, and Bartlett, C L R. 1981. Isolation of Legionella pneumophila from
water systems: Methods and preliminary results. British Medical Journal 282(6263):515-517.
34. Tobin, J O H, Bartlett, C L R, Waitkins, S A, Barrow, G I, Macrae, A D, Taylor, A G, Fallon, R J, and Lynch, F R N. 1981. Legionnaires' disease: Further evidence to implicate
water storage and distribution systems as sources. British Medical Journal 282(6263):573-
573.
35. Wadowsky, R M, Yee, R B, Mezmar, L, Wing, E J, and Dowling, J N. 1982. Hot water
systems as sources of Legionella pneumophila in hospital and non-hospital plumbing fixtures.
Applied and Environmental Microbiology 43(5):1104-1110.
36. West, A A, Rogers, J, Lee, J V, and Keevil, C W. 1992. Lack of dormancy in Legionella
pneumophila? In: J. M. Barbaree, R. F. Breiman, and A. P. Dufour (ed.), Legionella. Current
state and emerging perspectives. American Society for Microbiology Press, Washington DC,
pp. 201-203.
37. Yamamoto, H, Hashimoto, Y, and Ezaki, T. 1996. Study of nonculturable Legionella
pneumophila cells during multiple nutrient starvation. FEMS Microbiology Ecology 20(3):149-
154.
38. Yee, R B, and Wadowsky, R M. 1982. Multiplication of Legionella pneumophila in unsterilized
tap water. Applied and Environmental Microbiology 43(6):1330-1334.


L. pneumophila in drinking water biofilms
77
3.1 Introduction
Legionella pneumophila is an ubiquitous pathogen that, after infecting humans, will cause one of two
forms of disease; Legionnaire’s disease, the pneumonia form that can be fatal, and Pontiac’s fever, a
mild form of the disease similar to influenza [18, 20]. The route of transmission is mainly by inhalation
of contaminated aerosols [4, 24] and, being a waterborne pathogen, contamination of drinking water
plays a very important role in the outbreaks that still occur worldwide. In fact, this pathogen has been
isolated from drinking water distribution systems (DWDS), especially associated with biofilms [7, 11]
and is considered to be chlorine resistant [14, 15].
It is well known that several environmental conditions, such as temperature, iron concentration, carbon
source availability, plumbing materials, etc., can significantly influence the presence of L. pneumophila
in water and biofilms. However, all studies reported use standard agar plating methods (cultivability)
as a way to assess Legionella numbers [21, 22, 23, 25]. Under stressful conditions various pathogens,
including L. pneumophila, can enter a viable but non-cultivable (VBNC) state where the bacteria are
not able to grow directly on nutritious and selective medium [8, 10, 19, 26]. Moreover, when L.
pneumophila is sampled from its natural environment it is difficult to recover on artificial plating media
and is hence considered a fastidious microorganism [4]. In the last few years, molecular techniques
have been developed to try to overcome this non-cultivability problem, including the use of peptide
nucleic acid (PNA) specific probes which can identify specific microorganisms in complex microbial
consortia including biofilms [1, 17, 27]. Recently, it has been demonstrated that the PNA probe
PLPNE620 can be successfully used to specifically detect L. pneumophila in drinking water biofilms
[27].
The aim of this work is to study and compare the influence of different physico-chemical parameters,
such as temperature, carbon concentration and shear stress, on the survival of total and cultivable L.
pneumophila in heterotrophic biofilms.

Survival of drinking water pathogens after disinfection
78
3.2 Material and Methods
3.2.1 Biofilm experiments
The formation of biofilms was carried out using a two-stage chemostat model system (Figure 3.1a)
[12]. The first stage consisted of a 1-litre vessel (seed vessel) and the second stage consisted of three
1-litre vessels running in parallel, but connected in series with the seed vessel. All chemostats were
autoclaved and filled with filter-sterilized (0.2 μm pore size Nylon filter) tap water (1-litre). The seed
vessel was then inoculated with a microbial consortium that was obtained from tap water by filtration
through a 0.2 μm pore size Nylon filter (Pall Gelman, UK). Preliminary experiments have shown that
there was autochthonous L. pneumophila in the chemostats, by using the specific L. pneumophila
PNA probe. The seed vessel was maintained in batch mode for two days to promote microbial growth
and then changed into a continuous mode, being fed with filter-sterilized and dechlorinated tap water
at a flow rate of 50 ml h-1. This chemostat was operated at room temperature and stirred at 300 rpm to
ensure that the oxygen and nutrient concentrations were homogeneous. The effluent was divided in
three and used to feed the second stage chemostats; the biofilm-growing vessels. Each biofilm-
growing vessel was also fed with fresh medium (filter-sterilized tap water) at a flow rate that
maintained a dilution rate of 0.2 h-1 to promote typical environmental conditions for biofilm growth. The
first vessel, where no carbon source was added, was stirred at 300 rpm and served as a control. The
second vessel was stirred at 1200 rpm but with no carbon addition (high shear stress) and the third
vessel was stirred at 300 rpm and 8.8 mg l-1 of carbon was added by the inclusion of 30 mg l-1 of
sodium acetate to the fresh medium (high carbon concentration). The temperature was controlled at
either 15ºC or 20ºC by a proportional integral derivative unit system (Brighton Systems, UK). The first
temperature has been suggested to be a key temperature at which the cultivability of several
waterborne microorganisms starts to be affected [3], whereas the second is generally considered to be
the temperature of the drinking water during summer months. After 10 days, conditions in the biofilm-
growing vessels were stable and sterile unplasticized polyvinylchloride (uPVC) coupons could be
immersed (day 0). The coupons were removed after 1, 2, 4, 8, 16 and 32 days, gently rinsed to
remove planktonic cells attached to the surface of the biofilm, and scraped to quantify sessile cells
Figure 3.1a).
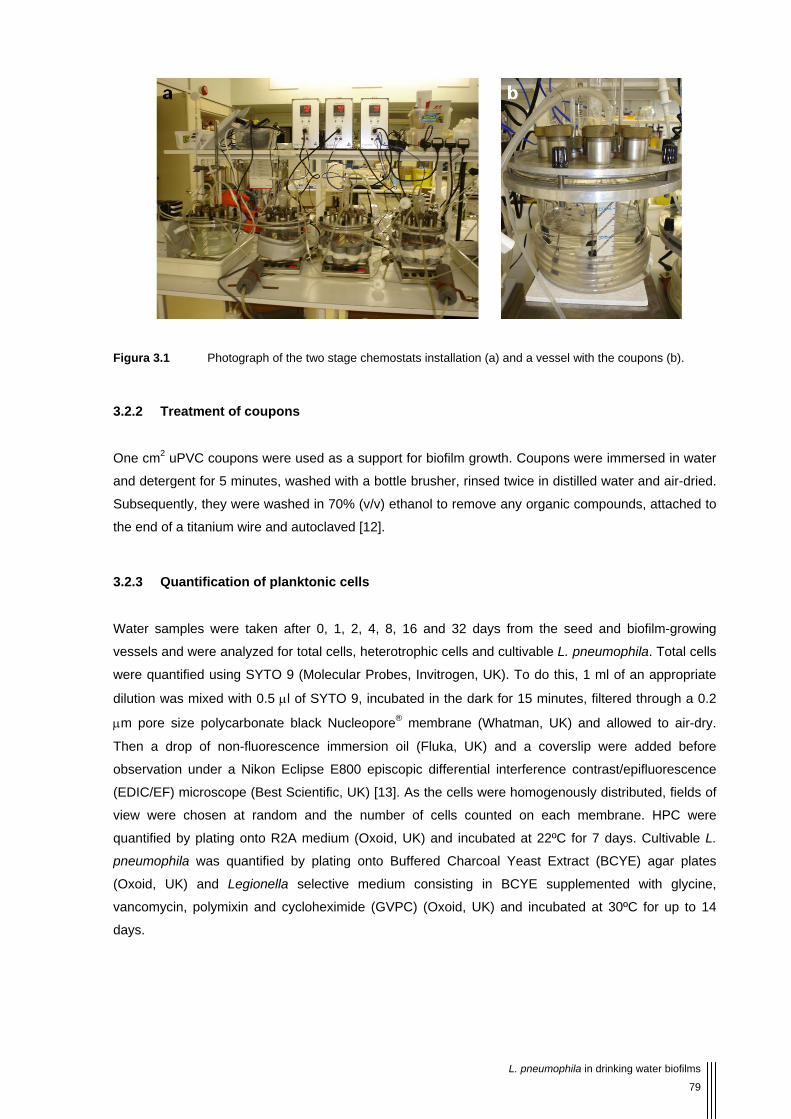
L. pneumophila in drinking water biofilms
79
Figura 3.1 Photograph of the two stage chemostats installation (a) and a vessel with the coupons (b).
3.2.2 Treatment of coupons
One cm2 uPVC coupons were used as a support for biofilm growth. Coupons were immersed in water
and detergent for 5 minutes, washed with a bottle brusher, rinsed twice in distilled water and air-dried.
Subsequently, they were washed in 70% (v/v) ethanol to remove any organic compounds, attached to
the end of a titanium wire and autoclaved [12].
3.2.3 Quantification of planktonic cells
Water samples were taken after 0, 1, 2, 4, 8, 16 and 32 days from the seed and biofilm-growing
vessels and were analyzed for total cells, heterotrophic cells and cultivable L. pneumophila. Total cells
were quantified using SYTO 9 (Molecular Probes, Invitrogen, UK). To do this, 1 ml of an appropriate
dilution was mixed with 0.5 μl of SYTO 9, incubated in the dark for 15 minutes, filtered through a 0.2
μm pore size polycarbonate black Nucleopore® membrane (Whatman, UK) and allowed to air-dry.
Then a drop of non-fluorescence immersion oil (Fluka, UK) and a coverslip were added before
observation under a Nikon Eclipse E800 episcopic differential interference contrast/epifluorescence
(EDIC/EF) microscope (Best Scientific, UK) [13]. As the cells were homogenously distributed, fields of
view were chosen at random and the number of cells counted on each membrane. HPC were
quantified by plating onto R2A medium (Oxoid, UK) and incubated at 22ºC for 7 days. Cultivable L.
pneumophila was quantified by plating onto Buffered Charcoal Yeast Extract (BCYE) agar plates
(Oxoid, UK) and Legionella selective medium consisting in BCYE supplemented with glycine,
vancomycin, polymixin and cycloheximide (GVPC) (Oxoid, UK) and incubated at 30ºC for up to 14
days.

Survival of drinking water pathogens after disinfection
80
3.2.4 Quantification of sessile cells
Coupons were immersed in 10 ml of filter-sterilized tap water containing autoclaved 2 mm diameter
glass beads (Merck, UK) and vortexed for one minute to remove all the biofilm from the coupons
surface and homogenize the suspension. Total cells, HPC and cultivable L. pneumophila were
quantified using the methods described above. In addition, total L. pneumophila were quantified using
the specific PNA probe PLPNE620 (5’-CTG ACC GTC CCA GGT-3’) (Eurogentec, Belgium) in a
fluorescence in situ hybridization assay (PNA-FISH) [27]. PNA-FISH was carried out by taking 1 ml of
an appropriate dilution and filtered through a 0.2 μm anodisc membrane (Whatman, UK). This was left
to air dry. Then the membrane was covered with 90% (v/v) ethanol to fix the cells and again air dried.
The hybridization, washing and microscopy observation method was performed as described by Wilks
and Keevil [27].
3.2.5 Confirmative tests
To verify which of the microorganisms isolated on BCYE were effectively L. pneumophila a loop of
each strain was resuspended in filter-sterilised tap water and plated onto BCYE, BCYE with no L-
cysteine addition (BCYE –cys) and GVPC before after acid and heat treatment. Acid treatment
consisted in mixing 500 μl of HCl – KCl buffer with 500 μl of sample followed by incubation at room
temperature for 5 minutes as described in the International Standard ISO 11731 [9]. Heat treatment
was performed by placing a 1 ml Eppendorf tube containing each sample in a water bath at 50ºC for
30 minutes [9]. All bacteria isolated on R2A or BCYE media were identified by 16S DNA sequencing at
DNAVision SA (Belgium). Briefly, for each culture DNA was purified, amplified and sequenced with
16S primers. The analysed fragments were about 1600 base pairs length. The sequenced fragments
were then BLASTed in the NCBI public database and therefore obtained the Genbank accession
number for the highest sequence similarity value.
3.2.6 Statistical analysis
The homogeneity of variances of total number of cells, total L. pneumophila, HPC and relation
between L. pneumophila of cells and total cells was checked by the Levene test for equality of
variances using a statistical package (SPSS Inc., Chicago IL, USA). Differences were subsequently
compared by a one-way ANOVA followed by a Bonferroni post hoc test. Differences were considered
relevant if P<0.05.
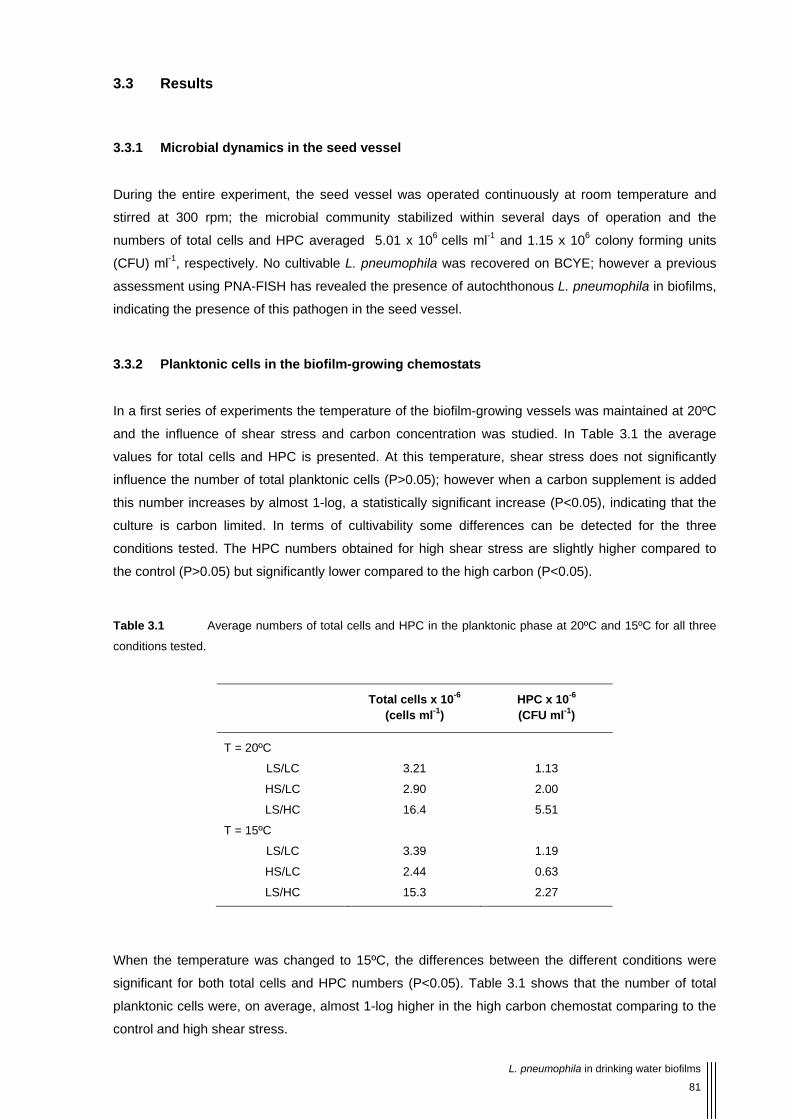
L. pneumophila in drinking water biofilms
81
3.3 Results
3.3.1 Microbial dynamics in the seed vessel
During the entire experiment, the seed vessel was operated continuously at room temperature and
stirred at 300 rpm; the microbial community stabilized within several days of operation and the
numbers of total cells and HPC averaged 5.01 x 10⁶ cells ml-1 and 1.15 x 10⁶ colony forming units
(CFU) ml-1, respectively. No cultivable L. pneumophila was recovered on BCYE; however a previous
assessment using PNA-FISH has revealed the presence of autochthonous L. pneumophila in biofilms,
indicating the presence of this pathogen in the seed vessel.
3.3.2 Planktonic cells in the biofilm-growing chemostats
In a first series of experiments the temperature of the biofilm-growing vessels was maintained at 20ºC
and the influence of shear stress and carbon concentration was studied. In Table 3.1 the average
values for total cells and HPC is presented. At this temperature, shear stress does not significantly
influence the number of total planktonic cells (P>0.05); however when a carbon supplement is added
this number increases by almost 1-log, a statistically significant increase (P<0.05), indicating that the
culture is carbon limited. In terms of cultivability some differences can be detected for the three
conditions tested. The HPC numbers obtained for high shear stress are slightly higher compared to
the control (P>0.05) but significantly lower compared to the high carbon (P<0.05).
Table 3.1 Average numbers of total cells and HPC in the planktonic phase at 20ºC and 15ºC for all three
conditions tested.
Total cells x 10-6 (cells ml-1)
HPC x 10-6 (CFU ml-1)
T = 20ºC
LS/LC 3.21 1.13
HS/LC 2.90 2.00
LS/HC 16.4 5.51
T = 15ºC
LS/LC 3.39 1.19
HS/LC 2.44 0.63
LS/HC 15.3 2.27
When the temperature was changed to 15ºC, the differences between the different conditions were
significant for both total cells and HPC numbers (P<0.05). Table 3.1 shows that the number of total
planktonic cells were, on average, almost 1-log higher in the high carbon chemostat comparing to the
control and high shear stress.

Survival of drinking water pathogens after disinfection
82
At both temperatures, the recovery of planktonic cultivable L. pneumophila was never possible for any
of the conditions tested, due to the overgrowth of other microorganisms and/or the loss of cultivability
by this pathogen.
Comparing the results obtained under the same conditions but for the two different temperatures, it
was verified that temperature had no influence on the total number of cells (P>0.05). Conversely, there
was an important decrease in the numbers of HPC in the vessels operated at a high shear stress and
high carbon concentration when the temperature was decreased (P<0.05).
3.3.3 L. pneumophila in heterotrophic biofilms
Figure 3.2a shows the results obtained for biofilm experiments at 20ºC. In terms of total cells it is
possible to observe that the curves for the three conditions tested overlap, meaning that the
differences between the three conditions tested gave similar results (P>0.05). The number of total L.
pneumophila quantified using the specific PNA probe, were not statistically different between the
control and high shear (P>0.05) but significantly different comparing these parameters to the high
carbon environment (P<0.05), indicating that high concentrations of carbon are the most favorable
condition to support sessile numbers of L. pneumophila, followed by the increase of shear stress. The
increase of carbon concentration also had a great effect on sessile HPC numbers (P<0.05) but the
increase of shear stress seems to have little effect on HPC numbers (P>0.05).
Figure 3.2b shows the results obtained for the biofilm experiments at 15ºC. At this temperature, it is
possible to observe that the numbers of total cells vary slightly during biofilm formation and between
the different conditions tested (what is also indicated for the value of P>0.05). Concerning the total L.
pneumophila, the numbers tended to be slightly higher when carbon was added (P>0.05). Apparently
the differences between the three conditions tested are only noticeable in terms of cultivable cells as it
was in the numbers of HPC that it was possible to obtain great differences (P<0.05).
Comparing the results obtained at 20ºC and 15ºC it was possible to observe that total cells and total L.
pneumophila numbers are quite different (P<0.05) while the HPC numbers are similar (P>0.05). In
general the total cells and the total L. pneumophila present in the biofilm were almost 1-log higher at
15ºC in all the conditions tested. When cultivable cells are compared, there were only significant
differences for HPC in the control experiment (P<0.05).

L. pneumophila in drinking water biofilms
83
Figura 3.2 Variation in the total cell number, total numbers of L. pneumophila and HPC in biofilms formed
at 20ºC (a) and 15ºC (b) in the control ( ), high shear stress ( ) and high concentration of carbon ( ).
In previous studies, the application of PNA probes to detect specific pathogens in situ (i.e. conducted
directly on the coupon substratum) was in part unsuccessful as the method was only able to detect
cells that were attached directly to the surface of the coupons as opposed to being embedded in
biofilm structures [1]. Although the PNA probe is well-known for being able to penetrate in biofilm
structures due to its hydrophobic character [5], in the current study it also failed to totally penetrate
thicker biofilms. Moreover, it was observed that more mature biofilms have a very bright EPS

Survival of drinking water pathogens after disinfection
84
(exopolymeric substances) matrix that interferes with the observations (Figure 3.3a and c). This
problem was overcome by resuspending the biofilm, diluting the sample and filtering onto a membrane
for FISH quantification (Figure 3.3b).
Figura 3.3 Microphotograph of hybridization with the L. pneumophila specific PNA probe: uPVC coupon
visualized under the TRITC channel (a) and scraped cells homogenized and filtered onto a membrane visualized
under the EDIC channel (c). Bars represent 20 μm. Average of the percentage of total L. pneumophila and total
flora (PNA/SYTO9), for all the conditions tested at both temperatures (d).
In Figure 3.3d it is possible to observe some significant differences which illustrate the influence of the
different conditions on the inclusion of L. pneumophila in heterotrophic biofilms according the
conditions that the biofilm was formed. The relation of L. pneumophila was on average 10% at 20ºC of
the total biofilm microbial consortium in the control experiment and did not change significantly with
the different conditions tested (P>0.05). However when temperature is decreased from 20ºC to 15ºC
the percentage of total L. pneumophila in relation to total cells is double for the control and high
carbon concentration but similar for high shear stress (P=1.000).

L. pneumophila in drinking water biofilms
85
3.3.4 Confirmative tests and bacterial identification
In a preliminary experiment the biofilm samples were plated on BCYE and GVPC agar plates. The
microorganisms failed to grow on GVPC most of the time and the few colonies obtained did not have a
typical L. pneumophila physiology. It was also observed that the microorganisms growing on GVPC
were also growing on BCYE. All microorganisms grown on BCYE were isolated and a series of L.
pneumophila confirmative tests were performed [9]. All strains grew on GVPC but failed to grow after
acid treatment except one (Table 3.2).
Table 3.2 Results of 16S DNA sequencing and PNA test for the colonies isolated on BCYE and R2A and
confirmative tests performed on colonies isolated on BCYE and on L. pneumophila NCTC12821.
Medium/
Physiology
Identification by 16S
DNA sequencing PNA
Before treatment After acid treatment After heat treatment B
CY
E
BC
YE
-c
ys
GV
PC
BC
YE
BC
YE
-c
ys
GV
PC
BC
YE
BC
YE
-c
ys
GV
PC
R2A/white Acidovorax spp. -
R2A/yellow Sphingobium yanoikuyae -
R2A/orange Saprospiraceae spp. -
BCYE/purple Stenotrophomonas spp. - + + + - - - + + +
BCYE/pink Pseudomonas spp. nd + - + - - - + + -
BCYE/white Mycobacterium chelonae - + - + + + + + + +
BCYE/yellow Variovorax paradoxus - nd nd nd nd nd nd nd nd nd
L. pneumophila n.a. + + - + + - + + - +
Legend: na: not applicable; nd: not determined; -: negative result; +: positive result
The conjugation of all the results indicated that none of the microorganisms isolated were L.
pneumophila species, what was confirmed by the results of the 16S DNA sequencing that identified
them as Mycobacterium chelonae, Pseudomonas spp., Variovorax paradoxus and Stenotrophomonas
spp. (Table 3.2).
All of the microorganisms isolated on BCYE and R2A were also tested with the highly specific L.
pneumophila PNA probe and results showed that these microorganisms did not bind with the PNA
probe (Table 3.2), confirming the results obtained in a previous study [27].

Survival of drinking water pathogens after disinfection
86
3.4 Discussion
The fresh medium flow rate that was feeding the biofilm-growing vessels was chosen based on the
literature [1, 21, 22]. By maintaining a dilution rate of 0.2 h-1, equivalent to a mean generation time of
3.5 hours, a washout is promoted and cells have little time to grow in the planktonic phase, creating
the typical conditions to form biofilms [12]. The similarity in the numbers obtained for total planktonic
cells in all the chemostats at both temperatures confirms that there is little growth in the planktonic
phase, the differences being due to biofilm detachment. Apparently at 20ºC the shear stress does not
influence the cultivability of HPC, as the average numbers were quite similar to the control experiment
contrary of what happens at 15ºC where a decrease was observed in the cultivability numbers when
shear stress was higher (P<0.05). When carbon was supplemented the number of total cells was
significantly higher compared to the other two chemostats and the cells also appeared much more
active, as cultivable numbers were also higher (P<0.05). This might be due the sloughing off of larger
portions of biofilm as it was noticed that the biofilms grown under high carbon concentration were
thicker and have a slimier aspect, due the formation of the EPS matrix.
In Figure 3.2a and b it is possible to confirm that, at 20ºC and 15ºC, respectively, the biofilm formation
kinetics follows a typical curve described by other authors [2, 21, 22]. In spite of the fact that the
number of total cells are not statistically different for the three conditions tested for the same
temperature (P>0.05), when the cultivability is studied the influence of the different conditions is
noticeable (P<0.05). This comparison leads to a conclusion that the carbon concentration influences
the biofilm growth more than the shear stress, probably stimulating the growth and multiplication of at
least some microorganisms inside of the biofilm. This is corroborated by the fact that, at 20ºC, the total
cells of the biofilm grown under high carbon concentration increased faster with biofilm age, contrary
to what happens in the other two fermenters. At 15ºC the increase is smoother. This indicates that the
biofilm behavior of this potable water community is greatly influenced by temperature, which is
corroborated by the fact that at 15ºC there are more cells in the biofilm than at 20ºC (P<0.05).
At 20ºC it is observed that the percentage of total L. pneumophila in relation to total cells does not vary
significantly with shear stress and carbon concentration, indicating that for the experimental conditions
tested there is no selection of total L. pneumophila adhered to the uPVC surfaces. Conversely, at
15ºC, although the differences are not very evident (P>0.05), this percentage diminishes slightly when
the shear stress is high. Comparing the percentage obtained at 15ºC and at 20ºC it is possible to
conclude that lower temperatures favour the inclusion of L. pneumophila during biofilm formation,
especially in the control and when carbon is added.
Concerning the temperature effect on biofilm formation, it was observed that at 15ºC the number of
total cells and total L. pneumophila is higher, showing that at lower temperatures adhesion is
promoted, which is perhaps not surprising as at this temperature cells should be more stressed. It
should be noted that the optimal growth temperature of this opportunistic human pathogen might
exceed 37ºC under some circumstances [16].

L. pneumophila in drinking water biofilms
87
The lack of recovery of cultivable L. pneumophila can be due the overgrowth of other microorganisms
but also by the ability that this microorganism has shown to enter into a VBNC state when stressed.
However, it has also been demonstrated that in favourable conditions this microorganism is able to
recover cultivability and cause infections [6, 8]. The PNA-FISH method is a tool that can be
successfully used to detect specific pathogens in drinking biofilms [1, 17, 27]. Previous studies
demonstrated that the PNA probe PLPNE620 is highly specific for L. pneumophila and do not bind
with other drinking water microorganisms inside of biofilms unless the biofilm has been spiked with L.
pneumophila [27].
In this study, it has been shown that even having high numbers of total L. pneumophila present the
recovery of this pathogen to artificial media might remain elusive. It was also observed that the signal
emitted by the cells labeled by PNA-FISH remained bright, which is indicative of a high rRNA content
and therefore of cell viability [1, 17, 27]. This points to the existence of VBNC cells that, not being
detected by standard methods, can give false results concerning water quality. This has public health
concerns as Steinert and colleagues [24] have hypothesized that Pontiac fever is caused by VBNC L.
pneumophila. Moreover, if treatment of water contaminated with VBNC L. pneumophila was not
improved, then this could lead to resuscitation and multiplication of the pathogen under appropriate
conditions such as in biofilms in static dead ends of water supply pipes or in shower heads or in the
sediment of corroding water tanks. This effect would be exacerbated if the carbon concentration of
these waters was higher than for the normal water supply, increasing the numbers of VBNC and/or
cultivable L. pneumophila present.
The fact that the percentage of L. pneumophila was considerably high even in unfavourable conditions
(on average 21% of the total microbial community in the control vessel), raises new concerns about
the presence of L. pneumophila in drinking water systems and even though outbreaks of Legionnaire’s
disease are not that frequent, it is possible that infections caused by this pathogen still happen in a
mild form, and are being ignored.

Survival of drinking water pathogens after disinfection
88
3.5 Acknowledgments
This work was supported by the Portuguese Institute Fundação para a Ciência e Tecnologia (PhD
grant SFRH/BD/17088/2004) and has been undertaken as part of a research project supported by the
European Commission within the Fifth Framework Programme, “Energy, Environment and sustainable
development programme”, no. EVK1-CT-2002-00108. Disclaimer stating that the author is solely
responsible for the work, it does not represent the opinion of the Community and the Community is not
responsible for any use that might be made of data appearing therein.
L. pneumophila in drinking water biofilms
89
3.6 References
1. Azevedo, N F, Vieira, M J, and Keevil, C W. 2003. Establishment of a continuous model
system to study Helicobacter pylori survival in potable water biofilms. Water Science and
Technology 47(5):155-160.
2. Codony, F, Morato, J, Ribas, F, and Mas, J D. 2002. Effect of chlorine, biodegradable
dissolved organic carbon and suspended bacteria on biofilm development in drinking water
systems. Journal of Basic Microbiology 42(5):311-319.
3. Colbourne, J S. 1985. Materials usage and their effects on the microbiological quality of
water supplies. Society for Applied Bacteriology Symposium Series 14(47S-59S.
4. Devos, L, Boon, N, and Verstraete, W. 2005. Legionella pneumophila in the environment:
The occurrence of a fastidious bacterium in oligotrophic conditions. Reviews in Environmental
Science and Biotechnology 4(1):61-74.
5. Drobniewski, F A, More, P G, and Harris, G S. 2000. Differentiation of Mycobacterium
tuberculosis complex and nontuberculous mycobacterial liquid cultures by using peptide
nucleic acid fluorescence in situ hybridization probes. Journal of Clinical Microbiology
38(1):444-447.
6. Garcia, M T, Jones, S, Pelaz, C, Millar, R D, and Abu Kwaik, Y. 2007. Acanthamoeba
polyphaga resuscitates viable non-culturable Legionella pneumophila after disinfection.
Environmental Microbiology 9(5):1267-1277.
7. Hsu, S C, Martin, R, and Wentworth, B B. 1984. Isolation of Legionella species from drinking
water. Applied and Environmental Microbiology 48(4):830-832.
8. Hussong, D, Colwell, R R, O'Brien, M, Weiss, E, Pearson, A D, Weiner, R M, and Burge, W D. 1987. Viable Legionella pneumophila not detectable by culture on agar media. Nature
Biotechnology 5(9):947-950.
9. International Organization for Standardization. 1998. ISO 11731: Water quality - detection
and enumeration of Legionella.
10. James, B W, Mauchline, W S, Dennis, P J, Keevil, C W, and Wait, R. 1999. Poly-3-
hydroxybutyrate in Legionella pneumophila, an energy source for survival in low nutrient
environments. Applied and Environmental Microbiology 65(2):822-827.
11. Keevil, C W. 2002. Pathogens in environmental biofilms In: G. Bitton (ed.), The Encyclopedia
of Environmental Microbiology. Wiley, New York, pp. 2339-2356.
12. Keevil, C W. 2001. Continuous culture models to study pathogens in biofilms. Methods in
Enzimology 337(104-122.
13. Keevil, C W. 2003. Rapid detection of biofilms and adherent pathogens using scanning
confocal laser microscopy and episcopic differential interference contrast microscopy. Water
Science and Technology 47(5):105-116.
14. Kuchta, J M, States, S J, McGlaughlin, J E, Overmeyer, J H, Wadowsky, R M, McNamara, A M, Wolford, R S, and Yee, R B. 1985. Enhanced chlorine resistance of tap water adapted
Legionella pneumophila as compared with agar medium passaged strains. Applied and
Environmental Microbiology 50(1):21-26.

Survival of drinking water pathogens after disinfection
90
15. Kuchta, J M, States, S J, McNamara, A M, Wadowsky, R M, and Yee, R B. 1983.
Susceptibility of Legionella pneumophila to chlorine in tap water. Applied and Environmental
Microbiology 46(5):1134-1139.
16. Kusnetsov, J M, Ottoila, E, and Martikainen, P J. 1996. Growth, respiration and survival of
Legionella pneumophila at high temperatures. Journal of Applied Bacteriology 81(341-347.
17. Lehtola, M J, Torvinen, E, Miettinen, L T, and Keevil, C W. 2006. Fluorescence in situ
hybridization using peptide nucleic acid probes for rapid detection of Mycobacterium avium
subsp avium and Mycobacterium avium subsp paratuberculosis in potable water biofilms.
Applied and Environmental Microbiology 72(1):848-853.
18. McDade, J E, Shepard, C C, Fraser, D W, Tsai, T R, Redus, M A, and Dowdle, W R. 1977.
Legionnaires' disease - isolation of a bacterium and demonstration of its role in other
respiratory disease. New England Journal of Medicine 297(22):1197-1203.
19. Oliver, J D. 2005. The viable but nonculturable state in bacteria. Journal of Microbiology
43(93-100.
20. Pasculle, W. 2000. Update on Legionella. Clinical Microbiology Newsletter 22(13):97-101.
21. Rogers, J, Dowsett, A B, Dennis, P J, Lee, J V, and Keevil, C W. 1994. Influence of
plumbing materials on biofilm formation and growth of Legionella pneumophila in potable
water systems. Applied and Environmental Microbiology 60(6):1842-1851.
22. Rogers, J, Dowsett, A B, Dennis, P J, Lee, J V, and Keevil, C W. 1994. Influence of
temperature and plumbing material selection on biofilm formation and growth of Legionella
pneumophila in a model potable water system containing complex microbial flora. Applied and
Environmental Microbiology 60(5):1585-1592.
23. States, S J, Conley, L F, Kuchta, J M, Oleck, B M, Lipovich, M J, Wolford, R S, Wadowsky, R M, McNamara, A M, Sykora, J L, Keleti, G, and Yee, R B. 1987. Survival and
multiplication of Legionella pneumophila in municipal drinking-water systems. Applied and
Environmental Microbiology 53(5):979-986.
24. Steinert, M, Hentschel, U, and Hacker, J. 2002. Legionella pneumophila: an aquatic microbe
goes astray. FEMS Microbiology Reviews 26(2):149-162.
25. Wadowsky, R M, Wolford, R, McNamara, A M, and Yee, R B. 1985. Effect of temperature,
ph, and oxygen level on the multiplication of naturally occurring Legionella pneumophila in
potable water. Applied and Environmental Microbiology 49(5):1197-1205.
26. West, A A, Rogers, J, Lee, J V, and Keevil, C W. 1992. Lack of dormancy in Legionella
pneumophila? In: J. M. Barbaree, R. F. Breiman, and A. P. Dufour (ed.), Legionella. Current
state and emerging perspectives. American Society for Microbiology Press, Washington DC,
pp. 201-203.
27. Wilks, S A, and Keevil, C W. 2006. Targeting species-specific low-affinity 16S rRNA binding
sites by using peptide nucleic acids for detection of legionellae in biofilms. Applied and
Environmental Microbiology 72(8):5453-5462.


Biofilms protect L. pneumophila to chlorination
93
4.1 Introduction
Under stressful conditions microorganisms can adhere to surfaces to form a biofilm, where they are
protected from external stressors, such as the action of biocides [8, 10, 11, 19, 21]. Consequently, it is
no surprise that biofilms are ubiquitous in drinking water distribution systems (DWDS) and, in some
cases, are related to public health problems [8, 32]. Health concerns arise not only due to the
protection that biofilms can offer to some pathogens, but also to an increased resistance to biocides
being developed by pathogens as an adaptation mechanism. This resistance has been observed for
chlorine, the disinfectant most commonly used in DWDS disinfection [29].
Disinfection efficiency is still assessed by standard cultivation methods, however it is well known that
some microorganisms can enter a viable but non-cultivable (VBNC) state, which means that they are
not able to grow on highly nutritious and selective artificial media but still retain viability and recover
their activity when favourable conditions are found [14, 15, 26, 34]. The non-cultivability of fastidious
microorganisms requires the development of new techniques to replace standard methods [36].
Recently, molecular techniques to detect specific pathogens in biofilms have been developed, most
noticeably the combination of fluorescence in situ hybridization with the use of peptide nucleic acid
probes (PNA-FISH) [4, 22, 35].
Legionella pneumophila is one of the pathogens most commonly isolated from DWDS [3, 18]. The
natural habitat of this microorganism is considered to be freshwater and it is believed that a parasitic
relationship with other environmental microorganisms, such as amoebae, is necessary for L.
pneumophila to multiply [1, 24, 30]. The ability of this pathogen to incorporate into biofilms has been
well-documented [27, 28], however these studies used type collections strains to spike the chemostats
and also relied on standard plating procedures for quantification, which fail to detect VBNC cells. In
fact, it has been demonstrated that ubiquitous uncultivable L. pneumophila can be detected in water
by PCR [9, 20, 38]. To understand the real numbers at which L. pneumophila might reside in DWDS
biofilms and how chlorine concentration affects these numbers is of utmost importance, as it has been
recently published that resuscitation of VBNC L. pneumophila by contact with amoebic trophozoites
occurs even after contact with sodium hypochlorite-disinfected water sources [5, 12].
As such, the aim of this work is to study the effect of different concentrations of chlorine on L.
pneumophila associated with drinking water biofilms, and compare the numbers obtained by standard
culture methods with the numbers obtained with PNA-FISH when a PNA probe highly specific for L.
pneumophila is used.

Survival of drinking water pathogens after disinfection
94
4.2 Material and Methods
4.2.1 Biofilm experiments
The formation of biofilms was carried out using a two-stage chemostat model system [17]. The first
stage consisted of one 1-litre vessel (seed vessel) and the second stage consisted of three 1-litre
vessels running in parallel, but connected in series with the seed vessel. All chemostats were
autoclaved and filled with filter-sterilized tap water (1-litre). The seed vessel was then inoculated with a
microbial consortium that was obtained from tap water by filtration through a 0.2 μm pore size Nylon
filter (Pall Gelman, UK). Preliminary experiments have shown that there was autochthonous L.
pneumophila in the chemostats, by using the specific L. pneumophila PNA probe. The seed vessel
was maintained in batch mode for two days to promote microbial growth and then changed to a
continuous mode, being fed with filter-sterilized and dechlorinated tap water at a flow rate of 50 ml h-1.
This chemostat was operated at room temperature and stirred at 300 rpm to ensure that the oxygen
and nutrient concentration were homogeneous. The exit culture was divided in three and used to feed
the second stage chemostats; the biofilm-growing vessels. Each biofilm-growing vessel was also fed
with fresh media (filter-sterilized tap water) at a flow rate that maintained the dilution rate at 0.2 h-1 to
promote the typical environmental conditions for biofilm growth. All the vessels were stirred at 300 rpm
and the temperature was controlled at 15ºC by a proportional integral derivative unit system (Brighton
Systems, UK). To one of the biofilm-growing vessels no chlorine was added, serving as a control, and
to the other two vessels chlorine was continuously supplemented, with the concentration maintained at
0.2 mg l-1 and 1.2 mg l-1. After 10 days, conditions in the biofilm-growing vessels were stable and
sterile unplasticized polyvinylchloride (uPVC) coupons could be immersed. The coupons were
removed after 1, 2, 4, 8, 16 and 32 days, gently rinsed to remove planktonic cells attached to the
surface of the biofilm, and scraped to quantify sessile cells.
4.2.2 Treatment of coupons
In this study 1 cm2 uPVC coupons were used as a surface to grow biofilms. Coupons were immersed
in water and detergent for 5 minutes, washed with a bottle brusher, rinsed twice in distilled water and
air-dried. Subsequently, they were washed in 70% (v/v) ethanol to remove any organic residue that
could be on their surface, suspended on a titanium wire and autoclaved [17].
4.2.3 Quantification of planktonic cells
At day 0 (when coupons were immersed) and at all sampling days, water samples from the seed and
biofilm-growing vessels were also taken for total cells, heterotrophic cells (HPC) and cultivable L.
pneumophila quantification. Total cells were quantified by SYTO 9 (Molecular Probes, Invitrogen, UK).
In summary, 1 ml of an appropriate dilution was mixed with 0.5 μl of SYTO 9, incubated in the dark for
15 minutes, filtered through a 0.2 μm pore size black polycarbonate Nucleopore® membrane

Biofilms protect L. pneumophila to chlorination
95
(Whatman, UK) and allowed to air-dry. Then, a drop of non-fluorescence immersion oil (Fluka, UK)
and a coverslip were added before observation under a Nikon Eclipse E800 episcopic differential
interference contrast/epifluorescence (EDIC/EF) microscope (Best Scientific, UK) [16]. As the cells
were homogenously distributed, several fields were chosen at random and counted on each
membrane. Heterotrophic species were quantified by heterotrophic plate count (HPC) on low nutrient
R2A medium (Oxoid, UK) and incubated at 22ºC for 7 days. Cultivable L. pneumophila were quantified
by plating onto Buffered Charcoal Yeast Extract (BCYE) agar plates (Oxoid, UK) and incubated at
30ºC for up to 14 days.
4.2.4 Quantification of sessile cells
Coupons were immersed in 2 ml of filter-sterilized tap water containing sterile 2 mm diameter glass
beads (Merck, UK) and vortexed for one minute to remove all the biofilm from the coupons surface
and homogenize the suspension. Total cells, HPC, and cultivable L. pneumophila were quantified
using the methods described above. In addition total L. pneumophila were quantified using the highly
specific PNA probe with the following sequence 5’-CTG ACC GTC CCA GGT-3’ (PLPNE620)
(Eurogentec, Belgium) [35]. In that case, 1 ml of an appropriate dilution was filtered through a 0.2 μm
anodisc membrane (Whatman, UK) and air dried. Then the membrane was covered with 90% (v/v)
ethanol to fix the cells and air dried. The hybridization, washing and microscopy observation method
were performed as described by Wilks and Keevil [35].
4.2.5 Chlorine measurements and inactivation
Two of the biofilm-growing vessels were also continuously fed with chlorine, provided by 2 working
solutions prepared every two days from a 5 g l-1 stock solution (Guest Medical, UK). Chlorine
concentration was controlled on a daily basis by measuring free chlorine in the water vessels by the
N,N-dimethyl-p-phenilenediamine (DPD) colorimetric method, as described in the Standard Methods
for the Examination of Water and Wastewater [2], except for the wavelength used (492 nm). To
quantify planktonic and sessile cells from these two vessels, it was necessary to neutralize chlorine.
For that sodium thiosulphate (Sigma, UK) at a final concentration of 5 mg l-1 was added to the water
samples and to the water where the coupons were immersed.
4.2.6 Statistical analysis
The homogeneity of variances of total number of cells, total L. pneumophila, HPC and relation
between L. pneumophila of cells and total cells was checked by the Levene test for equality of
variances using a statistical package (SPSS Inc., Chicago IL, USA). Differences were subsequently
compared by a one-way ANOVA followed by a Bonferroni post hoc test. Differences were considered
relevant if P<0.05.

Survival of drinking water pathogens after disinfection
96
4.3 Results and Discussion
4.3.1 Population in the planktonic phase
After 10 days operating in a continuous mode, the microorganisms present in the inoculum obtained
from tap water were already adapted to the chemostat environment and the experiment was started by
immersing the uPVC coupons in the biofilm-growing chemostats. As such, the numbers of total cells in
the planktonic phase, in general, were not statistically different (P>0.05), being the average of total
numbers for all the chemostats summarised on Table 4.1. Comparing the results obtained for the
different concentrations of chlorine added, it was observed that the HPC numbers decreased
significantly with the increase of chlorine concentration (P<0.05); thus the concentration of cells was
almost 1-log lower in the chlorinated vessels. The surviving culturable HPC represented only 5% of
the total cells present when exposed to 1.2 mg Cl2 l-1 compared to almost 40% in the absence of
chlorine. In terms of total cells there were significant differences between the control and the
chlorinated conditions (P<0.05) but the results were similar when the two concentrations of chlorine
are compared (P>0.95). This indicates that different concentrations of chlorine (at least for low
concentrations) have little effect on total numbers of cells but they become less cultivable.
Table 4.1 Numbers of planktonic total cells, HPC Numbers of planktonic total cells, HPC and relation
between HPC and total cells in the seed, control and in the chlorinated biofilm-growing vessels.
Total cells x 10-6 (cells ml-1)
HPC x 10-5
(CFU ml-1) HPC / total cells
(%)
Seed vessel 2.46 5.73 23.3
Biofilm-growing vessels
0.0 mgCl2 l-1 2.10 8.38 39.9
0.2 mgCl2 l-1 1.26 1.98 15.7
1.2 mgCl2 l-1 1.55 0.78 5.0
The quantification of cultivable L. pneumophila was not possible for any sample from the seed vessel
and the biofilm-growing. This occurred mainly because the two-stage chemostat system was not
spiked with a strain from culture collections, but found instead to be colonized by environmental L.
pneumophila as assessed by the highly specific PNA probe. It is well-known, however, that many

Biofilms protect L. pneumophila to chlorination
97
environmental strains of L. pneumophila are typically VBNC and as such unable to be recovered to
plating media from water [9, 20, 38]. In addition, other microorganisms were able to grow on the BCYE
medium, which means that even if a small proportion of L. pneumophila cells are viable, these might
be overgrown by other species (see also Chapter 3).
4.3.2 L. pneumophila in heterotrophic biofilms
In Figure 4.1, the curves representing the numbers of cells in the biofilm (total cells, total L.
pneumophila and HPC) denote the traditional shape of biofilm accumulation [7, 27, 28]. It is possible
to observe that most of the total cells and total L. pneumophila (calculated using the L. pneumophila
specific PNA probe) attached during the first few days and then varied within a narrow range (P>0.05).
Figura 4.1 Variation in the total cell number (a), total numbers of L. pneumophila (b) and HPC (c) in
biofilms formed when no chlorine is added ( ), when chlorine is continuously added to a final concentration of 0.2
mg l-1 ( ) and 1.2 mg l-1 ( ). Average of the relation between the numbers total L. pneumophila and total cells for
all the conditions tested (d).
Figure 4.1 shows that the numbers of total cells in the control vessel were only slightly lower than the
numbers obtained when chlorine was added. Biofilms are preferentially formed by stressed cells and

Survival of drinking water pathogens after disinfection
98
as chlorine is a well-known stressing agent it comes as no surprise that in the vessels where chlorine
is added more cells attach to the surface to form the biofilm. This is corroborated by the direct
observation of the uPVC coupons using episcopic differential interference contrast (EDIC) microscopy,
showing that the biofilm formed under chlorinated conditions was quantitatively and structurally similar
to the biofilm formed when no chorine was added (Figure 4.2), although coupons removed from the
non-chlorinated vessel looked slimier than the coupons with biofilm growth under chlorine addition.
Moreover, several studies have shown previously that biofilms can even grow in the presence of
chlorine [19, 25].
Figura 4.2 Microphotograph of a uPVC coupon visualized under the EDIC channel. The coupon was
covered with a 32 days-old biofilm formed in the absence of chlorine (a); in the presence of 1.2 mg ml-1 of free
chlorine (b). Bars represent 20 μm.
The numbers of total L. pneumophila quantified by the use of the PLPNE620 PNA probe did not vary
significantly with time for all the concentrations tested (P>0.05) and were similar appear to be similar
on biofilms formed under the three different concentrations. This suggests that chlorine has also little
effect on this particular pathogen to incorporate in biofilms. On the other hand, the percentage of total
L. pneumophila was on average approximately 20% of the total cells, under all biofilm formation
conditions. This is still a strikingly high result considering that the chemostats were not spiked with L.
pneumophila. It is true that there is no certainty on whether L. pneumophila is still in the viable state,
as no cultivable L. pneumophila was successfully recovered from any of the biofilm samples, but the
fact that the PNA probe is able to detect it and exhibit a bright fluorescence signal implies the
presence of a high 16S rRNA within the cells which strongly suggests that the bacterium might be in a
VBNC state. The non-recovery of cultivable L. pneumophila had also been observed in a previous
study investigating nutrient deprivation and the microorganisms isolated on selective agar were
identified afterwards as not being Legionella species by 16S DNA sequencing (Chapter 3).
The major differences appear when cultivable cells were quantified, as HPC numbers are much lower
in chlorinated conditions comparing to the control assay (P<0.05), which is supported by two studies
conducted by Codony et al. [6, 7], where it is verified that under chlorinated conditions the total

Biofilms protect L. pneumophila to chlorination
99
number of cells are similar to the control study but cells are less cultivable. In fact it was noticed that in
the control the HPC numbers were 2-log lower than in the biofilms formed in chlorinated water while
the difference for the two concentrations used was not significant (P>0.05), indicating that chlorine
maintains biofilm formation within a certain range.
4.3.3 Impact of chlorine on biofilm physiology
The morphology of the colonies obtained on R2A and on BCYE was similar for the samples of
planktonic and sessile cells, although in some sporadic cases the colonies appeared smaller and less
mucoid in the samples obtained from the chlorinated vessels. On the other hand, the planktonic cells
stained with SYTO 9 and observed by microscopy had mainly a rod shape and were very bright while
the sessile cells appeared as small and faint dots (results not shown) which is not surprising as cells in
a biofilm normally adapt and change their characteristics [13, 33]. It was also observed that the
coupons removed from the control vessel started to have a slimy aspect after 2 weeks but the
coupons removed from the chlorinated vessels never showed a slimy appearance. This slime might be
due to the presence of polymeric substances that form the typical EPS (extracellular polymeric
substance) matrix that involves the biofilms, protecting them from the external conditions [31, 36].
Under chlorinated conditions there was no visible EPS which might mean that the cells in the biofilm
are more exposed to chlorine, as the diffusion through the biofilm with scarce EPS matrix is easier and
deeper than when the matrix is thicker, resulting in loss of cultivability when biofilms are formed in
chlorinated water.
4.3.4 Impact of this study on public heath
This work reveals some important behaviour and characteristics of environmental L. pneumophila,
showing that this microorganism can reach up to 25% of the total microbial community of a biofilm,
despite the presence of chlorine.
The highest concentration of chlorine used in this work was greater than the concentration advised by
the World Health Organization (between 0.2 and 0.5 mg l-1) [37] but the numbers of total L.
pneumophila remained constant. Although no cultivable L. pneumophila was detected, considering
that cells detected by PNA FISH (cells with intact rRNA) might be still viable and that previous studies
have shown that L. pneumophila can lose cultivability without losing viability (Chapter 2), a pertinent
question remains: is L. pneumophila retaining its virulence and still able to cause infections? Relying
on the studies conducted by Hussong and colleagues [14] that showed that this pathogen can lose
cultivability in stressful conditions but maintain its virulence then it is plausible that the answer is yes.
As it has been stated before, L. pneumophila total cell numbers in biofilms were independent of
chlorine concentration, which supports the view that efforts to eliminate the pathogen from DWDS are
inadequate. In fact, if chlorine concentrations peak at a certain point in the DWDS, thereby
contributing for the enrichment of the pathogen in biofilms, L. pneumophila might use their dominant

Survival of drinking water pathogens after disinfection
100
position in terms of numbers and viability to further establish itself downstream in the DWDS. As such,
a better strategy would be to make sure that residual disinfectant levels through the entire DWDS
network are maintained in order to restrain L. pneumophila resuscitation via contact with amoebae.
With the constant disinfection failures that have been observed in many DWDS, it is perhaps
surprising that L. pneumophila infection has not been even more widespread. Possible explanations
include stress-induced lack of virulence, the minimum inoculum concentration to establish infection
and the effect of low temperatures [23], the fact that most infections occur via aerosolized particles
and even the possible lack of infectious ability by many strains due to their genetic repertoire.
Whatever the real answer is, it appears that biofilms play a key role in sustaining the survival of the
bacterium under stressful conditions, so that cells can replicate again as soon as more favorable
conditions are found.

Biofilms protect L. pneumophila to chlorination
101
4.4 Acknowledgements
This work was supported by the Portuguese Institute Fundação para a Ciência e Tecnologia (PhD
grant SFRH/BD/17088/2004) and has been undertaken as part of a research project supported by the
European Commission within the Fifth Framework Programme, “Energy, Environment and sustainable
development programme”, no. EVK1-CT-2002-00108. Disclaimer stating that the author is solely
responsible for the work, it does not represent the opinion of the Community and the Community is not
responsible for any use that might be made of data appearing therein.

Survival of drinking water pathogens after disinfection
102
4.5 References
1. Albert-Weissenberger, C, Cazalet, C, and Buchrieser, C. 2007. Legionella pneumophila - a
human pathogen that co-evolved with fresh water protozoa. Cellular and Molecular Life
Sciences 64(4):432-448.
2. American Public Health Association. 1998. Standard methods for the examination of water
and wastewater, In: L. S. Clesceri, A. E. Greenberg, and A. D. Eaton (ed.), 20th ed. American
Public Health Association, American Water Works Association, Water Environmental
Federation, Washington DC. pp. 4.63-4.64
3. Atlas, R M. 1999. Legionella: from environmental habitats to disease pathology, detection and
control. Environmental Microbiology 1(4):283-293.
4. Azevedo, N F, Vieira, M J, and Keevil, C W. 2003. Establishment of a continuous model
system to study Helicobacter pylori survival in potable water biofilms. Water Science and
Technology 47(5):155-160.
5. Bouyer, S, Imbert, C, Rodier, M H, and Hechard, Y. 2007. Long-term survival of Legionella
pneumophila associated with Acanthamoeba castellanii vesicles. Environmental Microbiology
9(5):1341-1344.
6. Codony, F, Morato, J, and Mas, J. 2005. Role of discontinuous chlorination on microbial
production by drinking water biofilms. Water Research 39(9):1896-1906.
7. Codony, F, Morato, J, Ribas, F, and Mas, J D. 2002. Effect of chlorine, biodegradable
dissolved organic carbon and suspended bacteria on biofilm development in drinking water
systems. Journal of Basic Microbiology 42(5):311-319.
8. Costerton, J W, Lewandowski, Z, Caldwell, D E, Korber, D R, and Lappin-Scott, H M. 1995. Microbial biofilms. Annual Review of Microbiology 49(1):711-745.
9. Diederen, B M W, de Jong, C M A, Aarts, I, Peeters, M F, and van der Zee, A. 2007.
Molecular evidence for the ubiquitous presence of Legionella species in Dutch tap water
installations. Journal of Water and Health 5(3):375-383.
10. Emtiazi, F, Schwartz, T, Marten, S M, Krolla-Sidenstein, P, and Obst, U. 2004.
Investigation of natural biofilms formed during the production of drinking water from surface
water embankment filtration. Water Research 38(5):1197-1206.
11. Fletcher, M, and Marshall, K C. 1982. Are solid surfaces of ecological significance to aquatic
bacteria In: K. C. Marshall (ed.), Advances in microbial ecology, vol. 6. Plenum Publishing
Corp, New York, pp. 199-230.
12. Garcia, M T, Jones, S, Pelaz, C, Millar, R D, and Abu Kwaik, Y. 2007. Acanthamoeba
polyphaga resuscitates viable non-culturable Legionella pneumophila after disinfection.
Environmental Microbiology 9(5):1267-1277.
13. Hansen, S K, Rainey, P B, Haagensen, J A J, and Molin, S. 2007. Evolution of species
interactions in a biofilm community. Nature 445(7127):533-536.
14. Hussong, D, Colwell, R R, O'Brien, M, Weiss, E, Pearson, A D, Weiner, R M, and Burge, W D. 1987. Viable Legionella pneumophila not detectable by culture on agar media. Nature
Biotechnology 5(9):947-950.
Biofilms protect L. pneumophila to chlorination
103
15. James, B W, Mauchline, W S, Dennis, P J, Keevil, C W, and Wait, R. 1999. Poly-3-
hydroxybutyrate in Legionella pneumophila, an energy source for survival in low nutrient
environments. Applied and Environmental Microbiology 65(2):822-827.
16. Keevil, C W. 2003. Rapid detection of biofilms and adherent pathogens using scanning
confocal laser microscopy and episcopic differential interference contrast microscopy. Water
Science and Technology 47(5):105-116.
17. Keevil, C W. 2001. Continuous culture models to study pathogens in biofilms. Methods in
Enzimology 337(104-122.
18. Keevil, C W. 2002. Pathogens in environmental biofilms In: G. Bitton (ed.), The Encyclopedia
of Environmental Microbiology. Wiley, New York, pp. 2339-2356.
19. Keevil, C W, Mackerness, C W, and Colbourne, J S. 1990. Biocide treatment of biofilms.
International Biodeterioration and Biodegradation 26(169-179.
20. Klont, R R, Rijs, A J M, Warris, A, Sturm, P D J, Melchers, W J G, and Verweij, P E. 2006.
Legionella pneumophila in commercial bottled mineral water. FEMS Immunology and Medical
Microbiology 47(1):42-44.
21. LeChevallier, M W, Cawthon, C D, and Lee, R G. 1988. Factors promoting survival of
bacteria in chlorinated water supplies. Applied and Environmental Microbiology 54(3):649-654.
22. Lehtola, M J, Torvinen, E, Miettinen, L T, and Keevil, C W. 2006. Fluorescence in situ
hybridization using peptide nucleic acid probes for rapid detection of Mycobacterium avium
subsp avium and Mycobacterium avium subsp paratuberculosis in potable water biofilms.
Applied and Environmental Microbiology 72(1):848-853.
23. Mauchline, W S, James, B W, Fitzgeorge, R B, Dennis, P J, and Keevil, C W. 1994.
Growth temperature reversibly modulates the virulence of Legionella pneumophila. Infection
and Immunity 62(7):2995-2997.
24. Murga, R, Forster, T S, Brown, E, Pruckler, J M, Fields, B S, and Donlan, R M. 2001. Role
of biofilms in the survival of Legionella pneumophila in a model potable water system.
Microbiology 147(3121-3126.
25. Norton, C D, and LeChevallier, M W. 2000. A pilot study of bacteriological population
changes through potable water treatment and distribution. Applied and Environmental
Microbiology 66(1):268-276.
26. Oliver, J D. 2005. The viable but nonculturable state in bacteria. Journal of Microbiology
43(93-100.
27. Rogers, J, Dowsett, A B, Dennis, P J, Lee, J V, and Keevil, C W. 1994. Influence of
plumbing materials on biofilm formation and growth of Legionella pneumophila in potable
water systems. Applied and Environmental Microbiology 60(6):1842-1851.
28. Rogers, J, Dowsett, A B, Dennis, P J, Lee, J V, and Keevil, C W. 1994. Influence of
temperature and plumbing material selection on biofilm formation and growth of Legionella
pneumophila in a model potable water system containing complex microbial flora. Applied and
Environmental Microbiology 60(5):1585-1592.
29. Schoenen, D. 2002. Role of disinfection in suppressing the spread of pathogens with drinking
water: possibilities and limitations. Water Research 36(15):3874-3888.

Survival of drinking water pathogens after disinfection
104
30. Steinert, M, Hentschel, U, and Hacker, J. 2002. Legionella pneumophila: an aquatic microbe
goes astray. FEMS Microbiology Reviews 26(2):149-162.
31. Szewzyk, U, Szewzyk, R, Manz, W, and Schleifer, K H. 2000. Microbiological safety of
drinking water. Annual Review of Microbiology 54(81-127.
32. Walker, J T, Mackerness, C W, Rogers, J, and Keevil, C W. 1995. Heterogenous mosaic
biofilm - a haven for waterborne pathogens In: H. M. Lappin-Scott and J. W. Costerton (ed.),
Microbial biofilms. Cambridge University Press, Cambridge pp. 196-204.
33. Watnick, P, and Kolter, R. 2000. Biofilm, city of microbes. Journal of Bacteriology
182(10):2675-2679.
34. West, A A, Rogers, J, Lee, J V, and Keevil, C W. 1992. Lack of dormancy in Legionella
pneumophila? In: J. M. Barbaree, R. F. Breiman, and A. P. Dufour (ed.), Legionella. Current
state and emerging perspectives. American Society for Microbiology Press, Washington DC,
pp. 201-203.
35. Wilks, S A, and Keevil, C W. 2006. Targeting species-specific low-affinity 16S rRNA binding
sites by using peptide nucleic acids for detection of legionellae in biofilms. Applied and
Environmental Microbiology 72(8):5453-5462.
36. Wimpenny, J, Manz, W, and Szewzyk, U. 2000. Heterogeneity in biofilms. FEMS
Microbiology Reviews 24(5):661-671.
37. World Health Organization. 2006. Guidelines for drinking water quality, 3rd ed, vol. 1. World
Health Organization, Geneva.
38. Wullings, B A, and van der Kooij, D. 2006. Occurrence and genetic diversity of uncultured
Legionella spp. in drinking water treated at temperatures below 15ºC. Applied and
Environmental Microbiology 72(1):157-166.


H. pylori in drinking water biofilms
107
5.1 Introduction
Helicobacter pylori is one of the most prevalent pathogens among human individuals, especially in
developing countries where incidence can reach up to 90% of the population [16]. Even though most
individuals that are infected by this pathogen are asymptomatic, it is now well established that H. pylori
can lead to the development of peptic and duodenal ulcer disease and gastric MALT lymphoma [8].
The route of transmission of this pathogen is still unknown. Person-to-person transmission seems
most likely as the only place where H. pylori has been systematically isolated is the human GI tract [3].
However, some authors suggest that water, food and animals can also be vectors of transmission [3,
7, 10, 17, 20, 29, 38]. The largest obstacle to prove that water is a route of transmission lays in the
fact that H. pylori has never been cultured from drinking water distribution systems (DWDS) using
standard cultivation techniques [3, 19]. Whether this happens due to the fastidious nature of the
microorganism or to the loss of viability in water is the key question of the transmission debate.
Accordingly, some groups have been attempting to develop artificial media to achieve better culture
recovery results than the one obtained with the traditional Columbia blood agar (CBA), such as F-12
[37] or the selective HP medium that has been proposed to recover H. pylori from water-exposed,
heterotrophic microenvironments [15].
In the meantime, molecular techniques such as polymerase chain reaction (PCR), have demonstrated
the presence of H. pylori in drinking water distribution systems (DWDS), especially associated with
biofilms [10, 29, 30, 40]. This shows that H. pylori is present in water but DNA isolation alone fails to
provide any indication about the viability of the bacterium.
In recent years another molecular technique, fluorescence in situ hybridisation (FISH), has been
successfully used to detect this pathogen in DWDS and other water bodies [9, 31]. This technique
usually detects rRNA, which implies that it is not only able to detect the presence of H. pylori, but also
to provide an indication of viability up to a certain extent due to the maintenance of a high rRNA
content [6, 28, 42].
The aim of this work was to apply both FISH and a selective culture medium to assess the number of
H. pylori cells found in autochthonous complex consortia drinking water biofilms (i.e., ubiquitous in tap
water biofilms) formed under different conditions in order to better understand the dynamics of H.
pylori populations in real DWDS.

Survival of drinking water pathogens after disinfection
108
5.2 Material and Methods
5.2.1 Biofilm experiments
The formation of biofilms was carried out using a two-stage chemostat model system [22]. The first
stage consisted of a 1-litre vessel (seed vessel) and the second stage consisted of three 1-litre
vessels running in parallel, but connected in series with the seed vessel. All chemostats were
autoclaved and filled with filter-sterilized (0.2 μm pore size Nylon filter) tap water (1-litre). The seed
vessel was then inoculated with a microbial consortium that was obtained from tap water by filtration
through a 0.2 μm pore size Nylon filter (Pall Gelman, UK). This vessel was maintained in batch mode
for two days to promote microbial growth and then changed into a continuous mode, being fed with
filter-sterilized and dechlorinated tap water at a flow rate of 50 ml h-1. The seed vessel was operated at
room temperature (approx. 22ºC) and stirred at 300 rpm to ensure that the oxygen and nutrient
concentrations were homogeneous. The effluent was divided in three and used to feed the second
stage chemostats; the biofilm-growing vessels. Each biofilm-growing vessel was also fed with fresh
medium (filter-sterilized tap water) at a flow rate that maintained a dilution rate of 0.2 h-1 to promote
typical environmental conditions for biofilm growth. The first vessel was stirred at 300 rpm and with no
addition of any carbon source (low shear stress and low carbon concentration – LS/LC), serving as a
control. The second vessel was stirred at 1200 rpm but with no carbon addition (high shear stress and
low carbon – HS/LC) and the third vessel was stirred at 300 rpm and 8.8 mg l-1 of carbon was added
by the inclusion of 30 mg l-1 of sodium acetate to the fresh medium (low shear stress and high carbon
– LS/HC). The temperature was controlled at either 15ºC or 20ºC by a proportional integral derivative
unit system (Brighton Systems, UK). After 10 days, conditions and total cell numbers in the biofilm-
growing vessels were stable and the biofilm growing vessels were inoculated with H. pylori NCTC
11637 at a final concentration of approximately 8 x 10⁵ CFU ml-1 (determined by measuring
absorbance at 640 nm) followed by immersion of sterile polyvinylchloride (PVC) coupons (day 0). The
coupons were removed after 1, 2, 4, 8, 16 and 31 days, gently rinsed to remove planktonic cells
attached to the surface of the biofilm, and scraped to quantify sessile cells.
5.2.2 Cultivation of H. pylori
H. pylori NCTC 11637 was maintained in vials frozen at -80ºC and recovered by plating onto
Columbia Blood Agar (CBA) (Oxoid, UK) supplemented with 5% (v/v) defibrinated horse blood (Oxoid,
UK) and incubated for 48 hours at 37ºC in a variable atmosphere workstation (MACS VA500, Don
Whitley, UK) set to a microaerophilic atmosphere of 10 % CO2, 7 % H2 and 3 % O2; the remainder
being N2. The cultures were subcultured once for 48 hours and used to inoculate the second-stage
chemostats.

H. pylori in drinking water biofilms
109
5.2.3 Preparation of coupons
PVC coupons (1 cm2) were used as a support for biofilm. PVC was the material chosen for the
coupons as it is the material more commonly used in water pipes and also because it has been shown
to be one of the less aggressive materials for H. pylori survival [2]. Coupons were immersed in water
and detergent (Guard professional, UK) for 5 minutes, washed with a bottle brusher, rinsed twice in
distilled water and air-dried. Subsequently, they were washed in 70% (v/v) ethanol to remove any
organic compounds, attached to the end of a titanium wire and autoclaved [22].
5.2.4 Quantification of planktonic cells
Water samples were taken after 0, 1, 2, 4, 8, 16 and 31 days from the seed and biofilm-growing
vessels and were analyzed for total cells, heterotrophic plate count cells (HPC) and cultivable H.
pylori. Total cells were quantified using SYTO 9 (Molecular Probes, Invitrogen, UK). In short, 1 ml of
an appropriate dilution was mixed with 0.5 μl of SYTO 9 (5mM solution in DMSO), incubated in the
dark for 15 minutes, filtered through a 0.2 μm pore size polycarbonate black Nucleopore® membrane
(Whatman, UK) and allowed to air-dry. Then a drop of non-fluorescence immersion oil (Fluka, UK) and
a coverslip were added before observation under a Nikon Eclipse E800 episcopic differential
interference contrast/epifluorescence (EDIC/EF) microscope (Best Scientific, UK) [23]. As cells were
homogeneously distributed, 10 fields of view were randomly chosen and the number of cells counted
on each membrane. HPC were obtained by plating onto R2A medium agar plates (Oxoid, UK) and
incubating at 22ºC for 7 days. Cultivable H. pylori was quantified by plating in triplicate onto selective
HP medium agar plates as described by Degnan et al. [15], using either calf serum or 5% (v/v)
defibrinated horse blood (Oxoid, UK) and the addition of 0.5 g l-1 pyruvic acid (Sigma, UK). Plates
were incubated at 37ºC in a microaerophilic atmosphere for 7 days. The colonies obtained on HP agar
plates were tested with the urease test performed according to the manufacturer instructions (Oxoid,
UK) and with the specific H. pylori peptide nucleic acid (PNA) probe to confirm the identity of H. pylori
as described below [21].
5.2.5 Quantification of sessile cells
Coupons were immersed in 2 ml of filter-sterilized tap water containing autoclaved 2 mm diameter
glass beads (Merck, UK) and vortexed for one minute to remove the biofilm from the coupons’ surface
and homogenize the suspension. A previous study in which the coupons were observed under EDIC
microscopy showed that this method completely removes the biofilm. Total cells, HPC and cultivable
H. pylori were quantified using the methods described above. In addition, total H. pylori were
quantified using a specific PNA probe with the following sequence 5’- GAGACTAAGCCCTCC -3’
(Eurogentec, Belgium) in a fluorescence in situ hybridization assay (PNA-FISH) (20). PNA-FISH was
carried out by taking 1 ml of an appropriate dilution and filtering through a 0.2 μm Anodisc membrane
(Whatman, UK). This was left to air dry. Then the membrane was covered with 4% (w/v)
paraformaldehyde followed by 50% (v/v) ethanol for 10 minutes each to fix the cells and finally air

Survival of drinking water pathogens after disinfection
110
dried. The hybridization, washing and microscopy observation method was based on the methods
described by Guimarães et al. [21]. In this case, 20 fields of view were randomly chosen and the
number of cells counted on each membrane.
5.2.6 Identification of sessile cells
All the bacteria isolated onto R2A and HP media were identified by 16S DNA sequencing at
DNAVision SA (Belgium). Briefly, for each culture DNA was purified, amplified and sequenced with
16S primers. The analysed fragments were about 1600 base pairs length. The sequenced fragments
were then BLASTed in the NCBI public database and therefore obtained the Genbank accession
number for the highest sequence similarity value.
5.2.7 Statistical analysis
The homogeneity of variances of total number of cells, total H. pylori and HPC and was checked by
the Levene test for equality of variances using a statistical package (SPSS Inc., Chicago IL, USA).
Differences were subsequently compared by a one-way ANOVA followed by a Bonferroni post hoc
test. Differences were considered relevant if P<0.05.
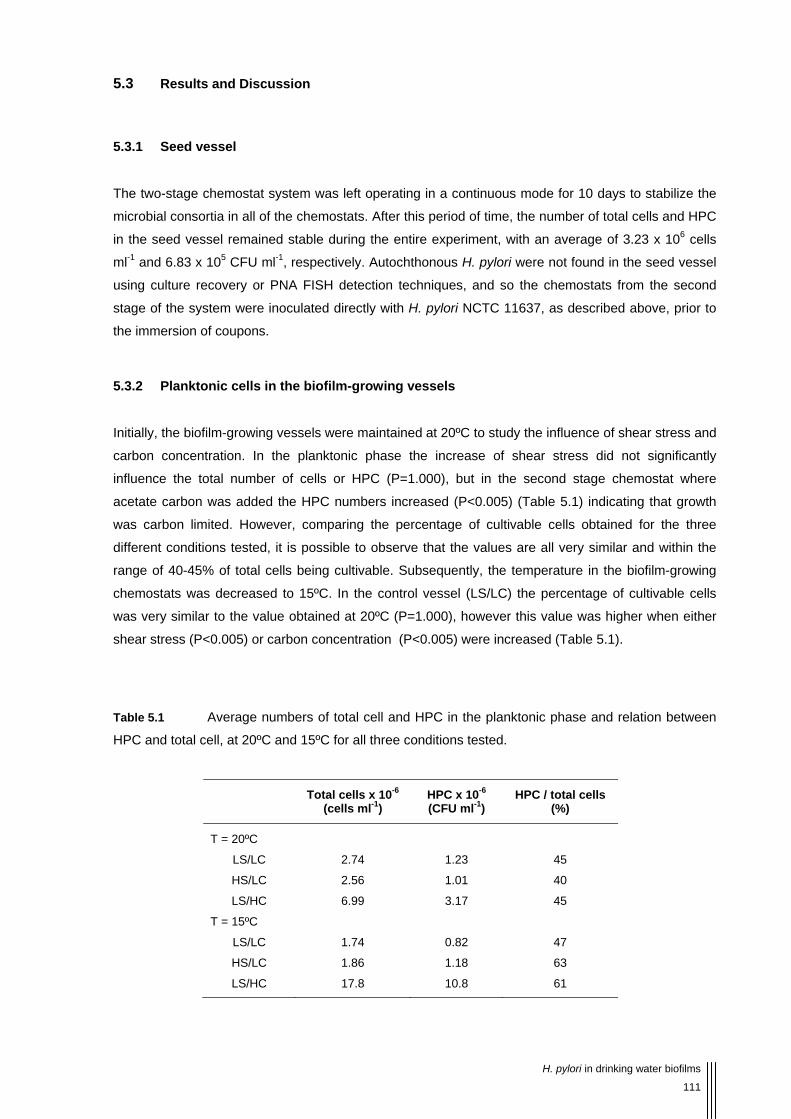
H. pylori in drinking water biofilms
111
5.3 Results and Discussion
5.3.1 Seed vessel
The two-stage chemostat system was left operating in a continuous mode for 10 days to stabilize the
microbial consortia in all of the chemostats. After this period of time, the number of total cells and HPC
in the seed vessel remained stable during the entire experiment, with an average of 3.23 x 10⁶ cells
ml-1 and 6.83 x 10⁵ CFU ml-1, respectively. Autochthonous H. pylori were not found in the seed vessel
using culture recovery or PNA FISH detection techniques, and so the chemostats from the second
stage of the system were inoculated directly with H. pylori NCTC 11637, as described above, prior to
the immersion of coupons.
5.3.2 Planktonic cells in the biofilm-growing vessels
Initially, the biofilm-growing vessels were maintained at 20ºC to study the influence of shear stress and
carbon concentration. In the planktonic phase the increase of shear stress did not significantly
influence the total number of cells or HPC (P=1.000), but in the second stage chemostat where
acetate carbon was added the HPC numbers increased (P<0.005) (Table 5.1) indicating that growth
was carbon limited. However, comparing the percentage of cultivable cells obtained for the three
different conditions tested, it is possible to observe that the values are all very similar and within the
range of 40-45% of total cells being cultivable. Subsequently, the temperature in the biofilm-growing
chemostats was decreased to 15ºC. In the control vessel (LS/LC) the percentage of cultivable cells
was very similar to the value obtained at 20ºC (P=1.000), however this value was higher when either
shear stress (P<0.005) or carbon concentration (P<0.005) were increased (Table 5.1).
Table 5.1 Average numbers of total cell and HPC in the planktonic phase and relation between
HPC and total cell, at 20ºC and 15ºC for all three conditions tested.
Total cells x 10-6 (cells ml-1)
HPC x 10-6 (CFU ml-1)
HPC / total cells (%)
T = 20ºC
LS/LC 2.74 1.23 45
HS/LC 2.56 1.01 40
LS/HC 6.99 3.17 45
T = 15ºC
LS/LC 1.74 0.82 47
HS/LC 1.86 1.18 63
LS/HC 17.8 10.8 61

Survival of drinking water pathogens after disinfection
112
For all water samples analysed it was not possible to recover cultivable H. pylori. Other authors have
demonstrated that in pure culture at 15ºC and 20ºC, H. pylori is able to maintain cultivability for some
days both in a water suspension [1, 4, 34] and in water-exposed biofilms [2, 14], which suggests that
the difficulty of recovering cultivable H. pylori in this work was due to interactions between this
microorganism and other species of the bacterial population present in water, like competition for
nutrients or due to the production of toxic compounds by other microorganisms. It is also important to
mention that overgrowth of other microorganisms occurred in certain samples. Degnan and colleagues
[15] have developed the HP medium as a way to selectively recover H. pylori from water and have
accordingly challenged the medium with the most commonly-known aquatic microorganisms and with
heterotrophic consortia from real water samples, obtaining negative growth in both cases. However,
real samples differ from place to place and in the present study, microorganisms were isolated from
the chemostat system on HP medium and identified by 16S DNA sequencing as Brevundimonas sp.,
Mycobacterium chelonae and Sphingomonas spp. (Genbank access number EF194089, AM884326
and AY749436, respectively). None of these microorganisms had been assessed for growth on HP
medium in the original experiments by Degnan et al. [15].
5.3.3 Cell population in the biofilm-growing vessels
Figure 5.1a shows the variation of total cells, HPC and total H. pylori in biofilms grown at 20ºC for the
three conditions tested. As it was obtained for planktonic samples, no cultivable H. pylori was
recovered on HP media from any of the biofilms samples. The biofilm development follows a kinetic
described by other authors, where the adhesion of most cells takes place in the first day, but no
statistically significant change occurs afterwards (P>0.05) [13, 33]. It should be noted that this pseudo
steady-state is actually the result of a dynamic equilibrium typical of biofilms where parts of the biofilm
detaching from the coupons are balanced by the adherence of new cells [36, 39]. This same trend was
observed for the experiment carried out at 15ºC (P>0.05) (Figure 5.1b).
In terms of total numbers of cells at 20ºC, increasing the shear stress did not affect numbers
(P=1.000), as it was obtained on average 4.31 x 10⁸ cells cm-2 when biofilm was formed in the LS/LC
vessel and 4.14 x 10⁸ cells cm-2 in the HS/LC vessel. However, adding a carbon source caused a two-
fold increase in the numbers (1.01 x 10⁹ cells cm-2) even though this result is not statistically significant
(P>0.05). For HPC numbers the differences were even more evident when the carbon concentration
was increased (4.00 x 10⁶ CFU cm-2 versus 4.87 x 10⁵ CFU cm-2 in the LS/LC and 4.55 x 10⁵ CFU cm-
2 in the HS/LC (P<0.1) which is not surprising as carbon is the limiting nutrient in this aquatic
environment. The comparison of the results obtained at both temperatures suggests that when the
concentration of carbon is increased the formation of biofilm is favoured at 20ºC (P<0.005).

H. pylori in drinking water biofilms
113
Figura 5.1 Variation in the total cell number, HPC and total numbers of H. pylori in biofilms formed at 20ºC
(a) and 15ºC (b) under the following conditions: low shear stress and low concentration of carbon ( ), high shear
stress and low concentration of carbon ( ) and low shear stress and high concentration of carbon ( ). Error bars
represent standard deviation.
5.3.4 H. pylori total counts in biofilms
One of the most important breakthroughs in this work was to be able to consistently detect and
quantify H. pylori within biofilm structures by the use of the H. pylori PNA probe, as earlier attempts
have been hampered by strong autofluorescence of the biofilm stacks in some environments
containing autofluorescent contaminants such as polycyclic aromatic hydrocarbons (PAH) [6]. This

Survival of drinking water pathogens after disinfection
114
issue was overcome by the option of counting the bacteria after removal of the biofilm from the
coupons using glass bead agitation and washing. In this way, it is still possible to visualize the matrix
structures of biofilm under epifluorescence microscopy (indicated by the large arrows on Figure 5.2a
and b), however the autofluorescence is not so bright allowing the observation of the cells. On the
other hand, the number of detected bacteria in that earlier study was also considerably lower than the
one found here, which demonstrates that most of H. pylori cells in the sessile state are embedded
within biofilm structures.
When comparing the effect of the different conditions tested, the results obtained for total H. pylori (at
20ºC) had a similar trend compared to the results described previously for total cells, as also in this
case, the numbers of total H. pylori cells were not statistically different (P>0.05) for the three
conditions tested (on average 2.25 x 10⁶ cells cm-2 in the LS/LC, 2.12 x 10⁶ cells cm-2 in the HS/LC
environment and 2.15 x 10⁶ cells cm-2 in the LS/HC environment) (Figure 5.1a). In relation to the
values obtained for total H. pylori at 15ºC, there was no significant difference between the three
conditions tested (P>0.05), being on average 1.54 x 10⁶ cells cm-2, 1.89 x 10⁶ cells cm-2 and 1.72 x 10⁶
cells cm-2 in the LS/LC, HS/LC and LS/HC environments, respectively (Figure 5.1b). Comparing the
results obtained at both temperatures it is possible to observe that the numbers are also not
statistically different (P>0.05) suggesting that the physico-chemical parameters studied in this work did
not affect the presence of H. pylori in heterotrophic biofilms, indicating that if a pulse (i.e. a sporadic
occurrence) of the pathogen passes through a drinking water supply then H. pylori will be included in
biofilms regardless of the DWDS characteristics.
The lack of effect of temperature on H. pylori adhesion has been demonstrated before by Azevedo et
al. [5], however, contrary to what was observed in this work, that same study demonstrated that shear
stress hinders biofilm formation. Even though the systems used to generate biofilm were different (the
system used in the previous study was operated in batch mode, having planktonic H. pylori during the
entire experiment), this altered behaviour might be more logically explained by the heterotrophic
nature of the biofilm in the current work. Heterotrophic DWDS associated-biofilms are known to create
a safe haven to protect microorganisms from external stress such as temperature, shear stress,
oxygen and nutrient concentration [25, 32, 41], and might help to retain H. pylori attached to the
surfaces.
In general, the numbers of total H. pylori at both temperatures decreased during the first week
(P<0.05) and remained more stable afterwards whereas the total number of bacteria in the biofilm
remained constant throughout the experiment (Figure 5.1a and b). This might be explained by the fact
that the vessels were pulsed with H. pylori only at the beginning of the experiment rather than being
continually challenged. Consequently, after the initial decline of the pathogen from the chemostats
(that occurred in approx. five hours), H. pylori cells that were only loosely adhered detached from the
biofilm and could not be replenished. After one week, the remaining H. pylori cells were already well-
protected within the biofilm and for any extra layers of heterotrophic cells that attached on top of them,
and hence the number of total H. pylori stabilised on most conditions (P=1.000). Figures 5.2a and b

H. pylori in drinking water biofilms
115
demonstrate that most of H. pylori cells in the sessile state are embedded in biofilm structures and
sustain this hypothesis.
Figura 5.2 Microphotograph of hybridization with the H. pylori specific PNA probe in a biofilm grown at
20ºC (a) and at 15ºC (b) using the epifluorescence TRITC filter. Large arrows indicate the autofluorescent matrix
of the biofilm whereas thin arrows represent coccoid H. pylori embedded in these structures. In (c) the cells were
observed using the epifluorescence DAPI filter serving as a control for the autofluorescence of the biofilm stacks
and individual cells attached to the substratum. Micrograph of a coupon with a 26 days-old biofilm formed under
LS/LC at 15ºC and observed using EDIC microscopy (d). Bars represent 20 μm.
5.3.5 H. pylori morphology and location within biofilms
The major difference between the experiments carried out at different temperatures was in the shape
of the cells detected by PNA-FISH. Spiral and coccoid-shaped cells were observed at both
temperatures; however, at 20ºC there were a larger proportion of spiral-shaped cells than at 15ºC
(Figures 5.2a and b). This is extremely relevant as the morphology of H. pylori cells has been
intimately connected with viability and infection capacity. Although it has been previously shown that
coccoid H. pylori might correspond to dead cells [18, 27], recent reports on the behaviour of H. pylori
in water have shown that coccoid cells are the manifestation of an environmentally robust type of cells

Survival of drinking water pathogens after disinfection
116
that might be understood as being in the viable but non cultivable (VBNC) state [2, 11, 12]. For H.
pylori, this morphological condition appears to still be able to recover cultivability and cause infection
when inoculated in mice [35].
An ecological explanation for the presence of H. pylori in biofilms is provided by the microaerophilic
nature of this pathogen. In fact, other microorganisms such as Legionella pneumophila,
Campylobacter jejuni and even E. coli, have been shown to prefer the microaerophilic environments
demonstrated to be present in biofilm stacks [22, 24, 32], due to their intricate structure (Figure 5.2d).
A recent study [26] has confirmed that even at high shear stresses, the oxygen concentration remains
quite low in fronds or stacks which is certainly beneficial to H. pylori and might explain why numbers
are not affected at high shear stresses. However oxygen availability is certainly dependent on the
conditions under which biofilms are formed and as such it is not yet possible to ascertain that all
biofilms contain microaerophilic microniches.
5.3.6 Cultivability of H. pylori in water and water-associated biofilms and implications for transmission.
Adams et al. [1] have shown that in pure culture H. pylori cells retain cultivability for longer at 15ºC
than at 20ºC. In the current study it was not possible to recover cultivable H. pylori from water samples
and biofilms. However, considering the shape of the cells detected by PNA-FISH and considering that
cultivable cells are in the spiral shape, while coccoid shaped cells are VBNC and therefore likely to be
non-cultivable, it would be expected to have more cultivable H. pylori at 20ºC, demonstrating that in
heterotrophic biofilms the behaviour of this pathogen might be completely different than in pure
culture. Additionally, the PNA probe used in this work targets sites on the 16S rRNA molecule and it is
known that the RNA content of a cell can be indicative of viability [6], which suggests that the cells
detected were still viable. It has been shown above that the concentration of total H. pylori included in
the biofilm formed in this work is either higher or very similar to the concentration found when pure
culture biofilms were formed [5]. In addition, the detection of H. pylori embedded in biofilms suggests a
close-association with other bacteria present in the biofilm. These two factors, together with the
persistence of a bright PNA-FISH signal, indicative of a high rRNA content, suggest that the
heterotrophic bacteria present in the biofilm formed in this study are not influencing negatively H. pylori
but only inducing it’s transformation into the more robust coccoid morphology [2].
The mode of transmission of H. pylori is not well established, and although there is considerable
evidence that water can be a strong candidate, several authors are sceptical in accepting this route of
transmission. This work provides new evidence about the survival of H. pylori in drinking water
biofilms, showing that this pathogen, although being fastidious and losing cultivability easily and
rapidly, can still maintain viability in the environmentally robust coccoid VBNC state for long periods of
time. The fact that this work, contrary to the pure culture studies reported in the literature, has been
done using natural, heterotrophic microbial consortia, shows the capacity of H. pylori to adapt to stress
situations by “taking advantage” of the presence of other microorganisms.
H. pylori in drinking water biofilms
117
5.4 Conclusions
This study is in agreement with the data obtained in the aquatic environment, where H. pylori is
detected by molecular techniques but not by plating methods [9]. In fact, it has been shown here that
even in artificially-inoculated systems, H. pylori recovery and growth on agar culture plates remains
elusive despite the abundant presence of the bacterium in biofilms as assessed by PNA-FISH. On the
other hand, previous experiments have shown that water-exposed H. pylori NCTC 11637 remains
cultivable in pure-culture biofilms for at least 24 hours [3].
The high numbers of H. pylori present in biofilms and the maintenance of high levels of rRNA within
the cells for at least 31 days strongly suggests that, far from being deleterious, interactions are indeed
protecting the pathogen by providing a stable, possibly microaerophilic environment for their cells to
subsist. This indicates that H. pylori might be found in biofilms in a VBNC state confirming that
standard cultivation methods are not the best approach to assess the safety of drinking water in
respect to this pathogen, and that while improved recovery methods are not available, it would be
important to utilise PNA-FISH as a monitoring method. This work shows that even when cultivable H.
pylori is not detected by standard methods this pathogen will persist in biofilms under most conditions
found in aquatic environments, suggesting that water biofilms might have a role on H. pylori
transmission.

Survival of drinking water pathogens after disinfection
118
5.5 Acknowledgements
We would like to thank Nuno Guimarães for his technical assistance with the PNA FISH method. This
work was supported by the Portuguese Institute Fundação para a Ciência e Tecnologia (PhD grant
SFRH/BD/17088/2004 and post-doc grant SFRH/BPD/20484/2004).

H. pylori in drinking water biofilms
119
5.6 References
1. Adams, B L, Bates, T C, and Oliver, J D. 2003. Survival of Helicobacter pylori in a natural
freshwater environment. Applied and Environmental Microbiology 69(12):7462-7466.
2. Azevedo, N F, Almeida, C, Cerqueira, L, Dias, S, Keevil, C W, and Vieira, M J. 2007.
Coccoid form of Helicobacter pylori as a morphological manifestation of cell adaptation to the
environment. Applied and Environmental Microbiology 73(10):3423-3427.
3. Azevedo, N F, Guimarães, N, Figueiredo, C, Keevil, C W, and Vieira, M J. 2007. A New
Model for the Transmission of Helicobacter pylori: Role of Environmental Reservoirs as Gene
Pools to Increase Strain Diversity. Critical Reviews in Microbiology 33(3):157 - 169.
4. Azevedo, N F, Pacheco, A P, Keevil, C W, and Vieira, M J. 2004. Nutrient shock and
incubation atmosphere influence recovery of culturable Helicobacter pylori from water. Applied
and Environmental Microbiology 70(1):490-493.
5. Azevedo, N F, Pinto, A R, Reis, N M, Vieira, M J, and Keevil, C W. 2006. Shear stress,
temperature, and inoculation concentration influence the adhesion of water-stressed
Helicobacter pylori to stainless steel 304 and polypropylene. Applied and Environmental
Microbiology 72(4):2936-2941.
6. Azevedo, N F, Vieira, M J, and Keevil, C W. 2003. Establishment of a continuous model
system to study Helicobacter pylori survival in potable water biofilms. Water Science and
Technology 47(5):155-160.
7. Bellack, N R, Koehoorn, M W, Macnab, Y C, and Morshed, M G. 2006. A conceptual model
of water's role as a reservoir in Helicobacter pylori transmission: a review of the evidence.
Epidemiology and Infection 134(3):439-449.
8. Blaser, M J, and Atherton, J C. 2004. Helicobacter pylori persistence: biology and disease.
Journal of Clinical Investigation 113(3):321-333.
9. Bragança, S M, Azevedo, N F, Simões, L C, Keevil, C W, and Vieira, M J. 2007. Use of
fluorescent in situ hybridisation for the visualisation of Helicobacter pylori in real drinking water
biofilms. Water Science and Technology 55(8):387-393.
10. Bunn, J E G, Mackay, W G, Thomas, J E, Reid, D C, and Weaver, L T. 2002. Detection of
Helicobacter pylori DNA in drinking water biofilms: implications for transmission in early life.
Letters in Applied Microbiology 34(6):450-454.
11. Cellini, L, Grande, R, Di Campli, E, Di Bartolomeo, S, Di Lorio, D, and Caputi, S. 2005.
Biofilm formation and modulation of luxS and rpoD expression by Helicobacter pylori. Biofilms
2(1-9.
12. Chaput, C, Ecobichon, C, Cayet, N, Girardin, S E, Werts, C, Guadagnini, S, Prevost, M C, Mengin-Lecreulx, D, Labigne, A, and Boneca, I G. 2006. Role of AmiA in the morphological
transition of Helicobacter pylori and in immune escape. PLoS Pathogens 2(9):844-852.
13. Codony, F, Morato, J, Ribas, F, and Mas, J D. 2002. Effect of chlorine, biodegradable
dissolved organic carbon and suspended bacteria on biofilm development in drinking water
systems. Journal of Basic Microbiology 42(5):311-319.

Survival of drinking water pathogens after disinfection
120
14. Cole, S P, Harwood, J, Lee, R, She, R, and Guiney, D G. 2004. Characterization of
monospecies biofilm formation by Helicobacter pylori. Journal of Bacteriology 186(10):3124-
3132.
15. Degnan, A J, Sonzogni, W C, and Standridge, J H. 2003. Development of a plating medium
for selection of Helicobacter pylori from water samples. Applied and Environmental
Microbiology 69(5):2914-2918.
16. Dunn, B E, Cohen, H, and Blaser, M J. 1997. Helicobacter pylori. Clinical Microbiology
Reviews 10(4):720-&.
17. Duynhoven, Y T H P, and de Jonge, R. 2001. Transmission of Helicobacter pylori: a role for
food? Bulletin of the World Health Organization 79(5):455-460.
18. Eaton, K A, Catrenich, C E, Makin, K M, and Krakowka, S. 1995. Virulence of Coccoid and
Bacillary Forms of Helicobacter pylori in Gnotobiotic Piglets. Journal of Infectious Diseases
171(2):459-462.
19. Engstrand, L. 2001. Helicobacter in water and waterborne routes of transmission. Journal of
Applied Microbiology 90(80S-84S.
20. Gomes, B C, and De Martinis, E C P. 2004. The significance of Helicobacter pylori in water,
food and environmental samples. Food Control 15(5):397-403.
21. Guimaraes, N, Azevedo, N F, Figueiredo, C, Keevil, C W, and Vieira, M J. 2007.
Development and Application of a Novel Peptide Nucleic Acid Probe for the Specific Detection
of Helicobacter pylori in Gastric Biopsy Specimens. Journal of Clinical Microbiology
45(9):3089-3094.
22. Keevil, C W. 2001. Continuous culture models to study pathogens in biofilms. Methods in
Enzimology 337(104-122.
23. Keevil, C W. 2003. Rapid detection of biofilms and adherent pathogens using scanning
confocal laser microscopy and episcopic differential interference contrast microscopy. Water
Science and Technology 47(5):105-116.
24. Keevil, C W. 2002. Pathogens in environmental biofilms In: G. Bitton (ed.), The Encyclopedia
of Environmental Microbiology. Wiley, New York, pp. 2339-2356.
25. Keevil, C W, Rogers, J, and Walker, J T. 1995. Potable water biofilms. Microbiology Europe
3( ):10-14.
26. Kuhl, M, Rickelt, L F, and Thar, R. 2007. Combined Imaging of Bacteria and Oxygen in
Biofilms. Applied and Environmental Microbiology 73(19):6289-6295.
27. Kusters, J G, Gerrits, M M, Van Strijp, J A, and Vandenbroucke-Grauls, C M. 1997.
Coccoid forms of Helicobacter pylori are the morphologic manifestation of cell death. Infection
and Immunity 65(9):3672-3679.
28. Lehtola, M J, Torvinen, E, Miettinen, L T, and Keevil, C W. 2006. Fluorescence in situ
hybridization using peptide nucleic acid probes for rapid detection of Mycobacterium avium
subsp avium and Mycobacterium avium subsp paratuberculosis in potable water biofilms.
Applied and Environmental Microbiology 72(1):848-853.
29. Mackay, W G, Gribbon, L T, Barer, M R, and Reid, D C. 1998. Biofilms in drinking water
systems - A possible reservoir for Helicobacter pylori. Water Science and Technology
38(12):181-185.

H. pylori in drinking water biofilms
121
30. Park, S R, Mackay, W G, and Reid, D C. 2001. Helicobacter sp recovered from drinking
water biofilm sampled from a water distribution system. Water Research 35(6):1624-1626.
31. Queralt, N, Bartolome, R, and Araujo, R. 2005. Detection of Helicobacter pylori DNA in
human faeces and water with different levels of faecal pollution in the north-east of Spain.
Journal of Applied Microbiology 98(4):889-895.
32. Robinson, P J, Walker, J T, Keevil, C W, and Cole, J. 1995. Reporter Genes and
Fluorescent Probes for Studying the Colonization of Biofilms in a Drinking Water Supply Line
by Enteric Bacteria. FEMS Microbiology Letters 129(2-3):183-188.
33. Rogers, J, Dowsett, A B, Dennis, P J, Lee, J V, and Keevil, C W. 1994. Influence of
Temperature and Plumbing Material Selection on Biofilm Formation and Growth of Legionella
pneumophila in a Model Potable Water System Containing Complex Microbial Flora. Applied
and Environmental Microbiology 60(5):1585-1592.
34. Shahamat, M, Mai, U, Paszko-Kolva, C, Kessel, M, and Colwell, R R. 1993. Use of
autoradiography to assess viability of Helicobacter pylori in water. Applied and Environmental
Microbiology 59(4):1231-1235.
35. She, F F, Lin, J Y, Liu, J Y, Huang, C, and Su, D H. 2003. Virulence of water induced
coccoid Helicobacter pylori and its experimental infection in mice. World Journal of
Gastroenterology 9(3):516-520.
36. Stoodley, P, Sauer, K, Davies, D G, and Costerton, J W. 2002. Biofilms as Complex
Differentiated Communities. Annual Review of Microbiology 56(1):187-209.
37. Testerman, T L, McGee, D J, and Mobley, H L T. 2001. Helicobacter pylori growth and
urease detection in the chemically defined medium Ham's F-12 nutrient mixture. Journal of
Clinical Microbiology 39(11):3842-3850.
38. Velazquez, M, and Feirtag, J M. 1999. Helicobacter pylori: characteristics, pathogenicity,
detection methods and mode of transmission implicating foods and water. International
Journal of Food Microbiology 53(2-3):95-104.
39. Vieira, M J, Melo, L F, and Pinheiro, M M. 1993. Biofilm formation: hydrodynamic effects on
internal diffusion and structure. Biofouling 7(67-80.
40. Voytek, M A, Ashen, J B, Fogarty, L R, Kirshtein, J D, and Landa, E R. 2005. Detection of
Helicobacter pylori and fecal indicator bacteria in five North American rivers. Journal of Water
and Health 3(4):405-422.
41. Walker, J T, Mackerness, C W, Rogers, J, and Keevil, C W. 1995. Heterogenous mosaic
biofilm - a haven for waterborne pathogens In: H. M. Lappin-Scott and J. W. Costerton (ed.),
Microbial Biofilms. Cambridge University Press, Cambridge pp. 196-204.
42. Wilks, S A, and Keevil, C W. 2006. Targeting species-specific low-affinity 16S rRNA binding
sites by using peptide nucleic acids for detection of legionellae in biofilms. Applied and
Environmental Microbiology 72(8):5453-5462.


Effect of chlorine on H. pylori
125
6.1 Introduction
Helicobacter pylori is a Gram-negative microorganism that colonizes the human stomach and can
cause gastric ulcers that under certain circumstances might degenerate into gastric carcinoma [9]. The
route of transmission for this pathogen is not well-known, and even though cultivable H. pylori has
never been isolated from drinking water distribution systems (DWDS), molecular techniques such as
PCR have detected the presence of H. pylori DNA in potable water [10, 28, 32], indicating that this
environment could act as an environmental reservoir for this bacterium. In fact, epidemiological
studies confirm that, particularly in developing countries, untreated water is a risk factor to increase
the incidence of this pathogen in the human population (reviewed in [5, 16, 18]).
Chlorine is the most commonly used disinfectant worldwide to ensure a safe distribution of water to
the consumer [33]. However, safety of drinking water is usually assessed by the presence of the
indicator of faecal pollution, Escherichia coli, and coliform bacteria, microorganisms that have been
proven to be less resistant to chlorine than several pathogenic bacteria such as Legionella spp. [26]
and H. pylori [8, 20]. Besides showing the extended resistance of H. pylori to chlorine, Johnson et al.
[20] and Baker et al. [8] have also shown that H. pylori is inactivated by 0.12 and 0.299 mg chlorine (l
min)-1, respectively. However their conclusions were based on the lack of recovery using standard
plating methods that fail to consider cells that have entered a viable but non cultivable (VBNC) state.
Recently, Moreno et al. [30] applied molecular techniques to demonstrate that H. pylori can survive in
low concentrations of chlorine in a VBNC state. Nonetheless, all these studies were performed on
pure cultures using suspended cells and up until now there have been no studies reporting the effect
of chlorination on H. pylori when associated with heterotrophic biofilms. It is well-known that
microorganisms in biofilms are more resistant to the biocide effect of antibiotics and chlorine due to
the difficulty of these molecules to diffuse through the biofilm matrix [14].
Recovery of pathogens by standard cultivation techniques is known to have limitations. On the other
hand, fluorescence in situ hybridization (FISH) using peptide nucleic acid (PNA) probes has been
widely studied in recent years as a promising technique to detect several pathogens in DWDS [7, 21,
27, 35].
The aim of this work was to study the effect of low concentrations of chlorine on H. pylori cells, when
associated with heterotrophic biofilms and when suspended in pure culture, to assess the ability of
biofilms to act as a protective niche for this pathogen.

Survival of drinking water pathogens after disinfection
126
6.2 Material and Methods
6.2.1 Culture maintenance
H. pylori NCTC 11637 was maintained in vials frozen at -80ºC and recovered by plating onto Columbia
Agar (Oxoid, UK) supplemented with 5% (v/v) defibrinated horse blood (CBA) (Oxoid, UK) and
incubated for 48 hours at 37ºC in a variable atmosphere workstation (MACS VA500, Don Whitley, UK)
set to a microaerobic atmosphere of 10 % CO2, 7 % H2 and 3 % O2. H. pylori was subcultured for 48
hours and then inoculated either into the second-stage chemostats (see below) or used in the pure
culture cells assessment.
6.2.2 Chlorine preparation and measurements
Chlorine tablets (H-8801, Guest Medical, UK) were added to filtered distilled water to obtain a 5 g l-1
stock solution. The measurement of chlorine was performed by the N,N-dimethyl-p-phenilenediamine
(DPD) colorimetric method, as described in the Standard Methods for the Examination of Water and
Wastewater [2] with the exception of the absorbance wavelength reading which was adjusted to 492
nm [29].
6.2.3 Experiments in heterotrophic biofilms
6.2.3.1 Biofilm formation
The formation of biofilms was carried out using a two-stage chemostat model system. The first stage
consisted of a 1-litre vessel (seed vessel) and the second stage consisted of three 1-litre vessels
running in parallel, but connected in series with the seed vessel [22]. All chemostats were autoclaved
and filled with filter-sterilized tap water (1-litre). The seed vessel was then inoculated with a microbial
consortium that was obtained from tap water by filtration through a 0.2 μm pore size Nylon filter (Pall
Gelman, UK), maintained in batch mode for two days to promote microbial growth and then changed
into a continuous mode, being fed with filter-sterilized and dechlorinated tap water at a flow rate of 50
ml h-1. This chemostat was operated at room temperature and stirred at 300 rpm to ensure that the
oxygen and nutrient concentrations were homogeneous. The outflow was divided in three and used to
feed the second stage chemostats – the biofilm-growing vessels. Each biofilm-growing vessel was

Effect of chlorine on H. pylori
127
also fed with fresh media (filter-sterilized tap water) at a flow rate that maintained the dilution rate of
0.2 h-1 to promote the typical environmental conditions for biofilm growth. All vessels were stirred at
300 rpm and the temperature was controlled at 15ºC by a proportional integral derivative unit system
(Brighton Systems, UK). To one of the biofilm-growing vessels no chlorine was added, serving as a
control, and to the other two vessels chlorine was continuously supplemented, with the concentration
being maintained at 0.2 mg l-1 and 1.2 mg l-1. After 10 days, conditions in the biofilm-growing vessels
were stable and these were inoculated with H. pylori NCTC 11637 at a final concentration of
approximately 3.18 x 10⁵ CFU ml-1 followed by the immersion of sterile unplasticized polyvinylchloride
(uPVC) coupons (day 0). The coupons were removed after 1, 2, 4, 8, 16 and 26 days, gently rinsed to
remove planktonic cells attached to the surface of the biofilm, and scraped to quantify sessile cells.
6.2.3.2 Coupon preparation
One cm2 uPVC coupons were used as a substratum for biofilm growth. Coupons were immersed in
water and detergent for 5 minutes, washed with a bottle brusher, rinsed twice in distilled water and air-
dried. Subsequently, they were washed in 70% (v/v) ethanol to remove any organic compounds,
attached to the end of a titanium wire and autoclaved [22].
6.2.3.3 Quantification of planktonic cells
Water samples were taken after 0, 1, 2, 4, 8, 16 and 26 days from the seed and biofilm-growing
vessels and were analyzed for total cells, heterotrophic cells and cultivable H. pylori. Total cells were
quantified using the SYTO 9 staining method (Molecular Probes, Invitrogen, UK). In short, 1 ml of an
appropriate dilution was mixed with 0.5 μl of SYTO 9, incubated in the dark for 15 minutes, filtered
through a 0.2 μm pore size polycarbonate black Nucleopore® membrane (Whatman, UK) and allowed
to air-dry. Then a drop of non-fluorescence immersion oil (Fluka, UK) and a coverslip were added
before observation under a Nikon Eclipse E800 episcopic differential interference
contrast/epifluorescence (EDIC/EF) microscope (Best Scientific, UK) [23]. As the cells were
homogenously distributed, fields of view were chosen at random and the number of cells counted on
each membrane. Heterotrophs were quantified by heterotrophic plate count (HPC) by plating onto R2A
(Oxoid, UK) and incubated at 22ºC for 7 days. Cultivable H. pylori was quantified by plating onto HP
medium agar plates as described in Chapter 5 and incubated at 37ºC in a microaerophilic atmosphere
Survival of drinking water pathogens after disinfection
128
for 7 days. The colonies obtained on HP agar plates were tested with the urease test (Oxoid, UK) and
by the use of a specific PNA probe to confirm the identity of H. pylori (see below).
6.2.3.4 Quantification of sessile cells
Coupons were immersed in 2 ml of filter-sterilized tap water containing autoclaved 2 mm diameter
glass beads (Merck, UK) and vortexed for 1 min to remove all the biofilm from the coupons surface
and homogenize the suspension. Total cells, HPC and cultivable H. pylori were quantified using the
methods described above. In addition, total H. pylori were quantified using a specific PNA probe with
the following sequence 5’- GAGACTAAGCCCTCC -3’ (Eurogentec, Belgium) in a fluorescence in situ
hybridization assay (PNA-FISH) [19]. PNA-FISH was carried out by taking 1 ml of an appropriate
dilution and filtered through a 0.2 μm anodisc membrane (Whatman, UK). This was left to air dry. Then
the membrane was covered with 4% (w/v) paraformaldehyde followed by 50% (v/v) ethanol for 10
minutes each to fix the cells and air dried. The hybridization, washing and microscopy observation
method was performed as described by Guimarães et al. [19].
6.2.3.5 Chlorine measurements and inactivation
Two of the biofilm-growing vessels were also continuously fed with chlorine, provided by 2 stock
solutions prepared every two days from a 5 g l-1 stock solution (Guest Medical, UK). Chlorine
concentration was controlled on a daily basis by measuring free chlorine on the water vessels by the
N,N-dimethyl-p-phenilenediamine (DPD) colorimetric method, as described before. To quantify
planktonic and sessile cells from these two vessels, it was necessary to neutralize the chlorine. As
such, sodium thiosulfate (Sigma, UK) at a final concentration of 5 mg l-1 was added to all the samples.
6.2.4 Experiments with H. pylori in pure culture
6.2.4.1 Chlorine disinfection tests
After considering the chlorine demand due to organic matter, an appropriate amount of the stock
solution was added to a suspension containing approximately 106 H. pylori CFU ml-1, in order to obtain
a free chlorine final concentration of 0.2; 0.7 and 1.2 mg l-1. A control assay where no chlorine was
added was also performed. Experiments were carried out in amber flasks (to avoid chlorine

Effect of chlorine on H. pylori
129
degradation by light) at room temperature and stirred at 620 rpm. Samples were taken at 0, 10, 20 and
30 minutes and cells quantified as explained below. At times 0 and 30 minutes the concentration of
free chlorine was measured by the DPD method as described before. The chlorine reaction was
inactivated by the addition of sodium thiosulfate (Sigma, UK) applied at a final concentration 5 mg l-1.
For each chlorine concentration the experiment was repeated at least three times.
6.2.4.2 Assessment of cultivable cells
A 40 μl aliquot of the previous samples was diluted (to obtain between 15 and 150 CFU per agar
plate) and spread onto CBA agar plates (in triplicate for each experiment) and incubated at 37ºC, in
the same atmosphere as described before, for 7-14 days. After this time the number of colonies was
counted to determine the number of cultivable cells remaining in the chlorinated solution.
6.2.4.3 Assessment of membrane integrity
To assess membrane integrity the LIVE/DEAD® BacLightTM Bacterial Viability kit (Molecular Probes,
UK) was used. A 50 μl aliquot of the samples was diluted in 0.95 ml of dechlorinated filtered tap water
and stained with SYTO 9/PI. A 3 μl volume of an equal proportion of SYTO 9 and PI mixture was
added to the sample and incubated in the dark, at room temperature for 15 minutes followed by
filtration through a polycarbonate black Nucleopore® membranes (0.2 μm pore size) (Whatman, UK).
Subsequently, the membranes were air dried, mounted onto glass slides with non-fluorescence
immersion oil and a cover slip. The slides were examined using an episcopic differential interference
contrast/epifluorescence microscope (EDIC/EF) (Best Scientific, UK) [23].
6.2.4.4 DNA electrophoresis
H. pylori NCTC 11637, grown under the same conditions as previously described, was suspended in
100 ml of dechlorinated and filtered tap water to give a final concentration of approximately 106 CFU
ml-1. This cell suspension was exposed to the same range of chlorine concentrations for 30 minutes.
Following this, cells were concentrated by centrifugation at 4000 rpm for 10 minutes and the DNA
extracted and purified using a DNA extract kit (Sigma, Spain). The DNA obtained was run in a
horizontal electrophoresis system for 2 hours at 100 V using 1% (w/v) agarose gel (Bio-Rad, Portugal)
Survival of drinking water pathogens after disinfection
130
containing ethidium bromide (50 μl l-1) of a 10 mg ml-1 stock (Bio-Rad, Portugal). Finally, the gel was
visualized by UV light.
6.2.5 Statistical analysis
Results obtained cultivable cells, membrane integrity, RNA injury, total and PNA cell counts were
transformed using a log10 scale. The mean for each was calculated based on at least three
experiments, and the homogeneity of variance across these parameters was checked by the Levene
test for equality of variances using a statistical package (SPSS Inc., Chicago IL, USA). Differences
between the parameters measured were subsequently compared by a one-way ANOVA followed by a
Bonferroni post hoc test. Differences were considered relevant if P<0.05.

Effect of chlorine on H. pylori
131
6.3 Results
6.3.1 Planktonic cells in the two-stage chemostat
Prior to the immersion of coupons the two-stage chemostat was continuously operated for ten days to
stabilize the microbial consortia in all the vessels. Afterwards and during the entire experiment the
number of total cells in the seed vessel remained constant with time but the number of heterotrophic
bacteria (HPC) decreased slightly (P<0.05), with an average 2.39 x 10⁶ cells ml-1 and 7.10 x 10⁵ CFU
ml-1, respectively. On Table 6.1 the mean of values obtained for total cells and HPC in the planktonic
phase for the three second-stage chemostats are presented. The numbers of total cells were
significantly lower (P=0.001), on average 40% lower in the chemostats where chlorine was added than
in the control vessel, where no chlorine was added (2.16 x 10⁶ cells ml-1). However, no statistically
significant differences were observed between the two concentrations of chlorine used (1.29 x 10⁶
cells ml-1 and 1.22 x 10⁶ cells ml-1, in the vessels where the concentration of chlorine was 0.2 mg l-1
and 1.2 mg l-1, respectively). Concerning the HPC numbers, the values obtained decreased smoothly
during the experiment (in general P<0.05), and were higher in the control vessel (9.88 x 10⁵ CFU ml-1)
and lower in the vessel with the highest concentration of chlorine (3.47 x 10⁴ CFU ml-1). The HPC
were statistically different when the three vessels were compared (P=0.001). The absence of
autochthonous H. pylori in the seed vessel required the inoculation of the biofilm growing vessels with
a collection strain as described above. However it was never possible to recover cultivable H. pylori
from any of the chemostats inoculated. Nevertheless, overgrowth of other microorganisms was
observed on the HP agar medium.
Table 6.1 Average numbers of total cell and HPC in the planktonic phase for all three conditions tested.
Cl2 concentration (mg l-1)
Total cells x 10-6 (cell ml-1)
HPC x 10-5 (CFU ml-1)
0.0 2.16 9.88
0.2 1.29 1.37
1.2 1.22 0.347

Survival of drinking water pathogens after disinfection
132
6.3.2 Population of biofilms
Figure 6.1a shows that most of the microorganisms adhered to the surface during the first day, and
that afterwards the numbers did not significantly change (in general, P>0.05). It was also possible to
observe that the total numbers of cells that constitute the biofilm in the absence and presence of
chlorine are different (P<0.05) but similar for the two different concentrations of chlorine used. The
numbers of total H. pylori detected by the specific PNA probe did not change significantly with the 3
conditions tested (P>0.05) (Figure 6.1b). It was in terms of cultivable cells that the differences between
the three conditions tested were observed. As expected, HPC decreased significantly when the
concentration of chlorine increased (Figure 6.1c). The HPC numbers were lower for the highest
concentration of chlorine (3.22 x 10² CFU cm-2) comparing to the other concentration of chlorine (9.94
x 102 CFU cm-2), and almost 3-log lower than in the control vessel (1.54 x 10⁵ CFU cm-2). Once again,
no cultivable H. pylori were detected although overgrowth of other microorganisms on the HP media
was observed.
Figura 6.1. Variation in the total cell number (a), total numbers of H. pylori (b) and HPC (c) in biofilms
formed when no chlorine is added ( ), when chlorine is continuously added to a final concentration of 0.2 ( ) and
1.2 ( ) mg l-1. Epifluorescence microphotograph of a biofilm hybridized with the H. pylori specific PNA probe,
using the TRITC filter. Bar represents 20 μm (d).

Effect of chlorine on H. pylori
133
6.3.3 Effect of chlorine on pure H. pylori suspensions
In order to understand the contribution of the heterotrophic consortium to protect H. pylori cells from
chlorine, an additional set of experiments using pure H. pylori cultures in suspension was performed.
Unlike the experiments on biofilms, chlorine was only added at the beginning of the experiment and as
such it was completely consumed after 30 minutes of contact time when the concentration of free
chlorine used was 0.2 and 0.7 mg l-1, whereas for the highest concentration of chlorine (1.2 mg l-1)
there was still some chlorine remaining in solution (Table 6.2). The values of the concentration of
chlorine presented (0.2; 0.7 and 1.2 mg l-1) already consider the chlorine demand due the initial
combination with organic matter.
Table 6.2 Chlorine concentration demand immediately after and 30 minutes after the chlorine addition to
the H. pylori suspension.
Cl2 concentration (mg l-1)
Cl2 measurement in the cell suspension (mg l-1)
0 min 30 min
0.2 0.373 0.076
0.7 0.598 0.044
1.2 1.011 0.115
In the control experiment, where no chlorine was added to the cell suspension, the number of total
(sum of viable and non-viable) and cultivable cells appear to remain constant with time, meaning that
at 20ºC there was no effect of water exposure during the 30 minutes of experiment (Figure 6.2a). For
all concentrations of chlorine added, there was no decrease in the number of viable cells though some
of the stained cells fluoresced from bright green to yellow and orange. The morphology of cells
remained constant during the entire length of the experiment for all conditions tested. The addition of
chlorine led to some loss of cultivability. It was observed that cells lost some cultivability when chlorine
was added but never completely lost the cultivability even for the highest concentration of chlorine.
Moreover, the difference between the number of cultivable H. pylori following 0.2 and 0.7 mg l-1
chlorine stress was not statistically significant (P>0.05). A surprising result was the disappearance of
the non-viable (cells that fluoresce red) bacteria for the two highest concentrations of chlorine used
(Figure 6.3b and c). For 0.7 mg l-1 the number of non-viable cells started decreasing after 10 minutes

Survival of drinking water pathogens after disinfection
134
of exposure time and completely disappeared in 10 minutes. For the highest concentration used the
non-viable cells completely disappeared during the first 10 minutes of chlorine exposure.
Figura 6.2. Variation in the number of total, viable and cultivable cells, after exposure to 0.0 (a), 0.2 (b), 0.7
(c) and 1.2 (d) mg l-1. Error bars represent standard deviation of at least three experiments.
DNA electrophoresis (Figure 6.3d) showed that after 30 min there were no cuts in the DNA, as only
one band appeared in the gel for all the conditions tested. However the bands became faint at chlorine
concentrations of 0.7 and 1.2 mg l-1.
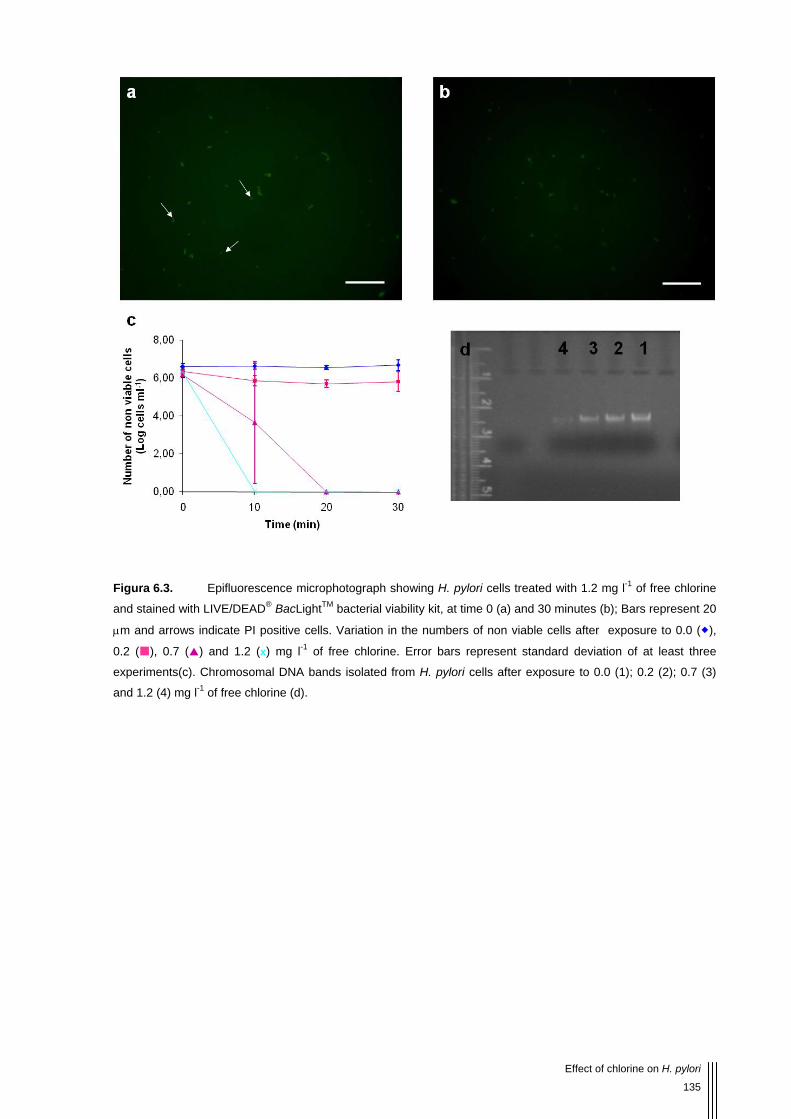
Effect of chlorine on H. pylori
135
Figura 6.3. Epifluorescence microphotograph showing H. pylori cells treated with 1.2 mg l-1 of free chlorine
and stained with LIVE/DEAD® BacLightTM bacterial viability kit, at time 0 (a) and 30 minutes (b); Bars represent 20
μm and arrows indicate PI positive cells. Variation in the numbers of non viable cells after exposure to 0.0 ( ),
0.2 ( ), 0.7 ( ) and 1.2 (x) mg l-1 of free chlorine. Error bars represent standard deviation of at least three
experiments(c). Chromosomal DNA bands isolated from H. pylori cells after exposure to 0.0 (1); 0.2 (2); 0.7 (3)
and 1.2 (4) mg l-1 of free chlorine (d).

Survival of drinking water pathogens after disinfection
136
6.4 Discussion
6.4.1 Planktonic cells in the two-stage chemostat
To form the heterotrophic biofilm a microbial consortium obtained by filtering tap water was used and
growth was promoted by using a low flow rate in the seed vessel. The constant numbers of total cells
and HPC for over 10 days revealed that the seed vessel was stable. H. pylori was not one of the
microorganisms present in this consortium, and as such the biofilm growing vessels were spiked with
a collection strain to study the influence of chlorine on the incorporation of this pathogen into drinking
water biofilms. It is known that at 15ºC this bacterium can maintain cultivability in suspension for more
than 70 hours [1, 4]. However, 30 minutes after inoculation, the water from all biofilm-growing vessels
was analyzed and no H. pylori was recovered on HP media but the growth of other microorganisms
was observed. As such, this strongly indicates that the recovery failed due to the overgrowth of
heterotrophic microorganisms and not to the immediate loss of cultivability by H. pylori. The medium
developed by Degnan et al. [15] needs improvement to be used in samples collected from
environment, as it has also been shown by Fernández and colleagues [17].
Results show that the total number of cells obtained in the second stage was similar to those obtained
in the first stage, despite the former being diluted with fresh medium. These results were observed
before the formation of biofilm, indicating that these high numbers were due to planktonic growth and
not to interactions with the biofilm. In fact, different concentrations of chlorine seem to have little effect
on the total number of planktonic microorganisms as the numbers obtained were similar, for the two
concentrations used and approximately half of the value obtained for the control vessel. The same
does not happen in terms of cultivability as cells lost cultivability with increasing concentrations of
chlorine. The fact that there are still cultivable cells suggests that there are microorganisms in the
inoculum that are resistant to chlorine and able to be recovered on artificial medium, which is not
surprising as the inoculum was obtained from chlorinated municipal water which means that bacteria
were chlorine adapted.
6.4.2 Sessile cells in the second stage of the chemostat system
The quantification of total cells present in the biofilm showed that different concentrations of chlorine
had no effect on biofilm formation as the numbers were similar for the two concentrations tested and
during the 26 days of experiment, which is not an unexpected result as it has been demonstrated
previously that biofilms are able to grow even in the presence of chlorine [24, 31]. The differences
observed here were in terms of cultivable cells, as the addition of chlorine promoted a loss of
cultivability of almost 3-log. These results can be supported by two studies conducted by Codony et al.
[11, 12], where it was shown that under chlorinated conditions the total number of cells was similar to
the control study but cells were less cultivable.

Effect of chlorine on H. pylori
137
6.4.3 Inclusion of H. pylori in heterotrophic biofilms
The quantification of total H. pylori showed that in the first few days there was no significant difference
between the different conditions tested, suggesting that, as the inoculum added to the chemostats was
the same, the inclusion of H. pylori in the heterotrophic biofilm was not influenced by the presence of
chlorine. During the first week there was a decrease in the number of total H. pylori that can be
explained by the fact that the pathogen has just been inoculated in the beginning of the experiment
(prior the immersion of coupons) and planktonic H. pylori cells were theoretically expected to be
washed out after approximately five hours. As such, after this time the cells that detach from the
biofilm can not be replaced and the detachment of biofilm that sloughs off H. pylori cells leads to a
decrease in the total numbers of this pathogen. After one week of biofilm formation the numbers of H.
pylori are constant for all the conditions tested although slightly lower in the biofilms formed under
chlorinated conditions. This might happen because the biofilm formed in the control chemostat were
slimier than the biofilms formed under chlorinated conditions. This slimy aspect indicates the presence
of exopolymeric substances (EPS) that embedded the biofilm, protecting it from external stress
conditions such as exposure to biocides. On the other hand, when the biofilm is thicker the
detachment of biofilm portions occurs preferentially in the external layer while internal layers remain
intact. The attachment of H. pylori occurred in the first 5 hours of biofilm formation, as it has been
explained before, and incorporates within in the inside layers. In thicker biofilms these layers remain
intact so the numbers of total H. pylori are constant with time. Conversely, when chlorine is added
biofilms are thinner so the detachment may also occur in the layers where H. pylori is adhered. On the
other hand, chlorine promotes biofilm detachment which can also contribute to a decrease in H. pylori
numbers.
Microscopy observation of H. pylori labeled to the 16S rRNA probe showed that the morphology of the
cells was mostly coccoid, both in the absence and presence of chlorine. This might be an important
observation as coccoid cells are known to retain their viability for longer and still able to cause
infections [3, 34]. Previous results have demonstrated that coccoid is the preferred shape at 15ºC
while at 20ºC the cells are normally spiral shaped (Chapter 5). This might indicate that at 15ºC cells
are more resistant to chlorination, which is the most commonly used disinfectant in DSWS.
6.4.4 Effect of chlorine on pure H. pylori suspensions
In the experiments described above two factors may have influenced the response of H. pylori to
chlorination: the presence of other microorganisms that might influence the behaviour of the pathogen
and the inclusion in biofilms, where H. pylori is more protected from the biocide effect of chlorine. To
try to understand the effect of this disinfectant on H. pylori cells, studies on suspended cells using a
pure culture were carried out. The studies were performed with suspended cells as other authors have
already demonstrated the inability of H. pylori to form homogeneous monospecies biofilms under most
conditions when suspended in water [3, 6, 13]. It was observed that H. pylori lost cultivability in the
presence of chlorine (P<0.05) for all the concentrations used compared to the control experiment but,

Survival of drinking water pathogens after disinfection
138
even at the highest concentration, it was always possible to recover cultivable cells. This could had
been due to the combination of organic matter that was introduced in the suspension with the cells, as
suggested by Johnson and colleagues [20], when they found that H. pylori was more resistant than E.
coli. However chlorine was measured at the end of the experiments and it was observed that for the
experiment at 1.2 mg l-1 there was still chlorine in the suspension, which means that there was enough
chlorine to react with the cells. On the other hand, the results presented in this study are opposite to
those obtained by other authors [8, 20, 30] where H. pylori had completely lost cultivability even at
lower concentrations than 1.2 mg l-1. This suggests that other parameters such as temperature, light
and water characteristics are important in chlorination efficiency [4].
The viability analysis showed that even for 1.2 mg l-1 the number of viable cells remained constant. An
interesting result was the fact that the non-viable cells disappeared when the concentration of chlorine
was 0.7 and 1.2 mg l-1. It was also observed by DNA electrophoresis that for these two concentrations
the genomic bands were fainter meaning that the concentration of DNA decreased. These two results
combined suggest that weaker H. pylori cells are more susceptible to chlorine than stronger cells, e.g.
there are H. pylori altruistic cells which absorb the chlorine to protect the others.
The results obtained in pure culture can bring some highlights for what happened in the experiments
with biofilms. The failure to recover cultivable H. pylori was likely to be due to the fact that the isolation
medium was not completely selective for H. pylori, allowing other microorganisms to grow. As a
fastidious microorganism that grows very slowly, the presence of other species may easily overgrow
H. pylori, being impossible to obtain cultivable data that could give important information. On the other
hand biofilms seem to promote altruism in cells [25], meaning that in biofilms H. pylori viable cells
might be extra protected by weakest H. pylori cells but also by other microorganisms present in the
consortium. The disappearance of non viable cells and loss of brightness of the DNA bands suggests
that the decrease in the numbers of total H. pylori in biofilms were not only due to the detachment of
the cells but also to the direct action of chlorine on altruistic cells. The detection of rRNA after 26 days
of inoculation indicates the presence of viable cells. It has been shown that cells can maintain bright
rRNA fluorescence after some hours of death but it would be impossible for 26 days. These two
results indicate that most dead cells disappeared in the first days of chlorine exposure and the cells
that were detected afterwards by PNA-FISH can be considered viable, although probably in VBNC
state, corroborated by the fact that most of the cells are coccoid shaped.
The fact that H. pylori in pure culture has never completely lost its cultivability shows the resistance of
this strain to chlorine, and the extra protection of biofilms which can lead to the presence of viable H.
pylori in DSDW, even if the cells are non cultivable. This work strongly supports the view that chlorine
in water might inhibit the activity of H. pylori, but fails to eliminate the pathogen from DWDS biofilms, a
safe haven where the pathogen might survive in a VBNC state.

Effect of chlorine on H. pylori
139
6.5 Acknowledgements
We would like to thank Nuno Guimarães for his technical assistance with the PNA FISH method. This
work was supported by the Portuguese Institute Fundação para a Ciência e Tecnologia (PhD grant
SFRH/BD/17088/2004 and post-doc grant SFRH/BPD/20484/2004).

Survival of drinking water pathogens after disinfection
140
6.6 References
1. Adams, B L, Bates, T C, and Oliver, J D. 2003. Survival of Helicobacter pylori in a natural
freshwater environment. Applied and Environmental Microbiology 69(12):7462-7466.
2. American Public Health Association. 1998. Standard methods for the examination of water
and wastewater, In: L. S. Clesceri, A. E. Greenberg, and A. D. Eaton (ed.), 20th ed. American
Public Health Association, American Water Works Association, Water Environmental
Federation, Washington DC. pp. 4.63-4.64
3. Azevedo, N F, Almeida, C, Cerqueira, L, Dias, S, Keevil, C W, and Vieira, M J. 2007.
Coccoid form of Helicobacter pylori as a morphological manifestation of cell adaptation to the
environment. Applied and Environmental Microbiology 73(10):3423-3427.
4. Azevedo, N F, Almeida, C, Fernandes, I, Cerqueira, L, Dias, S, Keevil, C W, and Vieira, M J. 2008. Survival of gastric and enterohepatic Helicobacter spp. in water: Implications for
transmission. Applied and Environmental Microbiology 74(6):1805-1811.
5. Azevedo, N F, Guimaraes, N, Figueiredo, C, Keevil, C W, and Vieira, M J. 2007. A new
model for the transmission of Helicobacter pylori: Role of environmental reservoirs as gene
pools to increase strain diversity. Critical Reviews in Microbiology 33(3):157 - 169.
6. Azevedo, N F, Pacheco, A P, Keevil, C W, and Vieira, M J. 2006. Adhesion of water
stressed Helicobacter pylori to abiotic surfaces. Journal of Applied Microbiology 101(3):718-
724.
7. Azevedo, N F, Vieira, M J, and Keevil, C W. 2003. Establishment of a continuous model
system to study Helicobacter pylori survival in potable water biofilms. Water Science and
Technology 47(5):155-160.
8. Baker, K H, Hegarty, J P, Redmond, B, Reed, N A, and Herson, D S. 2002. Effect of
oxidizing disinfectants (chlorine, monochloramine, and ozone) on Helicobacter pylori. Applied
and Environmental Microbiology 68(2):981-984.
9. Blaser, M J, and Atherton, J C. 2004. Helicobacter pylori persistence: biology and disease.
Journal of Clinical Investigation 113(3):321-333.
10. Bunn, J E G, Mackay, W G, Thomas, J E, Reid, D C, and Weaver, L T. 2002. Detection of
Helicobacter pylori DNA in drinking water biofilms: implications for transmission in early life.
Letters in Applied Microbiology 34(6):450-454.
11. Codony, F, Morato, J, and Mas, J. 2005. Role of discontinuous chlorination on microbial
production by drinking water biofilms. Water Research 39(9):1896-1906.
12. Codony, F, Morato, J, Ribas, F, and Mas, J D. 2002. Effect of chlorine, biodegradable
dissolved organic carbon and suspended bacteria on biofilm development in drinking water
systems. Journal of Basic Microbiology 42(5):311-319.
13. Cole, S P, Harwood, J, Lee, R, She, R, and Guiney, D G. 2004. Characterization of
monospecies biofilm formation by Helicobacter pylori. Journal of Bacteriology 186(10):3124-
3132.

Effect of chlorine on H. pylori
141
14. de Beer, D, Srinivasan, R, and Stewart, P S. 1994. Direct measurement of chlorine
penetration into biofilms during disinfection. Applied and Environmental Microbiology
60(12):4339-4344.
15. Degnan, A J, Sonzogni, W C, and Standridge, J H. 2003. Development of a plating medium
for selection of Helicobacter pylori from water samples. Applied and Environmental
Microbiology 69(5):2914-2918.
16. Engstrand, L. 2001. Helicobacter in water and waterborne routes of transmission. Journal of
Applied Microbiology 90(80S-84S.
17. Fernandez, M, Contreras, M, Suarez, P, Gueneau, P, and Garcia-Amado, M A. 2007. Use
of HP selective medium to detect Helicobacter pylori associated with other enteric bacteria in
seawater and marine molluscs. Letters in Applied Microbiology 45(2):213-218.
18. Gomes, B C, and Martinis, E C P. 2004. The significance of Helicobacter pylori in water, food
and environmental samples. Food Control 15(5):397-403.
19. Guimaraes, N, Azevedo, N F, Figueiredo, C, Keevil, C W, and Vieira, M J. 2007.
Development and application of a novel peptide nucleic acid probe for the specific detection of
Helicobacter pylori in gastric biopsy specimens. Journal of Clinical Microbiology 45(9):3089-
3094.
20. Johnson, C H, Rice, E W, and Reasoner, D J. 1997. Inactivation of Helicobacter pylori by
chlorination. Applied and Environmental Microbiology 63(12):4969-4970.
21. Juhna, T, Birzniece, D, Larsson, S, Zulenkovs, D, Sharipo, A, Azevedo, N F, Menard-Szczebara, F, Castagnet, S, Feliers, C, and Keevil, C W. 2007. Detection of Escherichia coli
in biofilms from pipe samples and coupons in drinking water distribution networks. Applied and
Environmental Microbiology 73(22):7456-7464.
22. Keevil, C W. 2001. Continuous culture models to study pathogens in biofilms. Methods in
Enzimology 337(104-122.
23. Keevil, C W. 2003. Rapid detection of biofilms and adherent pathogens using scanning
confocal laser microscopy and episcopic differential interference contrast microscopy. Water
Science and Technology 47(5):105-116.
24. Keevil, C W, Mackerness, C W, and Colbourne, J S. 1990. Biocide treatment of biofilms.
International Biodeterioration and Biodegradation 26(169-179.
25. Kreft, J U. 2004. Biofilms promote altruism. Microbiology 150(2751-2760.
26. Kuchta, J M, States, S J, McNamara, A M, Wadowsky, R M, and Yee, R B. 1983.
Susceptibility of Legionella pneumophila to chlorine in tap water. Applied and Environmental
Microbiology 46(5):1134-1139.
27. Lehtola, M J, Torvinen, E, Miettinen, L T, and Keevil, C W. 2006. Fluorescence in situ
hybridization using peptide nucleic acid probes for rapid detection of Mycobacterium avium
subsp avium and Mycobacterium avium subsp paratuberculosis in potable water biofilms.
Applied and Environmental Microbiology 72(1):848-853.
28. Mackay, W G, Gribbon, L T, Barer, M R, and Reid, D C. 1998. Biofilms in drinking water
systems - A possible reservoir for Helicobacter pylori. Water Science and Technology
38(12):181-185.

Survival of drinking water pathogens after disinfection
142
29. Moberg, L, and Karlberg, B. 2000. An improved N,N '-diethyl-p-phenylenediamine (DPD)
method for the determination of free chlorine based on multiple wavelength detection.
Analytica Chimica Acta 407(1-2):127-133.
30. Moreno, Y, Piqueres, P, Alonso, J L, Jiménez, A, González, A, and Ferrús, M A. 2007.
Survival and viability of Helicobacter pylori after inoculation into chlorinated drinking water.
Water Research 41(15):3490-3496.
31. Norton, C D, and LeChevallier, M W. 2000. A pilot study of bacteriological population
changes through potable water treatment and distribution. Applied and Environmental
Microbiology 66(1):268-276.
32. Park, S R, Mackay, W G, and Reid, D C. 2001. Helicobacter sp recovered from drinking
water biofilm sampled from a water distribution system. Water Research 35(6):1624-1626.
33. Schoenen, D. 2002. Role of disinfection in suppressing the spread of pathogens with drinking
water: possibilities and limitations. Water Research 36(15):3874-3888.
34. She, F F, Lin, J Y, Liu, J Y, Huang, C, and Su, D H. 2003. Virulence of water induced
coccoid Helicobacter pylori and its experimental infection in mice. World Journal of
Gastroenterology 9(3):516-520.
35. Wilks, S A, and Keevil, C W. 2006. Targeting species-specific low-affinity 16S rRNA binding
sites by using peptide nucleic acids for detection of legionellae in biofilms. Applied and
Environmental Microbiology 72(8):5453-5462.


Co-culture of L. pneumophila and H. pylori with water bacteria
145
7.1 Introduction
Under stressful conditions bacteria can adhere to surfaces forming a complex structure called biofilm.
In these structures the microorganisms are less exposed to the external factors responsible for stress,
such as temperature, low nutrients, presence of biocides, etc [11, 13, 16, 19, 27]. In natural
environments biofilms are constituted by several species of microorganisms that can interact with each
other either positively (for instance, the synthesis of a metabolite by one species that can be used in
the metabolism of another) or negatively (such as nutrient competition) [12, 37, 49]. One type of
biofilm that has been widely studied is that formed in drinking water distribution systems (DWDS),
because of its role in introduction of pathogens in drinking water and consequent impact in the human
health [7, 42].
Legionella pneumophila is a waterborne pathogen that can cause Legionnaires’ disease or Pontiac
fever [30, 35]. This pathogen is found naturally in fresh water reservoirs and can contaminate drinking
water when the disinfection is inefficient, being transmitted to man when contaminated aerosols are
inhaled [15, 22, 23, 40]. On the other hand, the mode of transmission of Helicobacter pylori remains
controversial but drinking water as a route of transmission has been recently proposed. Although no
cultivable H. pylori has ever been recovered from drinking water systems, molecular techniques such
as PCR [9, 29, 34, 46] and peptide nucleic acid (PNA) probes used to target 16S rRNA in
fluorescence in situ hybridization (FISH) assays [8, 36], have demonstrated the presence of this
pathogen in DWDS. This identification, associated with epidemiological studies that point to different
prevalences of H. pylori in a population associated with the type of source water, strongly supports
water as a route of transmission (reviewed in [3, 17, 20, 26]).
Previous studies have demonstrated that both pathogens can incorporate into heterotrophic drinking
water biofilms and remain for at least 32 days (Chapter 3 to 6). In the case of H. pylori, although no
cultivable cells were ever recovered, the presence of a high intracellular rRNA content indicates that
cells might be in a viable but non cultivable (VBNC) state [4]. On the other hand, after incorporation
into a multi-species biofilm, it is possible that some of the microorganisms might have contributed for
the loss of cultivability [43]. It is also possible that there were other microorganisms present that could
have a beneficial effect on L. pneumophila or H. pylori, as shown by planktonic studies in liquid media
[41, 47]. However, for multi-species biofilms it is technically very challenging to determine which
sessile microorganisms could have a positive or negative effect on these pathogens, particularly
regarding the intimate associations that occur within biofilms. These associations can occur between
the same cells (autoaggregation) or between different species (coaggregation) and have been well
described for isolates of dental plaque species in complex media and aquatic species in potable water
[10, 38].

Survival of drinking water pathogens after disinfection
146
Therefore, in addition to studying autoaggregation and coaggregation in planktonic culture, some of
the microorganisms isolated from these biofilms were used to form dual species biofilms with L.
pneumophila and H. pylori as a way to understand the mechanisms of sessile survival of these two
pathogens in drinking water biofilms.

Co-culture of L. pneumophila and H. pylori with water bacteria
147
7.2 Material and Methods
7.2.1 Culture maintenance
All strains were maintained in vials frozen at -80ºC and recovered by standard plating procedures onto
the appropriate media. L. pneumophila NCTC 12821, Variovorax paradoxus and Mycobacterium
chelonae were grown on Buffered Charcoal Yeast Extract (BCYE) agar (Oxoid, UK) for 24 hours at
30ºC. Acidovorax sp. and Sphingomonas sp. were grown on R2A (Oxoid, UK) for 48 hours at 22ºC. H.
pylori NCTC 11637 and Brevundimonas sp. were grown on Columbia Agar (Oxoid, UK) supplemented
with 5% (v/v) defibrinated horse blood (CBA) (Oxoid, UK) and incubated for 48 hours at 37ºC in a
microaerophilic atmosphere of 10 % CO2, 7 % H2 and 3 % O2, the remainder being N2.
7.2.2 Co-aggregation in test tubes
All bacterial strains were suspended in dechlorinated and filtered tap water in a final concentration of
approximately 2 x 10⁸ cells ml-1. For auto-aggregation, 3 ml of each suspension was transferred into
a sterile test tube, whereas for co-aggregation experiments 1.5 ml of either L. pneumophila or H. pylori
suspension was added to 1.5 ml of each one of the species isolated from drinking water biofilms. At
times 0, 1, 2, 4, 6, 8, 24 and 48 hours, tubes were vortexed for 10 seconds and observed for co-
aggregation according to the scale described by [38].
7.2.3 Biofilm formation
Cells were suspended in 50 ml of dechlorinated and filtered tap water to give a final concentration of
approximately 107 cells ml-1. As a control , pure-culture biofilms were formed by L. pneumophila
NCTC12821 and H. pylori NCTC11637. In the other experiments, L. pneumophila or H. pylori were
mixed with the other bacteria to form two-species biofilms. All suspensions were homogenized by
vortexing and 5 ml were transferred to 6-well microtitre plates containing one unplasticized
polyvinylchloride (uPVC) coupon in each well. Plates were incubated in the dark at 22ºC and two
coupons of each biofilm type were removed after 1, 2, 4, 8, 16 and 32 days, and gently rinsed to
remove loosely attached cells on the surface of the biofilm. One coupon was used for direct
observation under a Nikon Eclipse E800 episcopic differential interference contrast/epifluorescence
(EDIC/EF) microscope (Best Scientific, UK) [25] using the EDIC channel to directly visualise biofilm
and the other one scraped to quantify sessile cells.
7.2.4 Preparation of coupons
uPVC coupons (1 cm2) were used as a substratum for biofilm growth. Coupons were immersed in
water and detergent for 5 min, washed with a bottle brusher, rinsed twice in distilled water and air-

Survival of drinking water pathogens after disinfection
148
dried. Subsequently, they were washed in 70% (v/v) ethanol to remove any organic compounds and
autoclaved at 1 atm and 121ºC [24].
7.2.5 Quantification of sessile cells
Coupons were immersed in 2 ml of filter-sterilized tap water containing autoclaved 2 mm diameter
glass beads (Merck, UK) and vortexed for 1 min to remove all the biofilm from the coupons surface
and homogenize the suspension. Total cells were quantified using the SYTO 9 staining method
(Molecular Probes, Invitrogen, UK). In short, 1 ml of an appropriate dilution was mixed with 0.5 μl of
SYTO 9, incubated in the dark for 15 minutes, filtered through a 0.2 μm pore size polycarbonate black
Nucleopore® membrane (Whatman, UK) and allowed to air-dry. Then, a drop of non-fluorescent
immersion oil (Fluka, UK) and a coverslip were added before observation under the Nikon Eclipse
E800 EDIC/EF microscope (Best Scientific) [25]. As the cells were homogenously distributed, 10 fields
of view were chosen at random and the number of cells counted on each membrane. Cultivable
numbers, obtained for all bacteria, were determined by plating 40 μl of the suspension on the
respective agar medium under the appropriate incubation conditions, as described above. BCYE
plates were incubated for 2 days and R2A and CBA plates were incubated for 7 days.
L. pneumophila was also quantified using the specific PNA probe PLPNE620 (5’-CTG ACC GTC CCA
GGT-3’) and H. pylori by the use of a PNA probe with the following sequence 5’-
GAGACTAAGCCCTCC -3’(Eurogentec, Belgium). PNA-FISH was carried out by filtering 1 ml of an
appropriate dilution through a 0.2 μm anodisc membrane (Whatman, UK). This was left to air dry. For
the quantification of L. pneumophila the membrane was covered with 90% (v/v) ethanol to fix the cells
and again air dried. The hybridization, washing and microscopy observation method was performed as
described by [51]. For H. pylori quantification the membrane was covered with 4% (w/v)
paraformaldehyde followed by 50% (v/v) ethanol for 10 minutes each to fix the cells and air dried. The
hybridization, washing and microscopy observation method was performed as described by [21].
7.2.6 Statistical analysis
The homogeneity of variances of total number, PNA and cultivable cells and the relation between L.
pneumophila of cells and total cells was checked by the Levene test for equality of variances using a
statistical package (SPSS Inc., Chicago IL, USA). Results were subsequently compared by a one-way
ANOVA followed by a Bonferroni post hoc test. Differences were considered relevant if P<0.05.

Co-culture of L. pneumophila and H. pylori with water bacteria
149
7.3 Results and Discussion
In a previous study several bacterial strains were isolated from heterotrophic biofilms formed on uPVC
coupons in a two-stage chemostat system (Chapter 3 to 6). For the present work, the selection of the
bacteria used was based on the prevalence of these isolated strains in biofilms, i.e., the strains that
were always present in biofilm samples were used rather than those that were only found
intermittently. Initially, the selected biofilm strains were tested for auto and co-aggregation in test tubes
as described by Rickard et al. [38], either alone or with L. pneumophila. No aggregation was observed
for the strains studied either alone or in pairs with L. pneumophila (results not shown).
Figura 7.1. Epifluorescence microphotograph of L. pneumophila cells from the inoculum stained with SYTO
9 (a) and labeled by the PNA PLPEN620 probe (b). Bars represent 20 μm. (c) Variation with time in the total cell
number ( ), L. pneumophila bound to the PNA PLPEN620 probe ( ) and cultivable L. pneumophila ( ) present
in the L. pneumophila pure biofilm. (d) Average of the relation between the numbers L. pneumophila PNA cells
and total cells (turquoise bars) and relation between cultivable L. pneumophila and L. pneumophila PNA cells
(bright blue bars) for the pure and dual species biofilm.
For the experiments of biofilm formation on uPVC coupons, a L. pneumophila inoculum containing
approximately 3.7 x 10⁷ cells ml-1 was prepared; 49% were cultivable and 50% were detected by PNA-
FISH. Figures 7.1a and 1b describe cells from the inoculum stained with SYTO 9 and the PNA probe,
respectively, showing the differences of the two methods used. Cells obtained from rich media agar

Survival of drinking water pathogens after disinfection
150
plates are normally considered to be in a good physiological state and the similarity in the cultivable
and PNA detectable numbers, and the difference between PNA-labeled and total cells, strongly
indicates that the PNA probe failed to detect cells in all metabolic states. PNA probes have been used
to detect pathogens in mixed biofilms but it has not been well established if this technique can also
detect non-viable cells. In fact, some authors have suggested that as selected PNA probes bind
specifically to rRNA molecules, and after cellular death the content of rRNA decreases significantly,
the emission of a bright signal is a good indication of a high rRNA content and viability [6, 28, 51]. The
results obtained in this work corroborate that hypothesis. The inocula of the other strains had on
average 75% of cultivable cells except in the case of Mycobacterium chelonae where the percentage
was considerably lower (2.5%).
To simplify the presentation of results, only the variation with time of total cells, PNA-cells and
cultivable L. pneumophila present in the biofilm of the control experiment are shown (Figure 7.1c). As
it has been also shown before by other authors [42, 43], most of the cells attach to the uPVC surface
in the first day and the numbers of total and PNA cells did not change significantly (P>0.05) while
cultivable cells have a great increase in the first 2 weeks and decrease significantly in the two last
weeks of the experiment (P<0.05). It has been demonstrated that L. pneumophila can survive in tap
water for long periods without losing cultivability [35]. However, the bacterium is not able to replicate in
axenic cultures in tap water or in low nutrient media but only when associated with biofilms or
parasitizing amoeba species [33, 45]. Moreover, the similarity in the numbers of PNA and cultivability
suggest that cells that are not cultivable also have a low ribosomal content, and hence are probably in
a non-viable state. As such, the increase in the numbers of cultivable cells present in biofilms can be
explained by the fact that biofilms exist in a dynamic pseudo steady-state, meaning that while portions
of biofilm are constantly being sloughed off, more cells are attaching to the surface [9, 52]. If the cells
that detach are preferentially non cultivable and there is attachment of cultivable cells then the
numbers of cultivable cells embedded in the biofilm increase. Moreover, Rogers et al. (1992) [44]
showed that L. pneumophila can grow as microcolonies in complex consortia biofilms [44]. Although
single species biofilm cells appear to have lost cultivability, probably due to exhaustion of essential
nutrients in the batch culture system, PNA numbers remained constant and suggest that cells are still
viable. On the other hand, the maintenance of cultivability by some cells indicate that biofilms are a
protective niche for L. pneumophila even in axenic culture. The fact that total L. pneumophila and
PNA-labeled L. pneumophila remained constant with time indicates that there is no damage to DNA
and rRNA structures along the experiment and therefore the variation of PNA numbers in mixed
biofilms can be a good indicator of the variation of total L. pneumophila inside of those biofilms.
The numbers of L. pneumophila PNA cells and cultivable L. pneumophila when associated with other
bacteria do not change significantly with time after the first day (P>0.05). Table 7.1 shows that the
average of numbers of total cells, total PNA L. pneumophila and cultivable L. pneumophila in pure
biofilms and in dual species biofilms were similar, except for the numbers of cultivable L. pneumophila
when associated with Acidovorax sp. that were significantly lower (P<0.05). Figure 7.1d shows the
percentage of numbers of PNA L. pneumophila in relation to total cells and the percentage of
cultivable L. pneumophila in relation to PNA L. pneumophila. In the first case the percentage appears
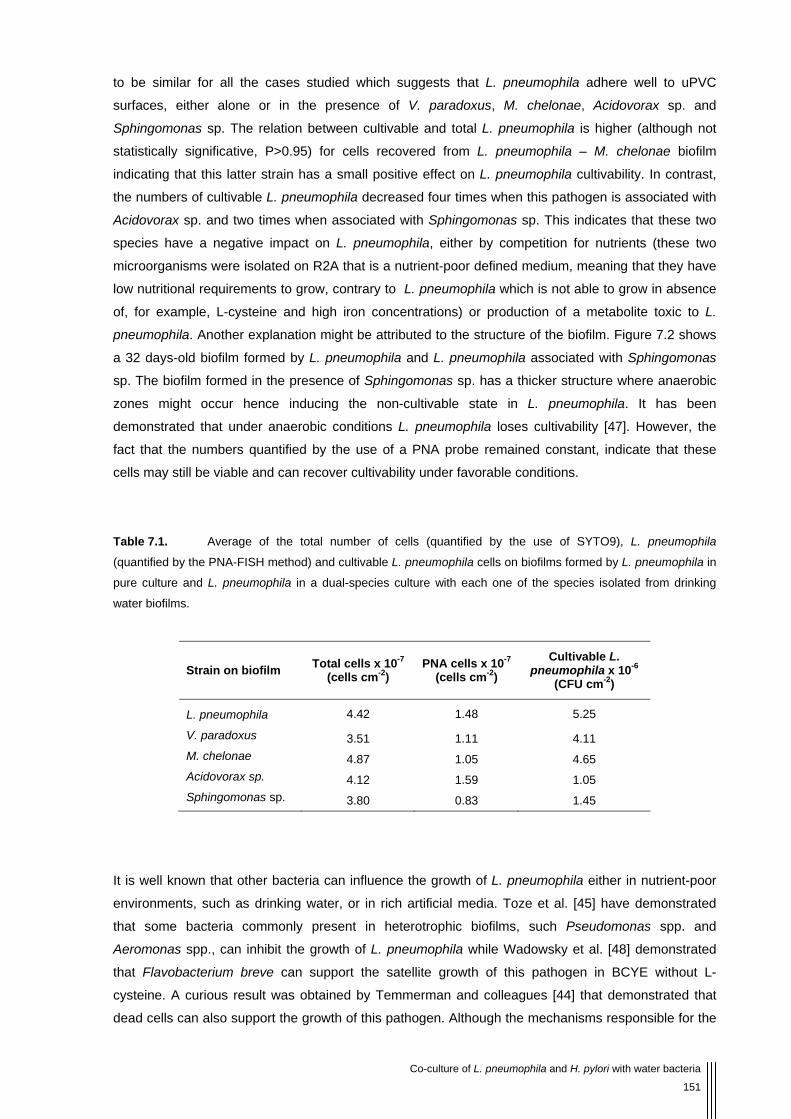
Co-culture of L. pneumophila and H. pylori with water bacteria
151
to be similar for all the cases studied which suggests that L. pneumophila adhere well to uPVC
surfaces, either alone or in the presence of V. paradoxus, M. chelonae, Acidovorax sp. and
Sphingomonas sp. The relation between cultivable and total L. pneumophila is higher (although not
statistically significative, P>0.95) for cells recovered from L. pneumophila – M. chelonae biofilm
indicating that this latter strain has a small positive effect on L. pneumophila cultivability. In contrast,
the numbers of cultivable L. pneumophila decreased four times when this pathogen is associated with
Acidovorax sp. and two times when associated with Sphingomonas sp. This indicates that these two
species have a negative impact on L. pneumophila, either by competition for nutrients (these two
microorganisms were isolated on R2A that is a nutrient-poor defined medium, meaning that they have
low nutritional requirements to grow, contrary to L. pneumophila which is not able to grow in absence
of, for example, L-cysteine and high iron concentrations) or production of a metabolite toxic to L.
pneumophila. Another explanation might be attributed to the structure of the biofilm. Figure 7.2 shows
a 32 days-old biofilm formed by L. pneumophila and L. pneumophila associated with Sphingomonas
sp. The biofilm formed in the presence of Sphingomonas sp. has a thicker structure where anaerobic
zones might occur hence inducing the non-cultivable state in L. pneumophila. It has been
demonstrated that under anaerobic conditions L. pneumophila loses cultivability [47]. However, the
fact that the numbers quantified by the use of a PNA probe remained constant, indicate that these
cells may still be viable and can recover cultivability under favorable conditions.
Table 7.1. Average of the total number of cells (quantified by the use of SYTO9), L. pneumophila
(quantified by the PNA-FISH method) and cultivable L. pneumophila cells on biofilms formed by L. pneumophila in
pure culture and L. pneumophila in a dual-species culture with each one of the species isolated from drinking
water biofilms.
Strain on biofilm Total cells x 10-7 (cells cm-2)
PNA cells x 10-7 (cells cm-2)
Cultivable L. pneumophila x 10-6
(CFU cm-2)
L. pneumophila 4.42 1.48 5.25
V. paradoxus 3.51 1.11 4.11 M. chelonae 4.87 1.05 4.65 Acidovorax sp. 4.12 1.59 1.05 Sphingomonas sp. 3.80 0.83 1.45
It is well known that other bacteria can influence the growth of L. pneumophila either in nutrient-poor
environments, such as drinking water, or in rich artificial media. Toze et al. [45] have demonstrated
that some bacteria commonly present in heterotrophic biofilms, such Pseudomonas spp. and
Aeromonas spp., can inhibit the growth of L. pneumophila while Wadowsky et al. [48] demonstrated
that Flavobacterium breve can support the satellite growth of this pathogen in BCYE without L-
cysteine. A curious result was obtained by Temmerman and colleagues [44] that demonstrated that
dead cells can also support the growth of this pathogen. Although the mechanisms responsible for the

Survival of drinking water pathogens after disinfection
152
influence of different microorganisms in L. pneumophila are unknown there is one aspect of L.
pneumophila microbial ecology that has been already well-established: L. pneumophila is not able to
grow in drinking water unless associated with biofilms or amoeba species ([15, 32],reviewed in [24]).
Hence, the knowledge of how microorganisms affect L. pneumophila growth might play a key factor for
the effective control of this pathogen in drinking water and requires further investigation.
Figura 7.2. Microphotograph of a uPVC coupon visualized under EDIC microscopy covered with a 32 days-
old biofilm formed by L. pneumophila (a) and L. pneumophila and Sphingomonas sp. (b). Bars represent 20 μm.
The same experiments were repeated using H. pylori instead of L. pneumophila and performing an
extra experiment with Brevundimonas sp., a bacterium isolated on CBA medium from drinking water
biofilms. The results in test tubes also reveal no co-aggregation with any of the bacteria. In fact,
several species isolated from drinking water biofilms do not present auto-aggregation, and it has been
particularly demonstrated for Brevundimonas vesicularis, Acidovorax delafieldii and V. paradoxus [10,
39].
In the H. pylori inoculum only 5.0% of the total cells were cultivable, a value similar to the value
obtained by Azevedo and colleagues [2], while 29% were detected by PNA-FISH. The difference
between cultivable and PNA numbers indicates that although coming from a rich medium some of the
cells were already in a VBNC state. However the poor cultivability of the cells on agar media do not
seem to be an obstacle to the formation of biofilm, as shown for biofilms formed after 1 and 32 days
(Figure 7.3a, b and c).

Co-culture of L. pneumophila and H. pylori with water bacteria
153
Figura 7.3. Microphotograph of a uPVC coupon visualized under EDIC microscopy covered with a 1 day-old
biofilm formed by H. pylori in pure culture in two different visual planes bottom (a) and top (b) and 32 days-old
biofilm (c). Bars represent 20 μm. (d) Variation with time in the total cell number ( ) and H. pylori PNA-cells ( )
present in the biofilm.
Figure 7.3d shows that when in pure culture H. pylori adheres to the surface to form the biofilm in the
first day followed by a statistically significant decrease in total cells (P<0.05) but only for the first 4
days. The same trend was observed for total cells and cells quantified by the PNA probe. No cultivable
H. pylori were recovered on CBA medium, which is opposite to the Azevedo et al [1] studies, that after
24 hours there were still cultivable cells in the biofilm. This might be due to the differences in method
of cell removal from the coupons, the quality of water or the type of uPVC. When the biofilm was
formed in the presence of Brevundimonas sp. the variation with time of total cells and PNA numbers
were not statistically significant (P>0.05). In this case due to the fast and easy growth of
Brevundimonas on CBA medium it is not possible to conclude about the loss of cultivability of H. pylori
when recovered from biofilms. Comparing the numbers obtained for pure H. pylori biofilms and
biofilms grown in the presence of Brevundimonas sp. there was no significant difference between the
numbers of H. pylori detected using the PNA probe (results not shown) or in the percentage between
PNA and total cells numbers (P>0.05) which suggest that this bacterium as little or no effect on the
inclusion of H. pylori in biofilms.
The recovery of cultivable H. pylori from biofilms grown in the presence of M. chelonae and
Sphingomonas sp. (6.67 x 101 and 1.83 x 10² CFU cm-2, respectively) suggests that these
microorganisms might have a positive effect on the inclusion and survival of this pathogen in drinking

Survival of drinking water pathogens after disinfection
154
water biofilms. The ability of H. pylori to adaptat to different physico-chemical parameters has been
studied by several authors [4, 5, 31, 33, 50] however no studies about the influence of other
microorganisms on the survival of this pathogen have been found in literature except the coculture of
H. pylori with the protozoa Acanthamoeba castellanii [52]. The synergetic interaction of
microorganisms in biofilms is well documented and in this particular case can be the key for the
survival of this microorganism in drinking water systems. More investigations should therefore be
performed concerning the influence of drinking water microorganisms on H. pylori metabolism and
survival.
When H. pylori cells were visualized under epifluorescence microscopy after being hybridized with the
H. pylori specific probe, it was observed that in the inoculum the morphology of the cells was
predominantly spiral while after forming biofilms the cells were mainly coccoid shaped. The coccoid
shape has been demonstrated by Azevedo and coworkers [1] as an environmental adaptation of this
pathogen to stress conditions and is associated to the VBNC state. It would be interesting to further
investigate and verify if these cells were able to recover and cause infections in mice or guinea pigs.
This work clearly demonstrates that, even in pure culture, both pathogens can adhere to surfaces and
form biofilm. L. pneumophila can remain cultivable for at least 32 days although less cultivable when
associated with Acidovorax sp. and Sphingomonas sp. On the other hand H. pylori loses the
cultivability in less than 24 hours except when associated with M. chelonae and Sphingomonas sp. M.
chelonae seems to have an important effect on the cultivability of both pathogens and being a
pathogen commonly found in drinking water systems [14, 18], can play an important role in disinfection
procedures. Control of this mycobacteria opportunistic pathogen and other biofilm species that can
have a synergetic effect on L. pneumophila and H. pylori might provide an important contribution
towards the supply of safe dinking water as both L. pneumophila and H. pylori have been found to be
chlorine resistant.

Co-culture of L. pneumophila and H. pylori with water bacteria
155
7.4 Acknowledgements
This work was supported by the Portuguese Institute Fundação para a Ciência e Tecnologia (PhD
grant SFRH/BD/17088/2004 and post-doc grant SFRH/BPD/20484/2004).

Survival of drinking water pathogens after disinfection
156
7.5 References
1. Azevedo, N F, Almeida, C, Cerqueira, L, Dias, S, Keevil, C W, and Vieira, M J. 2007.
Coccoid form of Helicobacter pylori as a morphological manifestation of cell adaptation to the
environment. Applied and Environmental Microbiology 73(10):3423-3427.
2. Azevedo, N F, Almeida, C, Fernandes, I, Cerqueira, L, Dias, S, Keevil, C W, and Vieira, M J. 2008. Survival of gastric and enterohepatic Helicobacter spp. in water: Implications for
transmission. Applied and Environmental Microbiology 74(6):1805-1811.
3. Azevedo, N F, Guimaraes, N, Figueiredo, C, Keevil, C W, and Vieira, M J. 2007. A new
model for the transmission of Helicobacter pylori: Role of environmental reservoirs as gene
pools to increase strain diversity. Critical Reviews in Microbiology 33(3):157 - 169.
4. Azevedo, N F, Pacheco, A P, Keevil, C W, and Vieira, M J. 2004. Nutrient shock and
incubation atmosphere influence recovery of culturable Helicobacter pylori from water. Applied
and Environmental Microbiology 70(1):490-493.
5. Azevedo, N F, Pinto, A R, Reis, N M, Vieira, M J, and Keevil, C W. 2006. Shear stress,
temperature, and inoculation concentration influence the adhesion of water-stressed
Helicobacter pylori to stainless steel 304 and polypropylene. Applied and Environmental
Microbiology 72(4):2936-2941.
6. Azevedo, N F, Vieira, M J, and Keevil, C W. 2003. Development of peptide nucleic acid
probes to detect H. pylori in diverse species potable water biofilms In: A. McBain, C. Allison,
M. Brading, A. Rickard, J. Verran, and J. Walker (ed.), Biofilm communities: Order from
chaos? Bioline, Cardiff, pp. 231-239.
7. Berry, D, Xi, C W, and Raskin, L. 2006. Microbial ecology of drinking water distribution
systems. Current Opinion in Biotechnology 17(3):297-302.
8. Bragança, S M, Azevedo, N F, Simões, L C, Keevil, C W, and Vieira, M J. 2007. Use of
fluorescent in situ hybridisation for the visualisation of Helicobacter pylori in real drinking water
biofilms. Water Science and Technology 55(8):387-393.
9. Bunn, J E G, Mackay, W G, Thomas, J E, Reid, D C, and Weaver, L T. 2002. Detection of
Helicobacter pylori DNA in drinking water biofilms: implications for transmission in early life.
Letters in Applied Microbiology 34(6):450-454.
10. Buswell, C M, Herlihy, Y M, Marsh, P D, Keevil, C W, and Leach, S A. 1997.
Coaggregation amongst aquatic biofilm bacteria. Journal of Applied Microbiology 83(4):477-
484.
11. Camper, A, Burr, M, Ellis, B, Butterfield, P, and Abernathy, C. 1999. Development and
structure of drinking water biofilms and techniques for their study. Journal of Applied
Microbiology 85(1S-12S.
12. Christensen, B B, Haagensen, J A J, Heydorn, A, and Molin, S. 2002. Metabolic
commensalism and competition in a two-species microbial consortium. Applied and
Environmental Microbiology 68(5):2495-2502.
Co-culture of L. pneumophila and H. pylori with water bacteria
157
13. Costerton, J W, Lewandowski, Z, Caldwell, D E, Korber, D R, and Lappin-Scott, H M. 1995. Microbial biofilms. Annual Review of Microbiology 49(1):711-745.
14. Dailloux, M, Laurain, C, Weber, M, and Hartemann, P. 1999. Water and nontuberculous
mycobacteria. Water Research 33(10):2219-2228.
15. Devos, L, Boon, N, and Verstraete, W. 2005. Legionella pneumophila in the environment:
The occurrence of a fastidious bacterium in oligotrophic conditions. Reviews in Environmental
Science and Biotechnology 4(1):61-74.
16. Emtiazi, F, Schwartz, T, Marten, S M, Krolla-Sidenstein, P, and Obst, U. 2004.
Investigation of natural biofilms formed during the production of drinking water from surface
water embankment filtration. Water Research 38(5):1197-1206.
17. Engstrand, L. 2001. Helicobacter in water and waterborne routes of transmission. Journal of
Applied Microbiology 90(80S-84S.
18. Fischeder, R, Schulzerobbecke, R, and Weber, A. 1991. Occurrence of mycobacteria in
drinking water samples. Zentralblatt fur Hygiene und Umweltmedizin 192(2):154-158.
19. Fletcher, M, and Marshall, K C. 1982. Are solid surfaces of ecological significance to aquatic
bacteria In: K. C. Marshall (ed.), Advances in microbial ecology, vol. 6. Plenum Publishing
Corp, New York, pp. 199-230.
20. Gomes, B C, and Martinis, E C P. 2004. The significance of Helicobacter pylori in water, food
and environmental samples. Food Control 15(5):397-403.
21. Guimaraes, N, Azevedo, N F, Figueiredo, C, Keevil, C W, and Vieira, M J. 2007.
Development and application of a novel peptide nucleic acid probe for the specific detection of
Helicobacter pylori in gastric biopsy specimens. Journal of Clinical Microbiology 45(9):3089-
3094.
22. Hsu, S C, Martin, R, and Wentworth, B B. 1984. Isolation of Legionella species from drinking
water. Applied and Environmental Microbiology 48(4):830-832.
23. Keevil, C W. 2002. Pathogens in environmental biofilms In: G. Bitton (ed.), The Encyclopedia
of Environmental Microbiology. Wiley, New York, pp. 2339-2356.
24. Keevil, C W. 2001. Continuous culture models to study pathogens in biofilms. Methods in
Enzimology 337(104-122.
25. Keevil, C W. 2003. Rapid detection of biofilms and adherent pathogens using scanning
confocal laser microscopy and episcopic differential interference contrast microscopy. Water
Science and Technology 47(5):105-116.
26. Klein, P D, Graham, D Y, Gaillour, A, Opekun, A R, and Smith, E O. 1991. Water source as
risk factor for Helicobacter pylori infection in Peruvian children. Lancet 337(8756):1503-1506.
27. LeChevallier, M W, Cawthon, C D, and Lee, R G. 1988. Factors promoting survival of
bacteria in chlorinated water supplies. Applied and Environmental Microbiology 54(3):649-654.
28. Lehtola, M J, Torvinen, E, Miettinen, L T, and Keevil, C W. 2006. Fluorescence in situ
hybridization using peptide nucleic acid probes for rapid detection of Mycobacterium avium
subsp avium and Mycobacterium avium subsp paratuberculosis in potable water biofilms.
Applied and Environmental Microbiology 72(1):848-853.

Survival of drinking water pathogens after disinfection
158
29. Mackay, W G, Gribbon, L T, Barer, M R, and Reid, D C. 1998. Biofilms in drinking water
systems - A possible reservoir for Helicobacter pylori. Water Science and Technology
38(12):181-185.
30. McDade, J E, Shepard, C C, Fraser, D W, Tsai, T R, Redus, M A, and Dowdle, W R. 1977.
Legionnaires' disease - isolation of a bacterium and demonstration of its role in other
respiratory disease. New England Journal of Medicine 297(22):1197-1203.
31. Mouery, K, Rader, B A, Gaynor, E C, and Guillemin, K. 2006. The stringent response is
required for Helicobacter pylori survival of stationary phase, exposure to acid, and aerobic
shock. Journal of Bacteriology 188(15):5494-5500.
32. Murga, R, Forster, T S, Brown, E, Pruckler, J M, Fields, B S, and Donlan, R M. 2001. Role
of biofilms in the survival of Legionella pneumophila in a model potable water system.
Microbiology 147(3121-3126.
33. Nilsson, H-O, Blom, J, Al-Soud, W A, Ljungh, A, Andersen, L P, and Wadstrom, T. 2002.
Effect of cold starvation, acid stress, and nutrients on metabolic activity of Helicobacter pylori.
Applied and Environmental Microbiology 68(1):11-19.
34. Park, S R, Mackay, W G, and Reid, D C. 2001. Helicobacter sp recovered from drinking
water biofilm sampled from a water distribution system. Water Research 35(6):1624-1626.
35. Pasculle, W. 2000. Update on Legionella. Clinical Microbiology Newsletter 22(13):97-101.
36. Queralt, N, Bartolome, R, and Araujo, R. 2005. Detection of Helicobacter pylori DNA in
human faeces and water with different levels of faecal pollution in the north-east of Spain.
Journal of Applied Microbiology 98(4):889-895.
37. Rao, D, Webb, J S, and Kjelleberg, S. 2005. Competitive interactions in mixed-species
biofilms containing the marine bacterium Pseudoalteromonas tunicata. Applied and
Environmental Microbiology 71(4):1729-1736.
38. Rickard, A H, Leach, S A, Hall, L S, Buswell, C M, High, N J, and Handley, P S. 2002.
Phylogenetic relationships and coaggregation ability of freshwater biofilm bacteria. Applied
and Environmental Microbiology 68(7):3644-3650.
39. Rickard, A H, McBain, A J, Ledder, R G, Handley, P S, and Gilbert, P. 2003.
Coaggregation between freshwater bacteria within biofilm and planktonic communities. Fems
Microbiology Letters 220(1):133-140.
40. Steinert, M, Hentschel, U, and Hacker, J. 2002. Legionella pneumophila: an aquatic microbe
goes astray. FEMS Microbiology Reviews 26(2):149-162.
41. Surman, S B, Morton, L H G, and Keevil, C W. 1994. The dependence of Legionella
pneumophila on other aquatic bacteria for survival on R2A medium. International
Biodeterioration and Biodegradation 13( 223-236.
42. Szewzyk, U, Szewzyk, R, Manz, W, and Schleifer, K H. 2000. Microbiological safety of
drinking water. Annual Review of Microbiology 54(81-127.
43. Tait, K, and Sutherland, I W. 2002. Antagonistic interactions amongst bacteriocin producing
enteric bacteria in dual species biofilms. Journal of Applied Microbiology 93(2):345-352.
44. Temmerman, R, Vervaeren, H, Noseda, B, Boon, N, and Verstraete, W. 2006. Necrotrophic
growth of Legionella pneumophila. Applied and Environmental Microbiology 72(6):4323-4328.

Co-culture of L. pneumophila and H. pylori with water bacteria
159
45. Toze, S, Sly, L I, MacRae, I C, and Fuerst, J A. 1990. Inhibition of growth of Legionella
species by heterotrophic plate count bacteria isolated from chlorinated drinking water. Current
Microbiology 21(2):139-143.
46. Voytek, M A, Ashen, J B, Fogarty, L R, Kirshtein, J D, and Landa, E R. 2005. Detection of
Helicobacter pylori and fecal indicator bacteria in five North American rivers. Journal of Water
and Health 3(4):405-422.
47. Wadowsky, R M, Wolford, R, McNamara, A M, and Yee, R B. 1985. Effect of temperature,
pH, and oxygen level on the multiplication of naturally occurring Legionella pneumophila in
potable water. Applied and Environmental Microbiology 49(5):1197-1205.
48. Wadowsky, R M, and Yee, R B. 1983. Satellite growth of Legionella pneumophila with an
environmental isolate of Flavobacterium breve. Applied and Environmental Microbiology
46(6):1447-1449.
49. Watnick, P, and Kolter, R. 2000. Biofilm, city of microbes. Journal of Bacteriology
182(10):2675-2679.
50. West, A P, Millar, M R, and Tompkins, D S. 1992. Effect of physical environment on survival
of Helicobacter pylori. Journal of Clinical Pathology 45(3):228-231.
51. Wilks, S A, and Keevil, C W. 2006. Targeting species-specific low-affinity 16S rRNA binding
sites by using peptide nucleic acids for detection of legionellae in biofilms. Applied and
Environmental Microbiology 72(8):5453-5462.
52. Winiecka-Krusnell, J, Wreiber, K, Von Euler, A, Engstrand, L, and Linder, E. 2002. Free-
living amoebae promote growth and survival of Helicobacter pylori. Scandinavian Journal of
Infectious Diseases 34(4):253-256.


Final conclusions and perspectives of work
163
8.1 Final Conclusions
The main objective was to study the influence of chlorine on L. pneumophila and H. pylori and
although certain aspects of this process have been successfully clarified, many new questions have
appeared.
After disinfection, residual chlorine must be provided to the final drinking water to ensure the
microbiological safety of tap water. However it was shown that low concentrations of chlorine are
ineffective in the control of L. pneumophila. It was demonstrated that after chlorination L. pneumophila
can completely lose its cultivability, however cells remain viable and capable of causing infection in
amoeba cells and consequently possibly in humans (Chapter 2). Moreover, drinking water biofilms can
work as a protective niche for L. pneumophila resulting in a very high tolerance to different low
concentrations of chlorine (Chapter 4).
With the H. pylori experiments similar results were obtained (Chapter 6). In the planktonic state, cells
lost cultivability without losing viability and surprisingly initial dead cells disappeared after exposure to
chlorine, indicating that chlorine reacts predominantly with weaker/damaged cells. The experiments
with heterotrophic biofilms also showed that biofilms are a refuge for H. pylori in chlorinated waters
and inside these structures different concentrations of chlorine have no effect on the total numbers of
this pathogen.
In chapters 3 and 5, it was shown that heterotrophic biofilms support the inclusion of L. pneumophila
and H. pylori in biofilms under different physico-chemical conditions. For L. pneumophila, shear stress
and carbon concentration seems to have little effect on the concentration of L. pneumophila existing in
drinking water biofilms, however, lower temperatures seem to favour the inclusion of this pathogen.
Concerning H. pylori, temperature had no effect in terms of H. pylori numbers inside the biofilm.
Differences were obtained at 15ºC for shear stress and carbon addition compared to the control. It is
important to note that although the numbers of H. pylori obtained for both temperatures were similar,
the cells were predominantly spiral shaped at 20ºC and coccoid at 15ºC which indicates that H. pylori
adapts its shape to different environmental conditions as a survival strategy.
The fact that in suspension, cells have lost cultivability without losing viability and in biofilms cultivable
cells were never recovered for the two pathogens tested, strongly supports that cultivable standard
methods are an ineffective measure for controlling water quality and assessing disinfection efficiency
and that alternative methods to detect VBNC, such as FISH or PCR, should be developed.

Survival of drinking water pathogens after disinfection
164
The influence of particular bacteria in biofilm formation and survival of L. pneumophila and H. pylori
was also assessed (Chapter 7). The bacterium M. chelonae seems to have an important role in the
cultivability of both pathogens while other heterotrophic bacteria decreased the cultivability of L.
pneumophila. These results also support the theory that the lack of cultivability in biofilms could be
due to the overgrowth of other heterotrophic bacteria and not only the ability of bacteria to enter a
VBNC state.
.

Final conclusions and perspectives of work
165
8.2 Future Work
This work has highlighted several aspects of chlorination and biofilm protection function. Nevertheless,
three years and half were not sufficient to answer all the questions and hence further investigation is
needed.
The development of alternative methods for the microbiological safety control of drinking water can
rely on the validation of PNA probes to detect specific viable pathogens. The confirmation that PNA
probes only detect viable and not total cells can be attained by the use of several methods
simultaneously, such as LIVE/DEAD, direct viable count and infectivity of animal models. In the later
case, for the particular pathogens studied in this work, amoeba species might prove to be a good and
easier alternative to animal models.
The deleterious effects of low concentrations of chlorine on L. pneumophila and H. pylori cells is not
well understood. It was attempted during this work to analyse the protein expression of both
pathogens after exposure to chlorine. The method used was iTRAQ and proteins would be detected
by Mass Spectrometry. This work is ongoing and will be very valuable as the comparison of proteins
expressed before and after exposure to the oxidative stress of chorine can help to understand the
disinfection action of chlorine and adopt better strategies to control these two pathogens.
The experiments of dual-species biofilms might also be expanded, by using other bacteria isolated
from drinking water to understand the role of different microorganisms in the behaviour of L.
pneumophila and H. pylori.
Finally, after validating PNA probes to detect viable cells, field studies can be performed to detect H.
pylori in water and definitely prove that water can be a route of transmission of this pathogen, as only
epidemiological studies have so far correlated water and incidence of these pathogens. And… did not
John Snow suspect about cholera be a waterborne disease based on epidemiological studies? And
was he not proved to be right?


Appendix I
Scientific Outputs


Scientific Outputs
169
I.1 Accepted and Submitted papers in peer reviewed international journals
Gião, M S, Azevedo, N F, Wilks, S A, Vieira, M J and Keevil, C W. “Detection of Helicobacter pylori in
drinking water biofilms by fluorescence in situ hybridization” (doi:10.1128/AEM.00827-08).
Gião, M S, Wilks, S A, Azevedo, N F, Vieira, M J and Keevil, C W. “Validation of LIVE/DEAD® to
detect viable but non-cultivable Legionella pneumophila” (submitted).
Gião, M S, Wilks, S A, Azevedo, N F, Vieira, M J and Keevil, C W. “Incorporation of natural
uncultivable Legionella pneumophila into potable water biofilms provides a protective niche
against chlorination stress” (submitted).
Gião, M S, Wilks, S A, Azevedo, N F, Vieira, M J and Keevil, C W. “Comparison between standard
culture and fluorescence in situ hybridization methods to study the influence of physico-
chemical parameters on Legionella pneumophila survival in drinking water biofilms”
(submitted).
Gião, M S, Azevedo, N F, Wilks, S A, Vieira, M J and Keevil, C W. “Resistance of Helicobacter pylori
to chlorine in drinking water biofilms” (in preparation).
Gião, M S, Azevedo, N F, Wilks, S A, Vieira, M J and Keevil, C W. “Interaction of Legionella
pneumophila and Helicobacter pylori with bacterial species isolated from drinking water
biofilms” (in preparation).

Survival of drinking water pathogens after disinfection
170
I.2 Oral presentations in international conferences and meetings
Azevedo N F, Gião M S, Almeida C, Fernandes I, Keevil C W and Vieira, M J. (September 2007).
“Relevance of heterotrophic biofilms on the agglomeration of H. pylori in water
environments: implications for transmission”. XX International Workshop on Helicobacter
and related bacteria in chronic digestive inflammation, Istanbul, Turkey, 20th to 22nd
September 2007.
Gião, M S, Azevedo, N F, Wilks, S A, Vieira, M J and Keevil, C W. “Influence of carbon concentration,
shear stress and temperature on survival of Legionella pneumophila in drinking water
biofilms”. 4th ASM Conference on Biofilms, Québec City, Canada, 25th to 29th March 2007.
Gião, M S, Azevedo, N F, Wilks, S A, Vieira, M J and Keevil, C W. “Assessment of viable but non
cultivable cells of Helicobacter pylori after chlorination”. Sixth progress meeting SAFER,
Universidade do Minho, Braga, Portugal, 7th and 8th April 2006.
Gião, M S, Azevedo, N F, Wilks, S A, Vieira, M J and Keevil, C W. “Influence of carbon concentration
and shear stress on survival of Legionella pneumophila in drinking water biofilms”. Sixth
progress meeting SAFER, Universidade do Minho, Braga, Portugal, 7th and 8th April 2006.
Gião, M S, Azevedo, N F, Wilks, S A, Vieira, M J and Keevil, C W. “Assessment of Viable but non-
cultivable cells of Legionella pneumophila after disinfection”. Fifth progress meeting SAFER,
Riga Technical University, Riga, Latvia, 6th and 7th October 2005.

Scientific Outputs
171
I.3 Poster presentations in international conferences
Gião, M S, Azevedo, N F, Wilks, S A, Vieira, M J and Keevil, C W. “Resistance of Legionella
pneumophila and Helicobacter pylori to chlorination in drinking water biofilms”. 12th
International Symposium on Microbial Ecology (ISME – 12), Cairns, Australia, 17th to 22nd
August 2008.
Gião, M S, Azevedo, N F, Wilks, S A, Vieira, M J and Keevil, C W. “Influence of physico-chemical
parameters on the survival of Helicobacter pylori in drinking water biofilms”. 14th
International Workshop on Campylobacter, Helicobacter and Related Organisms (CHRO),
Rotterdam, The Netherlands, 2nd to 5th September 2007.
Wilks, S A, Gião, M S, Vieira, M J and Keevil, C W “Legionella pneumophila is an abundant and
chlorine tolerant autochthonous member of potable water biofilms”. 107th ASM General
Meeting American Society for Microbiology (ASM), Toronto, Canada, 21st to 25th May 2007.
Gião, M S, Azevedo, N F, Wilks, S A, Vieira, M J and Keevil, C W. “Survival of Legionella
pneumophila and Helicobacter pylori in drinking water after chlorination”. 11th International
Symposium on Microbial Ecology (ISME – 11), Vienna, Austria, 20th to 25th August 2006.
Gião, M S, Azevedo, N F, Wilks, S A, Vieira, M J and Keevil, C W. “Survival of VBNC Legionella
pneumophila in drinking water following chlorine disinfection”. 2nd Congress of European
Microbiologists – FEMS 2006, Madrid, Spain, 4th to 8th July 2006.
Gião, M S, Azevedo, N F, Wilks, S A, Vieira, M J and Keevil, C W. “Assessment of Viable but non-
cultivable cells of Legionella pneumophila after disinfection”. WaterMicro 05, University of
Wales, Swansea, UK, 4th to 9th September 2005.


