Survey of Businesses’ Inflation Expectations
FEBRUARY 2015
RESEARCH SERVICES DEPARTMENT RESEARCH AND ECONOMIC PROGRAMMING DIVISION
Inflation Expectations Survey
Prepared by the Research Services Department Page 1 February 2015 Survey
The Statistical Institute of Jamaica (STATIN) undertakes surveys of businesses on behalf of the
Bank of Jamaica to ascertain the expectations of these economic agents about variables which are
likely to have an impact on inflation in the near-term. In this regard, the survey captures the
perception of Chief Executive Officers, Managing Directors and Financial Controllers about the
future movement of prices, current and future business conditions and the expected rate of increase
in wages/salaries. These responses assist the Central Bank in charting future policy decisions. The most recent
survey was conducted in February 2015 and had 302 respondents. Below are highlights from that survey.
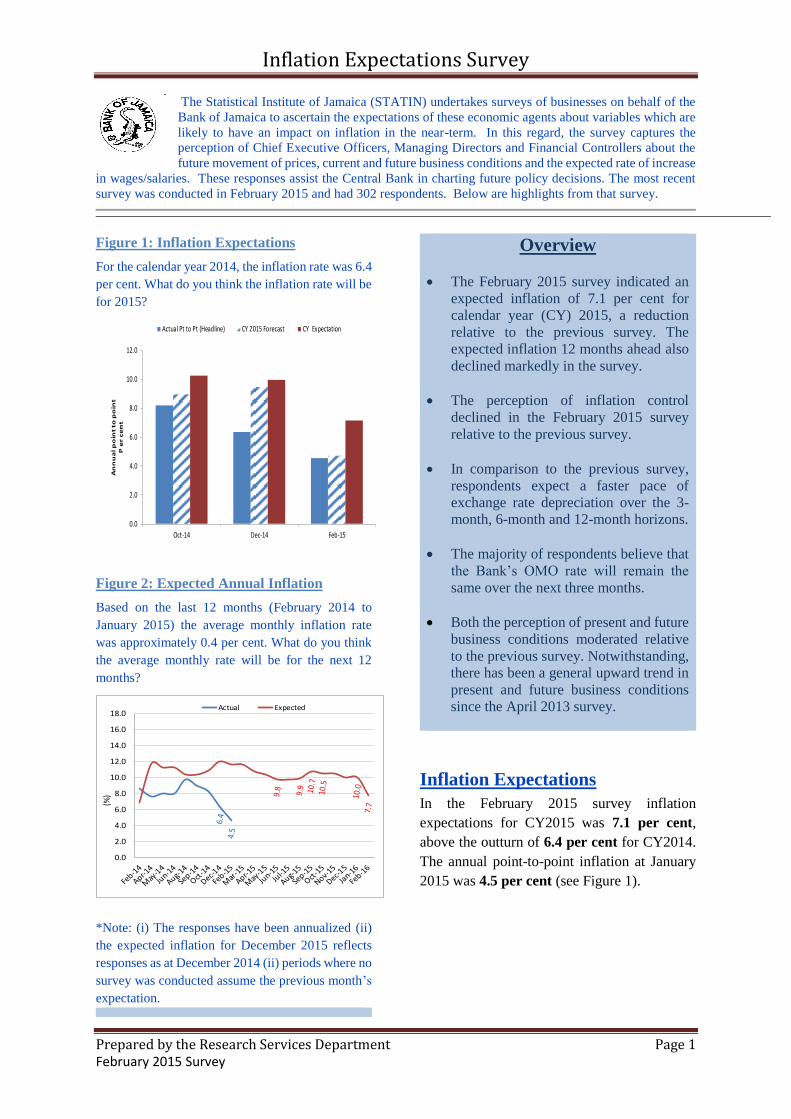
Figure 1: Inflation Expectations
For the calendar year 2014, the inflation rate was 6.4
per cent. What do you think the inflation rate will be
for 2015?
0.0
2.0
4.0
6.0
8.0
10.0
12.0
Oct-14 Dec-14 Feb-15
An
nu
al p
oin
t to
po
int
P e
r ce
nt
Actual Pt to Pt (Headline) CY 2015 Forecast CY Expectation
Figure 2: Expected Annual Inflation
Based on the last 12 months (February 2014 to
January 2015) the average monthly inflation rate
was approximately 0.4 per cent. What do you think
the average monthly rate will be for the next 12
months?
0.0
2.0
4.0
6.0
8.0
10.0
12.0
14.0
16.0
18.0
(%)
Actual Expected
*Note: (i) The responses have been annualized (ii)
the expected inflation for December 2015 reflects
responses as at December 2014 (ii) periods where no
survey was conducted assume the previous month’s
expectation.
Overview
The February 2015 survey indicated an
expected inflation of 7.1 per cent for
calendar year (CY) 2015, a reduction
relative to the previous survey. The
expected inflation 12 months ahead also
declined markedly in the survey.
The perception of inflation control
declined in the February 2015 survey
relative to the previous survey.
In comparison to the previous survey,
respondents expect a faster pace of
exchange rate depreciation over the 3-
month, 6-month and 12-month horizons.
The majority of respondents believe that
the Bank’s OMO rate will remain the
same over the next three months.
Both the perception of present and future
business conditions moderated relative
to the previous survey. Notwithstanding,
there has been a general upward trend in
present and future business conditions
since the April 2013 survey.
Inflation Expectations
In the February 2015 survey inflation
expectations for CY2015 was 7.1 per cent,
above the outturn of 6.4 per cent for CY2014.
The annual point-to-point inflation at January
2015 was 4.5 per cent (see Figure 1).
Inflation Expectations Survey
Prepared by the Research Services Department Page 2 February 2015 Survey
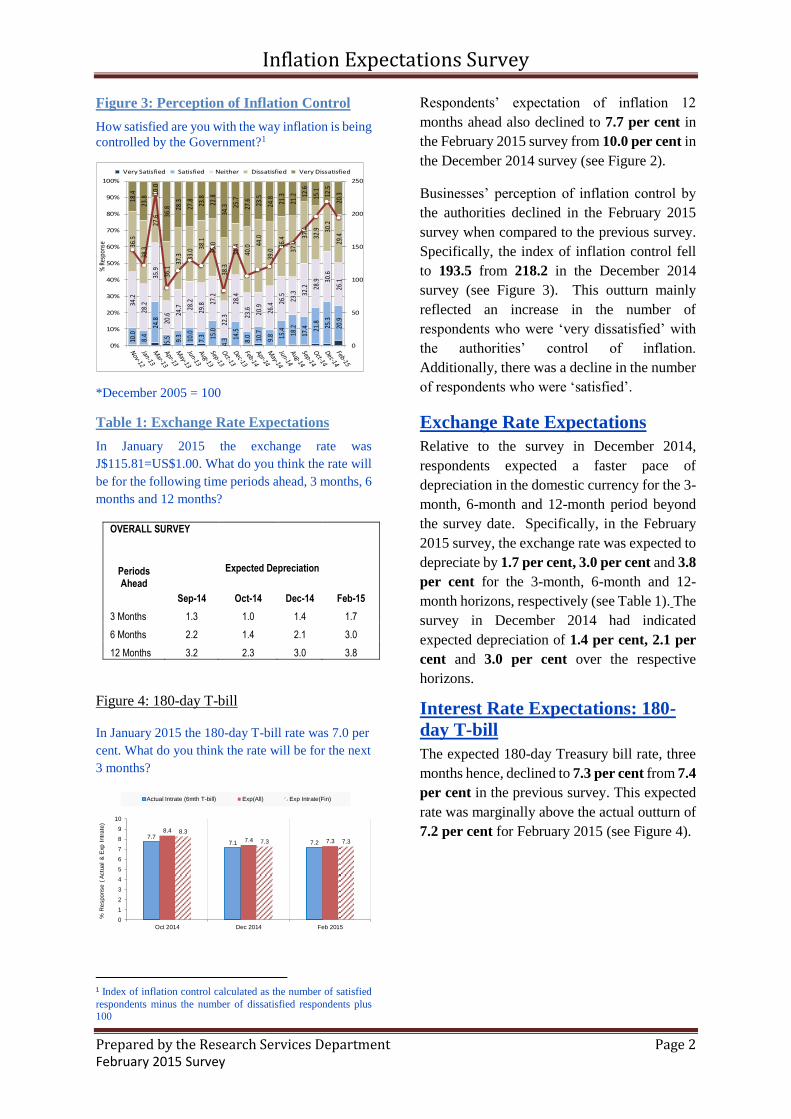
Figure 3: Perception of Inflation Control
How satisfied are you with the way inflation is being
controlled by the Government?1 10
.0
8.4
24.8
5.5 9.3
10.0
7.3 15
.0
4.3 14
.5
8.0 10
.7
9.8 15
.4 18.2
17.4 21
.8 25.3
20.9
34.2
28.2
35.9
20.6 24
.7 28.2
29.8 27
.2
22.3
28.4
23.6 20
.9
26.4 26
.5
23.3 32
.2 28.9 30
.6
26.1
36.5
38.3
27.6
36.1
37.3 33
.0
38.1
35.0
38.3
31.4
40.0 44
.0
39.0
36.4
37.0
37.4
32.9 30
.2
29.4
18.4
23.8
10.0
36.8 28
.3
27.8 23
.8
22.8
34.3 25
.7
27.6 23
.5
24.8 21
.3
21.2 12
.6
15.1
12.5
20.3
0
50
100
150
200
250
0%
10%
20%
30%
40%
50%
60%
70%
80%
90%
100%
% R
espo
nse
Very Satisfied Satisfied Neither Dissatisfied Very Dissatisfied
.
*December 2005 = 100
Table 1: Exchange Rate Expectations
In January 2015 the exchange rate was
J$115.81=US$1.00. What do you think the rate will
be for the following time periods ahead, 3 months, 6
months and 12 months?
OVERALL SURVEY
Periods Ahead
Expected Depreciation
Sep-14 Oct-14 Dec-14 Feb-15
3 Months 1.3 1.0 1.4 1.7
6 Months 2.2 1.4 2.1 3.0
12 Months 3.2 2.3 3.0 3.8
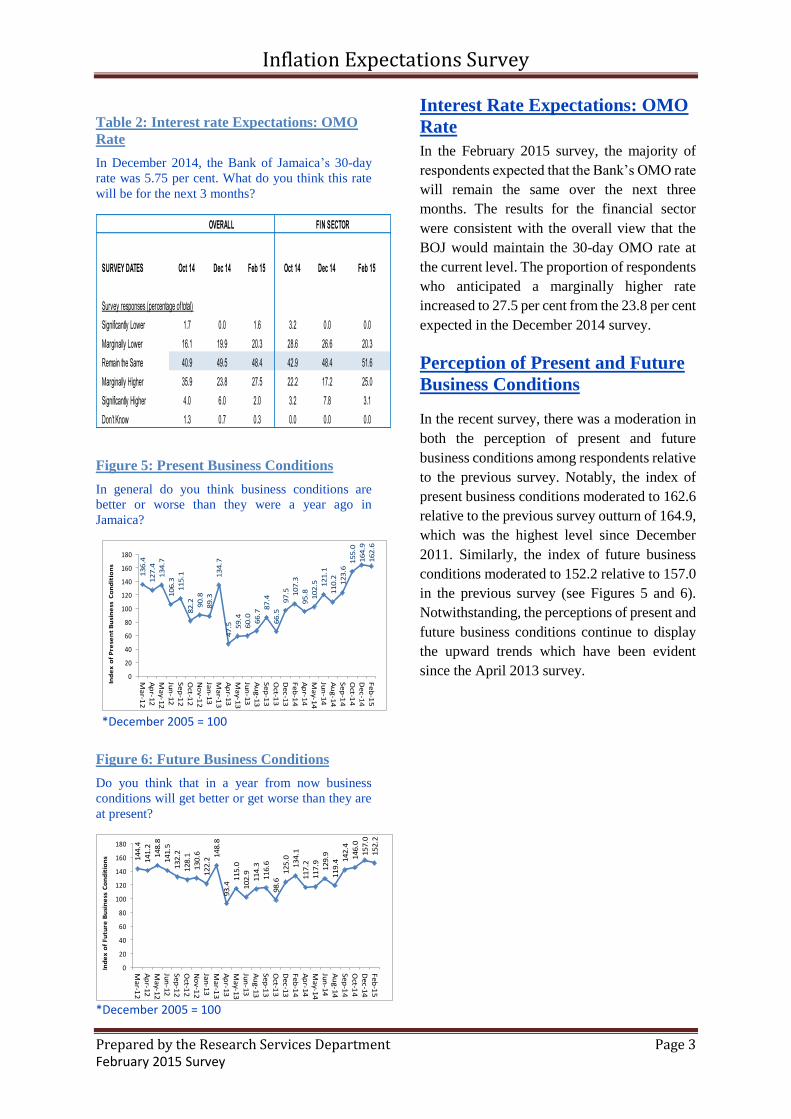
Figure 4: 180-day T-bill
In January 2015 the 180-day T-bill rate was 7.0 per
cent. What do you think the rate will be for the next
3 months?
7.77.1 7.2
8.4
7.4 7.3
8.3
7.3 7.3
0
1
2
3
4
5
6
7
8
9
10
Oct 2014 Dec 2014 Feb 2015
% R
espo
nse
( A
ctu
al
& E
xp I
ntr
ate
)
Actual Intrate (6mth T-bill) Exp(All) Exp Intrate(Fin)
1 Index of inflation control calculated as the number of satisfied
respondents minus the number of dissatisfied respondents plus 100
Respondents’ expectation of inflation 12
months ahead also declined to 7.7 per cent in
the February 2015 survey from 10.0 per cent in
the December 2014 survey (see Figure 2).
Businesses’ perception of inflation control by
the authorities declined in the February 2015
survey when compared to the previous survey.
Specifically, the index of inflation control fell
to 193.5 from 218.2 in the December 2014
survey (see Figure 3). This outturn mainly
reflected an increase in the number of
respondents who were ‘very dissatisfied’ with
the authorities’ control of inflation.
Additionally, there was a decline in the number
of respondents who were ‘satisfied’.
Exchange Rate Expectations
Relative to the survey in December 2014,
respondents expected a faster pace of
depreciation in the domestic currency for the 3-
month, 6-month and 12-month period beyond
the survey date. Specifically, in the February
2015 survey, the exchange rate was expected to
depreciate by 1.7 per cent, 3.0 per cent and 3.8
per cent for the 3-month, 6-month and 12-
month horizons, respectively (see Table 1). The
survey in December 2014 had indicated
expected depreciation of 1.4 per cent, 2.1 per
cent and 3.0 per cent over the respective
horizons.
Interest Rate Expectations: 180-
day T-bill
The expected 180-day Treasury bill rate, three
months hence, declined to 7.3 per cent from 7.4
per cent in the previous survey. This expected
rate was marginally above the actual outturn of
7.2 per cent for February 2015 (see Figure 4).
Inflation Expectations Survey
Prepared by the Research Services Department Page 3 February 2015 Survey
Table 2: Interest rate Expectations: OMO
Rate
In December 2014, the Bank of Jamaica’s 30-day
rate was 5.75 per cent. What do you think this rate
will be for the next 3 months?
SURVEY DATES Oct 14 Dec 14 Feb 15 Oct 14 Dec 14 Feb 15
Survey responses (percentage of total)
Significantly Lower 1.7 0.0 1.6 3.2 0.0 0.0
Marginally Lower 16.1 19.9 20.3 28.6 26.6 20.3
Remain the Same 40.9 49.5 48.4 42.9 48.4 51.6
Marginally Higher 35.9 23.8 27.5 22.2 17.2 25.0
Significantly Higher 4.0 6.0 2.0 3.2 7.8 3.1
Don’t Know 1.3 0.7 0.3 0.0 0.0 0.0
OVERALL FIN SECTOR
Figure 5: Present Business Conditions
In general do you think business conditions are
better or worse than they were a year ago in
Jamaica?
13
6.4
12
7.4
13
4.7
10
6.3
11
5.1
82
.2 90
.8
89
.3
13
4.7
47
.5 59
.4
60
.0 66
.7
87
.4
66
.5
97
.5 10
7.3
95
.8 10
2.5 1
21
.1
11
0.2 12
3.6
15
5.0
16
4.9
16
2.6
0
20
40
60
80
100
120
140
160
180
Ma
r-12
Ap
r-12
Ma
y-12
Jun
-12
Se
p-1
2
Oct-1
2
No
v-1
2
Jan
-13
Ma
r-13
Ap
r-13
Ma
y-13
Jun
-13
Au
g-1
3
Se
p-1
3
Oct-1
3
De
c-1
3
Fe
b-1
4
Ap
r-14
Ma
y-14
Jun
-14
Au
g-1
4
Se
p-1
4
Oct-1
4
De
c-1
4
Fe
b-1
5
Ind
ex
of
Pre
sen
t B
usi
ne
ss C
on
dit
ion
s
*December 2005 = 100
Figure 6: Future Business Conditions
Do you think that in a year from now business
conditions will get better or get worse than they are
at present?
14
4.4
14
1.2
14
8.8
14
1.5
13
2.2
12
8.1
13
0.6
12
2.2
14
8.8
93
.4
11
5.0
10
2.9
11
4.3
11
6.6
98
.6
12
5.0
13
4.1
11
7.2
11
7.9 12
9.9
11
9.4 1
42
.4
14
6.0
15
7.0
15
2.2
0
20
40
60
80
100
120
140
160
180
Ma
r-12
Ap
r-12
Ma
y-12
Jun
-12
Se
p-1
2
Oct-1
2
No
v-1
2
Jan
-13
Ma
r-13
Ap
r-13
Ma
y-13
Jun
-13
Au
g-1
3
Se
p-1
3
Oct-1
3
De
c-1
3
Fe
b-1
4
Ap
r-14
Ma
y-14
Jun
-14
Au
g-1
4
Se
p-1
4O
ct-14
De
c-1
4
Fe
b-1
5
Ind
ex
of
Fu
ture
Bu
sin
ess
Co
nd
itio
ns
*December 2005 = 100
Interest Rate Expectations: OMO
Rate
In the February 2015 survey, the majority of
respondents expected that the Bank’s OMO rate
will remain the same over the next three
months. The results for the financial sector
were consistent with the overall view that the
BOJ would maintain the 30-day OMO rate at
the current level. The proportion of respondents
who anticipated a marginally higher rate
increased to 27.5 per cent from the 23.8 per cent
expected in the December 2014 survey.
Perception of Present and Future
Business Conditions
In the recent survey, there was a moderation in
both the perception of present and future
business conditions among respondents relative
to the previous survey. Notably, the index of
present business conditions moderated to 162.6
relative to the previous survey outturn of 164.9,
which was the highest level since December
2011. Similarly, the index of future business
conditions moderated to 152.2 relative to 157.0
in the previous survey (see Figures 5 and 6).
Notwithstanding, the perceptions of present and
future business conditions continue to display
the upward trends which have been evident
since the April 2013 survey.
Inflation Expectations Survey
Prepared by the Research Services Department Page 4 February 2015 Survey
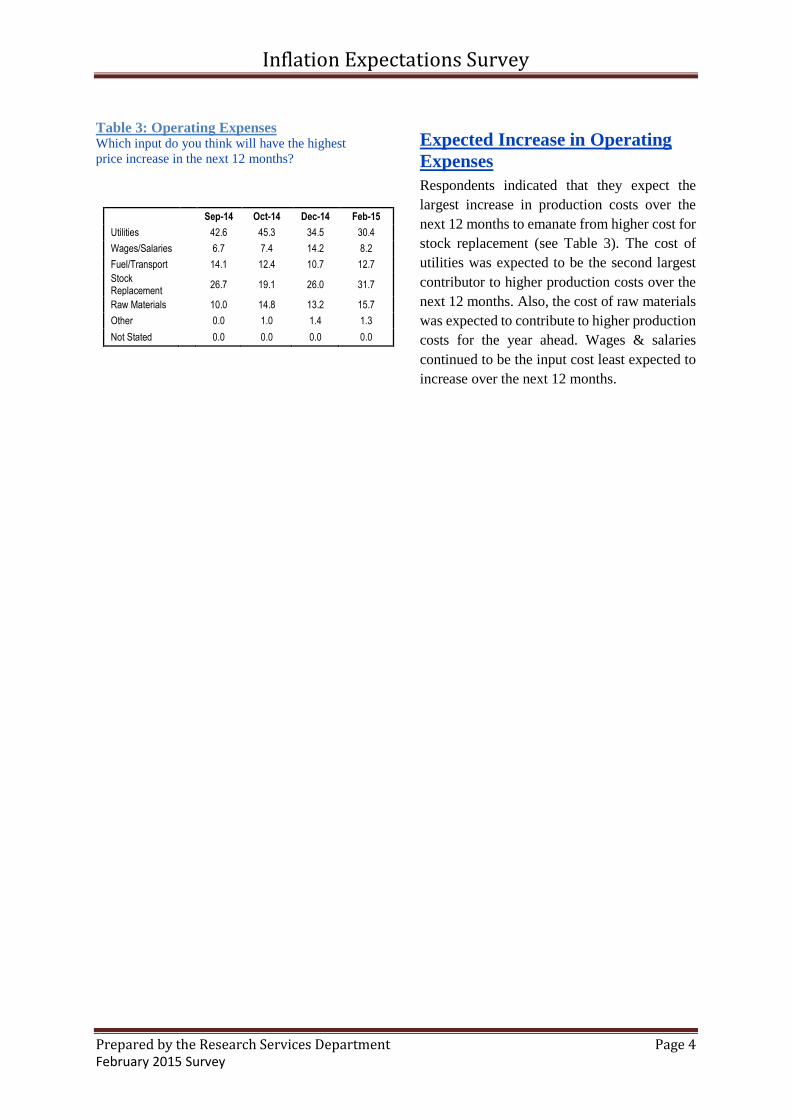
Table 3: Operating Expenses Which input do you think will have the highest
price increase in the next 12 months?
Sep-14 Oct-14 Dec-14 Feb-15
Utilities 42.6 45.3 34.5 30.4
Wages/Salaries 6.7 7.4 14.2 8.2
Fuel/Transport 14.1 12.4 10.7 12.7
Stock Replacement
26.7 19.1 26.0 31.7
Raw Materials 10.0 14.8 13.2 15.7
Other 0.0 1.0 1.4 1.3
Not Stated 0.0 0.0 0.0 0.0
Expected Increase in Operating
Expenses
Respondents indicated that they expect the
largest increase in production costs over the
next 12 months to emanate from higher cost for
stock replacement (see Table 3). The cost of
utilities was expected to be the second largest
contributor to higher production costs over the
next 12 months. Also, the cost of raw materials
was expected to contribute to higher production
costs for the year ahead. Wages & salaries
continued to be the input cost least expected to
increase over the next 12 months.


