Suprajit Engineering LtdCabled for growth on a well lit road
Analyst: Prayesh Jain
Ashini Shah
Stock Data
Sensex: 24,623
52 Week h/l (Rs): 152 / 111
Market cap (Rscr) : 1,738
6m Avg t/o (Rscr): 1
Bloomberg code: SEL IS
BSE code: 532509
NSE code: SUPRAJIT
FV (Rs): 1
Div yield (%): 0.7
Prices as on Mar 11, 2016
Company Rating Grid
Low High
1 2 3 4 5
Earnings Growth
Cash Flow
B/S Strength
Valuation appeal
Risk
Shareholding Pattern
Jun‐15 Sep‐15 Dec‐15
Promoters 51.8 51.8 51.8
FII+DII 6.5 7.1 7.6
Others 41.7 41.0 40.6
Share Price Trend
40
60
80
100
120
Mar‐15 Jul‐15 Nov‐15 Mar‐16
SUPRAJIT Sensex
Suprajit Engineering Ltd Cabled for growth on a well lit road
BUY Sector: Auto Component Sector View: Positive
CMP: Rs133 1‐yr Target: Rs180 Upside: 35.8%
This report is published by IIFL ‘India Private Clients’ research desk. IIFL has other business units with independent research teams separated by 'Chinese walls' catering to different sets of customers having varying objectives, risk profiles, investment horizon, etc. The views and opinions expressed in this document may at times be contrary in terms of rating, target prices,
estimates and views on sectors and markets… (Read the complete disclaimer at the back of this report)
Company Report
March 14, 2016
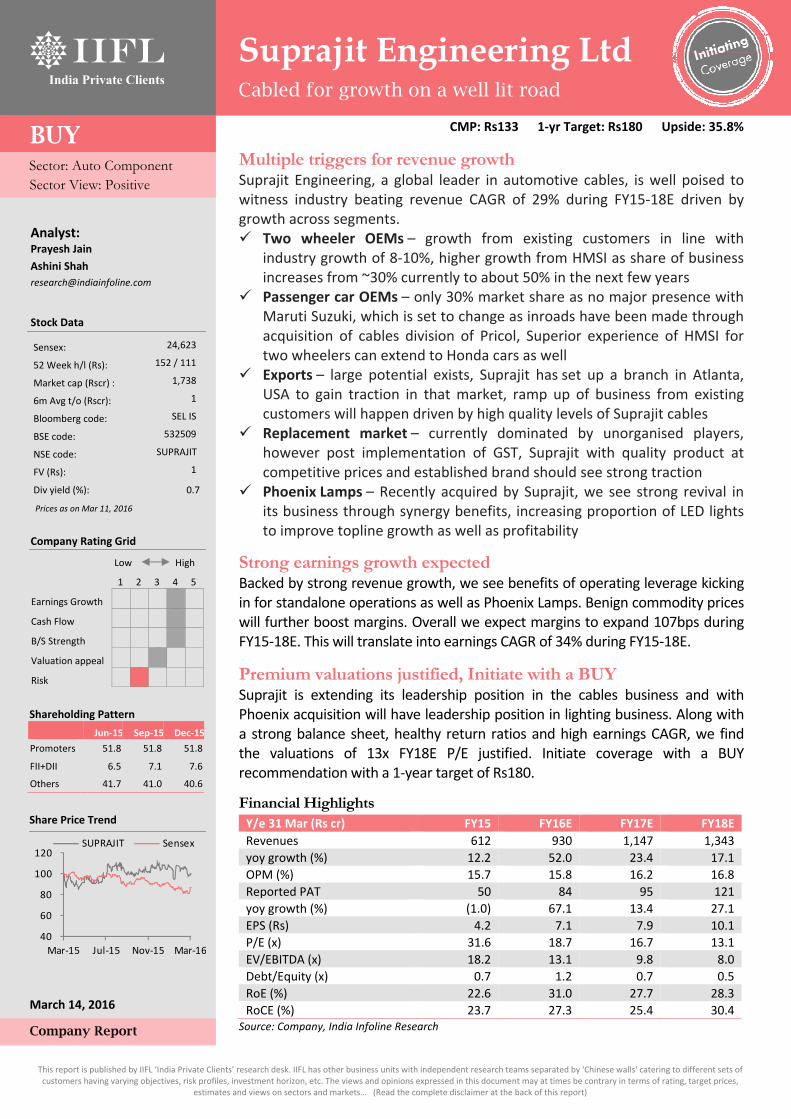
Multiple triggers for revenue growth Suprajit Engineering, a global leader in automotive cables, is well poised to witness industry beating revenue CAGR of 29% during FY15‐18E driven by growth across segments. Two wheeler OEMs – growth from existing customers in line with
industry growth of 8‐10%, higher growth from HMSI as share of business increases from ~30% currently to about 50% in the next few years
Passenger car OEMs – only 30% market share as no major presence with Maruti Suzuki, which is set to change as inroads have been made through acquisition of cables division of Pricol, Superior experience of HMSI for two wheelers can extend to Honda cars as well
Exports – large potential exists, Suprajit has set up a branch in Atlanta, USA to gain traction in that market, ramp up of business from existing customers will happen driven by high quality levels of Suprajit cables
Replacement market – currently dominated by unorganised players, however post implementation of GST, Suprajit with quality product at competitive prices and established brand should see strong traction
Phoenix Lamps – Recently acquired by Suprajit, we see strong revival in its business through synergy benefits, increasing proportion of LED lights to improve topline growth as well as profitability
Strong earnings growth expected Backed by strong revenue growth, we see benefits of operating leverage kicking in for standalone operations as well as Phoenix Lamps. Benign commodity prices will further boost margins. Overall we expect margins to expand 107bps during FY15‐18E. This will translate into earnings CAGR of 34% during FY15‐18E. Premium valuations justified, Initiate with a BUY Suprajit is extending its leadership position in the cables business and with Phoenix acquisition will have leadership position in lighting business. Along with a strong balance sheet, healthy return ratios and high earnings CAGR, we find the valuations of 13x FY18E P/E justified. Initiate coverage with a BUY recommendation with a 1‐year target of Rs180.
Financial Highlights Y/e 31 Mar (Rs cr) FY15 FY16E FY17E FY18E
Revenues 612 930 1,147 1,343
yoy growth (%) 12.2 52.0 23.4 17.1
OPM (%) 15.7 15.8 16.2 16.8
Reported PAT 50 84 95 121
yoy growth (%) (1.0) 67.1 13.4 27.1
EPS (Rs) 4.2 7.1 7.9 10.1
P/E (x) 31.6 18.7 16.7 13.1
EV/EBITDA (x) 18.2 13.1 9.8 8.0
Debt/Equity (x) 0.7 1.2 0.7 0.5
RoE (%) 22.6 31.0 27.7 28.3
RoCE (%) 23.7 27.3 25.4 30.4 Source: Company, India Infoline Research
Page 2 of 21
Suprajit Engineering Ltd
Domestic OEMs currently contribute ~85% of the revenues. We see this share declining but in absolute terms the growth should be higher than the industry volume growth
An expected normal monsoon and implementation of VII pay commission can trigger revival in two wheeler demand
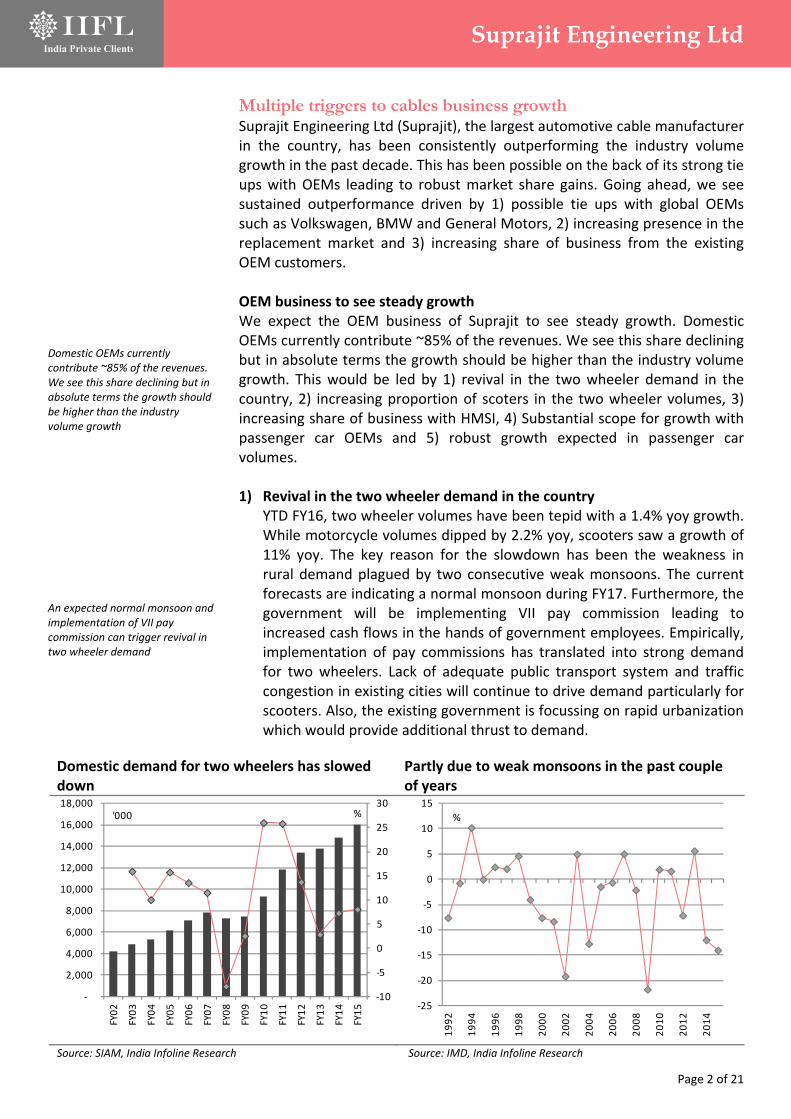
Multiple triggers to cables business growth Suprajit Engineering Ltd (Suprajit), the largest automotive cable manufacturer in the country, has been consistently outperforming the industry volume growth in the past decade. This has been possible on the back of its strong tie ups with OEMs leading to robust market share gains. Going ahead, we see sustained outperformance driven by 1) possible tie ups with global OEMs such as Volkswagen, BMW and General Motors, 2) increasing presence in the replacement market and 3) increasing share of business from the existing OEM customers. OEM business to see steady growth We expect the OEM business of Suprajit to see steady growth. Domestic OEMs currently contribute ~85% of the revenues. We see this share declining but in absolute terms the growth should be higher than the industry volume growth. This would be led by 1) revival in the two wheeler demand in the country, 2) increasing proportion of scoters in the two wheeler volumes, 3) increasing share of business with HMSI, 4) Substantial scope for growth with passenger car OEMs and 5) robust growth expected in passenger car volumes. 1) Revival in the two wheeler demand in the country
YTD FY16, two wheeler volumes have been tepid with a 1.4% yoy growth. While motorcycle volumes dipped by 2.2% yoy, scooters saw a growth of 11% yoy. The key reason for the slowdown has been the weakness in rural demand plagued by two consecutive weak monsoons. The current forecasts are indicating a normal monsoon during FY17. Furthermore, the government will be implementing VII pay commission leading to increased cash flows in the hands of government employees. Empirically, implementation of pay commissions has translated into strong demand for two wheelers. Lack of adequate public transport system and traffic congestion in existing cities will continue to drive demand particularly for scooters. Also, the existing government is focussing on rapid urbanization which would provide additional thrust to demand.
Domestic demand for two wheelers has slowed down
Partly due to weak monsoons in the past couple of years
Source: SIAM, India Infoline Research Source: IMD, India Infoline Research
‐10
‐5
0
5
10
15
20
25
30
‐
2,000
4,000
6,000
8,000
10,000
12,000
14,000
16,000
18,000
FY02
FY03
FY04
FY05
FY06
FY07
FY08
FY09
FY10
FY11
FY12
FY13
FY14
FY15
'000 %
‐25
‐20
‐15
‐10
‐5
0
5
10
15
1992
1994
1996
1998
2000
2002
2004
2006
2008
2010
2012
2014
%
Page 3 of 21
Suprajit Engineering Ltd
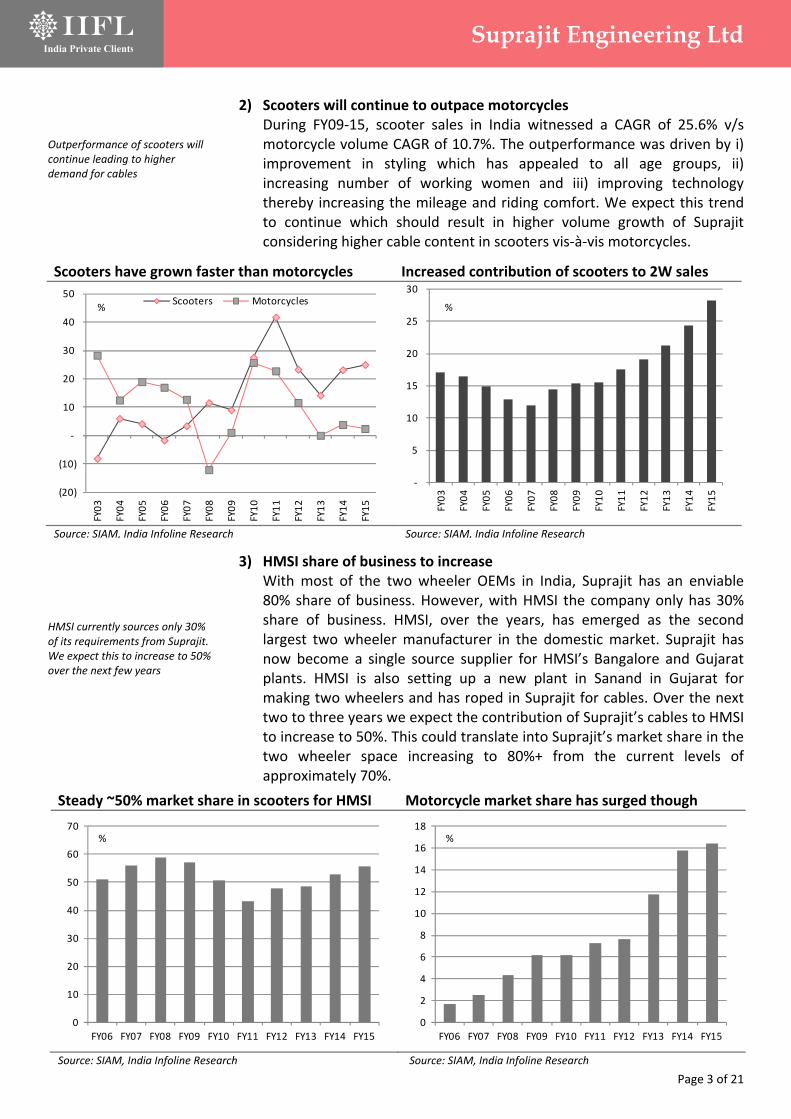
Outperformance of scooters will continue leading to higher demand for cables HMSI currently sources only 30% of its requirements from Suprajit. We expect this to increase to 50% over the next few years
2) Scooters will continue to outpace motorcycles During FY09‐15, scooter sales in India witnessed a CAGR of 25.6% v/s motorcycle volume CAGR of 10.7%. The outperformance was driven by i) improvement in styling which has appealed to all age groups, ii) increasing number of working women and iii) improving technology thereby increasing the mileage and riding comfort. We expect this trend to continue which should result in higher volume growth of Suprajit considering higher cable content in scooters vis‐à‐vis motorcycles.
3) HMSI share of business to increase With most of the two wheeler OEMs in India, Suprajit has an enviable 80% share of business. However, with HMSI the company only has 30% share of business. HMSI, over the years, has emerged as the second largest two wheeler manufacturer in the domestic market. Suprajit has now become a single source supplier for HMSI’s Bangalore and Gujarat plants. HMSI is also setting up a new plant in Sanand in Gujarat for making two wheelers and has roped in Suprajit for cables. Over the next two to three years we expect the contribution of Suprajit’s cables to HMSI to increase to 50%. This could translate into Suprajit’s market share in the two wheeler space increasing to 80%+ from the current levels of approximately 70%.
Scooters have grown faster than motorcycles Increased contribution of scooters to 2W sales
Source: SIAM, India Infoline Research Source: SIAM, India Infoline Research
(20)
(10)
‐
10
20
30
40
50
FY03
FY04
FY05
FY06
FY07
FY08
FY09
FY10
FY11
FY12
FY13
FY14
FY15
Scooters Motorcycles%
‐
5
10
15
20
25
30
FY03
FY04
FY05
FY06
FY07
FY08
FY09
FY10
FY11
FY12
FY13
FY14
FY15
%
Steady ~50% market share in scooters for HMSI Motorcycle market share has surged though
Source: SIAM, India Infoline Research Source: SIAM, India Infoline Research
0
10
20
30
40
50
60
70
FY06 FY07 FY08 FY09 FY10 FY11 FY12 FY13 FY14 FY15
%
0
2
4
6
8
10
12
14
16
18
FY06 FY07 FY08 FY09 FY10 FY11 FY12 FY13 FY14 FY15
%

Page 4 of 21
Suprajit Engineering Ltd
Suprajit has only 25% market share in the passenger car due to limited presence with Maruti. With acquisition of cables division of Pricol we expect this to increase significantly
4) Passenger car OEMs provide a substantial scope for growth
Suprajit has been a relatively late entrant in the passenger car cables segment. It entered the segment through the inorganic route wherein it acquired Shah Concabs in 14 years ago. Since then the company has seen market share gains but the gains have been much slower than the gains seen in the two wheeler space. It has about 25% market share currently and mainly supplies to OEMs such as Ashok Leyland, Tata Motors and M&M. To the largest player in the segment, Maruti, Suprajit supplies through its vendors. In FY15, Suprajit acquired speedo cables division of Pricol which should enable inroads into the business from Maruti and Hyundai. With a superior experience on the two wheelers, we expect Honda to extend the business relationships on the passenger car side as well.
Contribution from the passenger cars has been steady around 30%
Source: Company, India Infoline Research
0%
5%
10%
15%
20%
25%
30%
35%
FY02 FY12 FY13 FY14 FY15 H1 FY16
Estimated impact of increase in sourcing by HMSI FY12 FY13 FY14 FY15 FY16E FY17E FY18E
HMSI
Scooters 1,243,105 1,463,084 1,954,791 2,580,161 2,934,939 3,228,432 3,551,276
Motorcycles 858,496 1,292,340 1,767,765 1,795,000 1,624,288 1,754,231 1,894,569
Total 2,101,601 2,755,424 3,722,556 4,375,161 4,559,226 4,982,663 5,445,845
Cables sourced from SEL 25% 25% 25% 25% 25% 35% 50%
No of cables per scooter 6 6 6 6 6 6 6
No of cables per motorcycle 5 5 5 5 5 5 5
HMSI Scooter cable demand 7,458,630 8,778,504 11,728,746 15,480,966 17,609,631 19,370,595 21,307,654 HMSI Motorcycle cable demand
4,292,480 6,461,700 8,838,825 8,975,000 8,121,440 8,771,155 9,472,847
Total 11,751,110 15,240,204 20,567,571 24,455,966 25,731,071 28,141,749 30,780,501
SEL Sourcing 2,937,778 3,810,051 5,141,893 6,113,992 6,432,768 9,849,612 15,390,251
Change 27.9% 29.7% 35.0% 18.9% 5.2% 53.1% 56.3% Source: SIAM, India Infoline Research

Page 5 of 21
Suprajit Engineering Ltd
Passenger car demand is expected to stay strong driven by lower interest rates, falling fuel prices, improvement in rural sentiment and implementation of VII pay commission
5) Robust growth expectations for domestic passenger car demand Passenger car demand in the country has been strong in the past couple of years. We expect this trend to continue on the back of i) falling fuel prices, ii) lowering of interest rates, iii) expected improvement in the rural economy and iv) implementation of the 7th Pay Commission. Also OEMs have lined up several new launches in the near future to capture the emerging growth opportunity. Exports from the country are also on a rise and are expected to see stronger momentum in the near future. With increasing automation the demand for cables is expected to increase at a faster pace than the demand for cars. Resultantly, we expect strong increase in contribution of passenger car to Suprajit’s revenues.
Two wheeler OEMs largest customers for Suprajit
Customer Rank in 2015 Rank in 2014
Hero Motocorp 1 1
TVS Motors 2 2
Bajaj Auto 3 3
Aftermarket 4 4
M&M 5 8
India Yamaha 6 5
BMW 7 7
Piaggio 8 6
Honda Motors 9 10
GM 10 9
Nissan 11 13
John Deere 12 11
Royal Enfield 13 15
Suzuki 14 12
Volkswagen 15 14
Toyo 16 16
Catton Control 17 17 Source: Company, India Infoline Research
Petrol and diesel prices have been cut with falling crude oil prices
With inflation under control interest rates have been cut by RBI
Source: IOCL, India Infoline Research Source: Bloomberg, India Infoline Research
45
50
55
60
65
70
75
80
15‐Oct‐14
15‐Nov‐14
15‐Dec‐14
15‐Jan
‐15
15‐Feb‐15
15‐M
ar‐15
15‐Apr‐15
15‐M
ay‐15
15‐Jun‐15
15‐Jul‐15
15‐Aug‐15
15‐Sep‐15
15‐Oct‐15
15‐Nov‐15
15‐Dec‐15
15‐Jan
‐16
15‐Feb‐16
Petrol DieselRs/litre
6.0
6.2
6.4
6.6
6.8
7.0
7.2
7.4
7.6
7.8
8.0
8.2
Jan‐13
Apr‐13
Jul‐13
Oct‐13
Jan‐14
Apr‐14
Jul‐14
Oct‐14
Jan‐15
Apr‐15
Jul‐15
Oct‐15
Jan‐16
Page 6 of 21
Suprajit Engineering Ltd
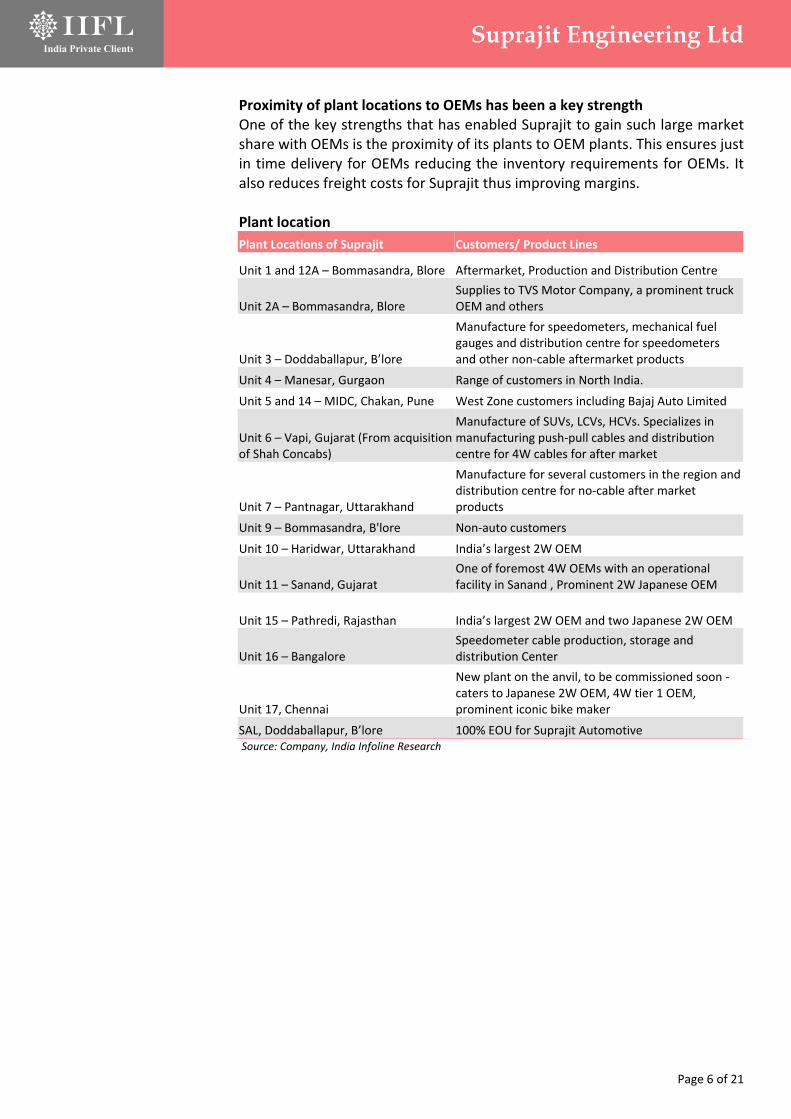
Proximity of plant locations to OEMs has been a key strength One of the key strengths that has enabled Suprajit to gain such large market share with OEMs is the proximity of its plants to OEM plants. This ensures just in time delivery for OEMs reducing the inventory requirements for OEMs. It also reduces freight costs for Suprajit thus improving margins. Plant location
Plant Locations of Suprajit Customers/ Product Lines
Unit 1 and 12A – Bommasandra, Blore Aftermarket, Production and Distribution Centre
Unit 2A – Bommasandra, Blore Supplies to TVS Motor Company, a prominent truck OEM and others
Unit 3 – Doddaballapur, B’lore
Manufacture for speedometers, mechanical fuel gauges and distribution centre for speedometers and other non‐cable aftermarket products
Unit 4 – Manesar, Gurgaon Range of customers in North India.
Unit 5 and 14 – MIDC, Chakan, Pune West Zone customers including Bajaj Auto Limited
Unit 6 – Vapi, Gujarat (From acquisition of Shah Concabs)
Manufacture of SUVs, LCVs, HCVs. Specializes in manufacturing push‐pull cables and distribution centre for 4W cables for after market
Unit 7 – Pantnagar, Uttarakhand
Manufacture for several customers in the region and distribution centre for no‐cable after market products
Unit 9 – Bommasandra, B'lore Non‐auto customers
Unit 10 – Haridwar, Uttarakhand India’s largest 2W OEM
Unit 11 – Sanand, Gujarat One of foremost 4W OEMs with an operational facility in Sanand , Prominent 2W Japanese OEM
Unit 15 – Pathredi, Rajasthan India’s largest 2W OEM and two Japanese 2W OEM
Unit 16 – Bangalore Speedometer cable production, storage and distribution Center
Unit 17, Chennai
New plant on the anvil, to be commissioned soon ‐ caters to Japanese 2W OEM, 4W tier 1 OEM, prominent iconic bike maker
SAL, Doddaballapur, B’lore 100% EOU for Suprajit Automotive Source: Company, India Infoline Research

Page 7 of 21
Suprajit Engineering Ltd
Replacement market is currently dominated by unorganised players Suprajit through its brand and wide dealership network will gain market share Implementation of GST will open up large opportunities as unorganised players will lose advantage
Huge replacement market potential The size of the 2W cable replacement market is in excess of Rs1,000crs pa and Suprajit has a market share of 4‐5%. The segment is dominated by the unorganized players who have 70%+ market share and the remaining is shared by Remsons and Acey Engineering. Suprajit with a view to substantially increase its market share in the replacement segment has set up a separate plant, a marketing team of 25‐30 people across India and robust 300 dealer distributor network dedicated to the replacement segment. The number of dealerships has increased from 50 dealers five years ago. The replacement cycle for two wheelers is about 4 years whereas for passenger cars it is about 6 years. With the strong growth seen in both passenger cars and two wheelers in the past decade, we see a strong replacement demand for cables in the medium term. Suprajit’s products are of superior quality and sold at a ~20% premium compared to local players. The unorganized players are not paying 12% VAT and hence they enjoy tax benefits. Implementation of GST would lead to reduction of benefits associated with tax for unorganized players and help Suprajit gain market share.
Estimated demand for two wheeler cables FY12 FY13 FY14 FY15 FY16E FY17E FY18E
Industry
Scooters 2,654,645 3,014,534 3,696,675 4,698,338 5,233,949 5,757,343 6,333,078
Change 24.9% 13.6% 22.6% 27.1% 11.4% 10.0% 10.0%
Motorcycles 11,939,606 11,933,365 12,462,951 12,975,761 12,677,318 13,437,958 14,512,994
Change 13.7% ‐0.1% 4.4% 4.1% ‐2.3% 6.0% 8.0%
Total 14,594,251 14,947,899 16,159,626 17,674,099 17,911,267 19,195,301 20,846,072
Change 15.6 2.4 8.1 9.4 1.3 7.2 8.6
No of cables per scooter 6.0 6.0 6.0 6.0 6.0 6.0 6.0
No of cables per motorcycle 5.0 5.0 5.0 5.0 5.0 5.0 5.0
OEM Demand for cables
Scooters 15,927,870 18,087,204 22,180,050 28,190,028 31,403,691 34,544,060 37,998,466
Motorcycles 59,698,030 59,666,825 62,314,755 64,878,805 63,386,592 67,189,788 72,564,971
Total 75,625,900 77,754,029 84,494,805 93,068,833 94,790,284 101,733,848 110,563,437
Change 15.9% 2.8% 8.7% 10.1% 1.8% 7.3% 8.7%
Replacement demand
Scooters 6,378,327 7,963,935 9,043,602 11,090,025 14,095,014
Motorcycles 26,250,183 29,849,015 29,833,413 31,157,378 32,439,403
Total 32,628,510 37,812,950 38,877,015 42,247,403 46,534,417
Change 15.9% 2.8% 8.7% 10.1%
Total demand 117,123,315 130,881,783 133,667,298 143,981,251 157,097,854
11.7% 2.1% 7.7% 9.1% Source: SIAM, Company, India Infoline Research
Page 8 of 21
Suprajit Engineering Ltd
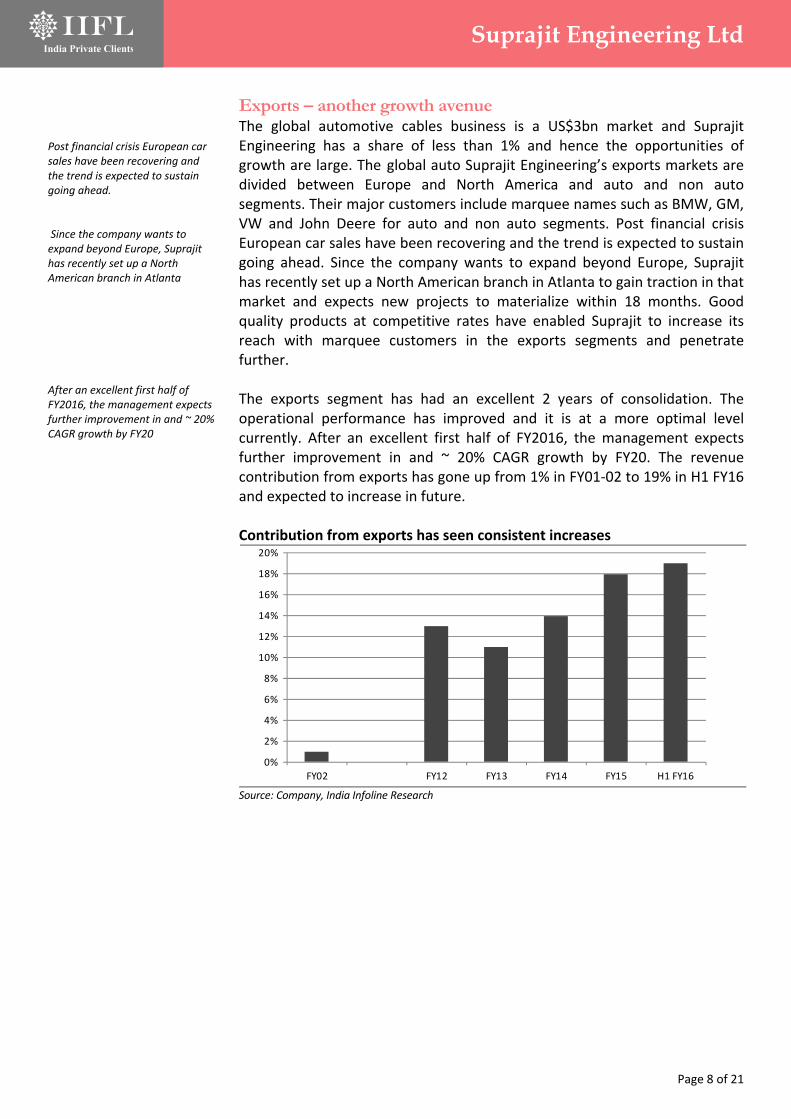
Post financial crisis European car sales have been recovering and the trend is expected to sustain going ahead. Since the company wants to expand beyond Europe, Suprajit has recently set up a North American branch in Atlanta After an excellent first half of FY2016, the management expects further improvement in and ~ 20% CAGR growth by FY20
Exports – another growth avenue The global automotive cables business is a US$3bn market and Suprajit Engineering has a share of less than 1% and hence the opportunities of growth are large. The global auto Suprajit Engineering’s exports markets are divided between Europe and North America and auto and non auto segments. Their major customers include marquee names such as BMW, GM, VW and John Deere for auto and non auto segments. Post financial crisis European car sales have been recovering and the trend is expected to sustain going ahead. Since the company wants to expand beyond Europe, Suprajit has recently set up a North American branch in Atlanta to gain traction in that market and expects new projects to materialize within 18 months. Good quality products at competitive rates have enabled Suprajit to increase its reach with marquee customers in the exports segments and penetrate further. The exports segment has had an excellent 2 years of consolidation. The operational performance has improved and it is at a more optimal level currently. After an excellent first half of FY2016, the management expects further improvement in and ~ 20% CAGR growth by FY20. The revenue contribution from exports has gone up from 1% in FY01‐02 to 19% in H1 FY16 and expected to increase in future. Contribution from exports has seen consistent increases
Source: Company, India Infoline Research
0%
2%
4%
6%
8%
10%
12%
14%
16%
18%
20%
FY02 FY12 FY13 FY14 FY15 H1 FY16

Page 9 of 21
Suprajit Engineering Ltd
Suprajit has ranked above its competitors in terms of both financial and operational performance
Superior performance when compared with competition Suprajit, over the years, has established itself as a leading cables supplier with global OEMs. This has been possible as the company maintained high level of product quality along with a lean cost structure. While quality enabled it to gain confidence of OEMs, lean cost structure allowed to it to achieve scale. Vis‐à‐vis an established player like Remsons, SEL’s performance on operational as well as financial parameters has been outstanding. The scale itself is a differentiator wherein Suprajit’s revenues are more than 5x that of Suprajit. In terms of operating margins Suprajit has a much larger advantage. Strong performance of Suprajit vs Ramsons
Remsons Suprajit
Rs cr FY14 FY15 FY14 FY15
No of cables (Lakhs) 241 246 1,250 1,310
Realization (Rs/cable) 46 47 39 40
Gross revenues 124 128 533 577
Excise 12 13 51 55
Net sales 112 115 482 522
Raw materials 65 68 312 331
Purchases 1 0 ‐ ‐
Change inventory (1) (2) (8) (0)
Total raw materials 64 66 303 331
As % of sales 57.7% 57.4% 62.9% 63.3%
Gross margins 42.3% 42.6% 37.1% 36.7%
Employee costs 17 18 57 66
As % of sales 14.9% 15.9% 11.8% 12.6%
Other expenditure 25 27 37 40
As % of sales 22.0% 23.1% 7.7% 7.7%
Total expenditure 106 111 397 437
As % of sales 94.5% 96.4% 82.3% 83.6%
Operating profit 6 4 86 86
OPM 5.5% 3.6% 17.7% 16.4%
Source: Company, India Infoline Research

Page 10 of 21
Suprajit Engineering Ltd
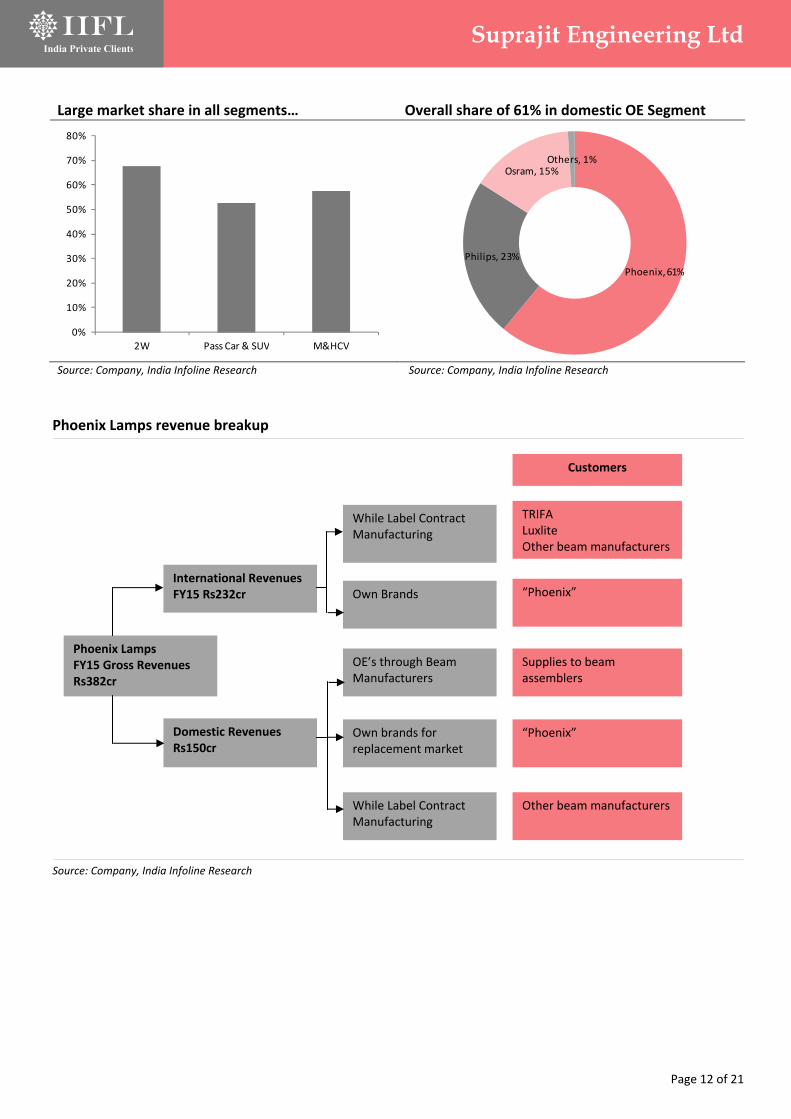
Acquisition of Phoenix Lamps is in line with the company’s strategy of being an auto component company with multiple products and the management expects to leverage the strengths of both teams The revenue contribution from replacement market is 77% and domestic OEM is 23%. It has 65‐70% market share in 2W segment, 50‐55% market share in car and SUV segment and 55‐60% in M& HCV segment
Synergy benefits to flow through on account of majority stake in Earnings accretive Phoenix Lamps Acquisition complements existing business Suprajit recently acquired 61.92% of Phoenix Lamps. The Phoenix Lamps acquisition is an important move by the company to de‐risk its product profile and enhance value to all stakeholders. This has been done with minimum additional debt of Rs 40 crore as it is significantly financed through internal accruals of Rs 115 crore. The acquisition is in line with the company’s strategy of being an auto component company with multiple products and the management expects to leverage the strengths of both teams. With 2 distinct products and similar customer profile, larger share of the pie with each customer can be acquired which leads to significant positioning in the auto components industry. Suprajit has been looking out for acquisitions for the past few years. The key criteria encompassed features such as 1) a different product, 2) leadership position, 3) profitable business, 4) global presence and 5) strong OEM relations. Phoenix Lamps fitted the bill to a tee. Phoenix Lamps has a significant presence in the auto component business in the OEM and replacement segments, it is a leader in the Halogen Lamps business (a proprietary product) and it is doing well financially with positive cash generation, low leverage and strong topline and EBITDA.
Being the pioneers of Halogen Lamps, Phoenix Lamps have emerged as the No.1 player in the India with the range of over 500 different types of products. It has significant global presence through its European subsidiaries – Trifa and Luxlite. PL supplies to both domestic and overseas customers (OEMs and replacement) and it caters to 50+ private labels across the globe. Bosch and Valeo are their major customers in the exports markets. Manufacturing facilities in both domestic tariff area and special economic zone in Noida enables meeting diverse customer requirements. Their current annual capacity is ~87mn lamps across 14 production lines with 75% utilization. The revenue contribution from replacement market is 77% and domestic OEM is 23%. It has 65‐70% market share in 2W segment, 50‐55% market share in car and SUV segment and 55‐60% in M& HCV segment. Their competitors include Philips, Osram and Jagan Lamps and their pricing is much higher than PL even though the products are of same quality which gives Phoenix Lamps competitive edge and makes it a value for money option. Performance to improve post acquisition The first few months at Phoenix have been challenging, dealing with regulatory and tax issues along with quality concerns, both in‐house as well as at the customers’ level. PL has lost market share in domestic market due to lack of focus on quality by the previous management. Pricing pressures and euro depreciation has also affected their performance. In spite of lower sales and profitability, the underlying performance at the current level is stable and expected to improve going ahead.

Page 11 of 21
Suprajit Engineering Ltd
Suprajit is re‐establishing its contracts with the customers to get customer confidence back and the management expects to gain lost market share by next financial year
Wide product range of Phoenix Lamps
Source: Company, India Infoline Research
Regulatory issues are dealt with carefully along with the plan to move the registered and corporate office to Bangalore for convenience. A Quality Challenge has been launched internally. Suprajit is reestablishing its contracts with the customers to get customer confidence back and the management expects to gain lost market share by next financial year. The company has been investing in technology to improve the quality of the products. A capex of Rs 30 crores have been announced to improve the quality and operational efficiency. They have consulted technology experts from Europe and Korea and implemented modernization program of plant and machinery. Also Suprajit is focusing on restructuring at the subsidiaries level to deliver better operational numbers on longer term basis.
The company is looking to expand to other regions besides Europe besides growing the replacement sales which would increase the overall business for the company. Besides all the initiatives taken to gain market share, leveraging the Suprajit relationship will lead superior performance of PL in future. With all the steps undertaken to revive the business, the management is hopeful of beating the industry growth for topline by 5‐10% and EBITDA margin being in the top 5 percentile in the auto component industry.
Domestic markets account for 57% of the revenues
Source: Company, India Infoline Research
Domestic OEM, 42%
Domestic Aftermarket, 11%
Domestic Institutional, 4%
Direct Export, 8%
Export to subsidiaries, 35%
Page 12 of 21
Suprajit Engineering Ltd
Large market share in all segments… Overall share of 61% in domestic OE Segment
Source: Company, India Infoline Research Source: Company, India Infoline Research
0%
10%
20%
30%
40%
50%
60%
70%
80%
2W Pass Car & SUV M&HCV
Phoenix, 61%
Philips, 23%
Osram, 15%Others, 1%
Phoenix Lamps FY15 Gross Revenues Rs382cr
International Revenues FY15 Rs232cr
Domestic Revenues Rs150cr
While Label Contract Manufacturing
Own Brands
OE’s through Beam Manufacturers
Own brands for replacement market
While Label Contract Manufacturing
TRIFA Luxlite Other beam manufacturers
“Phoenix”
Supplies to beam assemblers
“Phoenix”
Other beam manufacturers
Customers
Phoenix Lamps revenue breakup Source: Company, India Infoline Research

Page 13 of 21
Suprajit Engineering Ltd
Substantially diversified business profile now Over the years, Suprajit has substantially diversified its business from being a one product ‐ cables ‐ to multiple products wherein it now has capabilities to manufacture speedometers, turn indicators, PB levers, filters, gear shifters, stator coils, fuel sender unit assembly, moulded assemblies etc. In terms of segments, in 2002 it was predominantly it supplied only to two wheeler OEMs in the domestic market. Since then, the company has added passenger car, three wheelers, LCVs, HCVs, non‐automotive OEMs to its clientele. Also exports form a considerable portion of its revenues. This has also resulted in over dependence on one customer TVS Motors reducing substantially. This diversification has helped the company de‐risk its business by reducing the impact of cyclicality of one particular segment.
Diversified revenue base of Suprajit
Source: Company, India Infoline Research

Page 14 of 21
Suprajit Engineering Ltd
Strong revenue growth is expected for cables business driven by replacement and export markets. Phoenix Lamps should see a strong recovery under the fold of Suprajit Benefits of operating leverage and benign commodity prices to shore up margins for standalone as well as Phoenix Lamps
Financial performance to see sustained strength
All round revenue growth expected Suprajit Engineering’s revenue is expected to witness a 29% CAGR during FY15‐18E led by growth in exports and replacement segments. Exports segment is expected to see a ~20% CAGR over FY15‐18E and implementation of GST will lead to market share gains from the unorganized players in the replacement market. The company’s revenue has outperformed the industry growth by 5‐10% in the past and the trend is expected to sustain going ahead. The domestic two wheeler cables business is expected to grow higher than the industry led by increase in market share with HMSI from 25% to 50% in 18 months. The four wheeler business will also outperform the industry driven by widening customer base and volume expansion of its existing clients. After two years of declines, Phoenix Lamps is expected to regain its market share in FY17 and grow by 11% CAGR during FY16E‐18E. Earnings growth led by strong margin expansion Led by 29% CAGR revenue growth during FY15‐18E, the operating profit is expected to grow by 32% CAGR during FY15‐18E which will lead to 107 bps growth in operating margins to 16.8% over the same period. The share of revenue from replacement and exports segments is expected to increase over the next few years and since these segments command higher EBITDA margin than domestic OEM business, the margin is expected to improve going ahead. Furthermore, operational efficiencies, operating leverage and soft commodity prices will lead to major cost advantage. For Phoenix Lamps, the management expects to bring the margins in line with the Suprajit Engineering levels over a period of time. Earnings are expected to grow by 34% CAGR during FY15‐18E driven by 29% CAGR growth in revenue during FY15‐18E, 107 bps expansion in margin over the same period and contribution from the Phoenix Lamps business.
Strong growth to continue for standalone business
Phoenix Lamps revenue growth expected to pick up with synergy benefits
Source: Company, India Infoline Research Source: Company, India Infoline Research
0%
5%
10%
15%
20%
25%
30%
35%
40%
45%
50%
0
100
200
300
400
500
600
700
800
900
FY10
FY11
FY12
FY13
FY14
FY15
FY16E
FY17E
FY18E
Standalone revenue GrowthRs cr
‐30%
‐25%
‐20%
‐15%
‐10%
‐5%
0%
5%
10%
15%
0
100
200
300
400
500
600FY11
FY12
FY13
FY14
FY15
FY16E
FY17E
FY18E
Revenues yoy growthRs crRs cr
Page 15 of 21
Suprajit Engineering Ltd
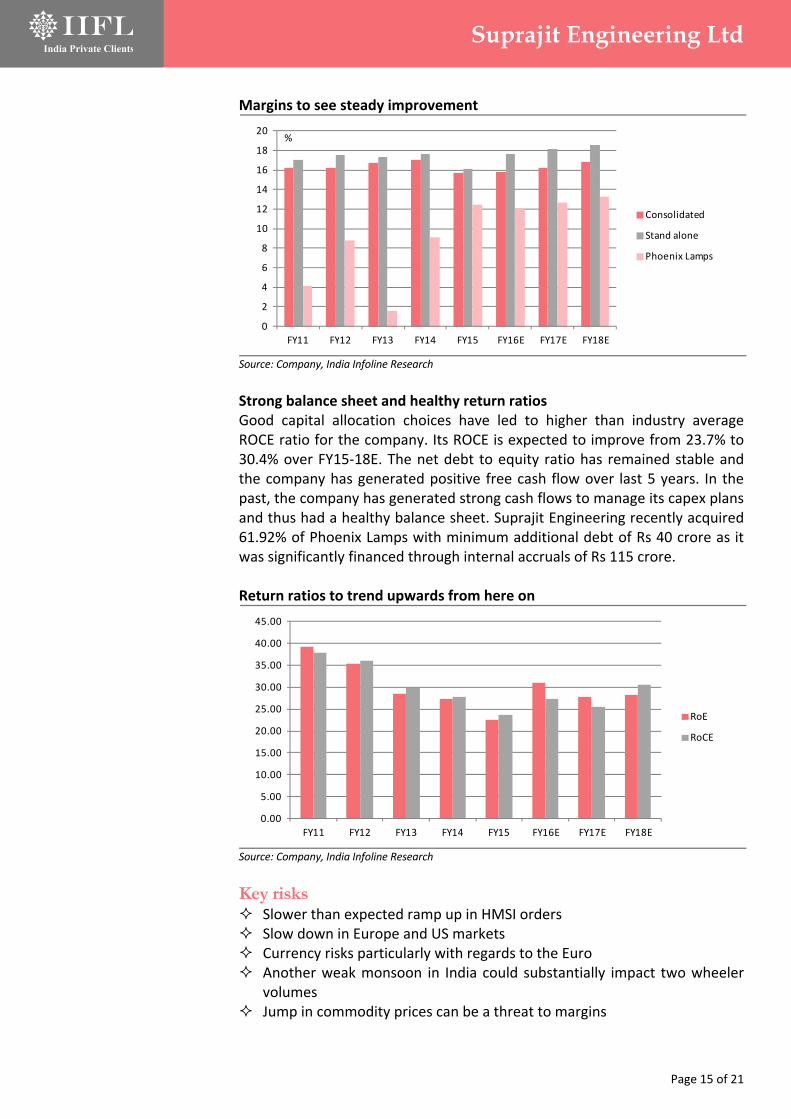
Margins to see steady improvement
Source: Company, India Infoline Research Strong balance sheet and healthy return ratios Good capital allocation choices have led to higher than industry average ROCE ratio for the company. Its ROCE is expected to improve from 23.7% to 30.4% over FY15‐18E. The net debt to equity ratio has remained stable and the company has generated positive free cash flow over last 5 years. In the past, the company has generated strong cash flows to manage its capex plans and thus had a healthy balance sheet. Suprajit Engineering recently acquired 61.92% of Phoenix Lamps with minimum additional debt of Rs 40 crore as it was significantly financed through internal accruals of Rs 115 crore. Return ratios to trend upwards from here on
Source: Company, India Infoline Research
Key risks Slower than expected ramp up in HMSI orders Slow down in Europe and US markets Currency risks particularly with regards to the Euro Another weak monsoon in India could substantially impact two wheeler
volumes Jump in commodity prices can be a threat to margins
0
2
4
6
8
10
12
14
16
18
20
FY11 FY12 FY13 FY14 FY15 FY16E FY17E FY18E
Consolidated
Stand alone
Phoenix Lamps
%
0.00
5.00
10.00
15.00
20.00
25.00
30.00
35.00
40.00
45.00
FY11 FY12 FY13 FY14 FY15 FY16E FY17E FY18E
RoE
RoCE

Page 16 of 21
Suprajit Engineering Ltd
Premium valuations justified, Initiate with BUY recommendation Suprajit Engineering is trading at FY18E of 13.1x. This is towards the premium end of the range for its peers. However, we believe that it deserves the premium owing to 1) its leadership position in the cables business in spite of established brands in the competition, 2) strong earnings growth expectations, 3) robust balance sheet and 4) strong cash flows. We value the company at 18x FY18E earnings of Rs10.1. Initiate coverage with a BUY recommendation and a 1‐year price target of Rs180. Valuations have corrected from peak
Source: Bloomberg, Company, India Infoline Research
0
50
100
150
200
250
Mar‐10 Mar‐11 Mar‐12 Mar‐13 Mar‐14 Mar‐15 Mar‐16
CMP 7x 12x 17x 22x 27x
Rs
Peer comparison CMP Target Upside Mkt Cap EPS (Rs) P/E (x) RoE (%) D/E (x)
(Rs) (Rs) (%) (Rs cr) FY16E FY17E FY18E FY16E FY17E FY18E FY16E FY16E
Amara Raja 902 965 7.0 14,759 29.4 35.5 42.8 29.4 24.3 20.2 26.2 0.0
Apollo Tyres 167 200 19.8 8,063 20.5 22.1 24.0 7.7 7.2 6.6 18.6 0.2
Balkrishna 588 730 24.1 5,404 53.5 63.2 73.0 10.4 8.8 7.7 24.1 1.2
Bharat Forge 817 850 4.0 17,128 32.2 38.8 47.8 22.8 19.0 15.4 19.6 0.4
Bosch 17,920 18,000 0.4 51,455 378.0 509.5 618.6 43.4 32.2 26.5 17.4 0.0
Exide 133 135 1.5 10,714 7.0 7.7 8.8 18.0 16.3 14.4 14.1 0.0
Greaves Cotton 126 180 42.9 2,849 7.3 8.4 10.0 16.1 13.9 11.6 20.8 0.0
Kirloskar Oil 209 270 29.2 2,933 9.7 10.6 13.5 20.9 19.2 15.0 10.2 0.0
LG Balakrishnan 427 550 28.8 653 40.2 49.7 59.3 10.3 8.4 7.0 16.5 0.4
MM Forgings 419 650 55.1 466 41.9 51.6 66.1 9.2 7.5 5.8 20.2 0.7
Motherson Sumi 239 318 33.1 18,531 10.0 13.5 17.6 21.1 15.6 11.9 35.8 1.1
MRF 34,490 45,000 30.5 13,544 3,800 4,257 4,602 8.4 7.5 6.9 30.4 0.5
Suprajit Eng 132 175 32.9 1,707 7.0 7.9 10.1 18.6 16.4 12.9 27.7 1.2
Swaraj Engine 842 1,000 18.8 1,011 41.1 49.7 59.1 19.7 16.3 13.7 22.9 ‐
TVS Srichakra 2,251 3,500 55.5 1,605 245.0 277.3 321.2 8.6 7.6 6.5 50.9 0.5 Source Company, India Infoline Research

Page 17 of 21
Suprajit Engineering Ltd
Company background Incorporated as a Private Limited Company in 1985, Suprajit Engineering Limited started manufacturing high quality liner cables to exacting Japanese standards for the automotive industry in 1987. Suprajit Engineering has evolved as India’s largest manufacturer of automotive cables with a capacity of over 180 million cables a year and 30 years of experience. It caters to a wide spectrum of automotive and non‐automotive cable requirements and has plants strategically located in the south, west and north India which gives it the ability to meet demanding product schedules as well as cater to customer specific development needs. Suprajit has two subsidiaries Suprajit Automotive Limited (SAL) and Suprajit Europe. Located near Bangalore in India, SAL is a 100% export oriented subsidiary of Suprajit Engineering and is specialized in the large scale manufacturing of cables to marquee customers worldwide. Based in Tamworth in the United Kingdom, Suprajit Europe is the Suprajit Group's technical center to the western world and a perfect intermediary for the global operations of Suprajit Group. Suprajit currently produces an exhaustive range of mechanical control cables for motorcycles, cars, commercial vehicles and various non‐ automotive cables and also specializes in the production of instruments, speedometers and many other parts Suprajit cables in two wheelers
Source: Company, India Infoline Research
Page 18 of 21
Suprajit Engineering Ltd
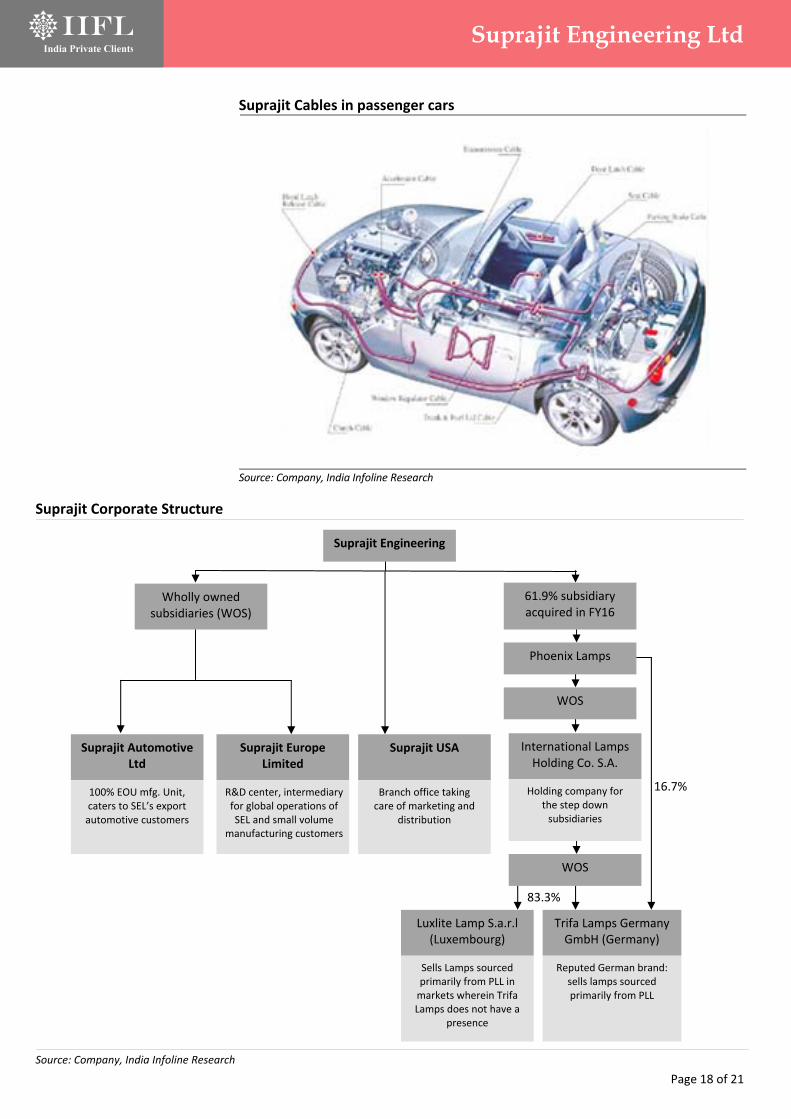
Suprajit Cables in passenger cars
Source: Company, India Infoline Research
Suprajit Engineering
Wholly owned subsidiaries (WOS)
61.9% subsidiary acquired in FY16
Suprajit Automotive Ltd
100% EOU mfg. Unit, caters to SEL’s export automotive customers
Suprajit Europe Limited
R&D center, intermediary for global operations of SEL and small volume
manufacturing customers
Suprajit USA
Branch office taking care of marketing and
distribution
International Lamps Holding Co. S.A.
Holding company for the step down subsidiaries
Phoenix Lamps
WOS
WOS
Luxlite Lamp S.a.r.l (Luxembourg)
Sells Lamps sourced primarily from PLL in markets wherein Trifa Lamps does not have a
presence
Trifa Lamps Germany GmbH (Germany)
Reputed German brand: sells lamps sourced primarily from PLL
16.7%
83.3%
Suprajit Corporate Structure
Source: Company, India Infoline Research

Page 19 of 21
Suprajit Engineering Ltd
Financials Income statement Y/e 31 Mar (Rs cr) FY15 FY16E FY17E FY18E
Revenue 612 930 1,147 1,343
Operating profit 96 147 186 225
Depreciation (9) (16) (22) (23)
Interest expense (16) (22) (24) (24)
Other income 4 21 10 12
Profit before tax 75 130 150 190
Taxes (24) (38) (46) (58)
Minorities and other 0 (7) (8) (10)
Adj. profit 50 85 95 121
Exceptional items 0 (1) 0 0
Net profit 50 84 95 121
Balance sheet Y/e 31 Mar (Rs cr) FY15 FY16E FY17E FY18E
Equity capital 12 12 12 12
Reserves 229 295 369 464
Net worth 241 307 381 476
Minority interest 0 7 8 10
Debt 166 376 271 241 Deferred tax liab (net) 9 9 9 9
Total liabilities 416 699 669 737
Fixed assets 185 310 227 233
Investments 112 112 112 112
Net working capital 114 238 302 356
Inventories 80 178 220 258
Sundry debtors 125 217 267 313
Other current assets 21 21 21 21
Sundry creditors (57) (114) (140) (162) Other current liabilities (56) (65) (67) (74)
Cash 6 39 35 41
Total assets 416 699 675 741
Cash flow statement Y/e 31 Mar (Rs cr) FY15 FY16E FY17E FY18E
Profit before tax 75 130 150 190
Depreciation 9 16 22 23
Tax paid (24) (38) (46) (58)
Working capital ∆ 5 (124) (64) (54)
Operating cashflow 65 (17) 62 101
Capital expenditure (41) (141) 61 (30)
Free cash flow 24 (158) 123 71
Equity raised (1) ‐ ‐ ‐
Investments (37) ‐ ‐ ‐
Debt financing/disposal 24 210 (105) (30)
Dividends paid (13) (18) (21) (26)
Other items 2 (1) (7) (8)
Net ∆ in cash (2) 33 (4) 7
Key ratios Y/e 31 Mar FY15 FY16E FY17E FY18E
Growth matrix (%)
Revenue growth 12.2 52.0 23.4 17.1
Op profit growth 3.8 53.1 26.6 21.0
EBIT growth 3.8 67.2 14.1 23.0
Net profit growth (1.0) 68.9 12.2 27.1
Profitability ratios (%)
OPM 15.7 15.8 16.2 16.8
EBIT margin 14.9 16.4 15.2 15.9
Net profit margin 8.2 9.1 8.3 9.0
RoCE 23.7 27.3 25.4 30.4
RoNW 22.6 31.0 27.7 28.3
RoA 10.2 12.1 10.8 13.0
Per share ratios (Rs)
EPS 4.2 7.1 7.9 10.1
Dividend per share 1.0 1.3 1.5 1.9
Cash EPS 4.9 8.4 9.8 12.0
Book value per share 20.1 25.6 31.8 39.7
Valuation ratios (x)
P/E 31.6 18.7 16.7 13.1
P/CEPS 26.8 15.8 13.5 11.0
P/B 6.6 5.2 4.2 3.3
EV/EBIDTA 18.2 13.1 9.8 8.0
Payout (%)
Dividend payout 26.5 21.2 22.1 21.4
Tax payout 32.7 29.2 30.9 30.7
Liquidity ratios
Debtor days 75 85 85 85
Inventory days 48 70 70 70
Creditor days 34 45 44 44
Leverage ratios
Net debt / equity 0.7 1.1 0.6 0.4
Net debt / op. profit 1.7 2.3 1.3 0.9
Du‐Pont analysis Y/e 31 Mar FY15 FY16E FY17E FY18E
Tax burden (x) 0.67 0.65 0.64 0.64
Interest burden (x) 0.82 0.85 0.86 0.89
EBIT margin (x) 0.15 0.16 0.15 0.16
Asset turnover (x) 1.24 1.32 1.30 1.44
Financial leverage (x) 2.21 2.57 2.56 2.17
RoE (%) 22.6 31.0 27.7 28.3

Page 20 of 21
‘Best Broker of the Year’ – by Zee Business for contribution to broking Nirmal Jain, Chairman, IIFL, received the award for The Best Broker of the Year (for contribution to broking in India) at India's Best Market Analyst Awards 2014 organised by the Zee Business in Mumbai. The award was presented by the guest of Honour Amit Shah, president of the Bharatiya Janata Party and Piyush Goel, Minister of state with independent charge for power, coal new and renewable energy.
Recommendation parameters for fundamental reports:
Buy – Absolute return of over +15%
Accumulate – Absolute return between 0% to +15%
Reduce – Absolute return between 0% to ‐10%
Sell – Absolute return below ‐10%
Call Failure ‐ In case of a Buy report, if the stock falls 20% below the recommended price on a closing basis, unless otherwise specified by the analyst; or, in case of a Sell report, if the stock rises 20% above the recommended price on a closing basis, unless otherwise specified by the analyst
India Infoline Group (hereinafter referred as IIFL) is engaged in diversified financial services business including equity broking, DP services, merchant banking, portfolio management services, distribution of Mutual Fund, insurance products and other investment products and also loans and finance business. India Infoline Ltd (“hereinafter referred as IIL”) is a part of the IIFL and is a member of the National Stock Exchange of India Limited (“NSE”) and the BSE Limited (“BSE”). IIL is also a Depository Participant registered with NSDL & CDSL, a SEBI registered merchant banker and a SEBI registered portfolio manager. IIL is a large broking house catering to retail, HNI and institutional clients. It operates through its branches and authorised persons and sub‐brokers spread across the country and the clients are provided online trading through internet and offline trading through branches and Customer Care. Terms & Conditions and Other Disclosures:‐ a) This research report (“Report”) is for the personal information of the authorised recipient(s) and is not for public distribution and should not be
reproduced or redistributed to any other person or in any form without IIL’s prior permission. The information provided in the Report is from publicly available data, which we believe, are reliable. While reasonable endeavors have been made to present reliable data in the Report so far as it relates to current and historical information, but IIL does not guarantee the accuracy or completeness of the data in the Report. Accordingly, IIL or any of its connected persons including its directors or subsidiaries or associates or employees shall not be in any way responsible for any loss or damage that may arise to any person from any inadvertent error in the information contained, views and opinions expressed in this publication.
b) Past performance should not be taken as an indication or guarantee of future performance, and no representation or warranty, express or implied, is made regarding future performance. Information, opinions and estimates contained in this report reflect a judgment of its original date of publication by IIFL and are subject to change without notice. The price, value of and income from any of the securities or financial instruments mentioned in this report can fall as well as rise. The value of securities and financial instruments is subject to exchange rate fluctuation that may have a positive or adverse effect on the price or income of such securities or financial instruments.
c) The Report also includes analysis and views of our research team. The Report is purely for information purposes and does not construe to be investment recommendation/advice or an offer or solicitation of an offer to buy/sell any securities. The opinions expressed in the Report are our current opinions as of the date of the Report and may be subject to change from time to time without notice. IIL or any persons connected with it do not accept any liability arising from the use of this document.
d) Investors should not solely rely on the information contained in this Report and must make investment decisions based on their own investment objectives, judgment, risk profile and financial position. The recipients of this Report may take professional advice before acting on this information.
e) IIL has other business segments / divisions with independent research teams separated by 'chinese walls' catering to different sets of customers having varying objectives, risk profiles, investment horizon, etc and therefore, may at times have, different and contrary views on stocks, sectors and markets.
f) This report is not directed or intended for distribution to, or use by, any person or entity who is a citizen or resident of or located in any locality, state, country or other jurisdiction, where such distribution, publication, availability or use would be contrary to local law, regulation or which would subject IIL and its affiliates to any registration or licensing requirement within such jurisdiction. The securities described herein may or may not be eligible for sale in all jurisdictions or to certain category of investors. Persons in whose possession this Report may come are required to inform themselves of and to observe such restrictions.
g) As IIL along with its associates, are engaged in various financial services business and so might have financial, business or other interests in other entities including the subject company/ies mentioned in this Report. However, IIL encourages independence in preparation of research report and strives to minimize conflict in preparation of research report. IIL and its associates did not receive any compensation or other benefits from the subject company/ies mentioned in the Report or from a third party in connection with preparation of the Report. Accordingly, IIL and its associates do not have any material conflict of interest at the time of publication of this Report.

Page 21 of 21
h) As IIL and its associates are engaged in various financial services business, it might have:‐
(a) received any compensation (except in connection with the preparation of this Report) from the subject company in the past twelve months; (b) managed or co‐managed public offering of securities for the subject company in the past twelve months; (c) received any compensation for investment banking or merchant banking or brokerage services from the subject company in the past twelve months; (d) received any compensation for products or services other than investment banking or merchant banking or brokerage services from the subject company in the past twelve months; (e) engaged in market making activity for the subject company.
i) IIL and its associates collectively do not own (in their proprietary position) 1% or more of the equity securities of the subject company/ies mentioned in the report as of the last day of the month preceding the publication of the research report.
j) The Research Analyst/s engaged in preparation of this Report or his/her relative
(a) does not have any financial interests in the subject company/ies mentioned in this report; (b) does not own 1% or more of the equity securities of the subject company mentioned in the report as of the last day of the month preceding the publication of the research report; (c) does not have any other material conflict of interest at the time of publication of the research report.
k) The Research Analyst/s engaged in preparation of this Report:‐
(a) has not received any compensation from the subject company in the past twelve months; (b) has not managed or co‐managed public offering of securities for the subject company in the past twelve months; (c) has not received any compensation for investment banking or merchant banking or brokerage services from the subject company in the past twelve months; (d) has not received any compensation for products or services other than investment banking or merchant banking or brokerage services from the subject company in the past twelve months; (e) has not received any compensation or other benefits from the subject company or third party in connection with the research report; (f) has not served as an officer, director or employee of the subject company; (g) is not engaged in market making activity for the subject company.
We submit that no material disciplinary action has been taken on IIL by any regulatory authority impacting Equity Research Analysis. A graph of daily closing prices of securities is available at http://www.nseindia.com/ChartApp/install/charts/mainpage.jsp, www.bseindia.com and http://economictimes.indiatimes.com/markets/stocks/stock‐quotes. (Choose a company from the list on the browser and select the “three years” period in the price chart).
Published in 2016. © India Infoline Ltd 2016 India Infoline Limited (Formerly “India Infoline Distribution Company Limited”), CIN No.: U99999MH1996PLC132983, Corporate Office – IIFL Centre, Kamala City, Senapati Bapat Marg, Lower Parel, Mumbai – 400013 Tel: (91‐22) 4249 9000 .Fax: (91‐22) 40609049, Regd. Office – IIFL House, Sun Infotech Park, Road No. 16V, Plot No. B‐23, MIDC, Thane Industrial Area, Wagle Estate, Thane – 400604 Tel: (91‐22) 25806650. Fax: (91‐22) 25806654 E‐mail: [email protected] Website: www.indiainfoline.com, Refer www.indiainfoline.com for detail of Associates. National Stock Exchange of India Ltd. SEBI Regn. No. : INB231097537/ INF231097537/ INE231097537, Bombay Stock Exchange Ltd. SEBI Regn. No.:INB011097533/ INF011097533/ BSE‐Currency, MCX Stock Exchange Ltd. SEBI Regn. No.: INB261097530/ INF261097530/ INE261097537, United Stock Exchange Ltd. SEBI Regn. No.: INE271097532, PMS SEBI Regn. No. INP000002213, IA SEBI Regn. No. INA000000623, SEBI RA Regn.:‐ INH000000248.
For Research related queries, write to: Amar Ambani, Head of Research at [email protected] For Sales and Account related information, write to customer care: [email protected] or call on 91‐22 4007 1000


