
University of Nebraska - Lincoln University of Nebraska - Lincoln
DigitalCommons@University of Nebraska - Lincoln DigitalCommons@University of Nebraska - Lincoln
Computer Science and Engineering: Theses, Dissertations, and Student Research
Computer Science and Engineering, Department of
Spring 4-4-2012
Supporting developer-onboarding with enhanced resource finding Supporting developer-onboarding with enhanced resource finding
and visual exploration and visual exploration
Jianguo Wang University of Nebraska-Lincoln, [email protected]
Follow this and additional works at: https://digitalcommons.unl.edu/computerscidiss
Part of the Computer Engineering Commons, and the Computer Sciences Commons
Wang, Jianguo, "Supporting developer-onboarding with enhanced resource finding and visual exploration" (2012). Computer Science and Engineering: Theses, Dissertations, and Student Research. 38. https://digitalcommons.unl.edu/computerscidiss/38
This Article is brought to you for free and open access by the Computer Science and Engineering, Department of at DigitalCommons@University of Nebraska - Lincoln. It has been accepted for inclusion in Computer Science and Engineering: Theses, Dissertations, and Student Research by an authorized administrator of DigitalCommons@University of Nebraska - Lincoln.

SUPPORTING DEVELOPER-ONBOARDING WITH ENHANCED RESOURCEFINDING AND VISUAL EXPLORATION
by
Jianguo Wang
A THESIS
Presented to the Faculty of
The Graduate College at the University of Nebraska
In Partial Fulfilment of Requirements
For the Degree of Master of Science
Major: Computer Science
Under the Supervision of Professor Anita Sarma
Lincoln, Nebraska
February, 2012

SUPPORTING DEVELOPER-ONBOARDING WITH ENHANCED RESOURCE
FINDING AND VISUAL EXPLORATION
Jianguo Wang, M. S.
University of Nebraska, 2012
Adviser: Anita Sarma
Understanding the basic structure of a code base and a development team are essential
to get new developers up to speed in a software development project. Developers do
so through the process of early experimentation with code and the creation of mental
models of technical and social structures in a project. However, getting up-to-speed
in a new project can be challenging due to difficulties in: finding the right place to
begin explorations, expanding the focus to determine relevant resources for tasks,
and identifying dependencies across project elements to gain a high-level overview of
project structures. In this thesis, I first identified six challenges that developers face
during the process of developer onboarding from recent research studies and informal
interviews with developers. To address these challenges, I implemented automated
tool support with enhanced resource finding and visual exploration. Specifically, I
proposed six functional requirements for supporting developers onboarding. I then
extended the project tool Tesseract to support these functionalities to help novice de-
velopers find relevant resources (files, developers, bugs, etc.) and understand project
structures when joining a new project. To understand how the onboarding func-
tionalities work in supporting developers’ onboarding process, I conducted a user
study with typical onboarding tasks requiring early experimentation and internalizing
project structures. The results indicated that enhanced search features, the ability to
explore semantic relationships across repositories, and network-centric visualizations
of project structures were very effective in supporting onboarding.
iii
ACKNOWLEDGMENTS
First, I would like to thank my adviser, Dr. Anita Sarma, for all her support, en-
couragement, and guidance, without which I would never be able to achieve this. Dr.
Sarma has everything you could ask for from an Adviser. She is patient, understand-
ing, and knowledgeable. She is willing to help whenever possible. I feel lucky to be
her first student and really appreciate this opportunity to work with her.
I would also like to thank my committee members Dr. Gregg Rothermel and
Dr. Witty Srisa-an, for offering great suggestions on my research and taking time
reviewing my thesis. Dr. Srisa-an also advised me through the first year in my
Master program, helping me adapt to the study and life here.
Next, I would like to thank Dr. Mark Awakuni-Swetland from Department of
Anthropology, who supported me during my first year of study.
I would like to thank Larry Maccherone, who built much of the tool I used for
my research. I would also like to thank my colleagues in the ESQuaReD Lab and the
staff at CSE department for always being available to help and answer questions.
Finally, I would like to thank my family and friends for their constant support
throughout my course of study.
This research is partially supported by NFS CCF-1016134 and AFSOR-FA9550-
09-1-0129.
iv
Contents
Contents iv
List of Figures vii
List of Tables viii
1 Introduction 1
2 Background and Related Work 7
2.1 Developer onboarding . . . . . . . . . . . . . . . . . . . . . . . . . . . 7
2.2 Program comprehension . . . . . . . . . . . . . . . . . . . . . . . . . 11
2.3 Resource identification . . . . . . . . . . . . . . . . . . . . . . . . . . 14
3 Motivation 18
3.1 Challenges in developer onboarding . . . . . . . . . . . . . . . . . . . 18
3.2 Pilot study for initial feedback . . . . . . . . . . . . . . . . . . . . . . 21
3.3 Functionalities to ease developer onboarding . . . . . . . . . . . . . . 24
3.4 Hypothetical scenario of a developer onboarding . . . . . . . . . . . . 25
4 Approaches and Implementation 27
4.1 Approaches to support onboarding . . . . . . . . . . . . . . . . . . . 27

v
4.2 Introduction to Tesseract . . . . . . . . . . . . . . . . . . . . . . . . . 30
4.3 Extensions to Tesseract to support onboarding . . . . . . . . . . . . . 37
4.3.1 Enhanced resource finding with synonym-based search and similar-
bugs search . . . . . . . . . . . . . . . . . . . . . . . . . . . . 37
4.3.2 Information retrieval techniques used . . . . . . . . . . . . . . 38
4.3.3 Implementation of synonym-based search and similar-bugs search 40
4.3.4 Integration of search features into visual exploration . . . . . . 42
4.3.5 Enhanced visualizations and navigation to solve scalability issue 44
4.3.6 Filters to reduce cognition load . . . . . . . . . . . . . . . . . 47
4.3.7 Summary . . . . . . . . . . . . . . . . . . . . . . . . . . . . . 48
5 User Study 49
5.1 Experiment settings . . . . . . . . . . . . . . . . . . . . . . . . . . . . 50
5.2 Evaluation design . . . . . . . . . . . . . . . . . . . . . . . . . . . . . 54
5.3 Results and discussion . . . . . . . . . . . . . . . . . . . . . . . . . . 56
5.4 Threats to validity . . . . . . . . . . . . . . . . . . . . . . . . . . . . 64
6 Conclusion 67
A User Study Tasks 70
A.1 Task 1 . . . . . . . . . . . . . . . . . . . . . . . . . . . . . . . . . . . 70
A.2 Task 2 . . . . . . . . . . . . . . . . . . . . . . . . . . . . . . . . . . . 71
A.3 Task 3 . . . . . . . . . . . . . . . . . . . . . . . . . . . . . . . . . . . 71
A.4 Task 4 . . . . . . . . . . . . . . . . . . . . . . . . . . . . . . . . . . . 72
B User Satisfaction Ratings in Exit Survey 74
B.1 User satisfaction ratings in control group . . . . . . . . . . . . . . . . 74
vi
B.2 User satisfaction ratings in experimental group . . . . . . . . . . . . . 75
Bibliography 76

vii
List of Figures
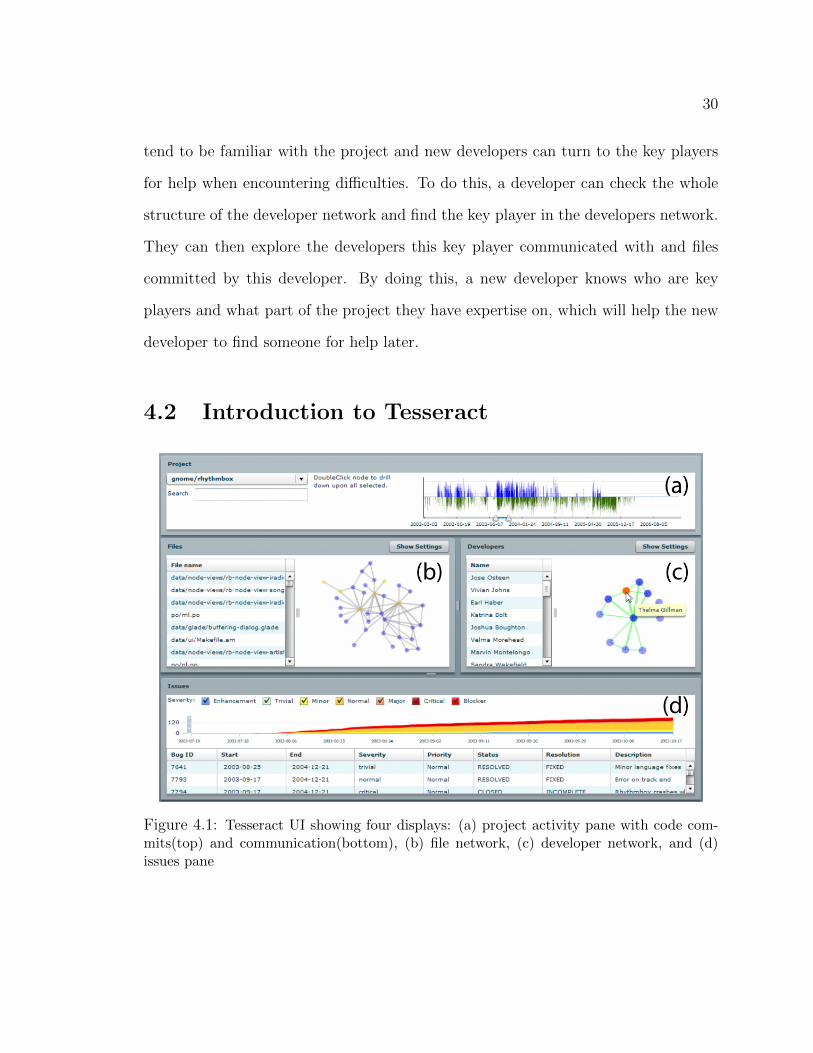
4.1 Tesseract UI showing four displays: (a) project activity pane with code com-
mits(top) and communication(bottom), (b) file network, (c) developer network,
and (d) issues pane . . . . . . . . . . . . . . . . . . . . . . . . . . . . . . . 30
4.2 Tesseract architecture: a client-server application . . . . . . . . . . . . . . . 35
4.3 Information flow for Tesseract . . . . . . . . . . . . . . . . . . . . . . . . . 36
4.4 Search over bugs in Tesseract with keywords “crash playback” . . . . . . . . 38
4.5 Information flow in search engine . . . . . . . . . . . . . . . . . . . . . . . 41
4.6 Similar bugs recommendation in Tesseract when Bug 7589 has been selected by
users . . . . . . . . . . . . . . . . . . . . . . . . . . . . . . . . . . . . . . 42
4.7 Integration of bug search into Tesseract . . . . . . . . . . . . . . . . . . . . 43
4.8 Display of bug details in Tesseract . . . . . . . . . . . . . . . . . . . . . . . 44
4.9 (a) Original file network visualization with scalability issues vs. (b) updated
file network visualization (2002-06-26 to 2003-02-05) . . . . . . . . . . . . . . 45
4.10 Tesseract UI with extensions . . . . . . . . . . . . . . . . . . . . . . . . . . 46
5.1 Evaluation model used for usability testing. Items with * include objective
measures . . . . . . . . . . . . . . . . . . . . . . . . . . . . . . . . . . . . 55
viii
List of Tables
3.1 Onboarding Requirements and Tesseract Features . . . . . . . . . . . . . 24
5.1 Experiment Design . . . . . . . . . . . . . . . . . . . . . . . . . . . . . . 50
5.2 Summary of number of related bugs found in Task 1 and Task 2 by re-
searchers(Max), the system(System), and subjects(average and maximum)
for both treatment groups . . . . . . . . . . . . . . . . . . . . . . . . . . 57
5.3 Terms used for completeness rate and correctness rate . . . . . . . . . . . 57
5.4 Correctness rate and Completeness rate for Task 1, Task 2 . . . . . . . . 58
5.5 Time-to-completion(in minutes) for Task 1 through Task 4 . . . . . . . . 59
5.6 User Satisfaction ratings based on a 5-point Likert scale, where 5 is “strongly
satisfied” . . . . . . . . . . . . . . . . . . . . . . . . . . . . . . . . . . . 62
B.1 User Satisfaction ratings in control group based on a 5-point Likert scale,
where 5 is “strongly satisfied” . . . . . . . . . . . . . . . . . . . . . . . . 74
B.2 User Satisfaction ratings in experimental group based on a 5-point Likert
scale, where 5 is “strongly satisfied” . . . . . . . . . . . . . . . . . . . . . 75

1
Chapter 1
Introduction
Software systems may be composed of a large code base with thousands or millions
of lines of code and complex interdependencies, understanding which is critical for
developers to contribute to or maintain a software project. Getting familiar with
the basic structure of a code base is especially essential for new developers to get
up to speed in a software development project and start contributing. The process
of becoming proficient with a code base is known as developer-onboarding [10]. The
concept of onboarding is originally from management science, dealing with the pro-
cess that new employees use to learn the knowledge, skills, and behaviors that they
need to succeed in their new organizations [3]. In software development, onboarding
(sometimes referred to as a joining script [43]) helps new developers learn about a
software engineering project and become members of the development team.
Developer-onbarding has long been a focus of study in open source projects mainly
because of its novel, volunteer-based business model and self-governing team struc-
tures [15, 43]. More recently, the study of developer-onboarding has been extended
into the domain of commercial projects. Research results indicate that it is very likely
for novice software developers to run into frustration with a number of factors: com-

2
munication, collaboration, technical difficulties, cognition, etc. [5]. It was found that
experienced developers face challenges too when joining a new project, even when
they move across projects within the same organization.
Primary factors which account for successful integration of developers into a
project were identified by Dagenais et al. in their study of integration into a new
software project landscape [12]. They found that the main factors that impact devel-
opers joining a software development project are early experimentation, internalizing
structures and cultures, and progress validation [12]. Early experimentation refers to
developers experimenting with the code base by performing small tasks to gain an
understanding of the project [12]. It prepares newcomers to further explore and un-
derstand a complex project. Internalizing structures and cultures within the project
refers to new developers efficiently identifying relevant resources and finding a place
to fit themselves into the project [12]. Good progress validation allows managers and
mentors of new developers to check if the new developers are on the right track and
that they are not stuck on a small problem for long periods of time. Studies have
found that new developers don’t always know where to ask for help [12].
In this work, I focus on challenges in early experimentation and internalization
of technical and social structures in the onboarding process of developers joining a
new project landscape. Specifically, this work addresses the following challenges that
hinder onboarding in early experimentation task and internalizing project structures.
First, it is nontrivial to accurately identify a good starting point in a software
project and it is challenging for new developers to find the relevant resources needed
to complete the starter tasks [34]. Second, the investigations of project resources
are limited by the current search capability, which is mainly provided by “keyword-
based” search [12]. Third, understanding the overall structures of a project and
interrelationships between various resources are considered critical, but it is difficult

3
for new developers to obtain such information during the early stage of their on-
boarding process [34]. Fourth, project investigations currently have to be performed
separately per repository, which makes it difficult for new developers to understand
project dependencies across multiple repositories [38]. Further, the majority of soft-
ware investigations treat the technical and social aspects of a project as dichotomous;
whereas, studies have shown that understanding the social structure and culture is
particularly important in getting assimilated into a project [12, 15]. Finally, large
scale of software systems with millions of lines of code and hundreds of developers
makes the creation of accurate mental models of the project cognitively challenging
[38].
Currently, developers use a mix of technology (issue trackers, versioning systems),
experimentation (getting their hands dirty by coding), and social means (seeking help
from mentors, experienced developers) to perform tasks in early experimentation and
for internalizing project structures [1, 5, 12]. Developers usually search for relevant
information for a bug in bug systems like Bugzilla [8] or issue trackers like Trac [40].
They may look for commit history in versioning systems such as SVN [39] and Git [18].
Developers may use command line query as well as some web-based UIs of these tools.
However, they have to query over different systems separately and then aggregate
those results manually to get the information they want. Most of the time they have
to build queries over the target database manually and repeat this step numerous
times. This resource finding process incurs significant time cost due to inefficient
queries and can be improved.
Studies have found that good mentoring is one of the most effective and irre-
placeable factors in facilitating onboarding [16]. For example, in one study new
developers needed frequent meetings with their mentors for up to four weeks, after
which they could operate more or less independently with one or two meetings per
4
week [16]. However, such mentoring is not always cost effective or feasible (e.g.,
in open source or distributed development settings). In such situations, automated
support for onboarding can be beneficial.
Developers onboarding a project also prefer visualizations to understand the code
base and communicate with mentors or experienced teammates [10]. However, most
of the time they have to draw diagrams on a whiteboard due to the poor tool sup-
port available for structural views of project resources and socio-technical depen-
dencies [10]. In this case, visualizations of project resources may help developers
understand a new project more easily.
To facilitate developer onboarding with automated support and provide visualiza-
tions of project resources, I first identify a set of functionality needs for onboarding
based on a literature survey of developer onboarding and its challenges, informal in-
terviews with some industry partners, and pilot studies. These functionalities include:
(1) identification of relevant resources to aid early experimentation, (2) seamless in-
vestigation of data that is fragmented across multiple repositories, (3) investigation
of semantic relationships, (4) exploration of social, technical, and socio-technical de-
pendencies, (5) representation of high-level project structures, and (6) facilitating
top-down and bottom-up comprehension strategies.
To achieve these onboarding functionalities, I extended a project exploration
tool, Tesseract, and used it as a platform for evaluating these functionalities in my
user study. Tesseract is an interactive exploration environment that visualizes the
socio-technical relationships in software projects. It analyzes information from code
archives, communication records, and bug repositories to capture the relations be-
tween code, developers, software bugs, and communication records. By empirically
analyzing data from different project repositories, Tesseract visualizes the file de-
pendencies, communication network, and technical dependencies among developers

5
based on their underlying work dependencies. Tesseract’s built-in features allow de-
velopers to explore project resources and socio-technical dependencies across multiple
repositories visually and interactively [32].
This work extended Tesseract by providing: (1) enhanced resource finding with
synonyms search and similar-bugs search, (2) integration of enhanced bug search fea-
tures to allow visual exploration and providing more details on bugs, (3) enhanced
network visualizations with package-level dependencies, and (4) a set of filters to man-
age various project resources. With enhanced resource finding and visual exploration,
Tesseract now supports a majority of the proposed onboarding functionalities.
To empirically validate the usefulness and effectiveness of these Tesseract func-
tionalities in supporting developer onboarding, I conducted a user study with tasks
on: (1) early experimentation and (2) internalizing structures of project resources.
This study included twenty participants as novice developers starting on an open
source project (GNOME Rhythmbox [29]). In the experiment, subjects were asked
to identify the right (starter) task by exploring related issues in the database, expand
the focus to identify related resources to the starter task, and answer questions re-
garding the technical and social structures of the project. My results show enhanced
resource finding to be beneficial in enabling early experimentation and visual explo-
ration across project entities to help in building mental models. Subjects when using
Tesseract provided more correct answers and in short time to completion. This was
confirmed by qualitative feedback from participants, who found Tesseract to help
them get an overview of the projects and in identifying related resources.
In summary, my work aims to explore tool support for developers onboarding a
software development project. This thesis primarily contributes to three aspects as
noted below:

6
1. It proposes a list of functionalities of tool support for developer onboarding.
2. It extends a project exploration tool with multi-perspective visual exploration
and enhanced resource finding to help developers onboard a new project.
3. It evaluates a project exploration tool to understand how these functionalities
work in supporting developer onboarding and projected future improvements.
The remainder of the thesis is structured as follows. In Chapter 2, I provide an
overview of background and related work on developer onboarding, program com-
prehension, resource identification, and information retrieval. In Chpater 3, I review
recent studies on challenges in developer onboarding and report the results of my pilot
study to better understand the onboarding challenges in practice. To address these
challenges, I then propose a list of functionalities to support developers onboarding
and present my approach to support these functionalities. Section 4 then presents an
introduction to Tesseract and explains the implementation details related to extend-
ing Tesseract to support developer onboarding. Section 5 evaluates the onboarding
support in Tesseract with a formal user study and discusses the results. Section 6
concludes my work with a brief outlook on future work.

7
Chapter 2
Background and Related Work
In this section, I first provide background on new developer onboarding and program
comprehension. I then discuss the technical aspects involved in enabling Tesseract to
help in resource finding. Specifically, I explain the information retrieval techniques
that can be used to improve search capability over software project resources. Finally,
I discuss related work on automated support for resource identification in software
development projects.
2.1 Developer onboarding
In management science, onboarding refers to the process where new employees learn
the knowledge, skills, and behaviors that they need to succeed in their new organi-
zations [3]. In software development, onboarding (sometimes referred to as a joining
script [43]) involves developers to get proficient with a code base and become a mem-
ber of the development team. Understanding the basic structure of a code base is
critical for new developers to get up to speed in a software development project and
start contributing. However, software systems may be composed of a large code base

8
with many lines of code and complex interdependencies, which makes it challeng-
ing for new developers to onboard a software project. Relevant research found that
novice software developers run into frustration with challenges regarding communi-
cation, collaboration, technical difficulties, cognition, etc. [5].
Dagenais et al. [12] performed a grounded theory study of integration of newcomers
into a software project and found early experimentation, internalizing structures and
cultures, and progress validation to be the three key factors that help newcomers
settle in a new project landscape. Each factor impacting developer onboarding is
going to be explained in detail in the following paragraph.
Early experimentation refers to developers experimenting with the code base by
performing small, often isolated tasks to gain an understanding of the project. In
a survey of developers joining new projects, this was considered more valuable and
effective than in-depth new developer training or documentation [12]. Newcomers
in most projects begin their initial assignments as open-ended code investigations,
isolated modifications to the code base, or simple bug fixes [15, 16]. The same char-
acteristics for early experimentation hold true for open source projects; however, here
it is the responsibility of the newcomer, instead of the manager, to identify the appro-
priate technical tasks and start contributing [15, 43]. Most projects have public lists
of open issues from which newcomers are encouraged to begin investigating. For ex-
ample, Rhythmbox [29], a popular Gnome project, has the following recommendation
for new developers in its online documentation:“If you don’t know what to work on,
or you’re looking for a small task to get started, take a look at the list of ‘gnome-love’
bugs and the current GNOME goals. Otherwise, there are enough bugs and feature
requests in Bugzilla to keep anyone busy.”
The second factor affecting onboarding is the ability to internalize the project
structures. This step involves the creation of project mental models, which is a devel-

9
oper’s mental representation of the project and its structures. Building these mental
models is closely tied to how developers understand the program and their inter-
dependencies. Research in the area of program comprehension has categorized the
cognitive processes and information structures as necessary components for building
mental models into different cognition models [44]. I will discuss program compre-
hension in more detail in Section 2.2.
It is not enough to only understand the technical structure in a project, but it is
important to gain an overall understanding of the project: a new developer needs to
understand both the technical and social aspects of the project [16]. For example,
some of the most common questions asked by developers include both technical and
social elements, such as: “who is the person responsible for this component”, “what
will be the impact of a change”, “who has changed this (artifact) in the past”, “who
can help me with this file”. Answering these questions requires an understanding of
the team structure and the project history. Unfortunately, the social and technical
information pertaining to a project are often treated as dichotomous by existing
tools [32].
Note that both early experimentation and creating mental models of the project
are integral parts of onboarding and are in fact, symbiotic. Early experimentation
tasks help in understanding project structures, which in turn inform early experi-
mentation and vice verse. Both these steps require an understanding of the semantic
relationships across different kinds of project entities. Semantic relations are rela-
tions that exist implicitly in a project and cannot be directly extracted. For example,
two files are likely to be related to each other if they were committed often in the
past, which cannot be found directly. Further, it is usually challenging to identify
semantic relations since they involve various kinds of project resources. For example,
in a communication network, congruence relations (details can be found in Section
10
4.1), which are mismatches between communication requirements and communication
behaviors, are calculated from commits records and communication records across
different databases. Unfortunately, most tools do not support the exploration of se-
mantic relationships across project entities. Further, these semantic relationships in-
corporate project entities that are typically siloed across different repositories [2, 32].
Understanding and managing these semantic relations is difficult enough in a regu-
lar software project; they become unmanageable when the scale of the project is in
millions lines of code. The current (large) scale of software systems make onboarding
tasks cognitively challenging [38].
Finally, the third influencing factor categorized by Dagenais et al. [12] in their
study was progress validation. This validation process helps newcomers validate their
progress and prevents the situation when they go far off track or get stuck with
what they do [12]. Studies have found that newcomers often cannot gauge when a
problem is difficult enough and they need help. Frequent progress validation can not
only provide an atmosphere where newcomers can feel at ease to ask questions or
report their progress, but also present a chance for newcomers to receive proactive
suggestions or useful shortcuts straight to the point when they encounter problems.
Newcomers can validate their progress either through team feedback where validation
can be obtained from team members who know the project landscape well, or by self-
checking their task status. Both types were found in [12] to be effective in helping
newcomers for a smoother onboarding process.
While all three aspects of onboarding are important, here in this thesis, I discuss
early experimentation and internalizing structures which can be aided by automated
tool support. In the following sections, I detail how I provide, through my tool, such
automated support for new developers during their onboarding process.

11
2.2 Program comprehension
As I have discussed in Section 2.1, program comprehension is essential to facilitate
the onboarding process of developers onto a new project. In program comprehen-
sion, developers utilize both existing and newly acquired knowledge to build a mental
model of the software project. Depending on their knowledge and project specific con-
texts developers use different cognition strategies, which are referred to as cognition
models [44].
The software engineering cognition models can be largely grouped as bottom up
and top down. The bottom-up model, proposed by Shneiderman and Mayer [33]
and Pennington [27], maintains that comprehension is built from the bottom-up by
reading source code and then grouping it into higher levels of abstraction (for ex-
ample, aggregating individual statements into functions, deciphering data or control
flow from source). This process of aggregating information continues until a high-
level understanding of the program is gained. The top-down model, proposed by
Brooks [31] and Soloway and Ehrlich [35], suggests that comprehension occurs in
a top-down approach. Brooks’ model, for example, states that the comprehension
process starts with a hypothesis of the global nature of the program, which is then
refined hierarchically. Other researchers have proposed that programmers do not use
the models dichotomously, rather they combine strategies of these models based on
the context of their exploration. For example, Letovsky’s knowledge base model [24]
proposes that programmers combine both the top-down and bottom-up approaches
“opportunistically”. The programmers tend to choose the cognition strategies that
they think yield the highest return in knowledge gain in a project. Similarly, Littman
et al. [25] and Soloway et al. [36] noted that programmers either use a systematic ap-
proach tracing through control-flow and data-flow abstractions or follow an as-needed

12
approach by focusing only on the code related to a particular task. However, it was
found that the “as-needed” approach, although easier to perform, is error prone and
inefficient [38]. The programmers explore only the parts of the code base that they
believe are relevant to their current tasks. The as-needed approach leads to more
errors since casual interactions are often overlooked [36].
Other research in program navigation has shown that a systematic, hypothesis
driven exploration is a better alternative [30]. However, new developers face difficul-
ties when using top-down (systematic) comprehension strategies because of their un-
familiarity with the project. Further, such strategies are not well-supported by tools
[34]. Instead, new developers are more comfortable, and because of available tool
support more successful, when using bottom-up comprehension strategies [26]. Not
surprisingly, during early-experimentation tasks new developers were found to employ
an as-needed comprehension strategy, investigating code and relevant resources for
the current task at hand [12, 16].
In a related study on program comprehension, Sillito et al. [34] analyzed pro-
grammer activities into four categories: 1) Finding focus points deals with developers
finding the “right” starting point to begin their tasks. To achieve this goal devel-
opers were found to mainly use text-based search on the code base by identifying
keywords or types (classes or interfaces). 2) Expanding focus points includes develop-
ers attempting to learn more about a given entity and finding information relevant to
their task. 3) Understanding a subgraph involves developers building concepts in the
project pertaining to multiple relationships and entities. To answer these questions,
developers have to explore the details and understand the overall structure of the
relevant project resources. 4) Questions over groups of subgraphs includes developers
trying to understand the relationships between multiple substructures in a project
13
or understand the interaction between a substructure and the rest of the software
system.
Note that the first two categories typically involve bottom-up comprehension
strategies and map to early experimentation tasks; the next two categories involve
top-down strategies and help in creating mental models. Sillito et al. [34] found that
new developers largely performed activities in the first three categories. They also
evaluated current tool support and found that the third category (overall structure
and relationships across structures) was barely supported by current project explo-
ration tools.
To understand the relationships across different project resource structures, de-
velopers are required to identify and internalize the complex dependecies between
technical structures and social structures, which has been found to be difficult for
new developers [5, 16]. New developers were found to spend significant portions of
their time in identifying the impact network (which changes in which files can impact
which other files and developers [13]). Tools such as Ariadne [41] and OSS browser [15]
take the first steps towards visualizing socio-technical relations in a project. Ariadne
analyzes the dependencies among code modules to create a network of dependent
artifacts, which is then annotated with developers who have edited each code mod-
ule. OSS browser takes a similar approach, but first creates a network of developers
based on their email communications and then annotates developers with the code
modules that they have edited. These tools create a hybrid graph of social and tech-
nical components by analyzing the versioning repository and the mailing lists (in OSS
Browser). Compared to these tools, Tesseract presents three different kinds of net-
works: file dependencies, communication network, and technical dependencies among
developers based on their underlying work dependencies. Further, I include informa-
tion and developer discussions in the issue tracker in my analysis. I also believe that
14
presenting the technical and social networks separately makes it easier to comprehend
complex networks.
2.3 Resource identification
A key challenge for new developers is the difficulty in identifying the right resources as
information about resources are siloed across different repositories and only limited
search capabilities are available. Identification of relevant resources of a project is
essential for program comprehension. However, the task is nontrivial. For example, a
study of the Microsoft’s Windows Serviceability group revealed that developers and
testers spent significant time during diagnosis looking for similar issues that have
been resolved in the past [7]. Developers usually have to manually search for similar
issues in a large database. Reading and understanding the comments on each issue
can be time consuming too.
Recently, research has attempted to provide tool support for resource identification
in software development which we discuss here. Hipikat [42] allows new developers to
determine resources that are related to an artifact which they are currently editing.
It links different project elements (code, bugs, and discussions in mailing lists) across
repositories to recommend related elements. Mylyn [21] is a similar tool that identifies
related resources to create a context for a user’s task. It monitors a programmer’s
work activity to identify and recommend information relevant to the current task,
which improves productivity of programmers by reducing searching, scrolling, and
navigation. One limitation of Mylyn is that it treats tasks independent from each
other while in practice tasks tend to be related. This linking of project elements across
different repositories is similar to Tesseract. However Hipikat and Mylyn recommend
project elements when a user queries about or edits a specific artifact, whereas our

15
extension to Tesseract [46] allows searching for similar tasks, a key activity in early
experimentation
Team Tracks [14] is a tool that provides traces of past navigation (across files) to
help with the task at hand. It identifies and visualizes a list of related resources and
frequently-accessed items when developers work on a task in a project. Codebook [4]
aggregates information about code related changes, developer commits, mail messages
etc., to provide information of related resources through a single portal. While these
tools link project elements across different repositories and provide a historical view,
my work enables tool support for searching for similar tasks: a key activity in early
experimentation [12]. Additionally, I provide visual explorations of project structures
and their relationships.
Limited search capability is another known problem in current project exploration
systems. To search for a relevant resource, in most cases users are required to ex-
plicitly mention the fields over which a search is to be performed. Therefore, the
quality of the search results is largely dependent on the quality of the query gen-
erated by the developer. Furthermore, current search capability is limited by exact
keyword matching [1, 12]. For example, issue trackers, such as Bugzilla, Trac, Jira
etc., provide search capabilities, but these are limited to exact matching of keywords
provided by the developer. Bug patches or code fragments that are often embedded
in bug descriptions are not easily identified by search engines, unless they use nat-
ural language processing. One exception is InfoZilla [6], a tool that automatically
extracts structural information (e.g., code snippets, bug patches, stack traces) from
bug reports, which can then facilitate bug triaging and detection of duplicate bugs.
DebugAdvisor [1] is another tool that distinguishes structured text in bug descrip-
tions and provides search functionalities. It uses a two phased approach: the first
“search” phase allows users to search using a fat query that contains both structured

16
and unstructured data describing the contextual information of a specific bug. The
second “related-information” phase retrieves resources (people, source files, etc.) from
multiple repositories that are related to a set of bug reports (typically limited to a set
of five bugs) identified in the first phase by taking into consideration the relationship
of the project resources. I do not differentiate structured text from unstructured text
in Tesseract and plan on using natural language processing based search in the future.
Recently Natural Language Processing (NLP) is being increasingly used to help
in search. For instance, Hill et al. present a context-based search that automatically
extracts natural language phrases from source code identifiers and categorizes the
phrases and search results into a hierarchy [19]. Latent Semantic Analysis (LSA)
is another popular technique that can be used to improve the search capability of
search engines. Basically, LSA follows the principle that words that are used in the
same contexts tend to have similar meanings. LSA analyzes a large corpus of natural
text with statistical computations to extract the contextual-usage meanings of words.
With these contextual-usage meanings, LSA uses a mathematical technique called
singular value decomposition to identify the similarity of words and text messages [23].
Helping to establish the relations between terms in similar contexts, LSA is able to
capture the latent semantic structure in an unstructured collection of text. A search
engine using latent semantic indexing can return results that are conceptually similar
in meaning to query terms even if the returned documents contains no same keywords
as in the query. I plan to use NLP techniques in the future.
My goals, thus far, have been to help newcomers find the right starter tasks and
identify relevant resources for these tasks. The user interface of Tesseract is geared to
help developers explore related bugs easily and systematically: a developer can drill
down into a set of related bugs (and their resources), and other bugs related to the
initial set transitively, and retrace their exploration paths. The interactive, visual

17
presentation of project elements in Tesseract sets my work apart from DebugAdvisor.
While DebugAdvisor presents a textual listing of bugs and related resources, Tesseract
provides multiple, cross-linked network visualizations; so much so that the use of the
Tesseract interface makes it almost trivial to investigate the project state for a selected
time period or bug. Finally, while DebugAdvior had a relatively large deployment
of the system, it was deployed to developers who were already part of a large team
and well versed in the project. Moreover, these developers only provided ad hoc
comments. My study, on the other hand, explicitly evaluated onboarding of new
developers through a controlled user study.
Finally, resource identification across multiple repositories relies on existing links.
However, such links are often missing, especially in open source projects [2]. To over-
come the problem of missing links, Linkster [2] allows an (expert) user to manually
link project elements through a UI. For example, users can add a link between a
commit ID and a bug ID by checking their relationships through the user interface
of Linkster. Linkster helps the efficacy of tools and research that depends on such
linkages by filling in the missing links. In summary, while current tools allow iden-
tification of links based on syntactic information of given program entities, semantic
relationships are barely supported [32, 34]. My work attempts to make semantic
relationships available to developers, for example, by displaying logical dependency
between files and displaying the developers who have edited a set of files.

18
Chapter 3
Motivation
Here I present my motivation to provide automated support to help new developers
onboarding a software engineering project. The first step towards this goal was to
locate a set of functionalities that such an automated tool could provide. I performed
a literature survey and informal interviews with developers in a pilot study to identify
the challenges and the solutions to those challenges. I list the challenges in onboarding
followed by a hypothetical example to illustrate the key steps a novice developer will
take when onboarding. I then present a list of six key functionalities needed to address
the challenges in the onboarding process.
3.1 Challenges in developer onboarding
Recent research has explored the process of onboarding in software development with
regard to relevant resource identification, program comprehension, social factors, etc.
After reviewing the findings from recent studies on developers onboarding, I iden-
tify the following challenges that impede onboarding in early experimentation and
internalizing structures.

19
First of all, it is nontrivial for newcomers to find a good starting point and the
resources relevant to the starter task [34]. When developers know little or nothing
about the code base, they are interested in finding a place to start looking. A typical
starter task for a newcomer could be a small bug fix. However, new developers have
difficulty searching for a bug that matches their skill set and interests. Typically they
identify an appropriate starter task through a text-based search. However, due to the
limited search capability of most issue trackers, it is often challenging to find a good
starter task. Further, developers have to identify relevant resources and similar issues
to fix a bug efficiently and correctly, but again this is not easy in current software
environments. Typically, developers have to manually check the bug lists in the bug
database to find the relevant resources needed to complete the starter task. This
phase takes significant time and effort.
Second, the investigations of a project currently available to the developers are
restricted within the scope of the available “keyword-based” search [12]. In fact, it
was found that it is difficult for novice developers to come up with the exact queries
to investigate a problem, and the quality of keyword-based search largely depends on
the quality of the queries provided by users [22]. For example, when developers search
for a bug related to a keyword using keyword-based search, bugs with descriptions
containing synonyms of the provided search term do not show in the search results.
Third, it is critical for developers to obtain an overview of the project struc-
tures and the interrelationships between different structures. To get familiar with a
project, a developer can either find a focus and then expand their focus to relevant
resources(formally known as a bottom-up strategy [27, 33]), or start from the over-
all structure of the project and then explore further into the details of an interesting
component(formally known as a top-down strategy [31, 35]). Both strategies to
understand a project require structural views of project resources and their interre-

20
lationships. However, it is challenging for new developers to obtain such information
during the early stage of their onboarding process. Current tools also lack means of
presenting and visualizing structural overview of project resources and relationships
among those structures [34]. Sim et al. [16] conducted a study of new graduates
joining an industry project and found that even after four months of working on a
project, developers still had a shallow understanding of the project and got frustrated
because of it.
Fourth, project investigations currently have to be performed separately on each
individual repository. This makes it difficult for developers to obtain an overview
of project dependencies syntactically and semantically [38]. Syntactic relations are
relations explicitly specified in program files. For example, two source files can be
related because the method defined in a file calls another method defined in another
file. Semantic relations are relations that exist implicitly in a project and cannot
be directly extracted. For example, two files are likely to be semantically related
to each other if they were committed together often in the past. But this relation
usually cannot be directly deciphered through static program analysis. Another factor
that makes identifying semantic relationships challenging is the fact that they can
involve different types of resources. For example, two developers are considered to
have communicated with each other if they both commented on the same bug. To
investigate a source file, a developer may have to reach out to a static analysis tool
to analyze its call dependencies; a configuration management repository to identify
its past changes; an issue tracker to keep track of the bugs which are associated with
it, and so on. Fragmented explorations between repositories make comprehension of
project structures not only difficult, but also time intensive [38].
Further, the majority of tools that support software investigations treat the tech-
nical and social aspects of a project as dichotomous. However, technical structure
21
and social structure depend on each other and studies have shown that understand-
ing the social structure and culture is particularly important in getting assimilated
in a project [12, 15]. In a software project, technical structure and social structure
depend on each other and developers rely on these dependencies to find someone for
help with regard to specific task. Due to the fact that new developers are unfamiliar
with the project resources and team structures, they are more likely to ask for help
from experienced team members. Thus, it is important for new developers to inves-
tigate the technical and social aspects of a project with regard to the dependencies
that exist among them.
Finally, the current scale of software systems makes the creation of accurate men-
tal models cognitively challenging [38]. Large software projects tend to consist of
millions of lines of code, which may have evolved over decades. Software development
teams also can be large and contains hundreds of people. New developer can easily
get lost in exploring such a code base with a large history of code commits, bug re-
ports, communication records, documentation, etc. Therefore, it is time consuming
and cognitively challenging for novice developers to get a good understanding of an
unfamiliar project. In fact, a study by Zhou and Mockus [48] has found that it takes
at least three years or so for developers to become fluent in their new project.
3.2 Pilot study for initial feedback
To further understand challenges in developer onboarding and to identify the typical
tasks in the onboarding process, I conducted a pilot study with developers performing
onboarding tasks and informal interviews with them to get their feedback.
I recruited four subjects for my pilot study: two professionals (P1, P2) with at least
four years of work experience and two graduate students (S1, S2) in computer science.
22
They were given a set of four tasks that simulated onboarding tasks for a GNOME
project Rythmbox. The first two tasks required subjects to identify similar issues from
the issue tracker (Bugzilla) when provided with keywords about a problem or given
a specific bug, after which they were asked to identify relevant resources to fix those
bugs (e.g., which files to change, which developers to seek help from). The other two
tasks required users to understand the social and technical structures in the project
by investigating the Git repository where the source code for Rhythmbox is hosted
with the mailing list archives of the project. The tasks in my pilot study are similar
to those used in my controlled study and to avoid repetition are described in detail
later. As part of the study, I also solicited feedback about the appropriateness of the
given tasks for onboarding. All four participants found the tasks to be representative.
Subject P1 commented on the tasks in the study:“When I first start my project in my
company, I got a lot to learn. The most difficult part to me was to find someone for
help. I had a hard time deciding who to contact. The tasks I just did are pretty close
to what I worked on when I was a new developer.” Another subject (S1) commented
“I would say these tasks are necessary when a developer joins a new project. This
happens when you try to understand a project.”
Subjects completed the first two tasks in about ten minutes, but none could
identify all related bugs. For example, subject P1 found only one related bug out
of four in Task 1. This was so because he did not try any synonyms of the given
keywords. In the second task I saw a similar issue, where P1 did not extract the
keywords from the given issue or use synonyms for them. When he was asked why he
didn’t try alternative keywords, he responded that he didn’t like to spend too much
time coming up with alternative queries and he often had difficulty in figuring out an
alternative query.

23
While the other subjects performed better than P1, they did not identify all re-
lated bugs either. One of the subjects who had 4.5 years of experience as a Quality
Assurance manager was the most successful in task completion since she tried mul-
tiple synonyms in her search. She commented: “One of my responsibilities when I
worked as QA was to find duplicated bugs. It was always a headache for me to select
appropriate keywords related to an issue. If the search engine supports synonyms and
similar bugs are just a click away, it definitely saves me a lot of time. I can check the
descriptions of similar bugs to locate duplicated ones.”
The last two tasks in the study required investigation of multiple repositories
and could only be partially completed. The professional participants did not have
experience in Git and could not complete the majority of these tasks. The rest
(S1, S2) had difficulty in understanding the semantic relationships across project
entities (social, technical, and socio-technical) since it was not readily available in
the repositories and required some pre-processing. For example, a subject (S2) with
two years of Git experience commented, “I can do the tasks in Git but have to spend
efforts writing long scripts. Some of the tasks involve querying over other databases
like Bugzilla, mailing lists, which would be a headache”.
All subjects found the aggregation, visualization and exploration of entities across
repositories to be extremely useful. Subject P1 commented: “The idea Tesseract
visualizes the relationship between bugs and developers is great. It can give me a
general idea who I should contact whenever I have questions on a bug. Of course, the
features of bug search in Tesseract can also give me more results when I want to find
bugs. Selecting key terms is hard.” Subject S4 commented: “Don’t want to query
different repositories separately. (It)would be very helpful to have these information
aggregated and visualized”

24
3.3 Functionalities to ease developer onboarding
Based on the literature survey and feedback from developers in my pilot study, I
propose a list of functional requirements for tool support of onboarding. The left
column in Table 3.1 shows tool support requirements to address the challenges that
I identified from my literature survey and pilot study.
Table 3.1: Onboarding Requirements and Tesseract Features
# Onboarding Requirements Tesseract Features1 Identification of relevant re-
sources [1, 12]Synonym-based search andsimilar-bugs search
2 Investigation of resources acrossrepositories [2, 32]
Cross-linked displays across dif-ferent project entities
3 Support investigation of semanticrelationships [32, 34]
Semantic relationships (logicaldependencies)
4 Exploration of socio, techni-cal, and socio-technical depen-dencies [32, 16]
Dependencies across files, bugs,developers, and communications
5 Providing high-level overview ofproject structures [34]
Network-centric views
6 Allowing top-down and bottom-up exploration [38]
Explore issues and related re-sources; view project structures
Requirement 1 allows identification of relevant resources, which helps novice de-
velopers to find a good starting point and the relevant resources needed to complete
the starter task. This requirement translates to the improved search capabilities com-
pared to the traditional keyword-based search. Requirement 2 enables investigation of
resources across repositories so that developers do not have to investigate each project
repository separately. Requirement 3 supports investigation of semantic relationships
to help developers capture the implicit semantic relationships between various project
resources. With requirement 4, developers are able to explore the socio, techinal, and
socio-technical dependencies in an aggregated holistic manner instead of performing

25
fragmented explorations in each separate structure. Requirement 5 provides a high-
level overview of the project structures, which is poorly supported by current project
exploration tools [34]. Finally, a tool to support onboarding is required to allow both
top-down and bottom-up exploration of a project. When performing early experi-
mentation, developers tend to find a starting point and expand their focus to relevant
resources in a bottom-up way. However, when developers try to build mental models
of a project, they prefer to start from an overview of the project structure and drill
down into components of interest, which involves top-down comprehension. So an
onboarding tool should support both top-down and bottom-up exploration so that
developers can choose the strategy that suits the context of their exploration.
3.4 Hypothetical scenario of a developer
onboarding
To describe how a new developer when starting a new project might require the
onboarding functionalities that we have outlined in the foregoing section, we present
a hypothetical example.
Let us consider a developer, Ellen, and assume that she wants to start contributing
to an open source project. To do so, she first checks the issue tracker of the project
and finds several open issues. As she is new to the project she wants to start on a task
that only requires small and isolated changes to the code base. Therefore, for each
open issue in the system, she investigates similar and related issues that have been
recently resolved. While doing so, she finds an issue that is interesting, highly similar
to a current issue, and had required changes to only a small subset of non-central
files. She then investigates the files that had been modified for this issue and the
26
developers who were involved in resolving it. To gain an understanding about the
scope of the task, she also investigates whether the files involved with the issue had
other bugs associated with it, or had been modified in the recent past. Finally, before
beginning her task she identifies the developers who had made changes to the files of
interest in case she needs help.
In my example, Ellen first locates a set of related resources (issues) to identify
the appropriate “starter” task for her early experimentation with the code base. To
do so, she searches the issue tracker to identify the right task. She then expands her
focus by investigating related technical and social resources that span multiple reposi-
tories. More specifically, Ellen performs a bottom-up exploration of the project space
by investigating the open and closed issues and the resources associated with these
issues. An alternative (top down) approach could have had Ellen first internalizing
the technical structures (file dependencies) in the project to identify non-central files
and then checking to see whether there were any open issues involving those files.
The key steps to help Ellen onboard are listed in the left column in Table 3.1.
Note that of these, Step 1 largely deals with early experimentation and Step 5 with
creation of mental models. The other steps are needed for both activities. Also
note that research on cognition models and comprehension has shown that effective
comprehension strategies combine both top-down and bottom-up approaches [38],
because of which I include it in my list.

27
Chapter 4
Approaches and Implementation
In this section, I first propose my approaches to support onboarding functionalities by
extending Tesseract, a project exploration tool. I then introduce the basic features in
Tesseract and describe the extensions I have made to Tesseract to support developer
onboarding.
4.1 Approaches to support onboarding
To explore tool support for developer onboarding, I extended a project exploration
tool Tesseract to include features to meet the list of requirements for new developer
onboarding. The right column in Table 3.1 shows features in Tesseract that support
the functionalities required for the onboarding process.
First, different project entities are cross-linked across different repositories and
visualized in Tesseract. This allows developers to investigate the project as a whole
and identify relations between different types of resources without having to explore
different repositories separately. Commit database, bug database and mailing list
archives are mined and aggregated to build a file network, developer network and
28
issue list which are visualized in Tesseract. In addition, these resources are cross-
linked so that developers can explore relevant resources to a specific project entity
without having to query each database separately. For example, selecting a bug in the
issue list, Tesseract highlights the relevant files in the file network and who worked
on this bug in the developer network.
Second, Tesseract mines the project data in different repositories and displays
semantic relationships for developers. For example, Tesseract visualizes the logical
dependency between files in the file network. If two files were committed together
with each other very often in the past, they are considered to be logically dependent
on each other. As we know in practice, files are often tied to each other in some
way if they are created and modified together many times in the source repository.
Another example of an implicit relationship caught by Tesseract is that developers
are considered to communicate with each other if they commented on the same bug.
If two developers commented on the same bug, it is very likely that they checked the
comments made by each other. Such semantic relationships are typically hidden and
take extra efforts and tools to uncover.
Third, Tesseract computes and displays dependencies across files, bugs, developers
and communications. Users can explore these dependencies visually and interactively.
For example, selecting a developer will highlight other developers she communicated
with, files she committed, and bugs she commented on. With only one click, users get
resources relevant to the developers she is interested in, without having to perform
individual queries over each repository. In addition, users can explore further into
the resources relevant to the selected developer, such as the issues he or she worked
on in the past.
Fourth, network-centric views of project resources are provided in Tesseract so that
developers can understand project structures from high-level overviews. Tesseract

29
visualizations include file network, developer network, issues overview, and activity
overview. These views are explained in detail in Section 4.1. With these high-level
overviews of project structure, new developers can get a holistic understanding of the
whole project. For example, the developer network allow users to easily understand
the social structure, find the social hubs that most developers communicate with, and
how each developers are related to each other.
Fifth, I enhanced resource finding to improve identification of relevant resources
in projects, which is the most important extension I have done to Tesseract. With
synonym-based search and similar-bugs search, Tesseract allows developers to effi-
ciently find an interesting starter task and the relevant resources for that task. With
synonym expansion (indexing a term as well as its synonyms), synonym-based search
allows users to search for a keyword as well as its synonyms by querying over a single
keyword. Thus users get more results relevant to the keywords in a query. Similar-
bugs search recommends a list of bugs similar to a current bug that the developer
has selected. The search engine takes the description of the current bug as a query,
calculates the similarity between the descriptions of all other bugs and the description
of this bug, ranks the bugs by the similarity and returns a number of top-ranked bugs
to users. With these additional advanced search features, new developers don’t have
to spend much time coming up with exact queries or trying alternative queries to
search for a relevant resource.
Finally, both top-down and bottom-up exploration of project resources are sup-
ported in Tesseract. For example, given a bug to fix for early experimentation, de-
velopers can explore issues bottom up by searching for details of a bug and identify
relevant bugs to that bug, files and developers. Developers can also understand a
project by top-down mental modeling. For example, a new developer may want to
get to know more about the key players in the project team since the key players
30
tend to be familiar with the project and new developers can turn to the key players
for help when encountering difficulties. To do this, a developer can check the whole
structure of the developer network and find the key player in the developers network.
They can then explore the developers this key player communicated with and files
committed by this developer. By doing this, a new developer knows who are key
players and what part of the project they have expertise on, which will help the new
developer to find someone for help later.
4.2 Introduction to Tesseract
Figure 4.1: Tesseract UI showing four displays: (a) project activity pane with code com-mits(top) and communication(bottom), (b) file network, (c) developer network, and (d)issues pane
31
In my study of onboarding I use Tesseract [32], an interactive project exploration
tool, as a platform of choice because its built-in features already provide many of
the key requirements identified in Section 3. With its interactive, cross-linked dis-
plays (see Figure 4.1), Tesseract already supports (see Steps 2 to 6 in Table 3.1):
investigation of resources across repositories; investigation of semantic relationships;
exploration of socio-technical dependencies; high-level overview of project structures;
top-down and bottom-up exploration. Details of this support will be explained after
the brief introduction of Tesseract.
Tesseract is a tool for interactive visual exploration of socio-technical dependen-
cies in software engineering projects [32]. It analyzes code archives, communication
records, and bug databases to capture the relations between code files, developers,
and software bugs. Specifically, Tesseract displays overall project activities(commits
and communication), file dependencies(logical coupling between files that have been
checked in together), social dependencies(dependencies between developers who have
edited the same file or commented on the same bug), bug history, and the interde-
pendencies between files, developers and bugs. It allows users to investigate a project
from different perspectives and get a holistic view of the project. Figure 4.1 shows the
screenshot of the user interface of Tesseract, which includes four primary displays:
1. The Project activity pane (Figure 4.1(a)) includes a project selection list and a
time series display of overall activities in the selected project. Users can select
a project from a drop-down list of available projects and then choose a time
period from the date slider to explore this project. The date slider is part of
the time series display and sets a start date and an end date of the time period
that users want to explore. Tesseract populates other panes with file network,
developer network, and bug data corresponding to the selected date range. The

32
distribution data in the times series display provides an overview of project
activities, with frequency of code commits on top and communications at the
bottom.
2. The Files network pane (Figure 4.1(b)) presents a network of dependent files
based on logical dependencies [17], that is, files that have been frequently
changed together in the past are considered to be interdependent. Users can set
a threshold of the times two files have been committed together in the selected
time period for them to be considered interdependent. Files that have been
committed together less than the threshold are not considered to be interde-
pendent. The number of times two files are committed together is represented
by the thickness of the edges in the network. A textual listing of the file names
is provided at the right hand side to allow quick identification of specific files
by name. It also allows users to search for a file by name in the file list.
3. The Developers network pane (Figure 4.1(c)) displays the social dependencies
among developers based on their communications with each other as recorded
in mailing lists or comments and activities in the issue tracker. There are three
kinds of edges in the developers network: coordination behavior, coordination
requirements, and congruence. The communication behavior in the project is
based on communication activities in the mailing lists and bug database. Specif-
ically, when developers participate in email discussions, comment on a particular
bug/issue in the Bugzilla database, or work on a particular bug/issue they are
considered to have communicated with each other. Coordination requirements
are calculated based on the methodology developed by Cataldo et al [9], where
developer to developer dependency is calculated based on the underlying logi-
cal coupling among the artifacts (i.e., files that have been committed together).

33
Congruence is defined as a match between the coordination requirements and
the coordination behavior of a team, where developers who are working on inter-
dependent artifacts are meant to coordinate with each other. The coordination
behavior link is compared with the coordination requirement link to calculate
congruence. When the communication link matches the coordination require-
ment link, the edge between two nodes in this graph is colored green. When the
communication link is missing the edge is colored red representing a gap. When
there is an extra communication link (i.e., two developers have communicated,
but not worked on coupled artifacts), the edge is colored grey. The developer
network panel provides two controls. The thickness of the edges is derived from
the number of times developers communicated with each other. This display
can also be used to present the impact network among developers because of
their underlying work dependencies. That is, if two developers are working
on files that are interdependent, changes by one developer might impact the
changes made by the other developer. Similar to the file network, it provides a
textual listing of the developer names and supports search by developer name.
4. An issues display (Figure 4.1(d)) that lists open issues or feature enhancements
in the issue tracker along with a stacked area chart view of the issues. Bug
information is shown in the Issues pane if the bug was active in the time range
selected by the date slider in the project activity pane. The stacked area chart
in the Issues pane displays the number of open bugs in the selected time range.
Bugs are classified according to severity and displayed in different colors in the
stacked area chart. The bug list under the stacked area chart provides fur-
ther information on open bugs in the selected time period. Users can check
the opened date, the closed date, and the description of a specific bug. Sever-
34
ity indicates the severity of bugs, such as “Blocker”, “Critical”, “Minor”, etc.
Severity is a status assigned by the core developers in the project. Each bug
has a Status, which can be “NEW”, “ASSIGNED”, “RESOLVED”. It shows the
status of the bug as reported by the developer working on it. Frequently bugs
undergo different stages: open, change in status, close, and resolve. Resolution
is the final decision about how the bug was resolved. For example, the final
status of a bug can be “FIXED”, “DUPLICATE”, “INVALID”.
The four displays are cross-linked and, therefore, allow interactive explorations of
underlying relations across project entities. Users can select a bug in the issues pane,
which will highlight the developer to whom the bug was assigned, the developers who
had communicated regarding that bug, and the files that had been changed as part
of the bug fix. Using this information along with the file dependencies graph, users
can identify bugs that involve files that are non-central and appropriate for them.
Further, clicking on a file highlights the developers who have edited the files in the
past and could serve as possible experts from whom they can seek help. In this way,
users also interact with the socio-technical relationships among various resources in
the project. Tesseract allows users to explore semantic relations by displaying the
implicit relations identified from data across different repositories, for example, the
logical coupling of files and congruence in communication among team members. The
overall activities displayed in the Project pane and network visualization enable users
to get a holistic view of the project. The date range selection and drill down features
in the visualization enable users to understand the project either top down or bottom
up.
Tesseract has been designed as a client-server application with a rich web client.
Its architecture is shown in Figure 4.2 [32]. Server side Tesseract is a data extractor.

35
Figure 4.2: Tesseract architecture: a client-server application
It collects and extract project data from code archives, communication records, and
bug databases. Client-side Tesseract consists of the data analysis and visualization
components, which can be grouped as model, view, and bindings. The data model
stores preprocessed relational data from server, current selection and drill down data
in the application, and filter settings specified by users. View includes the various user
interface components: bar chart, table, stacked area chart, and graph visualization.
Bindings exist between model and view components as well as among model com-
ponents. Data displayed in view components is bound to model data. Data binding
among model components exists when model data depends on preprocessed relational
data and user configuration data. For example, file network data is recalculated if
users change the file commit threshold setting.

36
Figure 4.3: Information flow for Tesseract
Figure 4.3 [32] shows the underlying information flow in Tesseract. Data collection
and extraction are done at the server side while data analysis and visualization are
done at the client side. In the collecting phase, Tesseract collects data from a source
code management system, one or more project mailing lists, and a common bug
or issue tracking database. The collection of data is then extracted and crossed-
linked in the extracting phase. The cross-linked data is stored in a small set of
XML files. On the client side, those XML files are analyzed in the analyzing phase to
capture (1) relationships among files, developers, and bugs, (2) coordination behavior,
coordination requirements and congruence among team members. The filtering phase
manages information overload by allowing users to set time period, thresholds and
communication patterns. The socio-technical relationships are finally visualized in
the visualizing phase.

37
4.3 Extensions to Tesseract to support
onboarding
While the basic functionalities of Tesseract could help in onboarding, a few require-
ments in supporting early experimentation and internalizing structures were missing.
First, the search capability in Tesseract was very limited. The original implementa-
tion of Tesseract only supports keyword-based search over file names and developer
names. The search engine returns results that matches the queried terms exactly and
it does not allow search over bugs. Second, the original Tesseract has scalability issues.
Most projects have hundreds of project artifacts. Visualizing such large numbers of
nodes can easily lead to overlap, which makes it hard to understand the network and
interact with it. The same issue happens to the developer network when there are
many active developers in the software development team. Further, there are multiple
types of files in a large project but users may want to explore certain types of files.
The original Tesseract does not support such file type filters and cognitive overload
still exists with years of data in a project. Third, navigation in Tesseract could be
more user friendly. For example, it is difficult for users to find the right time period
to explore since there is little time-related information besides the dates spreading
over years. Additional release information may help users to know more about the
dates they want to explore.
4.3.1 Enhanced resource finding with synonym-based
search and similar-bugs search
One of the key requirements in early experimentation is finding the right “starter”
tasks (Table 3.1, row 1). For this, I extended Tesseract [46] to include synonyms ex-

38
pansion of keywords and document-similarity search (Figure 4.1(d)). That is, Tesser-
act can now identify bugs in the database that are similar, but do not contain the
exact phrasing as the keywords in the query. The results of the search are ordered
based on their closeness to the original query terms and cross-linked to other resources
such as related files, contributing developers, etc., through the Tesseract UI. For ex-
ample, if users search for bugs that dealt with “playback crashes”, the results (see
Figure 4.4) would include bugs with descriptions containing the keywords “crash” and
“playback”, as well as “freeze” and “hang”, which are synonyms of “crash”. Similarly
if users select a bug from the list, the results include synonyms of keywords in the
description.
Figure 4.4: Search over bugs in Tesseract with keywords “crash playback”
4.3.2 Information retrieval techniques used
To help developers with resource identification during their onboarding process, I
enhanced the search capability by taking advantage of two information retrieval tech-
niques: synonym expansion and document similarity search [46]. Synonym expansion
is the process of expanding a word to its variants at either query or indexing time.
For example, “crash” can be expanded to “freeze, hang, die” in the context of soft-

39
ware bugs. I then have to keep a record of the synonyms sets, which is typically done
by creating a thesaurus. In my case, I index a word in a document along with its
synonyms if the queried word exists in the thesaurus. Details about the thesaurus
will be explained in the following section.
Document similarity is a technique that uses different heuristics to retrieve a
ranked listing of documents that are similar to a query document [45]. A similarity
heuristic is a mechanism that assigns a numeric score indicating how closely a doc-
ument is related to the queried document [49]. In my implementation, I follow the
Cosine Similarity measure based on the vector space model [28] to retrieve similar
documents. More specifically, documents and queries are modeled as n-dimensional
elements of a vector space (w1, w2, wn), with n being the number of index terms and
wi reflecting the importance of each term i in document or query. As noted in Equa-
tion 4.1, term weight wi is calculated as the product of term frequency (tfi) and
inverse document frequency (idfi).
wi = tfi × idfi (4.1)
idfi is calculated as in Equation 4.2 with D referring to the total number of
documents and dfi being the number of documents with the occurrence of index term
i.
idfi = log(D
dfi) (4.2)
Using the vector representation of documents and queries, the Cosine similarity
between a query and an indexed document is calculated based on Equation 4.3.
Sim(q, d) =
∑ni=1wqiwdi√∑n
i=1w2qi×∑n
i=1w2di
(4.3)

40
4.3.3 Implementation of synonym-based search and
similar-bugs search
I built the search features in Tesseract using Solr, an open source search platform [37].
The search feature is composed of five phases: analyzing, indexing, searching, query-
ing, and reporting (see Figure 4.5). In the analyzing phase, the search engine retrieves
bug data from the Bugzilla database, and analyzes and preprocesses the data through
the following steps: (1) stemming, (2) filtering out stop words, and (3) synonym
expansion. Stemming is the process for reducing words to their root. For example,
“worked”, “working” can both be stemmed to “work”. Filtering out stop words refers
to filtering out words such as “and”, “a”, “the”, that provide little lexical meaning
to improve performance. Synonym expansion is explained later in this section. The
analysis phase consists of first parsing the descriptive text of a bug into a bag of words
(an unordered collection of words). In the indexing phase, the bag of words corre-
sponding to a specific bug is indexed as a distinct document, which is then used in
the search phase. Note that synonyms for each term in the bag of words are retrieved
from a synonym thesaurus and indexed. In the query phase users can either query
by key terms of a software feature or search for a similar bug by selecting a specific
bug from the UI. Finally, in the reporting phase, search results are displayed based
on a ranking of their closeness to the search query (see Figure 4.4).
An important component of the search feature in Tesseract is the synonym-based
search. The first step for synonym-based search was to create a synonyms thesaurus.
The bug descriptions of a particular project in Gnome were manually analyzed to
determine synonyms, which were then added to the thesaurus. For example:
1. mute, silent

41
Figure 4.5: Information flow in search engine
2. view, display
3. crash, freeze, die, not working, doesn’t work
4. delete, remove
Manually creating the thesaurus was time consuming, but it is a resource that can
be reused for other software engineering projects. It took me about twenty hours to
analyze 2288 bug records in a project to create 100 synonym entries. Note that there
are available resources such as WordNet [47] a large lexical database of English, and
ConceptNet [11] a common sense knowledge base that can be used to expand queries
by identifying synonyms of search terms. However, these libraries are largely created
for the English language and not highly suitable for software engineering contexts.
The next step in the process is synonym expansion, which is performed during the
analyzing process. That is, when a term generated from a bug description is being
indexed the analyzer first checks whether the term has any synonyms in the thesaurus.
If it does then all its synonyms are also indexed as terms. Because of this, when a
search is performed all documents that contain the query terms or their synonyms
are retrieved. Once a set of query results have been obtained they are ranked based

42
on the closeness of their (bug) descriptions to the original query. More specifically,
I use Cosine similarity (see Equation 4.3) to identify the similarity between the bug
description and the query and rank the resultant bug reports accordingly.
The similar-bugs search follows a comparable approach, the main difference being
that a user selects a specific bug from the bugs pane list (see Figure 4.1(d)) instead of
searching over specific query terms. When a user selects a particular bug, the search
engine retrieves the description of the selected bug from the Bugzilla database using
the bug ID. It then parses the description and converts it into a bag of words, which
are considered the key query terms for the search. The rest of the process is exactly
the same as synonym-based search. Once the search engine recommends the “similar”
bugs, users can investigate the resultant bugs as well as explore other similar bugs
from the result set. The user interface of the similar bugs recommendation report is
shown in Figure 4.6.
Figure 4.6: Similar bugs recommendation in Tesseract when Bug 7589 has been selectedby users
4.3.4 Integration of search features into visual exploration
Implementing the search features required us to make modifications to the original
Tesseract architecture. Figure 4.7 shows the additions to the original architecture

43
through the highlighted modules. Specifically, the search application server and index
was added at the backend, new models on bug query and filters were added, and two
new UI components were implemented (bug query, bug report).
Figure 4.7: Integration of bug search into Tesseract
Additionally, Tesseract now displays more details on bugs (see Figure 4.8). De-
velopers can select a bug and explore details of the bugs, such as all comments from
developers, past activities related to bugs, etc.
The interactive project exploration feature provided by Tesseract sets it apart from
other existing bug-search tools. Using the search features in Tesseract new developers
can visually explore a particular feature, code component, or a bug. They can now
easily explore the vast project space to identify other related bugs or feature fixes,
the files and developers that were connected to a bug (or related bugs), developers
who discussed a bug and have the required expertise, and so on.

44
Figure 4.8: Display of bug details in Tesseract
4.3.5 Enhanced visualizations and navigation to solve
scalability issue
The original visualization in Tesseract has a couple of limitations. First, the visual-
ization of file network and developer network have scalability issues. When there are
hundreds of files in the file network, nodes in the network visualization tend to crowd
together or even overlap each other (see Figure 4.9(a)). This makes it hard for users
to select a node that they are interested in. Second, too many nodes in a visualization
can lead to cognition overload on users. There may be thousands of files in the file
network in the entire project. Users may be interested in only a few files in a specific
package and not want to explore many other files. Third, there is little information
on the nodes in the network visualization. Users may want more information to get
to know a file node in the network, such as the physical location of a file in the file
system, and the number of files often committed with a file. However, users only
know the corresponding file name of a node in the file network. They don’t know the

45
name of the parent directory or package of a file node. Neither do they how many
files are related to a specific file. Further, users have to check each edge to get files
related to a file node. To resolve these issues, I have extended Tesseract to include
more features in network visualization.
Figure 4.9: (a) Original file network visualization with scalability issues vs. (b) updatedfile network visualization (2002-06-26 to 2003-02-05)
Figure 4.9(b) displays the file network in the same date range (June 26, 2002 to
February 5, 2003). The default display for file-dependencies now lists dependencies
across packages, denoted by square-shaped nodes. If two files depends on each other
because they were committed often, their corresponding packages are also related to
each other. By grouping file nodes in their corresponding package, there are much
fewer nodes in the file network. Package level dependency also reduces the cognitive
load on developers since it allows developers to explore a specific package instead
of displaying all the files in the file network. Drilling down into a package node
recursively lists its constituent components (files or sub-packages). Such a view can
help new developers to quickly recognize the critical components in the system and
get an overview of the system structure.

46
Figure 4.10: Tesseract UI with extensions
Furthermore, Tesseract now provides more relevant information directly to users
by adding more information in tooltips. For example, when users investigate the
network view of files and developers, the network visualization displays additional
information about a node in the tooltip. As shown in Figure 4.10, hovering over a
package node lists its constituent files, its neighboring nodes, and a centrality measure
(number of relations to other files).
Another difficulty when users explore a project using Tesseract is to find and select
the appropriate time period they want to explore. The original implementation of
Tesseract only provides a way for users to select a starting date and an ending date of
a time period they are interested in. However, new developers are unfamiliar with the
project and may not be able to find an exact date of interest. In practice, developers
are more likely to explore a specific release, for example, a release that a bug is active
in.

47
To better navigate through various project resources, Tesseract now has its time
series display annotated with release dates (see Figure 4.10), which can then be used
to investigate a particular period in the project. The release dates are marked on the
date selection slider so users know which release a specific date is in when they select
a time period to explore. Additionally, users can quickly jump into a corresponding
release of a selected bug to explore relevant resources in the project. As shown in
Figure 4.10, users can double click a bug entry in bugs list to directly jump to its
corresponding release which it was active.
4.3.6 Filters to reduce cognition load
Cognitive overload can be a common problem for new developers when they onboard a
large project because of their unfamiliarity with the project landscape [12]. While the
network-centric displays of Tesseract alleviates this problem to an extent, I enhanced
the Tesseract UI to further facilitate exploration of large projects.
I have implemented a file type filter for the file network display (see Figure 4.9(b)).
When performing early experimentation tasks, developers can now choose to only view
a specific type among source code files (i.e., filter out files with extensions that are
not .c or .h). Such filtering can greatly reduce the visual complexity of the networks.
Since there can be thousands of bugs in a repository, the search engine may return
hundreds of bugs for a single query, which increases the cognitive overload on users.
I added a date range filter and bug severity filter as advanced features to the search
engine in Tesseract. The search engine now allows users to search for bugs over a
date range they choose. It also allows users to search for bugs with particular severity
types, for example, “Critical” bugs. In addition, users can limit the number of results
displayed in the bugs listing.
48
4.3.7 Summary
In summary, I implemented the following extensions to support developer onboarding
in addition to the built-in features of Tesseract.
First, to improve the search capability in Tesseract, I implemented a search engine
with synonym-search and similar-bugs search. A bug search query in Tesseract now
returns more results with the query terms as well as their synonyms. A similar bugs
search feature helps users find more bugs relevant to a specific bug by searching for
bugs with a similar description. The search engine is further integrated into the
visualization in Tesseract so that users can interactively explore bugs in the search
results.
Second, I enhanced the visual exploration in Tesseract with package-level depen-
dencies in the file network and a couple of filters to improve the scalability and reduce
the cognitive load for users. In the file network, Tesseract now allows files in the same
directory / package to be grouped into a package node, which reduces the density of
the nodes in the file network and solves nodes overlapping issues to some extent. Users
can drill down into a package node to explore files or sub-packages in it. Tesseract
now allows users to select files by types to be displayed in the file network. The
advanced features of the search engine provides date range selector and bug severity
filter to limit the number of results in a query over bugs.
49
Chapter 5
User Study
I empirically evaluated the onboarding functionalities as well as the Tesseract features
that support developer onboarding through user studies. I ask two broad research
questions to evaluate the effectiveness of Tesseract in helping onboarding.
RQ1. How does enhanced resource identification help developers in their early exper-
imentation tasks?
RQ2. How do visual explorations of technical, social, and socio-technical dependencies
help developers to gain an understanding of the project’s internal structure?
RQ1 investigates how Tesseract helps with early experimentation tasks, while
RQ2 deals with creation of mental models. Note that while the advanced search
functionality is geared towards early experimentation tasks and the network visual-
izations towards creating mental models, the remaining features from Section 3.5 are
pertinent for both.
In the rest of the section, I first describe my experiment settings and evaluation
model. I then present details of the experiment procedure and study results.

50
5.1 Experiment settings
Based on my pilot studies, I refined the user tasks and the Tesseract UI before per-
forming controlled user experiments, which were conducted at the usability lab at the
University of Nebraska-Lincoln and involved twenty participants. In the experiment,
participants first filled out a background questionnaire and then were led through a
tutorial explaining Tesseract and its features, which was followed by the actual tasks.
At the end of the experiment participants filled out an exit survey and were inter-
viewed (semi-structured). Each participant was paid twenty dollars for taking the
experiment. Details of the tutorial and tasks are available in Appendix A.
Among the twenty participants, fourteen were male and six female. All were
students in the Computer Science and Engineering department at the University of
Nebraska-Lincoln. Of the twenty participants fifteen were graduates and the rest ad-
vanced undergraduate students. Most students were adept at programming; fourteen
of them had more than three years of coding experience. Participants had experience
using versioning systems (twelve had used SVN and eight CVS) and issue trackers.
All of them had worked in teams and two of them had experience working with a
GNOME project. All participants were familiar with searching and used a search
engine almost every day.
Table 5.1: Experiment Design
Phase Task Task Type ParticipantsCtrl Exp
Early ExperimentationTask 1 Identify related bugs 10 10Task 2 Identify related features 10 10
Creating mental modelsTask 3 Internalize file structure 20Task 4 Internalize social structure 20

51
The experiment was designed in two phases (see Table 5.1). The first phase
evaluates the efficacy of Tesseract in helping developers find and expand focus in
early experimentation, while the second phase evaluates Tesseract in building mental
models of technical and social structures in a project. An alternate, single-phase
design could have required participants to resolve a bug by first searching for similar
bugs and then understanding the project structures. However, this could have several
issues. First, participants could have simply resolved the bug without performing
any early-experimentation strategies. Second, the quality of bug resolution would be
affected by individual differences caused by differences in experience or skills among
participants. Finally, because of time restrictions that govern user studies I could
have only assigned simple bugs, which in turn might not have required an in-depth
understanding of the project structures for their resolution, thereby, defeating the
goal of my study. Therefore, I separately test the early experimentation and mental
model tasks in two phases (see Appendix A for more details about user study tasks).
The first phase included two tasks, where subjects were asked to search for past
bugs similar to a given issue in the code base of the Rhythmbox project. They were
then asked to identify other related project elements (files edited, developer informa-
tion, etc). This phase involved two treatment groups and a between-subjects experi-
ment design. Participants were randomly assigned to the treatment groups (Control
or Experimental). The Control group used basic Tesseract with keyword-only search,
while the Experimental group had access to the synonym-based search feature. I
do so to evaluate how advanced search functionalities, currently unavailable in issue
trackers, can be of help in onboarding. Another alternate design could have required
participants in the Control group to use Bugzilla and other repositories. However,
based on my pilot study I felt that this would highly bias the experiment in favor of
Tesseract. Yet another option could have compared Tesseract with DebugAdvisor [1],

52
a cross-platform search-based tool. However, DebugAdvisor is a commercial tool and
requires significant manual configuration by the user to link project elements. I leave
such a comparative evaluation for the future.
The second phase of the experiment was a single treatment study with the main
goal to evaluate how visual explorations afforded by Tesseract help in understand-
ing project structures. Tasks in this phase asked participants to use Tesseract to
identify central developers, their contributions, social hubs in the project, and so on.
My experiment only uses a single treatment variable, since I am not aware of any
other project exploration tool that presents all the information provided in Tesseract.
Designing an experiment that required users to investigate project structures by an-
alyzing separate repositories would not have been a fair comparison; as corroborated
by my observations in the pilot study.
Each experiment phase consisted of two tasks, which were counterbalanced. For
example, in the “early experimentation” phase, participants were randomly assigned
either Task 1 or Task 2, followed by Task 2 or Task 1, respectively. Participants
were asked to playact as new developers who wanted to start to contribute to the
Rhythmbox project. The experiment tasks were phrased to create such a context.
The “early experimentation” phase involving Task 1 and Task 2 asked participants
to search for related bugs. Task 1 required participants to find all bugs related to a
problem with the Rhythmbox application (“the application crashes repeatedly when
you remove songs”). Additionally, they were required to identify relevant files for
resolving the bug, as well as developers who were involved with a similar bug in the
past and could help in its resolution. Task 2 was similar, but this time the context
was that the developer wanted to fix a particular bug (bug id: 8077) and needed to
identify similar or related bugs. As in the previous case, participants were asked to
identify relevant files and developers. As they performed their tasks, subjects noted

53
the bug ids of bugs that they thought were similar and took screen shots of the
networks with the relevant artifacts or developers highlighted.
The “mental model building” phase (Task 3 and Task 4) assessed how Tesser-
act helped participants in understanding project structures. Task 3 focused on the
technical structures, requiring participants to identify the central files in a given re-
lease, identify other files that were related to one of the central file (“rb-shell.c”),
and identify the developers who had edited that file in the past. Task 4 was similar,
but instead focused on the social structure. It required participants to identify the
central developers in the communication network, developers who had communicated
with one of the central developers (“Colin Walters”), and the files that “Colin” had
edited. Subjects noted the names of relevant entities and took screen shots of the
networks with relevant entities highlighted as they performed their tasks.
Note that the “mental model building” tasks do not build on the search results of
the “early experimentation” tasks. I explicitly split the tasks into the two phases, so
that any differences in results of Phase I would not have ripple effects on the outcome
of Phase II, especially since Phase I had two treatment groups and Phase II was a
single-treatment study.
The entire experiment was logged through screen captures, and exit interviews
with participants were audio recorded. Quantitative dependent measures such as,
time-to-completion, error rates, correctness and completeness rates were calculated
by analyzing the screen captures and answers recorded by users. Qualitative data on
user experience was obtained by analyzing screen captures, observation by researchers,
and exit interviews.

54
5.2 Evaluation design
I draw on the usability framework proposed by Hornbaek [20] to evaluate the us-
ability of Tesseract in facilitating onboarding. Hornbaek reviewed current practices
in usability measurements by surveying 180 usability studies in the field of Human
Computer Interaction (HCI) to present a working model for usability aspects and
research challenges associated with measuring each aspect. Hornbaek recommends
keeping distinct objective and subjective measures for each aspect and recommends
the types of questions and measures to consider when designing a usability study,
which I follow.
My evaluation model (see Figure 5.1) tests Tesseract using the three main usability
aspects: effectiveness, efficiency, and user satisfaction [14]. Effectiveness measures
whether the user can complete tasks, which is evaluated with error rates and number
of assists. Efficiency measures the effort it takes to complete the tasks and is often
evaluated with time to completion of tasks. User satisfaction measures the participant
opinions and attitudes about the product, which can be assessed with satisfaction
ratings, questionnaires, and user comments. Note as per Hornbaek, I include objective
and subjective measures for both effectiveness and efficiency.
Effectiveness refers to the quality of the outcomes. In my experiment, outcomes
are evaluated based on: (1) correctness and completeness rates, (2) error rates, and
(3) subjective evaluations of Tesseract. More specifically, I calculated the correct-
ness and completeness rates for “early experimentation” tasks (Tasks 1, 2) and error
rates for “mental model building” tasks (Tasks 3, 4). Subjective evaluations of how
Tesseract facilitated resource identification and understanding of a project and its
interrelationships were collected for tasks (see Table 5.6).
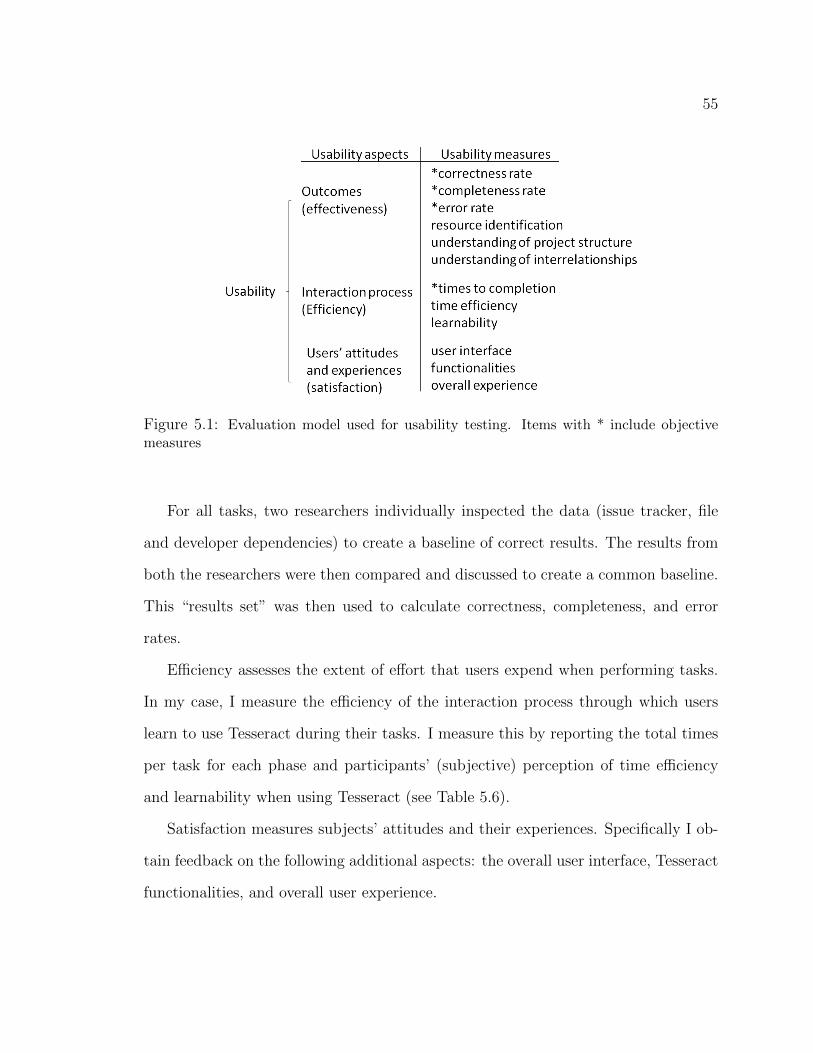
55
Figure 5.1: Evaluation model used for usability testing. Items with * include objectivemeasures
For all tasks, two researchers individually inspected the data (issue tracker, file
and developer dependencies) to create a baseline of correct results. The results from
both the researchers were then compared and discussed to create a common baseline.
This “results set” was then used to calculate correctness, completeness, and error
rates.
Efficiency assesses the extent of effort that users expend when performing tasks.
In my case, I measure the efficiency of the interaction process through which users
learn to use Tesseract during their tasks. I measure this by reporting the total times
per task for each phase and participants’ (subjective) perception of time efficiency
and learnability when using Tesseract (see Table 5.6).
Satisfaction measures subjects’ attitudes and their experiences. Specifically I ob-
tain feedback on the following additional aspects: the overall user interface, Tesseract
functionalities, and overall user experience.

56
5.3 Results and discussion
I present and analyze my experiment results by first discussing the early experimen-
tation tasks, followed by mental model building tasks and my qualitative results.
Early Experimentation: A key step in early experimentation is to identify the
right resources, which in my case translates to identifying a robust, initial set of
bugs with which to begin investigations (see Table 5.2). For Task 1, I found eight
related bugs from manual inspection of bug descriptions. However, the system when
using synonym-based search (Experimental group) identified five bugs, which dropped
down to three bugs with keyword-only based search (Control group). Similarly, for
Task 2, manual analysis of bug descriptions revealed eleven bugs, whereas the system
with synonym-based search found ten, which dropped down to seven without it. A
key reason for the difference between the number of bugs identified by the search
engine and the researchers using manual analysis was the lack of context available
to the search engine. For example, in Task 1 subjects had to fix a bug because the
application crashed when a song was removed. The keywords extracted from such a
definition are: crash, song, and remove. However bug descriptions that used file or
playlist instead of song (e.g., “crash on deleting file or playlist”) were ignored by the
system. Similarly when a bug description used seg fault instead of crash, Tesseract
did not detect this. While some of these misses can be corrected by fine-tuning the
thesaurus (include seg fault as a synonym for crash), others are context dependent
(here file equaled song) and cannot generalize across projects. In the future I will
explore including machine learning to self-augment the thesaurus.
Table 5.2 provides the maximum and average bugs discovered by subjects in both
treatment groups. Typically, the maximum number of bugs identified by a partici-
pant is equal to the maximum number of bugs extracted by the system (Control or

57
Table 5.2: Summary of number of related bugs found in Task 1 and Task 2 byresearchers(Max), the system(System), and subjects(average and maximum) for bothtreatment groups
Control ExperimentalTask Max System Avg. Sub max System Avg. Sub maxT1 8 3 3.3 4 5 4.5 6T2 11 7 6.4 7 10 8.3 10
Experimental group). However, there were two cases in Task 1, one each in Control
and Experimental groups, where a subject tried different query phrases and identified
an additional bug (row 1, column 5 and 8).
To assess the effectiveness of Tesseract in identifying relevant resources I calculate
the completeness and correctness rates for tasks (T1 and T2, see Table 5.4), which
evaluates the quality of the bug search results. For each bug in the search result, I
calculate error rates to evaluate how well subjects identified related files and develop-
ers. Table 5.3 lists the terms used for for calculating the completeness and correctness
rates.
Table 5.3: Terms used for completeness rate and correctness rate
Term Short DescriptionTrue positive TP A bug correctly classified as relevantTrue negative TN A bug correctly classified as irrelevantFalse positive FP A bug wrongly classified as relevantFalse negative FN A bug wrongly classified as irrelevant
The correctness rate is calculated as the number of correct classifications divided
by the total number of classifications (TP/(TP + FP )). The completeness rate is
calculated as the number of true positives divided by the total number of true positives
and false negatives (TP/(TP + FN)).
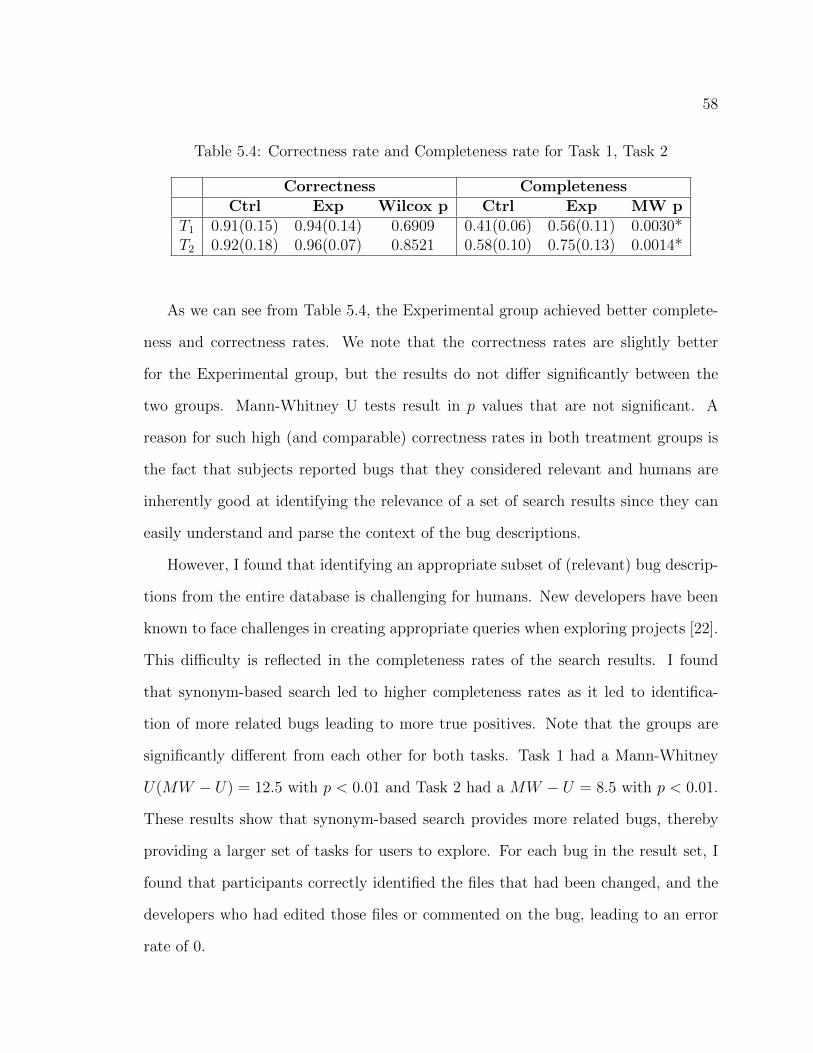
58
Table 5.4: Correctness rate and Completeness rate for Task 1, Task 2
Correctness CompletenessCtrl Exp Wilcox p Ctrl Exp MW p
T1 0.91(0.15) 0.94(0.14) 0.6909 0.41(0.06) 0.56(0.11) 0.0030*T2 0.92(0.18) 0.96(0.07) 0.8521 0.58(0.10) 0.75(0.13) 0.0014*
As we can see from Table 5.4, the Experimental group achieved better complete-
ness and correctness rates. We note that the correctness rates are slightly better
for the Experimental group, but the results do not differ significantly between the
two groups. Mann-Whitney U tests result in p values that are not significant. A
reason for such high (and comparable) correctness rates in both treatment groups is
the fact that subjects reported bugs that they considered relevant and humans are
inherently good at identifying the relevance of a set of search results since they can
easily understand and parse the context of the bug descriptions.
However, I found that identifying an appropriate subset of (relevant) bug descrip-
tions from the entire database is challenging for humans. New developers have been
known to face challenges in creating appropriate queries when exploring projects [22].
This difficulty is reflected in the completeness rates of the search results. I found
that synonym-based search led to higher completeness rates as it led to identifica-
tion of more related bugs leading to more true positives. Note that the groups are
significantly different from each other for both tasks. Task 1 had a Mann-Whitney
U(MW − U) = 12.5 with p < 0.01 and Task 2 had a MW − U = 8.5 with p < 0.01.
These results show that synonym-based search provides more related bugs, thereby
providing a larger set of tasks for users to explore. For each bug in the result set, I
found that participants correctly identified the files that had been changed, and the
developers who had edited those files or commented on the bug, leading to an error
rate of 0.

59
Next I analyzed the time-to-completion of tasks to investigate whether Tesser-
act (with synonym-based search) increases efficiency. Table 5.5 lists the time-to-
completion for all tasks. In the case of Task 1 and Task 2, I do not find any signifi-
cant differences between the treatment groups. However, subjects in the Experimental
group had identified more bugs (4.5 bugs vs. 3.8 in Task1 and 8.3 bugs vs. 6.4 in
Task 2) and investigated the resources associated with those bugs. So, I analyzed the
efficiency rate or the time taken per bug across the two groups. I again found the two
groups to be comparable. For Task 1, the Control group took 94.7 seconds per bug,
while the Experimental group took 65.49 seconds per bug. The two groups only differ
marginally (MW-U = 27.5 and p=0.096). In Task 2, the treatment groups were even
closer (Control: 48.83 sec, Experimental: 48.23 sec) with no significant differences.
Table 5.5: Time-to-completion(in minutes) for Task 1 through Task 4
TasksCompletion times(minimum)
Ctrl Exp MW p-valueT1 4.91(2.195) 4.65(1.175) 1.000T2 5.21(2.029) 6.67(2.047) 0.1051T3 5.49(1.791) n/aT4 5.75(1.146) n/a
Despite the closeness in the efficiency rates, I found that subjects in the Control
group made more attempts in formulating search queries. However, due to the limited
complexity of my tasks, extra queries were easy to formulate and did not temporally
disadvantage subjects. For example, Participant P2 when formulating the search
query for Task 1, first used the query “crash”, which resulted in too many results,
she then modified the query to “crash + song”, which still resulted in a very large
set. She then used “crash + remove + song” which resulted in a null set. She then
changed the query to use delete instead of remove, which produced the resultant set

60
that she finally investigated. So, while this subject had to modify her query four
times, she did it in rapid succession as she was well versed in searching.
Mental model building : This phase included tasks that assessed how interactive
visual explorations provided by Tesseract enabled users to understand the technical
and social project structures and dependencies.
The primary goal in Task 3 was to understand the technical structure in the
project and constituted three steps, requiring users to first understand the general de-
pendency structures in the project followed by “drilling down” on the socio-technical
dependencies surrounding an artifact. More specifically, subjects had to first identify
the central artifacts in the file-dependency network as determined by the number
of edges (degree centrality) connecting the node. One of the central files was “rb-
shell.c”, followed by two other nodes. These files had around fifteen neighbors each.
Subjects were then asked to drill down on “rb-shell.c” to identify which other files
were dependent on it and might be affected by changes; there were fourteen such
dependent files. Third, they had to identify developers who had edited that file in
the past and may therefore be of help; there were eight past developers.
I calculated error rates for each step in the task, which was calculated by matching
the answers provided by participants with my baseline of correct answers. Subjects
were considered to have an error if the answers provided by them did not exactly
match my baseline (answers with false positives were considered erroneous). Error
rates per step, per task were calculated as the total number of erroneous answers
divided by the total number of answers. I found that all participants correctly
identified the central artifacts (error rate = 0). However, there was one erroneous
answer for “file-dependencies” (error rate = 0.07) and two erroneous answers for
“past-developers” (error rate = 0.14).

61
Further analysis of the experiment videos revealed two participants who gave er-
roneous answers. One participant (P4) investigated the wrong time period, therefore,
analyzing the wrong networks. Because of this, he only correctly identified one de-
pendent file and six developers. The other participant (P8) misunderstood the task,
and instead of identifying developers who had edited “rb-shell.c” calculated all the
developers in the communication network; identifying twelve instead of eight devel-
opers. Note, that some of the above effects are due to my experimental settings (i.e.,
in real projects developers are unlikely to misunderstand their task). However, novice
developers could mistakenly investigate wrong time periods. To alleviate this situ-
ation, Tesseract now provides a “jump to release” button from the search page and
visual cues about the release that is under investigation (see Figure 4.10).
Task 4 assessed the effectiveness of Tesseract in facilitating the understanding of
social structures in a project and included four steps. Participants were asked to find
the social hubs in the communication network; “Colin Walters” was found to be the
most central node (seven edges), followed by two developers with five edges each.
In the next two steps, subjects had to identify which other files that “Colin” had
committed (twenty-one files) and other developers with whom he communicated (two
developers). The final step asked subjects to identify the (other) primary contributors
based on the number of files that they committed; there were three other primary
contributors. I found that all participants correctly identified all answers (social hubs,
developer contributions, communication edges, and primary contributors) leading to
an error rate of “0” for all four steps in the task. Next I analyzed the time-to-
completion of these tasks (see Table 5.5). I found that the average time to completion
for Task 3 was 5.49 minutes, followed by 5.75 minutes for Task 4. While I did not
compare Tesseract with other traditional versioning tools and issue trackers, note that
the literature suggests that internalizing the project structures and dependencies is

62
usually challenging to newcomers and requires significant effort and time on their
part [13, 15].
User satisfaction: I collected user satisfaction ratings through exit surveys (5-
point Likert scale) and semi-structured interviews. Table 5.6 summarizes the survey
results (see Appendix B for more details). All participants had very favorable reviews
across all categories with both Control and Experimental groups reporting high sat-
isfaction ratings. Participants were highly satisfied with synonym-based search and
similar-bugs search. In Task 1 and Task 2, subjects in the experimental group used
the advanced search features in Tesseract and rated their experience based on a 5-
point Likert scale, where 5 is “strongly satisfied”. The search engine enhanced by
synonym-based search is rated at an average of 4.71 and similar-bugs search is rated
at an average of 4.57. For example, Participant P4 commented: “Similar bug search
is good. Not only can it search bugs on keywords you input, it also finds bugs with
similar descriptions.” Another reports: “It’s pretty cool, if I input “remove” it also
lists synonyms.”
Table 5.6: User Satisfaction ratings based on a 5-point Likert scale, where 5 is“strongly satisfied”
CategoriesAverage(SD)
Ctrl ExpUser interface 4.14(1.069) 4.14(0.690)
Understanding of the project 3.86(0.690) 4.29(0.756)Resource identification 4.29(0.756) 4.29(0.756)Network visualizations 4.29(1.113) 4.00(1.000)
Search capability 4.43(0.787) 4.71(0.488)Similar bugs recommendations n/a 4.57(0.535)
Learnability 4.86(0.378) 4.57(0.535)Time efficiency 4.00(1.000) 4.29(0.535)
Overall experience 4.43(0.787) 4.43(0.787)

63
While synonym-based search was found to be advantageous, participants were
much more impressed by the Tesseract user interface, its novelty, and how easy it
made investigations of project dependencies. Participant [P1] notes how Tesseract
made early experimentation particularly easy for him: “(Tesseract) definitely saved
my time. Definitely. Right now I understand some of the underpinnings of Rhythmbox
like how everything is working. If someone gives a Rhythmbox whole folder or zip
folder and say try to fix a bug in this, I would have no idea.”
Participant P15’s quote sums up the user sentiments: “With Tesseract, I can
definitely save time in exploring a new project. It helps me identify the file structure
as well as the developer organization. I can easily find the primary contributors,
central artifacts, and get an idea of the whole software structure. Whenever I want
to find some people to get help, Tesseract can give me a hint.”
Finally, it was found that participants could easily learn to use the system in-
terface (4.86 and 4.57 scores for learnability by Control and Experimental groups,
respectively, see Table 5.6). Participant P13 notes that he would recommend Tesser-
act to others since: “It is very easy for beginners to learn how version system and bug
maintenance work rather than jumping into something like (command line version
system) which is very difficult to understand where there’s no visual interface.”
I also collected the possible improvements to Tesseract as suggested by user feed-
back. First, file listing with a hierachy structure will help users easily find a file they
are interested in and get an overview of the physical file structure. Current file listing
in Tesseract is a plain list of file names in alphabetical order and does not give any
information the hierarchy structure of the file system. Second, Tesseract may allow
users to go back to a higher level of package when they drill down to explore further
in the file hierachy. Currently users have difficulty going back to the previous level
of package they have just explored in the file network. A search history over bugs

64
may also be stored so that users can check the results of previous searches when they
search for similar bugs. One of the possible UI improvements suggested by users is
relocation of search boxes. Currently, there two separated search boxes for files and
developers. Multiple search boxes make users confused when they try to find a search
box in which to input a query. Additional text information about current selected
project and time period can be listed besides the date selection slider to help users
easily know the context of their exploration. Highlighting of relevant resources can
also be better. When a user clicked on a file, all relevant files, developers and bugs
are highlighted. These relevant resources are also highlighted when a user clicked on
a developer. The only difference is the color of the clicked resource entity. However,
users may not be able to notice the slight difference and get confused at which en-
tity is clicked. Some users even suggest a dashboard report for managers to monitor
onboarding activities of new developers, for example, what tasks a new developer is
working on, which team members a new developer has communicated with, and if a
new developer gets stuck on some tasks. This kind of report can help managers to
validate the onboarding process of new developers.
5.4 Threats to validity
In experiment design, external validity refers to the generalizabilty of the results of a
research study. Internal validity refers to the validity of the (causal) inferences in a
research study. Construct validity refers to the extent to which the experiment setting
actually reflects the construct under study. Here I discuss the threats to validity in
my study. I discuss the threats to external validity and internal validity, followed by
the threats to construct validity.

65
Threats to external validity: One threat is that students were used as partici-
pants instead of developers. However, since my study was meant to study onboarding
of new developers and all students were advanced students with several years of pro-
gramming experience, I feel that my results are generalizable to industry settings
where new postgraduates join projects. Another threat is that my tasks might not
be representative of tasks that developers face in real life. However, I minimized this
issue by using bugs and project data from an actual open source project. Finally, my
experiment only involved one GNOME project; other software projects might display
different characteristics.
Threats to internal validity: One threat can be the small sample size of sub-
jects, which is limited to ten in each group in the early experimentation tasks. To
estimate the sample sizes, I calculate Cohen’s d value, which is often used in measur-
ing effect size of statistical analysis. I chose to calculate the effect sizes for the early
experimentation tasks since these involved two treatment groups. Even though I have
a relatively small sample size, Cohen’s d for completeness rates in T1 is 1.73 and T2
is 1.48. Note Cohen’s d values > 0.8 are considered “large” effects, which indicates
no necessity of larger sample sizes. Further, to avoid any statistical conclusion issues,
I also use non-parametric testing (MannWhitney U Test) which is considered robust
for small sample sizes. Another threat comes from researcher bias in designing the
tasks for the user study. All four tasks in the experiment are created by researchers
instead of being randomly chosen from real tasks in practice. To reduce these biases, I
took the following steps: (1) I investigated common onboarding tasks used in practice
through literature survey. (2) I interviewed industry partners to get an idea of the
type of onboarding tasks, and (3) I interviewed participants in the pilot study about
the appropriateness of the tasks for onboarding. Finally, there is a threat of learning
effects on results across the four tasks. I minimized this threat by counterbalancing

66
tasks in each phase. I note that it is likely that subjects in the second phase (mental
model building) will demonstrate learning effects from the previous phase, however,
since this phase was a single-treatment study learning effects equally affect all par-
ticipants. In fact, I observe that learning effects also will take place in real life and is
in fact desirable.
Threats to construct validity: The choice of our tasks in the user study to
measure benefits for onboarding can construe a threat to construct validity. These
tasks are only a subset of all possible onboarding tasks in real-world software develop-
ment and may not be representative of all onboarding tasks that a new user will face.
However, these tasks were created based on findings by previous studies on onboard-
ing. Further, our subjects in the pilot found the tasks to be representative of tasks
in industry. Finally, while our four tasks were specifically created to investigate how
users could identify relevant resources and project structures, it is possible that our
task structures and the data represented in Tesseract might not be accurate measures
of how newcomers would identify resources or understand project structures. Only
an in depth field study investigating how newcomers use Tesseract can accurately
answer this question.

67
Chapter 6
Conclusion
Onboarding a project is challenging for both new developers as well as experienced de-
velopers. The challenges during onboarding include: difficulty in identifying the right
starting points; limited search capabilities that are restricted to individual reposito-
ries; inability to form accurate mental models of project structures and their semantic
relationships; and cognitive overload.
In this thesis, I propose a set of onboarding requirements and how those require-
ments can be met through automated support. Based on a literature survey of devel-
oper onboarding and its challenges, informal interviews with some industry partners,
and pilot studies, I identify a list of functional requirements to support developer
onboarding: (1) identification of relevant resources to aid early experimentation, (2)
seamless investigation of data that is fragmented across multiple repositories, (3)
investigation of semantic relationships, (4) exploration of social, technical, and socio-
technical dependencies, (5) representation of high-level project structures, and (6)
facilitating top-down and bottom-up comprehension strategies.
Further, I extended Tesseract to achieve these onboarding functionalities. Tesser-
act’s built-in features already support most of the functionalities required by devel-
68
oper onboarding. It allows developers to explore project resources and socio-technical
dependencies across multiple repositories visually and interactively [32]. This work
extended Tesseract with (1) enhanced resource finding with synonym-based search
and similar-bugs search, (2) integration of enhanced bug search features into visual
exploration and providing more details of bugs, (3) enhanced network visualizations
with package-level dependencies, and (4) a set of filters on various project resources.
With enhanced resource finding and visual exploration, Tesseract now supports a
majority of the onboarding functionalities I proposed.
I performed user studies to evaluate these onboarding functionalities in Tesser-
act. I found that synonym-based search, previously used in software maintenance
tasks [19], also helps in onboarding. More specifically, synonym-based search allowed
higher completeness rates among participants in my study. I also observed that par-
ticipants in the Control group, despite being adept in searching and experienced in
programming, did not typically use synonyms in their queries. This is inline with
past studies that have shown new developers to have difficulty in investigating a code
base [22]. Therefore, I posit that synonym-based search will help in early experimen-
tation. A caveat to my result is that synonym-based search over complex or long bug
descriptions could result in large sets of “starter” tasks that would need fine-tuning.
While synonym-based search was successful, the most notable benefit of Tesseract was
in helping users build accurate mental models of project structures quickly through
its cross-linked, network-centric visualizations. Subjects were able to complete tasks
with low error rates and in short time-to-completion. Past studies have observed
that creating accurate mental models is one of the most challenging tasks for new-
comers [5] and that they are frequently frustrated by their shallow understanding of
projects [16]. My results and participant feedback show that interactive, project ex-

69
ploration functionalities that visualize socio-technical dependencies of project entities
can help in creating accurate mental models and in short time-to-completion.
70
Appendix A
User Study Tasks
A.1 Task 1
You were just introduced to the Rhythmbox Gnome project. Now you are looking for
a small task to get started. You played with Rythmbox by running the application
for a while. Unfortunately, it crashed when you removed a song from the playlist.
So you want to start your contribution by fixing this bug. To understand this bug,
you want to find all previous bugs related to crashes caused by removing songs. You
also want to find which files to work on, who to seek help from and whether you can
learn from previous bugs related to crashes caused by removing songs. Specifically,
you will take following steps:
1. Find all the bugs about crashes caused by removing songs. You have to check
bugs description to decide if they are really related to the same problem.
2. For each bug, check the details of this bug, write down its status. Then find
the developer to seek help from(the developer that the bug was assigned to).
71
3. For each bug, find developers who commented on this bug. Some bugs may
have no developers that commented on it.
A.2 Task 2
You were just introduced to the Rhythmbox Gnome project. Now you are looking
for a small task to get started. You took a look at the list of bugs in Bugzilla and
checked their descriptions. You have found bug 8077 interesting and want to start
from it. To get to know this bug, you want to find which files to work on, who to
seek help from and whether you can learn from other bugs which might be related to
this one. Specifically, you will take following steps:
1. Find all the bugs related to bug 8077. You have to check bugs description to
decide if they are really related to the same problem.
2. For each bug, check the details of this bug, write down its status. Then find
the developer to seek help from(the developer that the bug was assigned to).
3. For each bug, find developers who commented on this bug. Some bugs may
have no developers that commented on it.
A.3 Task 3
You were just introduced to the Rhythmbox Gnome project. Now you want to know
more about source files in this project and the relationships between them.
In Tesseract, you checked the Files network of release 2.2 and found file “rb-shell.c”
under “shell” folder was a core file (a file that was often committed together with
other files). So you want to start from it.

72
You are going to check who contributed to this file and what other files it was
often committed with. You also want to further understand the file structure of this
project. Specifically, you will take following steps:
1. Select time between release 2.0 (2002-06-26) and release 2.2(2003-02-05).
2. Find file “rb-shell.c” under “shell” directory.
3. List files often committed together with this file. Count the total number and
paste the screenshot of the files network graph with “rb-shell.c” highlighted into
the MS Word document.
4. List the developers that committed this file. Count the total number and paste
the screenshot of the developers network graph with corresponding developers
highlighted into the MS Word document.
5. Find the central artifacts in this time period (note: a central artifacts is a file
that was often committed with other files in the current file network).
A.4 Task 4
You were just introduced to the Rhythmbox Gnome project. Now you want to know
more about people working on this project and the social relationships between them.
In Tesseract, you checked the Developers network of the current release and found
Colin Walters was a core developer (a developer that communicates with most other
developers). So you want to start from him.
You are going to check what contributions he did in previous releases and how he
communicated with other developers. You also want to further understand the social
structure of this team. Specifically, you will take following steps:

73
1. Select time between release 2.0 (2002-06-26) and release 2.2( 2003-02-05).
2. Find developer “colin walters”.
3. List the developers he communicated with. Count the total number and paste
the screenshot of developers network graph with colin walters highlighted into
the MS Word document.
4. List the files committed by him. Count the total number and paste the screen-
shot of the files network graph with committed files highlighted into the MS
Word document.
5. Find the primary contributor(s) in this time period(note: main contributor is
the developer who did the most commits).
6. Find the top 2 social hubs in the developers graph (note: a social hub is a
developer that communicated with many other developers).

74
Appendix B
User Satisfaction Ratings in Exit
Survey
B.1 User satisfaction ratings in control group
Table B.1: User Satisfaction ratings in control group based on a 5-point Likert scale,where 5 is “strongly satisfied”
Subject P1 P2 P3 P4 P5 P6 P7User interface 5 4 2 5 5 4 4
Understanding of the project 4 4 3 3 4 5 4Resource identification 4 5 3 4 5 5 4Network visualizations 4 4 2 5 5 5 5
Search capability 5 4 3 5 5 4 5Learnability 5 5 4 5 5 5 5
Time efficiency 5 4 2 4 4 4 5Overall experience 5 4 3 5 5 5 4

75
B.2 User satisfaction ratings in experimental
group
Table B.2: User Satisfaction ratings in experimental group based on a 5-point Likertscale, where 5 is “strongly satisfied”
Subject P8 P9 P10 P11 P12 P13 P14User interface 5 4 4 4 5 4 3
Understanding of the project 5 4 4 5 5 4 3Resource identification 4 5 4 4 5 5 3Network visualizations 4 3 3 5 5 5 3
Search capability 5 4 5 5 5 5 4Similar bugs recommendations 5 4 5 4 5 5 4
Learnability 4 4 5 5 5 5 4Time efficiency 5 4 5 3 5 5 3
Overall experience 5 4 4 5 5 5 3

76
Bibliography
[1] B. Ashok, Joseph Joy, Hongkang Liang, Sriram K. Rajamani, Gopal Srinivasa,
and Vipindeep Vangala. Debugadvisor: a recommender system for debugging.
In Proceedings of the the 7th joint meeting of the European software engineering
conference and the ACM SIGSOFT symposium on The foundations of software
engineering, ESEC/FSE ’09, pages 373–382, New York, NY, USA, 2009. ACM.
[2] Adrian Bachmann, Christian Bird, Foyzur Rahman, Premkumar Devanbu, and
Abraham Bernstein. The missing links: bugs and bug-fix commits. In Proceedings
of the eighteenth ACM SIGSOFT international symposium on Foundations of
software engineering, FSE ’10, pages 97–106, New York, NY, USA, 2010. ACM.
[3] Talya N. Bauer and Berrin Erdogan. Organizational socialization: The effec-
tive onboarding of new employees, pages 51–64. APA Handbooks in Psychology.
American Psychological Association, 2010.
[4] Andrew Begel, Yit Phang Khoo, and Thomas Zimmermann. Codebook: discov-
ering and exploiting relationships in software repositories. In Proceedings of the
32nd ACM/IEEE International Conference on Software Engineering - Volume
1, ICSE ’10, pages 125–134, New York, NY, USA, 2010. ACM.
[5] Andrew Begel and Beth Simon. Struggles of new college graduates in their first
software development job. SIGCSE Bull., 40:226–230, March 2008.
77
[6] Nicolas Bettenburg, Rahul Premraj, Thomas Zimmermann, and Sunghun Kim.
Extracting structural information from bug reports. In Proceedings of the 2008
international working conference on Mining software repositories, MSR ’08,
pages 27–30, New York, NY, USA, 2008. ACM.
[7] Shilpa Bugde, Nachiappan Nagappan, Sriram Rajamani, and G. Ramalingam.
Global software servicing: Observational experiences at microsoft. In Proceed-
ings of the 2008 IEEE International Conference on Global Software Engineering,
pages 182–191, Washington, DC, USA, 2008. IEEE Computer Society.
[8] Bugzilla - bug tracking used by the Mozilla projects. http://www.bugzilla.org/.
[9] Marcelo Cataldo, Patrick A. Wagstrom, James D. Herbsleb, and Kathleen M.
Carley. Identification of coordination requirements: implications for the design
of collaboration and awareness tools. In Proceedings of the 2006 20th anniversary
conference on Computer supported cooperative work, CSCW ’06, pages 353–362,
New York, NY, USA, 2006. ACM.
[10] Mauro Cherubini, Gina Venolia, Rob DeLine, and Andrew J. Ko. Let’s go to the
whiteboard: how and why software developers use drawings. In Proceedings of
the SIGCHI conference on Human factors in computing systems, CHI ’07, pages
557–566, New York, NY, USA, 2007. ACM.
[11] ConceptNet - a practical commonsense reasoning tool-kit.
http://csc.media.mit.edu/conceptnet.
[12] Barthelemy Dagenais, Harold Ossher, Rachel K. E. Bellamy, Martin P. Robil-
lard, and Jacqueline P. de Vries. Moving into a new software project landscape.
In Proceedings of the 32nd ACM/IEEE International Conference on Software

78
Engineering - Volume 1, ICSE ’10, pages 275–284, New York, NY, USA, 2010.
ACM.
[13] Cleidson R. B. de Souza and David F. Redmiles. An empirical study of software
developers’ management of dependencies and changes. In Proceedings of the 30th
international conference on Software engineering, ICSE ’08, pages 241–250, New
York, NY, USA, 2008. ACM.
[14] Robert DeLine, Mary Czerwinski, and George Robertson. Easing program com-
prehension by sharing navigation data. In Proceedings of the 2005 IEEE Sym-
posium on Visual Languages and Human-Centric Computing, pages 241–248,
Washington, DC, USA, 2005. IEEE Computer Society.
[15] Nicolas Ducheneaut. Socialization in an open source software community: A
socio-technical analysis. Comput. Supported Coop. Work, 14:323–368, August
2005.
[16] Susan Elliott Sim and Richard C. Holt. The ramp-up problem in software
projects: a case study of how software immigrants naturalize. In Proceedings
of the 20th international conference on Software engineering, ICSE ’98, pages
361–370, Washington, DC, USA, 1998. IEEE Computer Society.
[17] Harald Gall, Karin Hajek, and Mehdi Jazayeri. Detection of logical coupling
based on product release history. In Proceedings of the International Conference
on Software Maintenance, ICSM ’98, pages 190–, Washington, DC, USA, 1998.
IEEE Computer Society.
[18] Git - Fast Version Control System. http://git-scm.com/.

79
[19] Emily Hill, Lori Pollock, and K. Vijay-Shanker. Automatically capturing source
code context of nl-queries for software maintenance and reuse. In Proceedings
of the 31st International Conference on Software Engineering, ICSE ’09, pages
232–242, Washington, DC, USA, 2009. IEEE Computer Society.
[20] Kasper Hornbaek. Current practice in measuring usability: Challenges to us-
ability studies and research. Int. J. Hum.-Comput. Stud., 64:79–102, February
2006.
[21] Mik Kersten and Gail C. Murphy. Using task context to improve programmer
productivity. In Proceedings of the 14th ACM SIGSOFT international sympo-
sium on Foundations of software engineering, SIGSOFT ’06/FSE-14, pages 1–11,
New York, NY, USA, 2006. ACM.
[22] Todd Kulesza, Weng-Keen Wong, Simone Stumpf, Stephen Perona, Rachel
White, Margaret M. Burnett, Ian Oberst, and Andrew J. Ko. Fixing the pro-
gram my computer learned: barriers for end users, challenges for the machine.
In Proceedings of the 14th international conference on Intelligent user interfaces,
IUI ’09, pages 187–196, New York, NY, USA, 2009. ACM.
[23] Thomas K Landauer and Susan T. Dutnais. A solution to platos problem: The
latent semantic analysis theory of acquisition, induction, and representation of
knowledge. Psychological review, pages 211–240, 1997.
[24] Stanley Letovsky. Cognitive processes in program comprehension. In Papers
presented at the first workshop on empirical studies of programmers on Empirical
studies of programmers, pages 58–79, Norwood, NJ, USA, 1986. Ablex Publishing
Corp.

80
[25] David C. Littman, Jeannine Pinto, Stanley Letovsky, and Elliot Soloway. Mental
models and software maintenance. J. Syst. Softw., 7:341–355, December 1987.
[26] Nancy Pennington. Comprehension strategies in programming. In Gary M.
Olson, Sylvia Sheppard, and Elliot Soloway, editors, Empirical studies of pro-
grammers: second workshop, pages 100–113. Ablex Publishing Corp., Norwood,
NJ, USA, 1987.
[27] Nancy Pennington. Stimulus structures and mental representations in expert
comprehension of computer programs. Cognitive Psychology, 19:295–341, 1987.
[28] Vijay V. Raghavan and S. K. M. Wong. A critical analysis of vector space
model for information retrieval. Journal of the American Society for Information
Science, 37(5):279–287, 1986.
[29] Rhythmbox - music management application for Gnome.
http://projects.gnome.org/rhythmbox/.
[30] Martin P. Robillard, Wesley Coelho, and Gail C. Murphy. How effective devel-
opers investigate source code: An exploratory study. IEEE Trans. Softw. Eng.,
30:889–903, December 2004.
[31] Ruven and Brooks. Towards a theory of the comprehension of computer pro-
grams. International Journal of Man-Machine Studies, 18(6):543 – 554, 1983.
[32] Anita Sarma, Larry Maccherone, Patrick Wagstrom, and James Herbsleb. Tesser-
act: Interactive visual exploration of socio-technical relationships in software
development. In Proceedings of the 31st International Conference on Software
Engineering, ICSE ’09, pages 23–33, Washington, DC, USA, 2009. IEEE Com-
puter Society.

81
[33] Ben Shneiderman and Richard Mayer. Syntactic/semantic interactions in pro-
grammer behavior: A model and experimental results. International Journal of
Parallel Programming, 8:219–238, 1979.
[34] Jonathan Sillito, Gail C. Murphy, and Kris De Volder. Asking and answering
questions during a programming change task. IEEE Trans. Softw. Eng., 34:434–
451, July 2008.
[35] E. Soloway and K. Ehrlich. Empirical studies of programming knowledge, pages
507–521. Morgan Kaufmann Publishers Inc., San Francisco, CA, USA, 1986.
[36] Elliot Soloway, Robin Lampert, Stan Letovsky, David Littman, and Jeannine
Pinto. Designing documentation to compensate for delocalized plans. Commun.
ACM, 31:1259–1267, November 1988.
[37] Apache Solr - an open-source search server based on the Lucene Java search
library. http://lucene.apache.org/solr/.
[38] M.-A. D. Storey, F. D. Fracchia, and H. A. Mueller. Cognitive design elements
to support the construction of a mental model during software exploration. J.
Syst. Softw., 44:171–185, January 1999.
[39] Apache Subversion - enterprise-class centralized version control for the masses.
http://subversion.apache.org/.
[40] Trac - project management and bug/issue tracking system.
http://trac.edgewall.org/.
[41] Erik Trainer, Stephen Quirk, Cleidson de Souza, and David Redmiles. Bridging
the gap between technical and social dependencies with ariadne. In Proceedings of

82
the 2005 OOPSLA workshop on Eclipse technology eXchange, eclipse ’05, pages
26–30, New York, NY, USA, 2005. ACM.
[42] Davor CubraniC, Gail C. Murphy, Janice Singer, and Kellogg S. Booth. Learning
from project history: a case study for software development. In Proceedings of
the 2004 ACM conference on Computer supported cooperative work, CSCW ’04,
pages 82–91, New York, NY, USA, 2004. ACM.
[43] G. von Krogh, S. Spaeth, and K.R. Lakhani. Community, joining, and spe-
cialization in open source software innovation: a case study. Research Policy,
32(7):1217–1241, 2003.
[44] Anneliese von Mayrhauser and A. Marie Vans. Program comprehension during
software maintenance and evolution. Computer, 28:44–55, August 1995.
[45] Xiaojun Wan, Jianwu Yang, and Jianguo Xiao. Towards a unified approach
to document similarity search using manifold-ranking of blocks. Inf. Process.
Manage., 44:1032–1048, May 2008.
[46] Jianguo Wang and Anita Sarma. Which bug should i fix: helping new developers
onboard a new project. In Proceeding of the 4th international workshop on Co-
operative and human aspects of software engineering, CHASE ’11, pages 76–79,
New York, NY, USA, 2011. ACM.
[47] WordNet - a large lexical database of English synonyms.
http://wordnet.princeton.edu/.
[48] Minghui Zhou and Audris Mockus. Developer fluency: achieving true mastery in
software projects. In Proceedings of the eighteenth ACM SIGSOFT international

83
symposium on Foundations of software engineering, FSE ’10, pages 137–146,
New York, NY, USA, 2010. ACM.
[49] Justin Zobel and Alistair Moffat. Exploring the similarity space. SIGIR Forum,
32:18–34, April 1998.


