Suominen Corporation
Financial result Q4 and 2013
Helsinki, 30 January 2014
Nina Kopola, President & CEO
Tapio Engström, CFO
30 Jan 2014 Suominen Corporation 1

Contents
• Q4 and FY 2013 at a glance
• Financial review
• Actions taken to implement the strategy in Q4 2013
• Expansion to Brazil
• Summary and discussion
30 Jan 2014 Suominen Corporation 2

Q4 and FY 2013 at a glance
• Net sales* were MEUR 105.2 (+7%) in Q4 and MEUR 433.1 (+6%) in FY 2013.
• Operating profit excl. non-recurring items* was MEUR 3.7 (+123%) in Q4 and MEUR
18.3 (+42%) in FY 2013.
• Profit for the period after taxes* was MEUR 2.5 (-5.2)
• Wiping:
˗ The demand continued to develop positively in North America, in Europe the
competition remained tough
˗ Operating profit from continuing operations excl. non-recurring items grew 44% from
the comparison period.
• Flexibles:
˗ In Q4, net sales grew by 15% despite the tight competitive environment, result
remained negative
˗ Suominen intensified the business recovery program of the segment and invested in
the automatization of the Tampere plant.
• With the current group structure, Suominen expects its group net sales for the full year
2014 to remain at the level of 2013. Operating profit excluding non-recurring items is
expected to improve from year 2013.
30 Jan 2014 Suominen Corporation 3
* from continuing operations
Financial review
Q4 and FY 2013
30 Jan 2014 Suominen Corporation 4

Net sales grew from the comparison period
98.1
111.7 107.7 108.6 105.2
0
20
40
60
80
100
120
Q4/12 Q1/13 Q2/13 Q3/13 Q4/13
Net sales, M€
• FY 2013 net sales from
continuing operations were M€
433.1 (410.4 M€), growing slightly
stronger than market average,
+6%.
• In Q4, net sales from continuing
operations amounted to 105.2 M€
(98.1 M€), +7 %.
• Favorable demand for
nonwovens continued in North
American market.
• In Europe, the competitive
environment remained tough in
Europe, putting pressure on the
sales prices.
Suominen Corporation 30 Jan 2014 5
Continuing operations. Also the comparable figures have been adjusted.
1.7
5.0
4.3
5.3
3.7
0
1
2
3
4
5
6
7
0
1
2
3
4
5
6
Q4/12 Q1/13 Q2/13 Q3/13 Q4/13
Operating profit excl. non-recurring items, M€ and %
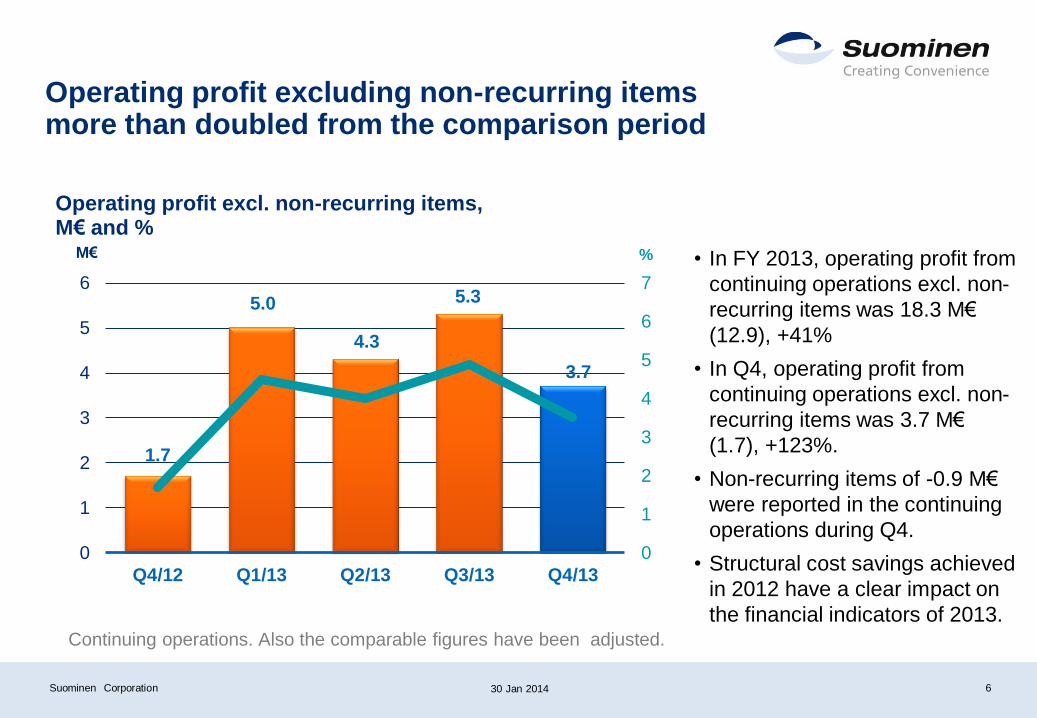
Operating profit excluding non-recurring items more than doubled from the comparison period
• In FY 2013, operating profit from
continuing operations excl. non-
recurring items was 18.3 M€
(12.9), +41%
• In Q4, operating profit from
continuing operations excl. non-
recurring items was 3.7 M€
(1.7), +123%.
• Non-recurring items of -0.9 M€
were reported in the continuing
operations during Q4.
• Structural cost savings achieved
in 2012 have a clear impact on
the financial indicators of 2013.
Suominen Corporation
M€ %
30 Jan 2014 6
Continuing operations. Also the comparable figures have been adjusted.

Cash flow from operations strengthened
• In Q4, cash flow from operations
was M€ 16.3 (11.7) and in FY
2013 M€ 21.3 (24.9).
• M€ 6.5 (5.0) of working capital
has been released since 1
January 2013.
Suominen Corporation 30 Jan 2014
11.7
-2.1
2.9 4.3
16.3
-5
0
5
10
15
20
Q4/12 Q1/13 Q2/13 Q3/13 Q4/13
Cash flow from operations, M€
7
Continuing operations. Also the comparable figures have been adjusted.
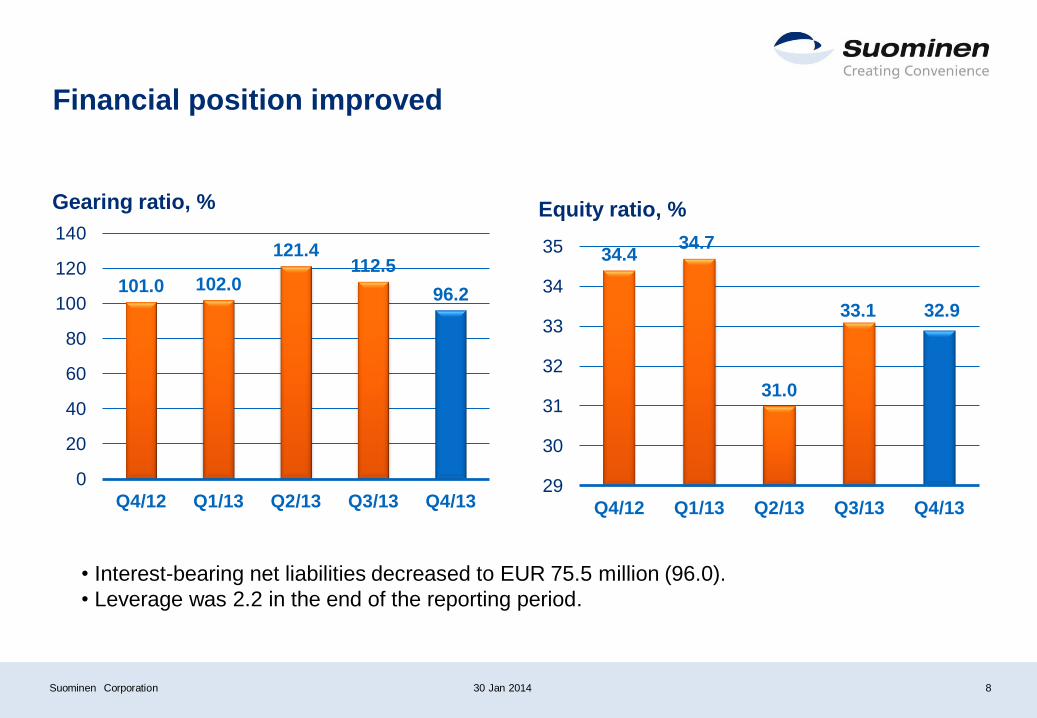
Financial position improved
101.0 102.0
121.4 112.5
96.2
0
20
40
60
80
100
120
140
Q4/12 Q1/13 Q2/13 Q3/13 Q4/13
Gearing ratio, %
34.4 34.7
31.0
33.1 32.9
29
30
31
32
33
34
35
Q4/12 Q1/13 Q2/13 Q3/13 Q4/13
Equity ratio, %
• Interest-bearing net liabilities decreased to EUR 75.5 million (96.0).
• Leverage was 2.2 in the end of the reporting period.
Suominen Corporation 30 Jan 2014 8
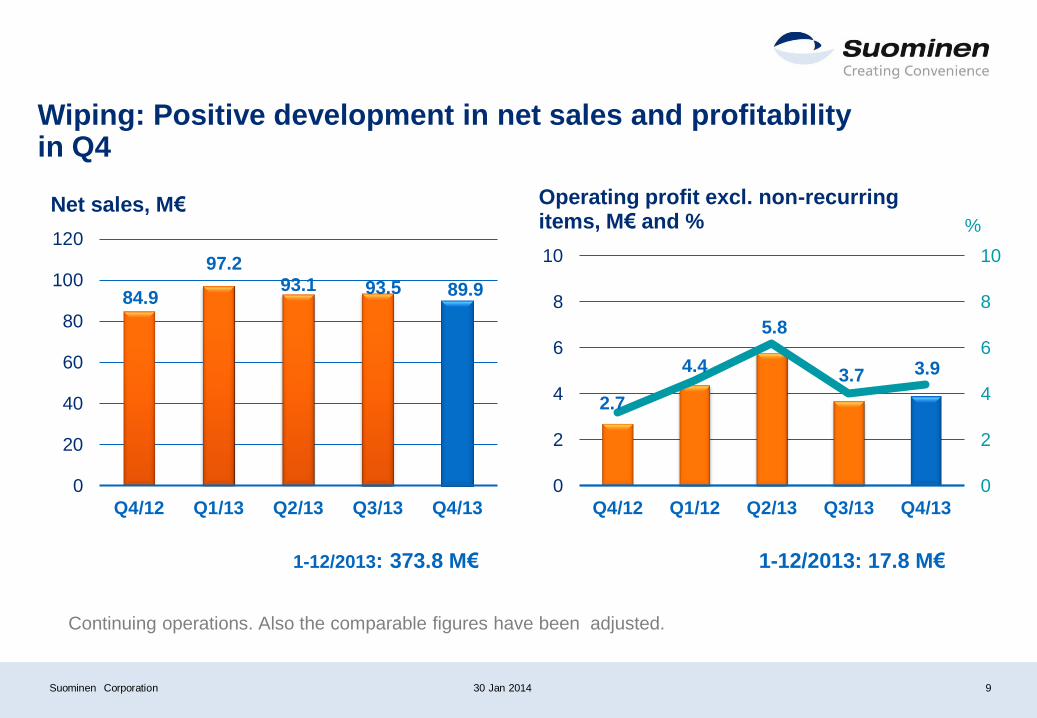
Wiping: Positive development in net sales and profitability in Q4
84.9
97.2 93.1 93.5 89.9
0
20
40
60
80
100
120
Q4/12 Q1/13 Q2/13 Q3/13 Q4/13
Net sales, M€
1-12/2013: 373.8 M€
2.7
4.4
5.8
3.7 3.9
0
2
4
6
8
10
0
2
4
6
8
10
Q4/12 Q1/12 Q2/13 Q3/13 Q4/13
Operating profit excl. non-recurring items, M€ and %
1-12/2013: 17.8 M€
%
Suominen Corporation 30 Jan 2014 9
Continuing operations. Also the comparable figures have been adjusted.

Wiping: The share of baby wipes further declined in the portfolio
41%
17%
13%
22%
7% Baby
Household
Industrial
Personal care
Other
• Clear transformation in the portfolio
compared with 2012:
• Share of baby wipes declined to
41% vs 47% in 2012.
• Share of nonwovens for
personal care wipes grew (22%
vs 18%)
• Share of products for industrial
wiping increased (13% vs 10%)
Suominen Corporation
Q1-Q4/2013: 373.8 M€ (357.9)
30 Jan 2014 10
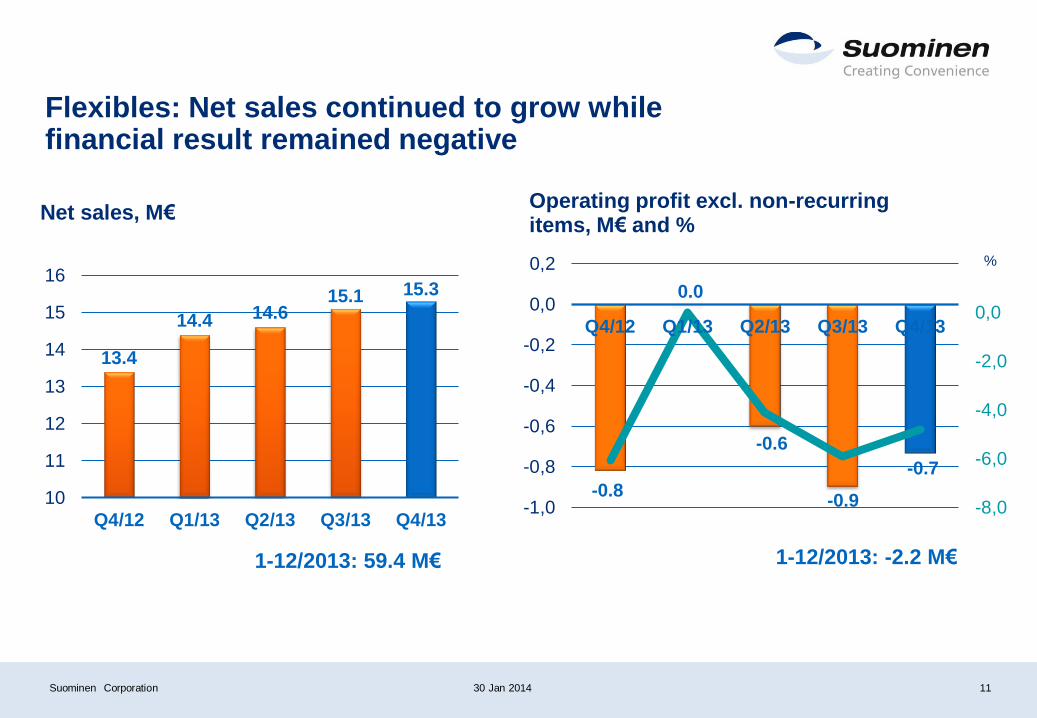
Flexibles: Net sales continued to grow while financial result remained negative
13.4
14.4 14.6 15.1 15.3
10
11
12
13
14
15
16
Q4/12 Q1/13 Q2/13 Q3/13 Q4/13
Net sales, M€
-0.8
0.0
-0.6
-0.9
-0.7
-8,0
-6,0
-4,0
-2,0
0,0
2,0
-1,0
-0,8
-0,6
-0,4
-0,2
0,0
0,2
Q4/12 Q1/13 Q2/13 Q3/13 Q4/13
Operating profit excl. non-recurring items, M€ and %
%
1-12/2013: 59.4 M€ 1-12/2013: -2.2 M€
Suominen Corporation 30 Jan 2014 11
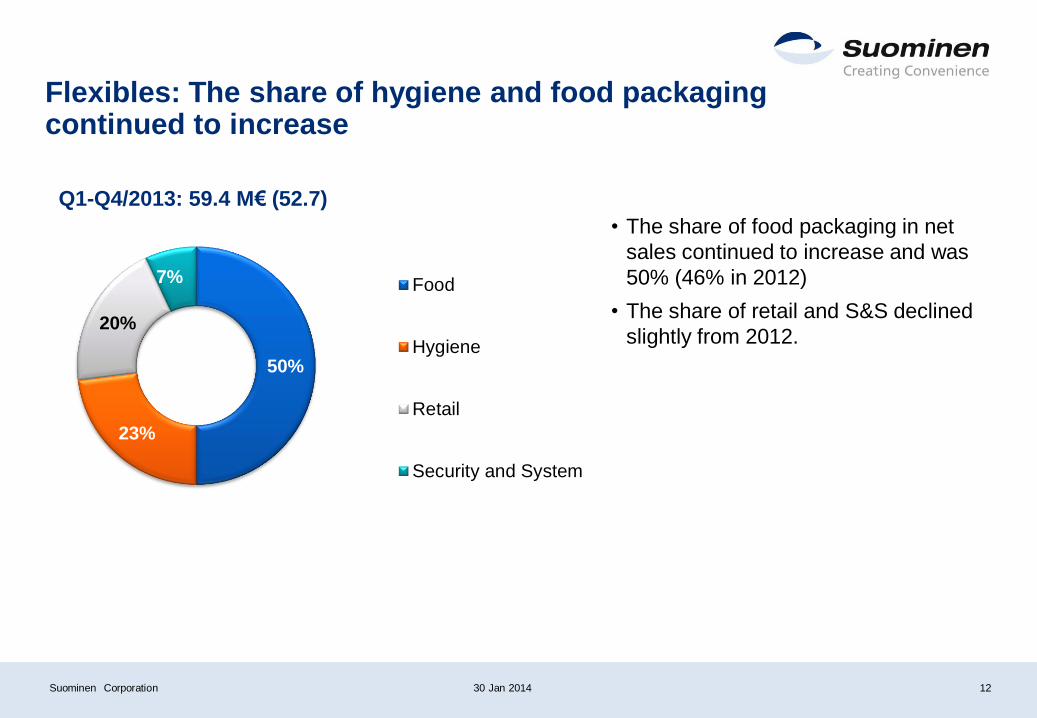
50%
23%
20%
7% Food
Hygiene
Retail
Security and System
Flexibles: The share of hygiene and food packaging continued to increase
• The share of food packaging in net
sales continued to increase and was
50% (46% in 2012)
• The share of retail and S&S declined
slightly from 2012.
Q1-Q4/2013: 59.4 M€ (52.7)
Suominen Corporation 30 Jan 2014 12

Outlook for 2014
• With the current group structure, Suominen expects its group net sales for the
full year 2014 to remain at the level of 2013. Operating profit excluding non-
recurring items is expected to improve from year 2013.
• In 2013, Suominen’s net sales were EUR 433.1 million and operating profit
excluding non-recurring items was EUR 18.3 million (continuing operations).
30 Jan 2014 Suominen Corporation 13

Actions taken to implement
strategy in Q4 2013
30 Jan 2014 Suominen Corporation 14
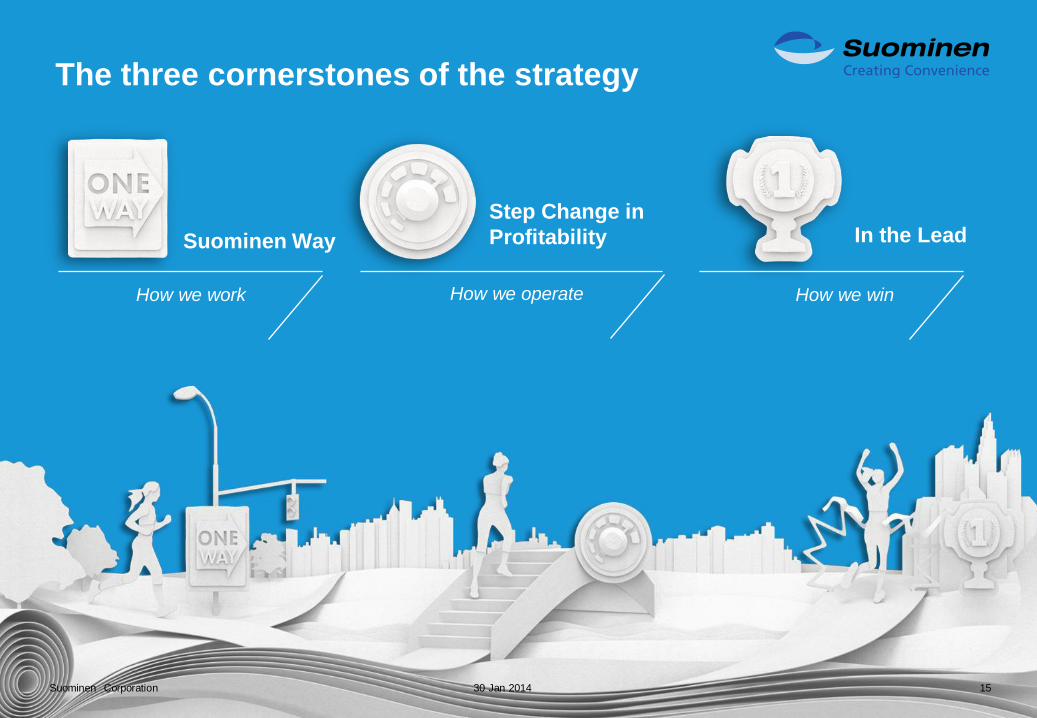
The three cornerstones of the strategy
How we win How we operate
In the Lead Step Change in
Profitability Suominen Way
How we work
30 Jan 2014 Suominen Corporation 15
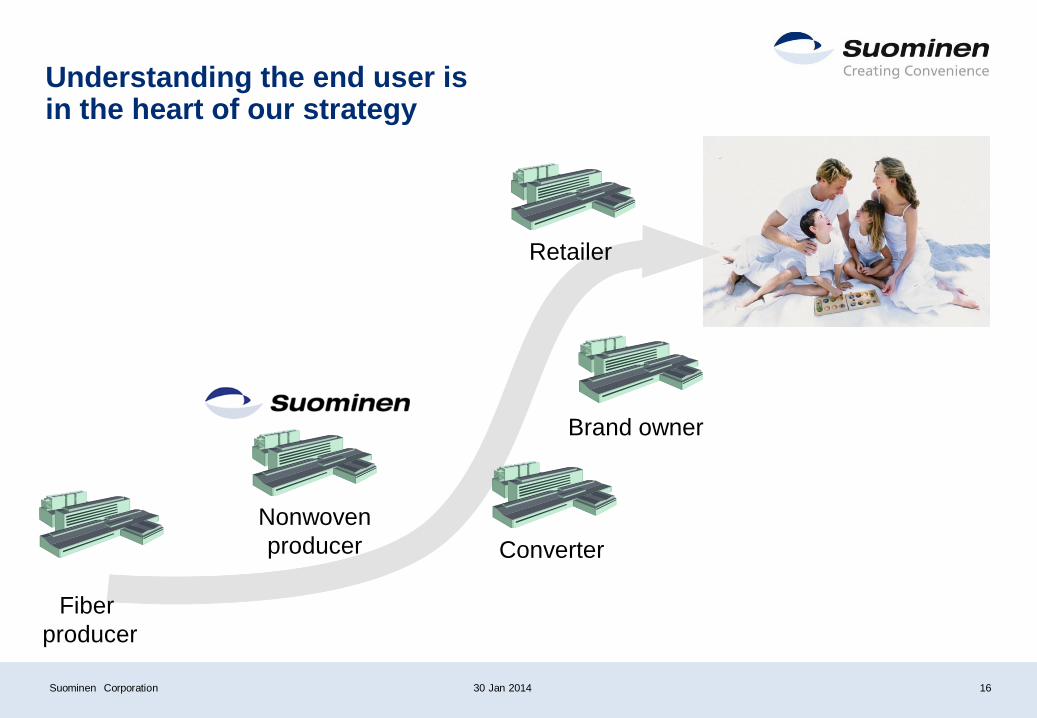
Understanding the end user is in the heart of our strategy
Fiber
producer
Nonwoven
producer
Brand owner
Converter
Retailer
Suominen Corporation 30 Jan 2014 16

We aim at increasing the share of products with higher added value
Today In the future
Value for Money
Products with
higher added value
30 Jan 2014 Suominen Corporation 17
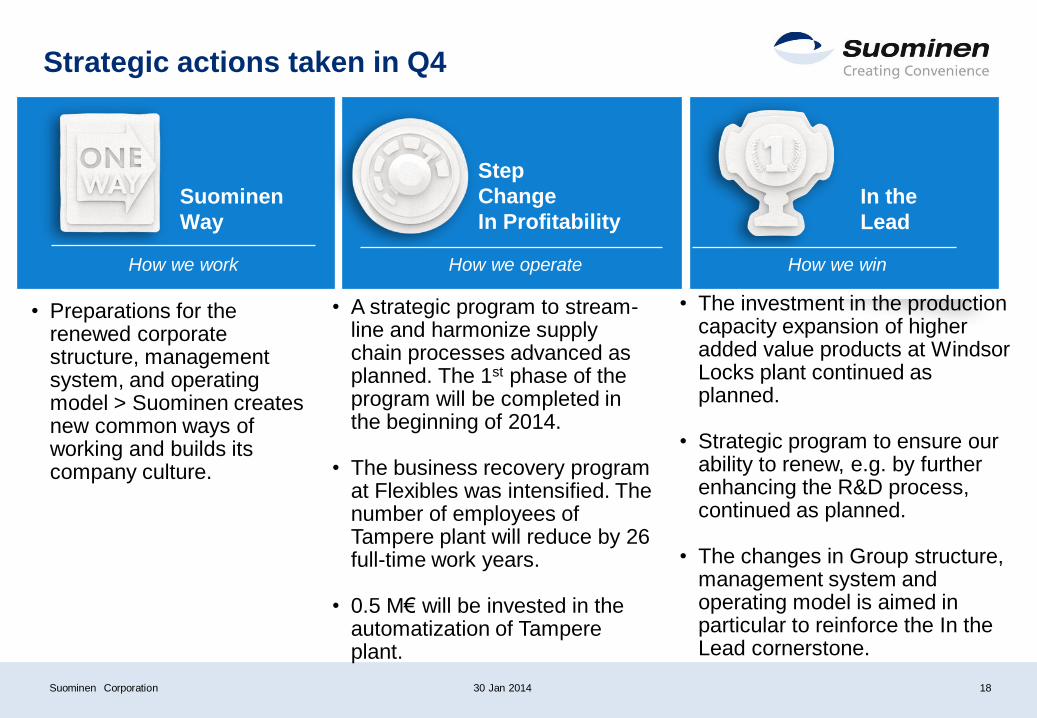
How we work
Strategic actions taken in Q4
• Preparations for the renewed corporate structure, management system, and operating model > Suominen creates new common ways of working and builds its company culture.
Suominen
Way
Step
Change
In Profitability
In the
Lead
How we win How we operate
• A strategic program to stream-line and harmonize supply chain processes advanced as planned. The 1st phase of the program will be completed in the beginning of 2014.
• The business recovery program at Flexibles was intensified. The number of employees of Tampere plant will reduce by 26 full-time work years.
• 0.5 M€ will be invested in the automatization of Tampere plant.
• The investment in the production capacity expansion of higher added value products at Windsor Locks plant continued as planned.
• Strategic program to ensure our ability to renew, e.g. by further enhancing the R&D process, continued as planned.
• The changes in Group structure, management system and operating model is aimed in particular to reinforce the In the Lead cornerstone.
30 Jan 2014 Suominen Corporation 18
Mid-term financial targets
Suominen aims to :
• Clearly improve its relative profitability. The target level of the company’s return on
investment (ROI) is to be above 10% (-0.6% in 2013).
• Have a solid capital structure with a gearing ratio principally between 40% and 80%
(96.2% in 2013).
• Increase its net sales at a rate that exceeds the average growth rate of the industry.
(In FY 2013, Suominen’s net sales from continuing operations grew 6%.)
30 Jan 2014 Suominen Corporation 19
Suominen to acquire
Ahlstrom’s Paulínia plant in Brazil
Suominen Corporation 30 Jan 2014 20
Transaction in brief
• Suominen and Ahlstrom agreed on 10 January 2014 on the sales of the entire stock of
Ahlstrom’s Paulínia unit in Brazil to Suominen. Formerly the plant was part of
Ahlstrom’s Home and Personal business area.
• The deal provides Suominen a foothold in a new, growing market region. Suominen
becomes a truly global player in nonwovens.
• The enterprise value is 17.5 MEUR. Suominen aims to finance the deal through a
convertible hybrid bond, treated as equity.
• A prerequisite for the issuance of a convertible hybrid bond is an authorization by
Suominen’s Extraordinary General Meeting.
• Ahlstrom Corporation has committed to subscribing for the bond for the parts other
investors do not subscribe for.
Suominen Corporation 30 Jan 2014 21

The strategic rationale of the deal for Suominen
• The deal makes an important milestone in the implementation of our In
the Lead strategy.
• The transaction provides Suominen a foothold in a new market region
offering opportunities for profitable growth:
• The demand for nonwovens still in strong growth in South America
• The deal enables Suominen to increase market share not only in
Brazil but also in the other countries in the continent.
• In South America, the nonwovens market enjoys healthy profitability
levels the transaction increases the share of products with higher
value add in Suominen’s portfolio.
• Through the acquisition, Suominen becomes a truly global player,
enabling us to serve our global customers even better than before as
we have locations in several continents.
Suominen Corporation 30 Jan 2014 22

Demand for nonwovens in Brazil
Personal Hygiene* Wiping*
Construction Filtration
Medical Other
A new, dynamic and growing market region
for Suominen
• Demographic factors (including the growth of middle
class) increase the demand for nonwovens products,
such as baby wipes and hygiene products.
Suominen Corporation 30 Jan 2014 23
*) Suominen markets.
Figures refer to 2010. Sources: Freedonia, Suominen. Source: Freedonia
20
30
40
50
60
100
200
300
400
500
600
2010 2015 2020
1000 t 1000 t Demand growth in Brazil
Demand for nonwovens Demand for wiping products
Suominen
market
share
15-20%
Paulínia plant in brief
• The plant manufactures nonwovens principally for wipes growth for Suominen’s
Convenience business area
• Additionally, there is an opportunity to expand the production capability to hygiene
and medical products to serve Suominen’s Care business area.
• Paulínia plant is the only nonwovens facility utilizing modern spunlace technology in
manufacturing wiping products in the country.
• The annual sales of the plant currently appr. 20 MEUR, free capacity available for
future growth.
• The profitability of the plant is above the average profitability of other Suominen’s
plants the deal increases the share of products with higher value add in our
portfolio.
• The plant is built in 2008 and it employes some 40 people.
Suominen Corporation 30 Jan 2014
24
30 Jan 2014 25
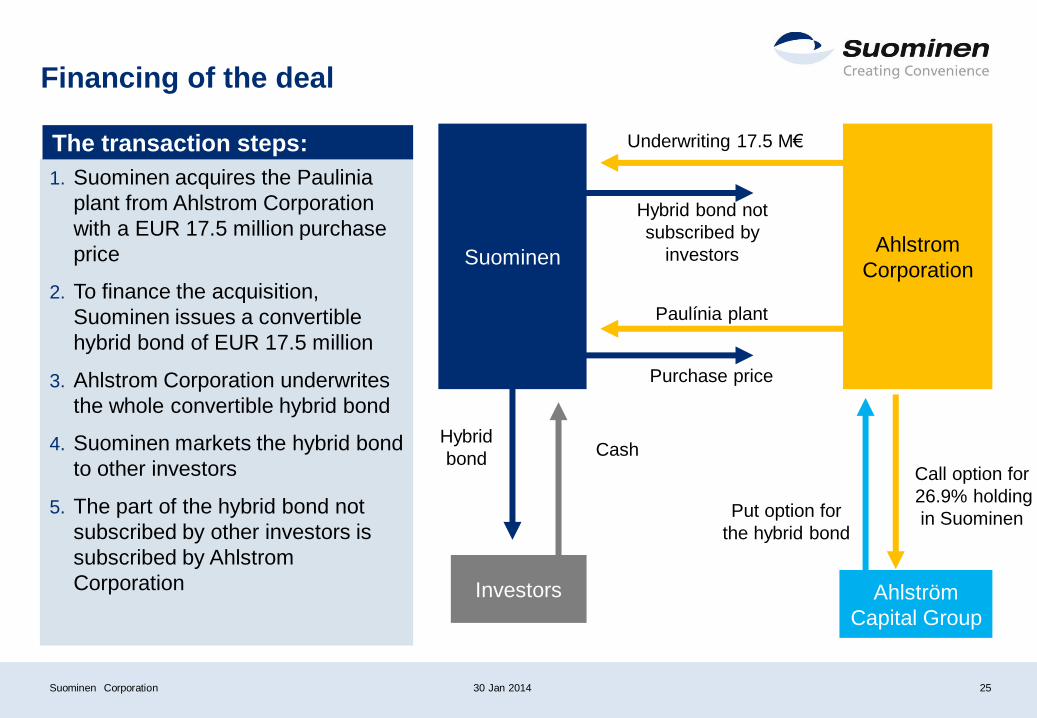
Financing of the deal
Suominen
Underwriting 17.5 M€
Hybrid bond not
subscribed by
investors
Paulínia plant
Purchase price
Ahlstrom
Corporation
Investors
Hybrid
bond Cash
1. Suominen acquires the Paulinia
plant from Ahlstrom Corporation
with a EUR 17.5 million purchase
price
2. To finance the acquisition,
Suominen issues a convertible
hybrid bond of EUR 17.5 million
3. Ahlstrom Corporation underwrites
the whole convertible hybrid bond
4. Suominen markets the hybrid bond
to other investors
5. The part of the hybrid bond not
subscribed by other investors is
subscribed by Ahlstrom
Corporation
The transaction steps:
Suominen Corporation
Ahlström
Capital Group
Put option for
the hybrid bond
Call option for
26.9% holding
in Suominen
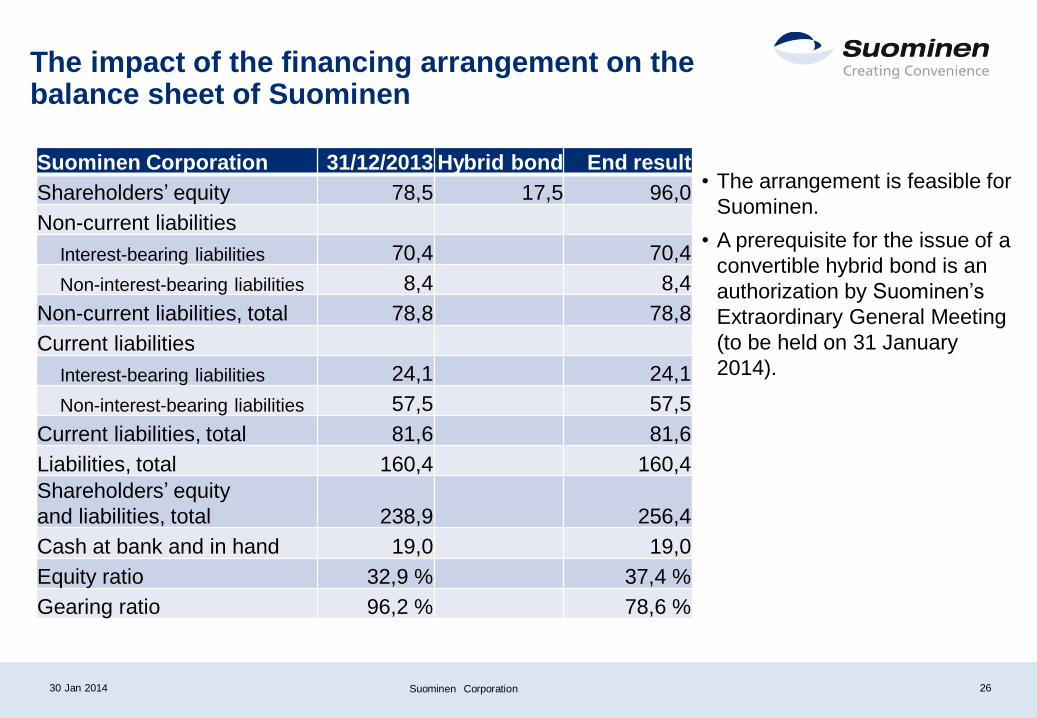
The impact of the financing arrangement on the balance sheet of Suominen
• The arrangement is feasible for
Suominen.
• A prerequisite for the issue of a
convertible hybrid bond is an
authorization by Suominen’s
Extraordinary General Meeting
(to be held on 31 January
2014).
Suominen Corporation 30 Jan 2014 26
Suominen Corporation 31/12/2013 Hybrid bond End result
Shareholders’ equity 78,5 17,5 96,0
Non-current liabilities
Interest-bearing liabilities 70,4 70,4
Non-interest-bearing liabilities 8,4 8,4
Non-current liabilities, total 78,8 78,8
Current liabilities
Interest-bearing liabilities 24,1 24,1
Non-interest-bearing liabilities 57,5 57,5
Current liabilities, total 81,6 81,6
Liabilities, total 160,4 160,4
Shareholders’ equity
and liabilities, total 238,9 256,4
Cash at bank and in hand 19,0 19,0
Equity ratio 32,9 % 37,4 %
Gearing ratio 96,2 % 78,6 %
Summary
Suominen Corporation 30 Jan 2014 27
Right direction
Financials at
new level
2014
Suominen’s overall development in 2013
was in accordance with our plans.
Net sales and operating profit excluding non-
recurring items grew (continuing operations).
Renewed operating model, clarified position in
value chain and expansion to South America -
an exciting start for 2014 for Suominen.

Thank you!
30 Jan 2014 Suominen Corporation 28
Appendices
30 Jan 2014 Suominen Corporation 29

Suominen locations after the closing
30
Production plant
Sales office
Paulínia, Brazil
30 Jan 2014 Suominen Corporation
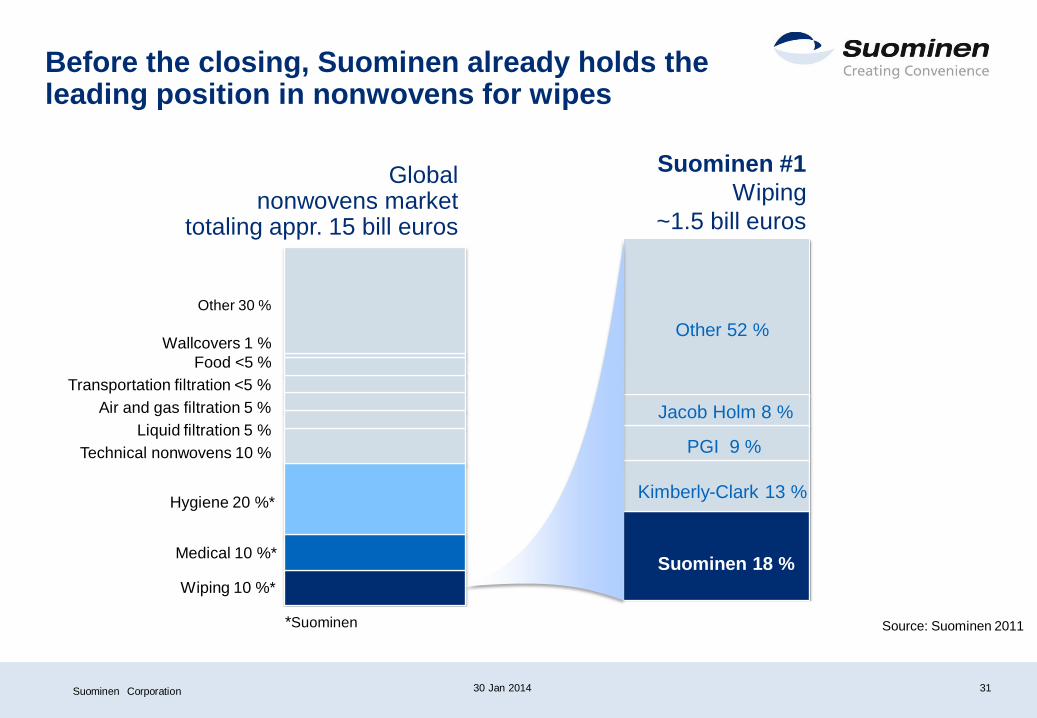
Source: Suominen 2011
Wiping 10 %*
Medical 10 %*
Hygiene 20 %*
Technical nonwovens 10 %
Liquid filtration 5 %
Air and gas filtration 5 %
Transportation filtration <5 %
Food <5 %
Wallcovers 1 %
Other 30 %
Suominen 18 %
Kimberly-Clark 13 %
PGI 9 %
Jacob Holm 8 %
Other 52 %
Before the closing, Suominen already holds the leading position in nonwovens for wipes
Global nonwovens market
totaling appr. 15 bill euros
Suominen #1
Wiping
~1.5 bill euros
*Suominen
Suominen Corporation 31 30 Jan 2014

Main terms and conditions of the convertible hybrid bond
Suominen Corporation 30 Jan 2014 32
Amount / Status
Subscription period
Date of issue
Maturity
Step up / Call-date
Indicative coupon
Conversion right
Conversion price
Dividend protection
Listing
Coupon step-up
EUR 17.5m / Hybrid bond
3 Feb 2014 – 4 Feb 2014 (tentative)
10 Feb 2014 (tentative)
Perpetual
4 years
Fixed coupon of 5.95% (PIK before first call date, thereafter cash interest)
American;; conversion right expires on the first call date
EUR 0.50 per share
No. If dividends will be paid, same proporation will be paid as cash interest.
No
After 4 years 6.95%, after 5th year 7.95%
Underwriting Ahlstrom Corporation has committed to subscribing for the bond


