Download - Sunny Optical Technology Group Co., Limited
DISCLOSURE APPENDIX CONTAINS ANALYST CERTIFICATIONS AND THE STATUS OF NON US ANALYSTS. US Disclosure: Credit Suisse does and seeks to do business with companies covered in its research reports. As a result, investors should be aware that the Firm may have a conflict of interest that could affect the objectivity of this report. Investors should consider this report as only a single factor in making their investment decision.
CREDIT SUISSE SECURITIES RESEARCH & ANALYTICS BEYOND INFORMATION®
Client-Driven Solutions, Insights, and Access
06 March 2013
Asia Pacific/China
Equity Research
Electronic Components & Connectors
Sunny Optical Technology Group Co., Limited (2382.HK / 2382 HK)
INITIATION
Lights, camera, action!
■ Initiating with an OUTPERFORM rating. Sunny Optical is a camera lens /
module producer with a dominant market share with branded Chinese
smartphone vendors. While the stock has outperformed the market
significantly over the past year, we believe the shares still have plenty of
room to run. Sunny Optical feeds off one of the best unit growth stories
around in tech, has a dominant position, the product cycle is in its favour,
further upside potential exists from newer technologies (3D gesture
detectors and array cameras) and the stock is still not well covered.
■ Strong unit growth with stable gross margins. As a leading supplier with
a ~50% share in China smartphone brands (ex-white-box), we expect Sunny
Optical to benefit from the sharp ramp up of branded Chinese smartphones
(estimated to grow ~2.4x over 2012-15E). Moreover, a strong product cycle
in handset cameras (pixel migration from 5MP to 8MP to 13MP) is boosting
ASP and mix, negating the impact of the usual like-to-like price declines. An
additional factor helping to maintain margins at the company level is its
strategy to produce more of its high-resolution lens in-house.
■ We are above consensus. Our 2013-14E EPS estimates are 16%/33%
above IBES, primarily because we are ahead of street in: (1) handset
camera sales growth (driven by pixel migration and overseas customer
penetration), and (2) high-margin specialty products (vehicle/ infrared lenses
and specialty cameras including 3D gesture detectors and array cameras).
■ Valuations should expand further. Our TP of HK$10.00 is based on 15x
FY13E P/E — in line with peers. We believe Sunny Optical merits a richer
multiple given its leadership position, strong execution, robust earnings
growth and the potential for further EPS upgrades. Key risks: lower-than-
expected China smartphone builds, component shortages and competition.
Share price performance
The price relative chart measures performance against the
MSCI CHINA F IDX which closed at 6363.92 on 06/03/13
On 06/03/13 the spot exchange rate was HK$7.76/US$1
Performance Over 1M 3M 12M Absolute (%) 15.8 48.5 198.1 Relative (%) 20.4 45.6 193.0
Financial and valuation metrics
Year 12/11A 12/12E 12/13E 12/14E Revenue (Rmb mn) 2,498.5 3,982.0 6,191.3 8,643.0 EBITDA (Rmb mn) 303.2 491.4 771.7 1,030.9 EBIT (Rmb mn) 211.5 334.8 551.5 766.6 Net profit (Rmb mn) 215.3 327.5 508.7 699.6 EPS (CS adj.) (Rmb) 0.22 0.34 0.53 0.72 Change from previous EPS (%) n.a. Consensus EPS (Rmb) n.a. 0.34 0.45 0.54 EPS growth (%) 51.7 52.1 55.3 37.5 P/E (x) 28.9 19.0 12.2 8.9 Dividend yield (%) 1.1 1.6 2.5 3.4 EV/EBITDA (x) 20.7 13.1 8.3 6.0 P/B (x) 3.8 3.2 2.6 2.1 ROE (%) 13.3 17.8 23.4 26.4 Net debt/equity (%) net cash net cash net cash net cash
Source: Company data, Thomson Reuters, Credit Suisse estimates.
0
100
200
300
400
0
5
10
Mar-11 Jul-11 Nov-11 Mar-12 Jul-12 Nov-12
Price (LHS) Rebased Rel (RHS)
Rating OUTPERFORM Price (06 Mar 13, HK$) 8.05 Target price (HK$) 10.00¹ Upside/downside (%) 24.2 Mkt cap (HK$ mn) 8,050 (US$ 1,038) Enterprise value (Rmb mn) 6,425 Number of shares (mn) 1,000.00 Free float (%) 49.0 52-week price range 8.05 - 2.24 ADTO - 6M (US$ mn) 4.3
*Stock ratings are relative to the coverage universe in each
analyst's or each team's respective sector.
¹Target price is for 12 months.
Research Analysts
Yan Taw Boon
852 2101 7039
Manish Nigam
852 2101 7067
06 March 2013
Sunny Optical Technology Group Co., Limited (2382.HK / 2382 HK) 2
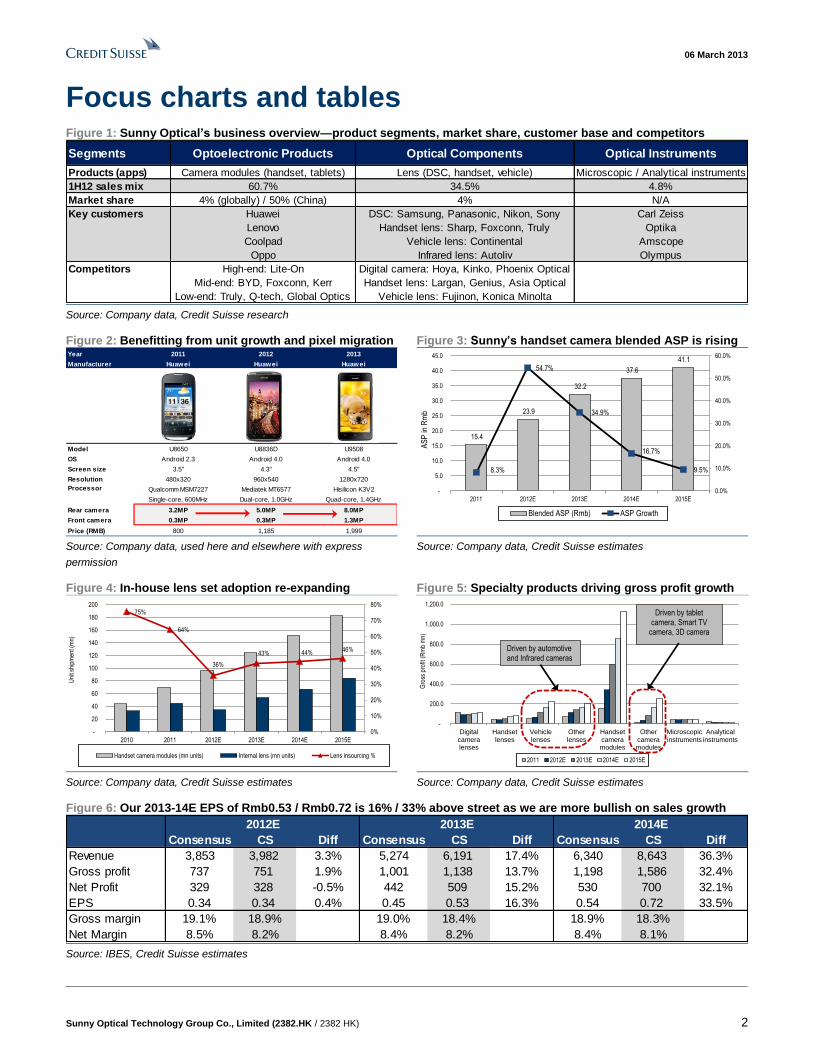
Focus charts and tables Figure 1: Sunny Optical’s business overview—product segments, market share, customer base and competitors
Source: Company data, Credit Suisse research
Figure 2: Benefitting from unit growth and pixel migration Figure 3: Sunny’s handset camera blended ASP is rising
Source: Company data, used here and elsewhere with express
permission
Source: Company data, Credit Suisse estimates
Figure 4: In-house lens set adoption re-expanding Figure 5: Specialty products driving gross profit growth
Source: Company data, Credit Suisse estimates Source: Company data, Credit Suisse estimates
Figure 6: Our 2013-14E EPS of Rmb0.53 / Rmb0.72 is 16% / 33% above street as we are more bullish on sales growth
Source: IBES, Credit Suisse estimates
Segments Optoelectronic Products Optical Components Optical Instruments
Products (apps) Camera modules (handset, tablets) Lens (DSC, handset, vehicle) Microscopic / Analytical instruments
1H12 sales mix 60.7% 34.5% 4.8%
Market share 4% (globally) / 50% (China) 4% N/A
Key customers Huawei DSC: Samsung, Panasonic, Nikon, Sony Carl Zeiss
Lenovo Handset lens: Sharp, Foxconn, Truly Optika
Coolpad Vehicle lens: Continental Amscope
Oppo Infrared lens: Autoliv Olympus
Competitors High-end: Lite-On Digital camera: Hoya, Kinko, Phoenix Optical
Mid-end: BYD, Foxconn, Kerr Handset lens: Largan, Genius, Asia Optical
Low-end: Truly, Q-tech, Global Optics Vehicle lens: Fujinon, Konica Minolta
Year 2011 2012 2013
Manufacturer Huawei Huawei Huawei
Model U8650 U8836D U9508
OS Android 2.3 Android 4.0 Android 4.0
Screen size 3.5" 4.3" 4.5"
Resolution 480x320 960x540 1280x720
Qualcomm MSM7227 Mediatek MT6577 Hisilicon K3V2
Single-core, 600MHz Dual-core, 1.0GHz Quad-core, 1.4GHz
Rear camera 3.2MP 5.0MP 8.0MP
Front camera 0.3MP 0.3MP 1.3MP
Price (RMB) 800 1,185 1,999
Processor
15.4
23.9
32.2
37.6
41.1
8.3%
54.7%
34.9%
16.7%
9.5%
0.0%
10.0%
20.0%
30.0%
40.0%
50.0%
60.0%
-
5.0
10.0
15.0
20.0
25.0
30.0
35.0
40.0
45.0
2011 2012E 2013E 2014E 2015E
AS
P in
Rm
b
Blended ASP (Rmb) ASP Growth
75%
64%
36%
43% 44% 46%
0%
10%
20%
30%
40%
50%
60%
70%
80%
-
20
40
60
80
100
120
140
160
180
200
2010 2011 2012E 2013E 2014E 2015E
Uni
t shi
pmen
t (m
n)
Handset camera modules (mn units) Internal lens (mn units) Lens insourcing %
-
200.0
400.0
600.0
800.0
1,000.0
1,200.0
Digitalcameralenses
Handsetlenses
Vehiclelenses
Otherlenses
Handsetcameramodules
Othercameramodules
Microscopicinstruments
Analyticalinstruments
Gro
ss p
rofit
(R
mb
mn)
2011 2012E 2013E 2014E 2015E
Driven by automotive and Infrared cameras
Driven by tablet camera, Smart TV
camera, 3D camera
Consensus CS Diff Consensus CS Diff Consensus CS Diff
Revenue 3,853 3,982 3.3% 5,274 6,191 17.4% 6,340 8,643 36.3%
Gross profit 737 751 1.9% 1,001 1,138 13.7% 1,198 1,586 32.4%
Net Profit 329 328 -0.5% 442 509 15.2% 530 700 32.1%
EPS 0.34 0.34 0.4% 0.45 0.53 16.3% 0.54 0.72 33.5%
Gross margin 19.1% 18.9% 19.0% 18.4% 18.9% 18.3%
Net Margin 8.5% 8.2% 8.4% 8.2% 8.4% 8.1%
2012E 2013E 2014E
06 March 2013
Sunny Optical Technology Group Co., Limited (2382.HK / 2382 HK) 3
Lights, camera, action! We initiate coverage on Sunny Optical with an OUTPERFORM rating and a TP of HK$10.0.
Our positive stance is based on Sunny Optical’s: (1) dominant position in China smartphone
supply chain and robust unit shipment growth, (2) view of sustainable earnings growth driven
by pixel migration, (3) potential penetration at global tier one customers, and (4) upside
potential from specialty products (vehicle/IR lenses, tablets, gesture control, array cameras).
Riding on China smartphone growth
Sunny Optical is a leading handset camera lens/module maker in China (over 60% of
revenue from handset cameras) with top-tier Chinese smartphone OEMs (Huawei,
Lenovo, Coolpad, Oppo) as its customers. We estimate that branded Chinese smartphone
builds will see a 172% CAGR over 2011-15E, from 43 mn units to 382 mn units, driven by
share gains in the domestic market and export channel expansion. With its dominant
share (~50%) in branded Chines smartphones, we view Sunny Optical as one of the best
proxies of China smartphone growth. While competition is intense, Sunny Optical is
solidifying its position with its edge in vertical integration, strong optical imaging know-how
and long-standing customer relationship. China smartphone camera pixel migration is
raising the entry barrier further, widening the gap against domestic low-end competitors.
Mix improvement + lens insourcing = stable margins
Rapid smartphone market growth is leading to aggressive camera pixel migration as
OEMs compete to provide better imaging experience to consumers. Chinese smartphone
brands are still one generation behind at 3MP/5MP versus global brands which are ahead
at 5MP/8MP. As Chinese smartphones play catch up in pixel migration, we expect Sunny
Optical’s sales mix of 8MP and above camera modules to rise from 18.5% in 2012E to
50.3%/77.6%/88.6% over 2013-15E. Despite a like-to-like price erosion of 10-30%, rising
sales of high-resolution camera modules should drive blended ASP higher. Further, as the
company improves its high-resolution handset lens production capability, we look for a
rebound in its lens insourcing starting 2Q13E. We expect improving product mix and
increase insourcing of lenses to lead to sustainable gross margins (c.15%) in 2013-15E.
Specialty products providing upside
Beyond handset cameras, multiple new products are emerging as key earnings drivers,
such as vehicle / infrared lens, tablet cameras, Smart TV cameras and other specialty
cameras (gesture control and array cameras). While Sunny Optical is likely to gain more
lens outsourcing orders from Japanese digital still camera (DSC) makers, we do not
expect its DSC product sales to grow over the next few year given the cannibalisation from
smartphones. The rapid expansion of new high-margin specialty products should more
than offset the weaknesses in digital camera-related products, in our view. Future positive
revenue surprise could come if gesture control or if array cameras find wider acceptance.
Street’s earnings estimates look too light
Our 2013/2014 EPS estimates are 16%/33% above consensus as we are more bullish on
blended ASP growth and high-margin specialty products. We expect Sunny to deliver
52%/55%/38%/30% earnings growth in 2012-15E. Our target price of HK$10.0 is based on
15x FY13E P/E, the upper-end of its five-year range and in line with peers. We believe
Sunny deserves a richer valuation given its strong earnings growth, expanding ROE and
potential global tier one customer penetration. Essentially, until last year the stock, was not
big or liquid enough for an institutional holding; hence historical multiples were probably
too low. Key risks include: (1) lower-than-expected growth in China smartphone builds,
(2) component shortage (VCM and 8MP/13MP CIS), (3) intensified pricing pressure in
camera modules, and (4) slower-than-expected ramp-up of specialty cameras/lenses.
Sunny Optical is a key
beneficiary of unit growth in
China smartphone brands
Ramp-up of 8MP/13MP
handset cameras increasing
blended ASPs
Specialty lens and cameras
are emerging as earnings
drivers, offsetting DSC
weaknesses
Sunny, in our view,
deserves a richer valuation
given its earnings
momentum and expanding
ROE
06 March 2013
Sunny Optical Technology Group Co., Limited (2382.HK / 2382 HK) 4
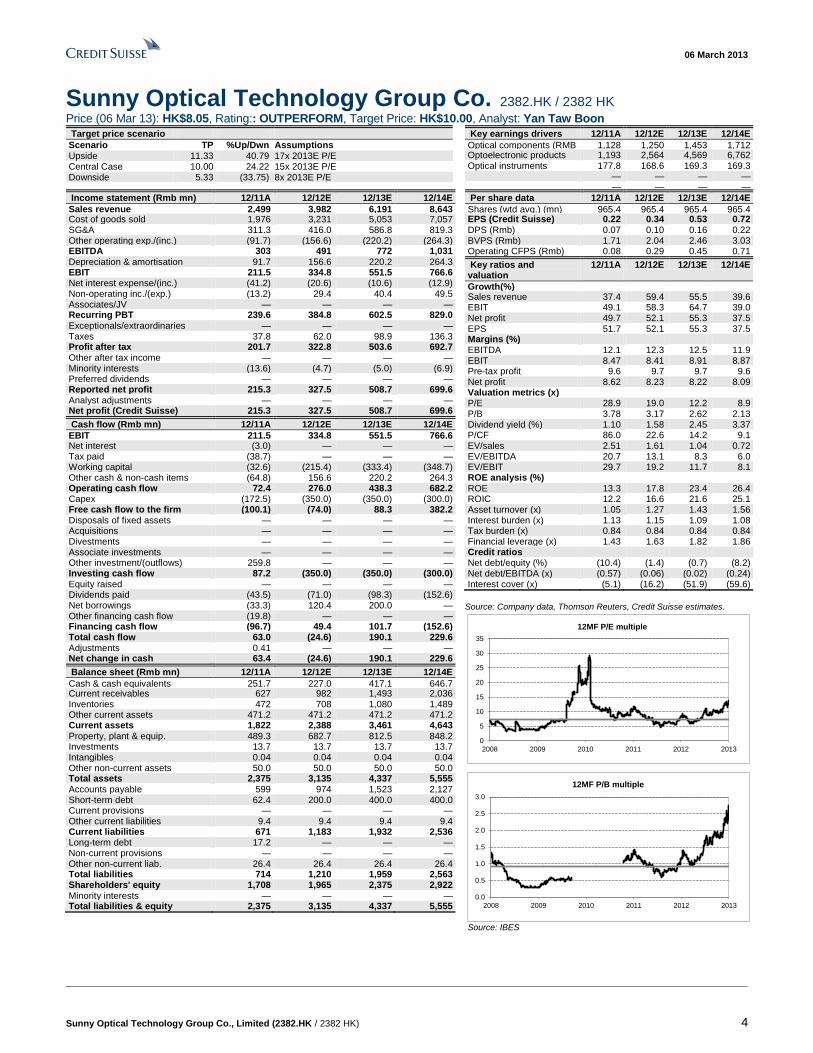
Sunny Optical Technology Group Co. 2382.HK / 2382 HK Price (06 Mar 13): HK$8.05, Rating:: OUTPERFORM, Target Price: HK$10.00, Analyst: Yan Taw Boon
Target price scenario
Scenario TP %Up/Dwn Assumptions Upside 11.33 40.79 17x 2013E P/E Central Case 10.00 24.22 15x 2013E P/E Downside 5.33 (33.75) 8x 2013E P/E
Key earnings drivers 12/11A 12/12E 12/13E 12/14E
Optical components (RMB mn)
1,128 1,250 1,453 1,712 Optoelectronic products 1,193 2,564 4,569 6,762 Optical instruments 177.8 168.6 169.3 169.3 — — — — — — — —
Income statement (Rmb mn) 12/11A 12/12E 12/13E 12/14E
Sales revenue 2,499 3,982 6,191 8,643 Cost of goods sold 1,976 3,231 5,053 7,057 SG&A 311.3 416.0 586.8 819.3 Other operating exp./(inc.) (91.7) (156.6) (220.2) (264.3) EBITDA 303 491 772 1,031 Depreciation & amortisation 91.7 156.6 220.2 264.3 EBIT 211.5 334.8 551.5 766.6 Net interest expense/(inc.) (41.2) (20.6) (10.6) (12.9) Non-operating inc./(exp.) (13.2) 29.4 40.4 49.5 Associates/JV — — — — Recurring PBT 239.6 384.8 602.5 829.0 Exceptionals/extraordinaries — — — — Taxes 37.8 62.0 98.9 136.3 Profit after tax 201.7 322.8 503.6 692.7 Other after tax income — — — — Minority interests (13.6) (4.7) (5.0) (6.9) Preferred dividends — — — — Reported net profit 215.3 327.5 508.7 699.6 Analyst adjustments — — — — Net profit (Credit Suisse) 215.3 327.5 508.7 699.6
Cash flow (Rmb mn) 12/11A 12/12E 12/13E 12/14E
EBIT 211.5 334.8 551.5 766.6 Net interest (3.0) — — — Tax paid (38.7) — — — Working capital (32.6) (215.4) (333.4) (348.7) Other cash & non-cash items (64.8) 156.6 220.2 264.3 Operating cash flow 72.4 276.0 438.3 682.2 Capex (172.5) (350.0) (350.0) (300.0) Free cash flow to the firm (100.1) (74.0) 88.3 382.2 Disposals of fixed assets — — — — Acquisitions — — — — Divestments — — — — Associate investments — — — — Other investment/(outflows) 259.8 — — — Investing cash flow 87.2 (350.0) (350.0) (300.0) Equity raised — — — — Dividends paid (43.5) (71.0) (98.3) (152.6) Net borrowings (33.3) 120.4 200.0 — Other financing cash flow (19.8) — — — Financing cash flow (96.7) 49.4 101.7 (152.6) Total cash flow 63.0 (24.6) 190.1 229.6 Adjustments 0.41 — — — Net change in cash 63.4 (24.6) 190.1 229.6
Balance sheet (Rmb mn) 12/11A 12/12E 12/13E 12/14E
Cash & cash equivalents 251.7 227.0 417.1 646.7 Current receivables 627 982 1,493 2,036 Inventories 472 708 1,080 1,489 Other current assets 471.2 471.2 471.2 471.2 Current assets 1,822 2,388 3,461 4,643 Property, plant & equip. 489.3 682.7 812.5 848.2 Investments 13.7 13.7 13.7 13.7 Intangibles 0.04 0.04 0.04 0.04 Other non-current assets 50.0 50.0 50.0 50.0 Total assets 2,375 3,135 4,337 5,555 Accounts payable 599 974 1,523 2,127 Short-term debt 62.4 200.0 400.0 400.0 Current provisions — — — — Other current liabilities 9.4 9.4 9.4 9.4 Current liabilities 671 1,183 1,932 2,536 Long-term debt 17.2 — — — Non-current provisions — — — — Other non-current liab. 26.4 26.4 26.4 26.4 Total liabilities 714 1,210 1,959 2,563 Shareholders' equity 1,708 1,965 2,375 2,922 Minority interests — — — — Total liabilities & equity 2,375 3,135 4,337 5,555
Per share data 12/11A 12/12E 12/13E 12/14E
Shares (wtd avg.) (mn) 965.4 965.4 965.4 965.4 EPS (Credit Suisse) (Rmb)
0.22 0.34 0.53 0.72 DPS (Rmb) 0.07 0.10 0.16 0.22 BVPS (Rmb) 1.71 2.04 2.46 3.03 Operating CFPS (Rmb) 0.08 0.29 0.45 0.71
Key ratios and valuation
12/11A 12/12E 12/13E 12/14E
Growth(%) Sales revenue 37.4 59.4 55.5 39.6 EBIT 49.1 58.3 64.7 39.0 Net profit 49.7 52.1 55.3 37.5 EPS 51.7 52.1 55.3 37.5 Margins (%) EBITDA 12.1 12.3 12.5 11.9 EBIT 8.47 8.41 8.91 8.87 Pre-tax profit 9.6 9.7 9.7 9.6 Net profit 8.62 8.23 8.22 8.09 Valuation metrics (x) P/E 28.9 19.0 12.2 8.9 P/B 3.78 3.17 2.62 2.13 Dividend yield (%) 1.10 1.58 2.45 3.37 P/CF 86.0 22.6 14.2 9.1 EV/sales 2.51 1.61 1.04 0.72 EV/EBITDA 20.7 13.1 8.3 6.0 EV/EBIT 29.7 19.2 11.7 8.1 ROE analysis (%) ROE 13.3 17.8 23.4 26.4 ROIC 12.2 16.6 21.6 25.1 Asset turnover (x) 1.05 1.27 1.43 1.56 Interest burden (x) 1.13 1.15 1.09 1.08 Tax burden (x) 0.84 0.84 0.84 0.84 Financial leverage (x) 1.43 1.63 1.82 1.86 Credit ratios Net debt/equity (%) (10.4) (1.4) (0.7) (8.2) Net debt/EBITDA (x) (0.57) (0.06) (0.02) (0.24) Interest cover (x) (5.1) (16.2) (51.9) (59.6)
Source: Company data, Thomson Reuters, Credit Suisse estimates.
Source: IBES
0
5
10
15
20
25
30
35
2008 2009 2010 2011 2012 2013
12MF P/E multiple
0.0
0.5
1.0
1.5
2.0
2.5
3.0
2008 2009 2010 2011 2012 2013
12MF P/B multiple
06 March 2013
Sunny Optical Technology Group Co., Limited (2382.HK / 2382 HK) 5
Table of contents Focus charts and tables 2 Lights, camera, action ! 3
Riding on China smartphone growth 3 Mix improvement + lens insourcing = stable margins 3 Specialty products providing upside 3 Street’s earnings estimates are too light 3
Sunny Optical Technology Group Co. 2382.HK / 2382 HK 4 Riding on China smartphone growth 6
A leading China smartphone camera module supplier 6 Global smartphone shipments going higher 7 Chinese smartphone share gains accelerating 7 A small player in a large global market ….. 10 …. and a fragmented supply chain ….. 10 …But dominates the China smartphone supply chain 11 Competitive edges strengthening market position 12
Mix improvement + lens insourcing = stable margins 14 Handset camera pixel migration trend continues 14 Image sensor innovations supporting pixel migration 16 Chinese smartphones migrating to 8/13MP in 2013 17 Pixel migration driving volume growth and better mix 18 Improving mix supporting rising blended ASP 19 Largan saw similar growth due to pixel migration 20 Revamp of in-house lens stabilizing gross margins 20
Specialty products providing upside 22 (1) Vehicle lens: Automotive cameras expanding fast 22 (2) Infrared lens: a long-tail growth opportunity 23 (3) Smart TV video module market growth continues 25 (4) Tablet cameras and emerging specialty cameras 26 Gesture recognition broadening addressable market 27 Array cameras – potentially taking off in 1H14E 30 New products offset digital still camera weakness 31
Street’s earnings estimates too light 32 Earnings outlook 32 Balance sheet analysis 33 CS estimates versus consensus 34 Sensitivity analysis 34 Valuations may expand as growth continues 35 Key risks to our call 36
Appendices 38 Company background 38 Employees and production bases 38 Sunny Optical management team profiles 38 Handset camera lens and modules 39
06 March 2013
Sunny Optical Technology Group Co., Limited (2382.HK / 2382 HK) 6
Riding China smartphone growth We view Sunny Optical as one of the best proxies for China smartphone growth due to its
dominant position (~50% share) in the China supply chain and aggressive camera resolution
migrations in 2013-14E as Chinese smartphone brands expand their product portfolio.
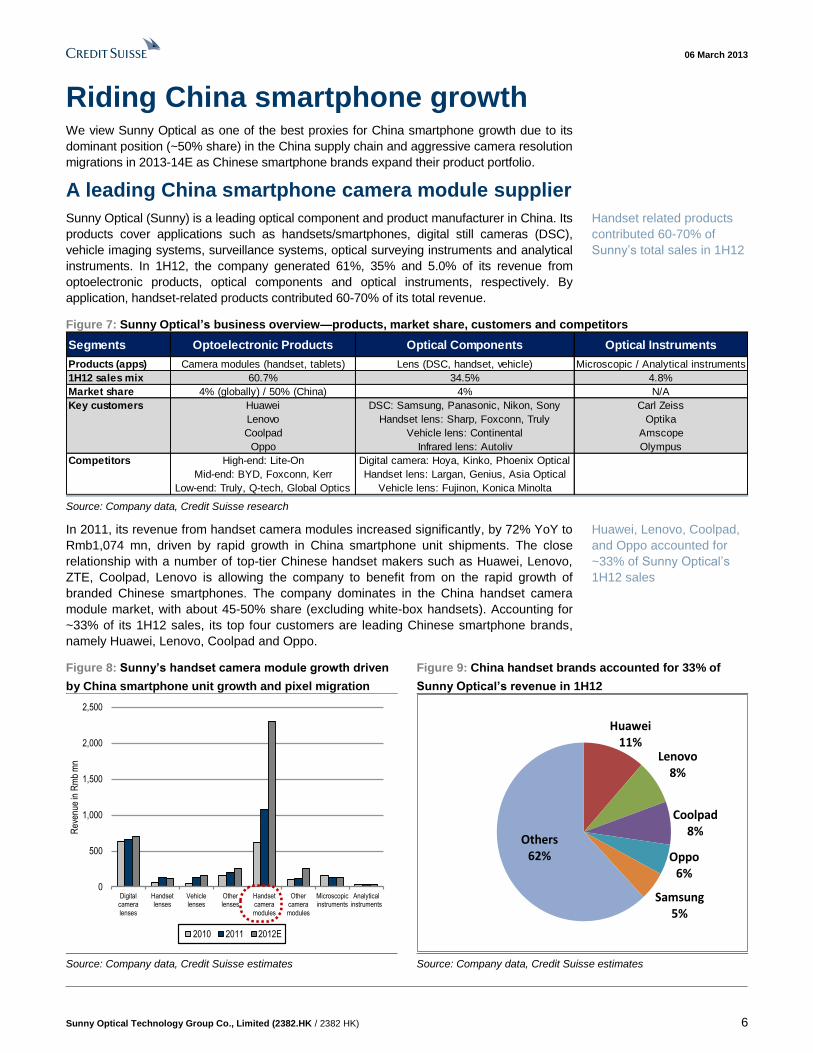
A leading China smartphone camera module supplier
Sunny Optical (Sunny) is a leading optical component and product manufacturer in China. Its
products cover applications such as handsets/smartphones, digital still cameras (DSC),
vehicle imaging systems, surveillance systems, optical surveying instruments and analytical
instruments. In 1H12, the company generated 61%, 35% and 5.0% of its revenue from
optoelectronic products, optical components and optical instruments, respectively. By
application, handset-related products contributed 60-70% of its total revenue.
Figure 7: Sunny Optical’s business overview—products, market share, customers and competitors
Source: Company data, Credit Suisse research
In 2011, its revenue from handset camera modules increased significantly, by 72% YoY to
Rmb1,074 mn, driven by rapid growth in China smartphone unit shipments. The close
relationship with a number of top-tier Chinese handset makers such as Huawei, Lenovo,
ZTE, Coolpad, Lenovo is allowing the company to benefit from on the rapid growth of
branded Chinese smartphones. The company dominates in the China handset camera
module market, with about 45-50% share (excluding white-box handsets). Accounting for
~33% of its 1H12 sales, its top four customers are leading Chinese smartphone brands,
namely Huawei, Lenovo, Coolpad and Oppo.
Figure 8: Sunny’s handset camera module growth driven
by China smartphone unit growth and pixel migration
Figure 9: China handset brands accounted for 33% of
Sunny Optical’s revenue in 1H12
Source: Company data, Credit Suisse estimates Source: Company data, Credit Suisse estimates
Segments Optoelectronic Products Optical Components Optical Instruments
Products (apps) Camera modules (handset, tablets) Lens (DSC, handset, vehicle) Microscopic / Analytical instruments
1H12 sales mix 60.7% 34.5% 4.8%
Market share 4% (globally) / 50% (China) 4% N/A
Key customers Huawei DSC: Samsung, Panasonic, Nikon, Sony Carl Zeiss
Lenovo Handset lens: Sharp, Foxconn, Truly Optika
Coolpad Vehicle lens: Continental Amscope
Oppo Infrared lens: Autoliv Olympus
Competitors High-end: Lite-On Digital camera: Hoya, Kinko, Phoenix Optical
Mid-end: BYD, Foxconn, Kerr Handset lens: Largan, Genius, Asia Optical
Low-end: Truly, Q-tech, Global Optics Vehicle lens: Fujinon, Konica Minolta
0
500
1,000
1,500
2,000
2,500
Digitalcameralenses
Handsetlenses
Vehiclelenses
Otherlenses
Handsetcameramodules
Othercameramodules
Microscopicinstruments
Analyticalinstruments
Rev
enue
in R
mb
mn
2010 2011 2012E
Huawei11%
Lenovo 8%
Coolpad 8%
Oppo 6%
Samsung5%
Others62%
Handset related products
contributed 60-70% of
Sunny’s total sales in 1H12
Huawei, Lenovo, Coolpad,
and Oppo accounted for
~33% of Sunny Optical’s
1H12 sales
06 March 2013
Sunny Optical Technology Group Co., Limited (2382.HK / 2382 HK) 7
Global smartphone shipments rising
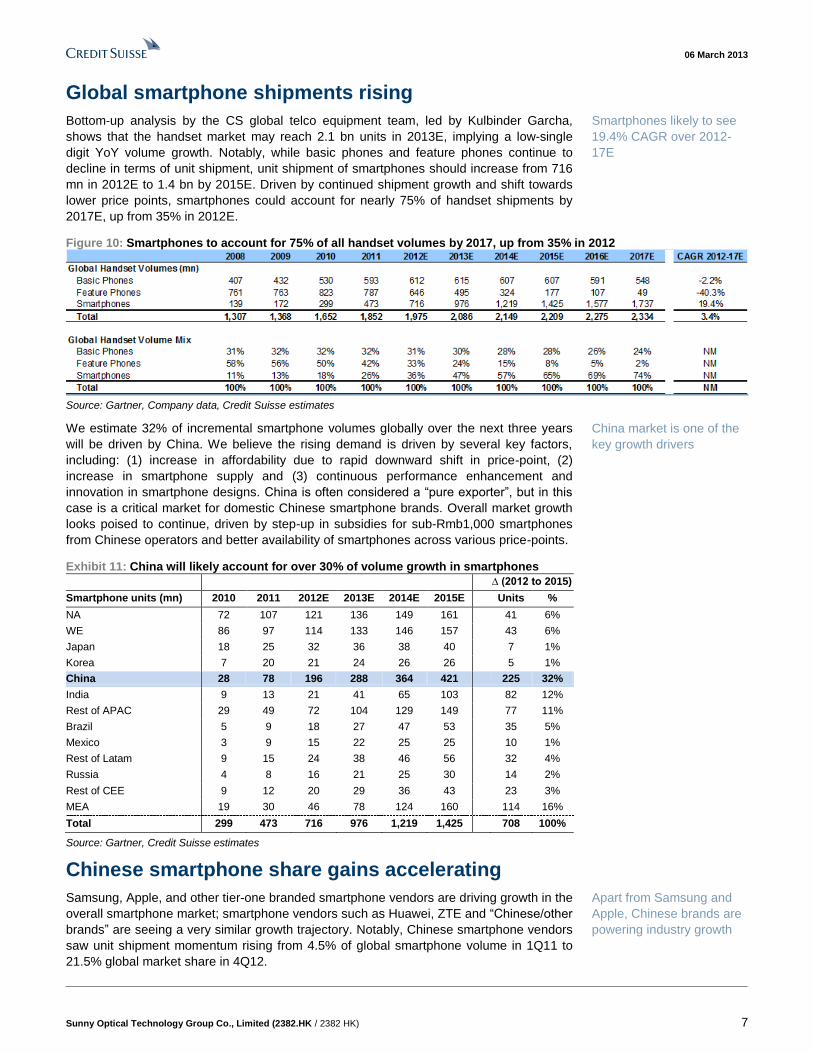
Bottom-up analysis by the CS global telco equipment team, led by Kulbinder Garcha,
shows that the handset market may reach 2.1 bn units in 2013E, implying a low-single
digit YoY volume growth. Notably, while basic phones and feature phones continue to
decline in terms of unit shipment, unit shipment of smartphones should increase from 716
mn in 2012E to 1.4 bn by 2015E. Driven by continued shipment growth and shift towards
lower price points, smartphones could account for nearly 75% of handset shipments by
2017E, up from 35% in 2012E.
Figure 10: Smartphones to account for 75% of all handset volumes by 2017, up from 35% in 2012
Source: Gartner, Company data, Credit Suisse estimates
We estimate 32% of incremental smartphone volumes globally over the next three years
will be driven by China. We believe the rising demand is driven by several key factors,
including: (1) increase in affordability due to rapid downward shift in price-point, (2)
increase in smartphone supply and (3) continuous performance enhancement and
innovation in smartphone designs. China is often considered a “pure exporter”, but in this
case is a critical market for domestic Chinese smartphone brands. Overall market growth
looks poised to continue, driven by step-up in subsidies for sub-Rmb1,000 smartphones
from Chinese operators and better availability of smartphones across various price-points.
Exhibit 11: China will likely account for over 30% of volume growth in smartphones
∆ (2012 to 2015)
Smartphone units (mn) 2010 2011 2012E 2013E 2014E 2015E Units %
NA 72 107 121 136 149 161 41 6%
WE 86 97 114 133 146 157 43 6%
Japan 18 25 32 36 38 40 7 1%
Korea 7 20 21 24 26 26 5 1%
China 28 78 196 288 364 421 225 32%
India 9 13 21 41 65 103 82 12%
Rest of APAC 29 49 72 104 129 149 77 11%
Brazil 5 9 18 27 47 53 35 5%
Mexico 3 9 15 22 25 25 10 1%
Rest of Latam 9 15 24 38 46 56 32 4%
Russia 4 8 16 21 25 30 14 2%
Rest of CEE 9 12 20 29 36 43 23 3%
MEA 19 30 46 78 124 160 114 16%
Total 299 473 716 976 1,219 1,425 708 100%
Source: Gartner, Credit Suisse estimates
Chinese smartphone share gains accelerating
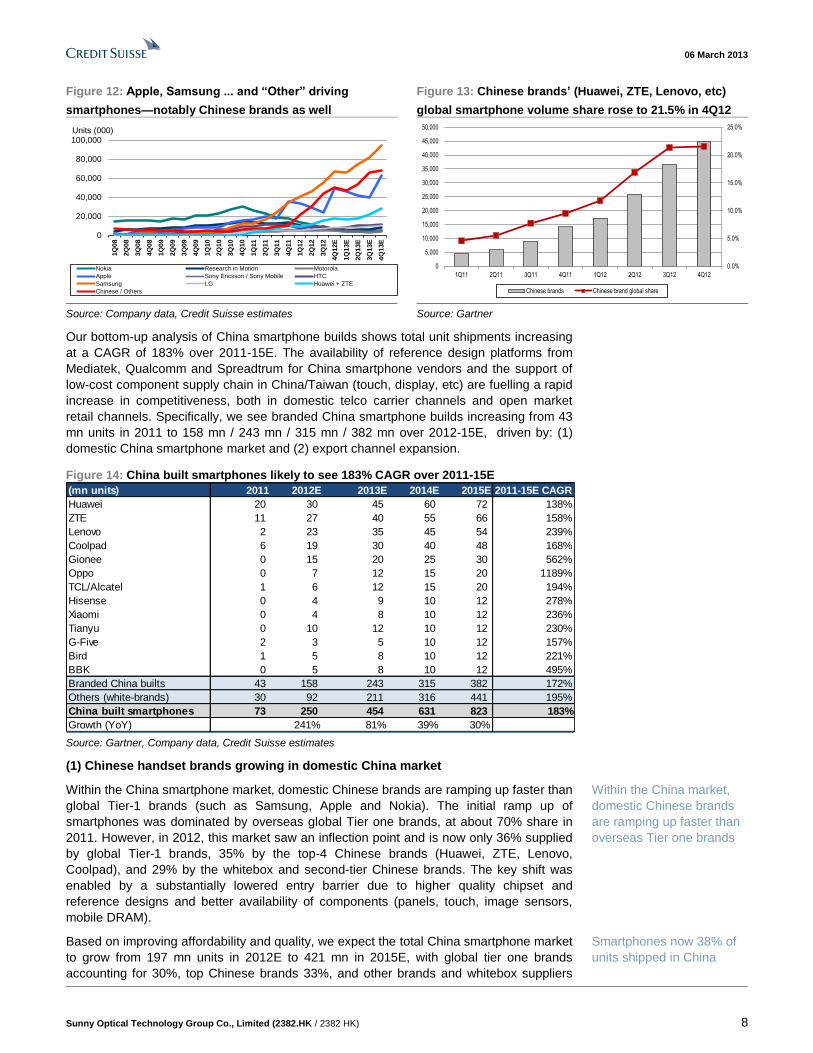
Samsung, Apple, and other tier-one branded smartphone vendors are driving growth in the
overall smartphone market; smartphone vendors such as Huawei, ZTE and “Chinese/other
brands” are seeing a very similar growth trajectory. Notably, Chinese smartphone vendors
saw unit shipment momentum rising from 4.5% of global smartphone volume in 1Q11 to
21.5% global market share in 4Q12.
Smartphones likely to see
19.4% CAGR over 2012-
17E
China market is one of the
key growth drivers
Apart from Samsung and
Apple, Chinese brands are
powering industry growth
06 March 2013
Sunny Optical Technology Group Co., Limited (2382.HK / 2382 HK) 8
Figure 12: Apple, Samsung ... and “Other” driving
smartphones—notably Chinese brands as well
Figure 13: Chinese brands’ (Huawei, ZTE, Lenovo, etc)
global smartphone volume share rose to 21.5% in 4Q12
Source: Company data, Credit Suisse estimates Source: Gartner
Our bottom-up analysis of China smartphone builds shows total unit shipments increasing
at a CAGR of 183% over 2011-15E. The availability of reference design platforms from
Mediatek, Qualcomm and Spreadtrum for China smartphone vendors and the support of
low-cost component supply chain in China/Taiwan (touch, display, etc) are fuelling a rapid
increase in competitiveness, both in domestic telco carrier channels and open market
retail channels. Specifically, we see branded China smartphone builds increasing from 43
mn units in 2011 to 158 mn / 243 mn / 315 mn / 382 mn over 2012-15E, driven by: (1)
domestic China smartphone market and (2) export channel expansion.
Figure 14: China built smartphones likely to see 183% CAGR over 2011-15E
Source: Gartner, Company data, Credit Suisse estimates
(1) Chinese handset brands growing in domestic China market
Within the China smartphone market, domestic Chinese brands are ramping up faster than
global Tier-1 brands (such as Samsung, Apple and Nokia). The initial ramp up of
smartphones was dominated by overseas global Tier one brands, at about 70% share in
2011. However, in 2012, this market saw an inflection point and is now only 36% supplied
by global Tier-1 brands, 35% by the top-4 Chinese brands (Huawei, ZTE, Lenovo,
Coolpad), and 29% by the whitebox and second-tier Chinese brands. The key shift was
enabled by a substantially lowered entry barrier due to higher quality chipset and
reference designs and better availability of components (panels, touch, image sensors,
mobile DRAM).
Based on improving affordability and quality, we expect the total China smartphone market
to grow from 197 mn units in 2012E to 421 mn in 2015E, with global tier one brands
accounting for 30%, top Chinese brands 33%, and other brands and whitebox suppliers
0
20,000
40,000
60,000
80,000
100,000
1Q
08
2Q
08
3Q
08
4Q
08
1Q
09
2Q
09
3Q
09
4Q
09
1Q
10
2Q
10
3Q
10
4Q
10
1Q
11
2Q
11
3Q
11
4Q
11
1Q
12
2Q
12
3Q
12
4Q
12E
1Q
13E
2Q
13E
3Q
13E
4Q
13E
Units (000)
Nokia Research in Motion Motorola
Apple Sony Ericsson / Sony Mobile HTC
Samsung LG Huawei + ZTE
Chinese / Others
0.0%
5.0%
10.0%
15.0%
20.0%
25.0%
0
5,000
10,000
15,000
20,000
25,000
30,000
35,000
40,000
45,000
50,000
1Q11 2Q11 3Q11 4Q11 1Q12 2Q12 3Q12 4Q12
Chinese brands Chinese brand global share
(mn units) 2011 2012E 2013E 2014E 2015E 2011-15E CAGR
Huawei 20 30 45 60 72 138%
ZTE 11 27 40 55 66 158%
Lenovo 2 23 35 45 54 239%
Coolpad 6 19 30 40 48 168%
Gionee 0 15 20 25 30 562%
Oppo 0 7 12 15 20 1189%
TCL/Alcatel 1 6 12 15 20 194%
Hisense 0 4 9 10 12 278%
Xiaomi 0 4 8 10 12 236%
Tianyu 0 10 12 10 12 230%
G-Five 2 3 5 10 12 157%
Bird 1 5 8 10 12 221%
BBK 0 5 8 10 12 495%
Branded China builts 43 158 243 315 382 172%
Others (white-brands) 30 92 211 316 441 195%
China built smartphones 73 250 454 631 823 183%
Growth (YoY) 241% 81% 39% 30%
Within the China market,
domestic Chinese brands
are ramping up faster than
overseas Tier one brands
Smartphones now 38% of
units shipped in China
06 March 2013
Sunny Optical Technology Group Co., Limited (2382.HK / 2382 HK) 9
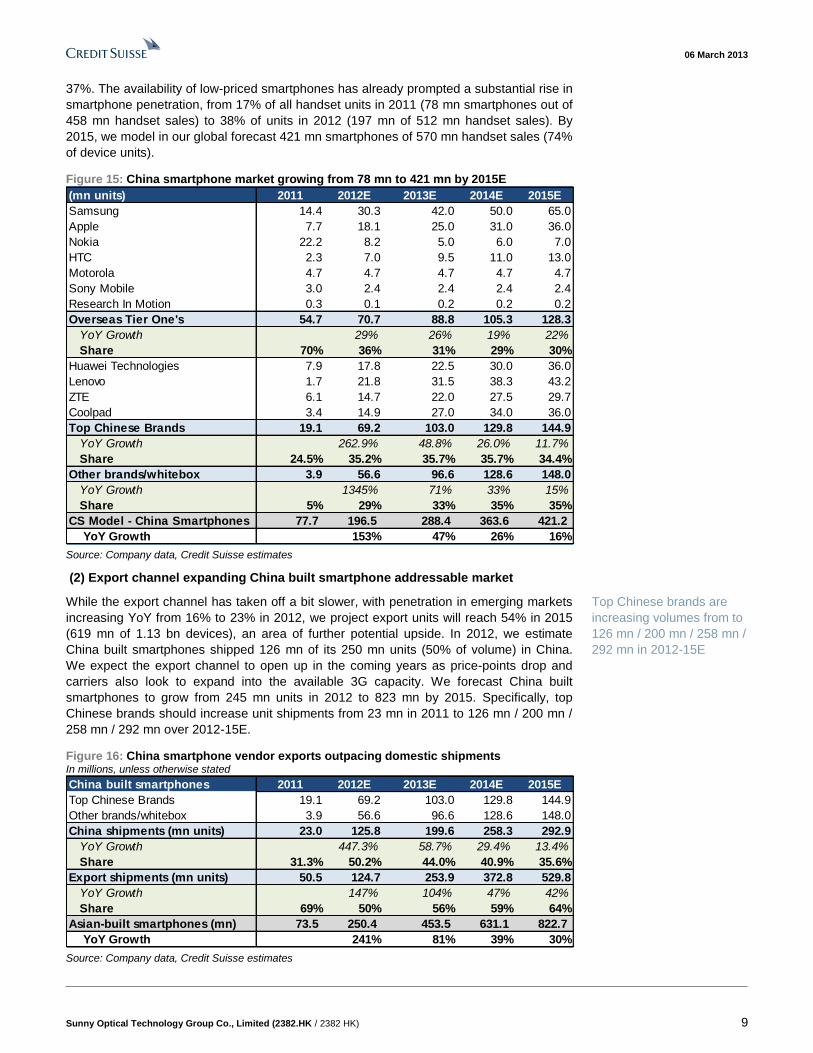
37%. The availability of low-priced smartphones has already prompted a substantial rise in
smartphone penetration, from 17% of all handset units in 2011 (78 mn smartphones out of
458 mn handset sales) to 38% of units in 2012 (197 mn of 512 mn handset sales). By
2015, we model in our global forecast 421 mn smartphones of 570 mn handset sales (74%
of device units).
Figure 15: China smartphone market growing from 78 mn to 421 mn by 2015E
Source: Company data, Credit Suisse estimates
(2) Export channel expanding China built smartphone addressable market
While the export channel has taken off a bit slower, with penetration in emerging markets
increasing YoY from 16% to 23% in 2012, we project export units will reach 54% in 2015
(619 mn of 1.13 bn devices), an area of further potential upside. In 2012, we estimate
China built smartphones shipped 126 mn of its 250 mn units (50% of volume) in China.
We expect the export channel to open up in the coming years as price-points drop and
carriers also look to expand into the available 3G capacity. We forecast China built
smartphones to grow from 245 mn units in 2012 to 823 mn by 2015. Specifically, top
Chinese brands should increase unit shipments from 23 mn in 2011 to 126 mn / 200 mn /
258 mn / 292 mn over 2012-15E.
Figure 16: China smartphone vendor exports outpacing domestic shipments In millions, unless otherwise stated
Source: Company data, Credit Suisse estimates
(mn units) 2011 2012E 2013E 2014E 2015E
Samsung 14.4 30.3 42.0 50.0 65.0
Apple 7.7 18.1 25.0 31.0 36.0
Nokia 22.2 8.2 5.0 6.0 7.0
HTC 2.3 7.0 9.5 11.0 13.0
Motorola 4.7 4.7 4.7 4.7 4.7
Sony Mobile 3.0 2.4 2.4 2.4 2.4
Research In Motion 0.3 0.1 0.2 0.2 0.2
Overseas Tier One's 54.7 70.7 88.8 105.3 128.3
YoY Growth 29% 26% 19% 22%
Share 70% 36% 31% 29% 30%
Huawei Technologies 7.9 17.8 22.5 30.0 36.0
Lenovo 1.7 21.8 31.5 38.3 43.2
ZTE 6.1 14.7 22.0 27.5 29.7
Coolpad 3.4 14.9 27.0 34.0 36.0
Top Chinese Brands 19.1 69.2 103.0 129.8 144.9
YoY Growth 262.9% 48.8% 26.0% 11.7%
Share 24.5% 35.2% 35.7% 35.7% 34.4%
Other brands/whitebox 3.9 56.6 96.6 128.6 148.0
YoY Growth 1345% 71% 33% 15%
Share 5% 29% 33% 35% 35%
CS Model - China Smartphones 77.7 196.5 288.4 363.6 421.2
YoY Growth 153% 47% 26% 16%
China built smartphones 2011 2012E 2013E 2014E 2015E
Top Chinese Brands 19.1 69.2 103.0 129.8 144.9
Other brands/whitebox 3.9 56.6 96.6 128.6 148.0
China shipments (mn units) 23.0 125.8 199.6 258.3 292.9
YoY Growth 447.3% 58.7% 29.4% 13.4%
Share 31.3% 50.2% 44.0% 40.9% 35.6%
Export shipments (mn units) 50.5 124.7 253.9 372.8 529.8
YoY Growth 147% 104% 47% 42%
Share 69% 50% 56% 59% 64%
Asian-built smartphones (mn) 73.5 250.4 453.5 631.1 822.7
YoY Growth 241% 81% 39% 30%
Top Chinese brands are
increasing volumes from to
126 mn / 200 mn / 258 mn /
292 mn in 2012-15E
06 March 2013
Sunny Optical Technology Group Co., Limited (2382.HK / 2382 HK) 10
A small player in a large global market …..
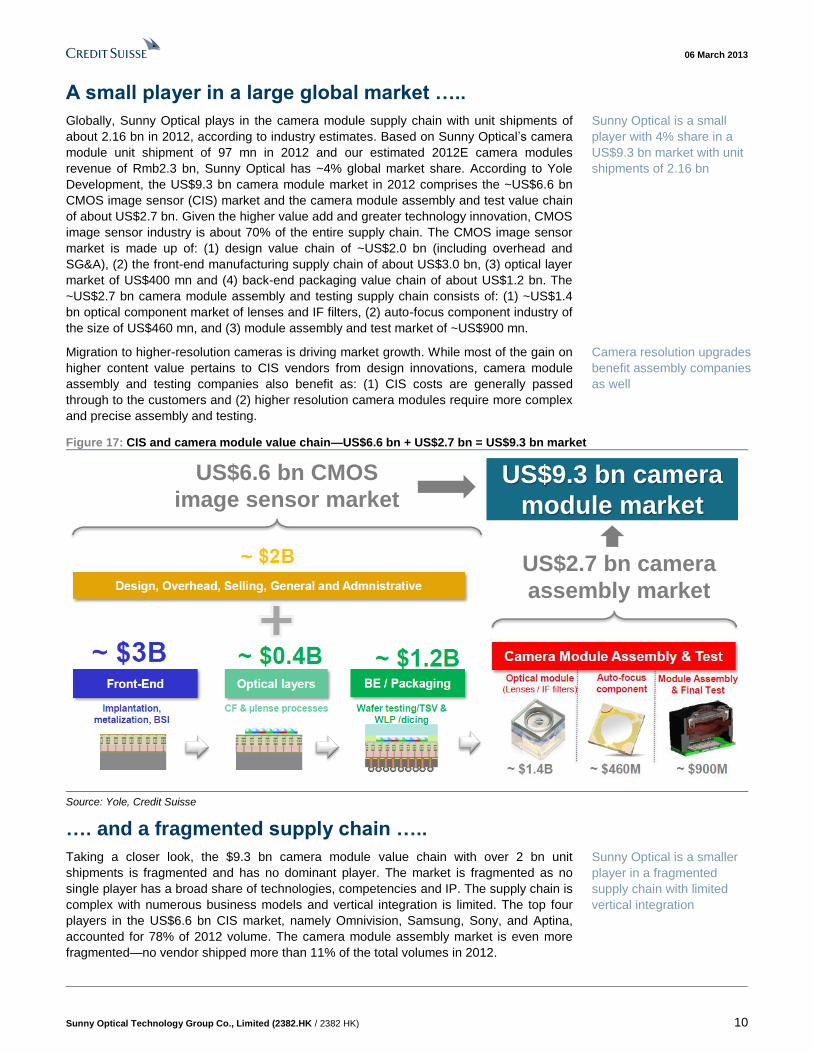
Globally, Sunny Optical plays in the camera module supply chain with unit shipments of
about 2.16 bn in 2012, according to industry estimates. Based on Sunny Optical’s camera
module unit shipment of 97 mn in 2012 and our estimated 2012E camera modules
revenue of Rmb2.3 bn, Sunny Optical has ~4% global market share. According to Yole
Development, the US$9.3 bn camera module market in 2012 comprises the ~US$6.6 bn
CMOS image sensor (CIS) market and the camera module assembly and test value chain
of about US$2.7 bn. Given the higher value add and greater technology innovation, CMOS
image sensor industry is about 70% of the entire supply chain. The CMOS image sensor
market is made up of: (1) design value chain of ~US$2.0 bn (including overhead and
SG&A), (2) the front-end manufacturing supply chain of about US$3.0 bn, (3) optical layer
market of US$400 mn and (4) back-end packaging value chain of about US$1.2 bn. The
~US$2.7 bn camera module assembly and testing supply chain consists of: (1) ~US$1.4
bn optical component market of lenses and IF filters, (2) auto-focus component industry of
the size of US$460 mn, and (3) module assembly and test market of ~US$900 mn.
Migration to higher-resolution cameras is driving market growth. While most of the gain on
higher content value pertains to CIS vendors from design innovations, camera module
assembly and testing companies also benefit as: (1) CIS costs are generally passed
through to the customers and (2) higher resolution camera modules require more complex
and precise assembly and testing.
Figure 17: CIS and camera module value chain—US$6.6 bn + US$2.7 bn = US$9.3 bn market
Source: Yole, Credit Suisse
…. and a fragmented supply chain …..
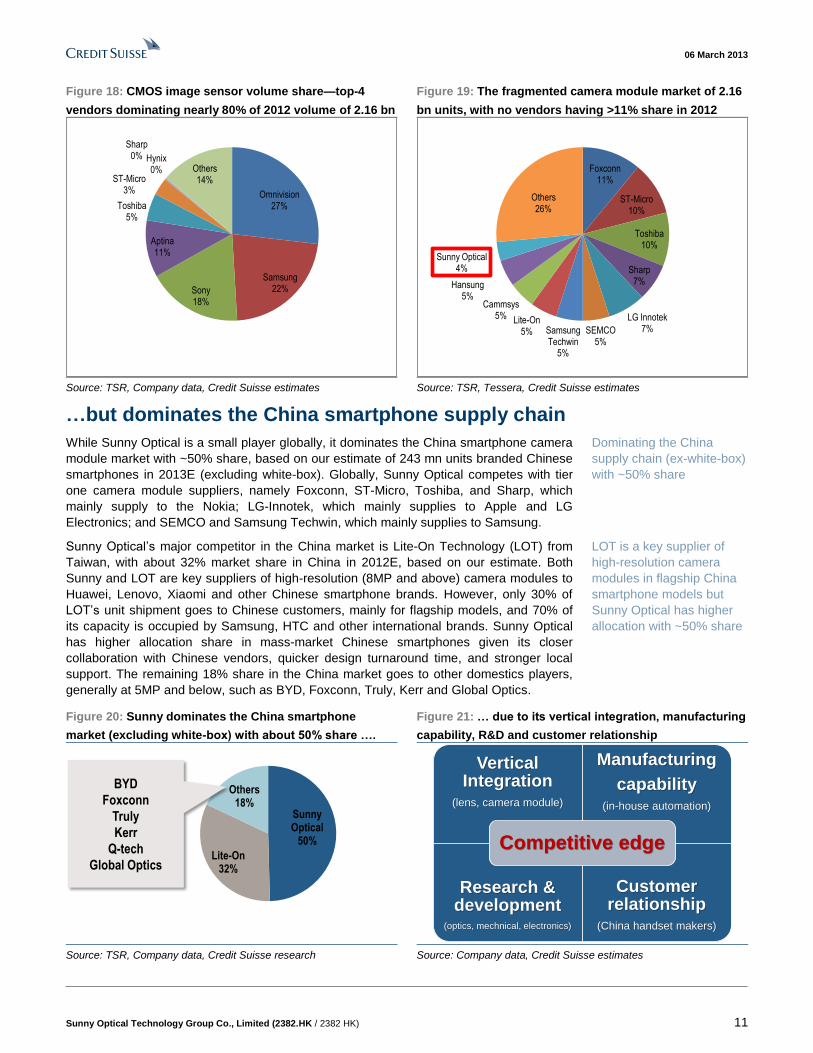
Taking a closer look, the $9.3 bn camera module value chain with over 2 bn unit
shipments is fragmented and has no dominant player. The market is fragmented as no
single player has a broad share of technologies, competencies and IP. The supply chain is
complex with numerous business models and vertical integration is limited. The top four
players in the US$6.6 bn CIS market, namely Omnivision, Samsung, Sony, and Aptina,
accounted for 78% of 2012 volume. The camera module assembly market is even more
fragmented—no vendor shipped more than 11% of the total volumes in 2012.
US$9.3 bn camera
module market
US$6.6 bn CMOS
image sensor market
US$2.7 bn camera
assembly market
Sunny Optical is a small
player with 4% share in a
US$9.3 bn market with unit
shipments of 2.16 bn
Camera resolution upgrades
benefit assembly companies
as well
Sunny Optical is a smaller
player in a fragmented
supply chain with limited
vertical integration
06 March 2013
Sunny Optical Technology Group Co., Limited (2382.HK / 2382 HK) 11
Figure 18: CMOS image sensor volume share—top-4
vendors dominating nearly 80% of 2012 volume of 2.16 bn
Figure 19: The fragmented camera module market of 2.16
bn units, with no vendors having >11% share in 2012
Source: TSR, Company data, Credit Suisse estimates Source: TSR, Tessera, Credit Suisse estimates
…but dominates the China smartphone supply chain
While Sunny Optical is a small player globally, it dominates the China smartphone camera
module market with ~50% share, based on our estimate of 243 mn units branded Chinese
smartphones in 2013E (excluding white-box). Globally, Sunny Optical competes with tier
one camera module suppliers, namely Foxconn, ST-Micro, Toshiba, and Sharp, which
mainly supply to the Nokia; LG-Innotek, which mainly supplies to Apple and LG
Electronics; and SEMCO and Samsung Techwin, which mainly supplies to Samsung.
Sunny Optical’s major competitor in the China market is Lite-On Technology (LOT) from
Taiwan, with about 32% market share in China in 2012E, based on our estimate. Both
Sunny and LOT are key suppliers of high-resolution (8MP and above) camera modules to
Huawei, Lenovo, Xiaomi and other Chinese smartphone brands. However, only 30% of
LOT’s unit shipment goes to Chinese customers, mainly for flagship models, and 70% of
its capacity is occupied by Samsung, HTC and other international brands. Sunny Optical
has higher allocation share in mass-market Chinese smartphones given its closer
collaboration with Chinese vendors, quicker design turnaround time, and stronger local
support. The remaining 18% share in the China market goes to other domestics players,
generally at 5MP and below, such as BYD, Foxconn, Truly, Kerr and Global Optics.
Figure 20: Sunny dominates the China smartphone
market (excluding white-box) with about 50% share ….
Figure 21: … due to its vertical integration, manufacturing
capability, R&D and customer relationship
Source: TSR, Company data, Credit Suisse research Source: Company data, Credit Suisse estimates
Omnivision27%
Samsung22%Sony
18%
Aptina11%
Toshiba5%
ST-Micro3%
Sharp0% Hynix
0% Others14%
Foxconn11%
ST-Micro10%
Toshiba10%
Sharp7%
LG Innotek7%SEMCO
5%Samsung Techwin
5%
Lite-On5%
Cammsys5%
Hansung5%
Sunny Optical4%
Others26%
Sunny Optical
50%
Lite-On32%
Others18%
BYD
Foxconn
Truly
Kerr
Q-tech
Global Optics
Vertical Integration
(lens, camera module)
Manufacturing
capability(in-house automation)
Research & development
(optics, mechnical, electronics)
Customer relationship
(China handset makers)
Competitive edge
Dominating the China
supply chain (ex-white-box)
with ~50% share
LOT is a key supplier of
high-resolution camera
modules in flagship China
smartphone models but
Sunny Optical has higher
allocation with ~50% share
06 March 2013
Sunny Optical Technology Group Co., Limited (2382.HK / 2382 HK) 12
Competitive edges strengthening market position
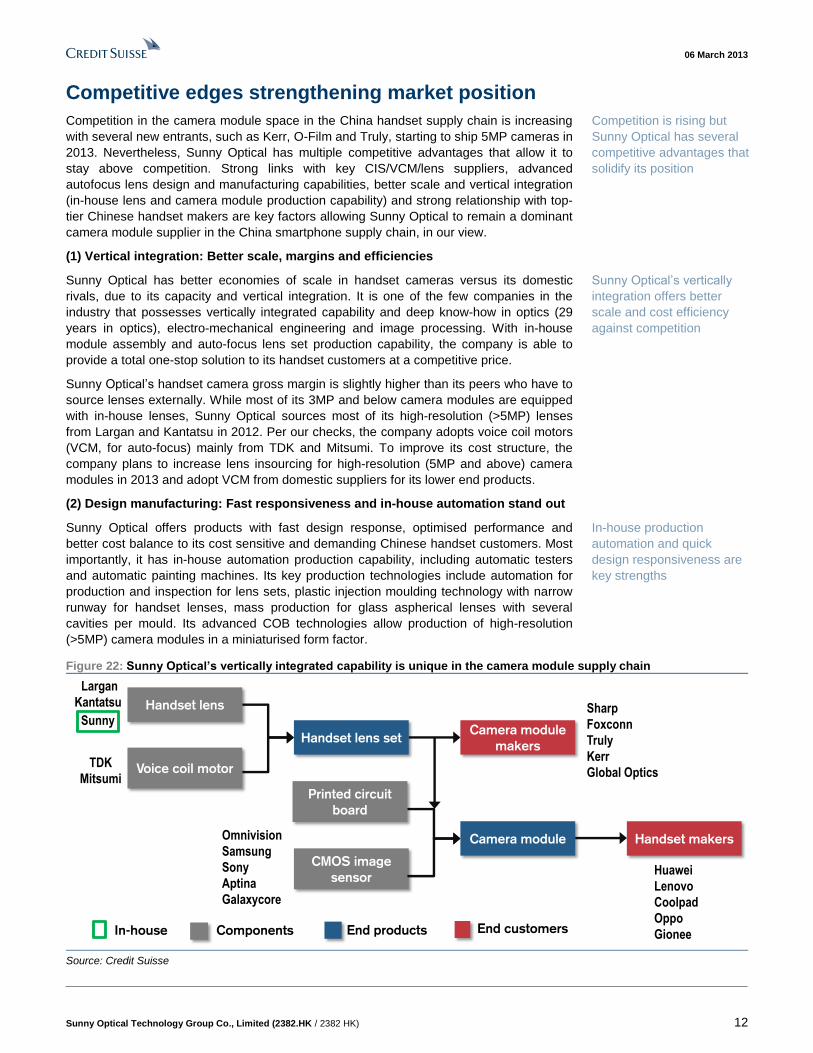
Competition in the camera module space in the China handset supply chain is increasing
with several new entrants, such as Kerr, O-Film and Truly, starting to ship 5MP cameras in
2013. Nevertheless, Sunny Optical has multiple competitive advantages that allow it to
stay above competition. Strong links with key CIS/VCM/lens suppliers, advanced
autofocus lens design and manufacturing capabilities, better scale and vertical integration
(in-house lens and camera module production capability) and strong relationship with top-
tier Chinese handset makers are key factors allowing Sunny Optical to remain a dominant
camera module supplier in the China smartphone supply chain, in our view.
(1) Vertical integration: Better scale, margins and efficiencies
Sunny Optical has better economies of scale in handset cameras versus its domestic
rivals, due to its capacity and vertical integration. It is one of the few companies in the
industry that possesses vertically integrated capability and deep know-how in optics (29
years in optics), electro-mechanical engineering and image processing. With in-house
module assembly and auto-focus lens set production capability, the company is able to
provide a total one-stop solution to its handset customers at a competitive price.
Sunny Optical’s handset camera gross margin is slightly higher than its peers who have to
source lenses externally. While most of its 3MP and below camera modules are equipped
with in-house lenses, Sunny Optical sources most of its high-resolution (>5MP) lenses
from Largan and Kantatsu in 2012. Per our checks, the company adopts voice coil motors
(VCM, for auto-focus) mainly from TDK and Mitsumi. To improve its cost structure, the
company plans to increase lens insourcing for high-resolution (5MP and above) camera
modules in 2013 and adopt VCM from domestic suppliers for its lower end products.
(2) Design manufacturing: Fast responsiveness and in-house automation stand out
Sunny Optical offers products with fast design response, optimised performance and
better cost balance to its cost sensitive and demanding Chinese handset customers. Most
importantly, it has in-house automation production capability, including automatic testers
and automatic painting machines. Its key production technologies include automation for
production and inspection for lens sets, plastic injection moulding technology with narrow
runway for handset lenses, mass production for glass aspherical lenses with several
cavities per mould. Its advanced COB technologies allow production of high-resolution
(>5MP) camera modules in a miniaturised form factor.
Figure 22: Sunny Optical’s vertically integrated capability is unique in the camera module supply chain
Source: Credit Suisse
Handset lens
Voice coil motor
Largan
Kantatsu
TDK
Mitsumi
Handset lens setCamera module
makers
CMOS image
sensor
Omnivision
Samsung
Sony
Aptina
Galaxycore
Printed circuit
board
Camera module Handset makers
Huawei
Lenovo
Coolpad
Oppo
Gionee
Sharp
Foxconn
Truly
Kerr
Global Optics
End productsComponents End customers
Sunny
In-house
Competition is rising but
Sunny Optical has several
competitive advantages that
solidify its position
Sunny Optical’s vertically
integration offers better
scale and cost efficiency
against competition
In-house production
automation and quick
design responsiveness are
key strengths
06 March 2013
Sunny Optical Technology Group Co., Limited (2382.HK / 2382 HK) 13
(3) Research and development: Nudging the entry barrier up
The ongoing camera resolution migration in smartphones and Sunny’s R&D focus on high-
resolution camera lens / modules and specialty cameras set it apart from rivals. R&D in
the areas of optics, electronics and software image processing allowed the company to
ramp up 8MP/13MP handset cameras ahead of its domestic rivals who are still at
5MP/8MP. This was a result of its extensive R&D partnership with Pantech that made the
company a qualified supplier of 8MP/13MP handset cameras in 2011/12.
The company has developed and obtained patents for ultra-wide-angle high resolution
vehicle lenses. Sunny Optical also has extensive R&D in various infrared lens sets for
vehicle and security surveillance applications. The company successfully started the mass
production of smart TV video camera modules for Samsung in 2012. It also completed
R&D for a number of microscopic systems, analytical instruments oriented for
spectrophotometers, gas chromatographs and mass spectrometers and high-end
measuring machines. The company is developing new technologies, including array
cameras (see page 31 for details on this technology) and 3D gesture recognition cameras.
(4) Solid customer relationship: Stickier business relationships
Sunny Optical has a clear advantage given its close proximity with Chinese customers and
long-term partnerships with key domestic handset makers. By entering into the supply
chain of TCL handset business segment in 2009-10, Sunny Optical established a close
relationship with a number of fast-growing branded Chinese customers such as Huawei,
Lenovo, Coolpad. As these customers grow their market shares, Sunny Optical further
strengthened its business relationship by offering cost-sensitive, high-performance
handset camera modules that differentiate from their global competitors. On top of its
success in China, Sunny Optical is expanding its presence to top-tier international
customers with meaningful production ramp-up potentially starting in 2H13.
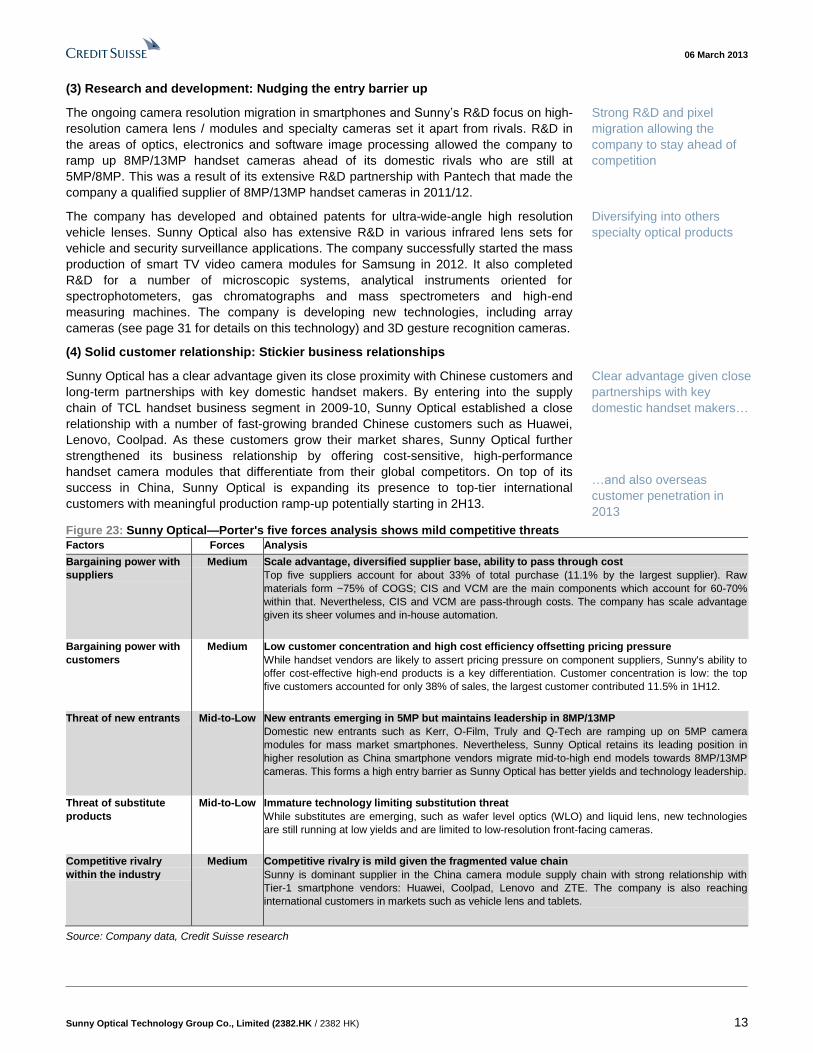
Figure 23: Sunny Optical—Porter's five forces analysis shows mild competitive threats
Factors Forces Analysis
Bargaining power with
suppliers
Medium Scale advantage, diversified supplier base, ability to pass through cost
Top five suppliers account for about 33% of total purchase (11.1% by the largest supplier). Raw
materials form ~75% of COGS; CIS and VCM are the main components which account for 60-70%
within that. Nevertheless, CIS and VCM are pass-through costs. The company has scale advantage
given its sheer volumes and in-house automation.
Bargaining power with
customers
Medium Low customer concentration and high cost efficiency offsetting pricing pressure
While handset vendors are likely to assert pricing pressure on component suppliers, Sunny's ability to
offer cost-effective high-end products is a key differentiation. Customer concentration is low: the top
five customers accounted for only 38% of sales, the largest customer contributed 11.5% in 1H12.
Threat of new entrants Mid-to-Low New entrants emerging in 5MP but maintains leadership in 8MP/13MP
Domestic new entrants such as Kerr, O-Film, Truly and Q-Tech are ramping up on 5MP camera
modules for mass market smartphones. Nevertheless, Sunny Optical retains its leading position in
higher resolution as China smartphone vendors migrate mid-to-high end models towards 8MP/13MP
cameras. This forms a high entry barrier as Sunny Optical has better yields and technology leadership.
Threat of substitute
products
Mid-to-Low Immature technology limiting substitution threat
While substitutes are emerging, such as wafer level optics (WLO) and liquid lens, new technologies
are still running at low yields and are limited to low-resolution front-facing cameras.
Competitive rivalry
within the industry
Medium Competitive rivalry is mild given the fragmented value chain
Sunny is dominant supplier in the China camera module supply chain with strong relationship with
Tier-1 smartphone vendors: Huawei, Coolpad, Lenovo and ZTE. The company is also reaching
international customers in markets such as vehicle lens and tablets.
Source: Company data, Credit Suisse research
Strong R&D and pixel
migration allowing the
company to stay ahead of
competition
Diversifying into others
specialty optical products
Clear advantage given close
partnerships with key
domestic handset makers…
…and also overseas
customer penetration in
2013
06 March 2013
Sunny Optical Technology Group Co., Limited (2382.HK / 2382 HK) 14
Mix improvement + lens insourcing = stable margins Rapid expansion of the smartphone and tablet market, combined with increase in usage of
mobile social apps, is leading to higher-resolution camera specification migrations. The
resolution and miniaturisation race is ongoing, and performance metrics are also
becoming more stringent. In 2011, the average mobile handset was 30% of the pixel count
of the average digital still camera (DSC). By 2015, handsets will have 60% of the pixel
count of DSC on average, with some having more than 80%, according to iSuppli
Figure 24: Handset camera resolution catching up with digital still cameras
Source: IHS iSuppli Mobile and Wireless Communications Service
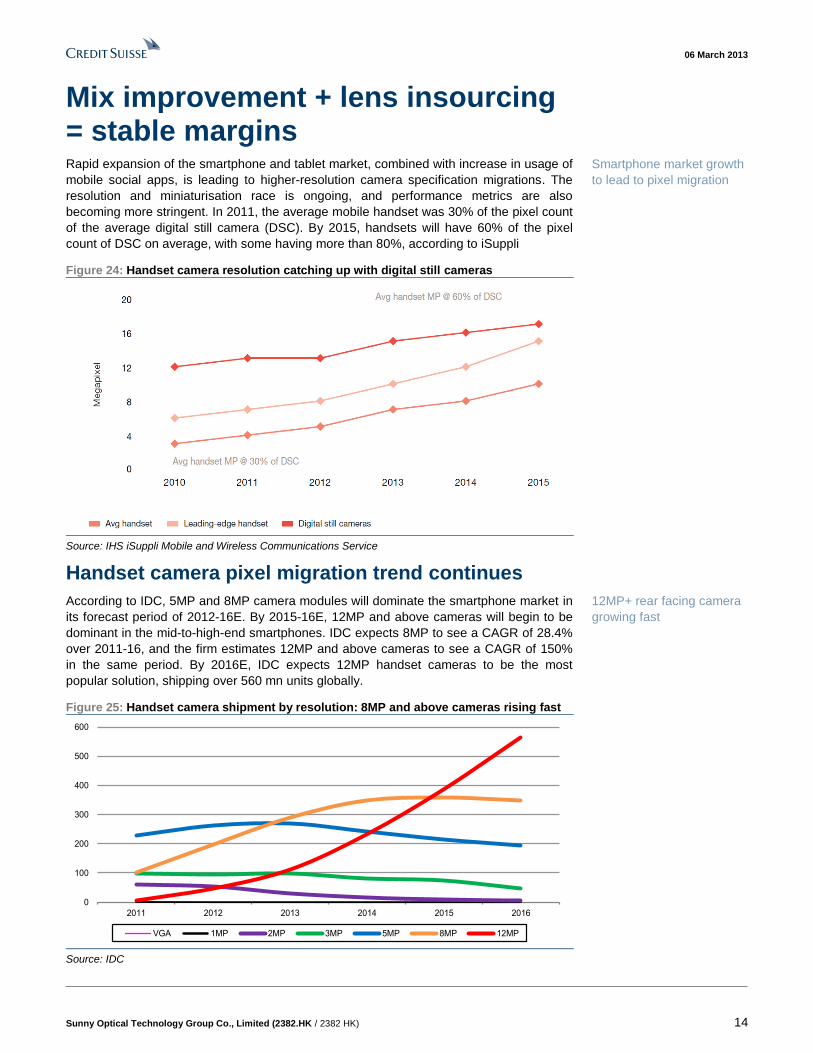
Handset camera pixel migration trend continues
According to IDC, 5MP and 8MP camera modules will dominate the smartphone market in
its forecast period of 2012-16E. By 2015-16E, 12MP and above cameras will begin to be
dominant in the mid-to-high-end smartphones. IDC expects 8MP to see a CAGR of 28.4%
over 2011-16, and the firm estimates 12MP and above cameras to see a CAGR of 150%
in the same period. By 2016E, IDC expects 12MP handset cameras to be the most
popular solution, shipping over 560 mn units globally.
Figure 25: Handset camera shipment by resolution: 8MP and above cameras rising fast
Source: IDC
0
100
200
300
400
500
600
2011 2012 2013 2014 2015 2016
VGA 1MP 2MP 3MP 5MP 8MP 12MP
Smartphone market growth
to lead to pixel migration
12MP+ rear facing camera
growing fast
06 March 2013
Sunny Optical Technology Group Co., Limited (2382.HK / 2382 HK) 15
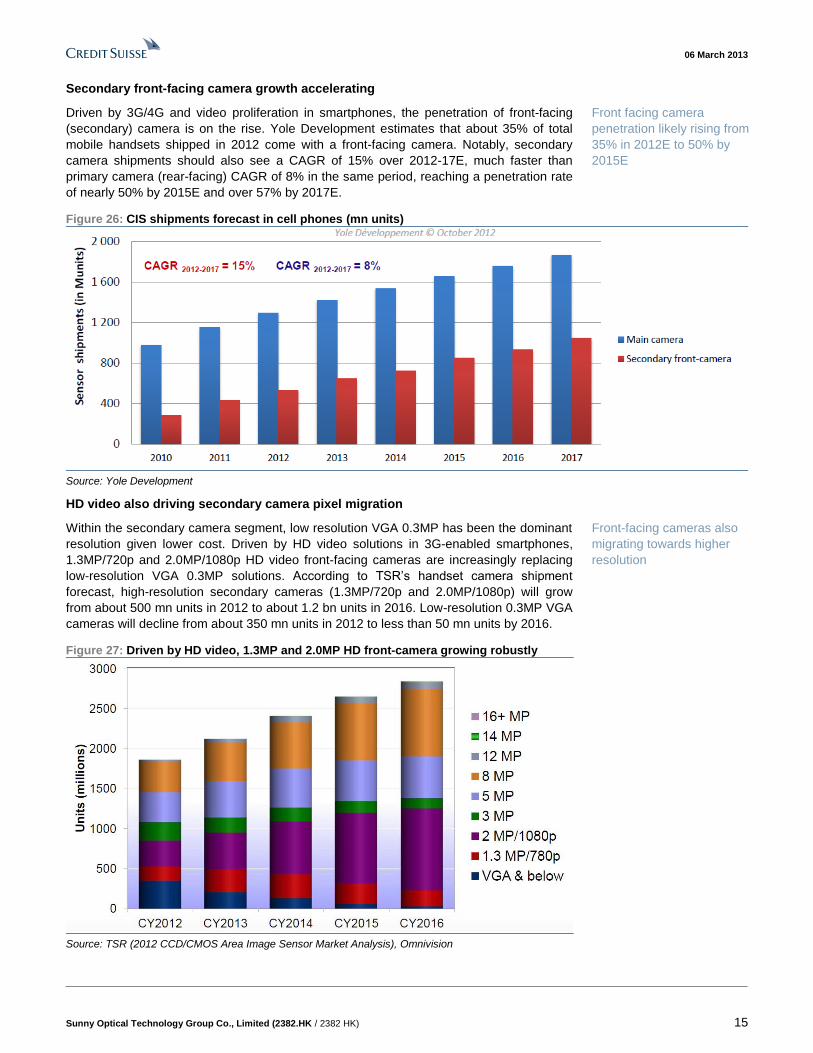
Secondary front-facing camera growth accelerating
Driven by 3G/4G and video proliferation in smartphones, the penetration of front-facing
(secondary) camera is on the rise. Yole Development estimates that about 35% of total
mobile handsets shipped in 2012 come with a front-facing camera. Notably, secondary
camera shipments should also see a CAGR of 15% over 2012-17E, much faster than
primary camera (rear-facing) CAGR of 8% in the same period, reaching a penetration rate
of nearly 50% by 2015E and over 57% by 2017E.
Figure 26: CIS shipments forecast in cell phones (mn units)
Source: Yole Development
HD video also driving secondary camera pixel migration
Within the secondary camera segment, low resolution VGA 0.3MP has been the dominant
resolution given lower cost. Driven by HD video solutions in 3G-enabled smartphones,
1.3MP/720p and 2.0MP/1080p HD video front-facing cameras are increasingly replacing
low-resolution VGA 0.3MP solutions. According to TSR’s handset camera shipment
forecast, high-resolution secondary cameras (1.3MP/720p and 2.0MP/1080p) will grow
from about 500 mn units in 2012 to about 1.2 bn units in 2016. Low-resolution 0.3MP VGA
cameras will decline from about 350 mn units in 2012 to less than 50 mn units by 2016.
Figure 27: Driven by HD video, 1.3MP and 2.0MP HD front-camera growing robustly
Source: TSR (2012 CCD/CMOS Area Image Sensor Market Analysis), Omnivision
Front facing camera
penetration likely rising from
35% in 2012E to 50% by
2015E
Front-facing cameras also
migrating towards higher
resolution
06 March 2013
Sunny Optical Technology Group Co., Limited (2382.HK / 2382 HK) 16
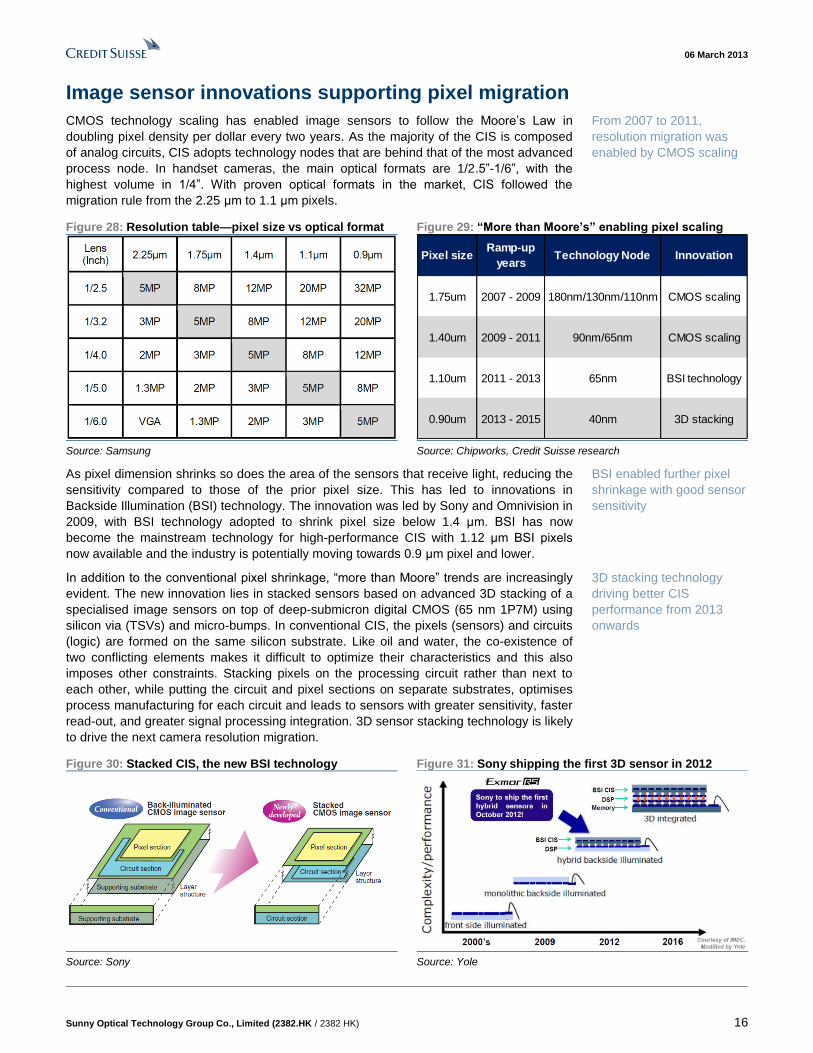
Image sensor innovations supporting pixel migration
CMOS technology scaling has enabled image sensors to follow the Moore’s Law in
doubling pixel density per dollar every two years. As the majority of the CIS is composed
of analog circuits, CIS adopts technology nodes that are behind that of the most advanced
process node. In handset cameras, the main optical formats are 1/2.5”-1/6”, with the
highest volume in 1/4”. With proven optical formats in the market, CIS followed the
migration rule from the 2.25 μm to 1.1 μm pixels.
Figure 28: Resolution table—pixel size vs optical format Figure 29: “More than Moore’s” enabling pixel scaling
Source: Samsung Source: Chipworks, Credit Suisse research
As pixel dimension shrinks so does the area of the sensors that receive light, reducing the
sensitivity compared to those of the prior pixel size. This has led to innovations in
Backside Illumination (BSI) technology. The innovation was led by Sony and Omnivision in
2009, with BSI technology adopted to shrink pixel size below 1.4 μm. BSI has now
become the mainstream technology for high-performance CIS with 1.12 μm BSI pixels
now available and the industry is potentially moving towards 0.9 μm pixel and lower.
In addition to the conventional pixel shrinkage, “more than Moore” trends are increasingly
evident. The new innovation lies in stacked sensors based on advanced 3D stacking of a
specialised image sensors on top of deep-submicron digital CMOS (65 nm 1P7M) using
silicon via (TSVs) and micro-bumps. In conventional CIS, the pixels (sensors) and circuits
(logic) are formed on the same silicon substrate. Like oil and water, the co-existence of
two conflicting elements makes it difficult to optimize their characteristics and this also
imposes other constraints. Stacking pixels on the processing circuit rather than next to
each other, while putting the circuit and pixel sections on separate substrates, optimises
process manufacturing for each circuit and leads to sensors with greater sensitivity, faster
read-out, and greater signal processing integration. 3D sensor stacking technology is likely
to drive the next camera resolution migration.
Figure 30: Stacked CIS, the new BSI technology Figure 31: Sony shipping the first 3D sensor in 2012
Source: Sony Source: Yole
Pixel sizeRamp-up
yearsTechnology Node Innovation
1.75um 2007 - 2009 180nm/130nm/110nm CMOS scaling
1.40um 2009 - 2011 90nm/65nm CMOS scaling
1.10um 2011 - 2013 65nm BSI technology
0.90um 2013 - 2015 40nm 3D stacking
From 2007 to 2011,
resolution migration was
enabled by CMOS scaling
BSI enabled further pixel
shrinkage with good sensor
sensitivity
3D stacking technology
driving better CIS
performance from 2013
onwards
06 March 2013
Sunny Optical Technology Group Co., Limited (2382.HK / 2382 HK) 17
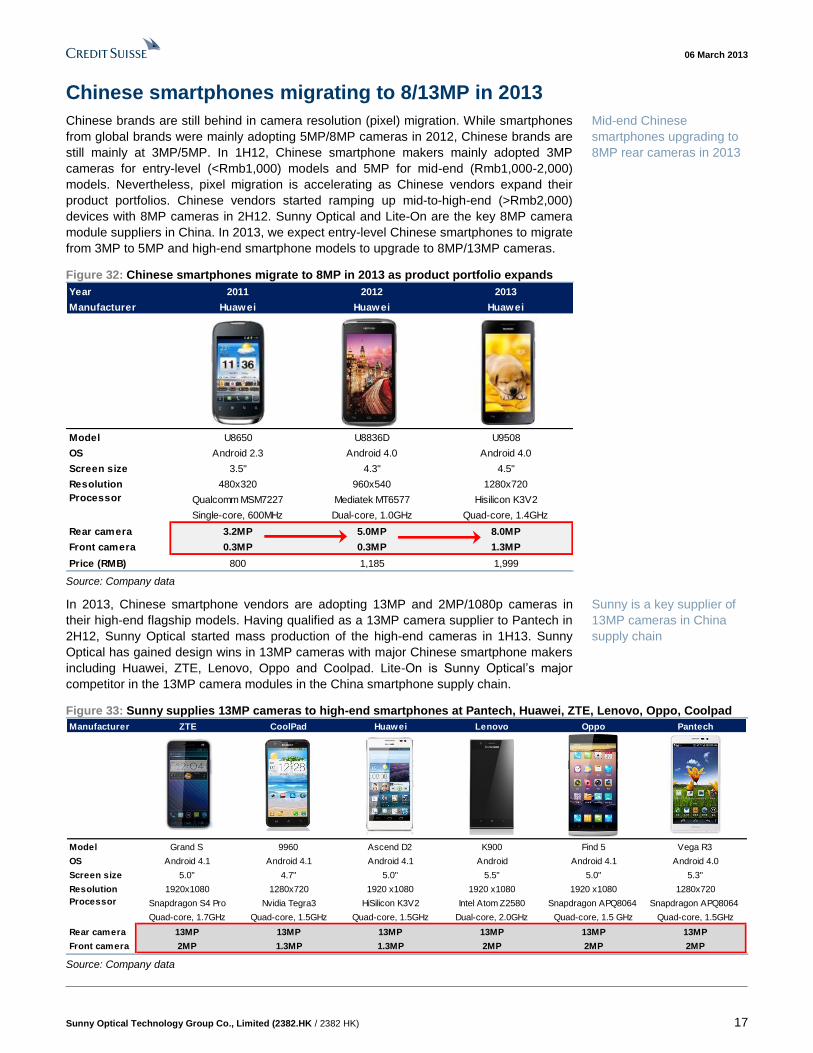
Chinese smartphones migrating to 8/13MP in 2013
Chinese brands are still behind in camera resolution (pixel) migration. While smartphones
from global brands were mainly adopting 5MP/8MP cameras in 2012, Chinese brands are
still mainly at 3MP/5MP. In 1H12, Chinese smartphone makers mainly adopted 3MP
cameras for entry-level (<Rmb1,000) models and 5MP for mid-end (Rmb1,000-2,000)
models. Nevertheless, pixel migration is accelerating as Chinese vendors expand their
product portfolios. Chinese vendors started ramping up mid-to-high-end (>Rmb2,000)
devices with 8MP cameras in 2H12. Sunny Optical and Lite-On are the key 8MP camera
module suppliers in China. In 2013, we expect entry-level Chinese smartphones to migrate
from 3MP to 5MP and high-end smartphone models to upgrade to 8MP/13MP cameras.
Figure 32: Chinese smartphones migrate to 8MP in 2013 as product portfolio expands
Source: Company data
In 2013, Chinese smartphone vendors are adopting 13MP and 2MP/1080p cameras in
their high-end flagship models. Having qualified as a 13MP camera supplier to Pantech in
2H12, Sunny Optical started mass production of the high-end cameras in 1H13. Sunny
Optical has gained design wins in 13MP cameras with major Chinese smartphone makers
including Huawei, ZTE, Lenovo, Oppo and Coolpad. Lite-On is Sunny Optical’s major
competitor in the 13MP camera modules in the China smartphone supply chain.
Figure 33: Sunny supplies 13MP cameras to high-end smartphones at Pantech, Huawei, ZTE, Lenovo, Oppo, Coolpad
Source: Company data
Year 2011 2012 2013
Manufacturer Huawei Huawei Huawei
Model U8650 U8836D U9508
OS Android 2.3 Android 4.0 Android 4.0
Screen size 3.5" 4.3" 4.5"
Resolution 480x320 960x540 1280x720
Qualcomm MSM7227 Mediatek MT6577 Hisilicon K3V2
Single-core, 600MHz Dual-core, 1.0GHz Quad-core, 1.4GHz
Rear camera 3.2MP 5.0MP 8.0MP
Front camera 0.3MP 0.3MP 1.3MP
Price (RMB) 800 1,185 1,999
Processor
Manufacturer ZTE CoolPad Huawei Lenovo Oppo Pantech
Model Grand S 9960 Ascend D2 K900 Find 5 Vega R3
OS Android 4.1 Android 4.1 Android 4.1 Android Android 4.1 Android 4.0
Screen size 5.0" 4.7" 5.0" 5.5" 5.0" 5.3"
Resolution 1920x1080 1280x720 1920 x1080 1920 x1080 1920 x1080 1280x720
Snapdragon S4 Pro Nvidia Tegra3 HiSilicon K3V2 Intel Atom Z2580 Snapdragon APQ8064 Snapdragon APQ8064
Quad-core, 1.7GHz Quad-core, 1.5GHz Quad-core, 1.5GHz Dual-core, 2.0GHz Quad-core, 1.5 GHz Quad-core, 1.5GHz
Rear camera 13MP 13MP 13MP 13MP 13MP 13MP
Front camera 2MP 1.3MP 1.3MP 2MP 2MP 2MP
Processor
Mid-end Chinese
smartphones upgrading to
8MP rear cameras in 2013
Sunny is a key supplier of
13MP cameras in China
supply chain
06 March 2013
Sunny Optical Technology Group Co., Limited (2382.HK / 2382 HK) 18
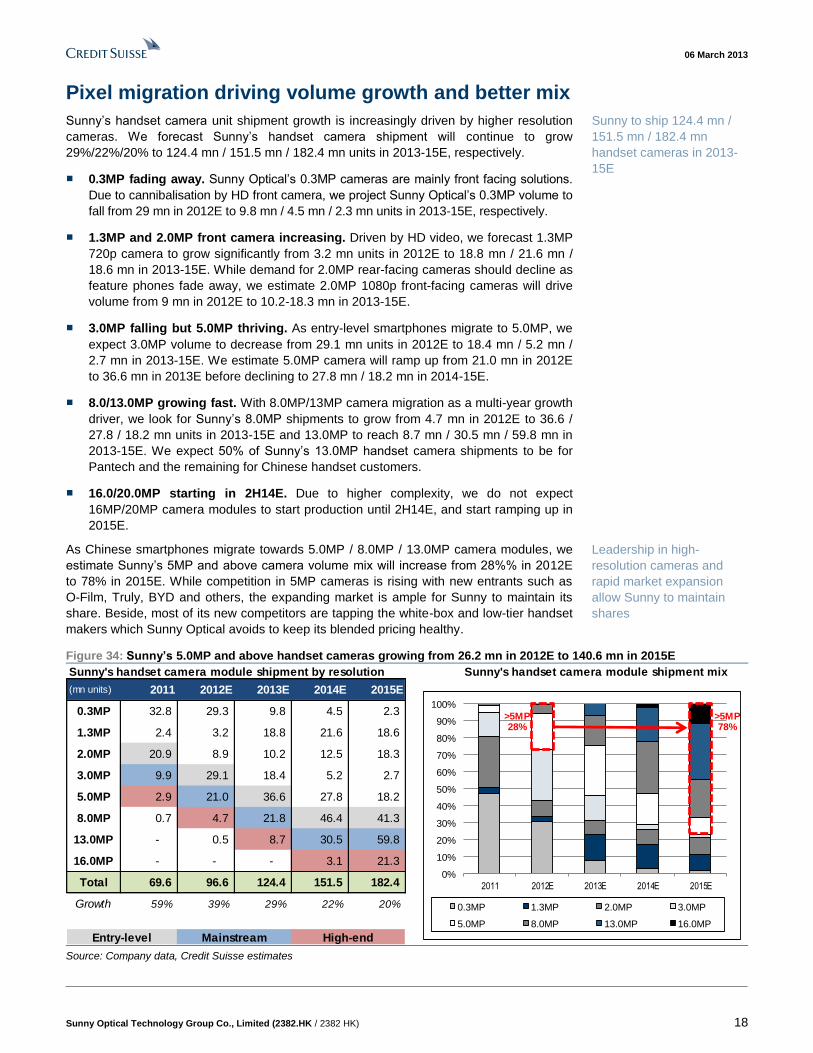
Pixel migration driving volume growth and better mix
Sunny’s handset camera unit shipment growth is increasingly driven by higher resolution
cameras. We forecast Sunny’s handset camera shipment will continue to grow
29%/22%/20% to 124.4 mn / 151.5 mn / 182.4 mn units in 2013-15E, respectively.
■ 0.3MP fading away. Sunny Optical’s 0.3MP cameras are mainly front facing solutions.
Due to cannibalisation by HD front camera, we project Sunny Optical’s 0.3MP volume to
fall from 29 mn in 2012E to 9.8 mn / 4.5 mn / 2.3 mn units in 2013-15E, respectively.
■ 1.3MP and 2.0MP front camera increasing. Driven by HD video, we forecast 1.3MP
720p camera to grow significantly from 3.2 mn units in 2012E to 18.8 mn / 21.6 mn /
18.6 mn in 2013-15E. While demand for 2.0MP rear-facing cameras should decline as
feature phones fade away, we estimate 2.0MP 1080p front-facing cameras will drive
volume from 9 mn in 2012E to 10.2-18.3 mn in 2013-15E.
■ 3.0MP falling but 5.0MP thriving. As entry-level smartphones migrate to 5.0MP, we
expect 3.0MP volume to decrease from 29.1 mn units in 2012E to 18.4 mn / 5.2 mn /
2.7 mn in 2013-15E. We estimate 5.0MP camera will ramp up from 21.0 mn in 2012E
to 36.6 mn in 2013E before declining to 27.8 mn / 18.2 mn in 2014-15E.
■ 8.0/13.0MP growing fast. With 8.0MP/13MP camera migration as a multi-year growth
driver, we look for Sunny’s 8.0MP shipments to grow from 4.7 mn in 2012E to 36.6 /
27.8 / 18.2 mn units in 2013-15E and 13.0MP to reach 8.7 mn / 30.5 mn / 59.8 mn in
2013-15E. We expect 50% of Sunny’s 13.0MP handset camera shipments to be for
Pantech and the remaining for Chinese handset customers.
■ 16.0/20.0MP starting in 2H14E. Due to higher complexity, we do not expect
16MP/20MP camera modules to start production until 2H14E, and start ramping up in
2015E.
As Chinese smartphones migrate towards 5.0MP / 8.0MP / 13.0MP camera modules, we
estimate Sunny’s 5MP and above camera volume mix will increase from 28%% in 2012E
to 78% in 2015E. While competition in 5MP cameras is rising with new entrants such as
O-Film, Truly, BYD and others, the expanding market is ample for Sunny to maintain its
share. Beside, most of its new competitors are tapping the white-box and low-tier handset
makers which Sunny Optical avoids to keep its blended pricing healthy.
Figure 34: Sunny’s 5.0MP and above handset cameras growing from 26.2 mn in 2012E to 140.6 mn in 2015E
Source: Company data, Credit Suisse estimates
Sunny's handset camera module shipment by resolution Sunny's handset camera module shipment mix
(mn units) 2011 2012E 2013E 2014E 2015E
0.3MP 32.8 29.3 9.8 4.5 2.3
1.3MP 2.4 3.2 18.8 21.6 18.6
2.0MP 20.9 8.9 10.2 12.5 18.3
3.0MP 9.9 29.1 18.4 5.2 2.7
5.0MP 2.9 21.0 36.6 27.8 18.2
8.0MP 0.7 4.7 21.8 46.4 41.3
13.0MP - 0.5 8.7 30.5 59.8
16.0MP - - - 3.1 21.3
Total 69.6 96.6 124.4 151.5 182.4
Growth 59% 39% 29% 22% 20%
Entry-level Mainstream High-end
0%
10%
20%
30%
40%
50%
60%
70%
80%
90%
100%
2011 2012E 2013E 2014E 2015E
0.3MP 1.3MP 2.0MP 3.0MP
5.0MP 8.0MP 13.0MP 16.0MP
>5MP28%
>5MP78%
Sunny to ship 124.4 mn /
151.5 mn / 182.4 mn
handset cameras in 2013-
15E
Leadership in high-
resolution cameras and
rapid market expansion
allow Sunny to maintain
shares
06 March 2013
Sunny Optical Technology Group Co., Limited (2382.HK / 2382 HK) 19
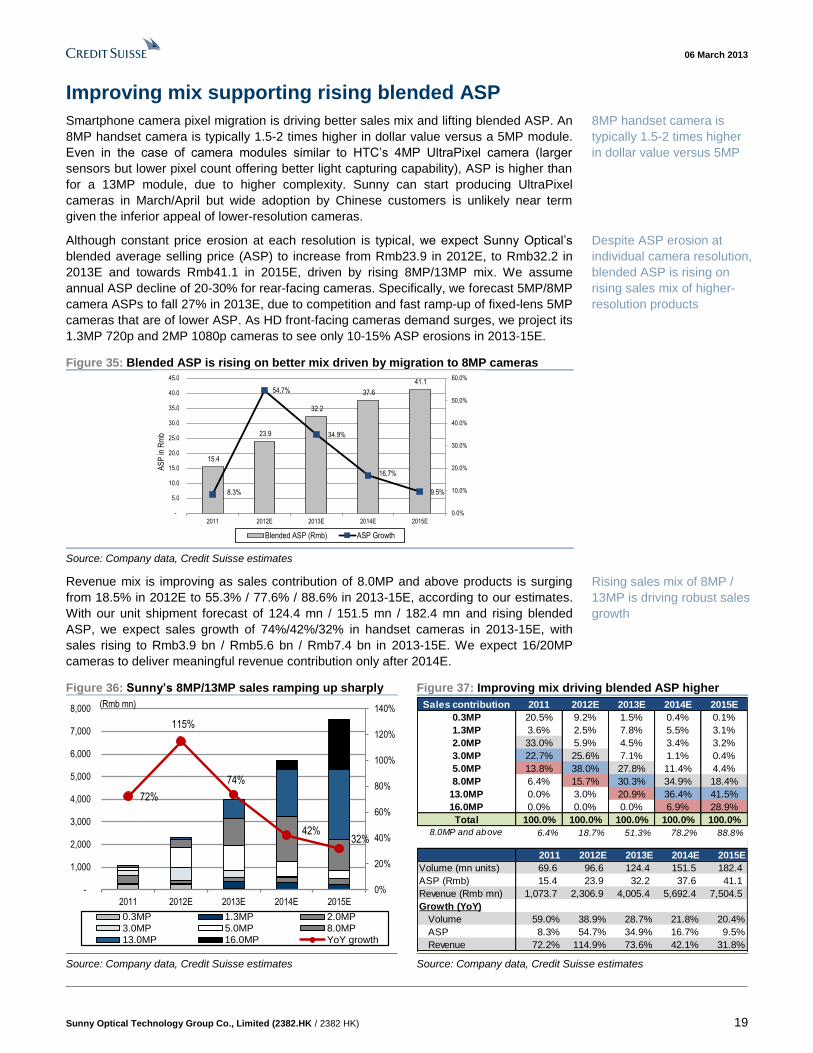
Improving mix supporting rising blended ASP
Smartphone camera pixel migration is driving better sales mix and lifting blended ASP. An
8MP handset camera is typically 1.5-2 times higher in dollar value versus a 5MP module.
Even in the case of camera modules similar to HTC’s 4MP UltraPixel camera (larger
sensors but lower pixel count offering better light capturing capability), ASP is higher than
for a 13MP module, due to higher complexity. Sunny can start producing UltraPixel
cameras in March/April but wide adoption by Chinese customers is unlikely near term
given the inferior appeal of lower-resolution cameras.
Although constant price erosion at each resolution is typical, we expect Sunny Optical’s
blended average selling price (ASP) to increase from Rmb23.9 in 2012E, to Rmb32.2 in
2013E and towards Rmb41.1 in 2015E, driven by rising 8MP/13MP mix. We assume
annual ASP decline of 20-30% for rear-facing cameras. Specifically, we forecast 5MP/8MP
camera ASPs to fall 27% in 2013E, due to competition and fast ramp-up of fixed-lens 5MP
cameras that are of lower ASP. As HD front-facing cameras demand surges, we project its
1.3MP 720p and 2MP 1080p cameras to see only 10-15% ASP erosions in 2013-15E.
Figure 35: Blended ASP is rising on better mix driven by migration to 8MP cameras
Source: Company data, Credit Suisse estimates
Revenue mix is improving as sales contribution of 8.0MP and above products is surging
from 18.5% in 2012E to 55.3% / 77.6% / 88.6% in 2013-15E, according to our estimates.
With our unit shipment forecast of 124.4 mn / 151.5 mn / 182.4 mn and rising blended
ASP, we expect sales growth of 74%/42%/32% in handset cameras in 2013-15E, with
sales rising to Rmb3.9 bn / Rmb5.6 bn / Rmb7.4 bn in 2013-15E. We expect 16/20MP
cameras to deliver meaningful revenue contribution only after 2014E.
Figure 36: Sunny’s 8MP/13MP sales ramping up sharply Figure 37: Improving mix driving blended ASP higher
Source: Company data, Credit Suisse estimates Source: Company data, Credit Suisse estimates
15.4
23.9
32.2
37.6
41.1
8.3%
54.7%
34.9%
16.7%
9.5%
0.0%
10.0%
20.0%
30.0%
40.0%
50.0%
60.0%
-
5.0
10.0
15.0
20.0
25.0
30.0
35.0
40.0
45.0
2011 2012E 2013E 2014E 2015E
AS
P in
Rm
b
Blended ASP (Rmb) ASP Growth
72%
115%
74%
42%32%
0%
20%
40%
60%
80%
100%
120%
140%
-
1,000
2,000
3,000
4,000
5,000
6,000
7,000
8,000
2011 2012E 2013E 2014E 2015E
(Rmb mn)
0.3MP 1.3MP 2.0MP3.0MP 5.0MP 8.0MP13.0MP 16.0MP YoY growth
Sales contribution 2011 2012E 2013E 2014E 2015E
0.3MP 20.5% 9.2% 1.5% 0.4% 0.1%
1.3MP 3.6% 2.5% 7.8% 5.5% 3.1%
2.0MP 33.0% 5.9% 4.5% 3.4% 3.2%
3.0MP 22.7% 25.6% 7.1% 1.1% 0.4%
5.0MP 13.8% 38.0% 27.8% 11.4% 4.4%
8.0MP 6.4% 15.7% 30.3% 34.9% 18.4%
13.0MP 0.0% 3.0% 20.9% 36.4% 41.5%
16.0MP 0.0% 0.0% 0.0% 6.9% 28.9%
Total 100.0% 100.0% 100.0% 100.0% 100.0%
8.0MP and above 6.4% 18.7% 51.3% 78.2% 88.8%
2011 2012E 2013E 2014E 2015E
Volume (mn units) 69.6 96.6 124.4 151.5 182.4
ASP (Rmb) 15.4 23.9 32.2 37.6 41.1
Revenue (Rmb mn) 1,073.7 2,306.9 4,005.4 5,692.4 7,504.5
Growth (YoY)
Volume 59.0% 38.9% 28.7% 21.8% 20.4%
ASP 8.3% 54.7% 34.9% 16.7% 9.5%
Revenue 72.2% 114.9% 73.6% 42.1% 31.8%
8MP handset camera is
typically 1.5-2 times higher
in dollar value versus 5MP
Despite ASP erosion at
individual camera resolution,
blended ASP is rising on
rising sales mix of higher-
resolution products
Rising sales mix of 8MP /
13MP is driving robust sales
growth
06 March 2013
Sunny Optical Technology Group Co., Limited (2382.HK / 2382 HK) 20
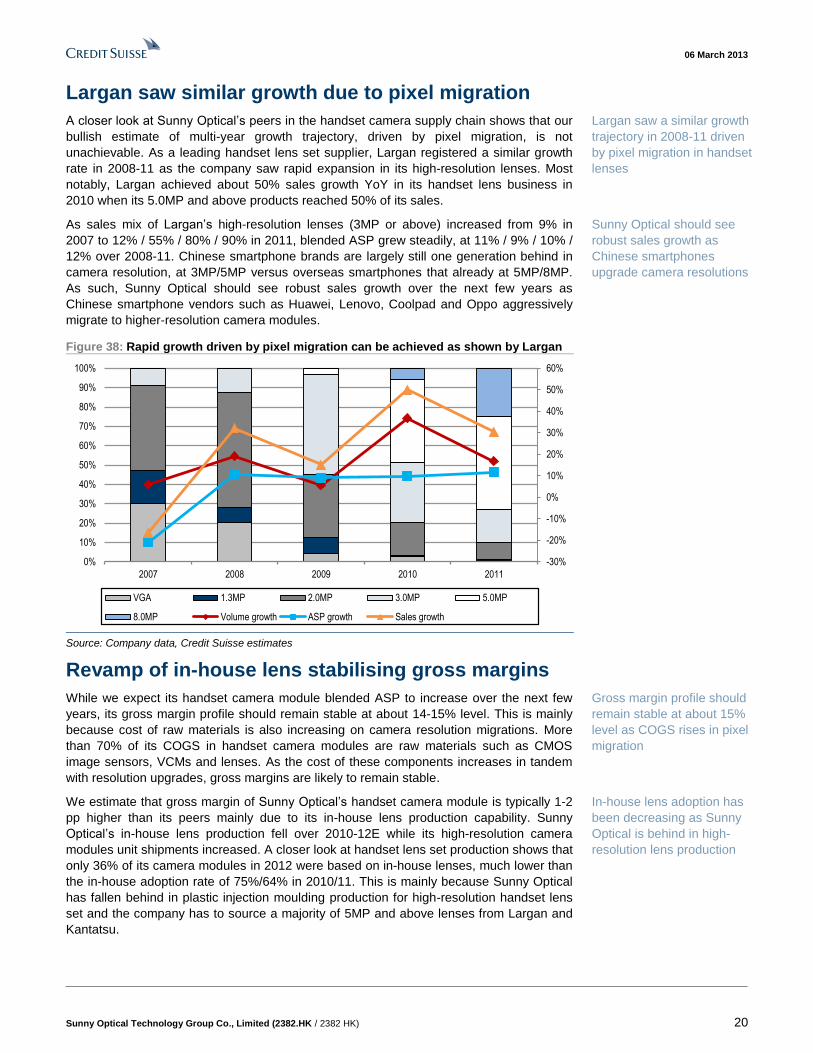
Largan saw similar growth due to pixel migration
A closer look at Sunny Optical’s peers in the handset camera supply chain shows that our
bullish estimate of multi-year growth trajectory, driven by pixel migration, is not
unachievable. As a leading handset lens set supplier, Largan registered a similar growth
rate in 2008-11 as the company saw rapid expansion in its high-resolution lenses. Most
notably, Largan achieved about 50% sales growth YoY in its handset lens business in
2010 when its 5.0MP and above products reached 50% of its sales.
As sales mix of Largan’s high-resolution lenses (3MP or above) increased from 9% in
2007 to 12% / 55% / 80% / 90% in 2011, blended ASP grew steadily, at 11% / 9% / 10% /
12% over 2008-11. Chinese smartphone brands are largely still one generation behind in
camera resolution, at 3MP/5MP versus overseas smartphones that already at 5MP/8MP.
As such, Sunny Optical should see robust sales growth over the next few years as
Chinese smartphone vendors such as Huawei, Lenovo, Coolpad and Oppo aggressively
migrate to higher-resolution camera modules.
Figure 38: Rapid growth driven by pixel migration can be achieved as shown by Largan
Source: Company data, Credit Suisse estimates
Revamp of in-house lens stabilising gross margins
While we expect its handset camera module blended ASP to increase over the next few
years, its gross margin profile should remain stable at about 14-15% level. This is mainly
because cost of raw materials is also increasing on camera resolution migrations. More
than 70% of its COGS in handset camera modules are raw materials such as CMOS
image sensors, VCMs and lenses. As the cost of these components increases in tandem
with resolution upgrades, gross margins are likely to remain stable.
We estimate that gross margin of Sunny Optical’s handset camera module is typically 1-2
pp higher than its peers mainly due to its in-house lens production capability. Sunny
Optical’s in-house lens production fell over 2010-12E while its high-resolution camera
modules unit shipments increased. A closer look at handset lens set production shows that
only 36% of its camera modules in 2012 were based on in-house lenses, much lower than
the in-house adoption rate of 75%/64% in 2010/11. This is mainly because Sunny Optical
has fallen behind in plastic injection moulding production for high-resolution handset lens
set and the company has to source a majority of 5MP and above lenses from Largan and
Kantatsu.
-30%
-20%
-10%
0%
10%
20%
30%
40%
50%
60%
0%
10%
20%
30%
40%
50%
60%
70%
80%
90%
100%
2007 2008 2009 2010 2011
VGA 1.3MP 2.0MP 3.0MP 5.0MP
8.0MP Volume growth ASP growth Sales growth
Largan saw a similar growth
trajectory in 2008-11 driven
by pixel migration in handset
lenses
Sunny Optical should see
robust sales growth as
Chinese smartphones
upgrade camera resolutions
Gross margin profile should
remain stable at about 15%
level as COGS rises in pixel
migration
In-house lens adoption has
been decreasing as Sunny
Optical is behind in high-
resolution lens production
06 March 2013
Sunny Optical Technology Group Co., Limited (2382.HK / 2382 HK) 21
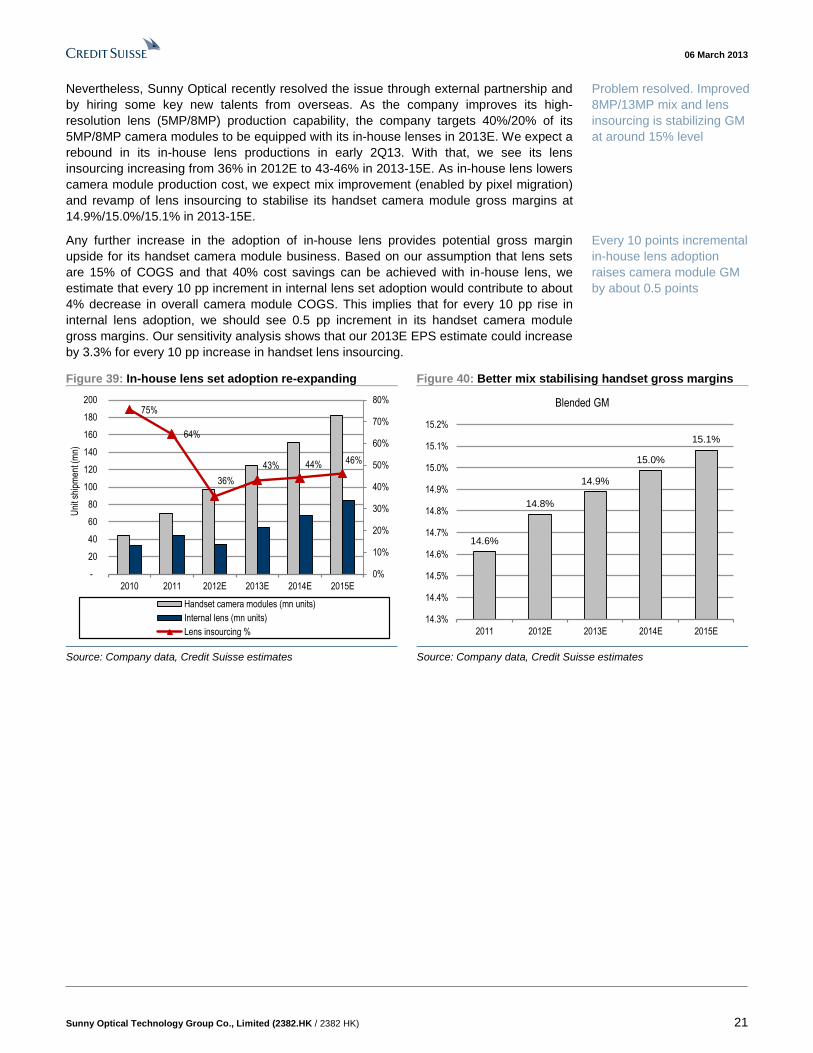
Nevertheless, Sunny Optical recently resolved the issue through external partnership and
by hiring some key new talents from overseas. As the company improves its high-
resolution lens (5MP/8MP) production capability, the company targets 40%/20% of its
5MP/8MP camera modules to be equipped with its in-house lenses in 2013E. We expect a
rebound in its in-house lens productions in early 2Q13. With that, we see its lens
insourcing increasing from 36% in 2012E to 43-46% in 2013-15E. As in-house lens lowers
camera module production cost, we expect mix improvement (enabled by pixel migration)
and revamp of lens insourcing to stabilise its handset camera module gross margins at
14.9%/15.0%/15.1% in 2013-15E.
Any further increase in the adoption of in-house lens provides potential gross margin
upside for its handset camera module business. Based on our assumption that lens sets
are 15% of COGS and that 40% cost savings can be achieved with in-house lens, we
estimate that every 10 pp increment in internal lens set adoption would contribute to about
4% decrease in overall camera module COGS. This implies that for every 10 pp rise in
internal lens adoption, we should see 0.5 pp increment in its handset camera module
gross margins. Our sensitivity analysis shows that our 2013E EPS estimate could increase
by 3.3% for every 10 pp increase in handset lens insourcing.
Figure 39: In-house lens set adoption re-expanding Figure 40: Better mix stabilising handset gross margins
Source: Company data, Credit Suisse estimates Source: Company data, Credit Suisse estimates
75%
64%
36%
43% 44% 46%
0%
10%
20%
30%
40%
50%
60%
70%
80%
-
20
40
60
80
100
120
140
160
180
200
2010 2011 2012E 2013E 2014E 2015E
Uni
t shi
pmen
t (m
n)
Handset camera modules (mn units)
Internal lens (mn units)
Lens insourcing %
14.6%
14.8%
14.9%
15.0%
15.1%
14.3%
14.4%
14.5%
14.6%
14.7%
14.8%
14.9%
15.0%
15.1%
15.2%
2011 2012E 2013E 2014E 2015E
Blended GM
Problem resolved. Improved
8MP/13MP mix and lens
insourcing is stabilizing GM
at around 15% level
Every 10 points incremental
in-house lens adoption
raises camera module GM
by about 0.5 points
06 March 2013
Sunny Optical Technology Group Co., Limited (2382.HK / 2382 HK) 22
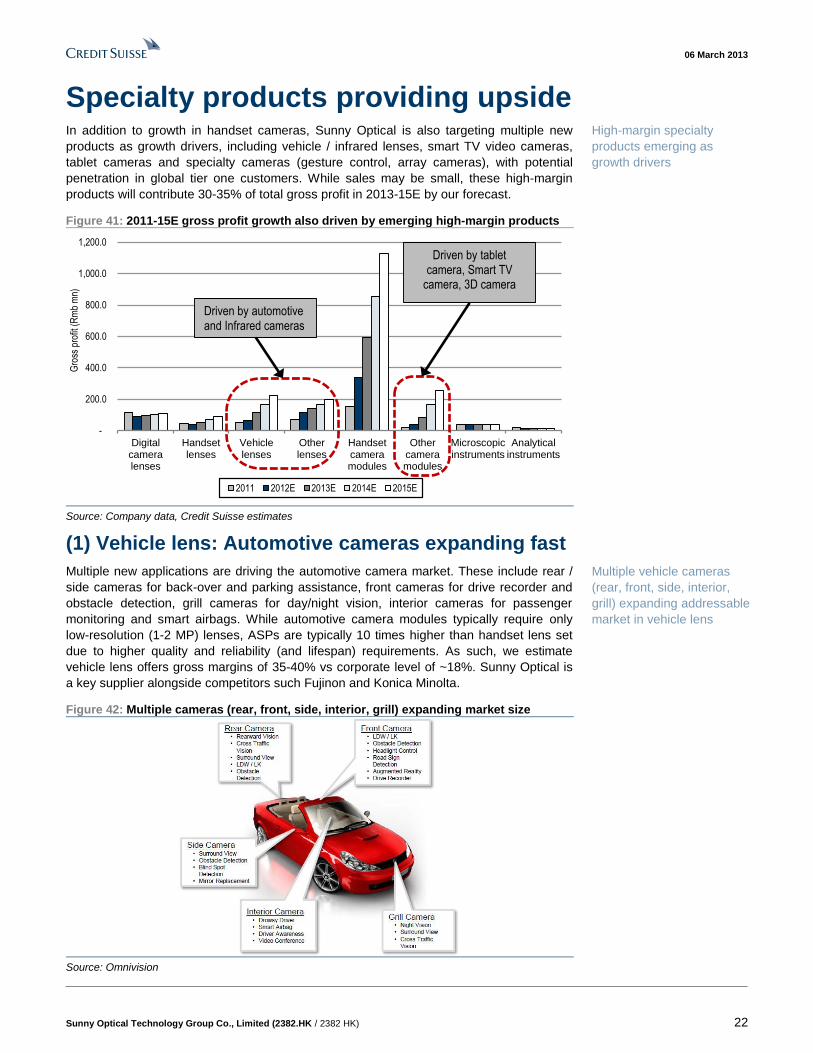
Specialty products providing upside In addition to growth in handset cameras, Sunny Optical is also targeting multiple new
products as growth drivers, including vehicle / infrared lenses, smart TV video cameras,
tablet cameras and specialty cameras (gesture control, array cameras), with potential
penetration in global tier one customers. While sales may be small, these high-margin
products will contribute 30-35% of total gross profit in 2013-15E by our forecast.
Figure 41: 2011-15E gross profit growth also driven by emerging high-margin products
Source: Company data, Credit Suisse estimates
(1) Vehicle lens: Automotive cameras expanding fast
Multiple new applications are driving the automotive camera market. These include rear /
side cameras for back-over and parking assistance, front cameras for drive recorder and
obstacle detection, grill cameras for day/night vision, interior cameras for passenger
monitoring and smart airbags. While automotive camera modules typically require only
low-resolution (1-2 MP) lenses, ASPs are typically 10 times higher than handset lens set
due to higher quality and reliability (and lifespan) requirements. As such, we estimate
vehicle lens offers gross margins of 35-40% vs corporate level of ~18%. Sunny Optical is
a key supplier alongside competitors such Fujinon and Konica Minolta.
Figure 42: Multiple cameras (rear, front, side, interior, grill) expanding market size
Source: Omnivision
-
200.0
400.0
600.0
800.0
1,000.0
1,200.0
Digitalcameralenses
Handsetlenses
Vehiclelenses
Otherlenses
Handsetcameramodules
Othercameramodules
Microscopicinstruments
Analyticalinstruments
Gro
ss p
rofit
(R
mb
mn)
2011 2012E 2013E 2014E 2015E
Driven by automotive and Infrared cameras
Driven by tablet camera, Smart TV
camera, 3D camera
High-margin specialty
products emerging as
growth drivers
Multiple vehicle cameras
(rear, front, side, interior,
grill) expanding addressable
market in vehicle lens
06 March 2013
Sunny Optical Technology Group Co., Limited (2382.HK / 2382 HK) 23
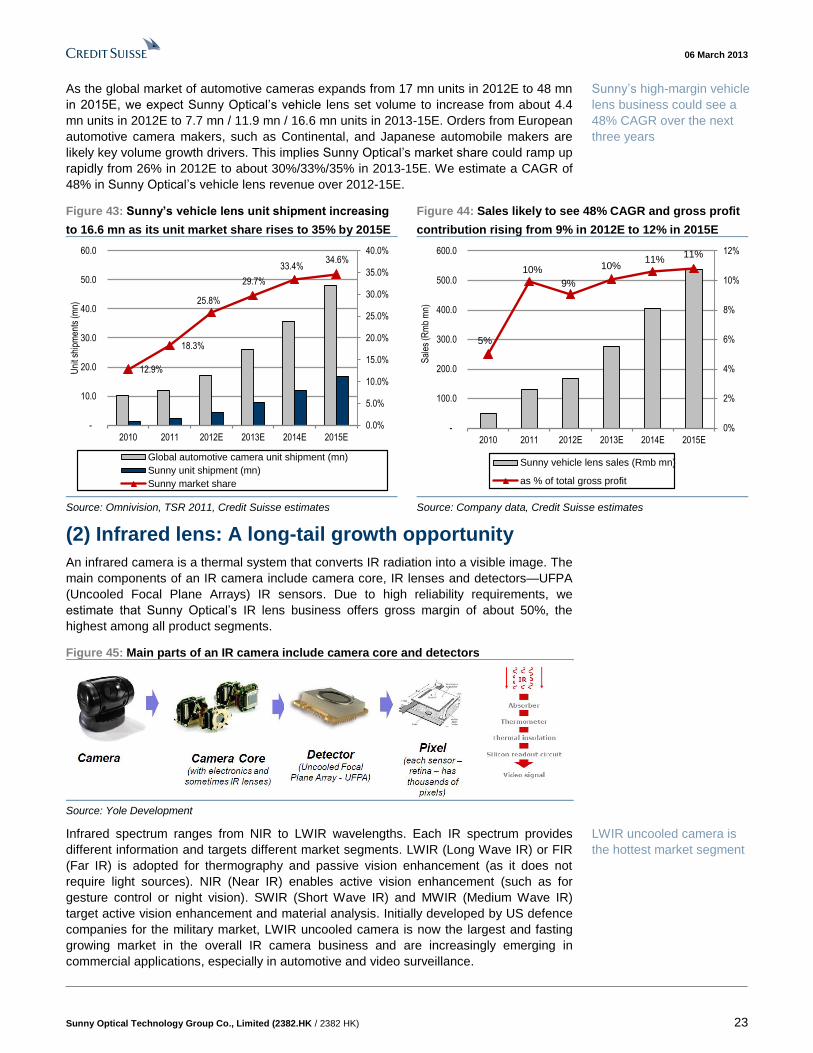
As the global market of automotive cameras expands from 17 mn units in 2012E to 48 mn
in 2015E, we expect Sunny Optical’s vehicle lens set volume to increase from about 4.4
mn units in 2012E to 7.7 mn / 11.9 mn / 16.6 mn units in 2013-15E. Orders from European
automotive camera makers, such as Continental, and Japanese automobile makers are
likely key volume growth drivers. This implies Sunny Optical’s market share could ramp up
rapidly from 26% in 2012E to about 30%/33%/35% in 2013-15E. We estimate a CAGR of
48% in Sunny Optical’s vehicle lens revenue over 2012-15E.
Figure 43: Sunny’s vehicle lens unit shipment increasing
to 16.6 mn as its unit market share rises to 35% by 2015E
Figure 44: Sales likely to see 48% CAGR and gross profit
contribution rising from 9% in 2012E to 12% in 2015E
Source: Omnivision, TSR 2011, Credit Suisse estimates Source: Company data, Credit Suisse estimates
(2) Infrared lens: A long-tail growth opportunity
An infrared camera is a thermal system that converts IR radiation into a visible image. The
main components of an IR camera include camera core, IR lenses and detectors—UFPA
(Uncooled Focal Plane Arrays) IR sensors. Due to high reliability requirements, we
estimate that Sunny Optical’s IR lens business offers gross margin of about 50%, the
highest among all product segments.
Figure 45: Main parts of an IR camera include camera core and detectors
Source: Yole Development
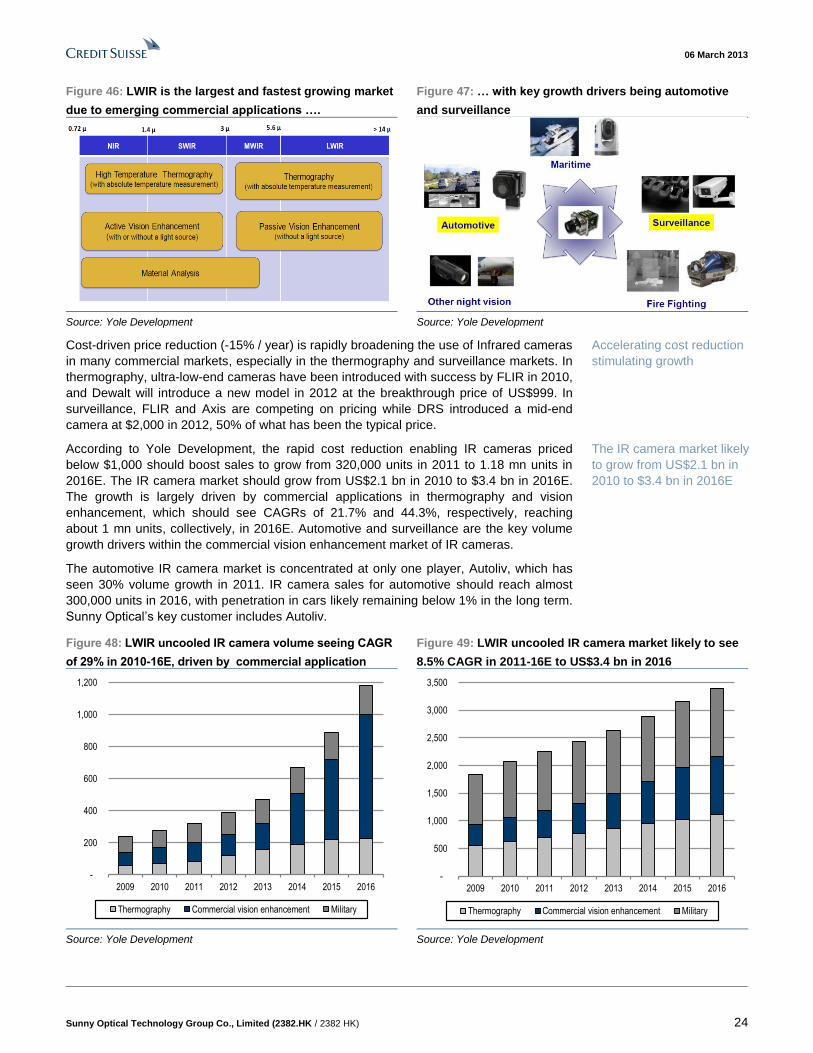
Infrared spectrum ranges from NIR to LWIR wavelengths. Each IR spectrum provides
different information and targets different market segments. LWIR (Long Wave IR) or FIR
(Far IR) is adopted for thermography and passive vision enhancement (as it does not
require light sources). NIR (Near IR) enables active vision enhancement (such as for
gesture control or night vision). SWIR (Short Wave IR) and MWIR (Medium Wave IR)
target active vision enhancement and material analysis. Initially developed by US defence
companies for the military market, LWIR uncooled camera is now the largest and fasting
growing market in the overall IR camera business and are increasingly emerging in
commercial applications, especially in automotive and video surveillance.
12.9%
18.3%
25.8%
29.7%
33.4%34.6%
0.0%
5.0%
10.0%
15.0%
20.0%
25.0%
30.0%
35.0%
40.0%
-
10.0
20.0
30.0
40.0
50.0
60.0
2010 2011 2012E 2013E 2014E 2015E
Uni
t shi
pmen
ts (
mn)
Global automotive camera unit shipment (mn)
Sunny unit shipment (mn)
Sunny market share
5%
10%
9%
10%11%
11%
0%
2%
4%
6%
8%
10%
12%
-
100.0
200.0
300.0
400.0
500.0
600.0
2010 2011 2012E 2013E 2014E 2015E
Sal
es (
Rm
b m
n)
Sunny vehicle lens sales (Rmb mn)
as % of total gross profit
Sunny’s high-margin vehicle
lens business could see a
48% CAGR over the next
three years
LWIR uncooled camera is
the hottest market segment
06 March 2013
Sunny Optical Technology Group Co., Limited (2382.HK / 2382 HK) 24
Figure 46: LWIR is the largest and fastest growing market
due to emerging commercial applications ….
Figure 47: … with key growth drivers being automotive
and surveillance
Source: Yole Development Source: Yole Development
Cost-driven price reduction (-15% / year) is rapidly broadening the use of Infrared cameras
in many commercial markets, especially in the thermography and surveillance markets. In
thermography, ultra-low-end cameras have been introduced with success by FLIR in 2010,
and Dewalt will introduce a new model in 2012 at the breakthrough price of US$999. In
surveillance, FLIR and Axis are competing on pricing while DRS introduced a mid-end
camera at $2,000 in 2012, 50% of what has been the typical price.
According to Yole Development, the rapid cost reduction enabling IR cameras priced
below $1,000 should boost sales to grow from 320,000 units in 2011 to 1.18 mn units in
2016E. The IR camera market should grow from US$2.1 bn in 2010 to $3.4 bn in 2016E.
The growth is largely driven by commercial applications in thermography and vision
enhancement, which should see CAGRs of 21.7% and 44.3%, respectively, reaching
about 1 mn units, collectively, in 2016E. Automotive and surveillance are the key volume
growth drivers within the commercial vision enhancement market of IR cameras.
The automotive IR camera market is concentrated at only one player, Autoliv, which has
seen 30% volume growth in 2011. IR camera sales for automotive should reach almost
300,000 units in 2016, with penetration in cars likely remaining below 1% in the long term.
Sunny Optical’s key customer includes Autoliv.
Figure 48: LWIR uncooled IR camera volume seeing CAGR
of 29% in 2010-16E, driven by commercial application
Figure 49: LWIR uncooled IR camera market likely to see
8.5% CAGR in 2011-16E to US$3.4 bn in 2016
Source: Yole Development Source: Yole Development
-
200
400
600
800
1,000
1,200
2009 2010 2011 2012 2013 2014 2015 2016
Thermography Commercial vision enhancement Military
-
500
1,000
1,500
2,000
2,500
3,000
3,500
2009 2010 2011 2012 2013 2014 2015 2016
Thermography Commercial vision enhancement Military
Accelerating cost reduction
stimulating growth
The IR camera market likely
to grow from US$2.1 bn in
2010 to $3.4 bn in 2016E
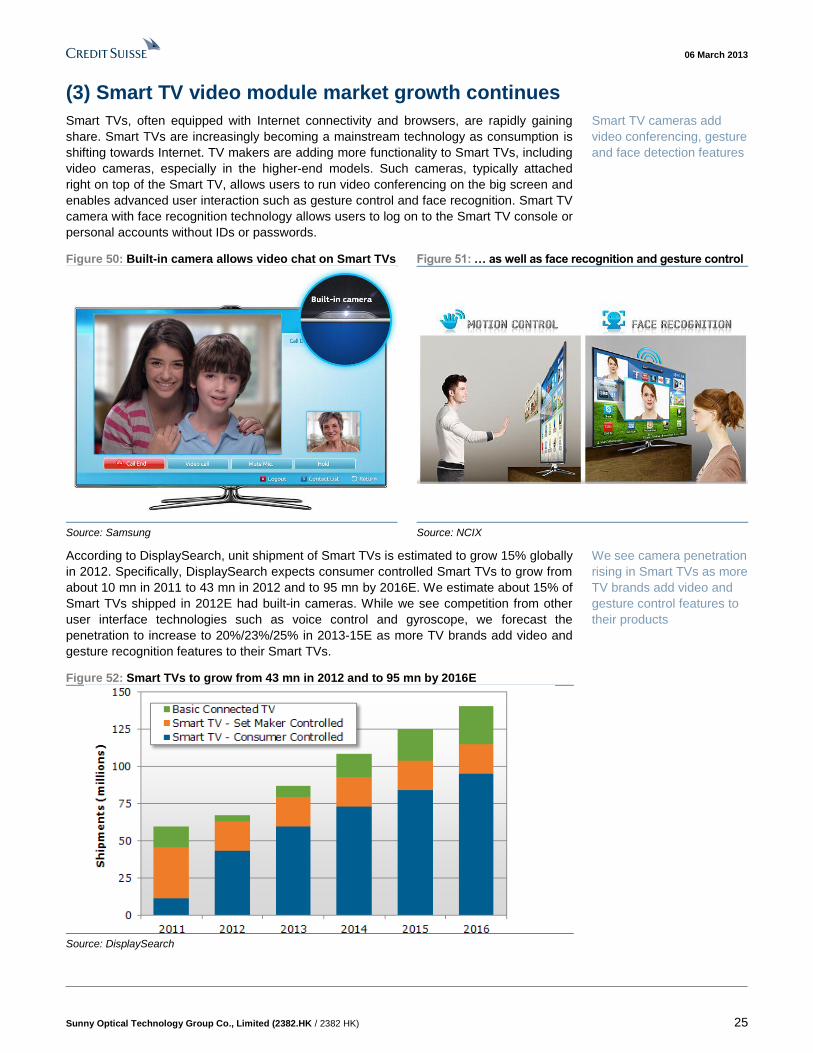
06 March 2013
Sunny Optical Technology Group Co., Limited (2382.HK / 2382 HK) 25
(3) Smart TV video module market growth continues
Smart TVs, often equipped with Internet connectivity and browsers, are rapidly gaining
share. Smart TVs are increasingly becoming a mainstream technology as consumption is
shifting towards Internet. TV makers are adding more functionality to Smart TVs, including
video cameras, especially in the higher-end models. Such cameras, typically attached
right on top of the Smart TV, allows users to run video conferencing on the big screen and
enables advanced user interaction such as gesture control and face recognition. Smart TV
camera with face recognition technology allows users to log on to the Smart TV console or
personal accounts without IDs or passwords.
Figure 50: Built-in camera allows video chat on Smart TVs Figure 51: … as well as face recognition and gesture control
Source: Samsung Source: NCIX
According to DisplaySearch, unit shipment of Smart TVs is estimated to grow 15% globally
in 2012. Specifically, DisplaySearch expects consumer controlled Smart TVs to grow from
about 10 mn in 2011 to 43 mn in 2012 and to 95 mn by 2016E. We estimate about 15% of
Smart TVs shipped in 2012E had built-in cameras. While we see competition from other
user interface technologies such as voice control and gyroscope, we forecast the
penetration to increase to 20%/23%/25% in 2013-15E as more TV brands add video and
gesture recognition features to their Smart TVs.
Figure 52: Smart TVs to grow from 43 mn in 2012 and to 95 mn by 2016E
Source: DisplaySearch
Smart TV cameras add
video conferencing, gesture
and face detection features
We see camera penetration
rising in Smart TVs as more
TV brands add video and
gesture control features to
their products
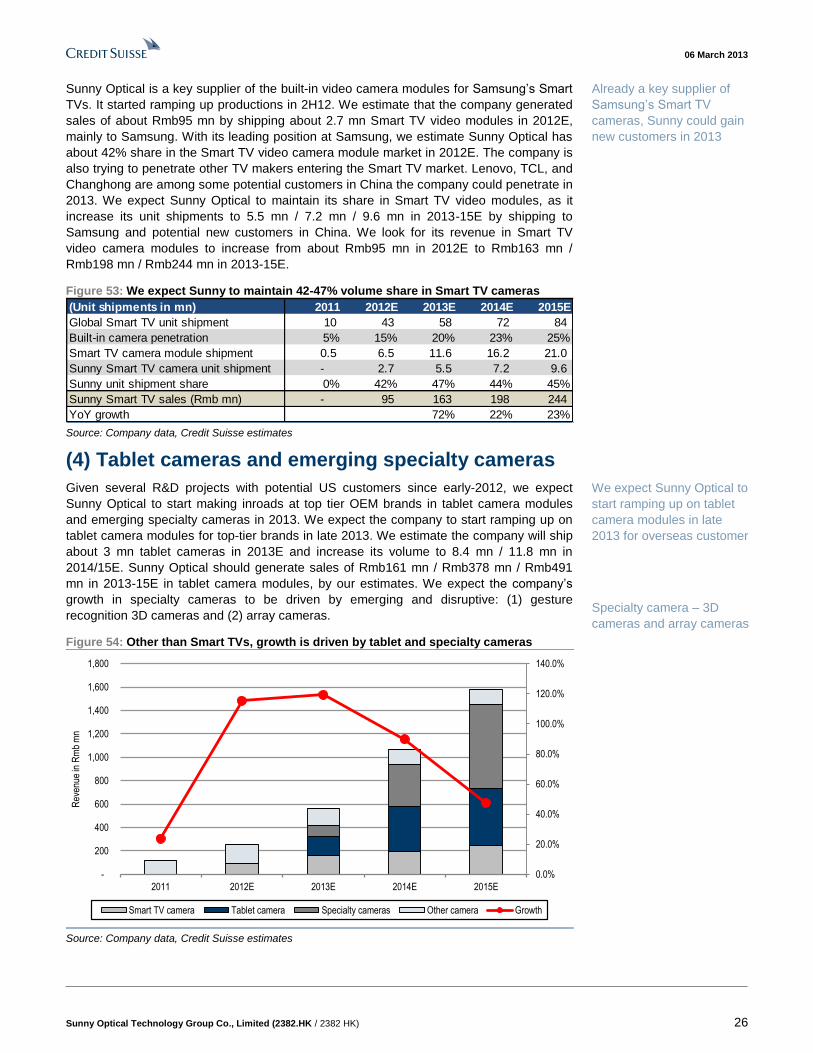
06 March 2013
Sunny Optical Technology Group Co., Limited (2382.HK / 2382 HK) 26
Sunny Optical is a key supplier of the built-in video camera modules for Samsung’s Smart
TVs. It started ramping up productions in 2H12. We estimate that the company generated
sales of about Rmb95 mn by shipping about 2.7 mn Smart TV video modules in 2012E,
mainly to Samsung. With its leading position at Samsung, we estimate Sunny Optical has
about 42% share in the Smart TV video camera module market in 2012E. The company is
also trying to penetrate other TV makers entering the Smart TV market. Lenovo, TCL, and
Changhong are among some potential customers in China the company could penetrate in
2013. We expect Sunny Optical to maintain its share in Smart TV video modules, as it
increase its unit shipments to 5.5 mn / 7.2 mn / 9.6 mn in 2013-15E by shipping to
Samsung and potential new customers in China. We look for its revenue in Smart TV
video camera modules to increase from about Rmb95 mn in 2012E to Rmb163 mn /
Rmb198 mn / Rmb244 mn in 2013-15E.
Figure 53: We expect Sunny to maintain 42-47% volume share in Smart TV cameras
Source: Company data, Credit Suisse estimates
(4) Tablet cameras and emerging specialty cameras
Given several R&D projects with potential US customers since early-2012, we expect
Sunny Optical to start making inroads at top tier OEM brands in tablet camera modules
and emerging specialty cameras in 2013. We expect the company to start ramping up on
tablet camera modules for top-tier brands in late 2013. We estimate the company will ship
about 3 mn tablet cameras in 2013E and increase its volume to 8.4 mn / 11.8 mn in
2014/15E. Sunny Optical should generate sales of Rmb161 mn / Rmb378 mn / Rmb491
mn in 2013-15E in tablet camera modules, by our estimates. We expect the company’s
growth in specialty cameras to be driven by emerging and disruptive: (1) gesture
recognition 3D cameras and (2) array cameras.
Figure 54: Other than Smart TVs, growth is driven by tablet and specialty cameras
Source: Company data, Credit Suisse estimates
(Unit shipments in mn) 2011 2012E 2013E 2014E 2015E
Global Smart TV unit shipment 10 43 58 72 84
Built-in camera penetration 5% 15% 20% 23% 25%
Smart TV camera module shipment 0.5 6.5 11.6 16.2 21.0
Sunny Smart TV camera unit shipment - 2.7 5.5 7.2 9.6
Sunny unit shipment share 0% 42% 47% 44% 45%
Sunny Smart TV sales (Rmb mn) - 95 163 198 244
YoY growth 72% 22% 23%
0.0%
20.0%
40.0%
60.0%
80.0%
100.0%
120.0%
140.0%
-
200
400
600
800
1,000
1,200
1,400
1,600
1,800
2011 2012E 2013E 2014E 2015E
Rev
enue
in R
mb
mn
Smart TV camera Tablet camera Specialty cameras Other camera Growth
Already a key supplier of
Samsung’s Smart TV
cameras, Sunny could gain
new customers in 2013
We expect Sunny Optical to
start ramping up on tablet
camera modules in late
2013 for overseas customer
Specialty camera – 3D
cameras and array cameras
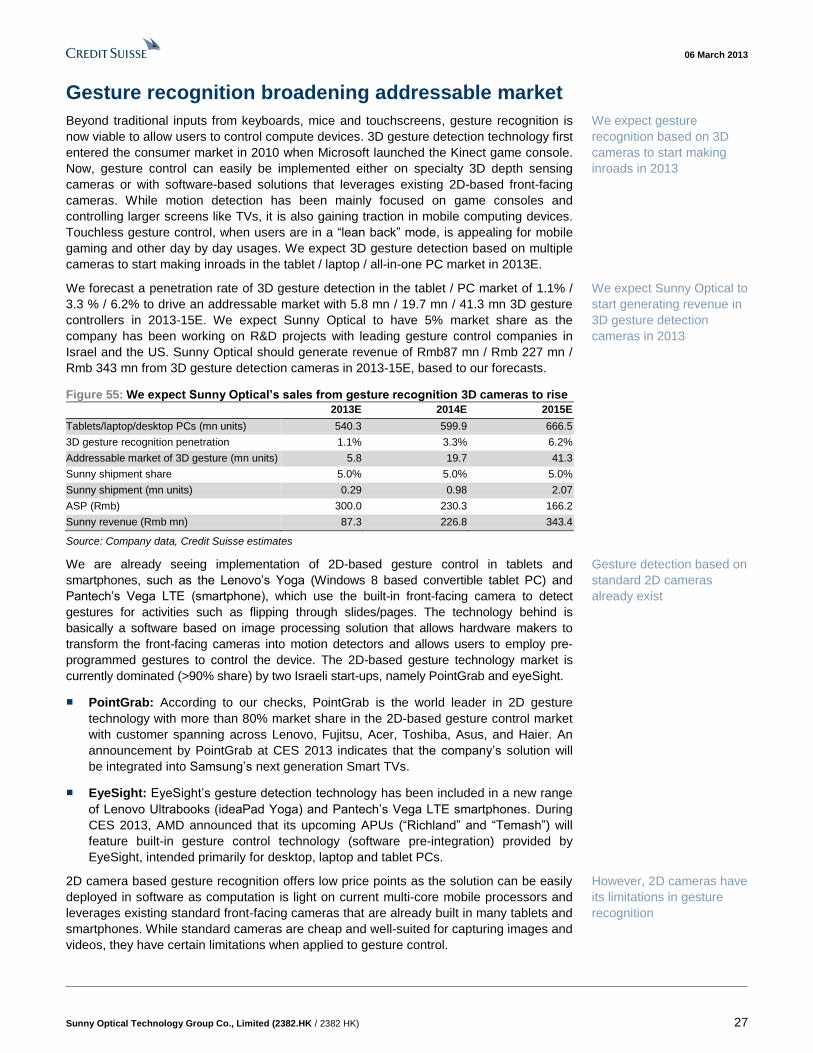
06 March 2013
Sunny Optical Technology Group Co., Limited (2382.HK / 2382 HK) 27
Gesture recognition broadening addressable market
Beyond traditional inputs from keyboards, mice and touchscreens, gesture recognition is
now viable to allow users to control compute devices. 3D gesture detection technology first
entered the consumer market in 2010 when Microsoft launched the Kinect game console.
Now, gesture control can easily be implemented either on specialty 3D depth sensing
cameras or with software-based solutions that leverages existing 2D-based front-facing
cameras. While motion detection has been mainly focused on game consoles and
controlling larger screens like TVs, it is also gaining traction in mobile computing devices.
Touchless gesture control, when users are in a “lean back” mode, is appealing for mobile
gaming and other day by day usages. We expect 3D gesture detection based on multiple
cameras to start making inroads in the tablet / laptop / all-in-one PC market in 2013E.
We forecast a penetration rate of 3D gesture detection in the tablet / PC market of 1.1% /
3.3 % / 6.2% to drive an addressable market with 5.8 mn / 19.7 mn / 41.3 mn 3D gesture
controllers in 2013-15E. We expect Sunny Optical to have 5% market share as the
company has been working on R&D projects with leading gesture control companies in
Israel and the US. Sunny Optical should generate revenue of Rmb87 mn / Rmb 227 mn /
Rmb 343 mn from 3D gesture detection cameras in 2013-15E, based to our forecasts.
Figure 55: We expect Sunny Optical’s sales from gesture recognition 3D cameras to rise
2013E 2014E 2015E
Tablets/laptop/desktop PCs (mn units) 540.3 599.9 666.5
3D gesture recognition penetration 1.1% 3.3% 6.2%
Addressable market of 3D gesture (mn units) 5.8 19.7 41.3
Sunny shipment share 5.0% 5.0% 5.0%
Sunny shipment (mn units) 0.29 0.98 2.07
ASP (Rmb) 300.0 230.3 166.2
Sunny revenue (Rmb mn) 87.3 226.8 343.4
Source: Company data, Credit Suisse estimates
We are already seeing implementation of 2D-based gesture control in tablets and
smartphones, such as the Lenovo’s Yoga (Windows 8 based convertible tablet PC) and
Pantech’s Vega LTE (smartphone), which use the built-in front-facing camera to detect
gestures for activities such as flipping through slides/pages. The technology behind is
basically a software based on image processing solution that allows hardware makers to
transform the front-facing cameras into motion detectors and allows users to employ pre-
programmed gestures to control the device. The 2D-based gesture technology market is
currently dominated (>90% share) by two Israeli start-ups, namely PointGrab and eyeSight.
■ PointGrab: According to our checks, PointGrab is the world leader in 2D gesture
technology with more than 80% market share in the 2D-based gesture control market
with customer spanning across Lenovo, Fujitsu, Acer, Toshiba, Asus, and Haier. An
announcement by PointGrab at CES 2013 indicates that the company’s solution will
be integrated into Samsung’s next generation Smart TVs.
■ EyeSight: EyeSight’s gesture detection technology has been included in a new range
of Lenovo Ultrabooks (ideaPad Yoga) and Pantech’s Vega LTE smartphones. During
CES 2013, AMD announced that its upcoming APUs (“Richland” and “Temash”) will
feature built-in gesture control technology (software pre-integration) provided by
EyeSight, intended primarily for desktop, laptop and tablet PCs.
2D camera based gesture recognition offers low price points as the solution can be easily
deployed in software as computation is light on current multi-core mobile processors and
leverages existing standard front-facing cameras that are already built in many tablets and
smartphones. While standard cameras are cheap and well-suited for capturing images and
videos, they have certain limitations when applied to gesture control.
We expect gesture
recognition based on 3D
cameras to start making
inroads in 2013
We expect Sunny Optical to
start generating revenue in
3D gesture detection
cameras in 2013
Gesture detection based on
standard 2D cameras
already exist
However, 2D cameras have
its limitations in gesture
recognition
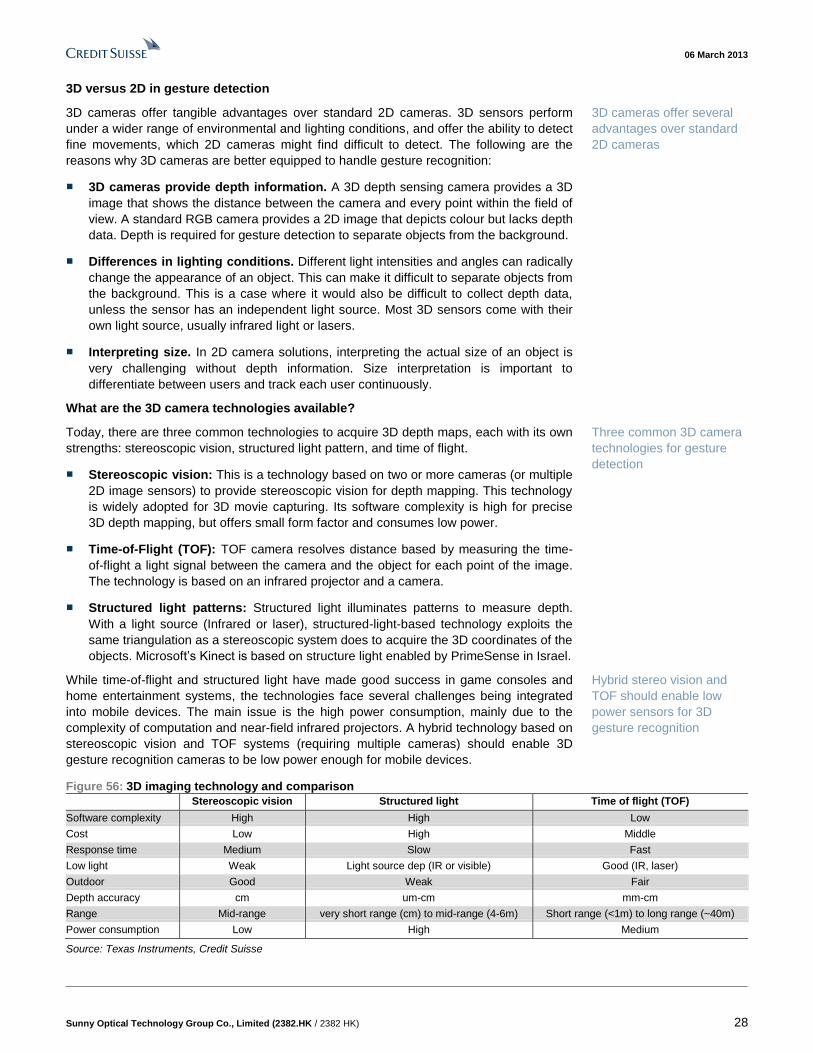
06 March 2013
Sunny Optical Technology Group Co., Limited (2382.HK / 2382 HK) 28
3D versus 2D in gesture detection
3D cameras offer tangible advantages over standard 2D cameras. 3D sensors perform
under a wider range of environmental and lighting conditions, and offer the ability to detect
fine movements, which 2D cameras might find difficult to detect. The following are the
reasons why 3D cameras are better equipped to handle gesture recognition:
■ 3D cameras provide depth information. A 3D depth sensing camera provides a 3D
image that shows the distance between the camera and every point within the field of
view. A standard RGB camera provides a 2D image that depicts colour but lacks depth
data. Depth is required for gesture detection to separate objects from the background.
■ Differences in lighting conditions. Different light intensities and angles can radically
change the appearance of an object. This can make it difficult to separate objects from
the background. This is a case where it would also be difficult to collect depth data,
unless the sensor has an independent light source. Most 3D sensors come with their
own light source, usually infrared light or lasers.
■ Interpreting size. In 2D camera solutions, interpreting the actual size of an object is
very challenging without depth information. Size interpretation is important to
differentiate between users and track each user continuously.
What are the 3D camera technologies available?
Today, there are three common technologies to acquire 3D depth maps, each with its own
strengths: stereoscopic vision, structured light pattern, and time of flight.
■ Stereoscopic vision: This is a technology based on two or more cameras (or multiple
2D image sensors) to provide stereoscopic vision for depth mapping. This technology
is widely adopted for 3D movie capturing. Its software complexity is high for precise
3D depth mapping, but offers small form factor and consumes low power.
■ Time-of-Flight (TOF): TOF camera resolves distance based by measuring the time-
of-flight a light signal between the camera and the object for each point of the image.
The technology is based on an infrared projector and a camera.
■ Structured light patterns: Structured light illuminates patterns to measure depth.
With a light source (Infrared or laser), structured-light-based technology exploits the
same triangulation as a stereoscopic system does to acquire the 3D coordinates of the
objects. Microsoft’s Kinect is based on structure light enabled by PrimeSense in Israel.
While time-of-flight and structured light have made good success in game consoles and
home entertainment systems, the technologies face several challenges being integrated
into mobile devices. The main issue is the high power consumption, mainly due to the
complexity of computation and near-field infrared projectors. A hybrid technology based on
stereoscopic vision and TOF systems (requiring multiple cameras) should enable 3D
gesture recognition cameras to be low power enough for mobile devices.
Figure 56: 3D imaging technology and comparison
Stereoscopic vision Structured light Time of flight (TOF)
Software complexity High High Low
Cost Low High Middle
Response time Medium Slow Fast
Low light Weak Light source dep (IR or visible) Good (IR, laser)
Outdoor Good Weak Fair
Depth accuracy cm um-cm mm-cm
Range Mid-range very short range (cm) to mid-range (4-6m) Short range (<1m) to long range (~40m)
Power consumption Low High Medium
Source: Texas Instruments, Credit Suisse
3D cameras offer several
advantages over standard
2D cameras
Three common 3D camera
technologies for gesture
detection
Hybrid stereo vision and
TOF should enable low
power sensors for 3D
gesture recognition
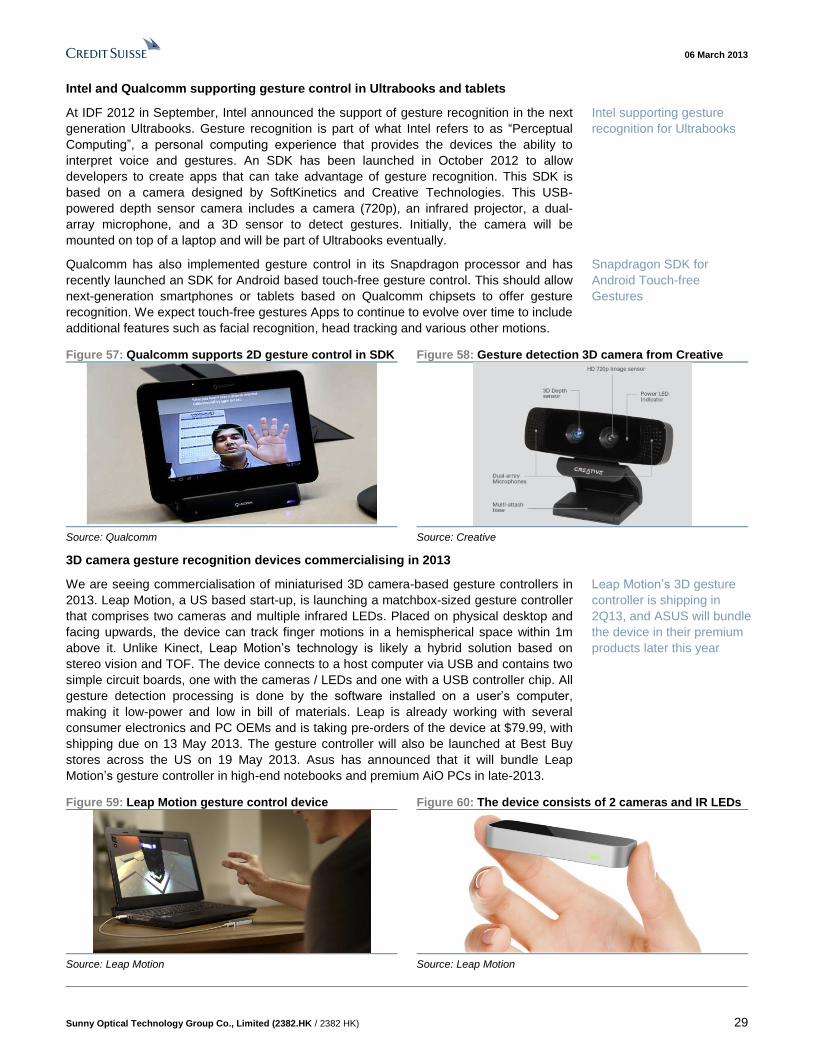
06 March 2013
Sunny Optical Technology Group Co., Limited (2382.HK / 2382 HK) 29
Intel and Qualcomm supporting gesture control in Ultrabooks and tablets
At IDF 2012 in September, Intel announced the support of gesture recognition in the next
generation Ultrabooks. Gesture recognition is part of what Intel refers to as “Perceptual
Computing”, a personal computing experience that provides the devices the ability to
interpret voice and gestures. An SDK has been launched in October 2012 to allow
developers to create apps that can take advantage of gesture recognition. This SDK is
based on a camera designed by SoftKinetics and Creative Technologies. This USB-
powered depth sensor camera includes a camera (720p), an infrared projector, a dual-
array microphone, and a 3D sensor to detect gestures. Initially, the camera will be
mounted on top of a laptop and will be part of Ultrabooks eventually.
Qualcomm has also implemented gesture control in its Snapdragon processor and has
recently launched an SDK for Android based touch-free gesture control. This should allow
next-generation smartphones or tablets based on Qualcomm chipsets to offer gesture
recognition. We expect touch-free gestures Apps to continue to evolve over time to include
additional features such as facial recognition, head tracking and various other motions.
Figure 57: Qualcomm supports 2D gesture control in SDK Figure 58: Gesture detection 3D camera from Creative
Source: Qualcomm Source: Creative
3D camera gesture recognition devices commercialising in 2013
We are seeing commercialisation of miniaturised 3D camera-based gesture controllers in
2013. Leap Motion, a US based start-up, is launching a matchbox-sized gesture controller
that comprises two cameras and multiple infrared LEDs. Placed on physical desktop and
facing upwards, the device can track finger motions in a hemispherical space within 1m
above it. Unlike Kinect, Leap Motion’s technology is likely a hybrid solution based on
stereo vision and TOF. The device connects to a host computer via USB and contains two
simple circuit boards, one with the cameras / LEDs and one with a USB controller chip. All
gesture detection processing is done by the software installed on a user’s computer,
making it low-power and low in bill of materials. Leap is already working with several
consumer electronics and PC OEMs and is taking pre-orders of the device at $79.99, with
shipping due on 13 May 2013. The gesture controller will also be launched at Best Buy
stores across the US on 19 May 2013. Asus has announced that it will bundle Leap
Motion’s gesture controller in high-end notebooks and premium AiO PCs in late-2013.
Figure 59: Leap Motion gesture control device Figure 60: The device consists of 2 cameras and IR LEDs
Source: Leap Motion Source: Leap Motion
Intel supporting gesture
recognition for Ultrabooks
Snapdragon SDK for
Android Touch-free
Gestures
Leap Motion’s 3D gesture
controller is shipping in
2Q13, and ASUS will bundle
the device in their premium
products later this year
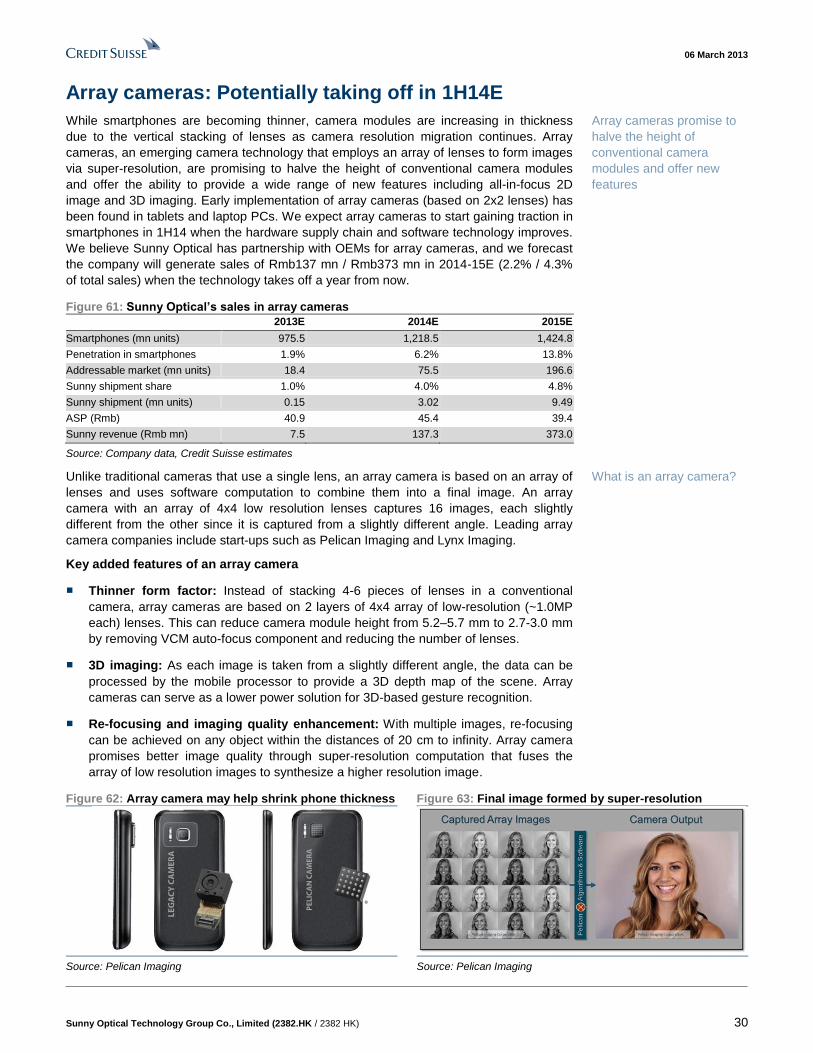
06 March 2013
Sunny Optical Technology Group Co., Limited (2382.HK / 2382 HK) 30
Array cameras: Potentially taking off in 1H14E
While smartphones are becoming thinner, camera modules are increasing in thickness
due to the vertical stacking of lenses as camera resolution migration continues. Array
cameras, an emerging camera technology that employs an array of lenses to form images
via super-resolution, are promising to halve the height of conventional camera modules
and offer the ability to provide a wide range of new features including all-in-focus 2D
image and 3D imaging. Early implementation of array cameras (based on 2x2 lenses) has
been found in tablets and laptop PCs. We expect array cameras to start gaining traction in
smartphones in 1H14 when the hardware supply chain and software technology improves.
We believe Sunny Optical has partnership with OEMs for array cameras, and we forecast
the company will generate sales of Rmb137 mn / Rmb373 mn in 2014-15E (2.2% / 4.3%
of total sales) when the technology takes off a year from now.
Figure 61: Sunny Optical’s sales in array cameras
2013E 2014E 2015E
Smartphones (mn units) 975.5 1,218.5 1,424.8
Penetration in smartphones 1.9% 6.2% 13.8%
Addressable market (mn units) 18.4 75.5 196.6
Sunny shipment share 1.0% 4.0% 4.8%
Sunny shipment (mn units) 0.15 3.02 9.49
ASP (Rmb) 40.9 45.4 39.4
Sunny revenue (Rmb mn) 7.5 137.3 373.0
Source: Company data, Credit Suisse estimates
Unlike traditional cameras that use a single lens, an array camera is based on an array of
lenses and uses software computation to combine them into a final image. An array
camera with an array of 4x4 low resolution lenses captures 16 images, each slightly
different from the other since it is captured from a slightly different angle. Leading array
camera companies include start-ups such as Pelican Imaging and Lynx Imaging.
Key added features of an array camera
■ Thinner form factor: Instead of stacking 4-6 pieces of lenses in a conventional
camera, array cameras are based on 2 layers of 4x4 array of low-resolution (~1.0MP
each) lenses. This can reduce camera module height from 5.2–5.7 mm to 2.7-3.0 mm
by removing VCM auto-focus component and reducing the number of lenses.
■ 3D imaging: As each image is taken from a slightly different angle, the data can be
processed by the mobile processor to provide a 3D depth map of the scene. Array
cameras can serve as a lower power solution for 3D-based gesture recognition.
■ Re-focusing and imaging quality enhancement: With multiple images, re-focusing
can be achieved on any object within the distances of 20 cm to infinity. Array camera
promises better image quality through super-resolution computation that fuses the
array of low resolution images to synthesize a higher resolution image.
Figure 62: Array camera may help shrink phone thickness Figure 63: Final image formed by super-resolution
Source: Pelican Imaging Source: Pelican Imaging
Array cameras promise to
halve the height of
conventional camera
modules and offer new
features
What is an array camera?
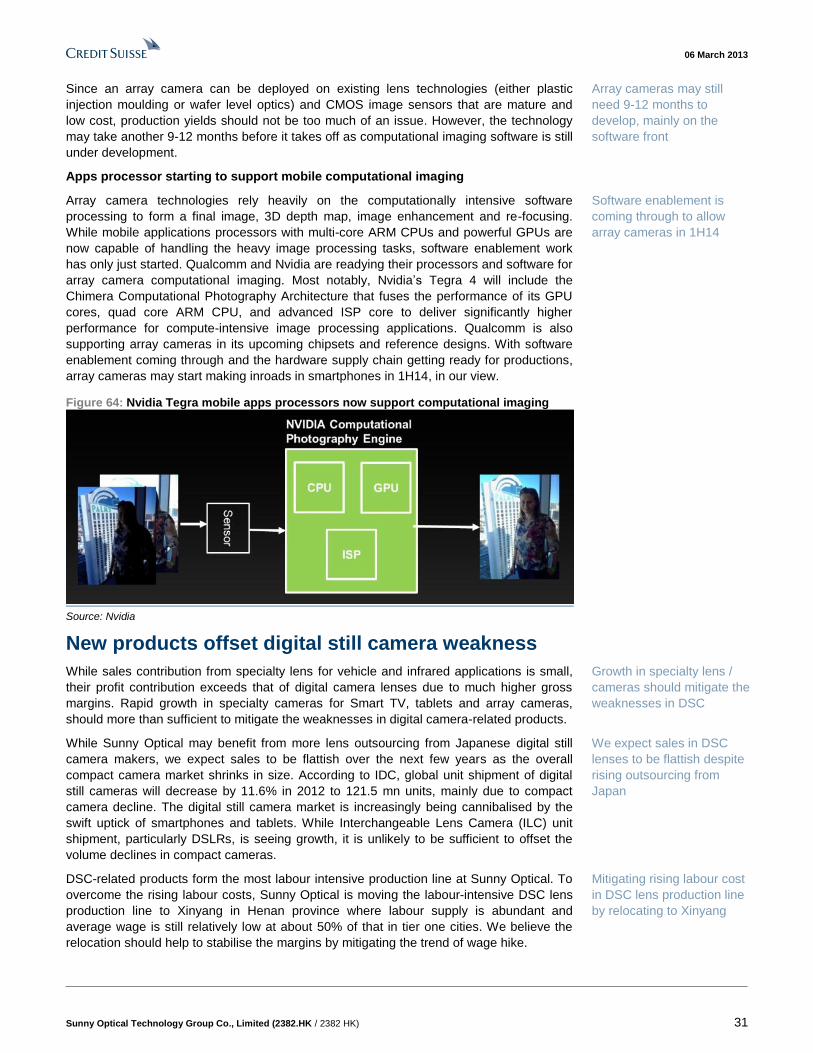
06 March 2013
Sunny Optical Technology Group Co., Limited (2382.HK / 2382 HK) 31
Since an array camera can be deployed on existing lens technologies (either plastic
injection moulding or wafer level optics) and CMOS image sensors that are mature and
low cost, production yields should not be too much of an issue. However, the technology
may take another 9-12 months before it takes off as computational imaging software is still
under development.
Apps processor starting to support mobile computational imaging
Array camera technologies rely heavily on the computationally intensive software
processing to form a final image, 3D depth map, image enhancement and re-focusing.
While mobile applications processors with multi-core ARM CPUs and powerful GPUs are
now capable of handling the heavy image processing tasks, software enablement work
has only just started. Qualcomm and Nvidia are readying their processors and software for
array camera computational imaging. Most notably, Nvidia’s Tegra 4 will include the
Chimera Computational Photography Architecture that fuses the performance of its GPU
cores, quad core ARM CPU, and advanced ISP core to deliver significantly higher
performance for compute-intensive image processing applications. Qualcomm is also
supporting array cameras in its upcoming chipsets and reference designs. With software
enablement coming through and the hardware supply chain getting ready for productions,
array cameras may start making inroads in smartphones in 1H14, in our view.
Figure 64: Nvidia Tegra mobile apps processors now support computational imaging
Source: Nvidia
New products offset digital still camera weakness
While sales contribution from specialty lens for vehicle and infrared applications is small,
their profit contribution exceeds that of digital camera lenses due to much higher gross
margins. Rapid growth in specialty cameras for Smart TV, tablets and array cameras,
should more than sufficient to mitigate the weaknesses in digital camera-related products.
While Sunny Optical may benefit from more lens outsourcing from Japanese digital still
camera makers, we expect sales to be flattish over the next few years as the overall
compact camera market shrinks in size. According to IDC, global unit shipment of digital
still cameras will decrease by 11.6% in 2012 to 121.5 mn units, mainly due to compact
camera decline. The digital still camera market is increasingly being cannibalised by the
swift uptick of smartphones and tablets. While Interchangeable Lens Camera (ILC) unit
shipment, particularly DSLRs, is seeing growth, it is unlikely to be sufficient to offset the
volume declines in compact cameras.
DSC-related products form the most labour intensive production line at Sunny Optical. To
overcome the rising labour costs, Sunny Optical is moving the labour-intensive DSC lens
production line to Xinyang in Henan province where labour supply is abundant and
average wage is still relatively low at about 50% of that in tier one cities. We believe the
relocation should help to stabilise the margins by mitigating the trend of wage hike.
Array cameras may still
need 9-12 months to
develop, mainly on the
software front
Software enablement is
coming through to allow
array cameras in 1H14
Growth in specialty lens /
cameras should mitigate the
weaknesses in DSC
We expect sales in DSC
lenses to be flattish despite
rising outsourcing from
Japan
Mitigating rising labour cost
in DSC lens production line
by relocating to Xinyang
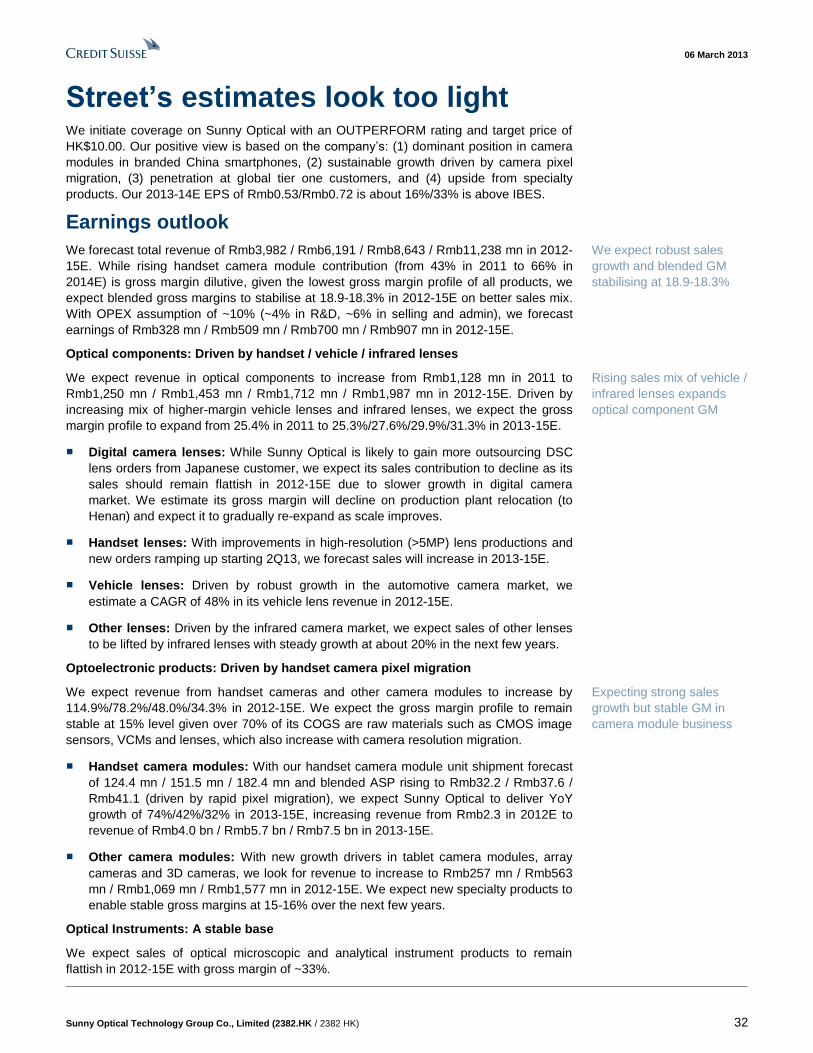
06 March 2013
Sunny Optical Technology Group Co., Limited (2382.HK / 2382 HK) 32
Street’s estimates look too light We initiate coverage on Sunny Optical with an OUTPERFORM rating and target price of
HK$10.00. Our positive view is based on the company’s: (1) dominant position in camera
modules in branded China smartphones, (2) sustainable growth driven by camera pixel
migration, (3) penetration at global tier one customers, and (4) upside from specialty
products. Our 2013-14E EPS of Rmb0.53/Rmb0.72 is about 16%/33% is above IBES.
Earnings outlook
We forecast total revenue of Rmb3,982 / Rmb6,191 / Rmb8,643 / Rmb11,238 mn in 2012-
15E. While rising handset camera module contribution (from 43% in 2011 to 66% in
2014E) is gross margin dilutive, given the lowest gross margin profile of all products, we
expect blended gross margins to stabilise at 18.9-18.3% in 2012-15E on better sales mix.
With OPEX assumption of ~10% (~4% in R&D, ~6% in selling and admin), we forecast
earnings of Rmb328 mn / Rmb509 mn / Rmb700 mn / Rmb907 mn in 2012-15E.
Optical components: Driven by handset / vehicle / infrared lenses
We expect revenue in optical components to increase from Rmb1,128 mn in 2011 to
Rmb1,250 mn / Rmb1,453 mn / Rmb1,712 mn / Rmb1,987 mn in 2012-15E. Driven by
increasing mix of higher-margin vehicle lenses and infrared lenses, we expect the gross
margin profile to expand from 25.4% in 2011 to 25.3%/27.6%/29.9%/31.3% in 2013-15E.
■ Digital camera lenses: While Sunny Optical is likely to gain more outsourcing DSC
lens orders from Japanese customer, we expect its sales contribution to decline as its
sales should remain flattish in 2012-15E due to slower growth in digital camera
market. We estimate its gross margin will decline on production plant relocation (to
Henan) and expect it to gradually re-expand as scale improves.
■ Handset lenses: With improvements in high-resolution (>5MP) lens productions and
new orders ramping up starting 2Q13, we forecast sales will increase in 2013-15E.
■ Vehicle lenses: Driven by robust growth in the automotive camera market, we
estimate a CAGR of 48% in its vehicle lens revenue in 2012-15E.
■ Other lenses: Driven by the infrared camera market, we expect sales of other lenses
to be lifted by infrared lenses with steady growth at about 20% in the next few years.
Optoelectronic products: Driven by handset camera pixel migration
We expect revenue from handset cameras and other camera modules to increase by
114.9%/78.2%/48.0%/34.3% in 2012-15E. We expect the gross margin profile to remain
stable at 15% level given over 70% of its COGS are raw materials such as CMOS image
sensors, VCMs and lenses, which also increase with camera resolution migration.
■ Handset camera modules: With our handset camera module unit shipment forecast
of 124.4 mn / 151.5 mn / 182.4 mn and blended ASP rising to Rmb32.2 / Rmb37.6 /
Rmb41.1 (driven by rapid pixel migration), we expect Sunny Optical to deliver YoY
growth of 74%/42%/32% in 2013-15E, increasing revenue from Rmb2.3 in 2012E to
revenue of Rmb4.0 bn / Rmb5.7 bn / Rmb7.5 bn in 2013-15E.
■ Other camera modules: With new growth drivers in tablet camera modules, array
cameras and 3D cameras, we look for revenue to increase to Rmb257 mn / Rmb563
mn / Rmb1,069 mn / Rmb1,577 mn in 2012-15E. We expect new specialty products to
enable stable gross margins at 15-16% over the next few years.
Optical Instruments: A stable base
We expect sales of optical microscopic and analytical instrument products to remain
flattish in 2012-15E with gross margin of ~33%.
We expect robust sales
growth and blended GM
stabilising at 18.9-18.3%
Rising sales mix of vehicle /
infrared lenses expands
optical component GM
Expecting strong sales
growth but stable GM in
camera module business
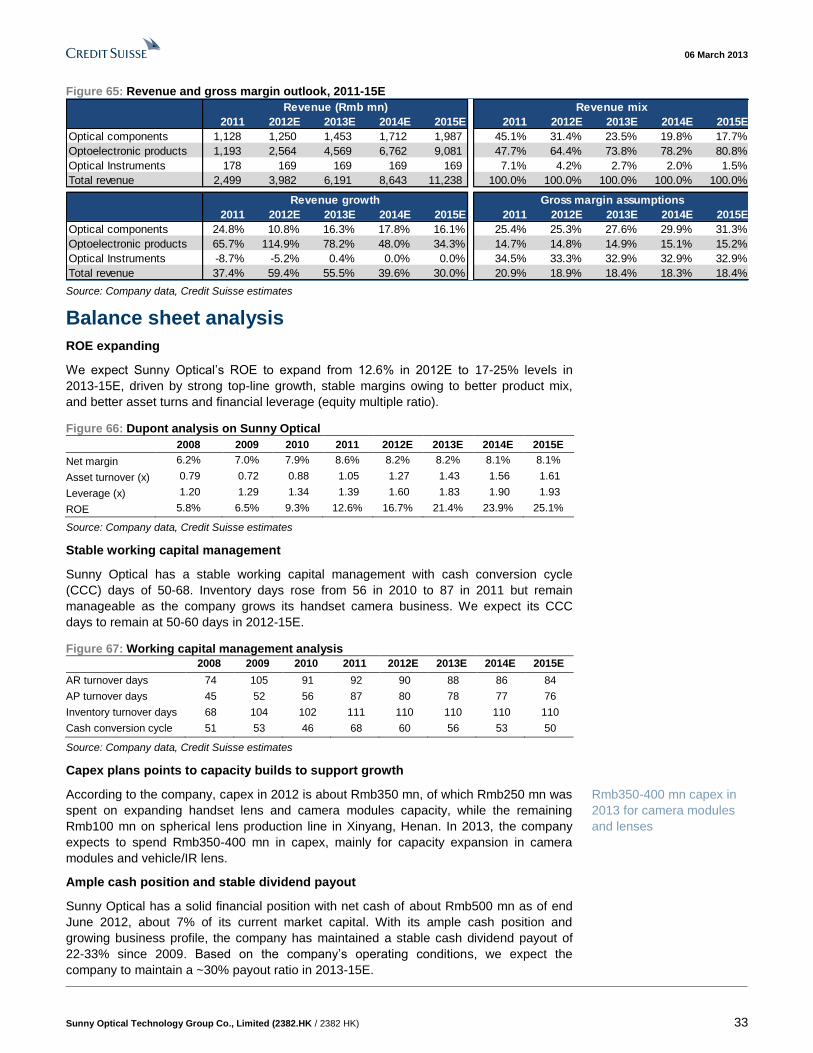
06 March 2013
Sunny Optical Technology Group Co., Limited (2382.HK / 2382 HK) 33
Figure 65: Revenue and gross margin outlook, 2011-15E
Source: Company data, Credit Suisse estimates
Balance sheet analysis
ROE expanding
We expect Sunny Optical’s ROE to expand from 12.6% in 2012E to 17-25% levels in
2013-15E, driven by strong top-line growth, stable margins owing to better product mix,
and better asset turns and financial leverage (equity multiple ratio).
Figure 66: Dupont analysis on Sunny Optical
2008 2009 2010 2011 2012E 2013E 2014E 2015E
Net margin 6.2% 7.0% 7.9% 8.6% 8.2% 8.2% 8.1% 8.1%
Asset turnover (x) 0.79 0.72 0.88 1.05 1.27 1.43 1.56 1.61
Leverage (x) 1.20 1.29 1.34 1.39 1.60 1.83 1.90 1.93
ROE 5.8% 6.5% 9.3% 12.6% 16.7% 21.4% 23.9% 25.1%
Source: Company data, Credit Suisse estimates
Stable working capital management
Sunny Optical has a stable working capital management with cash conversion cycle
(CCC) days of 50-68. Inventory days rose from 56 in 2010 to 87 in 2011 but remain
manageable as the company grows its handset camera business. We expect its CCC
days to remain at 50-60 days in 2012-15E.
Figure 67: Working capital management analysis
2008 2009 2010 2011 2012E 2013E 2014E 2015E
AR turnover days 74 105 91 92 90 88 86 84
AP turnover days 45 52 56 87 80 78 77 76
Inventory turnover days 68 104 102 111 110 110 110 110
Cash conversion cycle 51 53 46 68 60 56 53 50
Source: Company data, Credit Suisse estimates
Capex plans points to capacity builds to support growth
According to the company, capex in 2012 is about Rmb350 mn, of which Rmb250 mn was
spent on expanding handset lens and camera modules capacity, while the remaining
Rmb100 mn on spherical lens production line in Xinyang, Henan. In 2013, the company
expects to spend Rmb350-400 mn in capex, mainly for capacity expansion in camera
modules and vehicle/IR lens.
Ample cash position and stable dividend payout
Sunny Optical has a solid financial position with net cash of about Rmb500 mn as of end
June 2012, about 7% of its current market capital. With its ample cash position and
growing business profile, the company has maintained a stable cash dividend payout of
22-33% since 2009. Based on the company’s operating conditions, we expect the
company to maintain a ~30% payout ratio in 2013-15E.
2011 2012E 2013E 2014E 2015E 2011 2012E 2013E 2014E 2015E
Optical components 1,128 1,250 1,453 1,712 1,987 45.1% 31.4% 23.5% 19.8% 17.7%
Optoelectronic products 1,193 2,564 4,569 6,762 9,081 47.7% 64.4% 73.8% 78.2% 80.8%
Optical Instruments 178 169 169 169 169 7.1% 4.2% 2.7% 2.0% 1.5%
Total revenue 2,499 3,982 6,191 8,643 11,238 100.0% 100.0% 100.0% 100.0% 100.0%
2011 2012E 2013E 2014E 2015E 2011 2012E 2013E 2014E 2015E
Optical components 24.8% 10.8% 16.3% 17.8% 16.1% 25.4% 25.3% 27.6% 29.9% 31.3%
Optoelectronic products 65.7% 114.9% 78.2% 48.0% 34.3% 14.7% 14.8% 14.9% 15.1% 15.2%
Optical Instruments -8.7% -5.2% 0.4% 0.0% 0.0% 34.5% 33.3% 32.9% 32.9% 32.9%
Total revenue 37.4% 59.4% 55.5% 39.6% 30.0% 20.9% 18.9% 18.4% 18.3% 18.4%
Revenue growth Gross margin assumptions
Revenue (Rmb mn) Revenue mix
Rmb350-400 mn capex in
2013 for camera modules
and lenses
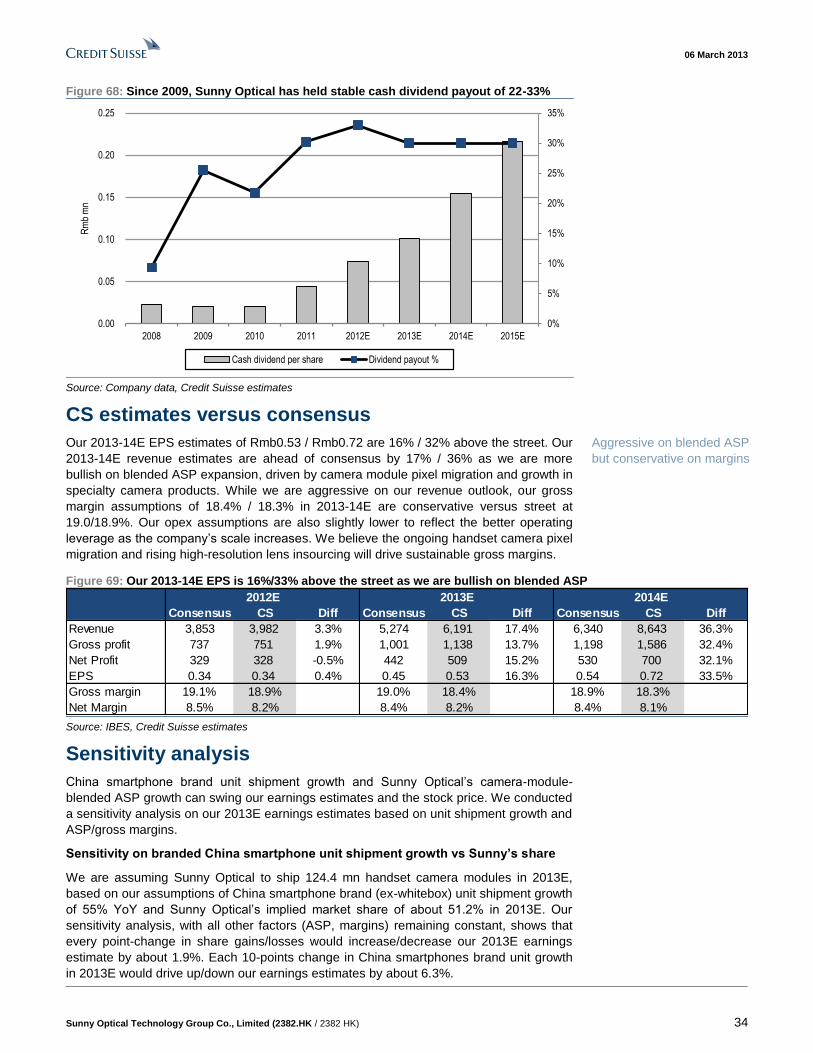
06 March 2013
Sunny Optical Technology Group Co., Limited (2382.HK / 2382 HK) 34
Figure 68: Since 2009, Sunny Optical has held stable cash dividend payout of 22-33%
Source: Company data, Credit Suisse estimates
CS estimates versus consensus
Our 2013-14E EPS estimates of Rmb0.53 / Rmb0.72 are 16% / 32% above the street. Our
2013-14E revenue estimates are ahead of consensus by 17% / 36% as we are more
bullish on blended ASP expansion, driven by camera module pixel migration and growth in
specialty camera products. While we are aggressive on our revenue outlook, our gross
margin assumptions of 18.4% / 18.3% in 2013-14E are conservative versus street at
19.0/18.9%. Our opex assumptions are also slightly lower to reflect the better operating
leverage as the company’s scale increases. We believe the ongoing handset camera pixel
migration and rising high-resolution lens insourcing will drive sustainable gross margins.
Figure 69: Our 2013-14E EPS is 16%/33% above the street as we are bullish on blended ASP
Source: IBES, Credit Suisse estimates
Sensitivity analysis
China smartphone brand unit shipment growth and Sunny Optical’s camera-module-
blended ASP growth can swing our earnings estimates and the stock price. We conducted
a sensitivity analysis on our 2013E earnings estimates based on unit shipment growth and
ASP/gross margins.
Sensitivity on branded China smartphone unit shipment growth vs Sunny’s share
We are assuming Sunny Optical to ship 124.4 mn handset camera modules in 2013E,
based on our assumptions of China smartphone brand (ex-whitebox) unit shipment growth
of 55% YoY and Sunny Optical’s implied market share of about 51.2% in 2013E. Our
sensitivity analysis, with all other factors (ASP, margins) remaining constant, shows that
every point-change in share gains/losses would increase/decrease our 2013E earnings
estimate by about 1.9%. Each 10-points change in China smartphones brand unit growth
in 2013E would drive up/down our earnings estimates by about 6.3%.
0%
5%
10%
15%
20%
25%
30%
35%
0.00
0.05
0.10
0.15
0.20
0.25
2008 2009 2010 2011 2012E 2013E 2014E 2015E
Rm
b m
n
Cash dividend per share Dividend payout %
Consensus CS Diff Consensus CS Diff Consensus CS Diff
Revenue 3,853 3,982 3.3% 5,274 6,191 17.4% 6,340 8,643 36.3%
Gross profit 737 751 1.9% 1,001 1,138 13.7% 1,198 1,586 32.4%
Net Profit 329 328 -0.5% 442 509 15.2% 530 700 32.1%
EPS 0.34 0.34 0.4% 0.45 0.53 16.3% 0.54 0.72 33.5%
Gross margin 19.1% 18.9% 19.0% 18.4% 18.9% 18.3%
Net Margin 8.5% 8.2% 8.4% 8.2% 8.4% 8.1%
2012E 2013E 2014E
Aggressive on blended ASP
but conservative on margins
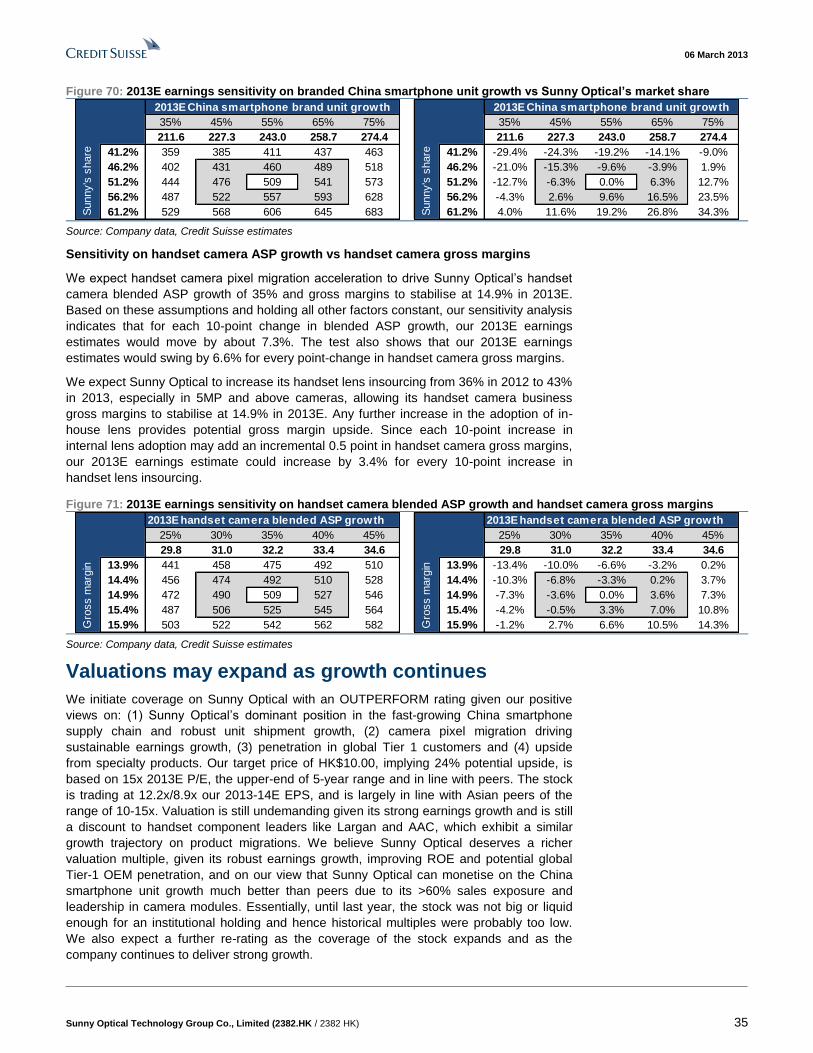
06 March 2013
Sunny Optical Technology Group Co., Limited (2382.HK / 2382 HK) 35
Figure 70: 2013E earnings sensitivity on branded China smartphone unit growth vs Sunny Optical’s market share
Source: Company data, Credit Suisse estimates
Sensitivity on handset camera ASP growth vs handset camera gross margins
We expect handset camera pixel migration acceleration to drive Sunny Optical’s handset
camera blended ASP growth of 35% and gross margins to stabilise at 14.9% in 2013E.
Based on these assumptions and holding all other factors constant, our sensitivity analysis
indicates that for each 10-point change in blended ASP growth, our 2013E earnings
estimates would move by about 7.3%. The test also shows that our 2013E earnings
estimates would swing by 6.6% for every point-change in handset camera gross margins.
We expect Sunny Optical to increase its handset lens insourcing from 36% in 2012 to 43%
in 2013, especially in 5MP and above cameras, allowing its handset camera business
gross margins to stabilise at 14.9% in 2013E. Any further increase in the adoption of in-
house lens provides potential gross margin upside. Since each 10-point increase in
internal lens adoption may add an incremental 0.5 point in handset camera gross margins,
our 2013E earnings estimate could increase by 3.4% for every 10-point increase in
handset lens insourcing.
Figure 71: 2013E earnings sensitivity on handset camera blended ASP growth and handset camera gross margins
Source: Company data, Credit Suisse estimates
Valuations may expand as growth continues
We initiate coverage on Sunny Optical with an OUTPERFORM rating given our positive
views on: (1) Sunny Optical’s dominant position in the fast-growing China smartphone
supply chain and robust unit shipment growth, (2) camera pixel migration driving
sustainable earnings growth, (3) penetration in global Tier 1 customers and (4) upside
from specialty products. Our target price of HK$10.00, implying 24% potential upside, is
based on 15x 2013E P/E, the upper-end of 5-year range and in line with peers. The stock
is trading at 12.2x/8.9x our 2013-14E EPS, and is largely in line with Asian peers of the
range of 10-15x. Valuation is still undemanding given its strong earnings growth and is still
a discount to handset component leaders like Largan and AAC, which exhibit a similar
growth trajectory on product migrations. We believe Sunny Optical deserves a richer
valuation multiple, given its robust earnings growth, improving ROE and potential global
Tier-1 OEM penetration, and on our view that Sunny Optical can monetise on the China
smartphone unit growth much better than peers due to its >60% sales exposure and
leadership in camera modules. Essentially, until last year, the stock was not big or liquid
enough for an institutional holding and hence historical multiples were probably too low.
We also expect a further re-rating as the coverage of the stock expands and as the
company continues to deliver strong growth.
2013E China smartphone brand unit growth 2013E China smartphone brand unit growth
35% 45% 55% 65% 75% 35% 45% 55% 65% 75%
509 211.6 227.3 243.0 258.7 274.4 211.6 227.3 243.0 258.7 274.4
41.2% 359 385 411 437 463 41.2% -29.4% -24.3% -19.2% -14.1% -9.0%
46.2% 402 431 460 489 518 46.2% -21.0% -15.3% -9.6% -3.9% 1.9%
51.2% 444 476 509 541 573 51.2% -12.7% -6.3% 0.0% 6.3% 12.7%
56.2% 487 522 557 593 628 56.2% -4.3% 2.6% 9.6% 16.5% 23.5%
61.2% 529 568 606 645 683 61.2% 4.0% 11.6% 19.2% 26.8% 34.3%Sunny's
share
Sunny's
share
2013E handset camera blended ASP growth 2013E handset camera blended ASP growth
25% 30% 35% 40% 45% 25% 30% 35% 40% 45%
509 29.8 31.0 32.2 33.4 34.6 29.8 31.0 32.2 33.4 34.6
13.9% 441 458 475 492 510 13.9% -13.4% -10.0% -6.6% -3.2% 0.2%
14.4% 456 474 492 510 528 14.4% -10.3% -6.8% -3.3% 0.2% 3.7%
14.9% 472 490 509 527 546 14.9% -7.3% -3.6% 0.0% 3.6% 7.3%
15.4% 487 506 525 545 564 15.4% -4.2% -0.5% 3.3% 7.0% 10.8%
15.9% 503 522 542 562 582 15.9% -1.2% 2.7% 6.6% 10.5% 14.3%Gro
ss m
arg
in
Gro
ss m
arg
in
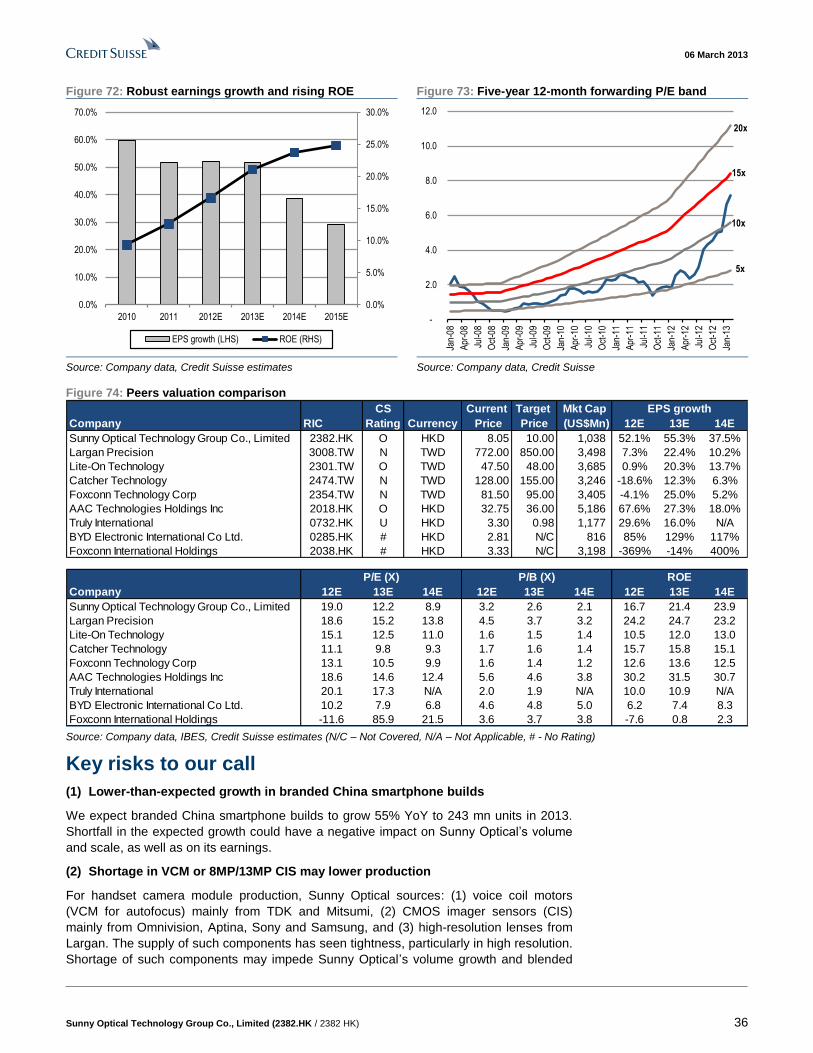
06 March 2013
Sunny Optical Technology Group Co., Limited (2382.HK / 2382 HK) 36
Figure 72: Robust earnings growth and rising ROE Figure 73: Five-year 12-month forwarding P/E band
Source: Company data, Credit Suisse estimates Source: Company data, Credit Suisse
Figure 74: Peers valuation comparison
Source: Company data, IBES, Credit Suisse estimates (N/C – Not Covered, N/A – Not Applicable, # - No Rating)
Key risks to our call
(1) Lower-than-expected growth in branded China smartphone builds
We expect branded China smartphone builds to grow 55% YoY to 243 mn units in 2013.
Shortfall in the expected growth could have a negative impact on Sunny Optical’s volume
and scale, as well as on its earnings.
(2) Shortage in VCM or 8MP/13MP CIS may lower production
For handset camera module production, Sunny Optical sources: (1) voice coil motors
(VCM for autofocus) mainly from TDK and Mitsumi, (2) CMOS imager sensors (CIS)
mainly from Omnivision, Aptina, Sony and Samsung, and (3) high-resolution lenses from
Largan. The supply of such components has seen tightness, particularly in high resolution.
Shortage of such components may impede Sunny Optical’s volume growth and blended
0.0%
5.0%
10.0%
15.0%
20.0%
25.0%
30.0%
0.0%
10.0%
20.0%
30.0%
40.0%
50.0%
60.0%
70.0%
2010 2011 2012E 2013E 2014E 2015E
EPS growth (LHS) ROE (RHS)
-
2.0
4.0
6.0
8.0
10.0
12.0
Jan-
08
Apr
-08
Jul-0
8
Oct
-08
Jan-
09
Apr
-09
Jul-0
9
Oct
-09
Jan-
10
Apr
-10
Jul-1
0
Oct
-10
Jan-
11
Apr
-11
Jul-1
1
Oct
-11
Jan-
12
Apr
-12
Jul-1
2
Oct
-12
Jan-
13
5x
10x
15x
20x
CS Current Target Mkt Cap
Company RIC Rating Currency Price Price (US$Mn) 12E 13E 14E
Sunny Optical Technology Group Co., Limited 2382.HK O HKD 8.05 10.00 1,038 52.1% 55.3% 37.5%
Largan Precision 3008.TW N TWD 772.00 850.00 3,498 7.3% 22.4% 10.2%
Lite-On Technology 2301.TW O TWD 47.50 48.00 3,685 0.9% 20.3% 13.7%
Catcher Technology 2474.TW N TWD 128.00 155.00 3,246 -18.6% 12.3% 6.3%
Foxconn Technology Corp 2354.TW N TWD 81.50 95.00 3,405 -4.1% 25.0% 5.2%
AAC Technologies Holdings Inc 2018.HK O HKD 32.75 36.00 5,186 67.6% 27.3% 18.0%
Truly International 0732.HK U HKD 3.30 0.98 1,177 29.6% 16.0% N/A
BYD Electronic International Co Ltd. 0285.HK # HKD 2.81 N/C 816 85% 129% 117%
Foxconn International Holdings 2038.HK # HKD 3.33 N/C 3,198 -369% -14% 400%
Company 12E 13E 14E 12E 13E 14E 12E 13E 14E
Sunny Optical Technology Group Co., Limited 19.0 12.2 8.9 3.2 2.6 2.1 16.7 21.4 23.9
Largan Precision 18.6 15.2 13.8 4.5 3.7 3.2 24.2 24.7 23.2
Lite-On Technology 15.1 12.5 11.0 1.6 1.5 1.4 10.5 12.0 13.0
Catcher Technology 11.1 9.8 9.3 1.7 1.6 1.4 15.7 15.8 15.1
Foxconn Technology Corp 13.1 10.5 9.9 1.6 1.4 1.2 12.6 13.6 12.5
AAC Technologies Holdings Inc 18.6 14.6 12.4 5.6 4.6 3.8 30.2 31.5 30.7
Truly International 20.1 17.3 N/A 2.0 1.9 N/A 10.0 10.9 N/A
BYD Electronic International Co Ltd. 10.2 7.9 6.8 4.6 4.8 5.0 6.2 7.4 8.3
Foxconn International Holdings -11.6 85.9 21.5 3.6 3.7 3.8 -7.6 0.8 2.3
EPS growth
P/E (X) P/B (X) ROE
06 March 2013
Sunny Optical Technology Group Co., Limited (2382.HK / 2382 HK) 37
ASP growth pixel migration. Nevertheless, given its leading handset camera supplier
position and its rising internal lens supply, we believe this risk is not threatening.
(3) Intensified pricing pressure or competition in handset camera modules
Sunny Optical is faced with competition from both domestic (BYD Electronics, Truly, Kerr,
and Q-Tech) and international players, such as Lite-On Technologies. Pricing competition
in the 5MP handset camera module is intensifying, and this could impact Sunny’s gross
margins. However, its strength in 8MP and strong customer relationships in China should
allow the company to sustain stable margins.
(4) Slower-than-expected ramp-up of specialty lens and cameras
There are uncertainties over the timing of the ramp-up of specialty products, especially in
gesture control and array cameras. Such emerging technologies may take longer than
expected to take off or could even not make it to the market at all.
(5) Impact from joint venture of LOT, Largan and TDK
Lite-On Technology, Largan and TDK are forming a joint venture company for vertical-
integrated production of high resolution handset camera modules. Such an alliance may
impact the relationship of Sunny Optical with its suppliers such as Largan and TDK if there
are conflicts of interest with the joint venture. Nevertheless, we do not expect a meaningful
earnings impact, given the target customer base is different (Sunny focuses on China
customers, while the joint venture is likely to target global brands).
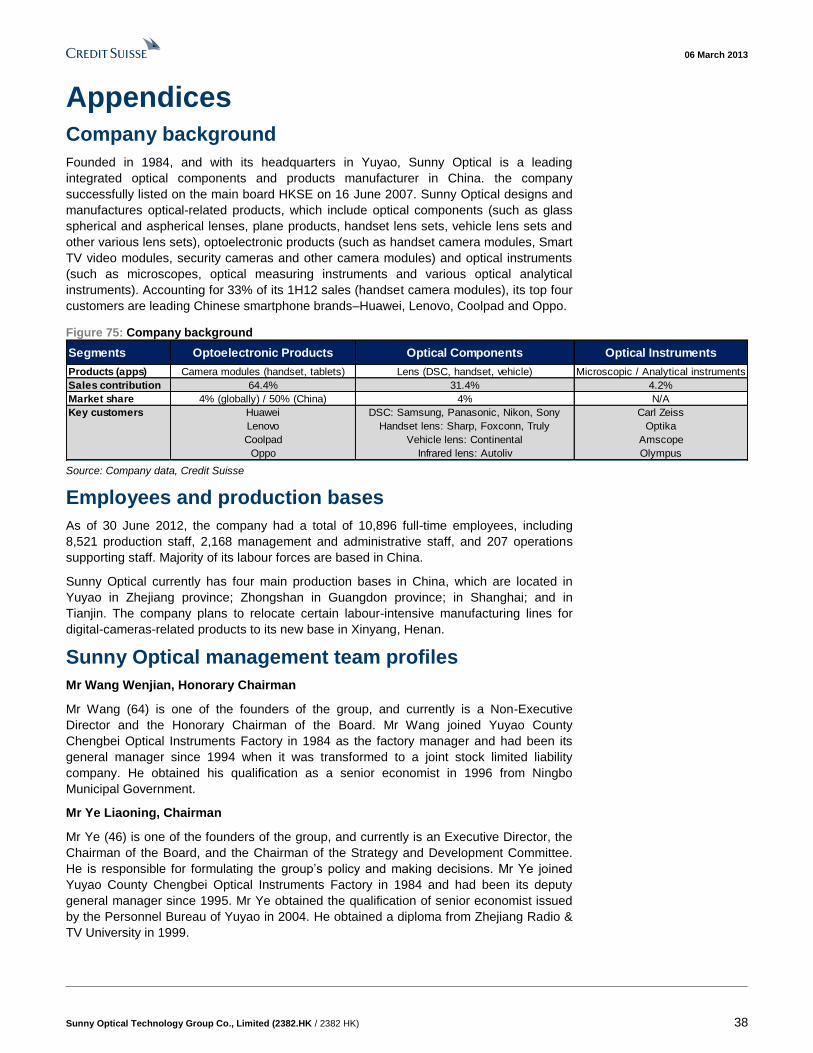
06 March 2013
Sunny Optical Technology Group Co., Limited (2382.HK / 2382 HK) 38
Appendices Company background
Founded in 1984, and with its headquarters in Yuyao, Sunny Optical is a leading
integrated optical components and products manufacturer in China. the company
successfully listed on the main board HKSE on 16 June 2007. Sunny Optical designs and
manufactures optical-related products, which include optical components (such as glass
spherical and aspherical lenses, plane products, handset lens sets, vehicle lens sets and
other various lens sets), optoelectronic products (such as handset camera modules, Smart
TV video modules, security cameras and other camera modules) and optical instruments
(such as microscopes, optical measuring instruments and various optical analytical
instruments). Accounting for 33% of its 1H12 sales (handset camera modules), its top four
customers are leading Chinese smartphone brands–Huawei, Lenovo, Coolpad and Oppo.
Figure 75: Company background
Source: Company data, Credit Suisse
Employees and production bases
As of 30 June 2012, the company had a total of 10,896 full-time employees, including
8,521 production staff, 2,168 management and administrative staff, and 207 operations
supporting staff. Majority of its labour forces are based in China.
Sunny Optical currently has four main production bases in China, which are located in
Yuyao in Zhejiang province; Zhongshan in Guangdon province; in Shanghai; and in
Tianjin. The company plans to relocate certain labour-intensive manufacturing lines for
digital-cameras-related products to its new base in Xinyang, Henan.
Sunny Optical management team profiles
Mr Wang Wenjian, Honorary Chairman
Mr Wang (64) is one of the founders of the group, and currently is a Non-Executive
Director and the Honorary Chairman of the Board. Mr Wang joined Yuyao County
Chengbei Optical Instruments Factory in 1984 as the factory manager and had been its
general manager since 1994 when it was transformed to a joint stock limited liability
company. He obtained his qualification as a senior economist in 1996 from Ningbo
Municipal Government.
Mr Ye Liaoning, Chairman
Mr Ye (46) is one of the founders of the group, and currently is an Executive Director, the
Chairman of the Board, and the Chairman of the Strategy and Development Committee.
He is responsible for formulating the group’s policy and making decisions. Mr Ye joined
Yuyao County Chengbei Optical Instruments Factory in 1984 and had been its deputy
general manager since 1995. Mr Ye obtained the qualification of senior economist issued
by the Personnel Bureau of Yuyao in 2004. He obtained a diploma from Zhejiang Radio &
TV University in 1999.
Segments Optoelectronic Products Optical Components Optical Instruments
Products (apps) Camera modules (handset, tablets) Lens (DSC, handset, vehicle) Microscopic / Analytical instruments
Sales contribution 64.4% 31.4% 4.2%
Market share 4% (globally) / 50% (China) 4% N/A
Key customers Huawei DSC: Samsung, Panasonic, Nikon, Sony Carl Zeiss
Lenovo Handset lens: Sharp, Foxconn, Truly Optika
Coolpad Vehicle lens: Continental Amscope
Oppo Infrared lens: Autoliv Olympus
06 March 2013
Sunny Optical Technology Group Co., Limited (2382.HK / 2382 HK) 39
Mr Sun Yang, CEO
Mr Sun (39) is an Executive Director and the Chief Executive Officer of the company. He is
responsible for the overall operation and management of the Sunny Optical Group. Mr Sun
graduated from Ningbo University in 1995 with a bachelor’s degree in economics. He then
obtained a master’s degree in economics from Shanghai University of Finance and
Economics in 2005. He joined Zhejiang Sunny (Group) Joint Stock Company Limited,
originally known as Yuyao County Chengbei Optical Instruments Factory, as chief officer
of its investment management centre in 2002. In 2008, Mr Sun was granted the
qualification of senior economist by Personnel Bureau of Ningbo.
Mr Liu Rui, Vice President
Mr Liu is responsible for the strategic planning, R&D and information management. He
graduated from the University of West Sydney with a master’s degree in business
administration in 2005. He obtained a bachelor’s degree in chemistry engineering from
Zhejiang University in 1989. Prior to joining the group in February 2006, Mr Liu worked
with Olympus (Shenzhen) Industrial Ltd. as a planning manager.
Ms Wong Pui Ling, Joint Company Secretary
Ms Wong is the joint company secretary, authorised representative and agent of the
company. She is primarily responsible for company secretarial matters and financial
management. Ms Wong joined the Group in 2007 and has nine years of experiences in
financial reporting, accounting and auditing. She is a qualified accountant and is a member
of the Association of Chartered Certified Accountants and the Hong Kong Institute of
Certified Public Accountants. She holds a bachelor’s degree in Business Administration
from the Chinese University of Hong Kong and a postgraduate diploma in Finance and
Law from the University of Hong Kong.
Ms Hu Yanyu, Joint Company Secretary and Head of Investor Relations
Ms Hu is responsible for company secretarial matters and investor relation management.
She joined the Group in 1999 and was part of various departments of the Group such as
administration, marketing & sales and investor relationship. Ms Hu is an affiliated person
of the Hong Kong Institute of Chartered Secretaries. She holds a master’s degree in
Business Administration from Shanghai University of Finance and Economics and a
bachelor’s degree in Administration from Zhejiang University. Ms Hu has also obtained the
qualification of economist issued by Personnel Bureau of Hangzhou.
Appendix II: Handset camera lens and modules
A handset camera module comprises lenses, IR filter, barrel and an assembly housing . In
a typical handset camera module, light enters an opening (aperture) and is directed to an
image sensor by the lenses.
The image sensor consists of pixels that generate signals upon receiving light via the lens.
Commonly used image sensors in handset cameras are CMOS (complementary metal-
oxide-semiconductor) sensors.
In most camera modules, one or more layers of lenses are placed between the aperture and
the image sensor to focus light onto the image sensor. This is typically called a lens barrel or
lens train. High-quality optics typically requires glass-based lenses due to higher index of
refraction. Today, most handset camera modules are made of plastic lenses. A typical 5MP
camera lens contains four pieces of lens elements while an 8MP has five pieces.
The most common manufacturing processes of handset camera modules are COB (Chip-
on-Board) and CSP (Chip Scale Packaging). COB is a technology that utilises wire
bonding to connect ICs directly to printed circuit boards, mainly adopted for high-resolution
handset cameras.
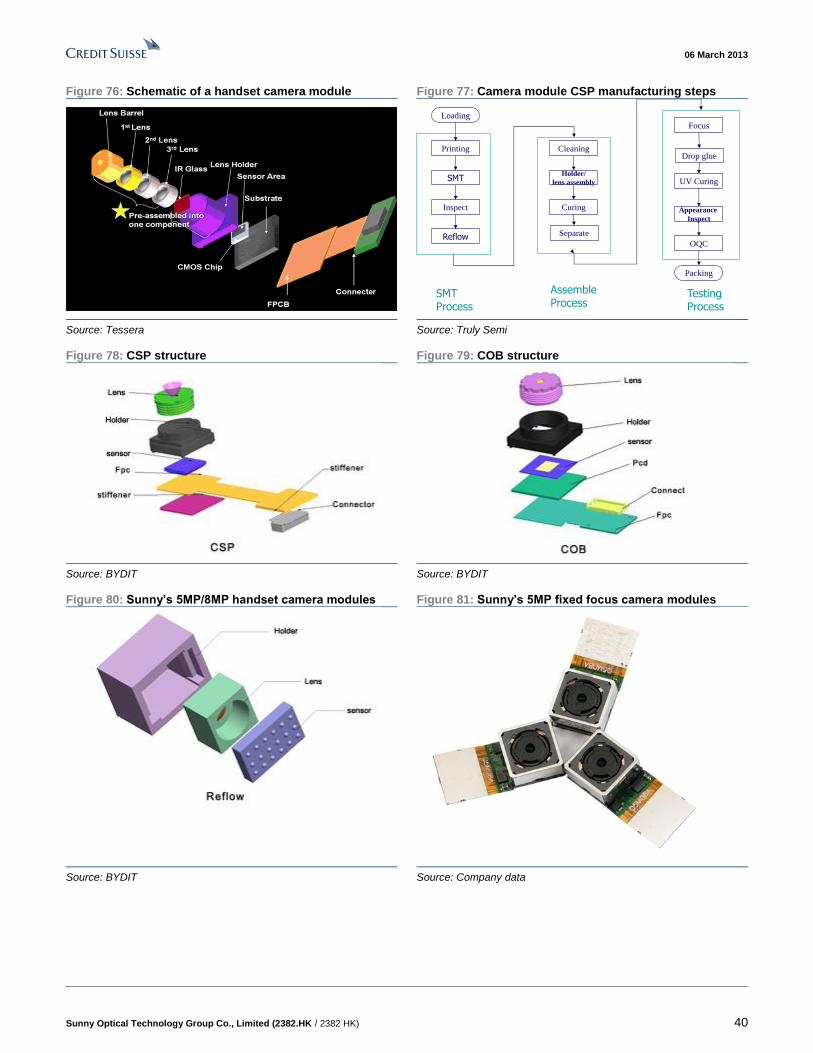
06 March 2013
Sunny Optical Technology Group Co., Limited (2382.HK / 2382 HK) 40
Figure 76: Schematic of a handset camera module Figure 77: Camera module CSP manufacturing steps
Source: Tessera Source: Truly Semi
Figure 78: CSP structure Figure 79: COB structure
Source: BYDIT Source: BYDIT
Figure 80: Sunny’s 5MP/8MP handset camera modules Figure 81: Sunny’s 5MP fixed focus camera modules
Source: BYDIT Source: Company data
Loading
Printing
SMT
Inspect
Reflow
Cleaning
Holder/
lens assembly UV Curing
Appearance
Inspect
OQC
Packing
Focus
Separate
SMT Process
Curing
Assemble Process
Testing Process
Drop glue
06 March 2013
Sunny Optical Technology Group Co., Limited (2382.HK / 2382 HK) 41
Companies Mentioned (Price as of 06-Mar-2013)
AAC Technologies Holdings Inc (2018.HK, HK$32.75) Acer Group (2353.TW, NT$27.0) Advanced Micro Devices, Inc. (AMD.N, $2.43) Apple Inc (AAPL.OQ, $431.17) Asia Optical (3019.TW, NT$30.9) Asustek (2357.TW, NT$368.0) Autoliv Inc (ALV.N, $66.44) BYD Electronic International Co Ltd. (0285.HK, HK$2.81) Catcher Technology (2474.TW, NT$128.0) Changhong (600839.SS, Rmb2.1) Continental (CONG.DE, €92.17) Creative Tech (CREA.SI, S$2.97) Foxconn International Holdings (2038.HK, HK$3.33) Foxconn Technology Corp (2354.TW, NT$81.5) Fujitsu (6702.T, ¥418) Haier (600690.SS, Rmb12.86) Hisense Kelon (000921.SZ, Rmb7.32) HOYA (7741.T, ¥1,822) HOYA (HOCPY.PK, $19.25) HTC Corp (2498.TW, NT$255.5) Intel Corp. (INTC.OQ, $21.51) Kinko Optical (6209.TW, NT$37.9) Konica Minolta Holdings (4902.T, ¥713) Largan Precision (3008.TW, NT$772.0) Lenovo Group Ltd (0992.HK, HK$8.54) LG Electronics Inc (066570.KS, W77,200) LG Innotek (011070.KS, W74,500) Lite-On Technology (2301.TW, NT$47.5) Microsoft Corporation (MSFT.OQ, $28.35) Mitsumi Electric (6767.T, ¥557) Motorola Mobility Holdings, Inc (MMI.N, $39.98) Nikon (7731.T, ¥2,044) Nokia (NOK1V.HE, €2.728) NVIDIA (NVDA.OQ, $12.8) O-Film Tech (002456.SZ, Rmb57.6) OLYMPUS (7733.T, ¥2,094) OmniVision TECH (OVTI.OQ, $13.26) Panasonic Corporation (6752.T, ¥672) Pantech Group (PNTE.KL, RM0.75) QUALCOMM Inc. (QCOM.OQ, $67.97) Research In Motion Limited (BBRY.OQ, $12.58) Samsung Electro-Mechanics (009150.KS, W97,300) Samsung Electronics (005930.KS, W1,560,000) Samsung Techwin (012450.KS, W65,600) Sharp Corp. (6753.T, ¥341) SK Hynix Inc. (000660.KS, W28,000) Sony (6758.T, ¥1,462) STMicroelectronics (STM.PA, €6.221) Sunny Optical Technology Group Co., Limited (2382.HK, HK$8.05, OUTPERFORM, TP HK$10.0) TCL Corp (000100.SZ, Rmb2.58) TDK (6762.T, ¥3,195) Texas Instruments Inc. (TXN.OQ, $35.0)Toshiba (6502.T, ¥439) Truly International (0732.HK, HK$3.3) ZTE Corporation (0763.HK, HK$14.14)
Disclosure Appendix
Important Global Disclosures
Yan Taw Boon and Manish Nigam, each certify, with respect to the companies or securities that the individual analyzes, that (1) the views expressed in this report accurately reflect his or her personal views about all of the subject companies and securities and (2) no part of his or her compensation was, is or will be directly or indirectly related to the specific recommendations or views expressed in this report.
The analyst(s) responsible for preparing this research report received Compensation that is based upon various factors including Credit Suisse's total revenues, a portion of which are generated by Credit Suisse's investment banking activities
As of December 10, 2012 Analysts’ stock rating are defined as follows:
Outperform (O) : The stock’s total return is expected to outperform the relevant benchmark*over the next 12 months.
Neutral (N) : The stock’s total return is expected to be in line with the relevant benchmark* over the next 12 months.
Underperform (U) : The stock’s total return is expected to underperform the relevant benchmark* over the next 12 months.
*Relevant benchmark by region: As of 10th December 2012, Japanese ratings are based on a stock’s total return relative to the analyst's coverage universe which consists of all companies covered by the analyst within the relevant sector, with Outperforms representing the most attractiv e, Neutrals the less attractive, and
06 March 2013
Sunny Optical Technology Group Co., Limited (2382.HK / 2382 HK) 42
Underperforms the least attractive investment opportunities. As of 2nd October 2012, U.S. and Canadian as well as European ratings are based on a stock’s total return relative to the analyst's coverage universe which consists of all companies covered by the analyst within the relevant sector, with Outperforms representing the most attractive, Neutrals the less attractive, and Underperforms the least attractive investment opportunities. For Latin Ame rican and non-Japan Asia stocks, ratings are based on a stock’s total return relative to the average total return of the relevant country or regional benchmark; Australia, New Zealand are, and prior to 2nd October 2012 U.S. and Canadian ratings were based on (1) a stock’s absolute total return potential to its current share price and (2) the relative attractiveness of a stock’s total return potential within an analyst’s coverage universe. For Australian and New Zealand stocks, 12 -month rolling yield is incorporated in the absolute total return calculation and a 15% and a 7.5% threshold replace the 10-15% level in the Outperform and Underperform stock rating definitions, respectively. The 15% and 7.5% thresholds replace the +10-15% and -10-15% levels in the Neutral stock rating definition, respectively. Prior to 10th December 2012, Japanese ratings were based on a stock’s total return relative to the average total return of the relevant country or regional benchmark.
Restricted (R) : In certain circumstances, Credit Suisse policy and/or applicable law and regulations preclude certain types of communications, including an investment recommendation, during the course of Credit Suisse's engagement in an investment banking transaction and in certain other circumstances.
Volatility Indicator [V] : A stock is defined as volatile if the stock price has moved up or down by 20% or more in a month in at least 8 of the past 24 months or the analyst expects significant volatility going forward.
Analysts’ sector weightings are distinct from analysts’ stock ratings and are based on the analyst’s expectations for the fundamentals and/or valuation of the sector* relative to the group’s historic fundamentals and/or valuation:
Overweight : The analyst’s expectation for the sector’s fundamentals and/or valuation is favorable over the next 12 months.
Market Weight : The analyst’s expectation for the sector’s fundamentals and/or valuation is neutral over the next 12 months.
Underweight : The analyst’s expectation for the sector’s fundamentals and/or valuation is cautious over the next 12 months.
*An analyst’s coverage sector consists of all companies covered by the analyst within the relevant sector. An analyst may cover multiple sectors.
Credit Suisse's distribution of stock ratings (and banking clients) is:
Global Ratings Distribution
Rating Versus universe (%) Of which banking clients (%)
Outperform/Buy* 43% (54% banking clients) Neutral/Hold* 38% (47% banking clients) Underperform/Sell* 16% (39% banking clients) Restricted 3%
*For purposes of the NYSE and NASD ratings distribution disclosure requirements, our stock ratings of Outperform, Neutral, and Underperform most closely correspond to Buy, Hold, and Sell, respectively; however, the meanings are not the same, as our stock ratings are determined on a relative basis. (Please refer to definitions above.) An investor's decision to buy or sell a security should be based on investment objectives, current holdings, and other individual factors.
Credit Suisse’s policy is to update research reports as it deems appropriate, based on developments with the subject company, the sector or the market that may have a material impact on the research views or opinions stated herein.
Credit Suisse's policy is only to publish investment research that is impartial, independent, clear, fair and not misleading. For more detail please refer to Credit Suisse's Policies for Managing Conflicts of Interest in connection with Investment Research: http://www.csfb.com/research and analytics/disclaimer/managing_conflicts_disclaimer.html
Credit Suisse does not provide any tax advice. Any statement herein regarding any US federal tax is not intended or written to be used, and cannot be used, by any taxpayer for the purposes of avoiding any penalties.
Price Target: (12 months) for Sunny Optical Technology Group Co., Limited (2382.HK)
Method: Our target of HK$10.0 is based on 15x FY13E P/E, the upper-end of 5-year range and in line with peers.
Risk: Key risks include: (1) lower-than-expected growth in China smartphone builds, (2) shortage in VCM and 8MP/13MP CIS that may impede volume growth and pixel migration, (3) intensified pricing pressure in camera modules
Please refer to the firm's disclosure website at www.credit-suisse.com/researchdisclosures for the definitions of abbreviations typically used in the target price method and risk sections.
See the Companies Mentioned section for full company names
Important Regional Disclosures
Singapore recipients should contact Credit Suisse AG, Singapore Branch for any matters arising from this research report.
The analyst(s) involved in the preparation of this report have not visited the material operations of the subject company (2382.HK) within the past 12 months
Restrictions on certain Canadian securities are indicated by the following abbreviations: NVS--Non-Voting shares; RVS--Restricted Voting Shares; SVS--Subordinate Voting Shares.
06 March 2013
Sunny Optical Technology Group Co., Limited (2382.HK / 2382 HK) 43
Individuals receiving this report from a Canadian investment dealer that is not affiliated with Credit Suisse should be advised that this report may not contain regulatory disclosures the non-affiliated Canadian investment dealer would be required to make if this were its own report.
For Credit Suisse Securities (Canada), Inc.'s policies and procedures regarding the dissemination of equity research, please visit http://www.csfb.com/legal_terms/canada_research_policy.shtml.
As of the date of this report, Credit Suisse acts as a market maker or liquidity provider in the equities securities that are the subject of this report.
Principal is not guaranteed in the case of equities because equity prices are variable.
Commission is the commission rate or the amount agreed with a customer when setting up an account or at any time after that.
Taiwanese Disclosures: This research report is for reference only. Investors should carefully consider their own investment risk. Investment results are the responsibility of the individual investor. Reports may not be reprinted without permission of CS. Reports written by Taiwan based analysts on non-Taiwan listed companies are not considered recommendations to buy or sell securities under Taiwan Stock Exchange Operational Regulations Governing Securities Firms Recommending Trades in Securities to Customers.
To the extent this is a report authored in whole or in part by a non-U.S. analyst and is made available in the U.S., the following are important disclosures regarding any non-U.S. analyst contributors: The non-U.S. research analysts listed below (if any) are not registered/qualified as research analysts with FINRA. The non-U.S. research analysts listed below may not be associated persons of CSSU and therefore may not be subject to the NASD Rule 2711 and NYSE Rule 472 restrictions on communications with a subject company, public appearances and trading securities held by a research analyst account.
Credit Suisse (Hong Kong) Limited ......................................................................................................................... Yan Taw Boon ; Manish Nigam
For Credit Suisse disclosure information on other companies mentioned in this report, please visit the website at www.credit-suisse.com/researchdisclosures or call +1 (877) 291-2683.
06 March 2013
Sunny Optical Technology Group Co., Limited (2382.HK / 2382 HK) 44
References in this report to Credit Suisse include all of the subsidiaries and affiliates of Credit Suisse operating under its investment banking division. For more information on our structure, please use the following link: https://www.credit-suisse.com/who_we_are/en/.This report may contain material that is not directed to, or intended for distribution to or use by, any person or entity who is a citizen or resident of or located in any locality, state, country or other jurisdiction where such distribution, publication, availability or use would be contrary to law or regulation or which would subject Credit Suisse AG or its affiliates ("CS") to any registration or licensing requirement within such jurisdiction. All material presented in this report, unless specifically indicated otherwise, is under copyright to CS. None of the material, nor its content, nor any copy of it, may be altered in any way, transmitted to, copied or distributed to any other party, without the prior express written permission of CS. All trademarks, service marks and logos used in this report are trademarks or service marks or registered trademarks or service marks of CS or its affiliates. The information, tools and material presented in this report are provided to you for information purposes only and are not to be used or considered as an offer or the solicitation of an offer to sell or to buy or subscribe for securities or other financial instruments. CS may not have taken any steps to ensure that the securities referred to in this report are suitable for any particular investor. CS will not treat recipients of this report as its customers by virtue of their receiving this report. The investments and services contained or referred to in this report may not be suitable for you and it is recommended that you consult an independent investment advisor if you are in doubt about such investments or investment services. Nothing in this report constitutes investment, legal, accounting or tax advice, or a representation that any investment or strategy is suitable or appropriate to your individual circumstances, or otherwise constitutes a personal recommendation to you. CS does not advise on the tax consequences of investments and you are advised to contact an independent tax adviser. Please note in particular that the bases and levels of taxation may change. Information and opinions presented in this report have been obtained or derived from sources believed by CS to be reliable, but CS makes no representation as to their accuracy or completeness. CS accepts no liability for loss arising from the use of the material presented in this report, except that this exclusion of liability does not apply to the extent that such liability arises under specific statutes or regulations applicable to CS. This report is not to be relied upon in substitution for the exercise of independent judgment. CS may have issued, and may in the future issue, other communications that are inconsistent with, and reach different conclusions from, the information presented in this report. Those communications reflect the different assumptions, views and analytical methods of the analysts who prepared them and CS is under no obligation to ensure that such other communications are brought to the attention of any recipient of this report. CS may, to the extent permitted by law, participate or invest in financing transactions with the issuer(s) of the securities referred to in this report, perform services for or solicit business from such issuers, and/or have a position or holding, or other material interest, or effect transactions, in such securities or options thereon, or other investments related thereto. In addition, it may make markets in the securities mentioned in the material presented in this report. CS may have, within the last three years, served as manager or co-manager of a public offering of securities for, or currently may make a primary market in issues of, any or all of the entities mentioned in this report or may be providing, or have provided within the previous 12 months, significant advice or investment services in relation to the investment concerned or a related investment. Additional information is, subject to duties of confidentiality, available on request. Some investments referred to in this report will be offered solely by a single entity and in the case of some investments solely by CS, or an associate of CS or CS may be the only market maker in such investments. Past performance should not be taken as an indication or guarantee of future performance, and no representation or warranty, express or implied, is made regarding future performance. Information, opinions and estimates contained in this report reflect a judgment at its original date of publication by CS and are subject to change without notice. The price, value of and income from any of the securities or financial instruments mentioned in this report can fall as well as rise. The value of securities and financial instruments is subject to exchange rate fluctuation that may have a positive or adverse effect on the price or income of such securities or financial instruments. Investors in securities such as ADR's, the values of which are influenced by currency volatility, effectively assume this risk. Structured securities are complex instruments, typically involve a high degree of risk and are intended for sale only to sophisticated investors who are capable of understanding and assuming the risks involved. The market value of any structured security may be affected by changes in economic, financial and political factors (including, but not limited to, spot and forward interest and exchange rates), time to maturity, market conditions and volatility, and the credit quality of any issuer or reference issuer. Any investor interested in purchasing a structured product should conduct their own investigation and analysis of the product and consult with their own professional advisers as to the risks involved in making such a purchase. Some investments discussed in this report may have a high level of volatility. High volatility investments may experience sudden and large falls in their value causing losses when that investment is realised. Those losses may equal your original investment. Indeed, in the case of some investments the potential losses may exceed the amount of initial investment and, in such circumstances, you may be required to pay more money to support those losses. Income yields from investments may fluctuate and, in consequence, initial capital paid to make the investment may be used as part of that income yield. Some investments may not be readily realisable and it may be difficult to sell or realise those investments, similarly it may prove difficult for you to obtain reliable information about the value, or risks, to which such an investment is exposed. This report may provide the addresses of, or contain hyperlinks to, websites. Except to the extent to which the report refers to website material of CS, CS has not reviewed any such site and takes no responsibility for the content contained therein. Such address or hyperlink (including addresses or hyperlinks to CS's own website material) is provided solely for your convenience and information and the content of any such website does not in any way form part of this document. Accessing such website or following such link through this report or CS's website shall be at your own risk. This report is issued and distributed in Europe (except Switzerland) by Credit Suisse Securities (Europe) Limited, One Cabot Square, London E14 4QJ, England, which is regulated in the United Kingdom by The Financial Services Authority ("FSA"). This report is being distributed in Germany by Credit Suisse Securities (Europe) This report is being distributed in the United States and Canada by Credit Suisse Securities (USA) LLC; in Switzerland by Credit Suisse AG; in Brazil by Banco de Investimentos Credit Suisse (Brasil) S.A or its affiliates; in Mexico by Banco Credit Suisse (México), S.A. (transactions related to the securities mentioned in this report will only be effected in compliance with applicable regulation); in Japan by Credit Suisse Securities (Japan) Limited, Financial Instruments Firm, Director-General of Kanto Local Finance Bureau (Kinsho) No. 66, a member of Japan Securities Dealers Association, The Financial Futures Association of Japan, Japan Investment Advisers Association, Type II Financial Instruments Firms Association; elsewhere in Asia/ Pacific by whichever of the following is the appropriately authorised entity in the relevant jurisdiction: Credit Suisse (Hong Kong) Limited, Credit Suisse Equities (Australia) Limited, Credit Suisse Securities (Thailand) Limited, Credit Suisse Securities (Malaysia) Sdn Bhd, Credit Suisse AG, Singapore Branch, Credit Suisse Securities (India) Private Limited regulated by the Securities and Exchange Board of India (registration Nos. INB230970637; INF230970637; INB010970631; INF010970631), having registered address at 9th Floor, Ceejay House, Dr.A.B. Road, Worli, Mumbai - 18, India, T- +91-22 6777 3777, Credit Suisse Securities (Europe) Limited, Seoul Branch, Credit Suisse AG, Taipei Securities Branch, PT Credit Suisse Securities Indonesia, Credit Suisse Securities (Philippines ) Inc., and elsewhere in the world by the relevant authorised affiliate of the above. Research on Taiwanese securities produced by Credit Suisse AG, Taipei Securities Branch has been prepared by a registered Senior Business Person. Research provided to residents of Malaysia is authorised by the Head of Research for Credit Suisse Securities (Malaysia) Sdn Bhd, to whom they should direct any queries on +603 2723 2020. This research may not conform to Canadian disclosure requirements. In jurisdictions where CS is not already registered or licensed to trade in securities, transactions will only be effected in accordance with applicable securities legislation, which will vary from jurisdiction to jurisdiction and may require that the trade be made in accordance with applicable exemptions from registration or licensing requirements. Non-U.S. customers wishing to effect a transaction should contact a CS entity in their local jurisdiction unless governing law permits otherwise. U.S. customers wishing to effect a transaction should do so only by contacting a representative at Credit Suisse Securities (USA) LLC in the U.S. Please note that this research was originally prepared and issued by CS for distribution to their market professional and institutional investor customers. Recipients who are not market professional or institutional investor customers of CS should seek the advice of their independent financial advisor prior to taking any investment decision based on this report or for any necessary explanation of its contents. This research may relate to investments or services of a person outside of the UK or to other matters which are not regulated by the FSA or in respect of which the protections of the FSA for private customers and/or the UK compensation scheme may not be available, and further details as to where this may be the case are available upon request in respect of this report. CS may provide various services to US municipal entities or obligated persons ("municipalities"), including suggesting individual transactions or trades and entering into such transactions. Any services CS provides to municipalities are not viewed as "advice" within the meaning of Section 975 of the Dodd-Frank Wall Street Reform and Consumer Protection Act. CS is providing any such services and related information solely on an arm's length basis and not as an advisor or fiduciary to the municipality. In connection with the provision of the any such services, there is no agreement, direct or indirect, between any municipality (including the officials, management, employees or agents thereof) and CS for CS to provide advice to the municipality. Municipalities should consult with their financial, accounting and legal advisors regarding any such services provided by CS. In addition, CS is not acting for direct or indirect compensation to solicit the municipality on behalf of an unaffiliated broker, dealer, municipal securities dealer, municipal advisor, or investment adviser for the purpose of obtaining or retaining an engagement by the municipality for or in connection with Municipal Financial Products, the issuance of municipal securities, or of an investment adviser to provide investment advisory services to or on behalf of the municipality. If this report is being distributed by a financial institution other than Credit Suisse AG, or its affiliates, that financial institution is solely responsible for distribution. Clients of that institution should contact that institution to effect a transaction in the securities mentioned in this report or require further information. This report does not constitute investment advice by Credit Suisse to the clients of the distributing financial institution, and neither Credit Suisse AG, its affiliates, and their respective officers, directors and employees accept any liability whatsoever for any direct or consequential loss arising from their use of this report or its content. Principal is not guaranteed. Commission is the commission rate or the amount agreed with a customer when setting up an account or at any time after that.
Copyright © 2013 CREDIT SUISSE AG and/or its affiliates. All rights reserved.
Investment principal on bonds can be eroded depending on sale price or market price. In addition, there are bonds on which investment principal can be eroded due to changes in redemption amounts. Care is required when investing in such instruments.
When you purchase non-listed Japanese fixed income securities (Japanese government bonds, Japanese municipal bonds, Japanese government guaranteed bonds, Japanese corporate bonds) from CS as a seller, you will be requested to pay the purchase price only.
TC1828


