
SUCTION MEASUREMENT OF BENTONITE USING
FILTER PAPER TECHNIQUE
A Thesis Submitted in Partial Fulfilment of the Requirements for the Degree of
Master of Technology
In
Civil Engineering
(Geotechnical Engineering)
Siddharthan.S
DEPARTMENT OF CIVIL ENGINEERING
NATIONAL INSTITUTE OF TECHNOLOGY, ROURKELA
MAY 2015

Suction Measurement of Bentonite using filter paper
technique
A Thesis Submitted in Partial Fulfilment of the Requirements for the Degree of
Master of Technology
In
Civil Engineering
(Geotechnical Engineering)
SIDDHARTHAN . S
213CE1037
Under the Supervision of
Dr. Ramakrishna Bag
DEPARTMENT OF CIVIL ENGINEERING
NATIONAL INSTITUTE OF TECHNOLOGY, ROURKELA

Department of Civil Engineering
National Institute of Technology Rourkela
Rourkela – 769008, India www.nitrkl.ac.in
CERTIFICATE
This is to certify that the project entitled “Suction Measurement of Bentonite using Filter
Paper Technique” submitted by Mr. Siddharthan.S (Roll No. 213CE1037) in partial
fulfilment of the requirements for the award of Master of Technology Degree in Civil
Engineering at NIT Rourkela is an authentic work carried out by him under my supervision
and guidance.
To the best of my knowledge, the matter embodied in this report has not been submitted to
any other university/institute for the award of any degree or diploma.
Place: Rourkela Prof. Ramakrishna Bag
Date: Department of Civil Engineering
National Institute of Technology Rourkela

Acknowledgement
I am deeply indebted to Dr. Ramakrishna Bag, Professor of Geotechnical
Engineering specialization, my supervisor, for the motivation, guidance and patience
throughout the research work.
I would like to thank Prof. S. K. Sahu, Head of Civil Engineering Department,
National Institute of Technology, Rourkela, for his valuable suggestions during other review
meeting and necessary facilities for the research work. I am also thankful to all the faculty
members of the Civil Engineering Department, who have directly or indirectly helped me
during the project work. I would like to extend my gratefulness to the Geotechnical
Laboratory in charge and labours for their help.
I sincerely thank to our Director Prof. S. K. Sarangi and all the authorities of the
institute for providing nice academic environment and other facilities in the NIT campus.
Finally, I would like to thank my family and friends especially Gurumoorthi and Siva
Sankari for their unwavering support, help and invariable source of motivation.
SIDDHARTHAN.S
Table of Contents
Abstract i
List of Figures ii
List of Tables ii
Chapter 1
Introduction 1
1.1 Soil Suction 2
1.2 Components 3
Chapter 2
Literature Review 4
2.1 Suction 4
2.2 Measurement of Suction 5
2.3 Comparison of Methods 5
2.4 Errors in Measurement 6
2.5 Theoretical model to predict Soil-Water Characteristic curve 7
2.6 Objective of Study 9
Chapter 3
Material Characteristics and Methods 10
3.1 General 10
3.2 Methods 10
3.2.1 Atterberg Limit 10
3.2.2 Specific Gravity 11
3.2.3 Particle Size Distribution 11
3.2.4 XRD Analysis 12
3.2.5 BET Analysis 12
3.2.6 Cation Exchange Capacity 13
3.2.7 Filter Paper Technique 13
Chapter 4
Results and Discussion 16
4.1 Introduction 16
4.2 Soil Water Characteristic Curve 16
Chapter 5
Conclusions and Future work 21
5.1 Conclusions 21
5.2 Future scope of work 21
References 22

Page | i
Abstract
Bentonite is used as buffer material in nuclear waste disposal for which its
characteristics should be studied. Soil - water characteristics curve (SWCC) is important to
understand the unsaturated soil behaviour. The SWCC provides an understanding between
the mass of water in a soil and the energy state of the water phase. Curve between soil suction
and water content or degree of saturation gives soil-water characteristic curve. In order
determine the relationship between suction and water content of unsaturated soil, filter paper
technique can be used. The method is simple, economical and provides result with reasonable
accuracy. It is an indirect suction measurement technique. Contact and Non – contact
methods of filter paper technique determines the total and matric suction values, respectively.
In the current study, bentonite was obtained from Bikaner, Rajasthan. Suction versus water
content SWCC was established for the specimens of different dry densities and results are
calculated using ASTM correlations. Experimentally obtained suction versus water content
relationships were compared with that of the results obtained from Fredlund and Xing (1994)
and van Genutchen (1980) models. The study revealed that with the increase in water content,
suction value decreases but shows no pattern with dry density. Theoretical models were used
to find suction values and compared with experimental results whereas van Genutchen model
gives more accurate results than that of Fredlund& Xing model.

Page | ii
List of Figures
Titles Page No
Fig 1: Structure of Montmorillonite 2
Fig 2: Variation of suction with water content by van Genutchen model 8
Fig 3: Variation of suction with water content by Fredlund and Xing model 9
Fig 4: Particle Size Distribution of Bentonite 11
Fig 5: XRD analysis of Bentonite 12
Fig 6: Filter paper placed in - between two halves of sample 15
Fig 7: Sketch of Desiccator with specimens 15
Fig 8: Variation of total suction with water content 17
Fig 9: Variation of matric suction with water content 17
Fig 10: Variation of total suction with density 18
Fig 11: Variation of matric Suction with density 18
Fig 12: Variation of total suction with water content – Fredlund& Xing
and van Genutchen models 19
Fig 13: Variation of matric suction with water content – Fredlund& Xing
and van Genutchen models 20
List of Tables
Table 1: Atterberg Limits of Bentonite 10
Table 2: Test Specimen – Details 16
Page | 1
CHAPTER 1
INTRODUCTION
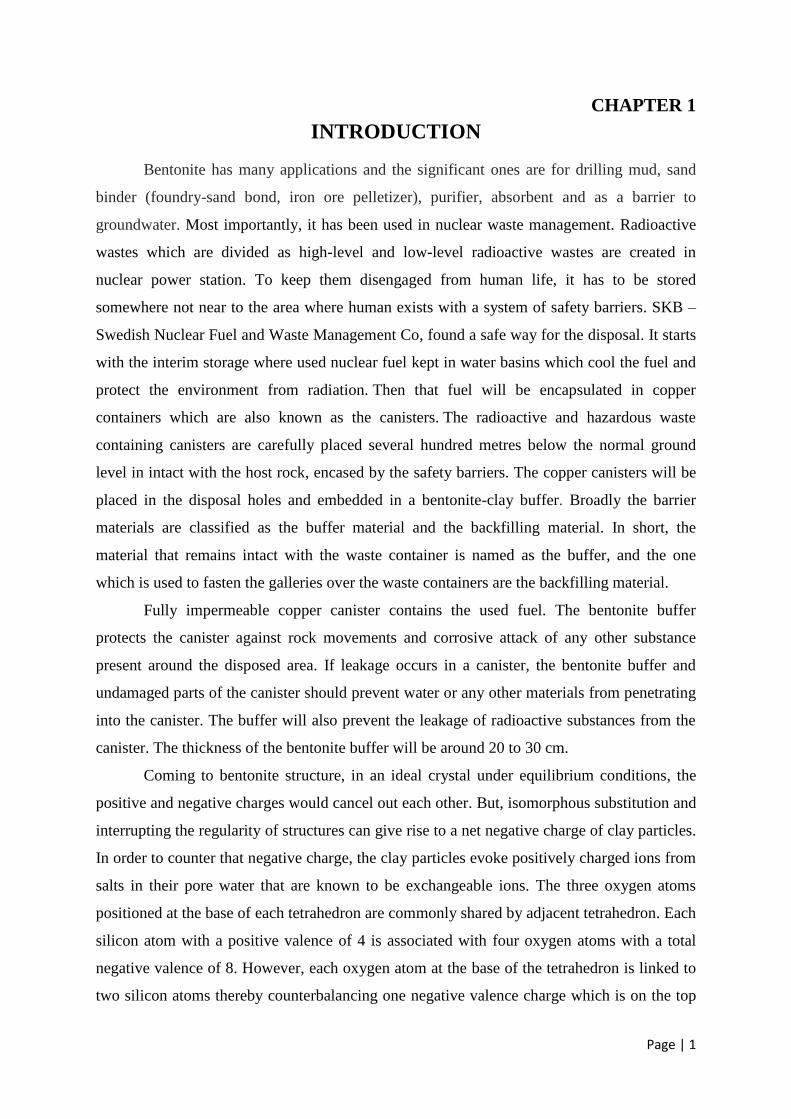
Bentonite has many applications and the significant ones are for drilling mud, sand
binder (foundry-sand bond, iron ore pelletizer), purifier, absorbent and as a barrier to
groundwater. Most importantly, it has been used in nuclear waste management. Radioactive
wastes which are divided as high-level and low-level radioactive wastes are created in
nuclear power station. To keep them disengaged from human life, it has to be stored
somewhere not near to the area where human exists with a system of safety barriers. SKB –
Swedish Nuclear Fuel and Waste Management Co, found a safe way for the disposal. It starts
with the interim storage where used nuclear fuel kept in water basins which cool the fuel and
protect the environment from radiation. Then that fuel will be encapsulated in copper
containers which are also known as the canisters. The radioactive and hazardous waste
containing canisters are carefully placed several hundred metres below the normal ground
level in intact with the host rock, encased by the safety barriers. The copper canisters will be
placed in the disposal holes and embedded in a bentonite-clay buffer. Broadly the barrier
materials are classified as the buffer material and the backfilling material. In short, the
material that remains intact with the waste container is named as the buffer, and the one
which is used to fasten the galleries over the waste containers are the backfilling material.
Fully impermeable copper canister contains the used fuel. The bentonite buffer
protects the canister against rock movements and corrosive attack of any other substance
present around the disposed area. If leakage occurs in a canister, the bentonite buffer and
undamaged parts of the canister should prevent water or any other materials from penetrating
into the canister. The buffer will also prevent the leakage of radioactive substances from the
canister. The thickness of the bentonite buffer will be around 20 to 30 cm.
Coming to bentonite structure, in an ideal crystal under equilibrium conditions, the
positive and negative charges would cancel out each other. But, isomorphous substitution and
interrupting the regularity of structures can give rise to a net negative charge of clay particles.
In order to counter that negative charge, the clay particles evoke positively charged ions from
salts in their pore water that are known to be exchangeable ions. The three oxygen atoms
positioned at the base of each tetrahedron are commonly shared by adjacent tetrahedron. Each
silicon atom with a positive valence of 4 is associated with four oxygen atoms with a total
negative valence of 8. However, each oxygen atom at the base of the tetrahedron is linked to
two silicon atoms thereby counterbalancing one negative valence charge which is on the top

Page | 2
layer of each tetrahedron. When the sheets of silica are piled up over the octahedral sheets,
the oxygen atoms replace the hydroxyls to fulfil their valence bonds. Structure of
montmorillonite has been shown in Figure 1.
Fig.1. Structure of Smectite clay
1.1 Soil Suction
In unsaturated soil, pore pressures at depths below the water table are derived from
weight of the water lying above the given elevation. The pore pressure by nature has a
positive value that can be measured using a piezometer using porous filter thereby making
intimate contact with water in the soil. Soil above the water table would be fully dry if the
water voids of soil were subjected only to gravitational force.
The forces acting between the soil particles and water are molecular and physico-
chemical forces and capillary forces resulting in moving the water into void spaces or to be
held there without drainage. The cohesive force that the soil exerts on the water is termed as
soil suction.

Page | 3
1.2 Components
Matric suction
Osmotic suction
Matric suction:
It is the difference between the pore-air pressure and pore-water pressure. It does not
cause liquid or vapour flow.
Osmotic Suction:
It is related to the salt concentration of the free pore-water of a soil. Difference in salt
concentrations at different points in a soil can cause movement of salts due to concentration
gradient.

Page | 4
CHAPTER 2
LITERATURE REVIEW
2.1 Suction
2.1.1Soil Suction Concept
Total suction is the combination of matric suction and osmotic suction. Matric suction
emerges due to texture, capillarity and adsorptive forces of soil whereas osmotic suction
comes due to dissolved salts in the soil. The relation is
where ht is total suction (kPa) hm is matric suction (kPa) and hp is osmotic suction (kPa).
Kelvin’s equation which is from ideal gas law is used to calculate total suction
where R - universal gas constant, T - absolute temperature, V -molecular volume of water
and P / Po - relative humidity.
Matric suction is calculated using pressure membrane devices. Across the porous
plate, difference between applied air pressure and water pressure gives the matric suction
value.
where ua - applied air pressure and uw - water pressure at atmospheric condition.
Osmotic suction is calculated using the relationship between osmotic suction and
osmotic coefficients. Osmotic coefficients are promptly available in literature for different
salt solutions. It can also be calculated from the following relation
where Φ is osmotic coefficient, v is the number of ions from one molecule of salt, m is
molality is molecular mass of water and ρw is density of water.

Page | 5
2.1.2 Soil-water characteristic curve (SWCC)
The SWCC provides an understanding between the mass of water in a soil and the
energy state of the water phase. Curve between soil suction and water content or degree of
saturation gives soil-water characteristic curve.
2.2 Measurement of Suction:
Measurement of suction can be done by both direct and indirect methods which are
given below. By measuring the negative pore water pressure, suction can be obtained.
Tensiometer and Axis translation technique are used to measure the suction directly. Using
electrical resistance sensor and thermal conductivity suction sensors, matric suction can be
measured indirectly. Filter paper technique, Psychrometer technique, capacitance sensor,
chilled-mirror hygrometer are some of the methods to measure total suction indirectly.
2.3 Comparison of other methods:
Psychrometer can measure the suction accurately only in range of 100 to 8000 kPa. In
case of thermal conductivity sensors, the range is 10 to 1500 kPa.
Haghighi et al. (2012) and Yahia-Aissa et al. (2000) using different techniques,
reported comparable results. In their study, the methods used are Insertion Tensiometer for
matric suction by direct measurement and Pressure Membrane Extractor for matric suction
measurement by axis translation technique and a Dew-point Potentiometer (WP4) for total
suction measurements using relative humidity concept.
The outcomes obtained are distinctive in matric suction measurement using
Tensiometer and Extractor techniques. For silty soil samples of 30% water content, matric
suction values determined using Extractor and Tensiometer techniques are 1430 kPa and 150
kPa respectively. Value got from Tensiometer should have been below atmospheric pressure
but it is not. Value measured exceeded the maximum value for that tensiometer due to the
formation of bubbles and provided inaccurate measurements. So, it is not reliable to use
Tensiometer technique for suction measurement in this range.
Only if an appropriate filter paper calibration curve is used and enough time given to
reach equilibrium and also without any temperature change, matric suction obtained by these
techniques would be similar.
Page | 6
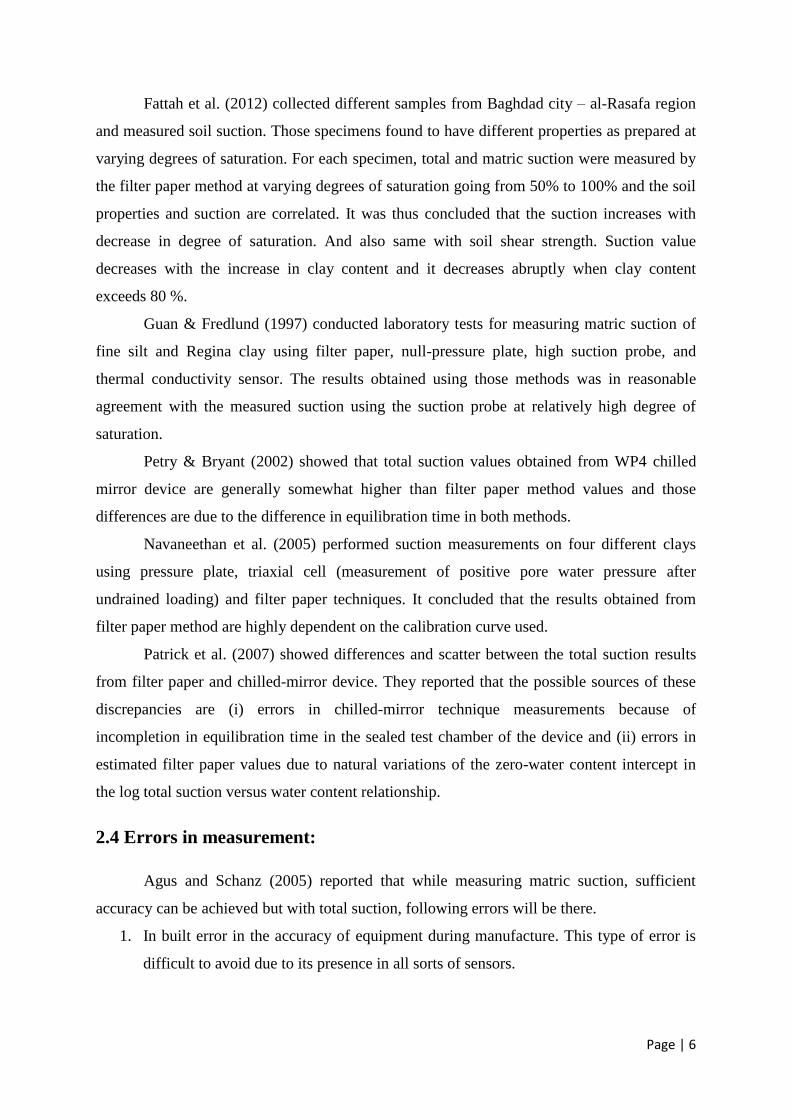
Fattah et al. (2012) collected different samples from Baghdad city – al-Rasafa region
and measured soil suction. Those specimens found to have different properties as prepared at
varying degrees of saturation. For each specimen, total and matric suction were measured by
the filter paper method at varying degrees of saturation going from 50% to 100% and the soil
properties and suction are correlated. It was thus concluded that the suction increases with
decrease in degree of saturation. And also same with soil shear strength. Suction value
decreases with the increase in clay content and it decreases abruptly when clay content
exceeds 80 %.
Guan & Fredlund (1997) conducted laboratory tests for measuring matric suction of
fine silt and Regina clay using filter paper, null-pressure plate, high suction probe, and
thermal conductivity sensor. The results obtained using those methods was in reasonable
agreement with the measured suction using the suction probe at relatively high degree of
saturation.
Petry & Bryant (2002) showed that total suction values obtained from WP4 chilled
mirror device are generally somewhat higher than filter paper method values and those
differences are due to the difference in equilibration time in both methods.
Navaneethan et al. (2005) performed suction measurements on four different clays
using pressure plate, triaxial cell (measurement of positive pore water pressure after
undrained loading) and filter paper techniques. It concluded that the results obtained from
filter paper method are highly dependent on the calibration curve used.
Patrick et al. (2007) showed differences and scatter between the total suction results
from filter paper and chilled-mirror device. They reported that the possible sources of these
discrepancies are (i) errors in chilled-mirror technique measurements because of
incompletion in equilibration time in the sealed test chamber of the device and (ii) errors in
estimated filter paper values due to natural variations of the zero-water content intercept in
the log total suction versus water content relationship.
2.4 Errors in measurement:
Agus and Schanz (2005) reported that while measuring matric suction, sufficient
accuracy can be achieved but with total suction, following errors will be there.
1. In built error in the accuracy of equipment during manufacture. This type of error is
difficult to avoid due to its presence in all sorts of sensors.

Page | 7
2. Temperature gradient between soil and vapour space causes error and this is more
common in filter paper technique and psychrometer.
3. Condensation of water vapour cause fluctuations in temperature and relative humidity
and again error occurs.
4. Error due to improper manual handling of sensors and variation in the procedures
followed by the operator and occurs in case of filter paper technique.
2.5 Theoretical models to predict soil-water characteristic curve
Other than experiments, there are theoretical models to predict the soil-water
characteristic curve. Those models have 2 or 3 parameters which govern the characteristic
curve. Some of the models are explained below.
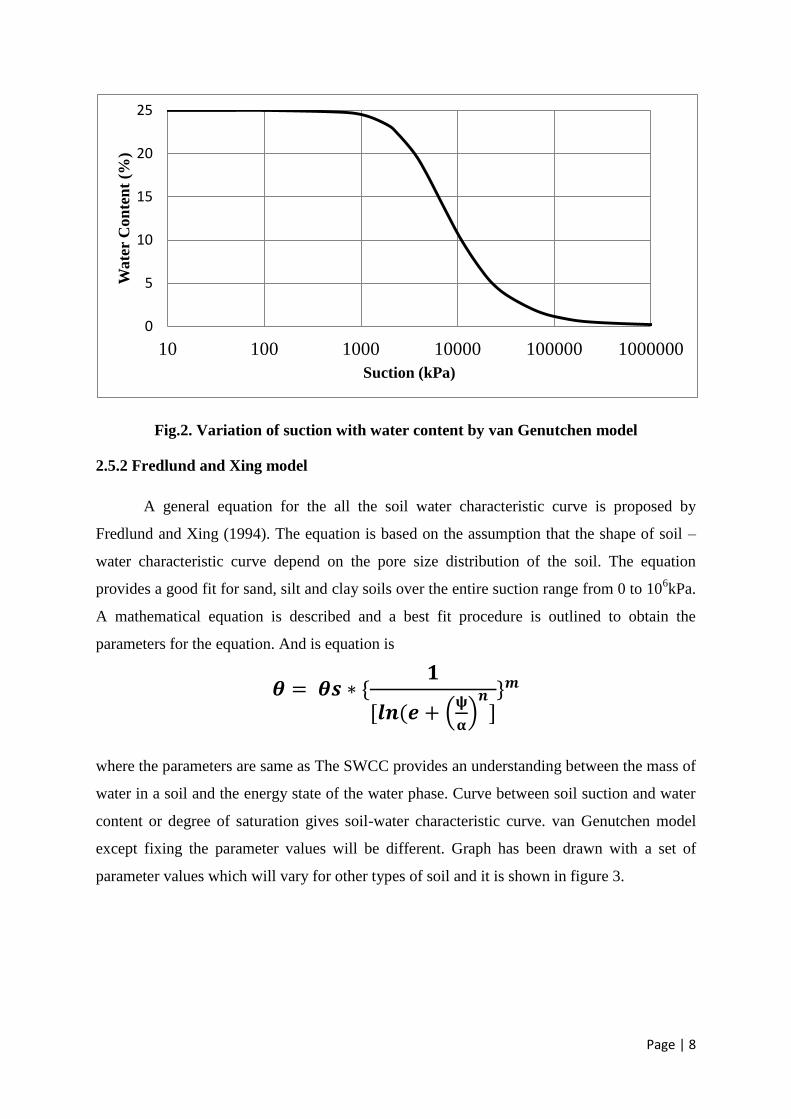
2.5.1 Van Genutchen model
van Genutchen made numerical model to find the hydraulic conductivity of
unsaturated soils by using soil – water retention curve for which an equation has been
formed. That equation was modified from Maulem’s and Burdin’s model. Modified equation
is
where m = 1-1/n and
α and n are independent parameters
ϴs – saturated water content
ϴr - residual water content
Of these four parameters, saturated water content can be obtained easily and residual
water content can also be obtained by getting the water content in dry sample. Other
parameters have to be arranged so that we get the characteristic curve and these parameters
will be different for different soil. Graph is shown in figure 2 with parameter values of
α=0.005 and n=2.
Page | 8
Fig.2. Variation of suction with water content by van Genutchen model
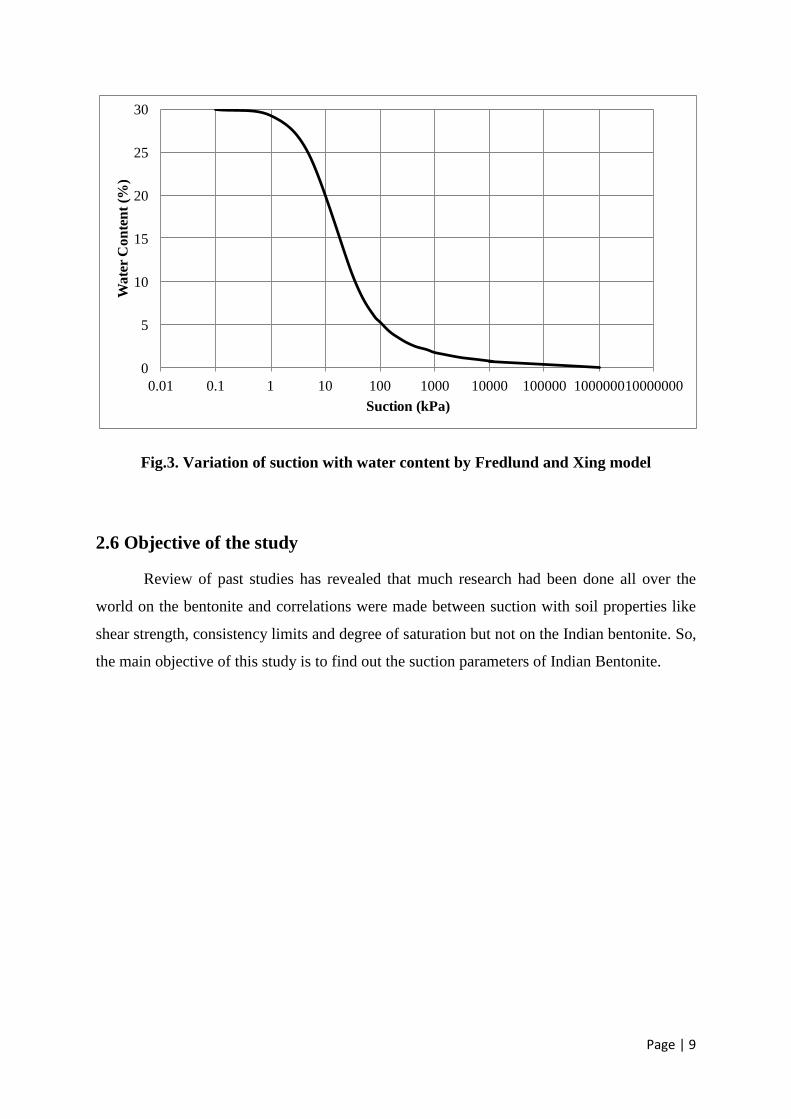
2.5.2 Fredlund and Xing model
A general equation for the all the soil water characteristic curve is proposed by
Fredlund and Xing (1994). The equation is based on the assumption that the shape of soil –
water characteristic curve depend on the pore size distribution of the soil. The equation
provides a good fit for sand, silt and clay soils over the entire suction range from 0 to 106kPa.
A mathematical equation is described and a best fit procedure is outlined to obtain the
parameters for the equation. And is equation is
where the parameters are same as The SWCC provides an understanding between the mass of
water in a soil and the energy state of the water phase. Curve between soil suction and water
content or degree of saturation gives soil-water characteristic curve. van Genutchen model
except fixing the parameter values will be different. Graph has been drawn with a set of
parameter values which will vary for other types of soil and it is shown in figure 3.
0
5
10
15
20
25
10 100 1000 10000 100000 1000000
Wate
r C
on
ten
t (%
)
Suction (kPa)
Page | 9
Fig.3. Variation of suction with water content by Fredlund and Xing model
2.6 Objective of the study
Review of past studies has revealed that much research had been done all over the
world on the bentonite and correlations were made between suction with soil properties like
shear strength, consistency limits and degree of saturation but not on the Indian bentonite. So,
the main objective of this study is to find out the suction parameters of Indian Bentonite.
0
5
10
15
20
25
30
0.01 0.1 1 10 100 1000 10000 100000 100000010000000
Wa
ter
Co
nte
nt
(%)
Suction (kPa)

Page | 10
CHAPTER 3
MATERIAL CHARACTERISTICS AND METHODS
3.1 General
The aim of this study is to investigate the suction parameter of bentonite and suction
with water content relationship. This chapter explains the methodology and materials used to
achieve the objectives. Bentonite was collected from Bikaner, Rajasthan. Procedure for
sample preparation, sampling and testing techniques are reported.
3.2 Method
3.2.1 Atterberg Limits
Atterberg limit tests were conducted to study the plasticity property of the soils. The
liquid limit and plastic limit are the water contents at which the soils exhibit both liquid and
plastic property, respectively. The liquid and plastic limits tests were conducted according to
IS: 2720-Part 5 and 6 (1985) and the results are presented in the table1.The liquid limit was
determined using the fall-cone method and the plastic limit was determined by rolling 3 mm
diameter threads of the soils until they began to crumble. The difference between these liquid
limit and plastic limit is known as the plasticity index, which is generally used to characterize
the plastic nature of soils.
Table 1. Atterberg limits of Bentonite
Limits and Indices Values
Liquid Limit 140 %
Plastic Limit 61 %
Shrinkage Limit 40 %
Plasticity Index 79 %
Page | 11
3.2.2 Specific Gravity
Specific gravity is the ratio of density or specific weight of the particles to the density
or unit weight of water. The specific gravity of bentonite was determined using pycnometer
method as per IS: 2720-Part 3 (1980) and it is found to be 2.67.
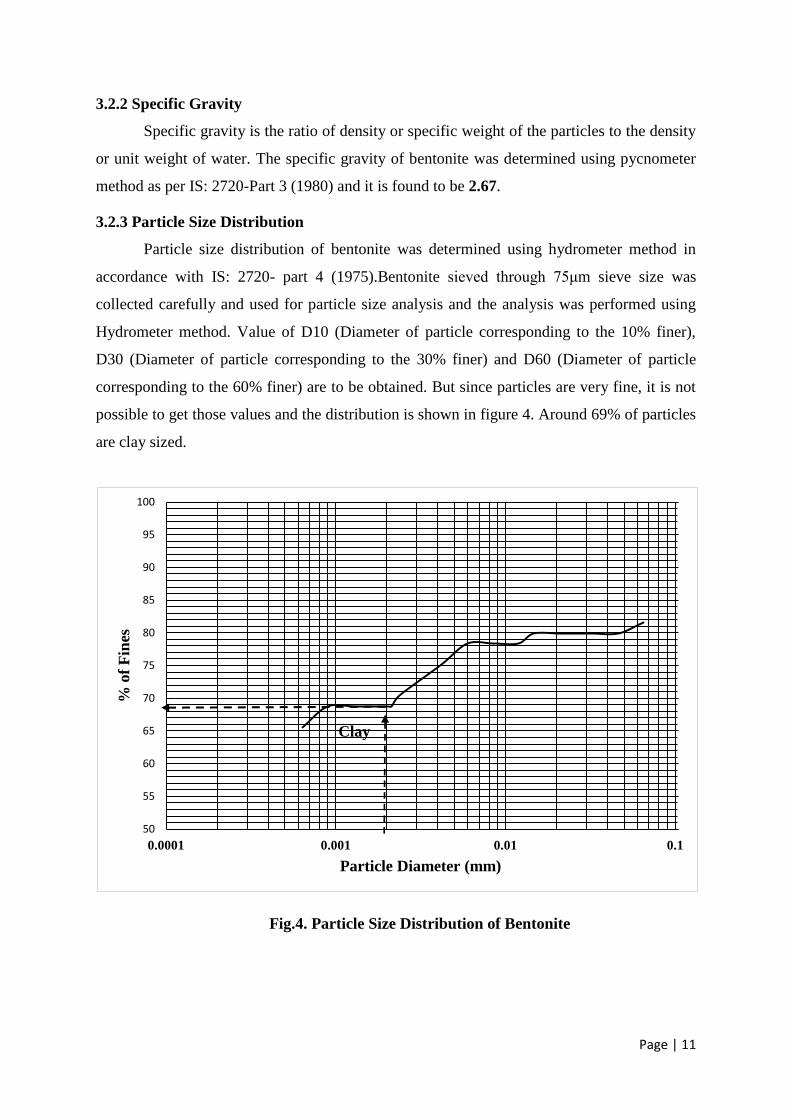
3.2.3 Particle Size Distribution
Particle size distribution of bentonite was determined using hydrometer method in
accordance with IS: 2720- part 4 (1975).Bentonite sieved through 75μm sieve size was
collected carefully and used for particle size analysis and the analysis was performed using
Hydrometer method. Value of D10 (Diameter of particle corresponding to the 10% finer),
D30 (Diameter of particle corresponding to the 30% finer) and D60 (Diameter of particle
corresponding to the 60% finer) are to be obtained. But since particles are very fine, it is not
possible to get those values and the distribution is shown in figure 4. Around 69% of particles
are clay sized.
Fig.4. Particle Size Distribution of Bentonite
50
55
60
65
70
75
80
85
90
95
100
0.0001 0.001 0.01 0.1
% o
f F
ines
Particle Diameter (mm)
Clay

Page | 12
3.2.4 XRD Analysis
The mineral composition of bentonite was determined by X-ray diffraction method.
According to Bragg’s law, the XRD identifies the minerals based on the relationship between
the angle of incidence of the X-rays, θ, to the c-axis spacing, d. A Philips automated powder
diffractometer was used for XRD analysis in this study.
1.5 g of fie grained sample is kept in oven drying for 2 hours and allowed to cool in
room temperature. Then, sample is filled in the sample holder of diffractometer and the XRD
pattern is obtained by scanning over angle range of 20° to 100°, 2θ at 0.25°/min. In the step
mode, a 0.05° - 2θ step for 2 s is given. Results are analysed using Xpert High Score software
and mineral composition has been found. Quartz, Montmorillonite, Muscovite and Calcite are
the minerals found. Result is shown in Figure 5.
Fig.5. XRD analysis of Bentonite
3.2.5 BET Analysis
Specific surface area being the significant physical parameter has a great impact on
the quality and utility of solid phase samples. Gas adsorption analysis is the widely used
method for measurement of specific surface area. This method involves exposure of gas to
the solid sample under various environmental conditions thereby measuring volume of
sample. The Brunauer, Emmett and Teller (BET) technique is commonly employed tool to
determine the surface area of powder sample. Here, nitrogen gas is used as probe that is

Page | 13
exposed on the solid material under standard conditions. Thus, surface area of the sample can
be measured from the monolayer adsorbed using the prior knowledge of cross sectional area
of probe being used. Activation of sample must be done to ensure that no air or gas has been
adsorbed on the solid particle before evaluation which may affect the sample quality.
Activation can be done by heating the sample under vacuum conditions. Specific Surface
Area has been determined by BET analyser and value is found to be 79.23 m²/g.
3.2.6Cation Exchange Capacity (CEC)
Cation Exchange Capacity (CEC) is defined as the amount of exchangeable ions that
a soil can hold at a given pH value. The Cation Exchange Capacity (CEC) of the soil sample
and soil lime mixture was found as per ASTM D7503 – 10 method. The Nitrogen
concentration was determined by spectrophotometer as per modified Parsons et al. (1984).
The nitrogen concentration was determined by the graph obtained by the absorbance of the
standard solution of known concentration. After Nitrogen Concentration is known, the CEC
of the sample is calculated by the equation
where N = nitrogen concentration in mg/L.
And the CEC value of bentonite is calculated as 54.71 meq/100 g.
3.2.7 Filter paper technique:
Filter paper method is nowadays being used for suction measurement due to its
advantages like method is simple, economical and reasonable accuracy (Bicalho et al.
2007and Oliveira &Marinho 2006). Other methods are having one or two of these advantages
but not all. In this method, filter paper has to attain equilibrium with the specimen by either
through liquid or vapour. Water content of filter paper is determined after it reached its
equilibrium time normally 15 days. From calibration curve given by ASTM, suction value is
found. This method can be used to measure suctions from 10 to 30000 kPa.
The experiments should be performed with great care. There are two procedures for
measuring suction by this technique. Non-contact filter paper procedure is to measure total
suction. Filter paper is suspended above the specimen and allowed for vapour transfer
Page | 14
between filter paper and soil until vapour pressure equilibrium is achieved. Contact filter
paper procedure is used to measure either the total or matric suction depending on the degree
of contact between the soil and the filter paper. In this technique, water content of filter paper
increases due to a flow of water in liquid form until equilibrium is established. Thus, it is
necessary to form an adequate contact between the filter paper and the soil.
According to the American society for Testing and Materials (ASTM), the filter paper
used must be ash-free quantitative Type II filter paper, for example, Whatman No. 42, Fisher
brand 9-790A or Schleicher and Schuell No. 589 White Ribbon. Diameter depends on the
specimen size. To prevent organism growth or biological decomposition on the filter paper, it
can be treated by dipping each paper in a 2 % concentration of formaldehyde. Biological
degradation is necessary when filter papers are subjected to a moist, humid environment for
greater than 14 days.
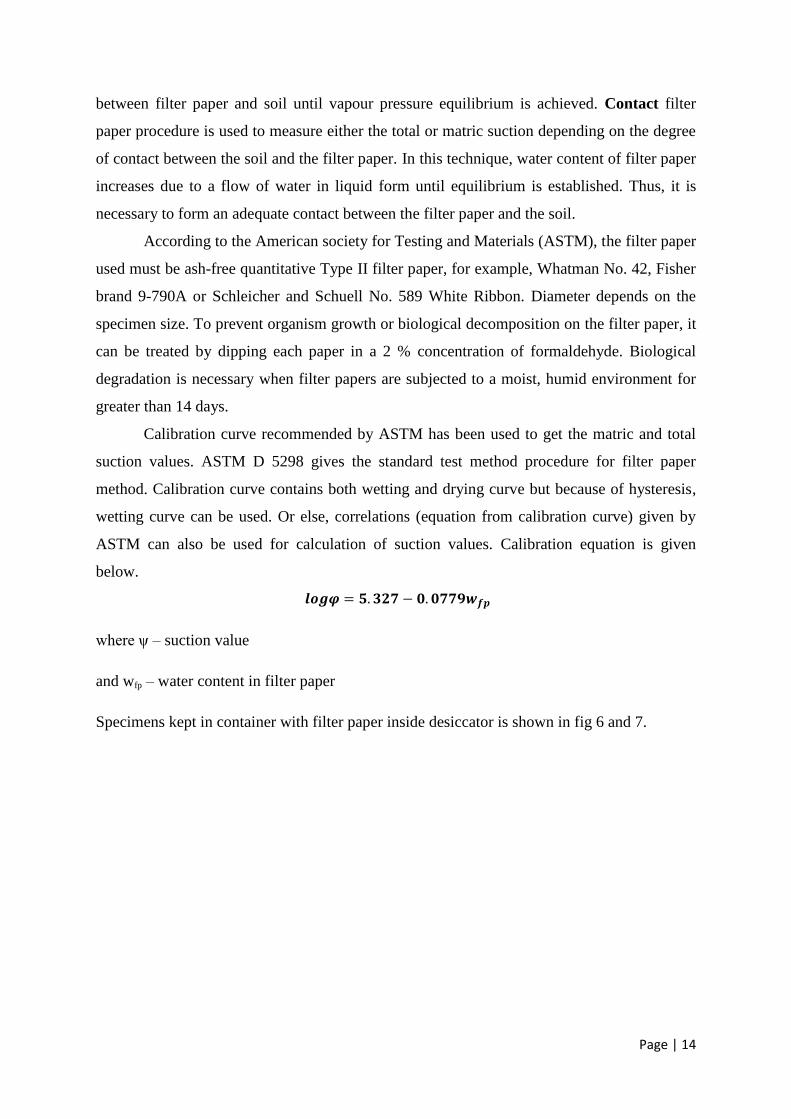
Calibration curve recommended by ASTM has been used to get the matric and total
suction values. ASTM D 5298 gives the standard test method procedure for filter paper
method. Calibration curve contains both wetting and drying curve but because of hysteresis,
wetting curve can be used. Or else, correlations (equation from calibration curve) given by
ASTM can also be used for calculation of suction values. Calibration equation is given
below.
where ψ – suction value
and wfp – water content in filter paper
Specimens kept in container with filter paper inside desiccator is shown in fig 6 and 7.

Page | 15
Fig.6. Filter paper placed in - between two halves of sample
Fig.7. Sketch of Desiccator with specimens
Page | 16
CHAPTER 4
RESULTS AND DISCUSSION
4.1 Introduction
Experiments have been conducted to find the suction values both total and matric
suction using filter paper technique and results are discussed in this chapter. Results are
calculated by using the given ASTM correlations.
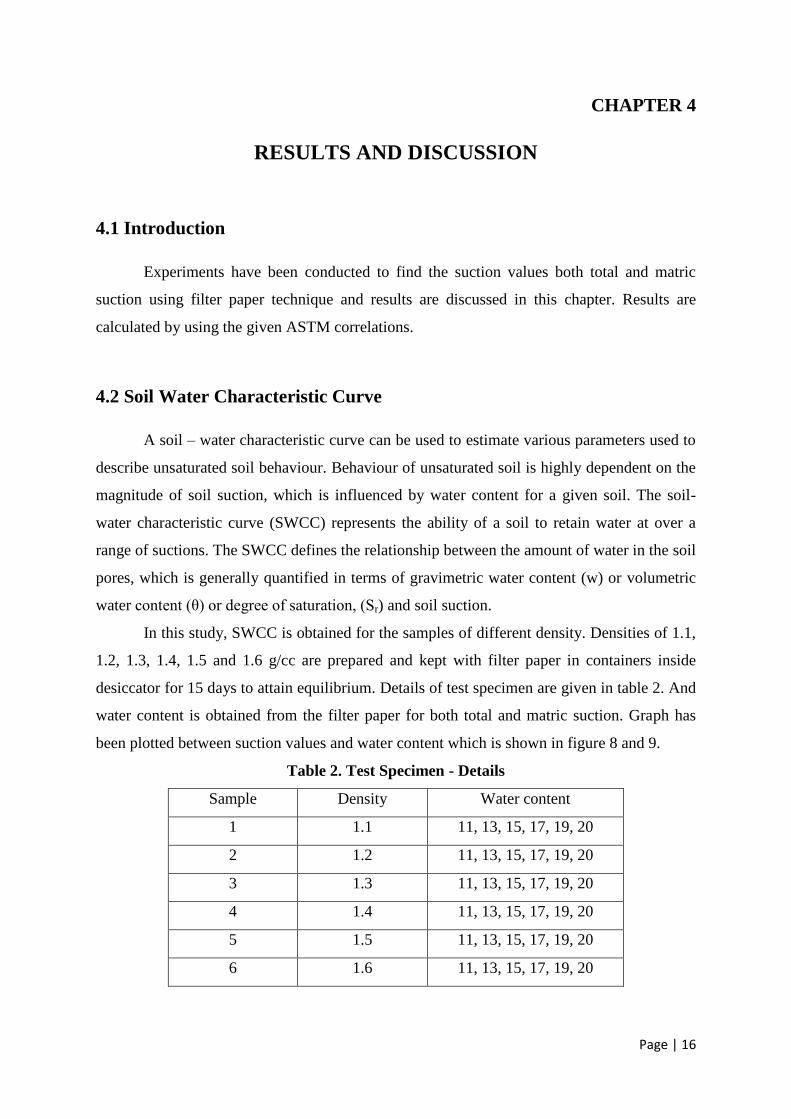
4.2 Soil Water Characteristic Curve
A soil – water characteristic curve can be used to estimate various parameters used to
describe unsaturated soil behaviour. Behaviour of unsaturated soil is highly dependent on the
magnitude of soil suction, which is influenced by water content for a given soil. The soil-
water characteristic curve (SWCC) represents the ability of a soil to retain water at over a
range of suctions. The SWCC defines the relationship between the amount of water in the soil
pores, which is generally quantified in terms of gravimetric water content (w) or volumetric
water content (θ) or degree of saturation, (Sr) and soil suction.
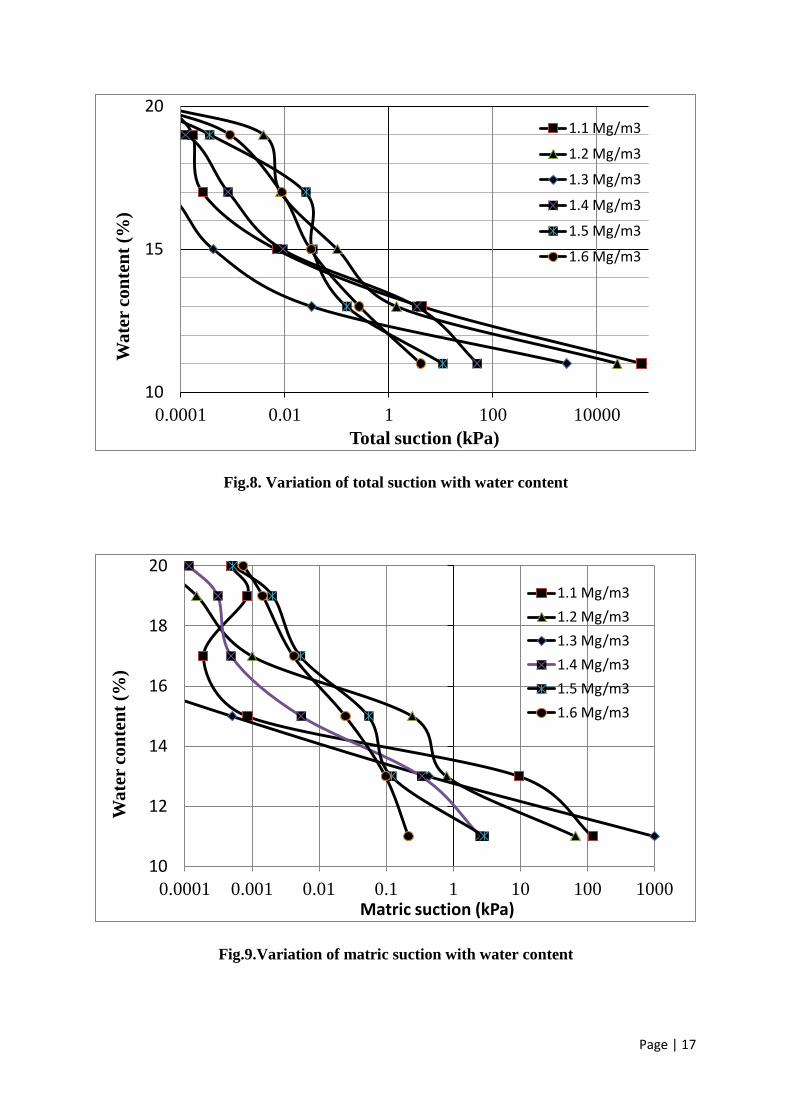
In this study, SWCC is obtained for the samples of different density. Densities of 1.1,
1.2, 1.3, 1.4, 1.5 and 1.6 g/cc are prepared and kept with filter paper in containers inside
desiccator for 15 days to attain equilibrium. Details of test specimen are given in table 2. And
water content is obtained from the filter paper for both total and matric suction. Graph has
been plotted between suction values and water content which is shown in figure 8 and 9.
Table 2. Test Specimen - Details
Sample Density Water content
1 1.1 11, 13, 15, 17, 19, 20
2 1.2 11, 13, 15, 17, 19, 20
3 1.3 11, 13, 15, 17, 19, 20
4 1.4 11, 13, 15, 17, 19, 20
5 1.5 11, 13, 15, 17, 19, 20
6 1.6 11, 13, 15, 17, 19, 20
Page | 17
Fig.8. Variation of total suction with water content
Fig.9.Variation of matric suction with water content
10
15
20
0.0001 0.01 1 100 10000
Wa
ter
con
ten
t (%
)
Total suction (kPa)
1.1 Mg/m3
1.2 Mg/m3
1.3 Mg/m3
1.4 Mg/m3
1.5 Mg/m3
1.6 Mg/m3
10
12
14
16
18
20
0.0001 0.001 0.01 0.1 1 10 100 1000
Wa
ter
con
ten
t (%
)
Matric suction (kPa)
1.1 Mg/m3
1.2 Mg/m3
1.3 Mg/m3
1.4 Mg/m3
1.5 Mg/m3
1.6 Mg/m3

Page | 18
As we know, both total and matric suction values increases with the decrease in water
content for any value of density, graph shows the same told behaviour. When it comes to
density, suction value did not follow a pattern. The value of suction increases and decreases
with dry density in a non-uniform manner irrespective of water content. The relation between
dry density and suction is shown clearly in figure10 and 11.
Fig.10. Variation of total suction with density
Fig.11. Variation of Matric Suction with density
1E-06
0.001
1
1000
1000000
1.05 1.15 1.25 1.35 1.45 1.55 1.65
Tota
l su
ctio
n (
kPa
)
Dry density (Mg/m3)
11% w/c
13% w/c
15% w/c
17% w/c
19% w/c
20% w/c
1E-05
0.01
10
10000
1.05 1.15 1.25 1.35 1.45 1.55 1.65
Mat
ric
suct
ion
(kP
a)
Dry density (Mg/m3)
11% w/c
13% w/c
15% w/c
17% w/c
19% w/c
20% w/c
Page | 19
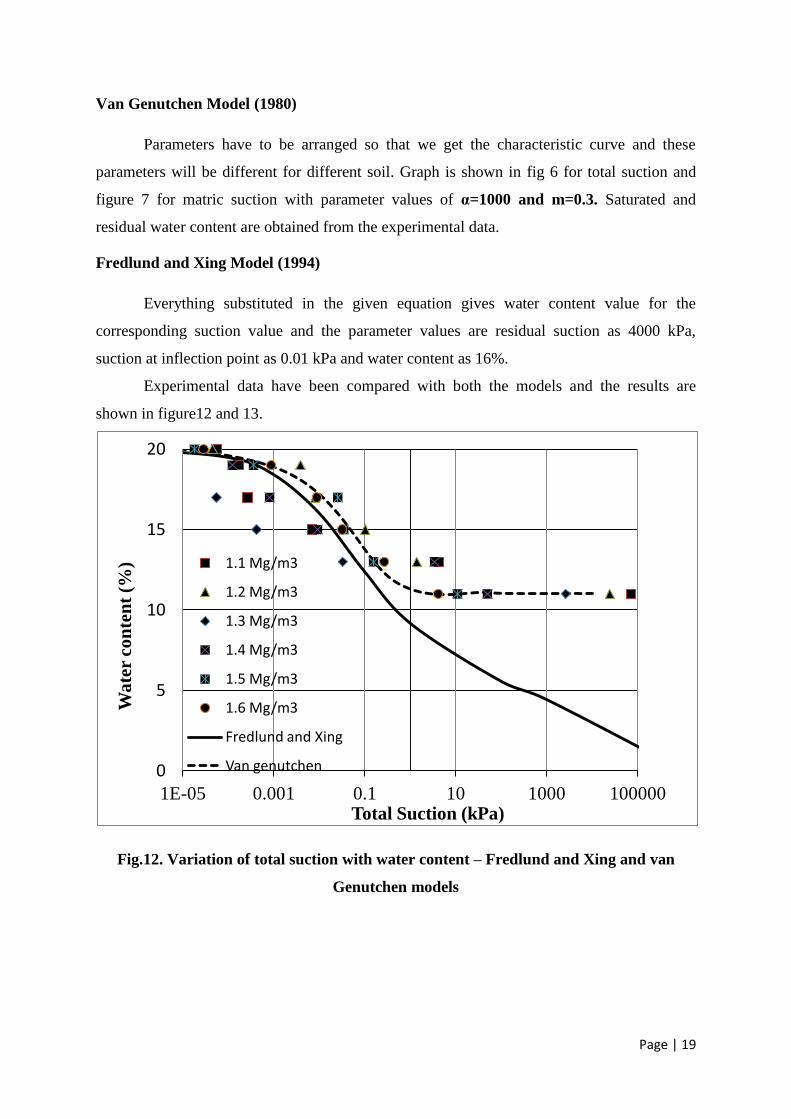
Van Genutchen Model (1980)
Parameters have to be arranged so that we get the characteristic curve and these
parameters will be different for different soil. Graph is shown in fig 6 for total suction and
figure 7 for matric suction with parameter values of α=1000 and m=0.3. Saturated and
residual water content are obtained from the experimental data.
Fredlund and Xing Model (1994)
Everything substituted in the given equation gives water content value for the
corresponding suction value and the parameter values are residual suction as 4000 kPa,
suction at inflection point as 0.01 kPa and water content as 16%.
Experimental data have been compared with both the models and the results are
shown in figure12 and 13.
Fig.12. Variation of total suction with water content – Fredlund and Xing and van
Genutchen models
0
5
10
15
20
1E-05 0.001 0.1 10 1000 100000
Wa
ter
con
ten
t (%
)
Total Suction (kPa)
1.1 Mg/m3
1.2 Mg/m3
1.3 Mg/m3
1.4 Mg/m3
1.5 Mg/m3
1.6 Mg/m3
Fredlund and Xing
Van genutchen

Page | 20
Fig.13. Variation of matric suction with water content – Fredlund and Xing and van
Genutchen models
0
5
10
15
20
0.0001 0.01 1 100 10000
Wa
ter
con
ten
t (%
)
Matric Suction (kPa)
1.1 Mg/m3
1.2 Mg/m3
1.3 Mg/m3
1.4 Mg/m3
1.5 Mg/m3
1.6 Mg/m3
Fredlund and Xing
Van genutchen

Page | 21
CHAPTER 5
CONCLUSIONS AND FUTURE WORK
5.1Conclusions
In the current study, suction behaviour of Indian bentonite was studied. Different
densities and water content of bentonite were considered. It was found that with increase in
water content, both total and matric suction values were decreased.
There was no particular pattern observed due to change in dry density at equal water
content on matric and total suction variation.
Theoretical models such as Fredlund& Xing (1994) and van Genutchen (1980) were
used to determine suction versus water content relationships. Comparison between
experimental and theoretical results showed that van Genutchen (1980) model provide better
relationship between suction and water content than that of Fredlund& Xing (1994) model.
5.2 Future Scope of work
Parameters such as swelling characteristics, compressibility, and consolidation can be
determined for bentonite. Suction can also be measured by adding chemicals to the bentonite
sample. Suction parameter may be determined for unsaturated soil types which are easily
available than bentonite.

Page | 22
References
Agus S.S and Schanz T, (2005) “Comparison of four methods for measuring total suction”,
Vadose Zone J 4, 1087–1095.
ASTM Standard Test Method for Measurement of Soil Potential (Suction) Using Filter Paper
(ASTM D 5298)
Bicalho K.V, Correia G.A, Ferreira S, Fleureau J.M, Marinho F.A.M, (2007)“Filter paper
method of soil suction measurement”, XIII Panamerican Conference on Soil
Mechanics and Geotechnical Engineering, Margarita.
Elgabu H. M (2013), “Critical Evaluation of some Suction Measurement Techniques”, PhD
thesis, Cardiff University.
Fattah M.Y, Yahya A.Y and Ahmed B.A (2012), “Total and matric suction measurement of
unsaturated soils in Baghdad region by filter paper method” Journal of Engineering,
18(5), 611 – 620.
Fredlund D.G and Xing A, (1994) “Equations for the Soil- Water characteristic curve”,
Canadian Geotechnical Journal, 31(3), 521 – 532.
Genutchen van M.Th, (1980) “A Closed form Equation for predicting the Hydraulic
Conductivity of Unsaturated Soils”, Soil Science Society of American Journal, 44 (5)
Guan Y, Fredlund D.G, (1997) “Use of Tensile Strength of Water for the Direct
Measurement of High Soil Suction”, Canadian Geotechnical Journal, 34(4), 604–614.
Haghighi A, Medero G.M, Marinho F.A.M, Mercier B and Woodward P.K, (2011),
“Temperature Effects on Suction Measurement Using the Filter Paper Technique”,
Geotechnical Testing Journal, 35(1) Paper ID GTJ103575
Marinho F.A.M and Oliveira O.M, (2006), “The Filter Paper Method Revisited”,
Geotechnical Testing Journal, 29(3), Paper ID GTJ14125

Page | 23
Navaneethan T, Sivakumar V, Wheeler S.J, Doran I.G, (2005),“Assessment of suction
measurements in saturated clays”, Geotechnical Engineering Proceedings, Institution
of Civil Engineers, 158, 15–24.
Patrick P. K, Olsen H.W, Higgins J. D, (2007),“Comparison of chilled-mirror measurements
and filter paper estimates of total soil suction”, Geotechnical Testing Journal 30(5),
360-367.
Petry T. M, Bryant J. T, (2002),“Evaluation and use of the Decagon WP4 dewpoint
potentiometer”, Proceedings of the Texas Section of the American Society of Civil
Engineers Fall 2002 Meeting, Waco, Texas.


